Dallastown borough, PA Map & Demographics
Dallastown borough Overview
$26,255
PER CAPITA INCOME
$67,645
AVG FAMILY INCOME
$56,397
AVG HOUSEHOLD INCOME
35.6%
WAGE / INCOME GAP [ % ]
64.4¢/ $1
WAGE / INCOME GAP [ $ ]
0.38
INEQUALITY / GINI INDEX
4,164
TOTAL POPULATION
1,969
MALE POPULATION
2,195
FEMALE POPULATION
89.70
MALES / 100 FEMALES
111.48
FEMALES / 100 MALES
39.9
MEDIAN AGE
3.2
AVG FAMILY SIZE
2.4
AVG HOUSEHOLD SIZE
2,226
LABOR FORCE [ PEOPLE ]
69.9%
PERCENT IN LABOR FORCE
5.7%
UNEMPLOYMENT RATE
Income in Dallastown borough
Income Overview in Dallastown borough
Per Capita Income in Dallastown borough is $26,255, while median incomes of families and households are $67,645 and $56,397 respectively.
| Characteristic | Number | Measure |
| Per Capita Income | 4,164 | $26,255 |
| Median Family Income | 996 | $67,645 |
| Mean Family Income | 996 | $78,194 |
| Median Household Income | 1,748 | $56,397 |
| Mean Household Income | 1,748 | $62,084 |
| Income Deficit | 996 | $0 |
| Wage / Income Gap (%) | 4,164 | 35.57% |
| Wage / Income Gap ($) | 4,164 | 64.43¢ per $1 |
| Gini / Inequality Index | 4,164 | 0.38 |
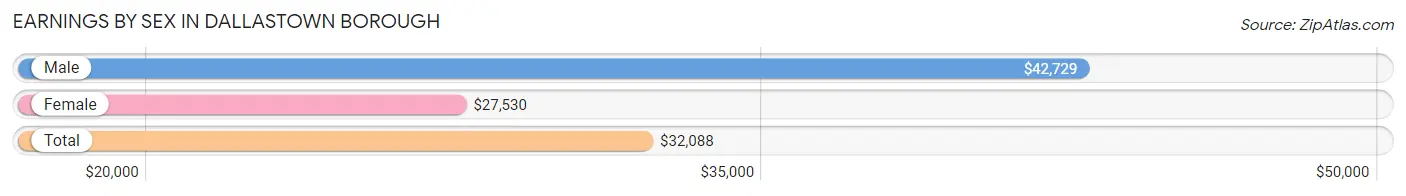
Earnings by Sex in Dallastown borough
Average Earnings in Dallastown borough are $32,088, $42,729 for men and $27,530 for women, a difference of 35.6%.
| Sex | Number | Average Earnings |
| Male | 1,145 (51.4%) | $42,729 |
| Female | 1,084 (48.6%) | $27,530 |
| Total | 2,229 (100.0%) | $32,088 |
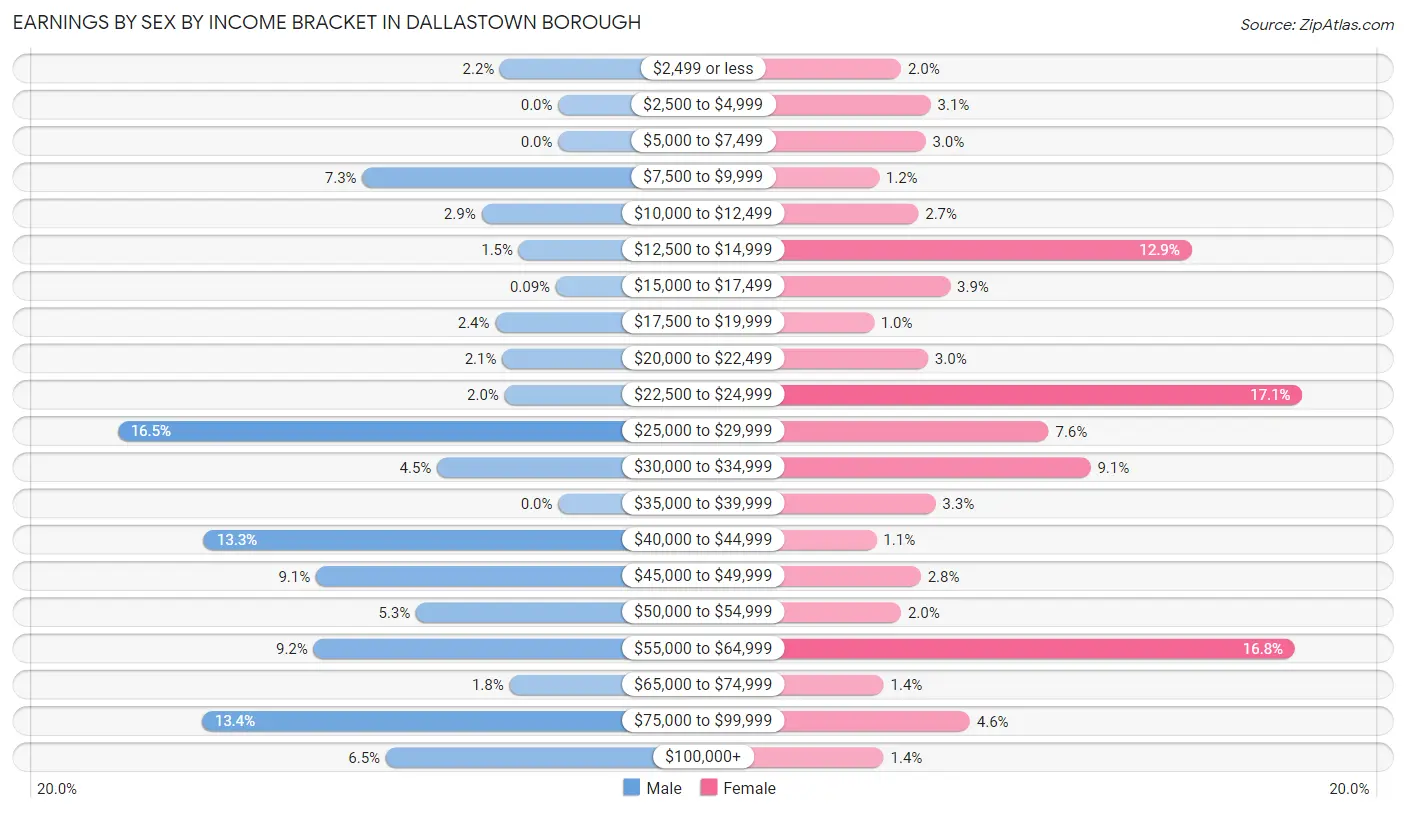
Earnings by Sex by Income Bracket in Dallastown borough
The most common earnings brackets in Dallastown borough are $25,000 to $29,999 for men (189 | 16.5%) and $22,500 to $24,999 for women (185 | 17.1%).
| Income | Male | Female |
| $2,499 or less | 25 (2.2%) | 22 (2.0%) |
| $2,500 to $4,999 | 0 (0.0%) | 34 (3.1%) |
| $5,000 to $7,499 | 0 (0.0%) | 32 (2.9%) |
| $7,500 to $9,999 | 84 (7.3%) | 13 (1.2%) |
| $10,000 to $12,499 | 33 (2.9%) | 29 (2.7%) |
| $12,500 to $14,999 | 17 (1.5%) | 140 (12.9%) |
| $15,000 to $17,499 | 1 (0.1%) | 42 (3.9%) |
| $17,500 to $19,999 | 27 (2.4%) | 11 (1.0%) |
| $20,000 to $22,499 | 24 (2.1%) | 33 (3.0%) |
| $22,500 to $24,999 | 23 (2.0%) | 185 (17.1%) |
| $25,000 to $29,999 | 189 (16.5%) | 82 (7.6%) |
| $30,000 to $34,999 | 52 (4.5%) | 99 (9.1%) |
| $35,000 to $39,999 | 0 (0.0%) | 36 (3.3%) |
| $40,000 to $44,999 | 152 (13.3%) | 12 (1.1%) |
| $45,000 to $49,999 | 104 (9.1%) | 30 (2.8%) |
| $50,000 to $54,999 | 61 (5.3%) | 22 (2.0%) |
| $55,000 to $64,999 | 105 (9.2%) | 182 (16.8%) |
| $65,000 to $74,999 | 21 (1.8%) | 15 (1.4%) |
| $75,000 to $99,999 | 153 (13.4%) | 50 (4.6%) |
| $100,000+ | 74 (6.5%) | 15 (1.4%) |
| Total | 1,145 (100.0%) | 1,084 (100.0%) |
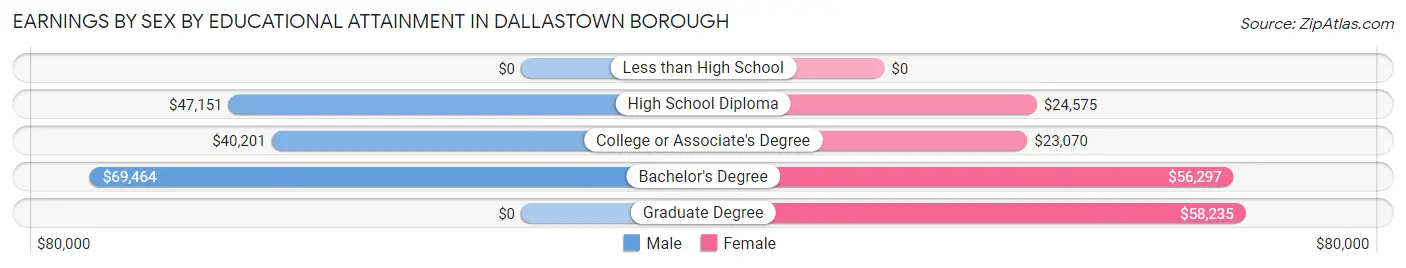
Earnings by Sex by Educational Attainment in Dallastown borough
Average earnings in Dallastown borough are $45,685 for men and $28,887 for women, a difference of 36.8%. Men with an educational attainment of bachelor's degree enjoy the highest average annual earnings of $69,464, while those with college or associate's degree education earn the least with $40,201. Women with an educational attainment of graduate degree earn the most with the average annual earnings of $58,235, while those with college or associate's degree education have the smallest earnings of $23,070.
| Educational Attainment | Male Income | Female Income |
| Less than High School | - | - |
| High School Diploma | $47,151 | $24,575 |
| College or Associate's Degree | $40,201 | $23,070 |
| Bachelor's Degree | $69,464 | $56,297 |
| Graduate Degree | - | - |
| Total | $45,685 | $28,887 |
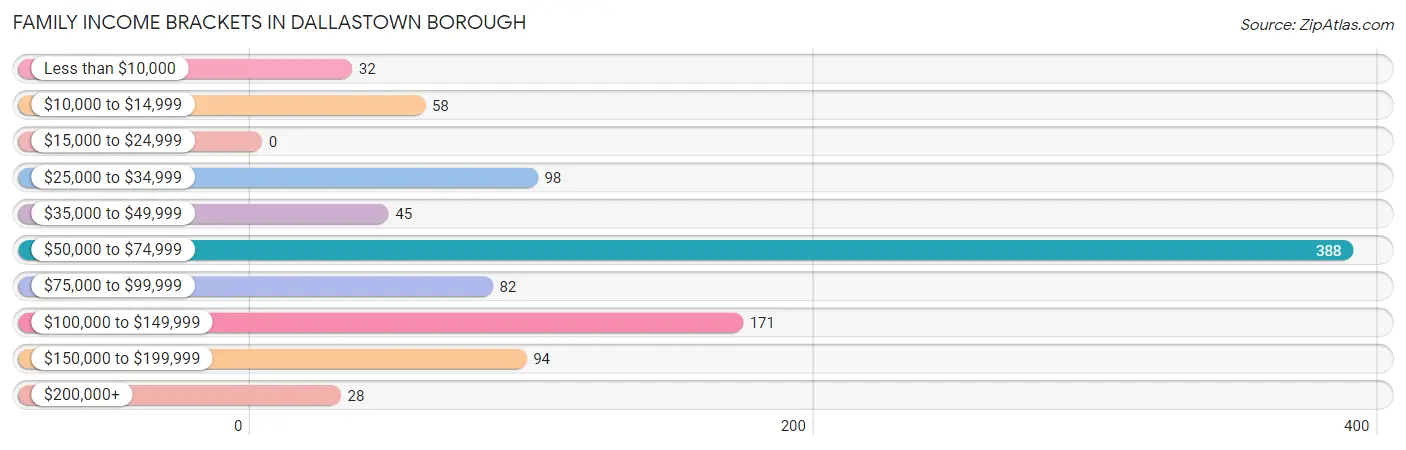
Family Income in Dallastown borough
Family Income Brackets in Dallastown borough
According to the Dallastown borough family income data, there are 388 families falling into the $50,000 to $74,999 income range, which is the most common income bracket and makes up 39.0% of all families.
| Income Bracket | # Families | % Families |
| Less than $10,000 | 32 | 3.2% |
| $10,000 to $14,999 | 58 | 5.8% |
| $15,000 to $24,999 | 0 | 0.0% |
| $25,000 to $34,999 | 98 | 9.8% |
| $35,000 to $49,999 | 45 | 4.5% |
| $50,000 to $74,999 | 388 | 39.0% |
| $75,000 to $99,999 | 82 | 8.2% |
| $100,000 to $149,999 | 171 | 17.2% |
| $150,000 to $199,999 | 94 | 9.4% |
| $200,000+ | 28 | 2.8% |
Family Income by Famaliy Size in Dallastown borough
6-person families (144 | 14.5%) account for the highest median family income in Dallastown borough with $165,222 per family, while 2-person families (292 | 29.3%) have the highest median income of $34,345 per family member.
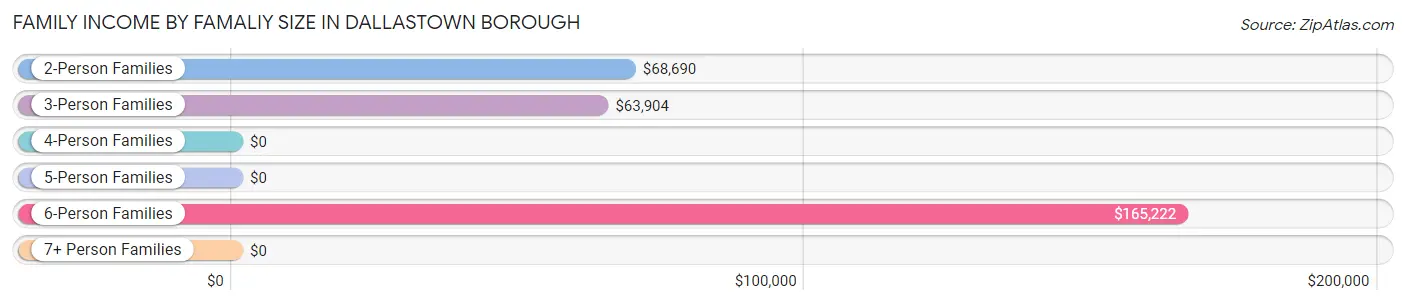
| Income Bracket | # Families | Median Income |
| 2-Person Families | 292 (29.3%) | $68,690 |
| 3-Person Families | 414 (41.6%) | $63,904 |
| 4-Person Families | 39 (3.9%) | $0 |
| 5-Person Families | 107 (10.7%) | $0 |
| 6-Person Families | 144 (14.5%) | $165,222 |
| 7+ Person Families | 0 (0.0%) | $0 |
| Total | 996 (100.0%) | $67,645 |
Family Income by Number of Earners in Dallastown borough
The median family income in Dallastown borough is $67,645, with families comprising 3+ earners (194) having the highest median family income of $116,346, while families with no earners (137) have the lowest median family income of $29,957, accounting for 19.5% and 13.8% of families, respectively.
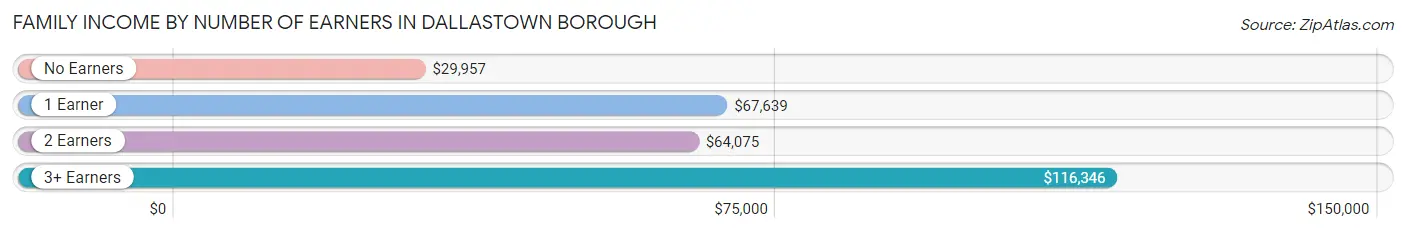
| Number of Earners | # Families | Median Income |
| No Earners | 137 (13.8%) | $29,957 |
| 1 Earner | 299 (30.0%) | $67,639 |
| 2 Earners | 366 (36.7%) | $64,075 |
| 3+ Earners | 194 (19.5%) | $116,346 |
| Total | 996 (100.0%) | $67,645 |
Household Income in Dallastown borough
Household Income Brackets in Dallastown borough
With 496 households falling in the category, the $50,000 to $74,999 income range is the most frequent in Dallastown borough, accounting for 28.4% of all households. In contrast, only 35 households (2.0%) fall into the $200,000+ income bracket, making it the least populous group.
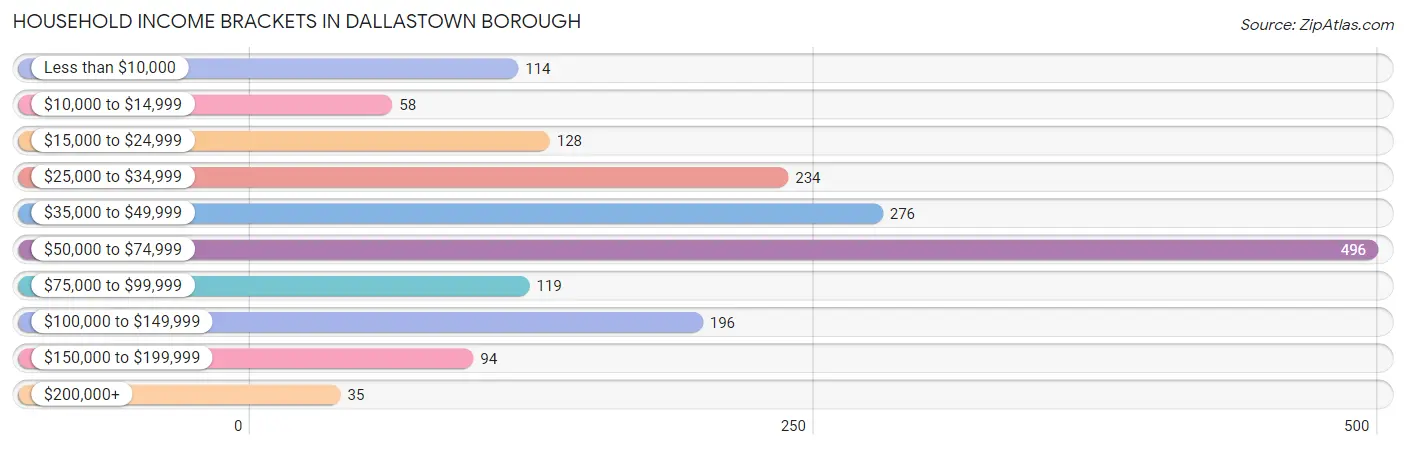
| Income Bracket | # Households | % Households |
| Less than $10,000 | 114 | 6.5% |
| $10,000 to $14,999 | 58 | 3.3% |
| $15,000 to $24,999 | 128 | 7.3% |
| $25,000 to $34,999 | 234 | 13.4% |
| $35,000 to $49,999 | 276 | 15.8% |
| $50,000 to $74,999 | 496 | 28.4% |
| $75,000 to $99,999 | 119 | 6.8% |
| $100,000 to $149,999 | 196 | 11.2% |
| $150,000 to $199,999 | 94 | 5.4% |
| $200,000+ | 35 | 2.0% |
Household Income by Householder Age in Dallastown borough
The median household income in Dallastown borough is $56,397, with the highest median household income of $63,750 found in the 25 to 44 years age bracket for the primary householder. A total of 542 households (31.0%) fall into this category. Meanwhile, the 65+ years age bracket for the primary householder has the lowest median household income of $33,625, with 364 households (20.8%) in this group.
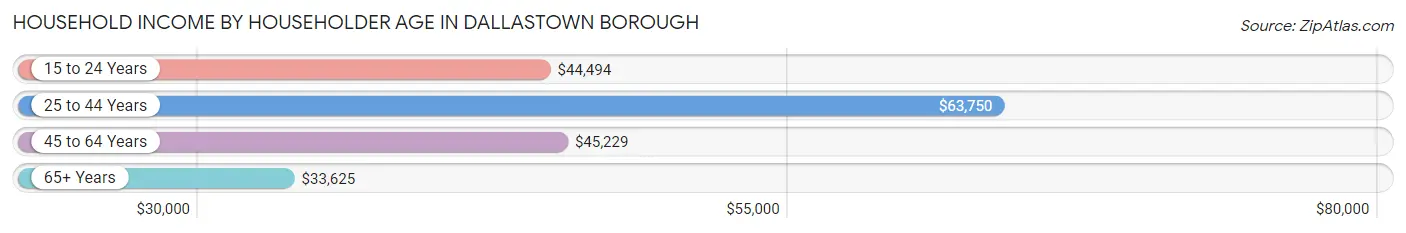
| Income Bracket | # Households | Median Income |
| 15 to 24 Years | 67 (3.8%) | $44,494 |
| 25 to 44 Years | 542 (31.0%) | $63,750 |
| 45 to 64 Years | 775 (44.3%) | $45,229 |
| 65+ Years | 364 (20.8%) | $33,625 |
| Total | 1,748 (100.0%) | $56,397 |
Poverty in Dallastown borough
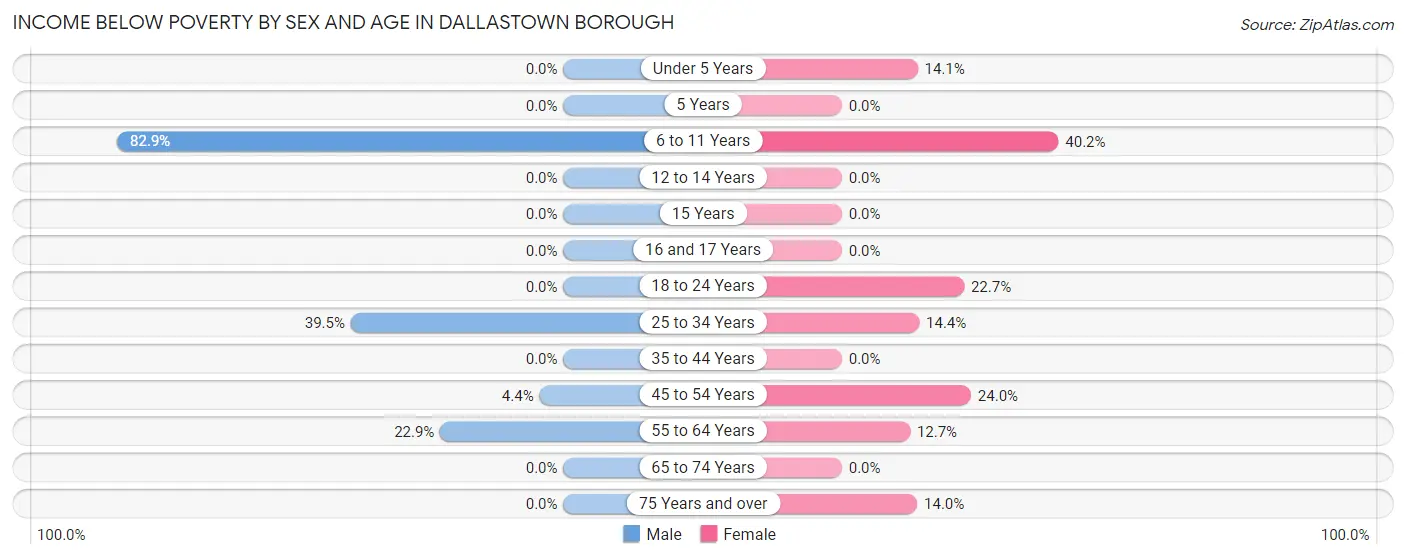
Income Below Poverty by Sex and Age in Dallastown borough
With 10.2% poverty level for males and 13.5% for females among the residents of Dallastown borough, 6 to 11 year old males and 6 to 11 year old females are the most vulnerable to poverty, with 58 males (82.9%) and 80 females (40.2%) in their respective age groups living below the poverty level.
| Age Bracket | Male | Female |
| Under 5 Years | 0 (0.0%) | 37 (14.1%) |
| 5 Years | 0 (0.0%) | 0 (0.0%) |
| 6 to 11 Years | 58 (82.9%) | 80 (40.2%) |
| 12 to 14 Years | 0 (0.0%) | 0 (0.0%) |
| 15 Years | 0 (0.0%) | 0 (0.0%) |
| 16 and 17 Years | 0 (0.0%) | 0 (0.0%) |
| 18 to 24 Years | 0 (0.0%) | 22 (22.7%) |
| 25 to 34 Years | 58 (39.5%) | 32 (14.3%) |
| 35 to 44 Years | 0 (0.0%) | 0 (0.0%) |
| 45 to 54 Years | 12 (4.4%) | 58 (24.0%) |
| 55 to 64 Years | 72 (22.9%) | 53 (12.7%) |
| 65 to 74 Years | 0 (0.0%) | 0 (0.0%) |
| 75 Years and over | 0 (0.0%) | 13 (14.0%) |
| Total | 200 (10.2%) | 295 (13.5%) |
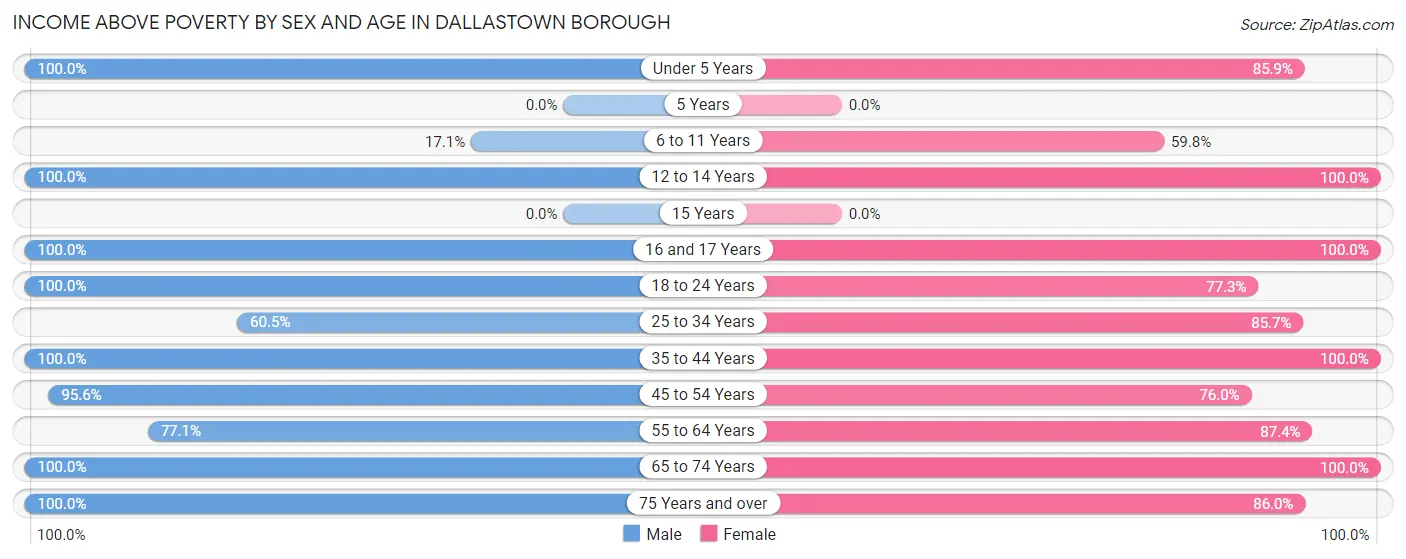
Income Above Poverty by Sex and Age in Dallastown borough
According to the poverty statistics in Dallastown borough, males aged under 5 years and females aged 12 to 14 years are the age groups that are most secure financially, with 100.0% of males and 100.0% of females in these age groups living above the poverty line.
| Age Bracket | Male | Female |
| Under 5 Years | 211 (100.0%) | 226 (85.9%) |
| 5 Years | 0 (0.0%) | 0 (0.0%) |
| 6 to 11 Years | 12 (17.1%) | 119 (59.8%) |
| 12 to 14 Years | 53 (100.0%) | 183 (100.0%) |
| 15 Years | 0 (0.0%) | 0 (0.0%) |
| 16 and 17 Years | 19 (100.0%) | 23 (100.0%) |
| 18 to 24 Years | 227 (100.0%) | 75 (77.3%) |
| 25 to 34 Years | 89 (60.5%) | 191 (85.7%) |
| 35 to 44 Years | 364 (100.0%) | 348 (100.0%) |
| 45 to 54 Years | 259 (95.6%) | 184 (76.0%) |
| 55 to 64 Years | 243 (77.1%) | 366 (87.4%) |
| 65 to 74 Years | 185 (100.0%) | 89 (100.0%) |
| 75 Years and over | 96 (100.0%) | 80 (86.0%) |
| Total | 1,758 (89.8%) | 1,884 (86.5%) |
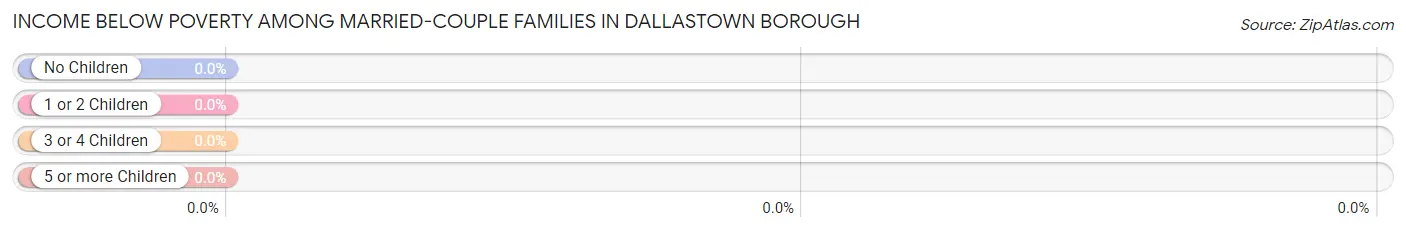
Income Below Poverty Among Married-Couple Families in Dallastown borough
| Children | Above Poverty | Below Poverty |
| No Children | 327 (100.0%) | 0 (0.0%) |
| 1 or 2 Children | 354 (100.0%) | 0 (0.0%) |
| 3 or 4 Children | 113 (100.0%) | 0 (0.0%) |
| 5 or more Children | 0 (0.0%) | 0 (0.0%) |
| Total | 794 (100.0%) | 0 (0.0%) |
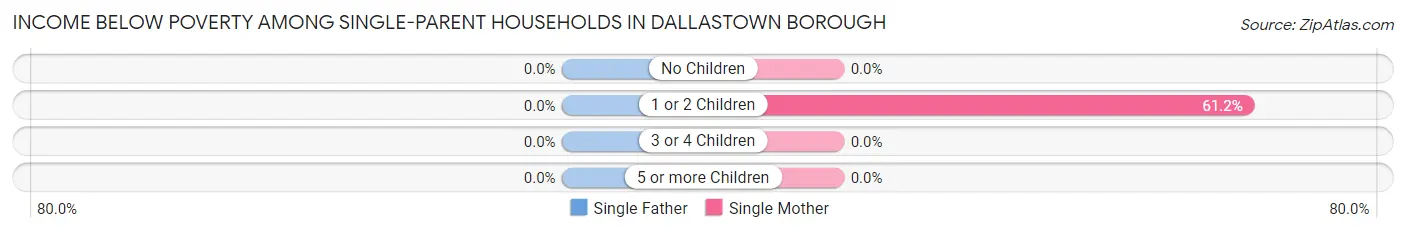
Income Below Poverty Among Single-Parent Households in Dallastown borough
| Children | Single Father | Single Mother |
| No Children | 0 (0.0%) | 0 (0.0%) |
| 1 or 2 Children | 0 (0.0%) | 90 (61.2%) |
| 3 or 4 Children | 0 (0.0%) | 0 (0.0%) |
| 5 or more Children | 0 (0.0%) | 0 (0.0%) |
| Total | 0 (0.0%) | 90 (61.2%) |
Income Below Poverty Among Married-Couple vs Single-Parent Households in Dallastown borough
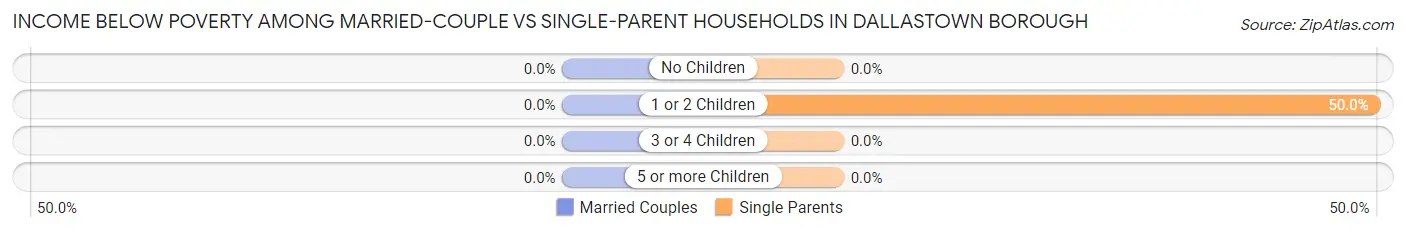
| Children | Married-Couple Families | Single-Parent Households |
| No Children | 0 (0.0%) | 0 (0.0%) |
| 1 or 2 Children | 0 (0.0%) | 90 (50.0%) |
| 3 or 4 Children | 0 (0.0%) | 0 (0.0%) |
| 5 or more Children | 0 (0.0%) | 0 (0.0%) |
| Total | 0 (0.0%) | 90 (44.6%) |
Race in Dallastown borough
The most populous races in Dallastown borough are White / Caucasian (3,981 | 95.6%), Hispanic or Latino (186 | 4.5%), and Two or more Races (77 | 1.8%).
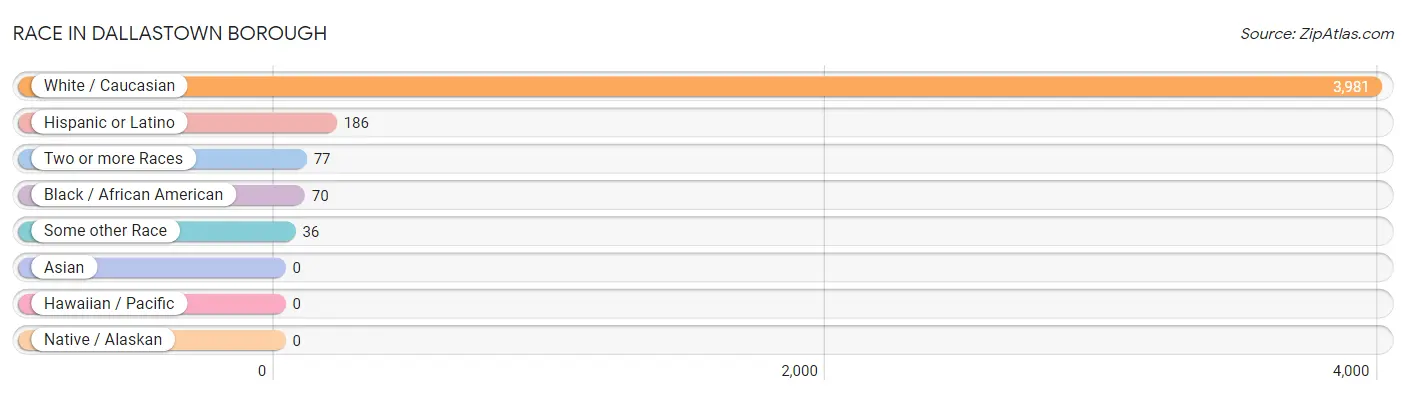
| Race | # Population | % Population |
| Asian | 0 | 0.0% |
| Black / African American | 70 | 1.7% |
| Hawaiian / Pacific | 0 | 0.0% |
| Hispanic or Latino | 186 | 4.5% |
| Native / Alaskan | 0 | 0.0% |
| White / Caucasian | 3,981 | 95.6% |
| Two or more Races | 77 | 1.8% |
| Some other Race | 36 | 0.9% |
| Total | 4,164 | 100.0% |
Ancestry in Dallastown borough
The most populous ancestries reported in Dallastown borough are German (1,276 | 30.6%), Italian (611 | 14.7%), Polish (478 | 11.5%), American (431 | 10.3%), and Irish (411 | 9.9%), together accounting for 77.0% of all Dallastown borough residents.
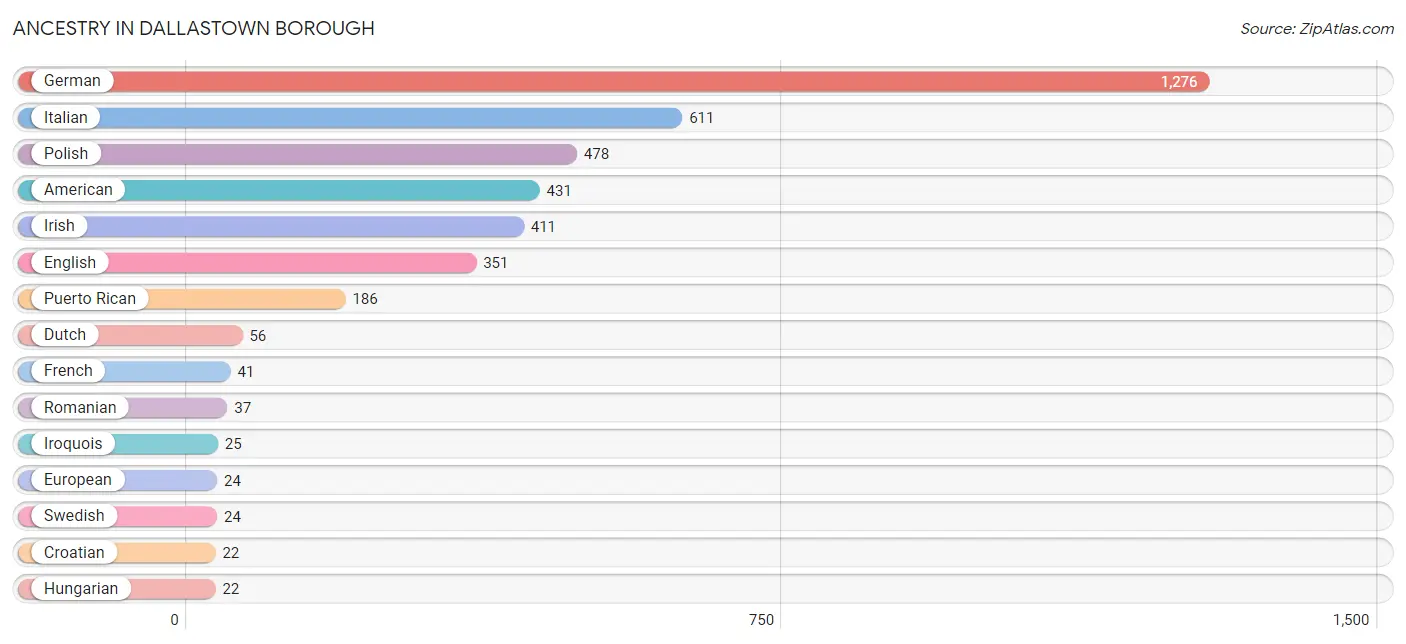
| Ancestry | # Population | % Population |
| American | 431 | 10.3% |
| Blackfeet | 1 | 0.0% |
| Croatian | 22 | 0.5% |
| Dutch | 56 | 1.3% |
| English | 351 | 8.4% |
| European | 24 | 0.6% |
| French | 41 | 1.0% |
| German | 1,276 | 30.6% |
| Hungarian | 22 | 0.5% |
| Irish | 411 | 9.9% |
| Iroquois | 25 | 0.6% |
| Italian | 611 | 14.7% |
| Polish | 478 | 11.5% |
| Puerto Rican | 186 | 4.5% |
| Romanian | 37 | 0.9% |
| Slovak | 21 | 0.5% |
| Swedish | 24 | 0.6% |
| Welsh | 22 | 0.5% | View All 18 Rows |
Immigrants in Dallastown borough

| Immigration Origin | # Population | % Population | View All 0 Rows |
Sex and Age in Dallastown borough
Sex and Age in Dallastown borough
The most populous age groups in Dallastown borough are 20 to 24 Years (227 | 11.5%) for men and 55 to 59 Years (289 | 13.2%) for women.
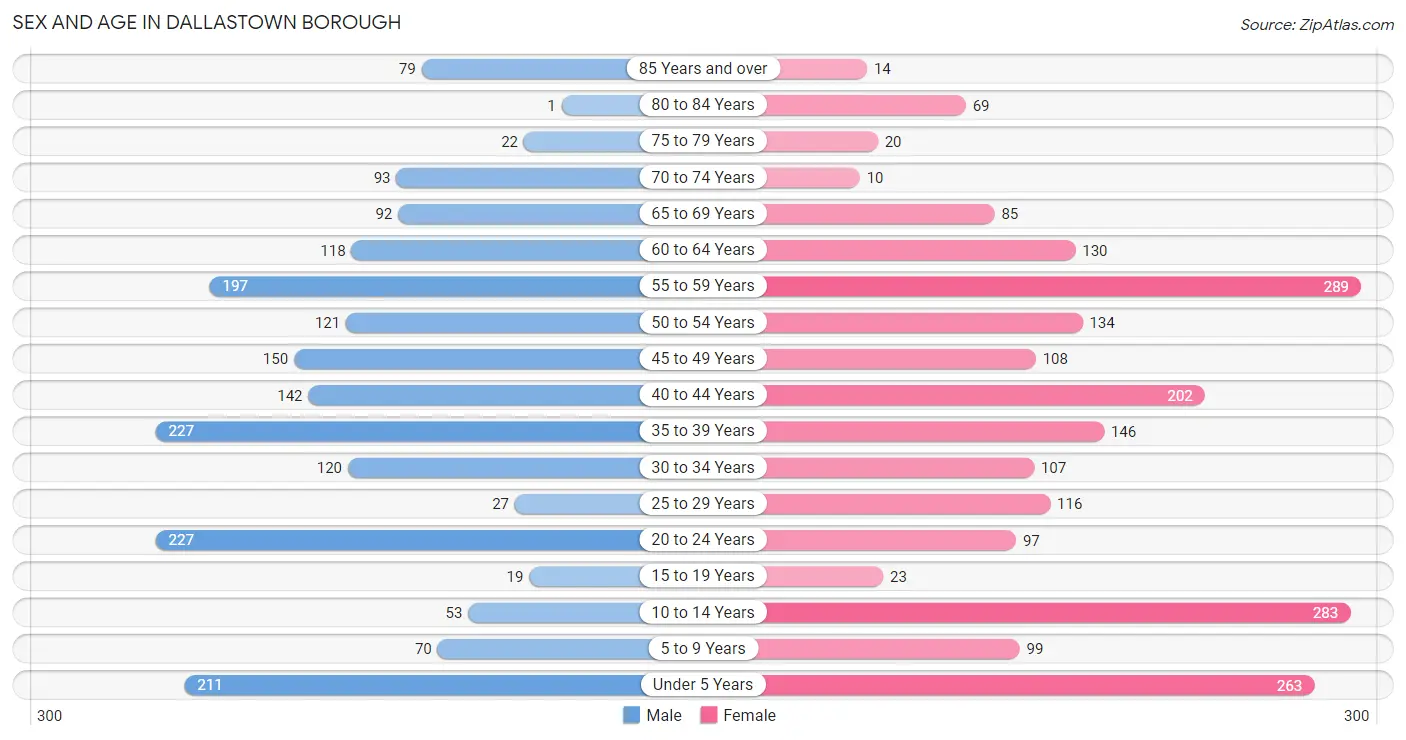
| Age Bracket | Male | Female |
| Under 5 Years | 211 (10.7%) | 263 (12.0%) |
| 5 to 9 Years | 70 (3.6%) | 99 (4.5%) |
| 10 to 14 Years | 53 (2.7%) | 283 (12.9%) |
| 15 to 19 Years | 19 (1.0%) | 23 (1.1%) |
| 20 to 24 Years | 227 (11.5%) | 97 (4.4%) |
| 25 to 29 Years | 27 (1.4%) | 116 (5.3%) |
| 30 to 34 Years | 120 (6.1%) | 107 (4.9%) |
| 35 to 39 Years | 227 (11.5%) | 146 (6.7%) |
| 40 to 44 Years | 142 (7.2%) | 202 (9.2%) |
| 45 to 49 Years | 150 (7.6%) | 108 (4.9%) |
| 50 to 54 Years | 121 (6.1%) | 134 (6.1%) |
| 55 to 59 Years | 197 (10.0%) | 289 (13.2%) |
| 60 to 64 Years | 118 (6.0%) | 130 (5.9%) |
| 65 to 69 Years | 92 (4.7%) | 85 (3.9%) |
| 70 to 74 Years | 93 (4.7%) | 10 (0.5%) |
| 75 to 79 Years | 22 (1.1%) | 20 (0.9%) |
| 80 to 84 Years | 1 (0.1%) | 69 (3.1%) |
| 85 Years and over | 79 (4.0%) | 14 (0.6%) |
| Total | 1,969 (100.0%) | 2,195 (100.0%) |
Families and Households in Dallastown borough
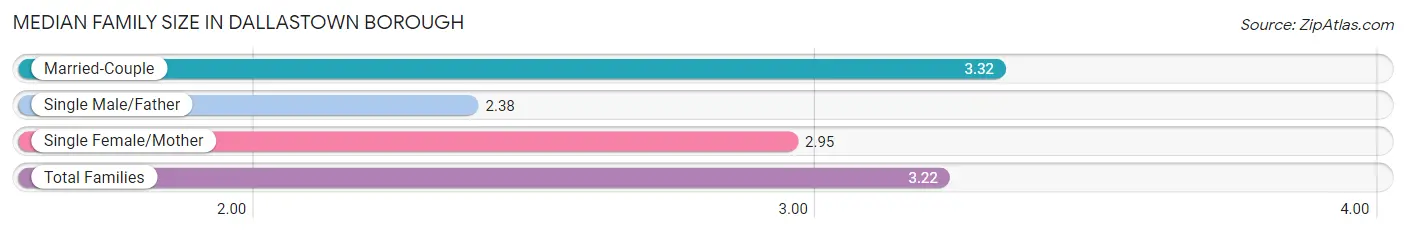
Median Family Size in Dallastown borough
The median family size in Dallastown borough is 3.22 persons per family, with married-couple families (794 | 79.7%) accounting for the largest median family size of 3.32 persons per family. On the other hand, single male/father families (55 | 5.5%) represent the smallest median family size with 2.38 persons per family.
| Family Type | # Families | Family Size |
| Married-Couple | 794 (79.7%) | 3.32 |
| Single Male/Father | 55 (5.5%) | 2.38 |
| Single Female/Mother | 147 (14.8%) | 2.95 |
| Total Families | 996 (100.0%) | 3.22 |
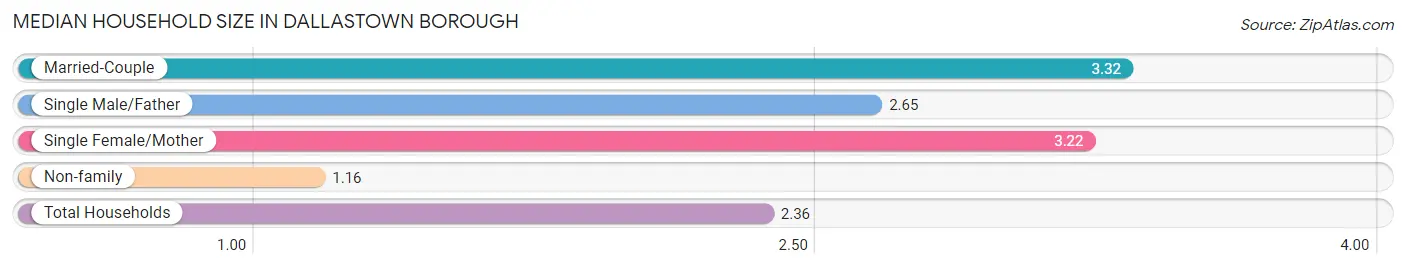
Median Household Size in Dallastown borough
The median household size in Dallastown borough is 2.36 persons per household, with married-couple households (794 | 45.4%) accounting for the largest median household size of 3.32 persons per household. non-family households (752 | 43.0%) represent the smallest median household size with 1.16 persons per household.
| Household Type | # Households | Household Size |
| Married-Couple | 794 (45.4%) | 3.32 |
| Single Male/Father | 55 (3.2%) | 2.65 |
| Single Female/Mother | 147 (8.4%) | 3.22 |
| Non-family | 752 (43.0%) | 1.16 |
| Total Households | 1,748 (100.0%) | 2.36 |
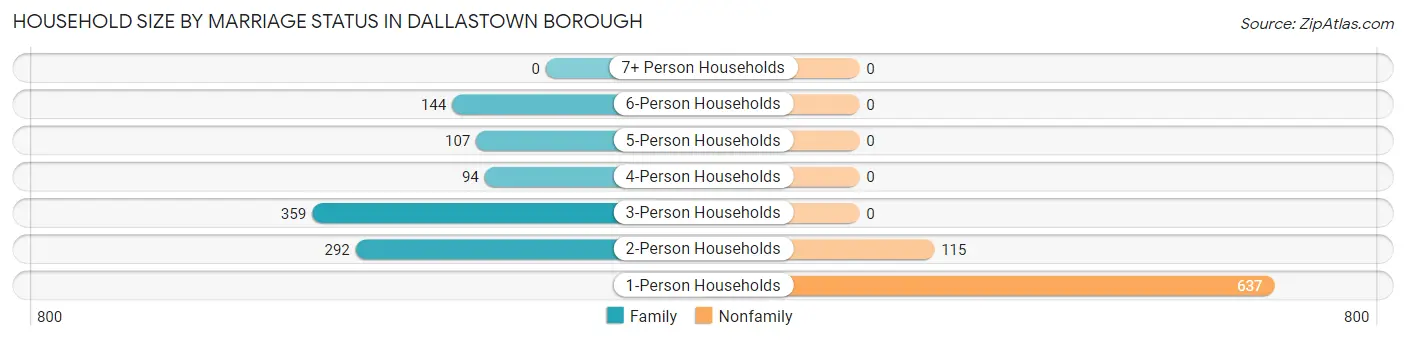
Household Size by Marriage Status in Dallastown borough
Out of a total of 1,748 households in Dallastown borough, 996 (57.0%) are family households, while 752 (43.0%) are nonfamily households. The most numerous type of family households are 3-person households, comprising 359, and the most common type of nonfamily households are 1-person households, comprising 637.
| Household Size | Family Households | Nonfamily Households |
| 1-Person Households | - | 637 (36.4%) |
| 2-Person Households | 292 (16.7%) | 115 (6.6%) |
| 3-Person Households | 359 (20.5%) | 0 (0.0%) |
| 4-Person Households | 94 (5.4%) | 0 (0.0%) |
| 5-Person Households | 107 (6.1%) | 0 (0.0%) |
| 6-Person Households | 144 (8.2%) | 0 (0.0%) |
| 7+ Person Households | 0 (0.0%) | 0 (0.0%) |
| Total | 996 (57.0%) | 752 (43.0%) |
Female Fertility in Dallastown borough
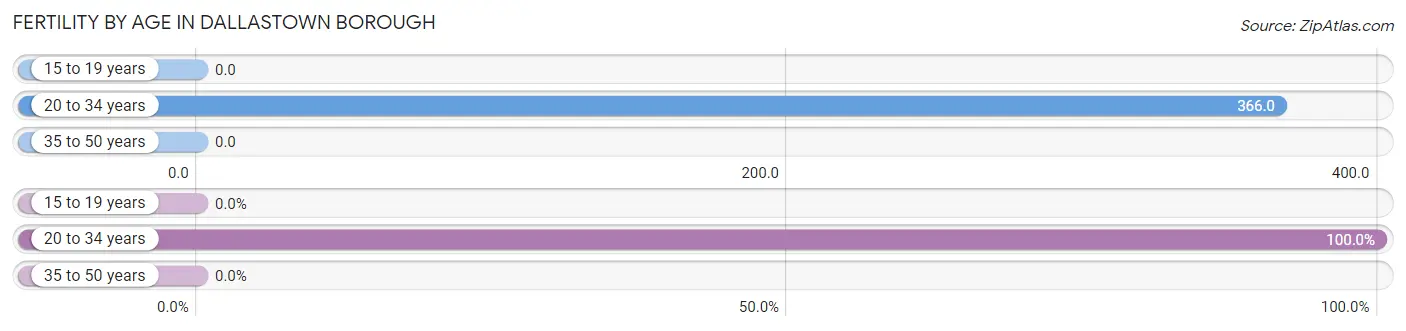
Fertility by Age in Dallastown borough
Average fertility rate in Dallastown borough is 142.0 births per 1,000 women. Women in the age bracket of 20 to 34 years have the highest fertility rate with 366.0 births per 1,000 women. Women in the age bracket of 20 to 34 years acount for 100.0% of all women with births.
| Age Bracket | Women with Births | Births / 1,000 Women |
| 15 to 19 years | 0 (0.0%) | 0.0 |
| 20 to 34 years | 117 (100.0%) | 366.0 |
| 35 to 50 years | 0 (0.0%) | 0.0 |
| Total | 117 (100.0%) | 142.0 |
Fertility by Age by Marriage Status in Dallastown borough
71.8% of women with births (117) in Dallastown borough are married. The highest percentage of unmarried women with births falls into 20 to 34 years age bracket with 28.2% of them unmarried at the time of birth, while the lowest percentage of unmarried women with births belong to 20 to 34 years age bracket with 28.2% of them unmarried.
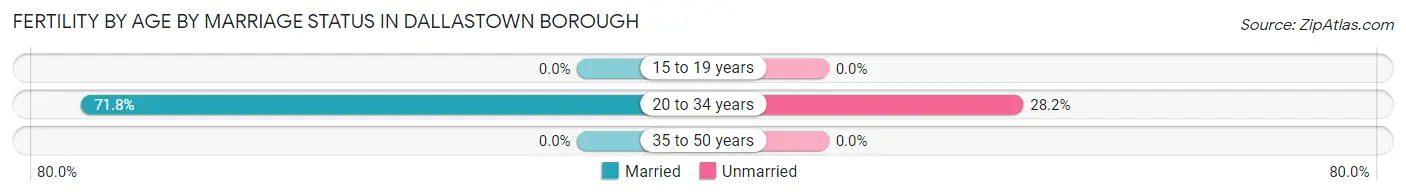
| Age Bracket | Married | Unmarried |
| 15 to 19 years | 0 (0.0%) | 0 (0.0%) |
| 20 to 34 years | 84 (71.8%) | 33 (28.2%) |
| 35 to 50 years | 0 (0.0%) | 0 (0.0%) |
| Total | 84 (71.8%) | 33 (28.2%) |
Fertility by Education in Dallastown borough
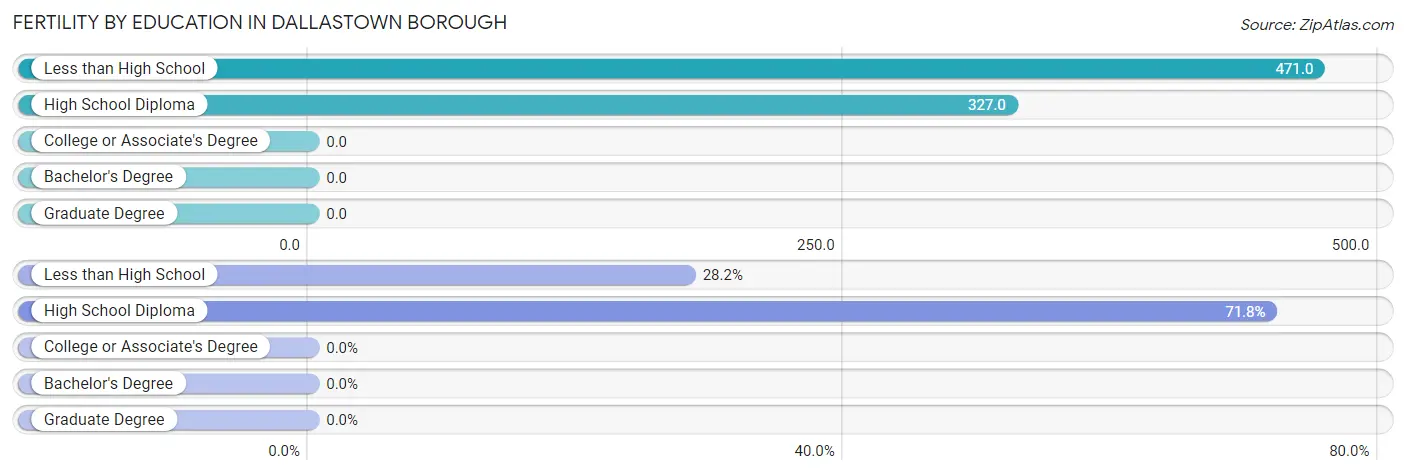
| Educational Attainment | Women with Births | Births / 1,000 Women |
| Less than High School | 33 (28.2%) | 471.0 |
| High School Diploma | 84 (71.8%) | 327.0 |
| College or Associate's Degree | 0 (0.0%) | 0.0 |
| Bachelor's Degree | 0 (0.0%) | 0.0 |
| Graduate Degree | 0 (0.0%) | 0.0 |
| Total | 117 (100.0%) | 142.0 |
Fertility by Education by Marriage Status in Dallastown borough
28.2% of women with births in Dallastown borough are unmarried. Women with the educational attainment of high school diploma are most likely to be married with 100.0% of them married at childbirth, while women with the educational attainment of less than high school are least likely to be married with 100.0% of them unmarried at childbirth.
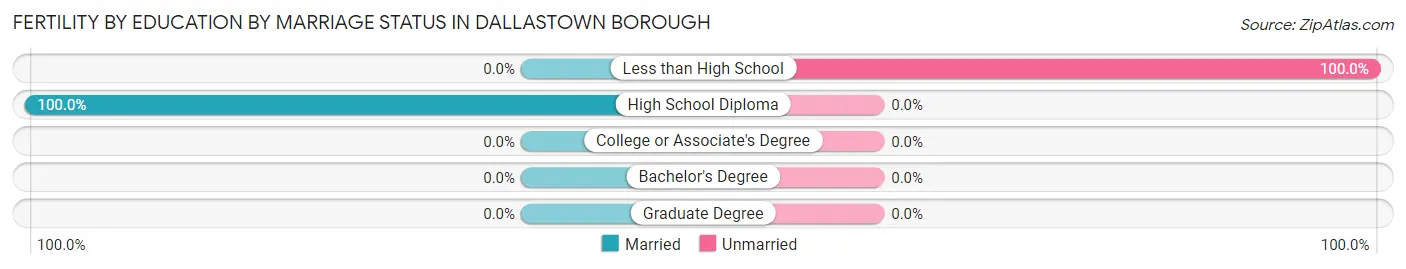
| Educational Attainment | Married | Unmarried |
| Less than High School | 0 (0.0%) | 33 (100.0%) |
| High School Diploma | 84 (100.0%) | 0 (0.0%) |
| College or Associate's Degree | 0 (0.0%) | 0 (0.0%) |
| Bachelor's Degree | 0 (0.0%) | 0 (0.0%) |
| Graduate Degree | 0 (0.0%) | 0 (0.0%) |
| Total | 84 (71.8%) | 33 (28.2%) |
Employment Characteristics in Dallastown borough
Employment by Class of Employer in Dallastown borough
Among the 2,099 employed individuals in Dallastown borough, private company employees (1,349 | 64.3%), not-for-profit organizations (397 | 18.9%), and self-employed (not incorporated) (154 | 7.3%) make up the most common classes of employment.
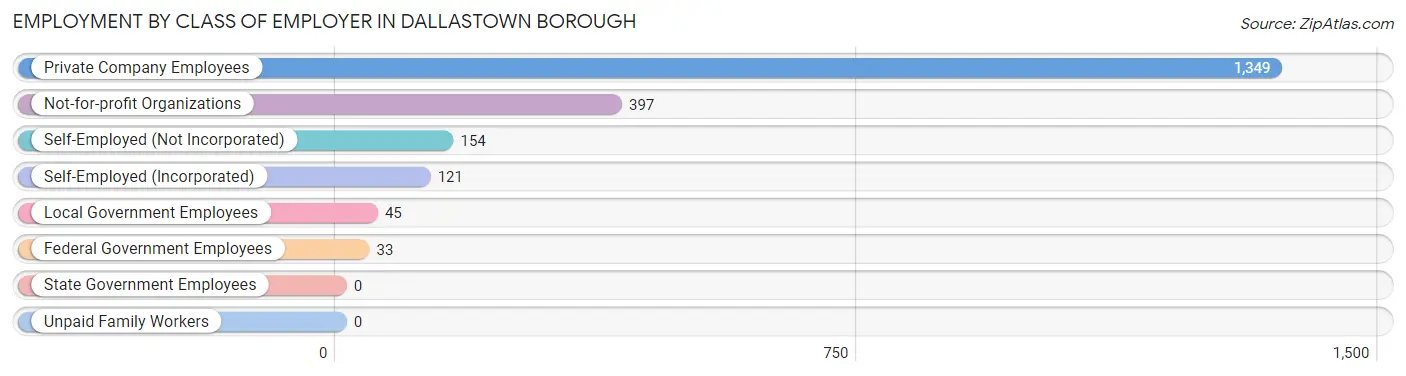
| Employer Class | # Employees | % Employees |
| Private Company Employees | 1,349 | 64.3% |
| Self-Employed (Incorporated) | 121 | 5.8% |
| Self-Employed (Not Incorporated) | 154 | 7.3% |
| Not-for-profit Organizations | 397 | 18.9% |
| Local Government Employees | 45 | 2.1% |
| State Government Employees | 0 | 0.0% |
| Federal Government Employees | 33 | 1.6% |
| Unpaid Family Workers | 0 | 0.0% |
| Total | 2,099 | 100.0% |
Employment Status by Age in Dallastown borough
According to the labor force statistics for Dallastown borough, out of the total population over 16 years of age (3,185), 69.9% or 2,226 individuals are in the labor force, with 5.7% or 127 of them unemployed. The age group with the highest labor force participation rate is 45 to 54 years, with 94.9% or 487 individuals in the labor force. Within the labor force, the 25 to 29 years age range has the highest percentage of unemployed individuals, with 72.4% or 84 of them being unemployed.
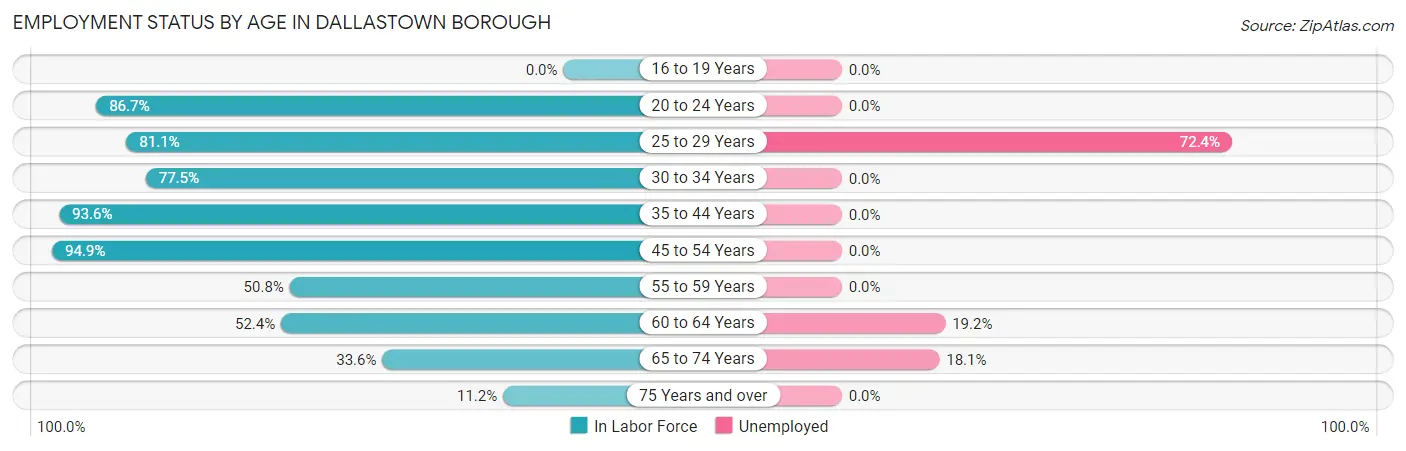
| Age Bracket | In Labor Force | Unemployed |
| 16 to 19 Years | 0 (0.0%) | 0 (0.0%) |
| 20 to 24 Years | 281 (86.7%) | 0 (0.0%) |
| 25 to 29 Years | 116 (81.1%) | 84 (72.4%) |
| 30 to 34 Years | 176 (77.5%) | 0 (0.0%) |
| 35 to 44 Years | 671 (93.6%) | 0 (0.0%) |
| 45 to 54 Years | 487 (94.9%) | 0 (0.0%) |
| 55 to 59 Years | 247 (50.8%) | 0 (0.0%) |
| 60 to 64 Years | 130 (52.4%) | 25 (19.2%) |
| 65 to 74 Years | 94 (33.6%) | 17 (18.1%) |
| 75 Years and over | 23 (11.2%) | 0 (0.0%) |
| Total | 2,226 (69.9%) | 127 (5.7%) |
Employment Status by Educational Attainment in Dallastown borough
According to labor force statistics for Dallastown borough, 78.3% of individuals (1,828) out of the total population between 25 and 64 years of age (2,334) are in the labor force, with 6.0% or 110 of them being unemployed. The group with the highest labor force participation rate are those with the educational attainment of bachelor's degree or higher, with 89.4% or 466 individuals in the labor force. Within the labor force, individuals with high school diploma education have the highest percentage of unemployment, with 14.9% or 96 of them being unemployed.
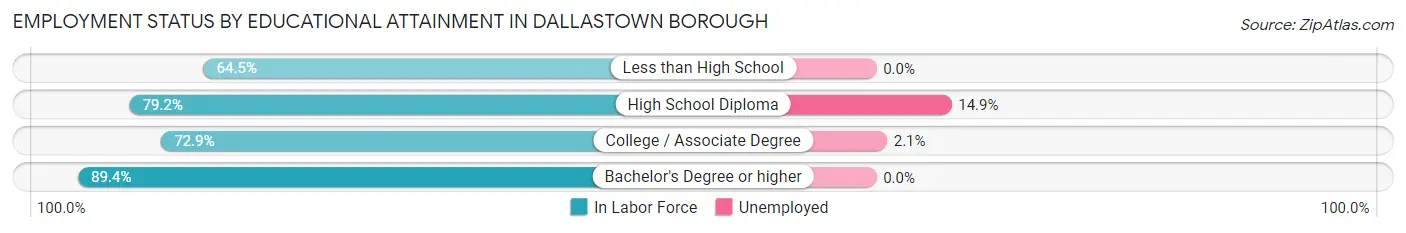
| Educational Attainment | In Labor Force | Unemployed |
| Less than High School | 89 (64.5%) | 0 (0.0%) |
| High School Diploma | 646 (79.2%) | 122 (14.9%) |
| College / Associate Degree | 626 (72.9%) | 18 (2.1%) |
| Bachelor's Degree or higher | 466 (89.4%) | 0 (0.0%) |
| Total | 1,828 (78.3%) | 140 (6.0%) |
Employment Occupations by Sex in Dallastown borough
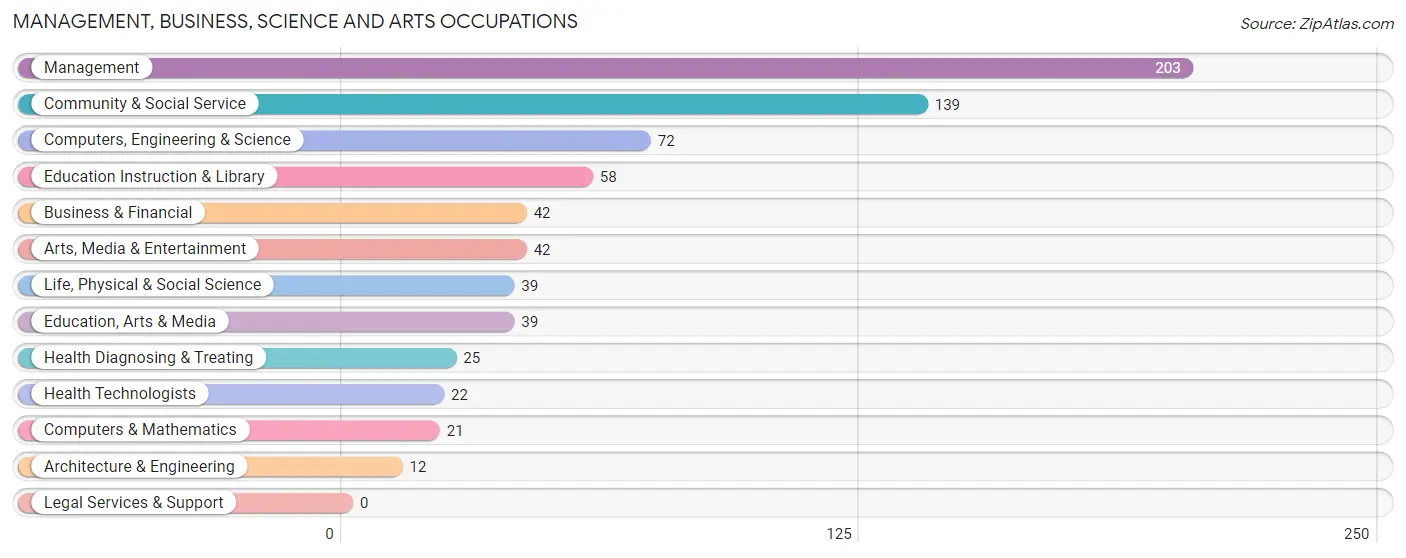
Management, Business, Science and Arts Occupations
The most common Management, Business, Science and Arts occupations in Dallastown borough are Management (203 | 9.7%), Community & Social Service (139 | 6.6%), Computers, Engineering & Science (72 | 3.4%), Education Instruction & Library (58 | 2.8%), and Business & Financial (42 | 2.0%).
Management, Business, Science and Arts Occupations by Sex
Within the Management, Business, Science and Arts occupations in Dallastown borough, the most male-oriented occupations are Computers, Engineering & Science (100.0%), Computers & Mathematics (100.0%), and Architecture & Engineering (100.0%), while the most female-oriented occupations are Business & Financial (73.8%), Health Diagnosing & Treating (72.0%), and Health Technologists (68.2%).
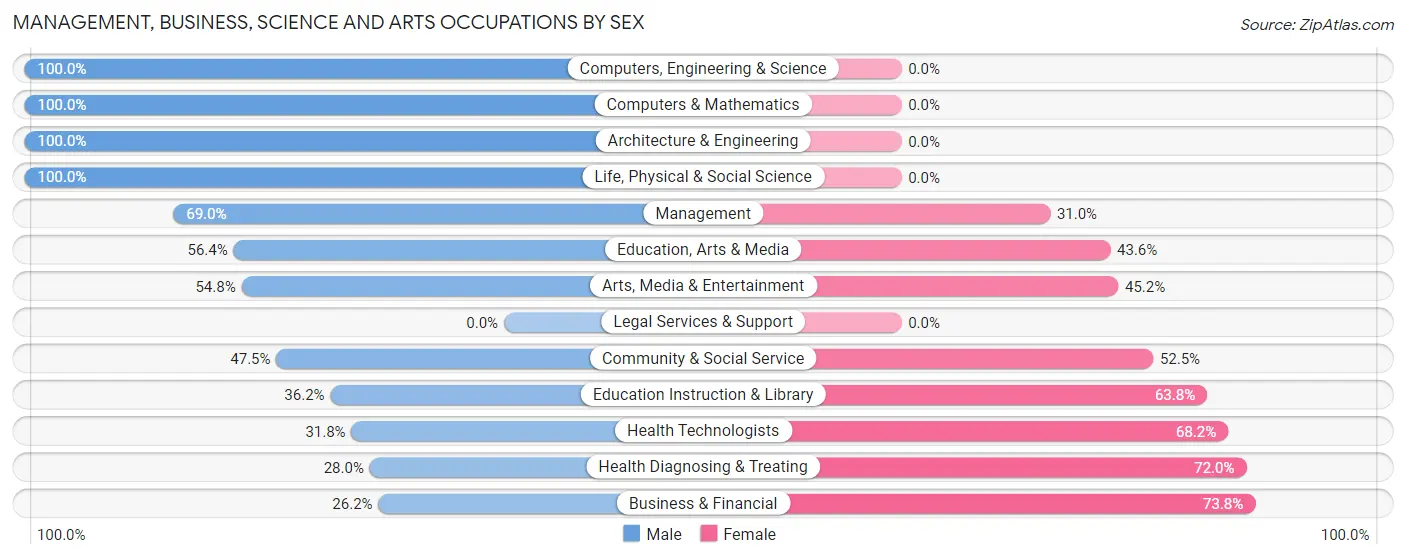
| Occupation | Male | Female |
| Management | 140 (69.0%) | 63 (31.0%) |
| Business & Financial | 11 (26.2%) | 31 (73.8%) |
| Computers, Engineering & Science | 72 (100.0%) | 0 (0.0%) |
| Computers & Mathematics | 21 (100.0%) | 0 (0.0%) |
| Architecture & Engineering | 12 (100.0%) | 0 (0.0%) |
| Life, Physical & Social Science | 39 (100.0%) | 0 (0.0%) |
| Community & Social Service | 66 (47.5%) | 73 (52.5%) |
| Education, Arts & Media | 22 (56.4%) | 17 (43.6%) |
| Legal Services & Support | 0 (0.0%) | 0 (0.0%) |
| Education Instruction & Library | 21 (36.2%) | 37 (63.8%) |
| Arts, Media & Entertainment | 23 (54.8%) | 19 (45.2%) |
| Health Diagnosing & Treating | 7 (28.0%) | 18 (72.0%) |
| Health Technologists | 7 (31.8%) | 15 (68.2%) |
| Total (Category) | 296 (61.5%) | 185 (38.5%) |
| Total (Overall) | 1,111 (52.9%) | 988 (47.1%) |
Services Occupations
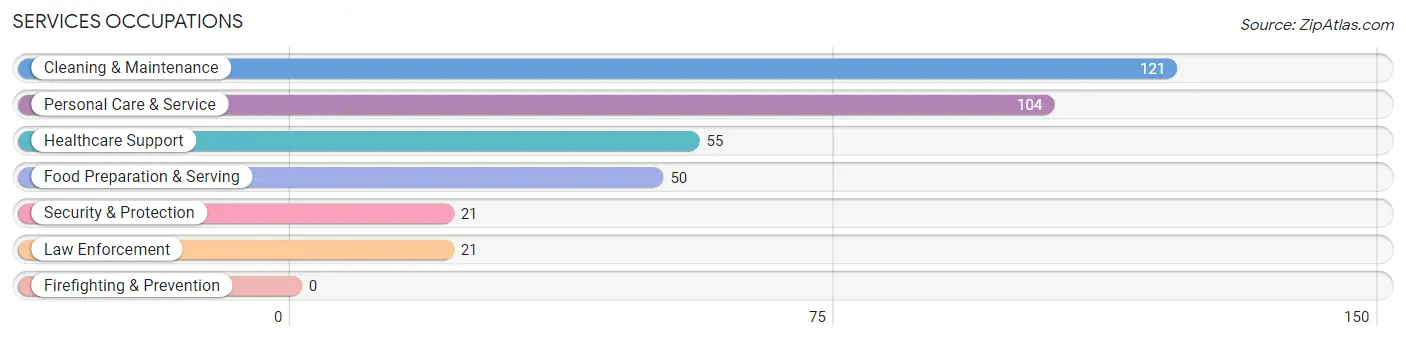
The most common Services occupations in Dallastown borough are Cleaning & Maintenance (121 | 5.8%), Personal Care & Service (104 | 5.0%), Healthcare Support (55 | 2.6%), Food Preparation & Serving (50 | 2.4%), and Security & Protection (21 | 1.0%).
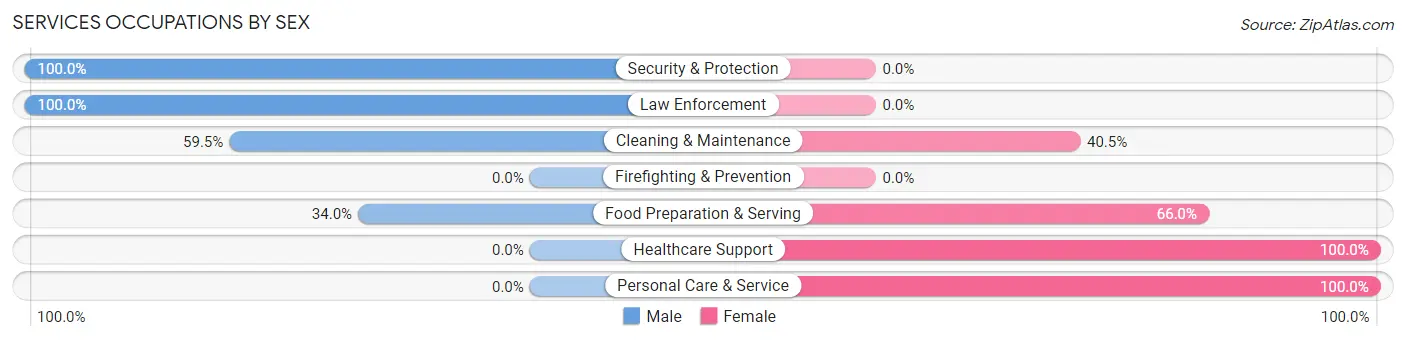
Services Occupations by Sex
Within the Services occupations in Dallastown borough, the most male-oriented occupations are Security & Protection (100.0%), Law Enforcement (100.0%), and Cleaning & Maintenance (59.5%), while the most female-oriented occupations are Healthcare Support (100.0%), Personal Care & Service (100.0%), and Food Preparation & Serving (66.0%).
| Occupation | Male | Female |
| Healthcare Support | 0 (0.0%) | 55 (100.0%) |
| Security & Protection | 21 (100.0%) | 0 (0.0%) |
| Firefighting & Prevention | 0 (0.0%) | 0 (0.0%) |
| Law Enforcement | 21 (100.0%) | 0 (0.0%) |
| Food Preparation & Serving | 17 (34.0%) | 33 (66.0%) |
| Cleaning & Maintenance | 72 (59.5%) | 49 (40.5%) |
| Personal Care & Service | 0 (0.0%) | 104 (100.0%) |
| Total (Category) | 110 (31.3%) | 241 (68.7%) |
| Total (Overall) | 1,111 (52.9%) | 988 (47.1%) |
Sales and Office Occupations
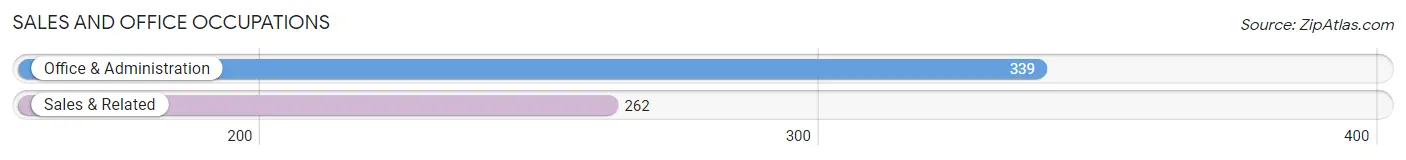
The most common Sales and Office occupations in Dallastown borough are Office & Administration (339 | 16.2%), and Sales & Related (262 | 12.5%).
Sales and Office Occupations by Sex

| Occupation | Male | Female |
| Sales & Related | 156 (59.5%) | 106 (40.5%) |
| Office & Administration | 22 (6.5%) | 317 (93.5%) |
| Total (Category) | 178 (29.6%) | 423 (70.4%) |
| Total (Overall) | 1,111 (52.9%) | 988 (47.1%) |
Natural Resources, Construction and Maintenance Occupations
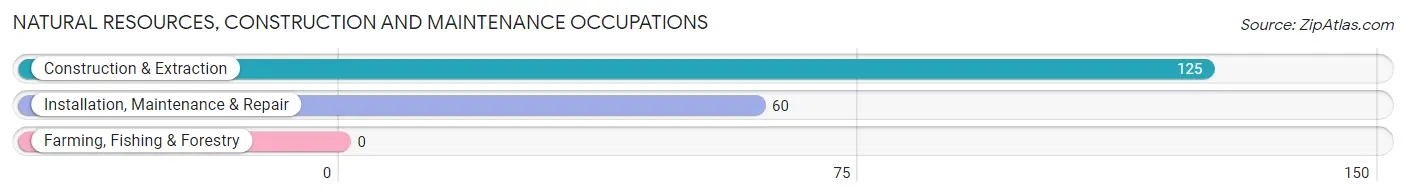
The most common Natural Resources, Construction and Maintenance occupations in Dallastown borough are Construction & Extraction (125 | 6.0%), and Installation, Maintenance & Repair (60 | 2.9%).
Natural Resources, Construction and Maintenance Occupations by Sex
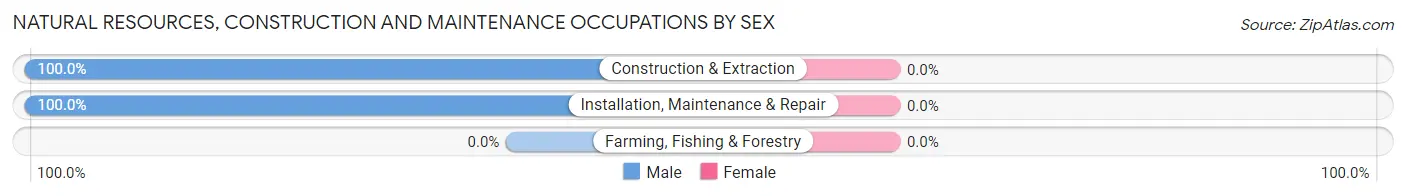
| Occupation | Male | Female |
| Farming, Fishing & Forestry | 0 (0.0%) | 0 (0.0%) |
| Construction & Extraction | 125 (100.0%) | 0 (0.0%) |
| Installation, Maintenance & Repair | 60 (100.0%) | 0 (0.0%) |
| Total (Category) | 185 (100.0%) | 0 (0.0%) |
| Total (Overall) | 1,111 (52.9%) | 988 (47.1%) |
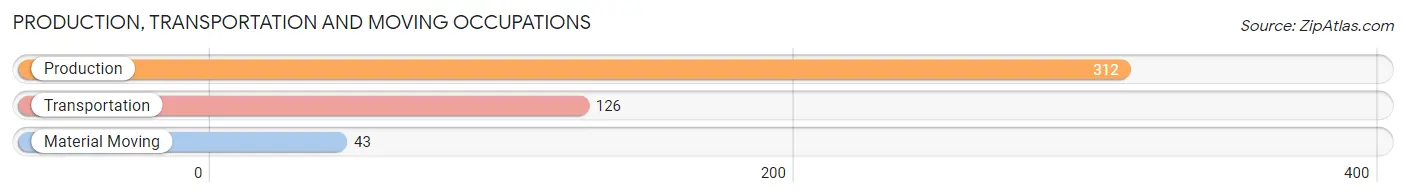
Production, Transportation and Moving Occupations
The most common Production, Transportation and Moving occupations in Dallastown borough are Production (312 | 14.9%), Transportation (126 | 6.0%), and Material Moving (43 | 2.1%).
Production, Transportation and Moving Occupations by Sex
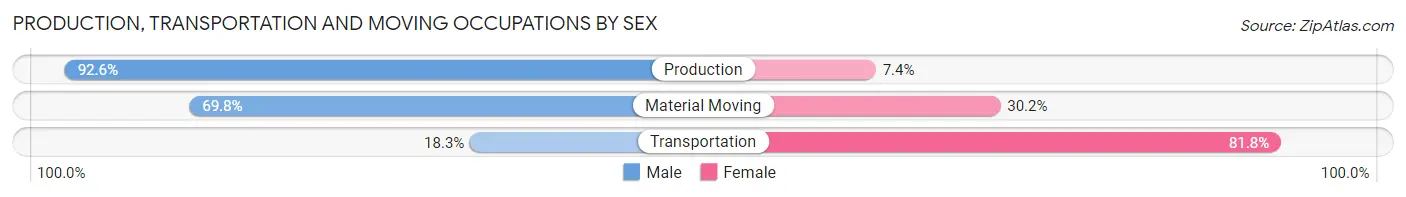
| Occupation | Male | Female |
| Production | 289 (92.6%) | 23 (7.4%) |
| Transportation | 23 (18.2%) | 103 (81.8%) |
| Material Moving | 30 (69.8%) | 13 (30.2%) |
| Total (Category) | 342 (71.1%) | 139 (28.9%) |
| Total (Overall) | 1,111 (52.9%) | 988 (47.1%) |
Employment Industries by Sex in Dallastown borough
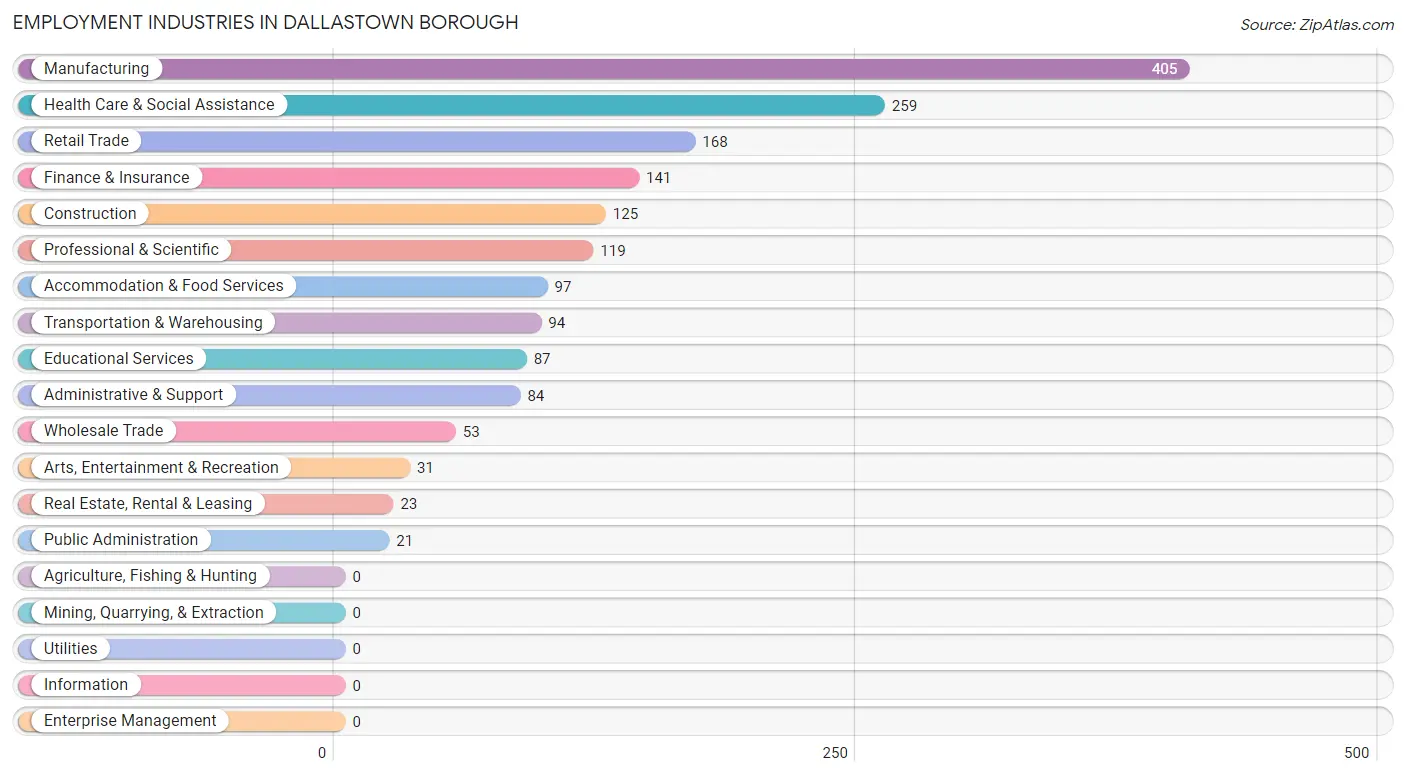
Employment Industries in Dallastown borough
The major employment industries in Dallastown borough include Manufacturing (405 | 19.3%), Health Care & Social Assistance (259 | 12.3%), Retail Trade (168 | 8.0%), Finance & Insurance (141 | 6.7%), and Construction (125 | 6.0%).
Employment Industries by Sex in Dallastown borough
The Dallastown borough industries that see more men than women are Construction (100.0%), Arts, Entertainment & Recreation (100.0%), and Public Administration (100.0%), whereas the industries that tend to have a higher number of women are Real Estate, Rental & Leasing (100.0%), Accommodation & Food Services (95.9%), and Finance & Insurance (89.4%).
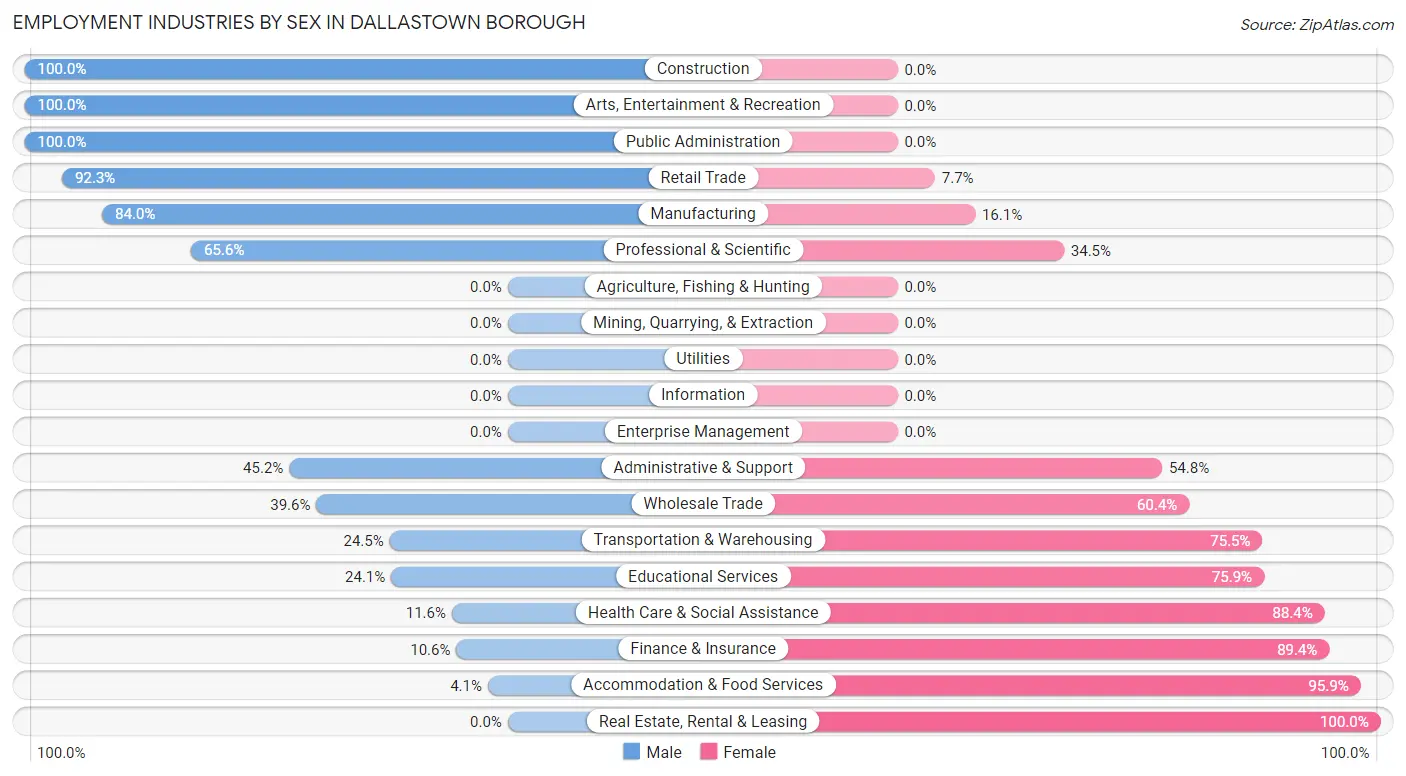
| Industry | Male | Female |
| Agriculture, Fishing & Hunting | 0 (0.0%) | 0 (0.0%) |
| Mining, Quarrying, & Extraction | 0 (0.0%) | 0 (0.0%) |
| Construction | 125 (100.0%) | 0 (0.0%) |
| Manufacturing | 340 (84.0%) | 65 (16.1%) |
| Wholesale Trade | 21 (39.6%) | 32 (60.4%) |
| Retail Trade | 155 (92.3%) | 13 (7.7%) |
| Transportation & Warehousing | 23 (24.5%) | 71 (75.5%) |
| Utilities | 0 (0.0%) | 0 (0.0%) |
| Information | 0 (0.0%) | 0 (0.0%) |
| Finance & Insurance | 15 (10.6%) | 126 (89.4%) |
| Real Estate, Rental & Leasing | 0 (0.0%) | 23 (100.0%) |
| Professional & Scientific | 78 (65.5%) | 41 (34.4%) |
| Enterprise Management | 0 (0.0%) | 0 (0.0%) |
| Administrative & Support | 38 (45.2%) | 46 (54.8%) |
| Educational Services | 21 (24.1%) | 66 (75.9%) |
| Health Care & Social Assistance | 30 (11.6%) | 229 (88.4%) |
| Arts, Entertainment & Recreation | 31 (100.0%) | 0 (0.0%) |
| Accommodation & Food Services | 4 (4.1%) | 93 (95.9%) |
| Public Administration | 21 (100.0%) | 0 (0.0%) |
| Total | 1,111 (52.9%) | 988 (47.1%) |
Education in Dallastown borough
School Enrollment in Dallastown borough
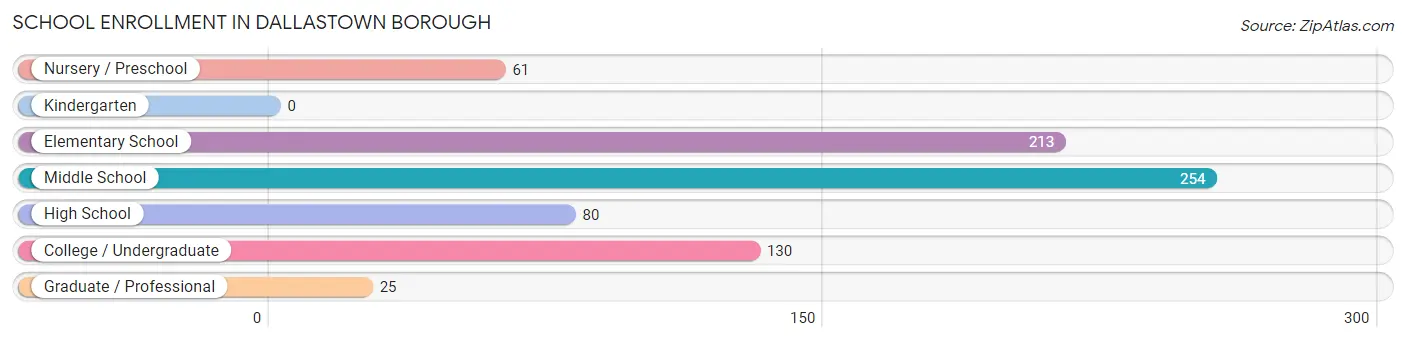
The most common levels of schooling among the 763 students in Dallastown borough are middle school (254 | 33.3%), elementary school (213 | 27.9%), and college / undergraduate (130 | 17.0%).
| School Level | # Students | % Students |
| Nursery / Preschool | 61 | 8.0% |
| Kindergarten | 0 | 0.0% |
| Elementary School | 213 | 27.9% |
| Middle School | 254 | 33.3% |
| High School | 80 | 10.5% |
| College / Undergraduate | 130 | 17.0% |
| Graduate / Professional | 25 | 3.3% |
| Total | 763 | 100.0% |
School Enrollment by Age by Funding Source in Dallastown borough
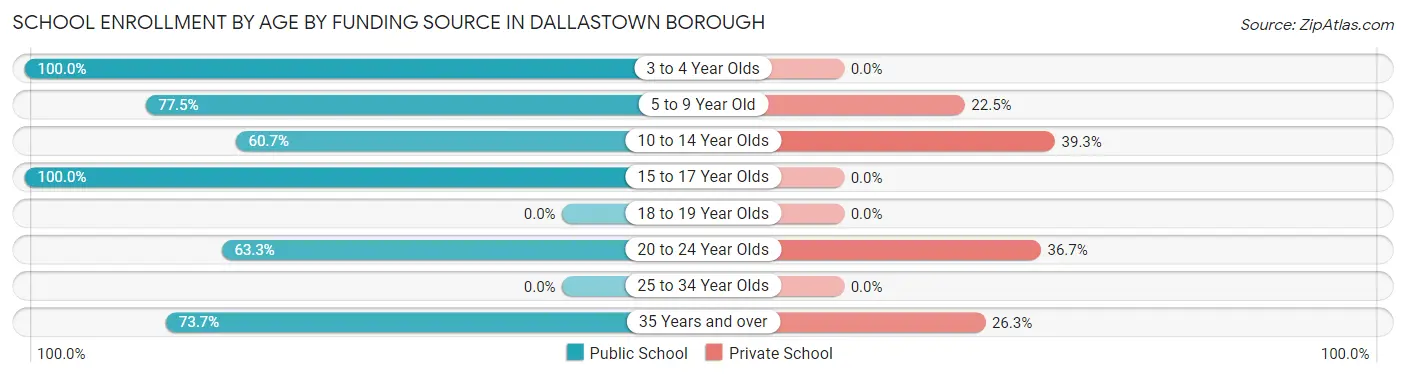
Out of a total of 763 students who are enrolled in schools in Dallastown borough, 217 (28.4%) attend a private institution, while the remaining 546 (71.6%) are enrolled in public schools. The age group of 10 to 14 year olds has the highest likelihood of being enrolled in private schools, with 132 (39.3% in the age bracket) enrolled. Conversely, the age group of 3 to 4 year olds has the lowest likelihood of being enrolled in a private school, with 61 (100.0% in the age bracket) attending a public institution.
| Age Bracket | Public School | Private School |
| 3 to 4 Year Olds | 61 (100.0%) | 0 (0.0%) |
| 5 to 9 Year Old | 131 (77.5%) | 38 (22.5%) |
| 10 to 14 Year Olds | 204 (60.7%) | 132 (39.3%) |
| 15 to 17 Year Olds | 42 (100.0%) | 0 (0.0%) |
| 18 to 19 Year Olds | 0 (0.0%) | 0 (0.0%) |
| 20 to 24 Year Olds | 38 (63.3%) | 22 (36.7%) |
| 25 to 34 Year Olds | 0 (0.0%) | 0 (0.0%) |
| 35 Years and over | 70 (73.7%) | 25 (26.3%) |
| Total | 546 (71.6%) | 217 (28.4%) |
Educational Attainment by Field of Study in Dallastown borough
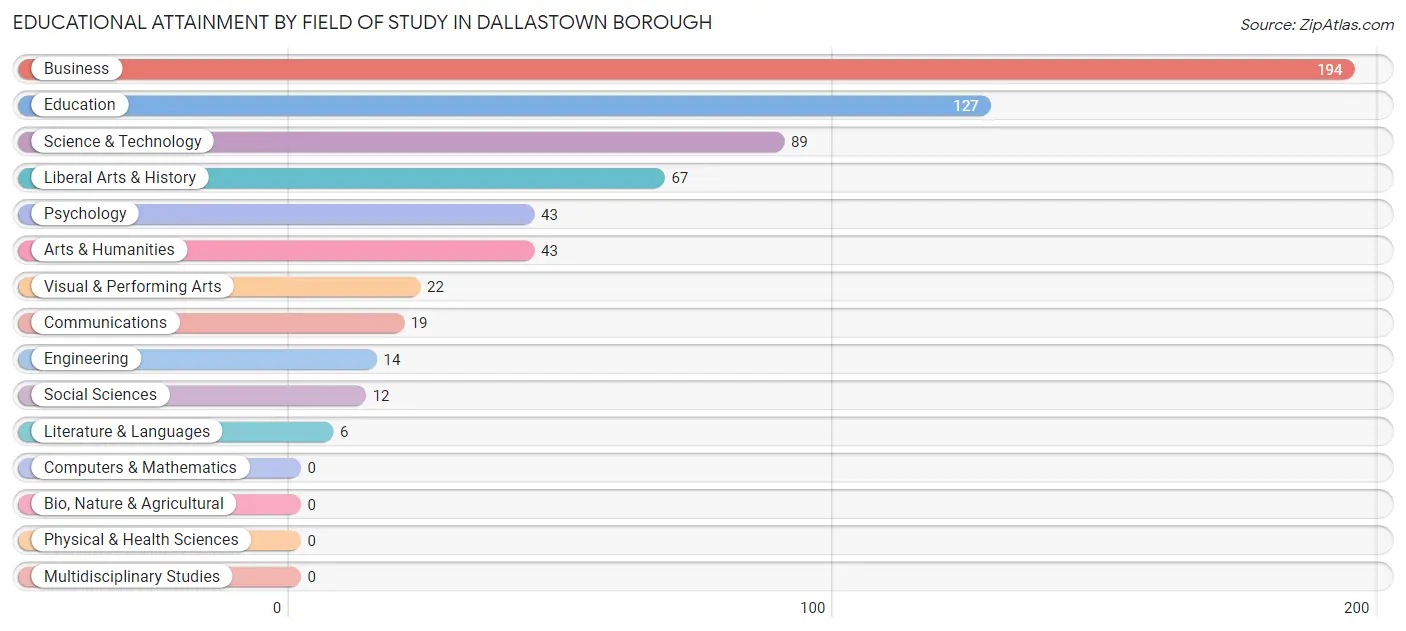
Business (194 | 30.5%), education (127 | 20.0%), science & technology (89 | 14.0%), liberal arts & history (67 | 10.5%), and psychology (43 | 6.8%) are the most common fields of study among 636 individuals in Dallastown borough who have obtained a bachelor's degree or higher.
| Field of Study | # Graduates | % Graduates |
| Computers & Mathematics | 0 | 0.0% |
| Bio, Nature & Agricultural | 0 | 0.0% |
| Physical & Health Sciences | 0 | 0.0% |
| Psychology | 43 | 6.8% |
| Social Sciences | 12 | 1.9% |
| Engineering | 14 | 2.2% |
| Multidisciplinary Studies | 0 | 0.0% |
| Science & Technology | 89 | 14.0% |
| Business | 194 | 30.5% |
| Education | 127 | 20.0% |
| Literature & Languages | 6 | 0.9% |
| Liberal Arts & History | 67 | 10.5% |
| Visual & Performing Arts | 22 | 3.5% |
| Communications | 19 | 3.0% |
| Arts & Humanities | 43 | 6.8% |
| Total | 636 | 100.0% |
Transportation & Commute in Dallastown borough
Vehicle Availability by Sex in Dallastown borough
The most prevalent vehicle ownership categories in Dallastown borough are males with 2 vehicles (516, accounting for 46.5%) and females with 2 vehicles (368, making up 52.2%).
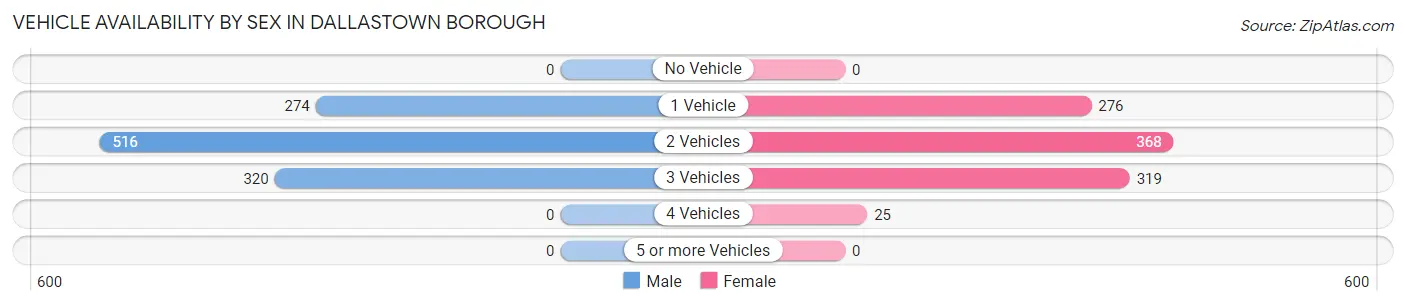
| Vehicles Available | Male | Female |
| No Vehicle | 0 (0.0%) | 0 (0.0%) |
| 1 Vehicle | 274 (24.7%) | 276 (27.9%) |
| 2 Vehicles | 516 (46.5%) | 368 (37.2%) |
| 3 Vehicles | 320 (28.8%) | 319 (32.3%) |
| 4 Vehicles | 0 (0.0%) | 25 (2.5%) |
| 5 or more Vehicles | 0 (0.0%) | 0 (0.0%) |
| Total | 1,110 (100.0%) | 988 (100.0%) |
Commute Time in Dallastown borough
The most frequently occuring commute durations in Dallastown borough are 5 to 9 minutes (369 commuters, 18.3%), 20 to 24 minutes (361 commuters, 17.9%), and less than 5 minutes (341 commuters, 16.9%).
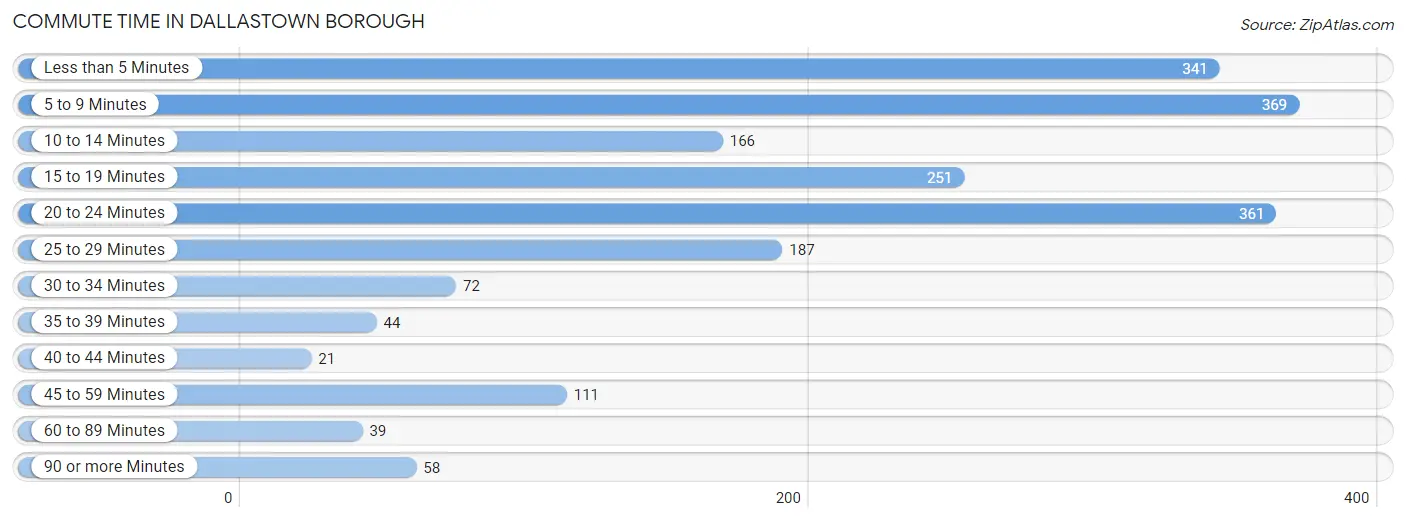
| Commute Time | # Commuters | % Commuters |
| Less than 5 Minutes | 341 | 16.9% |
| 5 to 9 Minutes | 369 | 18.3% |
| 10 to 14 Minutes | 166 | 8.2% |
| 15 to 19 Minutes | 251 | 12.4% |
| 20 to 24 Minutes | 361 | 17.9% |
| 25 to 29 Minutes | 187 | 9.3% |
| 30 to 34 Minutes | 72 | 3.6% |
| 35 to 39 Minutes | 44 | 2.2% |
| 40 to 44 Minutes | 21 | 1.0% |
| 45 to 59 Minutes | 111 | 5.5% |
| 60 to 89 Minutes | 39 | 1.9% |
| 90 or more Minutes | 58 | 2.9% |
Commute Time by Sex in Dallastown borough
The most common commute times in Dallastown borough are 5 to 9 minutes (207 commuters, 19.5%) for males and 15 to 19 minutes (183 commuters, 19.1%) for females.
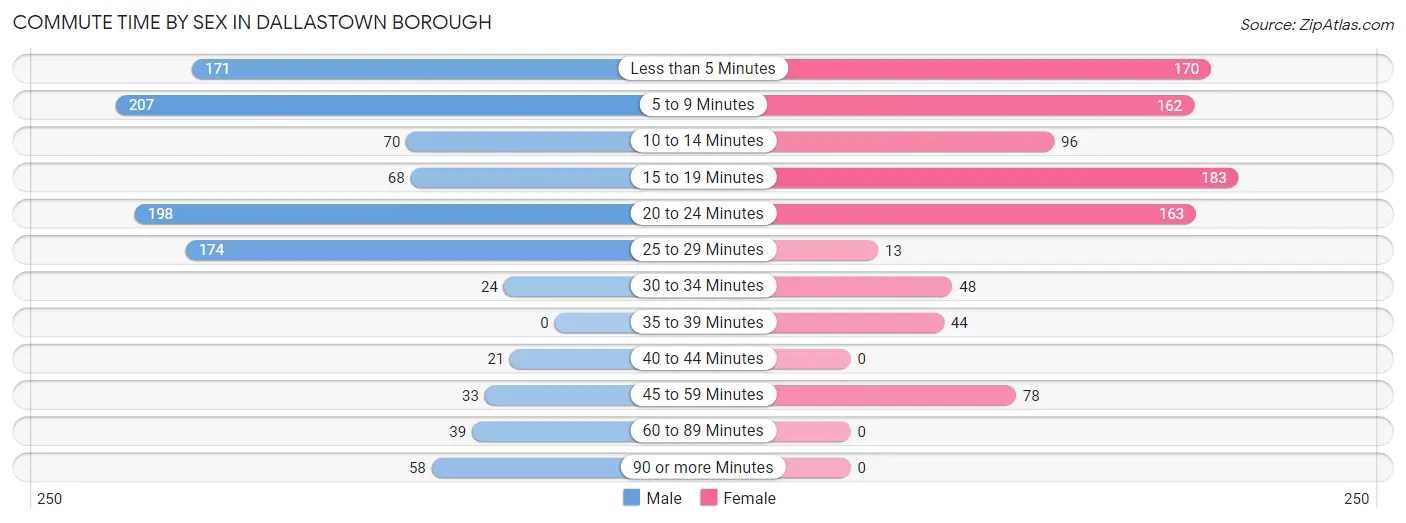
| Commute Time | Male | Female |
| Less than 5 Minutes | 171 (16.1%) | 170 (17.8%) |
| 5 to 9 Minutes | 207 (19.5%) | 162 (16.9%) |
| 10 to 14 Minutes | 70 (6.6%) | 96 (10.0%) |
| 15 to 19 Minutes | 68 (6.4%) | 183 (19.1%) |
| 20 to 24 Minutes | 198 (18.6%) | 163 (17.0%) |
| 25 to 29 Minutes | 174 (16.4%) | 13 (1.4%) |
| 30 to 34 Minutes | 24 (2.3%) | 48 (5.0%) |
| 35 to 39 Minutes | 0 (0.0%) | 44 (4.6%) |
| 40 to 44 Minutes | 21 (2.0%) | 0 (0.0%) |
| 45 to 59 Minutes | 33 (3.1%) | 78 (8.2%) |
| 60 to 89 Minutes | 39 (3.7%) | 0 (0.0%) |
| 90 or more Minutes | 58 (5.5%) | 0 (0.0%) |
Time of Departure to Work by Sex in Dallastown borough
The most frequent times of departure to work in Dallastown borough are 12:00 AM to 4:59 AM (131, 12.3%) for males and 8:30 AM to 8:59 AM (154, 16.1%) for females.
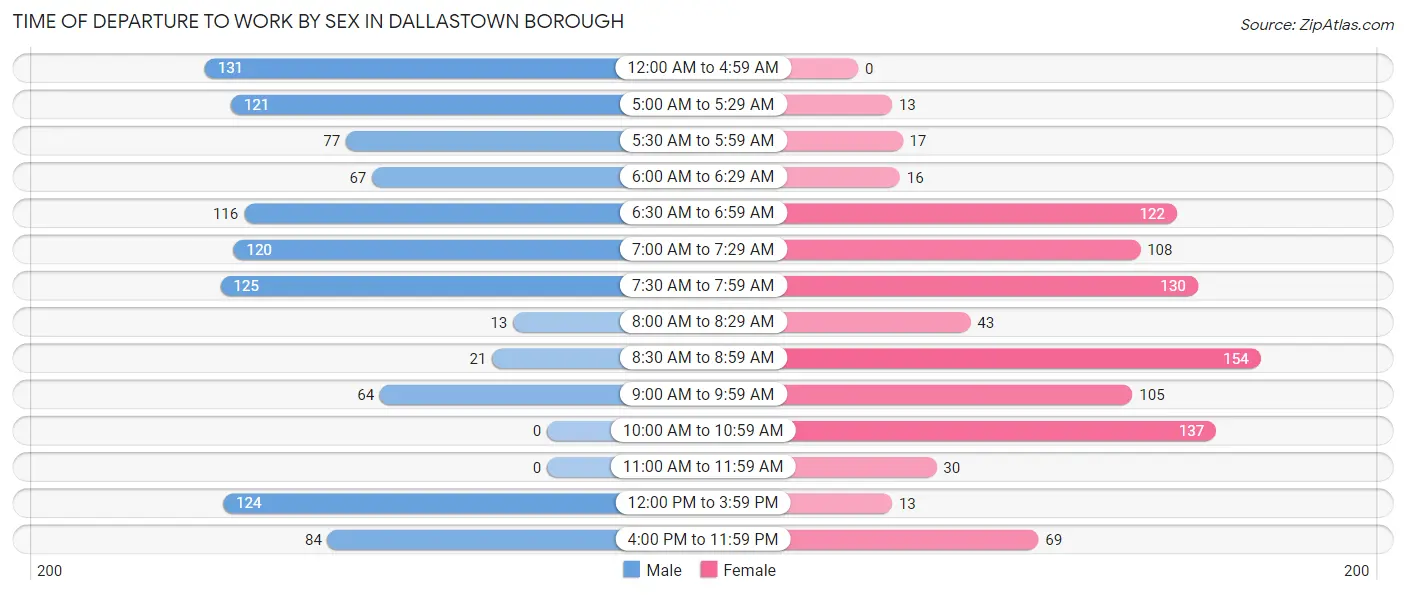
| Time of Departure | Male | Female |
| 12:00 AM to 4:59 AM | 131 (12.3%) | 0 (0.0%) |
| 5:00 AM to 5:29 AM | 121 (11.4%) | 13 (1.4%) |
| 5:30 AM to 5:59 AM | 77 (7.2%) | 17 (1.8%) |
| 6:00 AM to 6:29 AM | 67 (6.3%) | 16 (1.7%) |
| 6:30 AM to 6:59 AM | 116 (10.9%) | 122 (12.8%) |
| 7:00 AM to 7:29 AM | 120 (11.3%) | 108 (11.3%) |
| 7:30 AM to 7:59 AM | 125 (11.8%) | 130 (13.6%) |
| 8:00 AM to 8:29 AM | 13 (1.2%) | 43 (4.5%) |
| 8:30 AM to 8:59 AM | 21 (2.0%) | 154 (16.1%) |
| 9:00 AM to 9:59 AM | 64 (6.0%) | 105 (11.0%) |
| 10:00 AM to 10:59 AM | 0 (0.0%) | 137 (14.3%) |
| 11:00 AM to 11:59 AM | 0 (0.0%) | 30 (3.1%) |
| 12:00 PM to 3:59 PM | 124 (11.7%) | 13 (1.4%) |
| 4:00 PM to 11:59 PM | 84 (7.9%) | 69 (7.2%) |
| Total | 1,063 (100.0%) | 957 (100.0%) |
Housing Occupancy in Dallastown borough
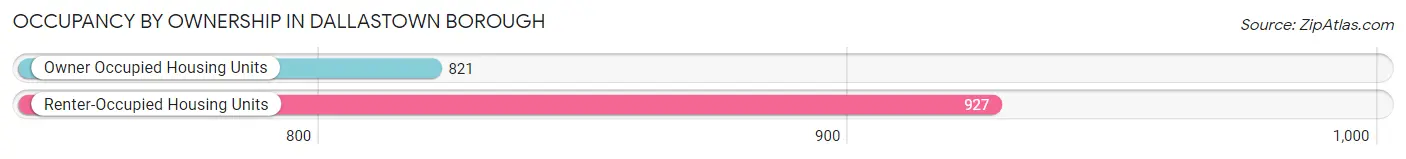
Occupancy by Ownership in Dallastown borough
Of the total 1,748 dwellings in Dallastown borough, owner-occupied units account for 821 (47.0%), while renter-occupied units make up 927 (53.0%).
| Occupancy | # Housing Units | % Housing Units |
| Owner Occupied Housing Units | 821 | 47.0% |
| Renter-Occupied Housing Units | 927 | 53.0% |
| Total Occupied Housing Units | 1,748 | 100.0% |
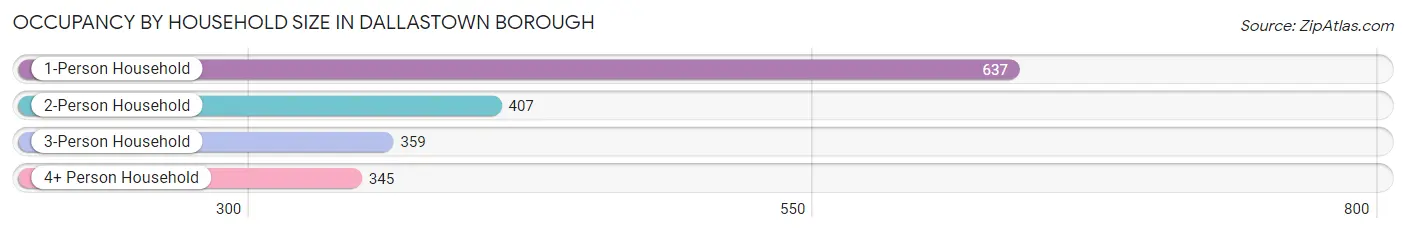
Occupancy by Household Size in Dallastown borough
| Household Size | # Housing Units | % Housing Units |
| 1-Person Household | 637 | 36.4% |
| 2-Person Household | 407 | 23.3% |
| 3-Person Household | 359 | 20.5% |
| 4+ Person Household | 345 | 19.7% |
| Total Housing Units | 1,748 | 100.0% |
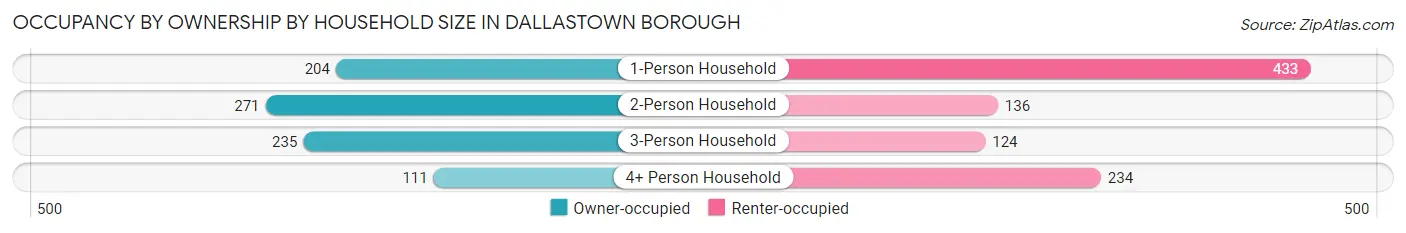
Occupancy by Ownership by Household Size in Dallastown borough
| Household Size | Owner-occupied | Renter-occupied |
| 1-Person Household | 204 (32.0%) | 433 (68.0%) |
| 2-Person Household | 271 (66.6%) | 136 (33.4%) |
| 3-Person Household | 235 (65.5%) | 124 (34.5%) |
| 4+ Person Household | 111 (32.2%) | 234 (67.8%) |
| Total Housing Units | 821 (47.0%) | 927 (53.0%) |
Occupancy by Educational Attainment in Dallastown borough

| Household Size | Owner-occupied | Renter-occupied |
| Less than High School | 32 (24.2%) | 100 (75.8%) |
| High School Diploma | 345 (52.6%) | 311 (47.4%) |
| College/Associate Degree | 204 (38.8%) | 322 (61.2%) |
| Bachelor's Degree or higher | 240 (55.3%) | 194 (44.7%) |
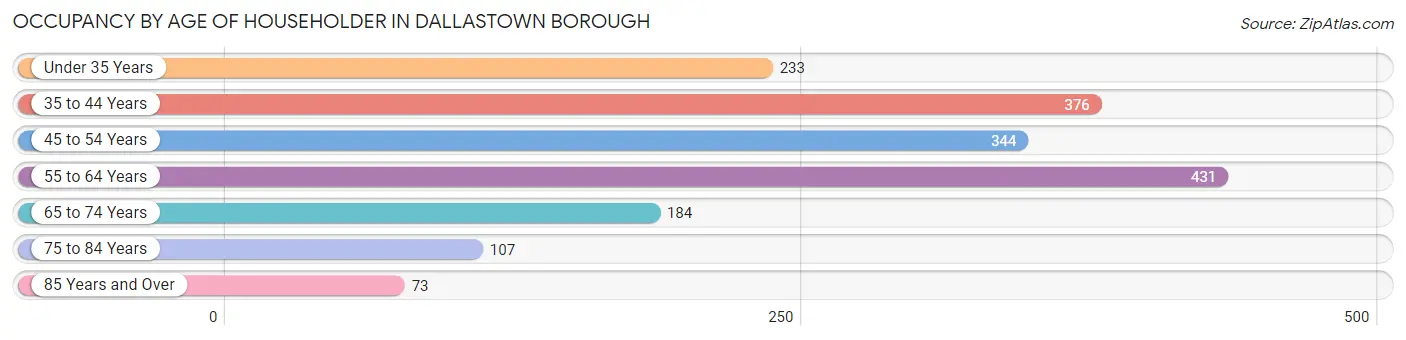
Occupancy by Age of Householder in Dallastown borough
| Age Bracket | # Households | % Households |
| Under 35 Years | 233 | 13.3% |
| 35 to 44 Years | 376 | 21.5% |
| 45 to 54 Years | 344 | 19.7% |
| 55 to 64 Years | 431 | 24.7% |
| 65 to 74 Years | 184 | 10.5% |
| 75 to 84 Years | 107 | 6.1% |
| 85 Years and Over | 73 | 4.2% |
| Total | 1,748 | 100.0% |
Housing Finances in Dallastown borough
Median Income by Occupancy in Dallastown borough
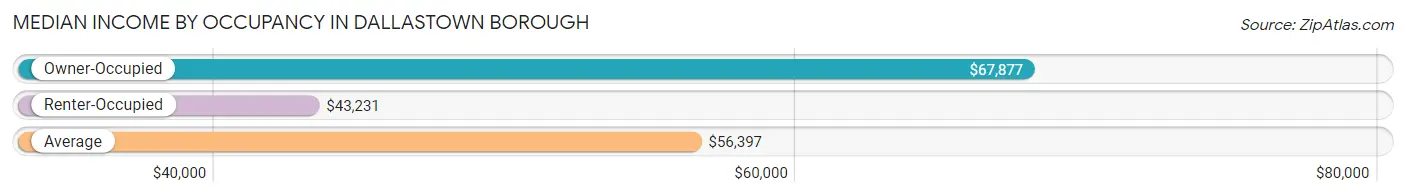
| Occupancy Type | # Households | Median Income |
| Owner-Occupied | 821 (47.0%) | $67,877 |
| Renter-Occupied | 927 (53.0%) | $43,231 |
| Average | 1,748 (100.0%) | $56,397 |
Occupancy by Householder Income Bracket in Dallastown borough
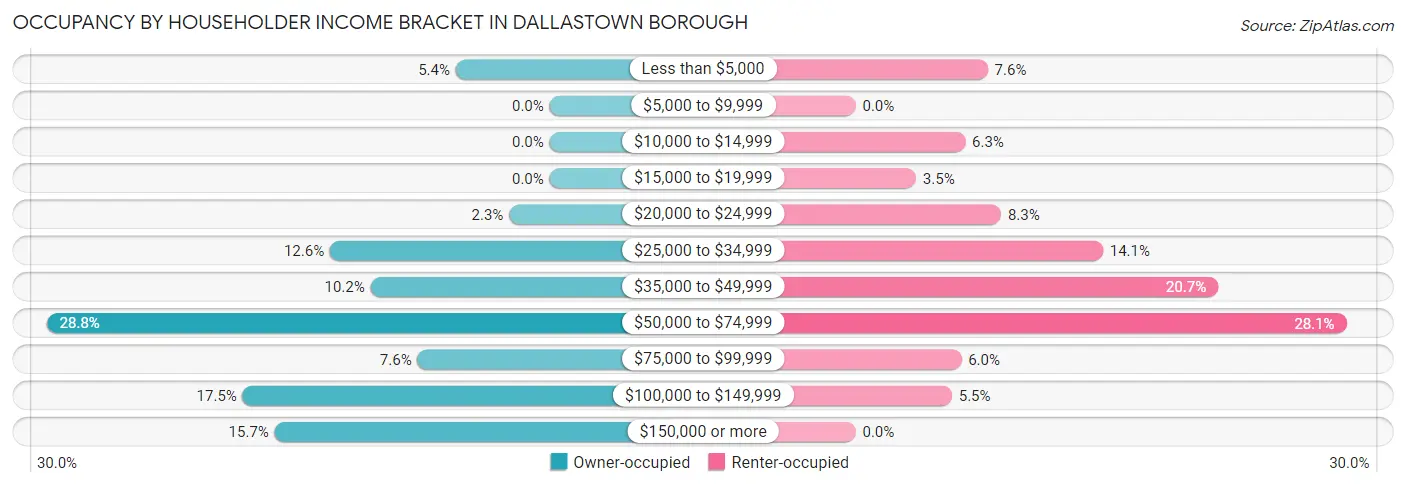
| Income Bracket | Owner-occupied | Renter-occupied |
| Less than $5,000 | 44 (5.4%) | 70 (7.5%) |
| $5,000 to $9,999 | 0 (0.0%) | 0 (0.0%) |
| $10,000 to $14,999 | 0 (0.0%) | 58 (6.3%) |
| $15,000 to $19,999 | 0 (0.0%) | 32 (3.5%) |
| $20,000 to $24,999 | 19 (2.3%) | 77 (8.3%) |
| $25,000 to $34,999 | 103 (12.6%) | 131 (14.1%) |
| $35,000 to $49,999 | 84 (10.2%) | 192 (20.7%) |
| $50,000 to $74,999 | 236 (28.7%) | 260 (28.1%) |
| $75,000 to $99,999 | 62 (7.5%) | 56 (6.0%) |
| $100,000 to $149,999 | 144 (17.5%) | 51 (5.5%) |
| $150,000 or more | 129 (15.7%) | 0 (0.0%) |
| Total | 821 (100.0%) | 927 (100.0%) |
Monthly Housing Cost Tiers in Dallastown borough
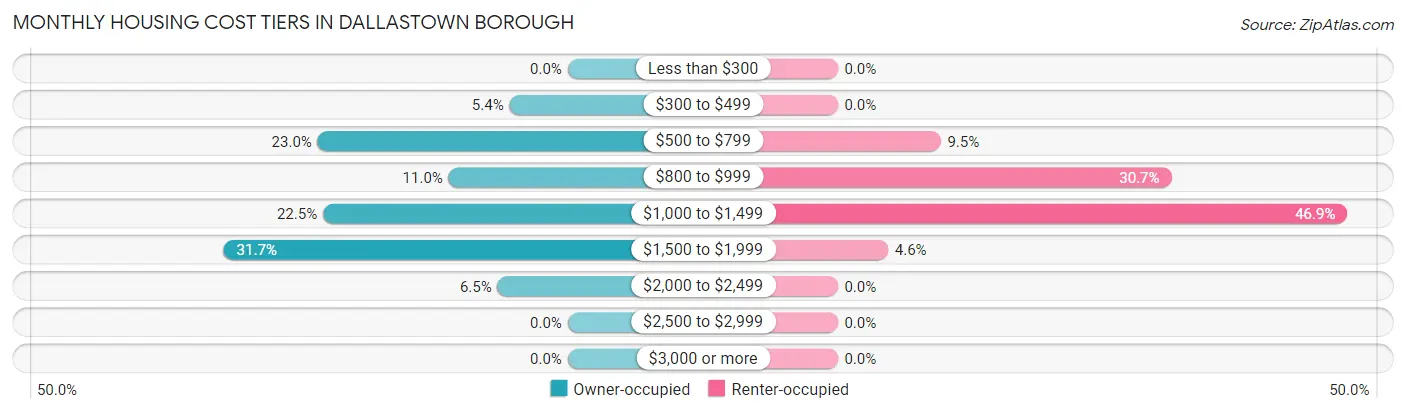
| Monthly Cost | Owner-occupied | Renter-occupied |
| Less than $300 | 0 (0.0%) | 0 (0.0%) |
| $300 to $499 | 44 (5.4%) | 0 (0.0%) |
| $500 to $799 | 189 (23.0%) | 88 (9.5%) |
| $800 to $999 | 90 (11.0%) | 285 (30.7%) |
| $1,000 to $1,499 | 185 (22.5%) | 435 (46.9%) |
| $1,500 to $1,999 | 260 (31.7%) | 43 (4.6%) |
| $2,000 to $2,499 | 53 (6.5%) | 0 (0.0%) |
| $2,500 to $2,999 | 0 (0.0%) | 0 (0.0%) |
| $3,000 or more | 0 (0.0%) | 0 (0.0%) |
| Total | 821 (100.0%) | 927 (100.0%) |
Physical Housing Characteristics in Dallastown borough
Housing Structures in Dallastown borough
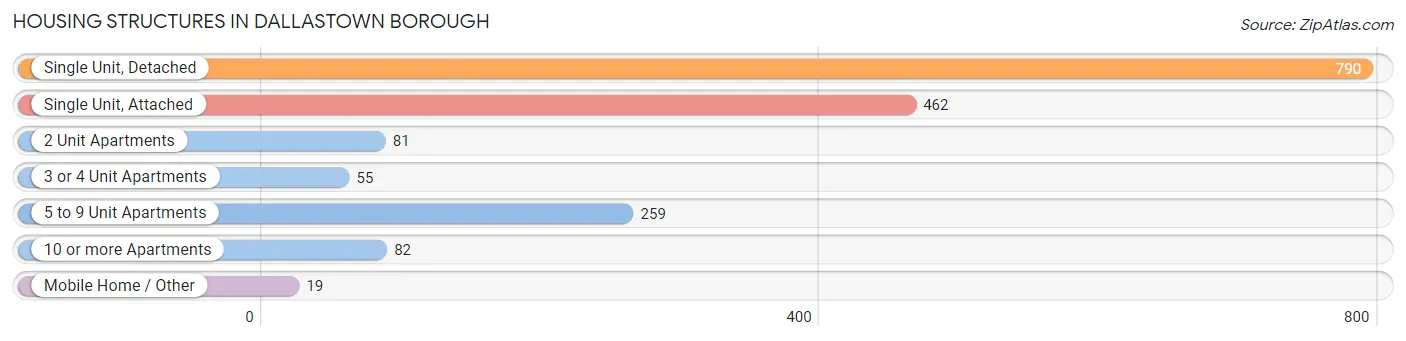
| Structure Type | # Housing Units | % Housing Units |
| Single Unit, Detached | 790 | 45.2% |
| Single Unit, Attached | 462 | 26.4% |
| 2 Unit Apartments | 81 | 4.6% |
| 3 or 4 Unit Apartments | 55 | 3.2% |
| 5 to 9 Unit Apartments | 259 | 14.8% |
| 10 or more Apartments | 82 | 4.7% |
| Mobile Home / Other | 19 | 1.1% |
| Total | 1,748 | 100.0% |
Housing Structures by Occupancy in Dallastown borough
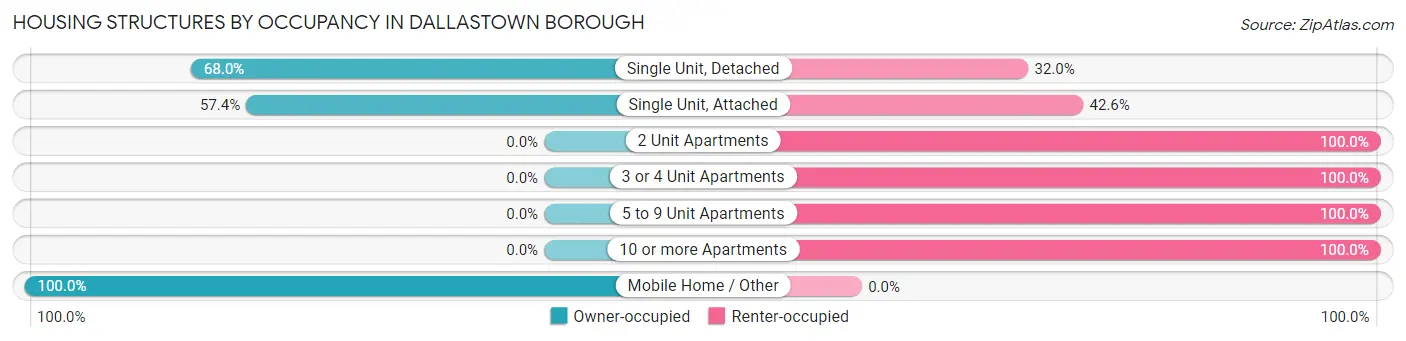
| Structure Type | Owner-occupied | Renter-occupied |
| Single Unit, Detached | 537 (68.0%) | 253 (32.0%) |
| Single Unit, Attached | 265 (57.4%) | 197 (42.6%) |
| 2 Unit Apartments | 0 (0.0%) | 81 (100.0%) |
| 3 or 4 Unit Apartments | 0 (0.0%) | 55 (100.0%) |
| 5 to 9 Unit Apartments | 0 (0.0%) | 259 (100.0%) |
| 10 or more Apartments | 0 (0.0%) | 82 (100.0%) |
| Mobile Home / Other | 19 (100.0%) | 0 (0.0%) |
| Total | 821 (47.0%) | 927 (53.0%) |
Housing Structures by Number of Rooms in Dallastown borough
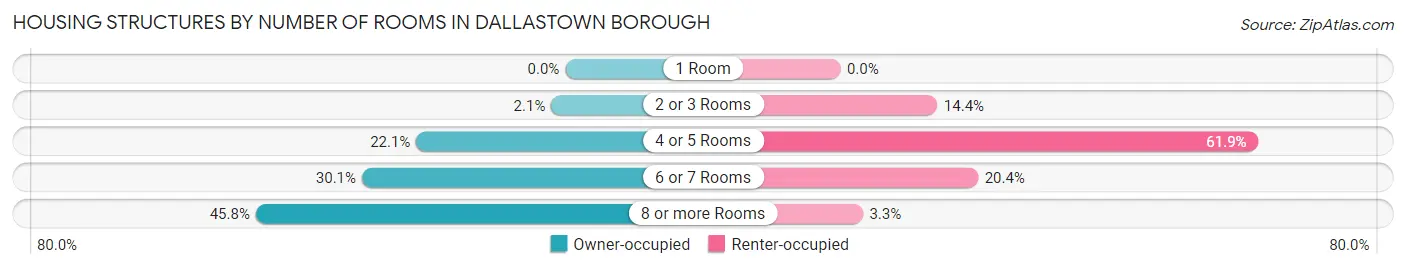
| Number of Rooms | Owner-occupied | Renter-occupied |
| 1 Room | 0 (0.0%) | 0 (0.0%) |
| 2 or 3 Rooms | 17 (2.1%) | 133 (14.3%) |
| 4 or 5 Rooms | 181 (22.1%) | 574 (61.9%) |
| 6 or 7 Rooms | 247 (30.1%) | 189 (20.4%) |
| 8 or more Rooms | 376 (45.8%) | 31 (3.3%) |
| Total | 821 (100.0%) | 927 (100.0%) |
Housing Structure by Heating Type in Dallastown borough
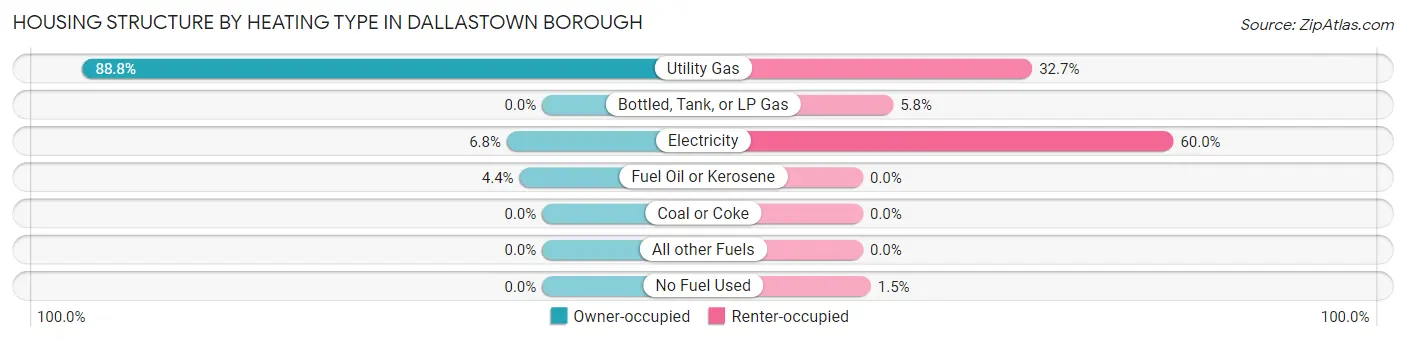
| Heating Type | Owner-occupied | Renter-occupied |
| Utility Gas | 729 (88.8%) | 303 (32.7%) |
| Bottled, Tank, or LP Gas | 0 (0.0%) | 54 (5.8%) |
| Electricity | 56 (6.8%) | 556 (60.0%) |
| Fuel Oil or Kerosene | 36 (4.4%) | 0 (0.0%) |
| Coal or Coke | 0 (0.0%) | 0 (0.0%) |
| All other Fuels | 0 (0.0%) | 0 (0.0%) |
| No Fuel Used | 0 (0.0%) | 14 (1.5%) |
| Total | 821 (100.0%) | 927 (100.0%) |
Household Vehicle Usage in Dallastown borough
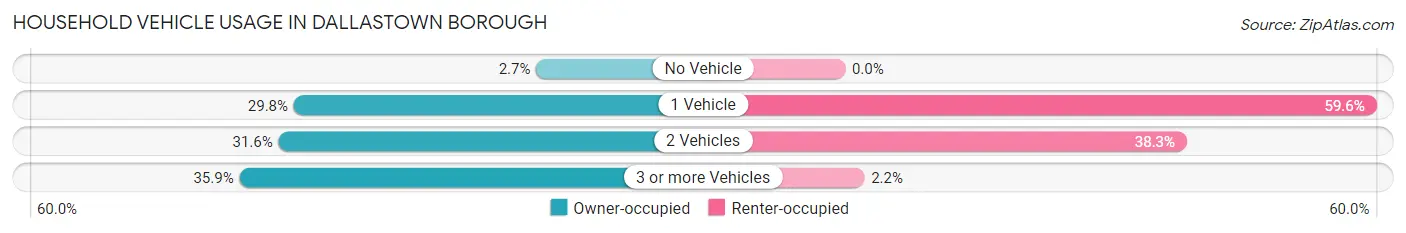
| Vehicles per Household | Owner-occupied | Renter-occupied |
| No Vehicle | 22 (2.7%) | 0 (0.0%) |
| 1 Vehicle | 245 (29.8%) | 552 (59.6%) |
| 2 Vehicles | 259 (31.6%) | 355 (38.3%) |
| 3 or more Vehicles | 295 (35.9%) | 20 (2.2%) |
| Total | 821 (100.0%) | 927 (100.0%) |
Real Estate & Mortgages in Dallastown borough
Real Estate and Mortgage Overview in Dallastown borough
| Characteristic | Without Mortgage | With Mortgage |
| Housing Units | 196 | 625 |
| Median Property Value | $131,700 | $156,000 |
| Median Household Income | $40,192 | $114 |
| Monthly Housing Costs | $719 | $0 |
| Real Estate Taxes | $2,973 | $0 |
Property Value by Mortgage Status in Dallastown borough
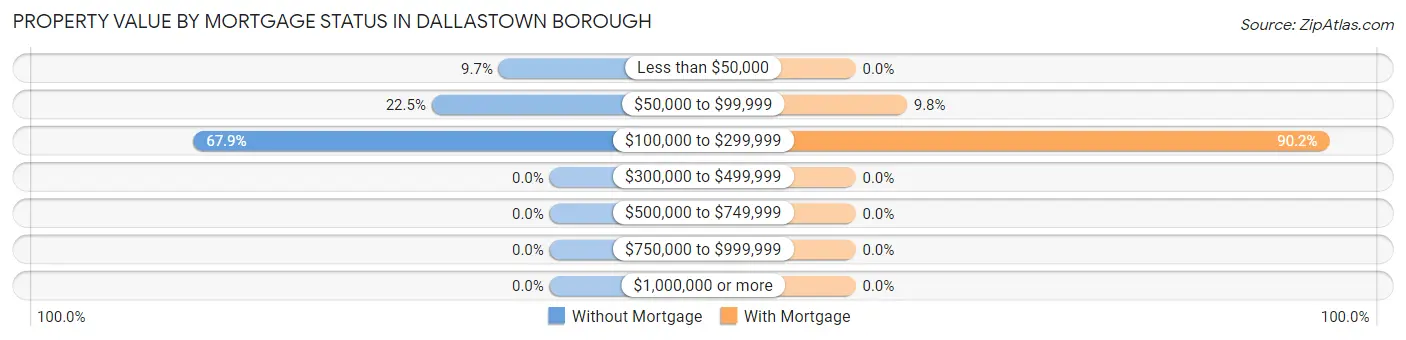
| Property Value | Without Mortgage | With Mortgage |
| Less than $50,000 | 19 (9.7%) | 0 (0.0%) |
| $50,000 to $99,999 | 44 (22.5%) | 61 (9.8%) |
| $100,000 to $299,999 | 133 (67.9%) | 564 (90.2%) |
| $300,000 to $499,999 | 0 (0.0%) | 0 (0.0%) |
| $500,000 to $749,999 | 0 (0.0%) | 0 (0.0%) |
| $750,000 to $999,999 | 0 (0.0%) | 0 (0.0%) |
| $1,000,000 or more | 0 (0.0%) | 0 (0.0%) |
| Total | 196 (100.0%) | 625 (100.0%) |
Household Income by Mortgage Status in Dallastown borough
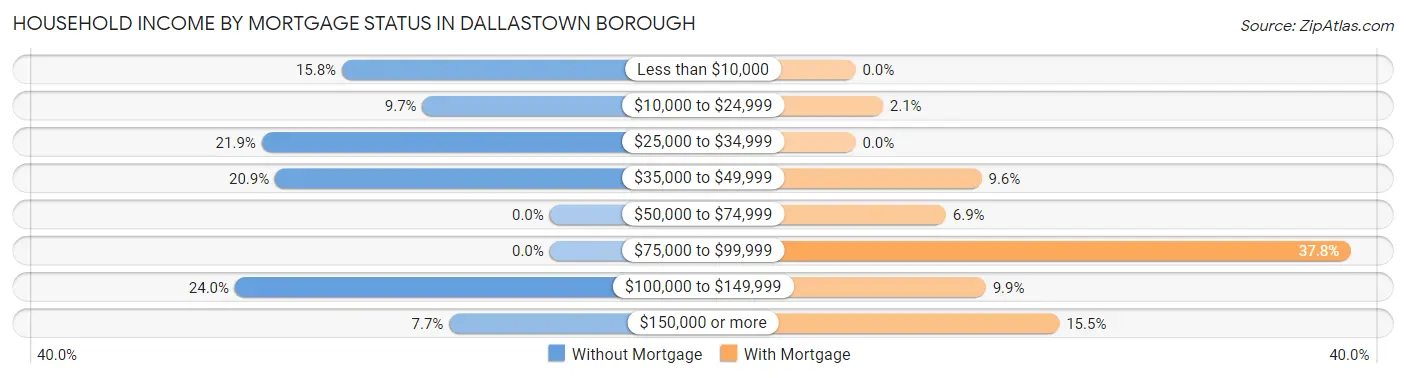
| Household Income | Without Mortgage | With Mortgage |
| Less than $10,000 | 31 (15.8%) | 0 (0.0%) |
| $10,000 to $24,999 | 19 (9.7%) | 13 (2.1%) |
| $25,000 to $34,999 | 43 (21.9%) | 0 (0.0%) |
| $35,000 to $49,999 | 41 (20.9%) | 60 (9.6%) |
| $50,000 to $74,999 | 0 (0.0%) | 43 (6.9%) |
| $75,000 to $99,999 | 0 (0.0%) | 236 (37.8%) |
| $100,000 to $149,999 | 47 (24.0%) | 62 (9.9%) |
| $150,000 or more | 15 (7.6%) | 97 (15.5%) |
| Total | 196 (100.0%) | 625 (100.0%) |
Property Value to Household Income Ratio in Dallastown borough
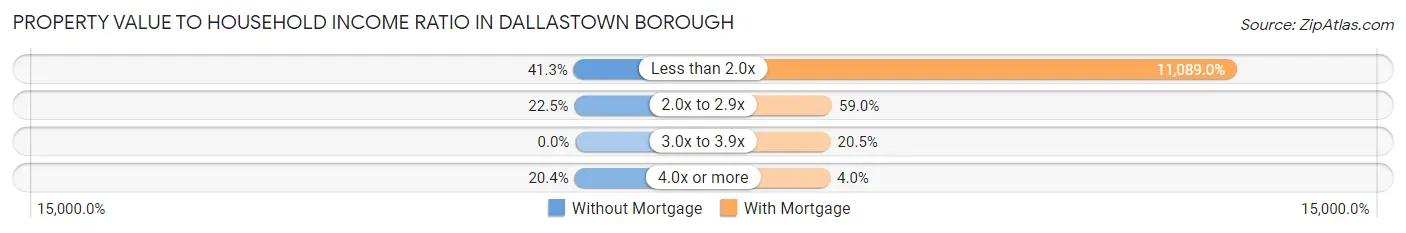
| Value-to-Income Ratio | Without Mortgage | With Mortgage |
| Less than 2.0x | 81 (41.3%) | 69,306 (11,089.0%) |
| 2.0x to 2.9x | 44 (22.5%) | 369 (59.0%) |
| 3.0x to 3.9x | 0 (0.0%) | 128 (20.5%) |
| 4.0x or more | 40 (20.4%) | 25 (4.0%) |
| Total | 196 (100.0%) | 625 (100.0%) |
Real Estate Taxes by Mortgage Status in Dallastown borough
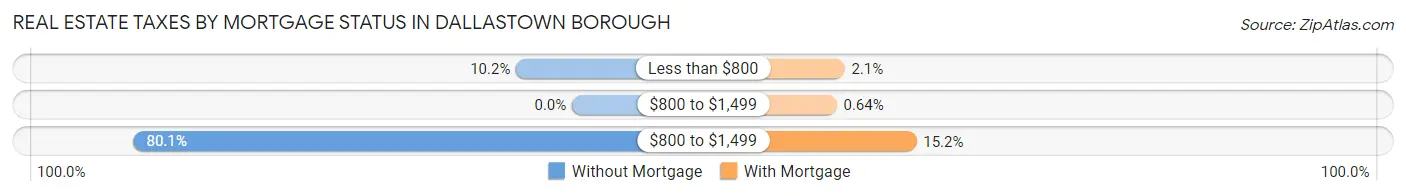
| Property Taxes | Without Mortgage | With Mortgage |
| Less than $800 | 20 (10.2%) | 13 (2.1%) |
| $800 to $1,499 | 0 (0.0%) | 4 (0.6%) |
| $800 to $1,499 | 157 (80.1%) | 95 (15.2%) |
| Total | 196 (100.0%) | 625 (100.0%) |
Health & Disability in Dallastown borough
Health Insurance Coverage by Age in Dallastown borough
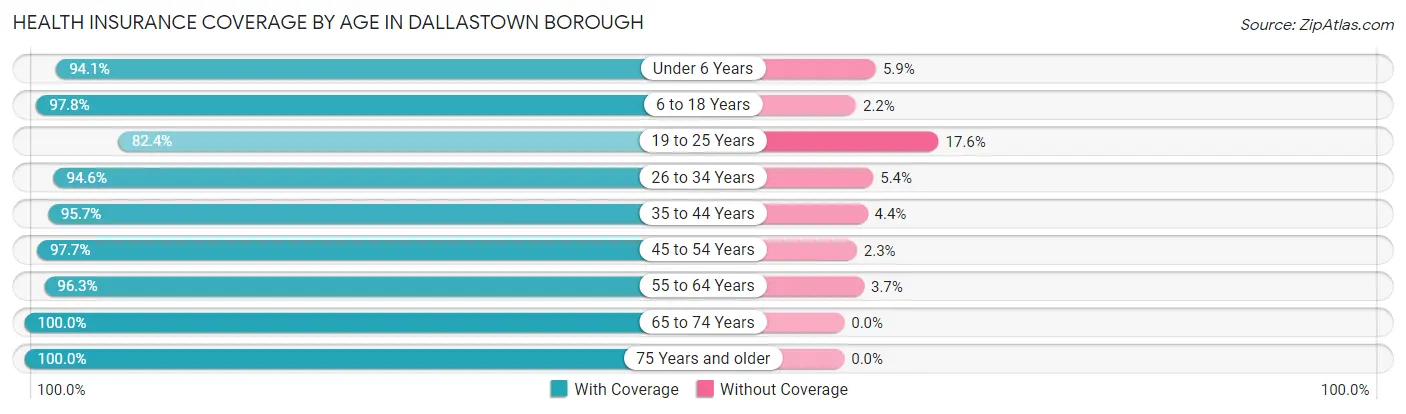
| Age Bracket | With Coverage | Without Coverage |
| Under 6 Years | 446 (94.1%) | 28 (5.9%) |
| 6 to 18 Years | 535 (97.8%) | 12 (2.2%) |
| 19 to 25 Years | 267 (82.4%) | 57 (17.6%) |
| 26 to 34 Years | 350 (94.6%) | 20 (5.4%) |
| 35 to 44 Years | 681 (95.7%) | 31 (4.3%) |
| 45 to 54 Years | 501 (97.7%) | 12 (2.3%) |
| 55 to 64 Years | 707 (96.3%) | 27 (3.7%) |
| 65 to 74 Years | 274 (100.0%) | 0 (0.0%) |
| 75 Years and older | 189 (100.0%) | 0 (0.0%) |
| Total | 3,950 (95.5%) | 187 (4.5%) |
Health Insurance Coverage by Citizenship Status in Dallastown borough
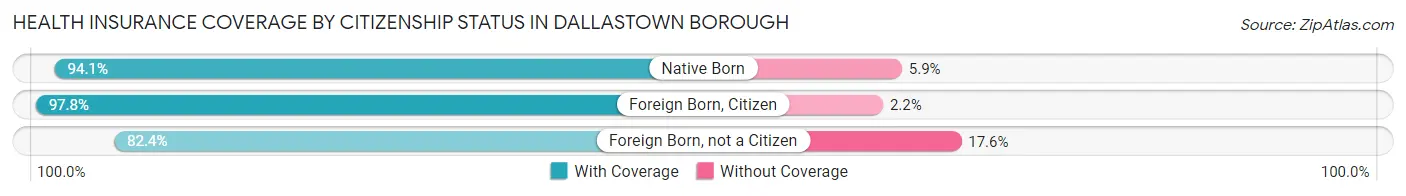
| Citizenship Status | With Coverage | Without Coverage |
| Native Born | 446 (94.1%) | 28 (5.9%) |
| Foreign Born, Citizen | 535 (97.8%) | 12 (2.2%) |
| Foreign Born, not a Citizen | 267 (82.4%) | 57 (17.6%) |
Health Insurance Coverage by Household Income in Dallastown borough
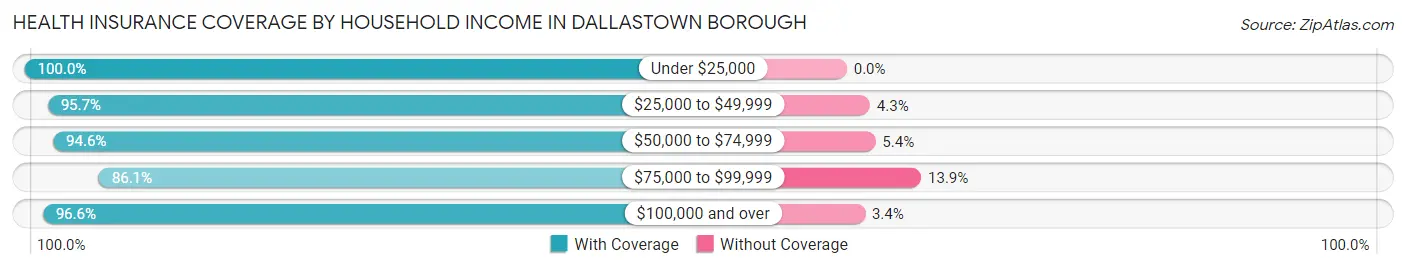
| Household Income | With Coverage | Without Coverage |
| Under $25,000 | 502 (100.0%) | 0 (0.0%) |
| $25,000 to $49,999 | 730 (95.7%) | 33 (4.3%) |
| $50,000 to $74,999 | 1,342 (94.6%) | 76 (5.4%) |
| $75,000 to $99,999 | 235 (86.1%) | 38 (13.9%) |
| $100,000 and over | 1,138 (96.6%) | 40 (3.4%) |
Public vs Private Health Insurance Coverage by Age in Dallastown borough
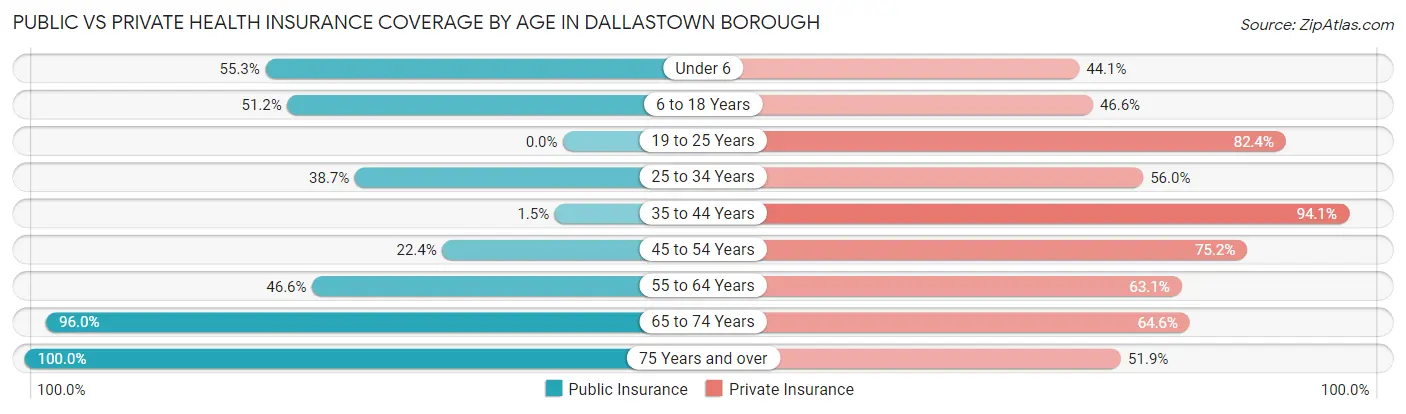
| Age Bracket | Public Insurance | Private Insurance |
| Under 6 | 262 (55.3%) | 209 (44.1%) |
| 6 to 18 Years | 280 (51.2%) | 255 (46.6%) |
| 19 to 25 Years | 0 (0.0%) | 267 (82.4%) |
| 25 to 34 Years | 143 (38.7%) | 207 (55.9%) |
| 35 to 44 Years | 11 (1.5%) | 670 (94.1%) |
| 45 to 54 Years | 115 (22.4%) | 386 (75.2%) |
| 55 to 64 Years | 342 (46.6%) | 463 (63.1%) |
| 65 to 74 Years | 263 (96.0%) | 177 (64.6%) |
| 75 Years and over | 189 (100.0%) | 98 (51.8%) |
| Total | 1,605 (38.8%) | 2,732 (66.0%) |
Disability Status by Sex by Age in Dallastown borough
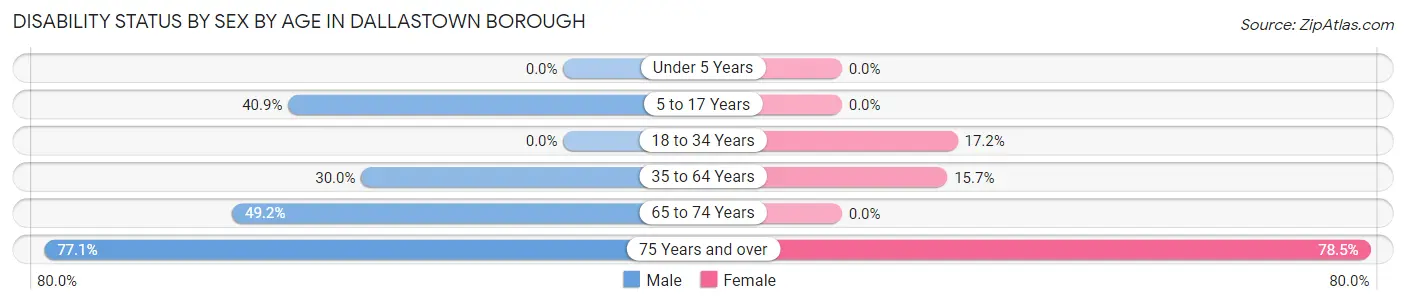
| Age Bracket | Male | Female |
| Under 5 Years | 0 (0.0%) | 0 (0.0%) |
| 5 to 17 Years | 58 (40.8%) | 0 (0.0%) |
| 18 to 34 Years | 0 (0.0%) | 55 (17.2%) |
| 35 to 64 Years | 285 (30.0%) | 158 (15.7%) |
| 65 to 74 Years | 91 (49.2%) | 0 (0.0%) |
| 75 Years and over | 74 (77.1%) | 73 (78.5%) |
Disability Class by Sex by Age in Dallastown borough
Disability Class: Hearing Difficulty
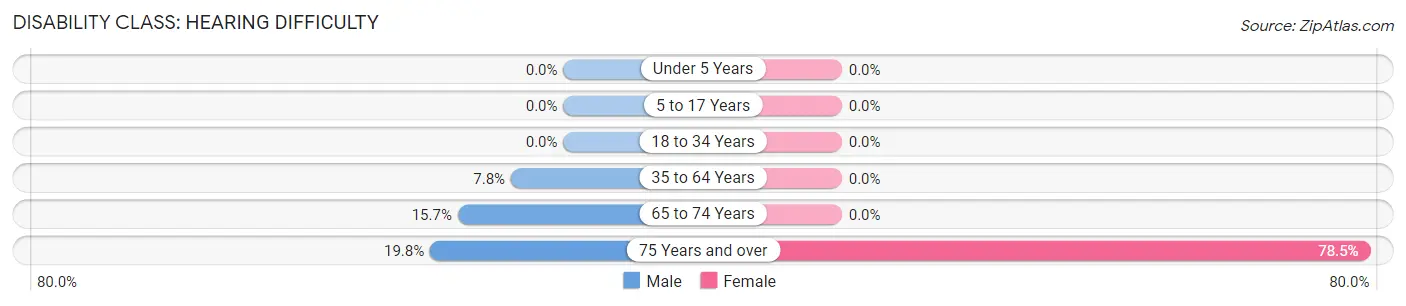
| Age Bracket | Male | Female |
| Under 5 Years | 0 (0.0%) | 0 (0.0%) |
| 5 to 17 Years | 0 (0.0%) | 0 (0.0%) |
| 18 to 34 Years | 0 (0.0%) | 0 (0.0%) |
| 35 to 64 Years | 74 (7.8%) | 0 (0.0%) |
| 65 to 74 Years | 29 (15.7%) | 0 (0.0%) |
| 75 Years and over | 19 (19.8%) | 73 (78.5%) |
Disability Class: Vision Difficulty
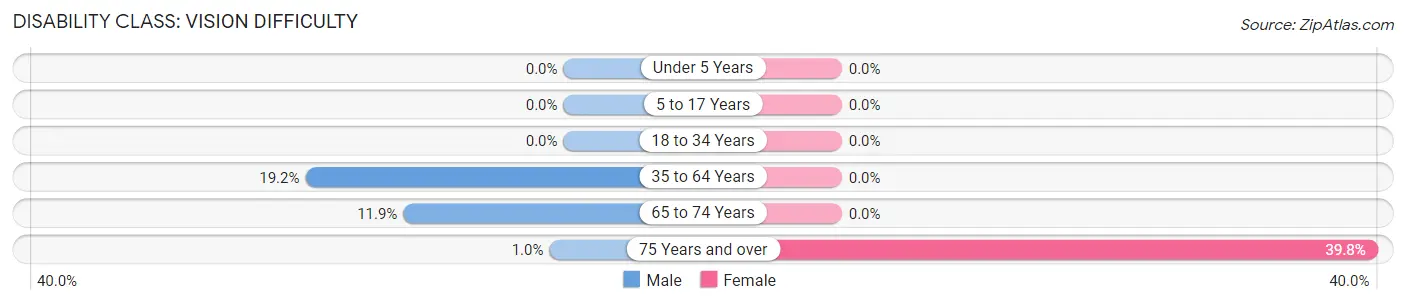
| Age Bracket | Male | Female |
| Under 5 Years | 0 (0.0%) | 0 (0.0%) |
| 5 to 17 Years | 0 (0.0%) | 0 (0.0%) |
| 18 to 34 Years | 0 (0.0%) | 0 (0.0%) |
| 35 to 64 Years | 182 (19.2%) | 0 (0.0%) |
| 65 to 74 Years | 22 (11.9%) | 0 (0.0%) |
| 75 Years and over | 1 (1.0%) | 37 (39.8%) |
Disability Class: Cognitive Difficulty
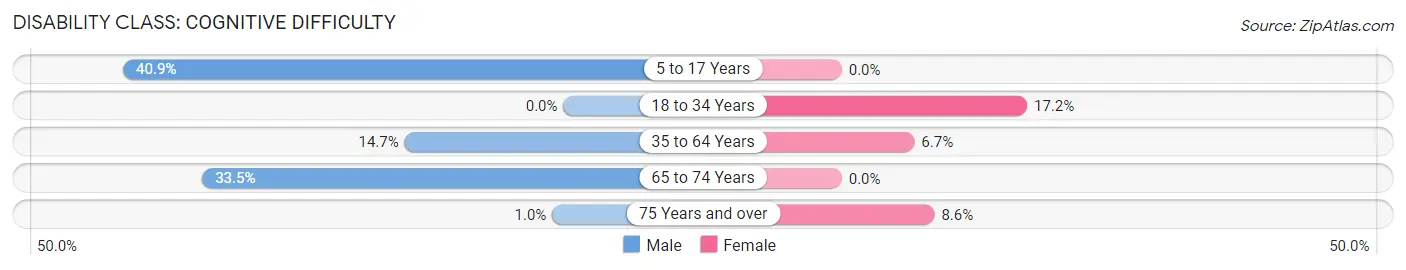
| Age Bracket | Male | Female |
| 5 to 17 Years | 58 (40.8%) | 0 (0.0%) |
| 18 to 34 Years | 0 (0.0%) | 55 (17.2%) |
| 35 to 64 Years | 140 (14.7%) | 68 (6.7%) |
| 65 to 74 Years | 62 (33.5%) | 0 (0.0%) |
| 75 Years and over | 1 (1.0%) | 8 (8.6%) |
Disability Class: Ambulatory Difficulty
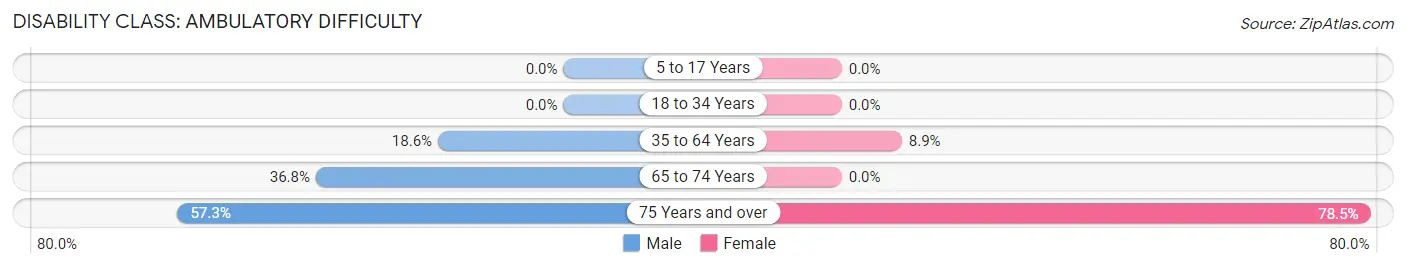
| Age Bracket | Male | Female |
| 5 to 17 Years | 0 (0.0%) | 0 (0.0%) |
| 18 to 34 Years | 0 (0.0%) | 0 (0.0%) |
| 35 to 64 Years | 177 (18.6%) | 90 (8.9%) |
| 65 to 74 Years | 68 (36.8%) | 0 (0.0%) |
| 75 Years and over | 55 (57.3%) | 73 (78.5%) |
Disability Class: Self-Care Difficulty
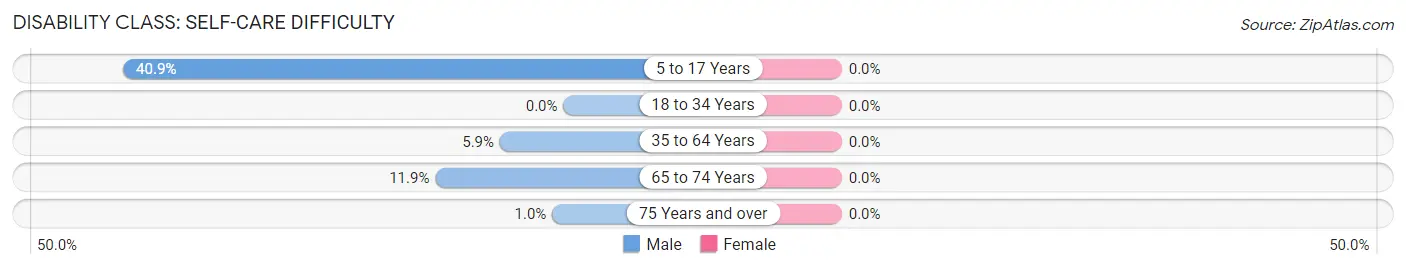
| Age Bracket | Male | Female |
| 5 to 17 Years | 58 (40.8%) | 0 (0.0%) |
| 18 to 34 Years | 0 (0.0%) | 0 (0.0%) |
| 35 to 64 Years | 56 (5.9%) | 0 (0.0%) |
| 65 to 74 Years | 22 (11.9%) | 0 (0.0%) |
| 75 Years and over | 1 (1.0%) | 0 (0.0%) |
Technology Access in Dallastown borough
Computing Device Access in Dallastown borough
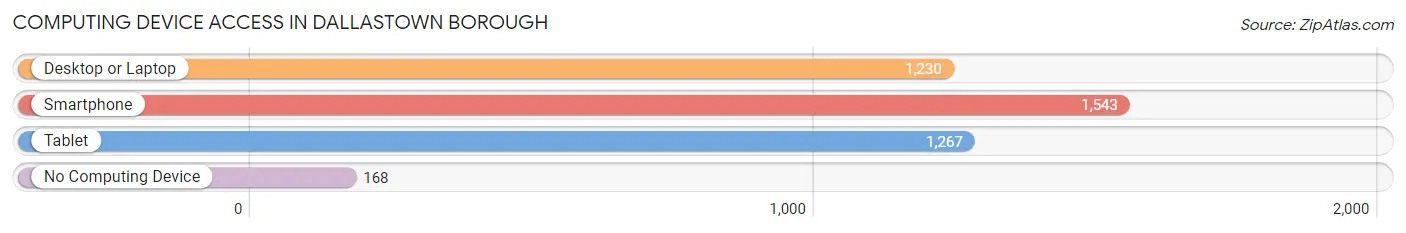
| Device Type | # Households | % Households |
| Desktop or Laptop | 1,230 | 70.4% |
| Smartphone | 1,543 | 88.3% |
| Tablet | 1,267 | 72.5% |
| No Computing Device | 168 | 9.6% |
| Total | 1,748 | 100.0% |
Internet Access in Dallastown borough
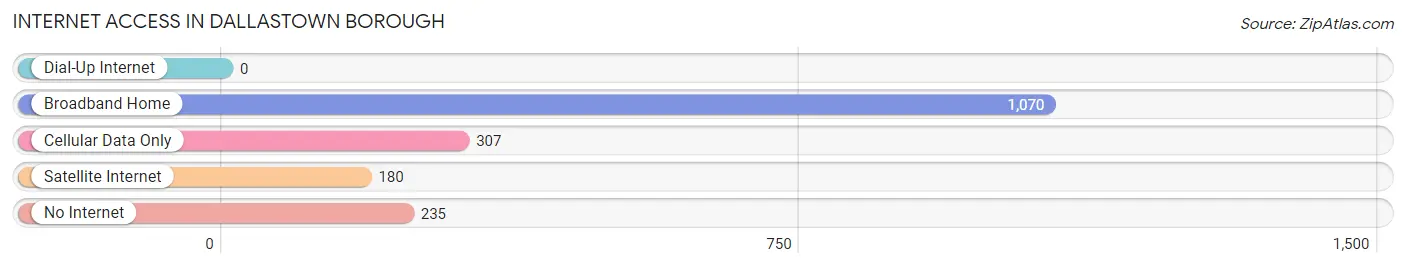
| Internet Type | # Households | % Households |
| Dial-Up Internet | 0 | 0.0% |
| Broadband Home | 1,070 | 61.2% |
| Cellular Data Only | 307 | 17.6% |
| Satellite Internet | 180 | 10.3% |
| No Internet | 235 | 13.4% |
| Total | 1,748 | 100.0% |
Dallastown borough Summary
Dallastown Borough is a small borough located in York County, Pennsylvania. It is situated in the southeastern corner of the county, approximately 10 miles south of the city of York. The borough is bordered by the townships of York, Windsor, and North Hopewell. As of the 2010 census, the population of Dallastown was 4,085.
History
The area that is now Dallastown was first settled in 1750 by a group of German immigrants. The town was originally known as “Dallastowne” and was named after the first settler, John Dallas. The town was officially incorporated in 1854.
In the late 19th century, Dallastown was a thriving industrial center. The town was home to several factories, including a paper mill, a brickyard, and a tannery. The town also had a railroad station, which connected it to the rest of the county.
In the early 20th century, Dallastown began to decline as the factories closed and the railroad station was abandoned. The town’s population decreased from 1,500 in 1900 to just over 1,000 in 1950.
In the late 20th century, Dallastown began to experience a resurgence. The town was revitalized with the construction of a new shopping center and the opening of several new businesses. The population of the borough has since grown to over 4,000.
Geography
Dallastown is located at 39°45'N 76°37'W. The borough has a total area of 1.2 square miles, all of which is land. The borough is situated in the Piedmont region of Pennsylvania, and is surrounded by rolling hills and farmland.
The borough is located in the Susquehanna River watershed. The borough is drained by several small creeks, including the Codorus Creek, which flows through the center of town.
Economy
The economy of Dallastown is largely based on agriculture and light manufacturing. The borough is home to several small businesses, including a grocery store, a hardware store, and a restaurant.
The borough is also home to several large employers, including a manufacturing plant and a distribution center. The borough is also home to a number of small farms, which produce a variety of crops, including corn, soybeans, and hay.
Demographics
As of the 2010 census, the population of Dallastown was 4,085. The racial makeup of the borough was 94.3% White, 2.2% African American, 0.3% Native American, 0.7% Asian, 0.1% Pacific Islander, and 2.4% from other races. Hispanic or Latino of any race were 2.7% of the population.
The median household income in Dallastown was $50,945, and the median family income was $60,917. The per capita income for the borough was $24,945. About 6.3% of families and 8.2% of the population were below the poverty line, including 11.2% of those under age 18 and 5.2% of those age 65 or over.
Common Questions
What is Per Capita Income in Dallastown borough?
Per Capita income in Dallastown borough is $26,255.
What is the Median Family Income in Dallastown borough?
Median Family Income in Dallastown borough is $67,645.
What is the Median Household income in Dallastown borough?
Median Household Income in Dallastown borough is $56,397.
What is Income or Wage Gap in Dallastown borough?
Income or Wage Gap in Dallastown borough is 35.6%.
Women in Dallastown borough earn 64.4 cents for every dollar earned by a man.
What is Inequality or Gini Index in Dallastown borough?
Inequality or Gini Index in Dallastown borough is 0.38.
What is the Total Population of Dallastown borough?
Total Population of Dallastown borough is 4,164.
What is the Total Male Population of Dallastown borough?
Total Male Population of Dallastown borough is 1,969.
What is the Total Female Population of Dallastown borough?
Total Female Population of Dallastown borough is 2,195.
What is the Ratio of Males per 100 Females in Dallastown borough?
There are 89.70 Males per 100 Females in Dallastown borough.
What is the Ratio of Females per 100 Males in Dallastown borough?
There are 111.48 Females per 100 Males in Dallastown borough.
What is the Median Population Age in Dallastown borough?
Median Population Age in Dallastown borough is 39.9 Years.
What is the Average Family Size in Dallastown borough
Average Family Size in Dallastown borough is 3.2 People.
What is the Average Household Size in Dallastown borough
Average Household Size in Dallastown borough is 2.4 People.
How Large is the Labor Force in Dallastown borough?
There are 2,226 People in the Labor Forcein in Dallastown borough.
What is the Percentage of People in the Labor Force in Dallastown borough?
69.9% of People are in the Labor Force in Dallastown borough.
What is the Unemployment Rate in Dallastown borough?
Unemployment Rate in Dallastown borough is 5.7%.