Coopersburg borough, PA Map & Demographics
Coopersburg borough Overview
$38,790
PER CAPITA INCOME
$94,500
AVG FAMILY INCOME
$70,465
AVG HOUSEHOLD INCOME
30.6%
WAGE / INCOME GAP [ % ]
69.4¢/ $1
WAGE / INCOME GAP [ $ ]
0.41
INEQUALITY / GINI INDEX
2,332
TOTAL POPULATION
1,149
MALE POPULATION
1,183
FEMALE POPULATION
97.13
MALES / 100 FEMALES
102.96
FEMALES / 100 MALES
43.2
MEDIAN AGE
2.8
AVG FAMILY SIZE
2.2
AVG HOUSEHOLD SIZE
1,324
LABOR FORCE [ PEOPLE ]
67.3%
PERCENT IN LABOR FORCE
2.9%
UNEMPLOYMENT RATE
Income in Coopersburg borough
Income Overview in Coopersburg borough
Per Capita Income in Coopersburg borough is $38,790, while median incomes of families and households are $94,500 and $70,465 respectively.
| Characteristic | Number | Measure |
| Per Capita Income | 2,332 | $38,790 |
| Median Family Income | 646 | $94,500 |
| Mean Family Income | 646 | $106,499 |
| Median Household Income | 1,050 | $70,465 |
| Mean Household Income | 1,050 | $85,214 |
| Income Deficit | 646 | $0 |
| Wage / Income Gap (%) | 2,332 | 30.58% |
| Wage / Income Gap ($) | 2,332 | 69.42¢ per $1 |
| Gini / Inequality Index | 2,332 | 0.41 |
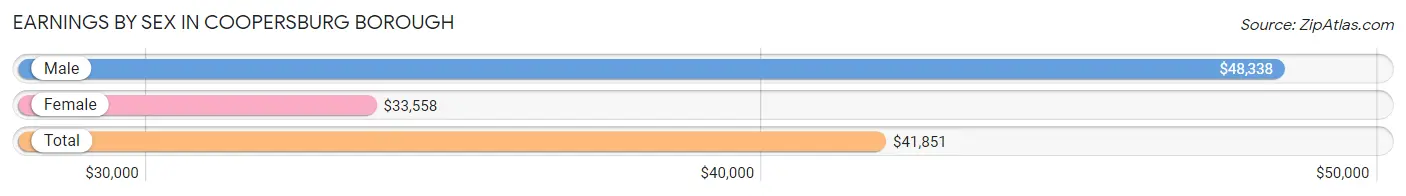
Earnings by Sex in Coopersburg borough
Average Earnings in Coopersburg borough are $41,851, $48,338 for men and $33,558 for women, a difference of 30.6%.
| Sex | Number | Average Earnings |
| Male | 715 (50.0%) | $48,338 |
| Female | 714 (50.0%) | $33,558 |
| Total | 1,429 (100.0%) | $41,851 |
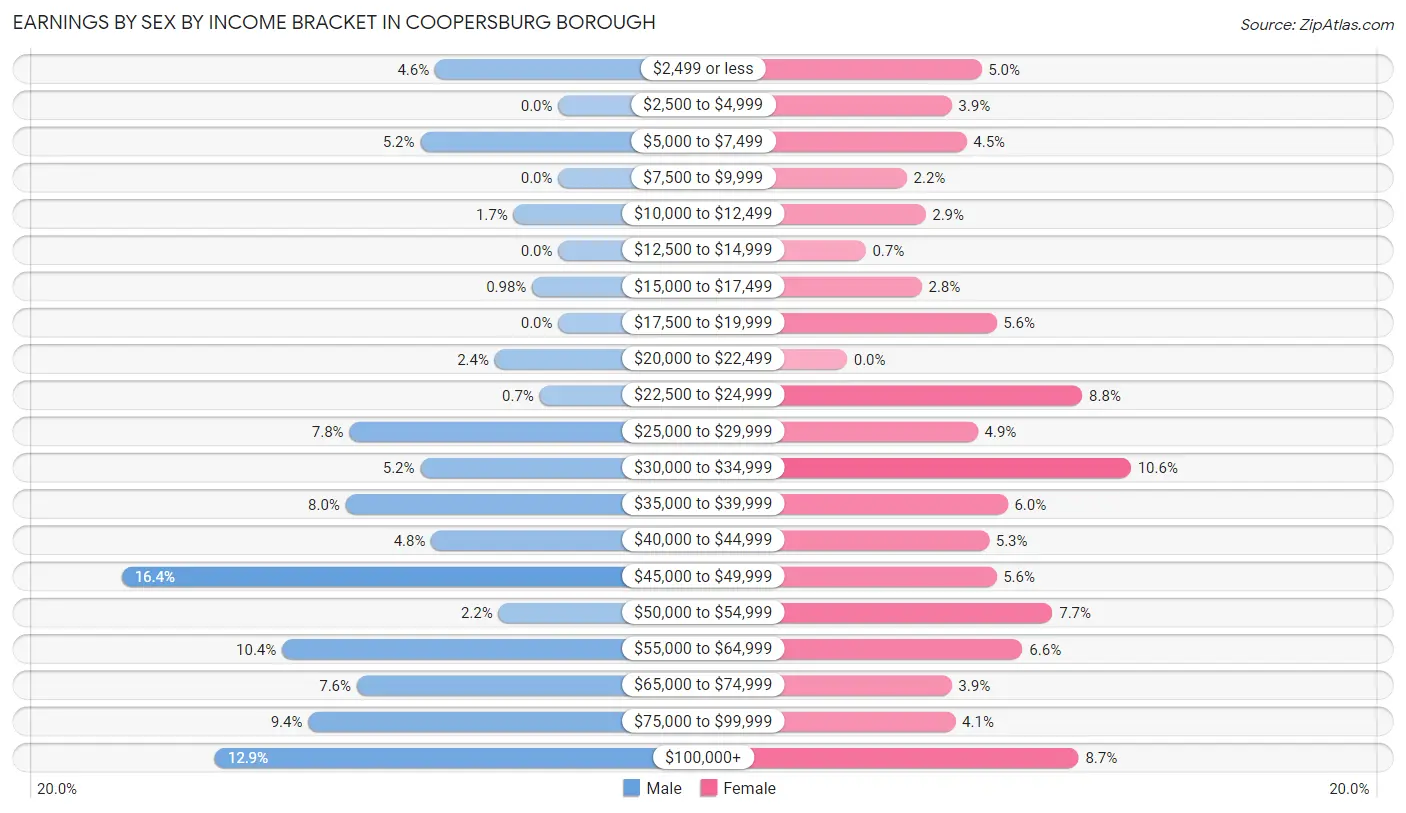
Earnings by Sex by Income Bracket in Coopersburg borough
The most common earnings brackets in Coopersburg borough are $45,000 to $49,999 for men (117 | 16.4%) and $30,000 to $34,999 for women (76 | 10.6%).
| Income | Male | Female |
| $2,499 or less | 33 (4.6%) | 36 (5.0%) |
| $2,500 to $4,999 | 0 (0.0%) | 28 (3.9%) |
| $5,000 to $7,499 | 37 (5.2%) | 32 (4.5%) |
| $7,500 to $9,999 | 0 (0.0%) | 16 (2.2%) |
| $10,000 to $12,499 | 12 (1.7%) | 21 (2.9%) |
| $12,500 to $14,999 | 0 (0.0%) | 5 (0.7%) |
| $15,000 to $17,499 | 7 (1.0%) | 20 (2.8%) |
| $17,500 to $19,999 | 0 (0.0%) | 40 (5.6%) |
| $20,000 to $22,499 | 17 (2.4%) | 0 (0.0%) |
| $22,500 to $24,999 | 5 (0.7%) | 63 (8.8%) |
| $25,000 to $29,999 | 56 (7.8%) | 35 (4.9%) |
| $30,000 to $34,999 | 37 (5.2%) | 76 (10.6%) |
| $35,000 to $39,999 | 57 (8.0%) | 43 (6.0%) |
| $40,000 to $44,999 | 34 (4.8%) | 38 (5.3%) |
| $45,000 to $49,999 | 117 (16.4%) | 40 (5.6%) |
| $50,000 to $54,999 | 16 (2.2%) | 55 (7.7%) |
| $55,000 to $64,999 | 74 (10.3%) | 47 (6.6%) |
| $65,000 to $74,999 | 54 (7.5%) | 28 (3.9%) |
| $75,000 to $99,999 | 67 (9.4%) | 29 (4.1%) |
| $100,000+ | 92 (12.9%) | 62 (8.7%) |
| Total | 715 (100.0%) | 714 (100.0%) |
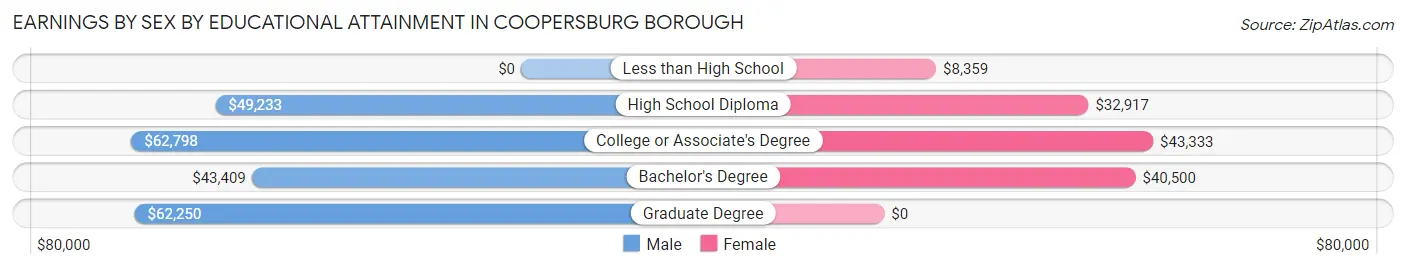
Earnings by Sex by Educational Attainment in Coopersburg borough
Average earnings in Coopersburg borough are $49,497 for men and $39,263 for women, a difference of 20.7%. Men with an educational attainment of college or associate's degree enjoy the highest average annual earnings of $62,798, while those with bachelor's degree education earn the least with $43,409. Women with an educational attainment of college or associate's degree earn the most with the average annual earnings of $43,333, while those with less than high school education have the smallest earnings of $8,359.
| Educational Attainment | Male Income | Female Income |
| Less than High School | - | - |
| High School Diploma | $49,233 | $32,917 |
| College or Associate's Degree | $62,798 | $43,333 |
| Bachelor's Degree | $43,409 | $40,500 |
| Graduate Degree | $62,250 | $0 |
| Total | $49,497 | $39,263 |
Family Income in Coopersburg borough
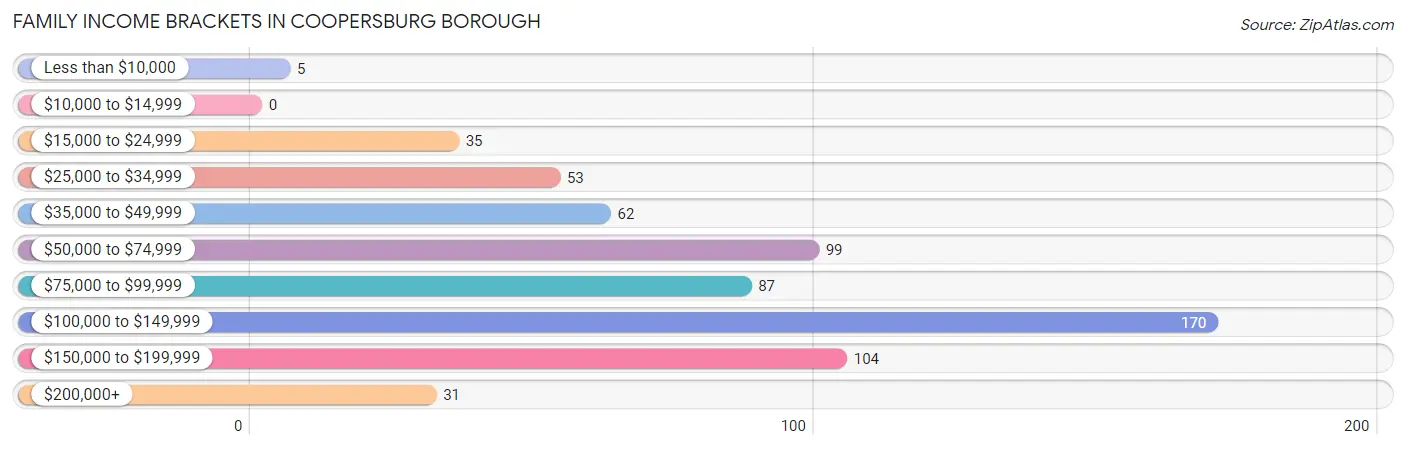
Family Income Brackets in Coopersburg borough
According to the Coopersburg borough family income data, there are 170 families falling into the $100,000 to $149,999 income range, which is the most common income bracket and makes up 26.3% of all families.
| Income Bracket | # Families | % Families |
| Less than $10,000 | 5 | 0.8% |
| $10,000 to $14,999 | 0 | 0.0% |
| $15,000 to $24,999 | 35 | 5.4% |
| $25,000 to $34,999 | 53 | 8.2% |
| $35,000 to $49,999 | 62 | 9.6% |
| $50,000 to $74,999 | 99 | 15.3% |
| $75,000 to $99,999 | 87 | 13.5% |
| $100,000 to $149,999 | 170 | 26.3% |
| $150,000 to $199,999 | 104 | 16.1% |
| $200,000+ | 31 | 4.8% |
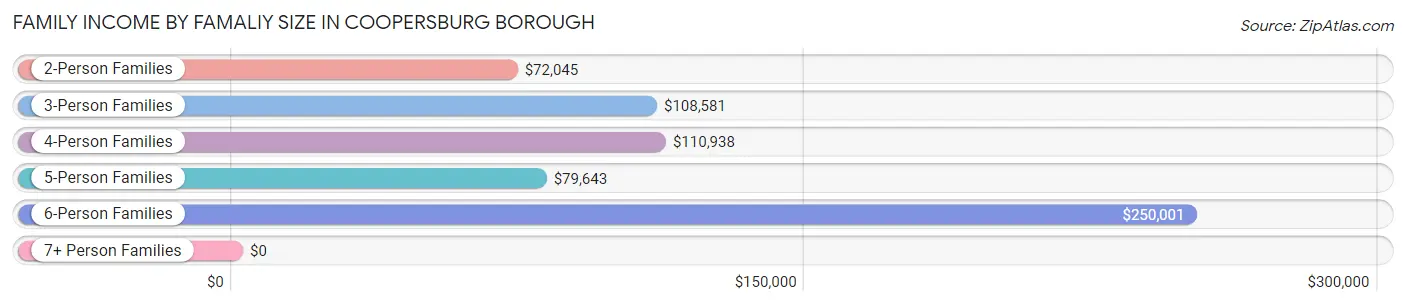
Family Income by Famaliy Size in Coopersburg borough
6-person families (23 | 3.6%) account for the highest median family income in Coopersburg borough with $250,001 per family, while 6-person families (23 | 3.6%) have the highest median income of $41,667 per family member.
| Income Bracket | # Families | Median Income |
| 2-Person Families | 354 (54.8%) | $72,045 |
| 3-Person Families | 156 (24.1%) | $108,581 |
| 4-Person Families | 63 (9.8%) | $110,938 |
| 5-Person Families | 50 (7.7%) | $79,643 |
| 6-Person Families | 23 (3.6%) | $250,001 |
| 7+ Person Families | 0 (0.0%) | $0 |
| Total | 646 (100.0%) | $94,500 |
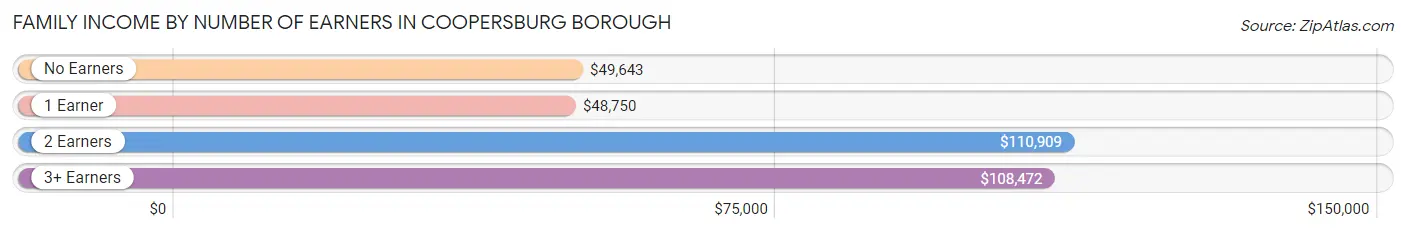
Family Income by Number of Earners in Coopersburg borough
The median family income in Coopersburg borough is $94,500, with families comprising 2 earners (302) having the highest median family income of $110,909, while families with 1 earner (146) have the lowest median family income of $48,750, accounting for 46.8% and 22.6% of families, respectively.
| Number of Earners | # Families | Median Income |
| No Earners | 102 (15.8%) | $49,643 |
| 1 Earner | 146 (22.6%) | $48,750 |
| 2 Earners | 302 (46.8%) | $110,909 |
| 3+ Earners | 96 (14.9%) | $108,472 |
| Total | 646 (100.0%) | $94,500 |
Household Income in Coopersburg borough
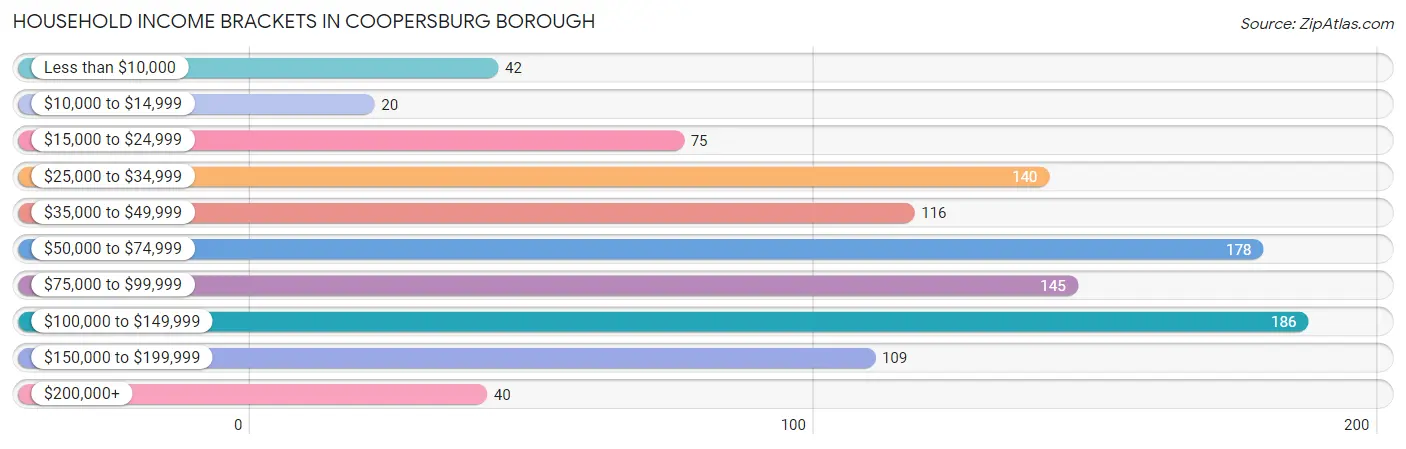
Household Income Brackets in Coopersburg borough
With 186 households falling in the category, the $100,000 to $149,999 income range is the most frequent in Coopersburg borough, accounting for 17.7% of all households. In contrast, only 20 households (1.9%) fall into the $10,000 to $14,999 income bracket, making it the least populous group.
| Income Bracket | # Households | % Households |
| Less than $10,000 | 42 | 4.0% |
| $10,000 to $14,999 | 20 | 1.9% |
| $15,000 to $24,999 | 75 | 7.1% |
| $25,000 to $34,999 | 140 | 13.3% |
| $35,000 to $49,999 | 116 | 11.0% |
| $50,000 to $74,999 | 178 | 17.0% |
| $75,000 to $99,999 | 145 | 13.8% |
| $100,000 to $149,999 | 186 | 17.7% |
| $150,000 to $199,999 | 109 | 10.4% |
| $200,000+ | 40 | 3.8% |
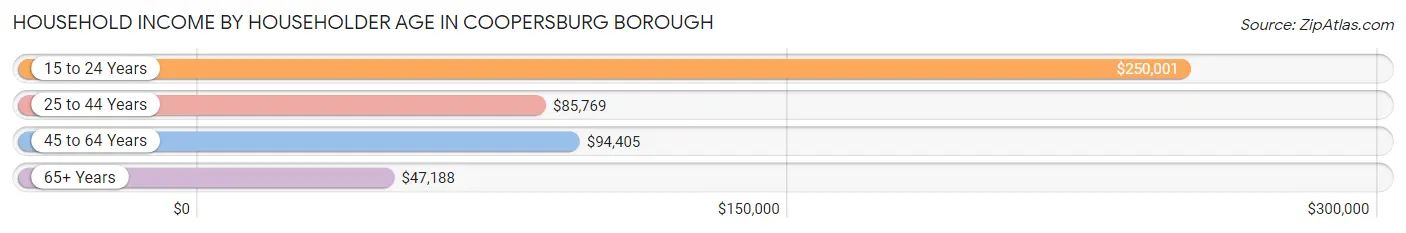
Household Income by Householder Age in Coopersburg borough
The median household income in Coopersburg borough is $70,465, with the highest median household income of $250,001 found in the 15 to 24 years age bracket for the primary householder. A total of 29 households (2.8%) fall into this category. Meanwhile, the 65+ years age bracket for the primary householder has the lowest median household income of $47,188, with 397 households (37.8%) in this group.
| Income Bracket | # Households | Median Income |
| 15 to 24 Years | 29 (2.8%) | $250,001 |
| 25 to 44 Years | 308 (29.3%) | $85,769 |
| 45 to 64 Years | 316 (30.1%) | $94,405 |
| 65+ Years | 397 (37.8%) | $47,188 |
| Total | 1,050 (100.0%) | $70,465 |
Poverty in Coopersburg borough
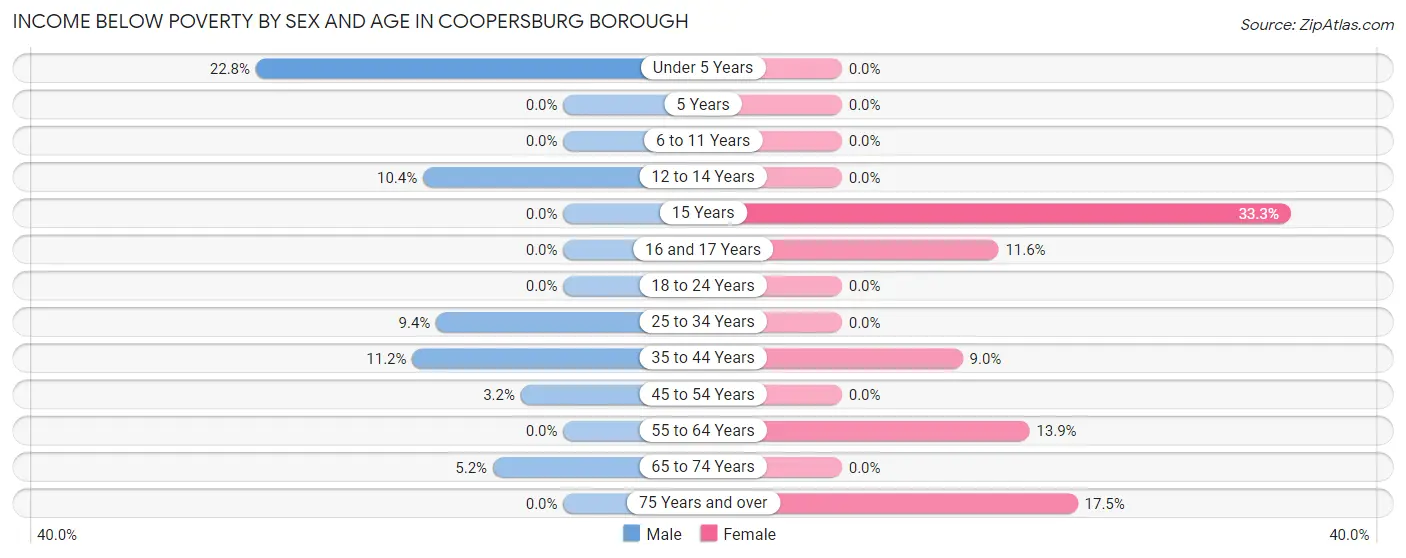
Income Below Poverty by Sex and Age in Coopersburg borough
With 5.9% poverty level for males and 6.2% for females among the residents of Coopersburg borough, under 5 year old males and 15 year old females are the most vulnerable to poverty, with 21 males (22.8%) and 6 females (33.3%) in their respective age groups living below the poverty level.
| Age Bracket | Male | Female |
| Under 5 Years | 21 (22.8%) | 0 (0.0%) |
| 5 Years | 0 (0.0%) | 0 (0.0%) |
| 6 to 11 Years | 0 (0.0%) | 0 (0.0%) |
| 12 to 14 Years | 5 (10.4%) | 0 (0.0%) |
| 15 Years | 0 (0.0%) | 6 (33.3%) |
| 16 and 17 Years | 0 (0.0%) | 5 (11.6%) |
| 18 to 24 Years | 0 (0.0%) | 0 (0.0%) |
| 25 to 34 Years | 17 (9.4%) | 0 (0.0%) |
| 35 to 44 Years | 12 (11.2%) | 14 (9.0%) |
| 45 to 54 Years | 5 (3.2%) | 0 (0.0%) |
| 55 to 64 Years | 0 (0.0%) | 17 (13.9%) |
| 65 to 74 Years | 8 (5.2%) | 0 (0.0%) |
| 75 Years and over | 0 (0.0%) | 31 (17.5%) |
| Total | 68 (5.9%) | 73 (6.2%) |
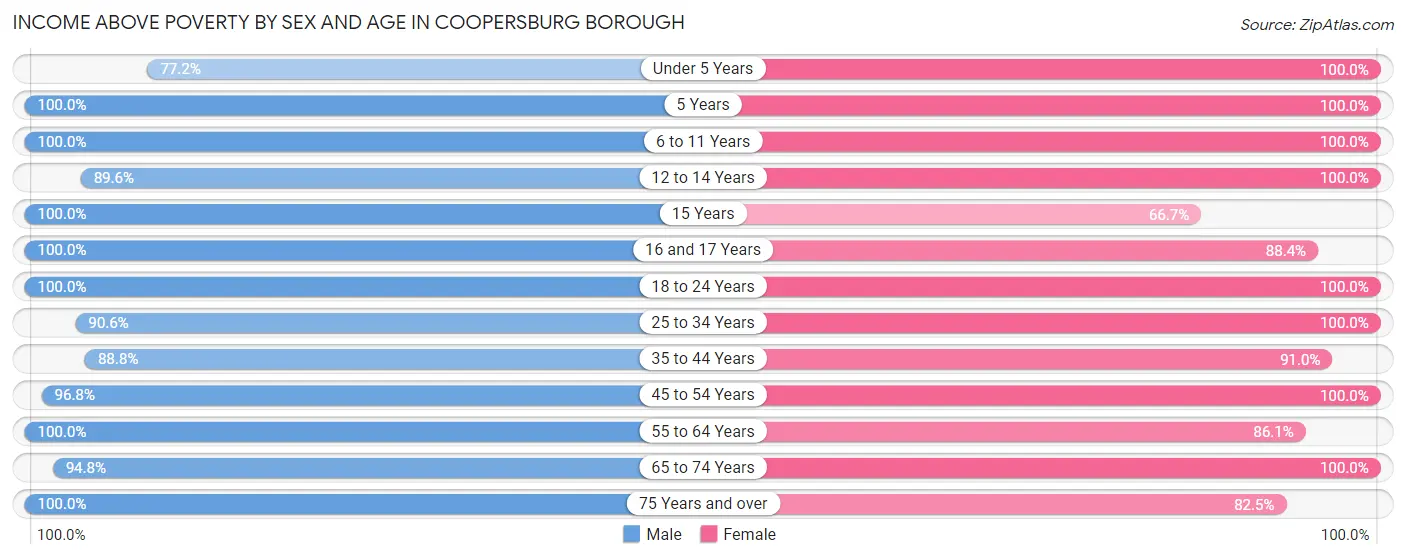
Income Above Poverty by Sex and Age in Coopersburg borough
According to the poverty statistics in Coopersburg borough, males aged 5 years and females aged under 5 years are the age groups that are most secure financially, with 100.0% of males and 100.0% of females in these age groups living above the poverty line.
| Age Bracket | Male | Female |
| Under 5 Years | 71 (77.2%) | 54 (100.0%) |
| 5 Years | 12 (100.0%) | 4 (100.0%) |
| 6 to 11 Years | 55 (100.0%) | 50 (100.0%) |
| 12 to 14 Years | 43 (89.6%) | 26 (100.0%) |
| 15 Years | 5 (100.0%) | 12 (66.7%) |
| 16 and 17 Years | 27 (100.0%) | 38 (88.4%) |
| 18 to 24 Years | 92 (100.0%) | 85 (100.0%) |
| 25 to 34 Years | 163 (90.6%) | 156 (100.0%) |
| 35 to 44 Years | 95 (88.8%) | 142 (91.0%) |
| 45 to 54 Years | 153 (96.8%) | 152 (100.0%) |
| 55 to 64 Years | 106 (100.0%) | 105 (86.1%) |
| 65 to 74 Years | 145 (94.8%) | 140 (100.0%) |
| 75 Years and over | 114 (100.0%) | 146 (82.5%) |
| Total | 1,081 (94.1%) | 1,110 (93.8%) |
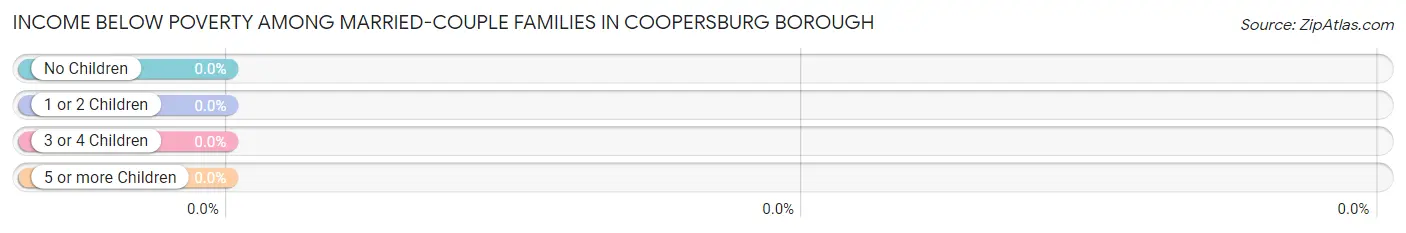
Income Below Poverty Among Married-Couple Families in Coopersburg borough
| Children | Above Poverty | Below Poverty |
| No Children | 312 (100.0%) | 0 (0.0%) |
| 1 or 2 Children | 127 (100.0%) | 0 (0.0%) |
| 3 or 4 Children | 25 (100.0%) | 0 (0.0%) |
| 5 or more Children | 0 (0.0%) | 0 (0.0%) |
| Total | 464 (100.0%) | 0 (0.0%) |
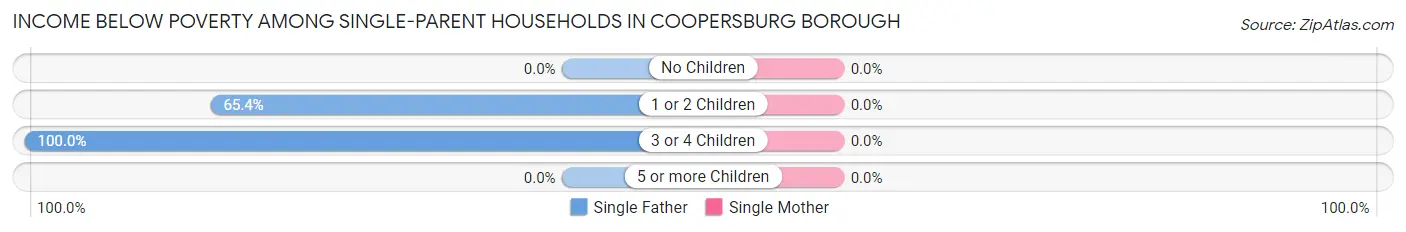
Income Below Poverty Among Single-Parent Households in Coopersburg borough
| Children | Single Father | Single Mother |
| No Children | 0 (0.0%) | 0 (0.0%) |
| 1 or 2 Children | 17 (65.4%) | 0 (0.0%) |
| 3 or 4 Children | 5 (100.0%) | 0 (0.0%) |
| 5 or more Children | 0 (0.0%) | 0 (0.0%) |
| Total | 22 (47.8%) | 0 (0.0%) |
Income Below Poverty Among Married-Couple vs Single-Parent Households in Coopersburg borough
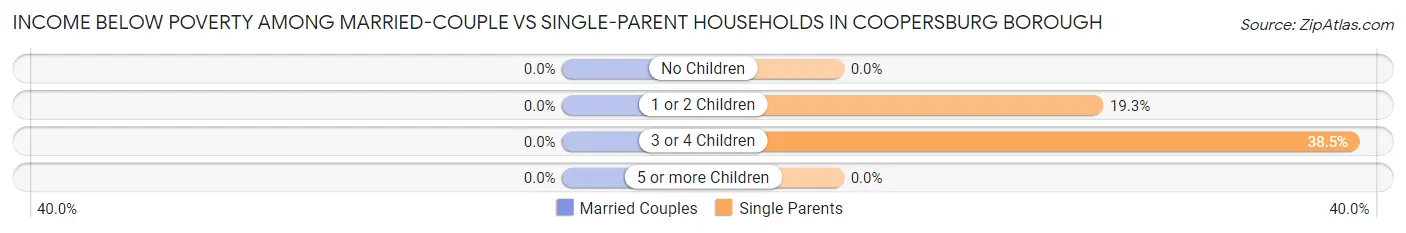
| Children | Married-Couple Families | Single-Parent Households |
| No Children | 0 (0.0%) | 0 (0.0%) |
| 1 or 2 Children | 0 (0.0%) | 17 (19.3%) |
| 3 or 4 Children | 0 (0.0%) | 5 (38.5%) |
| 5 or more Children | 0 (0.0%) | 0 (0.0%) |
| Total | 0 (0.0%) | 22 (12.1%) |
Race in Coopersburg borough
The most populous races in Coopersburg borough are White / Caucasian (2,041 | 87.5%), Hispanic or Latino (129 | 5.5%), and Black / African American (112 | 4.8%).
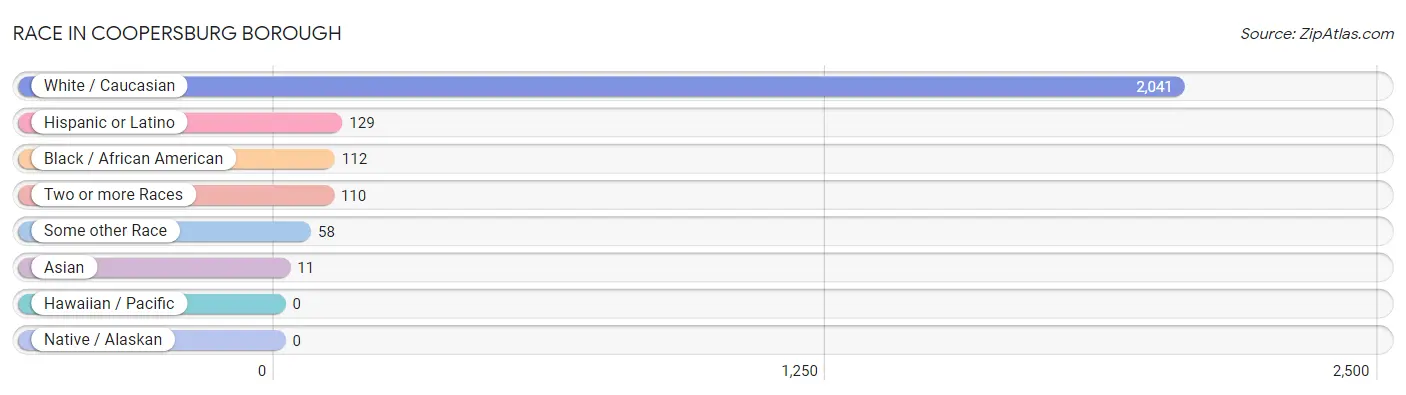
| Race | # Population | % Population |
| Asian | 11 | 0.5% |
| Black / African American | 112 | 4.8% |
| Hawaiian / Pacific | 0 | 0.0% |
| Hispanic or Latino | 129 | 5.5% |
| Native / Alaskan | 0 | 0.0% |
| White / Caucasian | 2,041 | 87.5% |
| Two or more Races | 110 | 4.7% |
| Some other Race | 58 | 2.5% |
| Total | 2,332 | 100.0% |
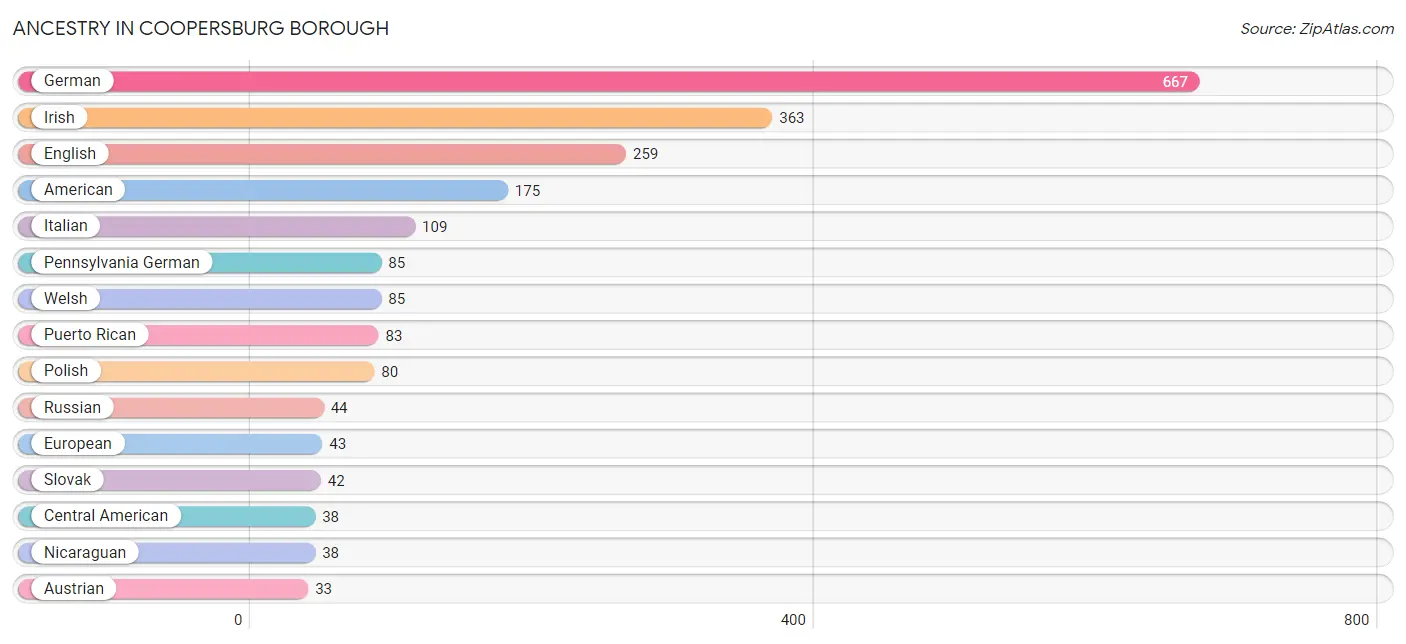
Ancestry in Coopersburg borough
The most populous ancestries reported in Coopersburg borough are German (667 | 28.6%), Irish (363 | 15.6%), English (259 | 11.1%), American (175 | 7.5%), and Italian (109 | 4.7%), together accounting for 67.4% of all Coopersburg borough residents.
| Ancestry | # Population | % Population |
| American | 175 | 7.5% |
| Arab | 28 | 1.2% |
| Austrian | 33 | 1.4% |
| Bhutanese | 25 | 1.1% |
| Central American | 38 | 1.6% |
| Croatian | 4 | 0.2% |
| Czech | 23 | 1.0% |
| Czechoslovakian | 9 | 0.4% |
| Dutch | 10 | 0.4% |
| Egyptian | 22 | 0.9% |
| English | 259 | 11.1% |
| European | 43 | 1.8% |
| Finnish | 4 | 0.2% |
| French | 25 | 1.1% |
| German | 667 | 28.6% |
| Greek | 4 | 0.2% |
| Guamanian / Chamorro | 9 | 0.4% |
| Hungarian | 19 | 0.8% |
| Irish | 363 | 15.6% |
| Iroquois | 9 | 0.4% |
| Italian | 109 | 4.7% |
| Korean | 21 | 0.9% |
| Latvian | 5 | 0.2% |
| Lithuanian | 5 | 0.2% |
| Nicaraguan | 38 | 1.6% |
| Norwegian | 5 | 0.2% |
| Pennsylvania German | 85 | 3.6% |
| Polish | 80 | 3.4% |
| Portuguese | 7 | 0.3% |
| Puerto Rican | 83 | 3.6% |
| Romanian | 7 | 0.3% |
| Russian | 44 | 1.9% |
| Scandinavian | 8 | 0.3% |
| Scotch-Irish | 5 | 0.2% |
| Slavic | 1 | 0.0% |
| Slovak | 42 | 1.8% |
| Swedish | 22 | 0.9% |
| Swiss | 17 | 0.7% |
| Syrian | 6 | 0.3% |
| Trinidadian and Tobagonian | 8 | 0.3% |
| Ukrainian | 30 | 1.3% |
| Welsh | 85 | 3.6% | View All 42 Rows |
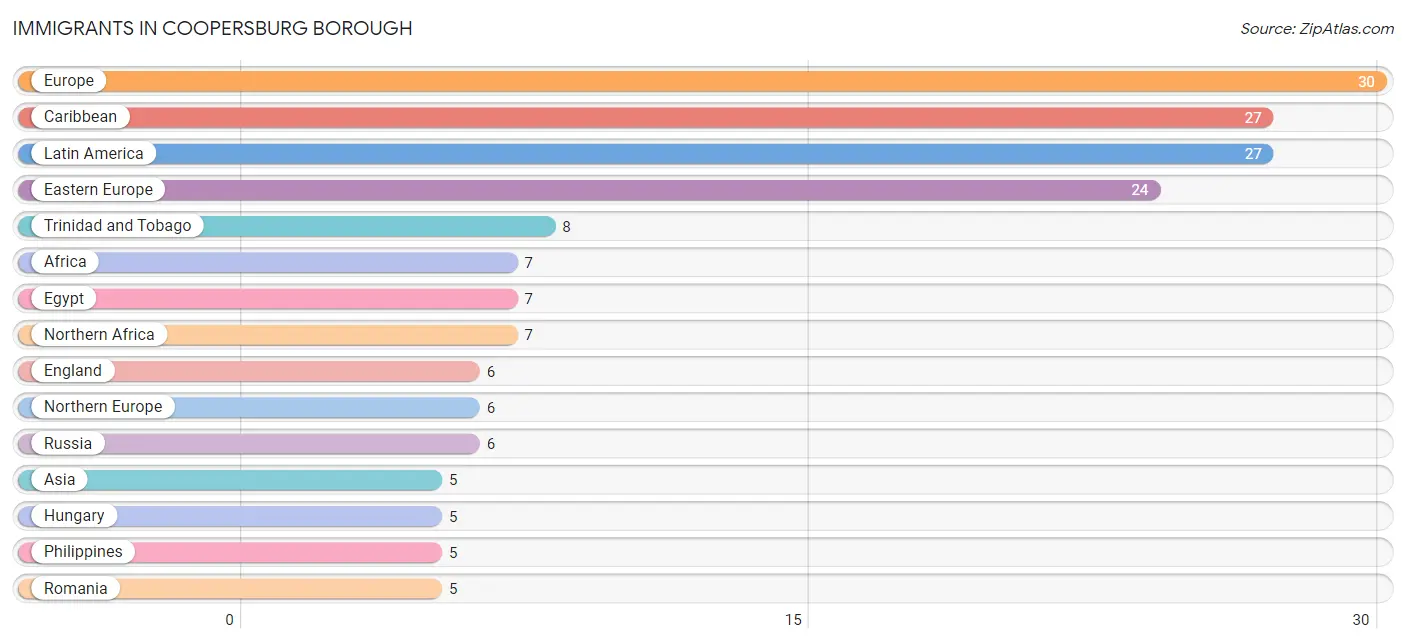
Immigrants in Coopersburg borough
The most numerous immigrant groups reported in Coopersburg borough came from Europe (30 | 1.3%), Caribbean (27 | 1.2%), Latin America (27 | 1.2%), Eastern Europe (24 | 1.0%), and Trinidad and Tobago (8 | 0.3%), together accounting for 5.0% of all Coopersburg borough residents.
| Immigration Origin | # Population | % Population |
| Africa | 7 | 0.3% |
| Asia | 5 | 0.2% |
| Belarus | 4 | 0.2% |
| Caribbean | 27 | 1.2% |
| Eastern Europe | 24 | 1.0% |
| Egypt | 7 | 0.3% |
| England | 6 | 0.3% |
| Europe | 30 | 1.3% |
| Hungary | 5 | 0.2% |
| Latin America | 27 | 1.2% |
| Northern Africa | 7 | 0.3% |
| Northern Europe | 6 | 0.3% |
| Philippines | 5 | 0.2% |
| Poland | 4 | 0.2% |
| Romania | 5 | 0.2% |
| Russia | 6 | 0.3% |
| South Eastern Asia | 5 | 0.2% |
| Trinidad and Tobago | 8 | 0.3% | View All 18 Rows |
Sex and Age in Coopersburg borough
Sex and Age in Coopersburg borough
The most populous age groups in Coopersburg borough are 25 to 29 Years (119 | 10.4%) for men and 65 to 69 Years (96 | 8.1%) for women.
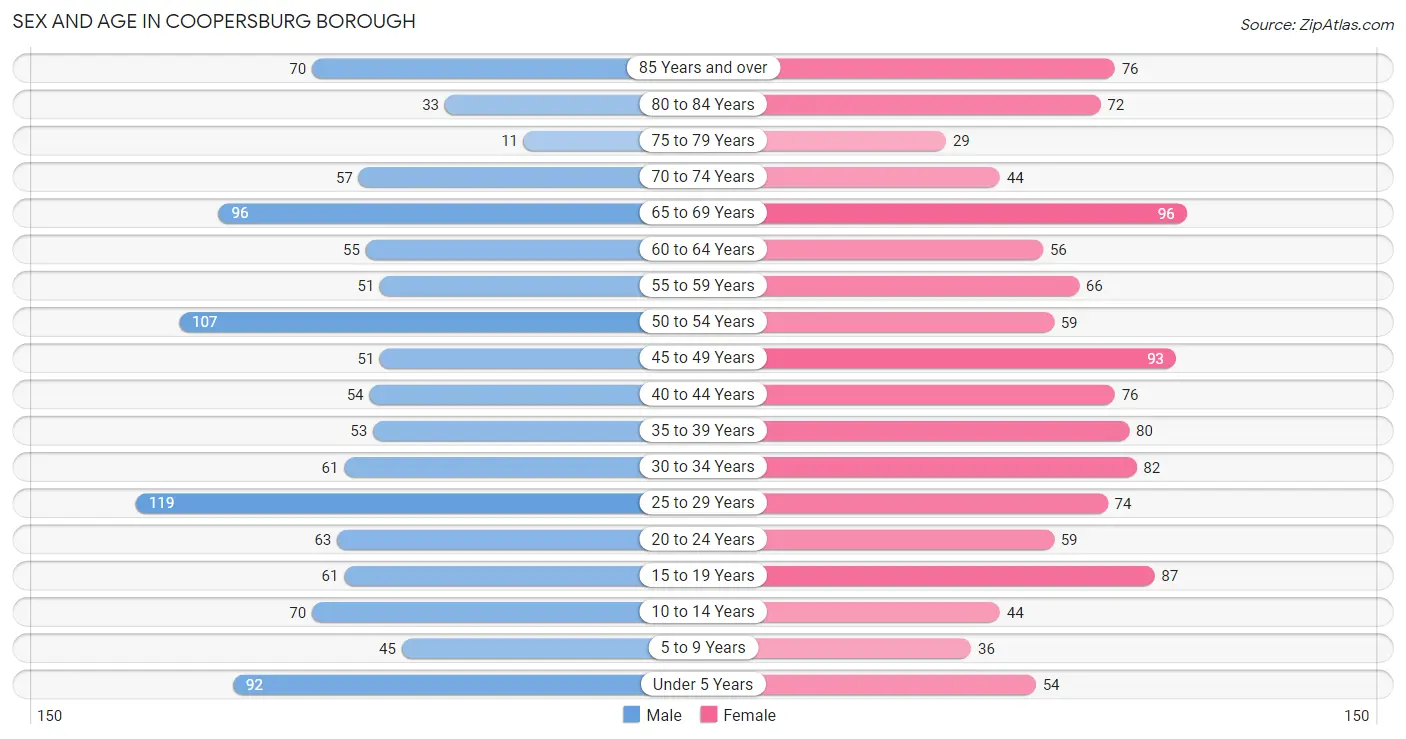
| Age Bracket | Male | Female |
| Under 5 Years | 92 (8.0%) | 54 (4.6%) |
| 5 to 9 Years | 45 (3.9%) | 36 (3.0%) |
| 10 to 14 Years | 70 (6.1%) | 44 (3.7%) |
| 15 to 19 Years | 61 (5.3%) | 87 (7.3%) |
| 20 to 24 Years | 63 (5.5%) | 59 (5.0%) |
| 25 to 29 Years | 119 (10.4%) | 74 (6.3%) |
| 30 to 34 Years | 61 (5.3%) | 82 (6.9%) |
| 35 to 39 Years | 53 (4.6%) | 80 (6.8%) |
| 40 to 44 Years | 54 (4.7%) | 76 (6.4%) |
| 45 to 49 Years | 51 (4.4%) | 93 (7.9%) |
| 50 to 54 Years | 107 (9.3%) | 59 (5.0%) |
| 55 to 59 Years | 51 (4.4%) | 66 (5.6%) |
| 60 to 64 Years | 55 (4.8%) | 56 (4.7%) |
| 65 to 69 Years | 96 (8.4%) | 96 (8.1%) |
| 70 to 74 Years | 57 (5.0%) | 44 (3.7%) |
| 75 to 79 Years | 11 (1.0%) | 29 (2.5%) |
| 80 to 84 Years | 33 (2.9%) | 72 (6.1%) |
| 85 Years and over | 70 (6.1%) | 76 (6.4%) |
| Total | 1,149 (100.0%) | 1,183 (100.0%) |
Families and Households in Coopersburg borough
Median Family Size in Coopersburg borough
The median family size in Coopersburg borough is 2.84 persons per family, with single male/father families (46 | 7.1%) accounting for the largest median family size of 3.57 persons per family. On the other hand, married-couple families (464 | 71.8%) represent the smallest median family size with 2.78 persons per family.
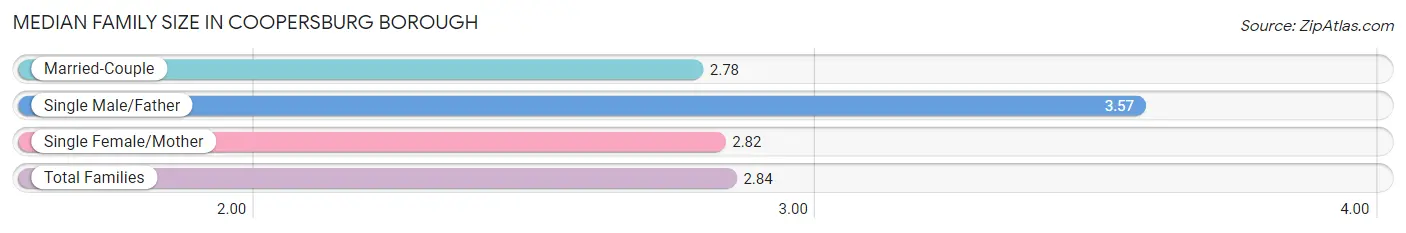
| Family Type | # Families | Family Size |
| Married-Couple | 464 (71.8%) | 2.78 |
| Single Male/Father | 46 (7.1%) | 3.57 |
| Single Female/Mother | 136 (21.0%) | 2.82 |
| Total Families | 646 (100.0%) | 2.84 |
Median Household Size in Coopersburg borough
The median household size in Coopersburg borough is 2.22 persons per household, with single male/father households (46 | 4.4%) accounting for the largest median household size of 3.93 persons per household. non-family households (404 | 38.5%) represent the smallest median household size with 1.16 persons per household.
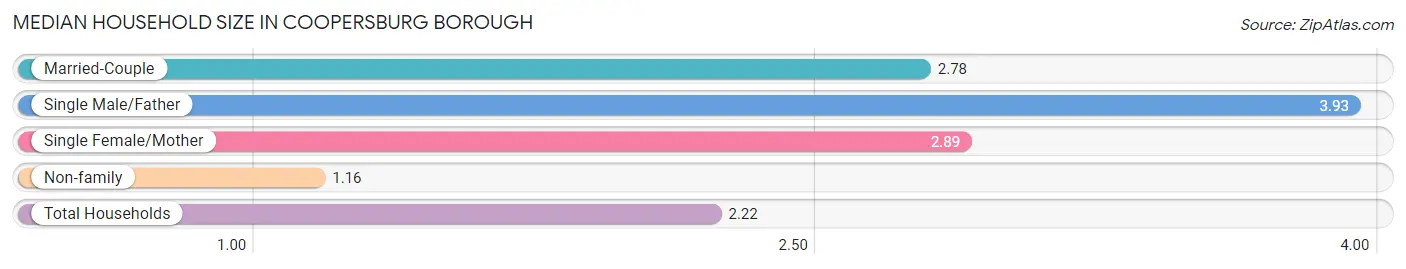
| Household Type | # Households | Household Size |
| Married-Couple | 464 (44.2%) | 2.78 |
| Single Male/Father | 46 (4.4%) | 3.93 |
| Single Female/Mother | 136 (13.0%) | 2.89 |
| Non-family | 404 (38.5%) | 1.16 |
| Total Households | 1,050 (100.0%) | 2.22 |
Household Size by Marriage Status in Coopersburg borough
Out of a total of 1,050 households in Coopersburg borough, 646 (61.5%) are family households, while 404 (38.5%) are nonfamily households. The most numerous type of family households are 2-person households, comprising 337, and the most common type of nonfamily households are 1-person households, comprising 328.
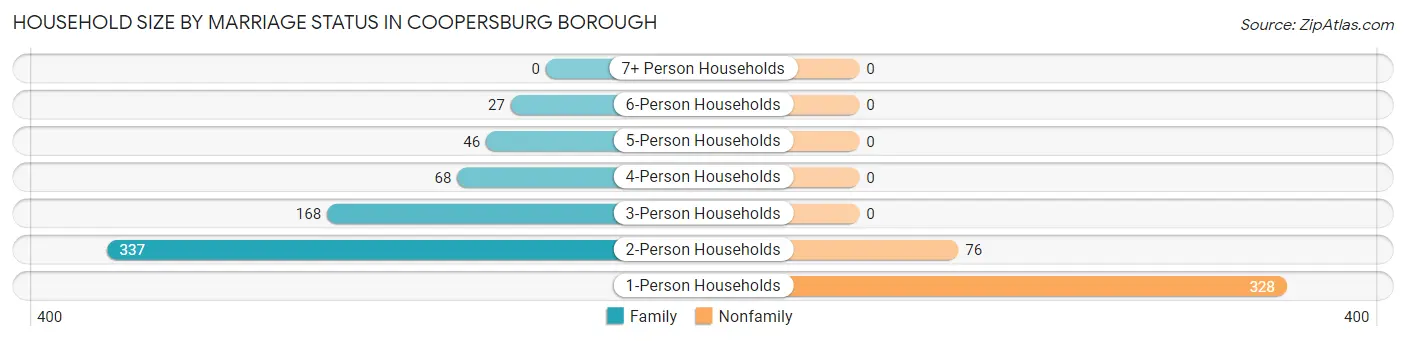
| Household Size | Family Households | Nonfamily Households |
| 1-Person Households | - | 328 (31.2%) |
| 2-Person Households | 337 (32.1%) | 76 (7.2%) |
| 3-Person Households | 168 (16.0%) | 0 (0.0%) |
| 4-Person Households | 68 (6.5%) | 0 (0.0%) |
| 5-Person Households | 46 (4.4%) | 0 (0.0%) |
| 6-Person Households | 27 (2.6%) | 0 (0.0%) |
| 7+ Person Households | 0 (0.0%) | 0 (0.0%) |
| Total | 646 (61.5%) | 404 (38.5%) |
Female Fertility in Coopersburg borough
Fertility by Age in Coopersburg borough
Average fertility rate in Coopersburg borough is 78.0 births per 1,000 women. Women in the age bracket of 20 to 34 years have the highest fertility rate with 153.0 births per 1,000 women. Women in the age bracket of 20 to 34 years acount for 75.0% of all women with births.
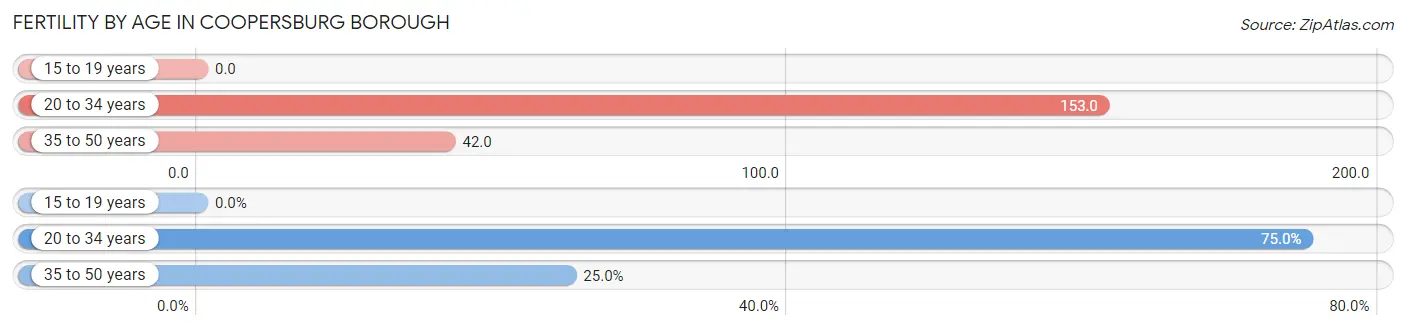
| Age Bracket | Women with Births | Births / 1,000 Women |
| 15 to 19 years | 0 (0.0%) | 0.0 |
| 20 to 34 years | 33 (75.0%) | 153.0 |
| 35 to 50 years | 11 (25.0%) | 42.0 |
| Total | 44 (100.0%) | 78.0 |
Fertility by Age by Marriage Status in Coopersburg borough
88.6% of women with births (44) in Coopersburg borough are married. The highest percentage of unmarried women with births falls into 20 to 34 years age bracket with 15.1% of them unmarried at the time of birth, while the lowest percentage of unmarried women with births belong to 35 to 50 years age bracket with 0.0% of them unmarried.
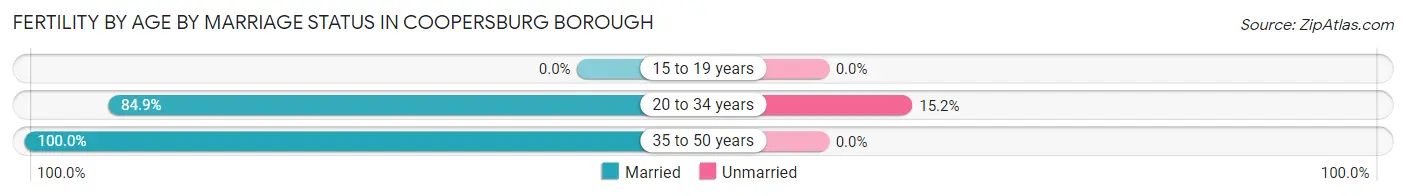
| Age Bracket | Married | Unmarried |
| 15 to 19 years | 0 (0.0%) | 0 (0.0%) |
| 20 to 34 years | 28 (84.9%) | 5 (15.1%) |
| 35 to 50 years | 11 (100.0%) | 0 (0.0%) |
| Total | 39 (88.6%) | 5 (11.4%) |
Fertility by Education in Coopersburg borough
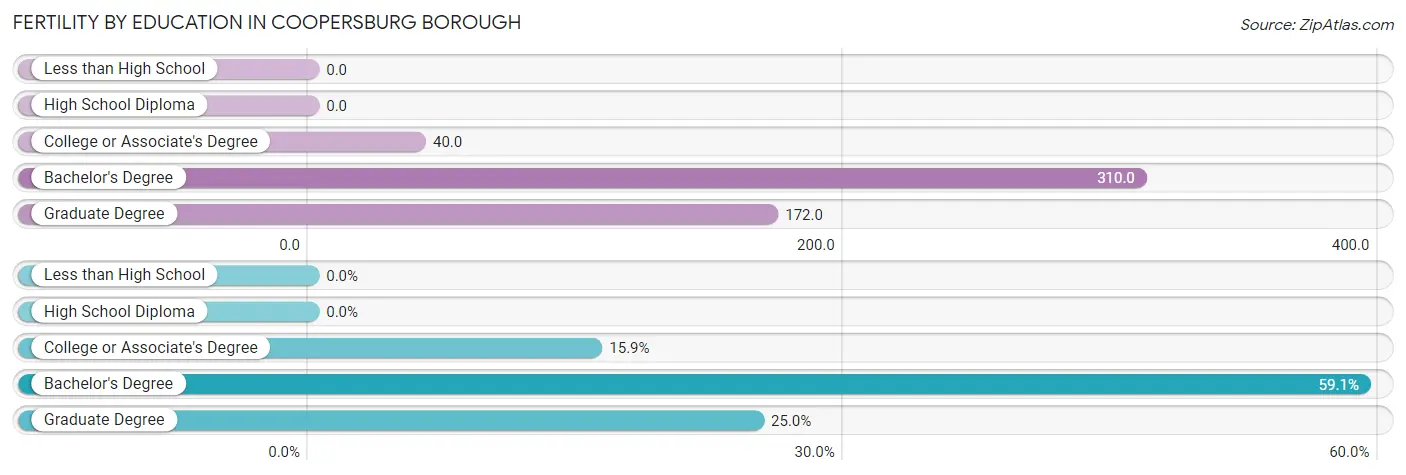
| Educational Attainment | Women with Births | Births / 1,000 Women |
| Less than High School | 0 (0.0%) | 0.0 |
| High School Diploma | 0 (0.0%) | 0.0 |
| College or Associate's Degree | 7 (15.9%) | 40.0 |
| Bachelor's Degree | 26 (59.1%) | 310.0 |
| Graduate Degree | 11 (25.0%) | 172.0 |
| Total | 44 (100.0%) | 78.0 |
Fertility by Education by Marriage Status in Coopersburg borough
11.4% of women with births in Coopersburg borough are unmarried. Women with the educational attainment of college or associate's degree are most likely to be married with 100.0% of them married at childbirth, while women with the educational attainment of graduate degree are least likely to be married with 45.5% of them unmarried at childbirth.
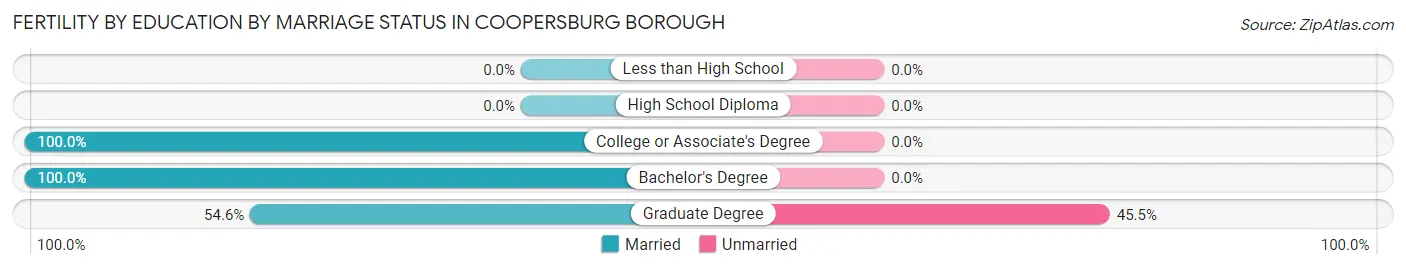
| Educational Attainment | Married | Unmarried |
| Less than High School | 0 (0.0%) | 0 (0.0%) |
| High School Diploma | 0 (0.0%) | 0 (0.0%) |
| College or Associate's Degree | 7 (100.0%) | 0 (0.0%) |
| Bachelor's Degree | 26 (100.0%) | 0 (0.0%) |
| Graduate Degree | 6 (54.5%) | 5 (45.5%) |
| Total | 39 (88.6%) | 5 (11.4%) |
Employment Characteristics in Coopersburg borough
Employment by Class of Employer in Coopersburg borough
Among the 1,273 employed individuals in Coopersburg borough, private company employees (1,025 | 80.5%), not-for-profit organizations (99 | 7.8%), and self-employed (not incorporated) (42 | 3.3%) make up the most common classes of employment.
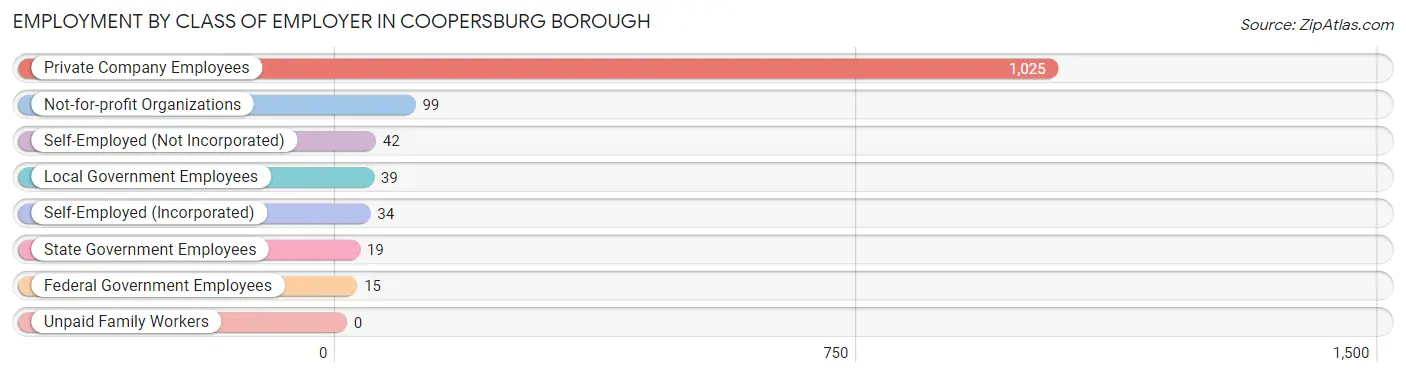
| Employer Class | # Employees | % Employees |
| Private Company Employees | 1,025 | 80.5% |
| Self-Employed (Incorporated) | 34 | 2.7% |
| Self-Employed (Not Incorporated) | 42 | 3.3% |
| Not-for-profit Organizations | 99 | 7.8% |
| Local Government Employees | 39 | 3.1% |
| State Government Employees | 19 | 1.5% |
| Federal Government Employees | 15 | 1.2% |
| Unpaid Family Workers | 0 | 0.0% |
| Total | 1,273 | 100.0% |
Employment Status by Age in Coopersburg borough
According to the labor force statistics for Coopersburg borough, out of the total population over 16 years of age (1,968), 67.3% or 1,324 individuals are in the labor force, with 2.9% or 38 of them unemployed. The age group with the highest labor force participation rate is 25 to 29 years, with 100.0% or 193 individuals in the labor force. Within the labor force, the 55 to 59 years age range has the highest percentage of unemployed individuals, with 15.2% or 12 of them being unemployed.
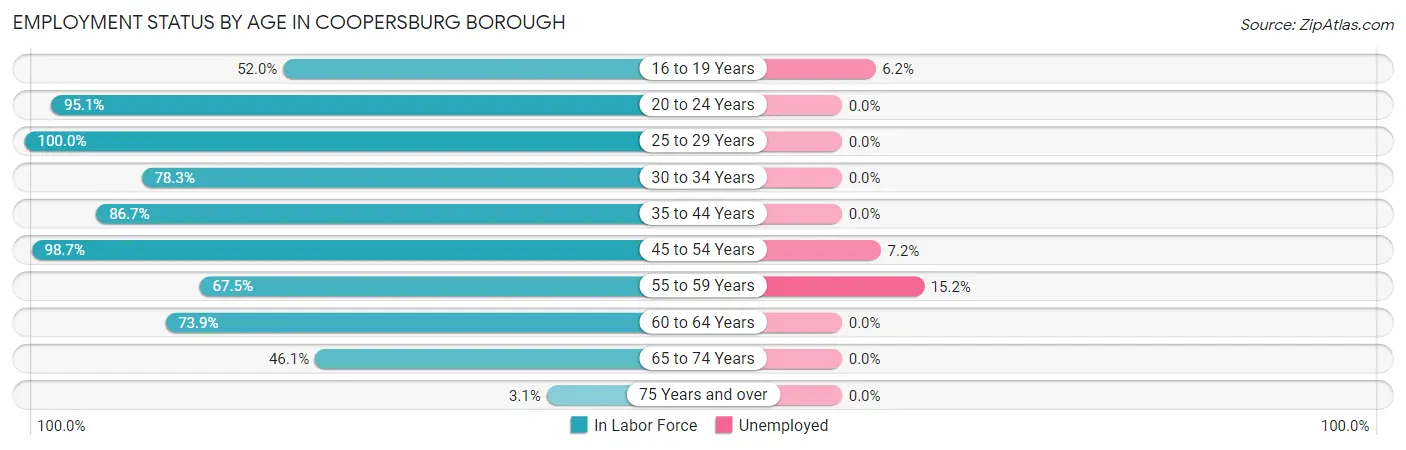
| Age Bracket | In Labor Force | Unemployed |
| 16 to 19 Years | 65 (52.0%) | 4 (6.2%) |
| 20 to 24 Years | 116 (95.1%) | 0 (0.0%) |
| 25 to 29 Years | 193 (100.0%) | 0 (0.0%) |
| 30 to 34 Years | 112 (78.3%) | 0 (0.0%) |
| 35 to 44 Years | 228 (86.7%) | 0 (0.0%) |
| 45 to 54 Years | 306 (98.7%) | 22 (7.2%) |
| 55 to 59 Years | 79 (67.5%) | 12 (15.2%) |
| 60 to 64 Years | 82 (73.9%) | 0 (0.0%) |
| 65 to 74 Years | 135 (46.1%) | 0 (0.0%) |
| 75 Years and over | 9 (3.1%) | 0 (0.0%) |
| Total | 1,324 (67.3%) | 38 (2.9%) |
Employment Status by Educational Attainment in Coopersburg borough
According to labor force statistics for Coopersburg borough, 88.0% of individuals (1,001) out of the total population between 25 and 64 years of age (1,137) are in the labor force, with 3.4% or 34 of them being unemployed. The group with the highest labor force participation rate are those with the educational attainment of less than high school, with 100.0% or 53 individuals in the labor force. Within the labor force, individuals with high school diploma education have the highest percentage of unemployment, with 6.4% or 22 of them being unemployed.
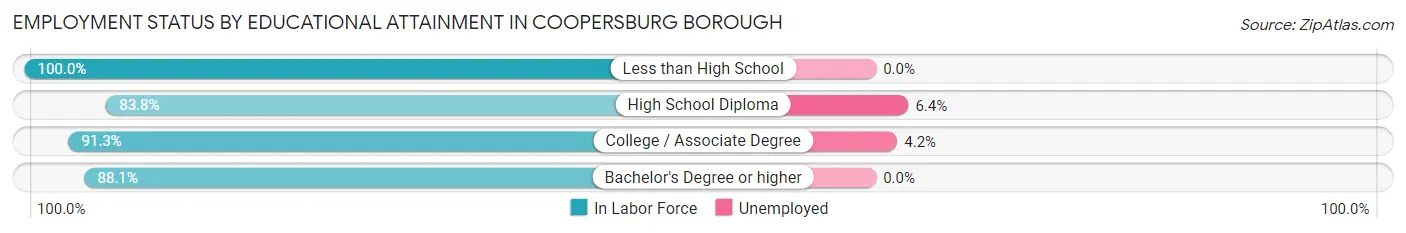
| Educational Attainment | In Labor Force | Unemployed |
| Less than High School | 53 (100.0%) | 0 (0.0%) |
| High School Diploma | 346 (83.8%) | 26 (6.4%) |
| College / Associate Degree | 284 (91.3%) | 13 (4.2%) |
| Bachelor's Degree or higher | 317 (88.1%) | 0 (0.0%) |
| Total | 1,001 (88.0%) | 39 (3.4%) |
Employment Occupations by Sex in Coopersburg borough
Management, Business, Science and Arts Occupations
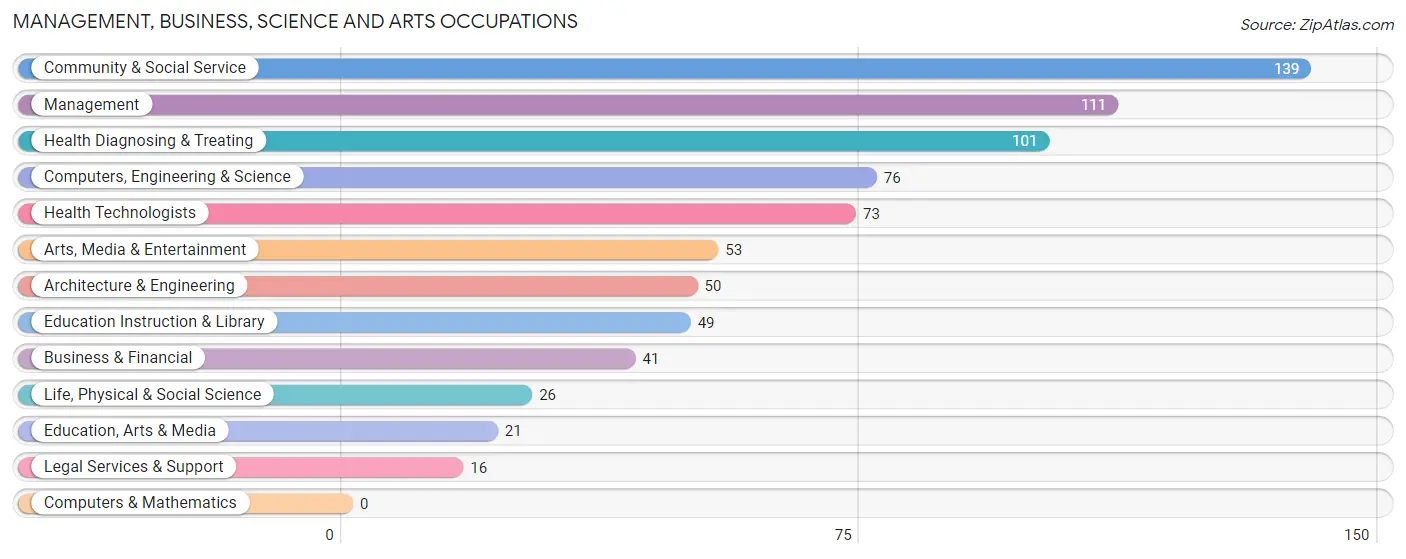
The most common Management, Business, Science and Arts occupations in Coopersburg borough are Community & Social Service (139 | 10.8%), Management (111 | 8.6%), Health Diagnosing & Treating (101 | 7.9%), Computers, Engineering & Science (76 | 5.9%), and Health Technologists (73 | 5.7%).
Management, Business, Science and Arts Occupations by Sex
Within the Management, Business, Science and Arts occupations in Coopersburg borough, the most male-oriented occupations are Education, Arts & Media (100.0%), Architecture & Engineering (90.0%), and Computers, Engineering & Science (59.2%), while the most female-oriented occupations are Life, Physical & Social Science (100.0%), Education Instruction & Library (91.8%), and Arts, Media & Entertainment (90.6%).
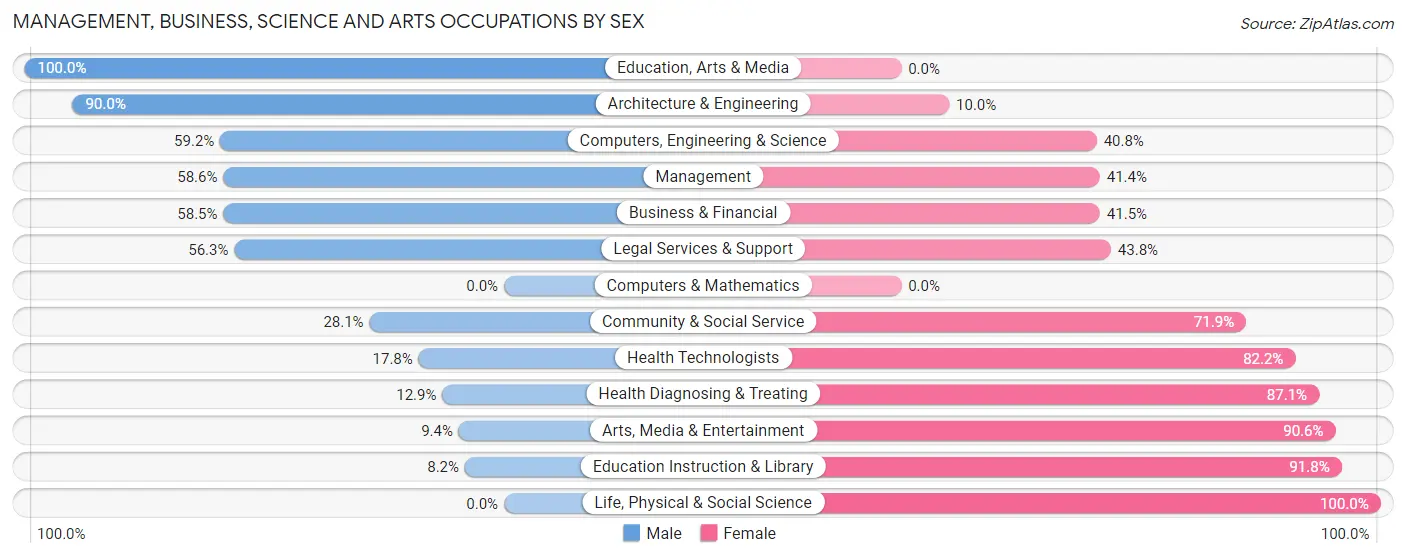
| Occupation | Male | Female |
| Management | 65 (58.6%) | 46 (41.4%) |
| Business & Financial | 24 (58.5%) | 17 (41.5%) |
| Computers, Engineering & Science | 45 (59.2%) | 31 (40.8%) |
| Computers & Mathematics | 0 (0.0%) | 0 (0.0%) |
| Architecture & Engineering | 45 (90.0%) | 5 (10.0%) |
| Life, Physical & Social Science | 0 (0.0%) | 26 (100.0%) |
| Community & Social Service | 39 (28.1%) | 100 (71.9%) |
| Education, Arts & Media | 21 (100.0%) | 0 (0.0%) |
| Legal Services & Support | 9 (56.2%) | 7 (43.8%) |
| Education Instruction & Library | 4 (8.2%) | 45 (91.8%) |
| Arts, Media & Entertainment | 5 (9.4%) | 48 (90.6%) |
| Health Diagnosing & Treating | 13 (12.9%) | 88 (87.1%) |
| Health Technologists | 13 (17.8%) | 60 (82.2%) |
| Total (Category) | 186 (39.7%) | 282 (60.3%) |
| Total (Overall) | 649 (50.4%) | 638 (49.6%) |
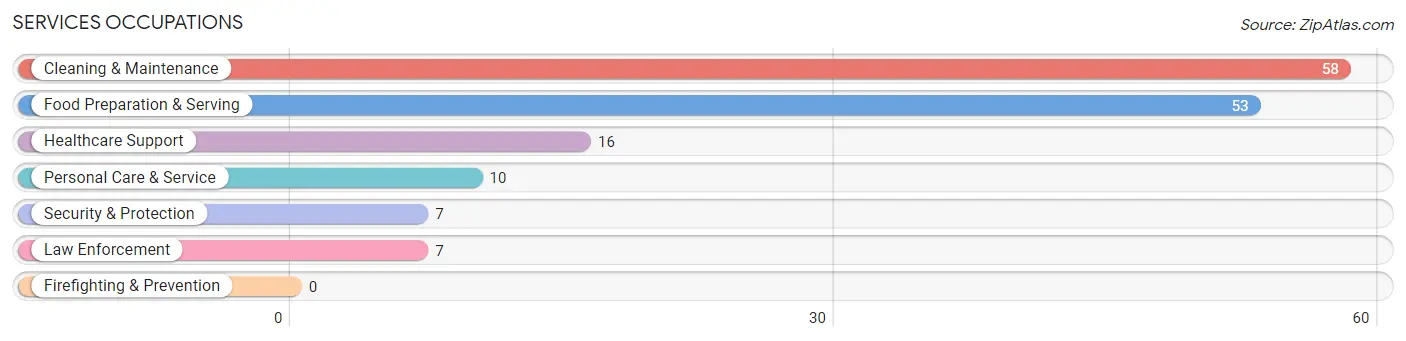
Services Occupations
The most common Services occupations in Coopersburg borough are Cleaning & Maintenance (58 | 4.5%), Food Preparation & Serving (53 | 4.1%), Healthcare Support (16 | 1.2%), Personal Care & Service (10 | 0.8%), and Security & Protection (7 | 0.5%).
Services Occupations by Sex
Within the Services occupations in Coopersburg borough, the most male-oriented occupations are Security & Protection (100.0%), Law Enforcement (100.0%), and Cleaning & Maintenance (60.3%), while the most female-oriented occupations are Personal Care & Service (100.0%), Food Preparation & Serving (75.5%), and Healthcare Support (62.5%).
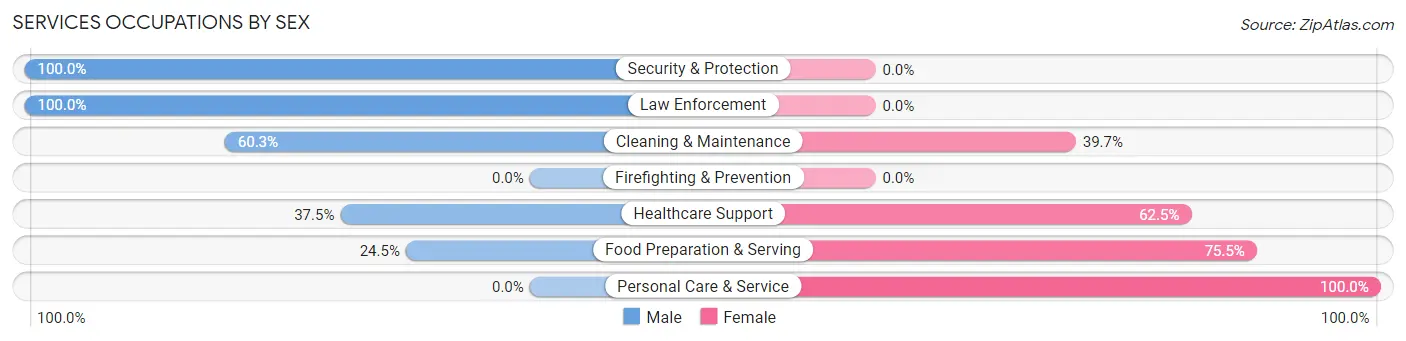
| Occupation | Male | Female |
| Healthcare Support | 6 (37.5%) | 10 (62.5%) |
| Security & Protection | 7 (100.0%) | 0 (0.0%) |
| Firefighting & Prevention | 0 (0.0%) | 0 (0.0%) |
| Law Enforcement | 7 (100.0%) | 0 (0.0%) |
| Food Preparation & Serving | 13 (24.5%) | 40 (75.5%) |
| Cleaning & Maintenance | 35 (60.3%) | 23 (39.7%) |
| Personal Care & Service | 0 (0.0%) | 10 (100.0%) |
| Total (Category) | 61 (42.4%) | 83 (57.6%) |
| Total (Overall) | 649 (50.4%) | 638 (49.6%) |
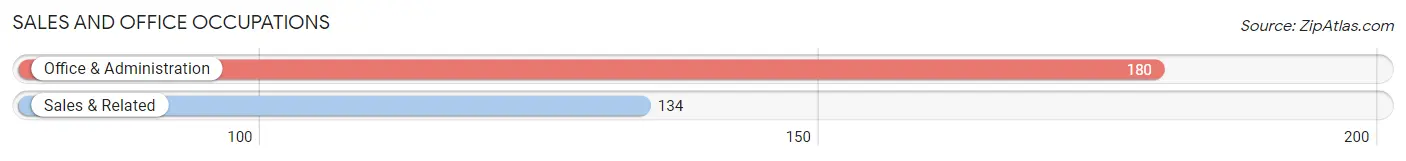
Sales and Office Occupations
The most common Sales and Office occupations in Coopersburg borough are Office & Administration (180 | 14.0%), and Sales & Related (134 | 10.4%).
Sales and Office Occupations by Sex
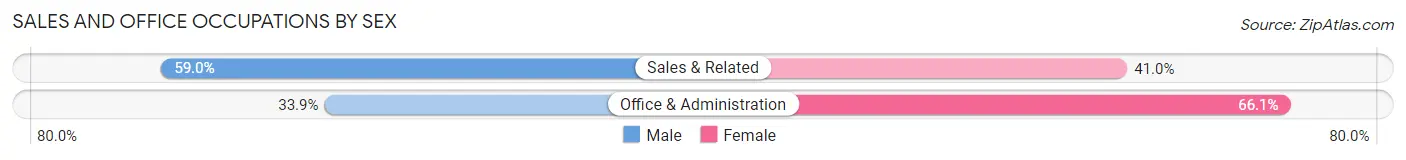
| Occupation | Male | Female |
| Sales & Related | 79 (59.0%) | 55 (41.0%) |
| Office & Administration | 61 (33.9%) | 119 (66.1%) |
| Total (Category) | 140 (44.6%) | 174 (55.4%) |
| Total (Overall) | 649 (50.4%) | 638 (49.6%) |
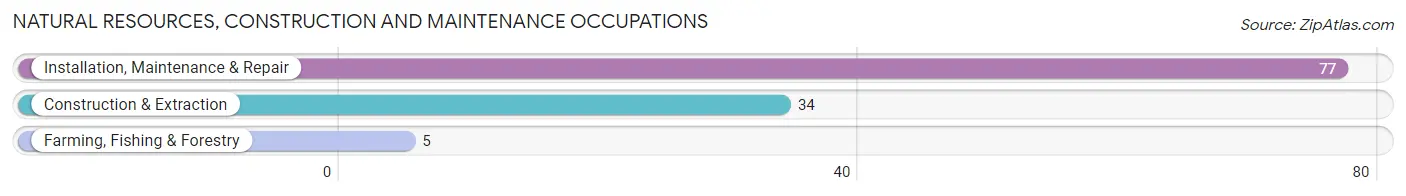
Natural Resources, Construction and Maintenance Occupations
The most common Natural Resources, Construction and Maintenance occupations in Coopersburg borough are Installation, Maintenance & Repair (77 | 6.0%), Construction & Extraction (34 | 2.6%), and Farming, Fishing & Forestry (5 | 0.4%).
Natural Resources, Construction and Maintenance Occupations by Sex
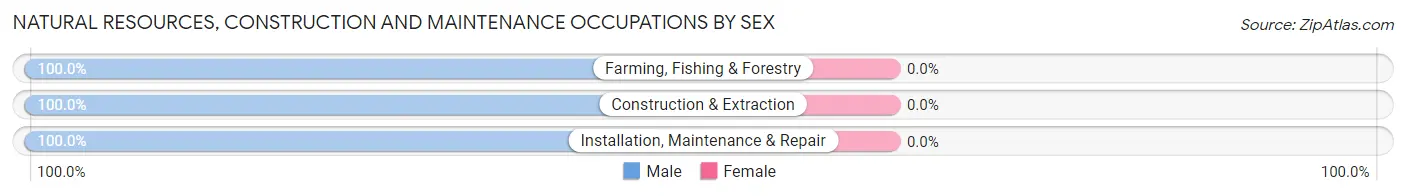
| Occupation | Male | Female |
| Farming, Fishing & Forestry | 5 (100.0%) | 0 (0.0%) |
| Construction & Extraction | 34 (100.0%) | 0 (0.0%) |
| Installation, Maintenance & Repair | 77 (100.0%) | 0 (0.0%) |
| Total (Category) | 116 (100.0%) | 0 (0.0%) |
| Total (Overall) | 649 (50.4%) | 638 (49.6%) |
Production, Transportation and Moving Occupations
The most common Production, Transportation and Moving occupations in Coopersburg borough are Transportation (101 | 7.9%), Production (80 | 6.2%), and Material Moving (64 | 5.0%).
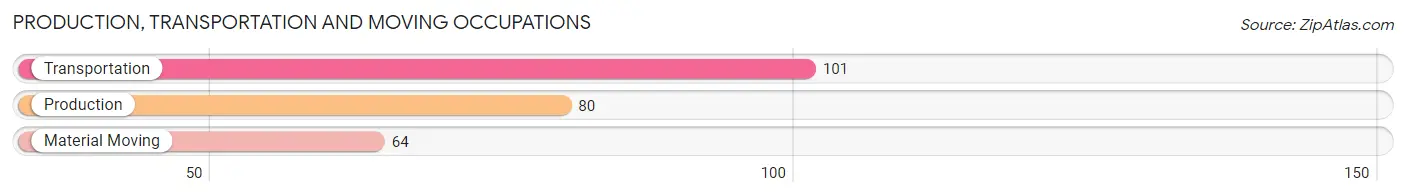
Production, Transportation and Moving Occupations by Sex
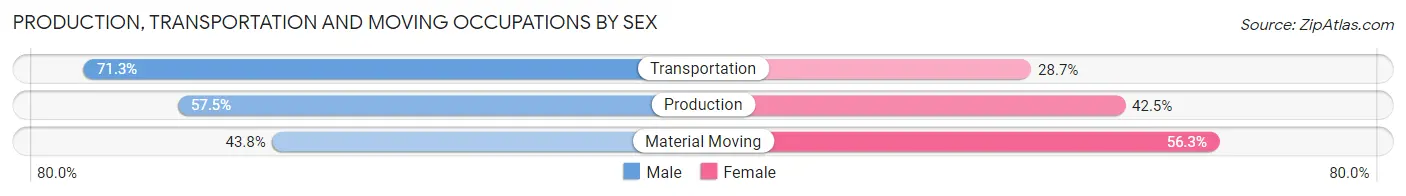
| Occupation | Male | Female |
| Production | 46 (57.5%) | 34 (42.5%) |
| Transportation | 72 (71.3%) | 29 (28.7%) |
| Material Moving | 28 (43.8%) | 36 (56.2%) |
| Total (Category) | 146 (59.6%) | 99 (40.4%) |
| Total (Overall) | 649 (50.4%) | 638 (49.6%) |
Employment Industries by Sex in Coopersburg borough
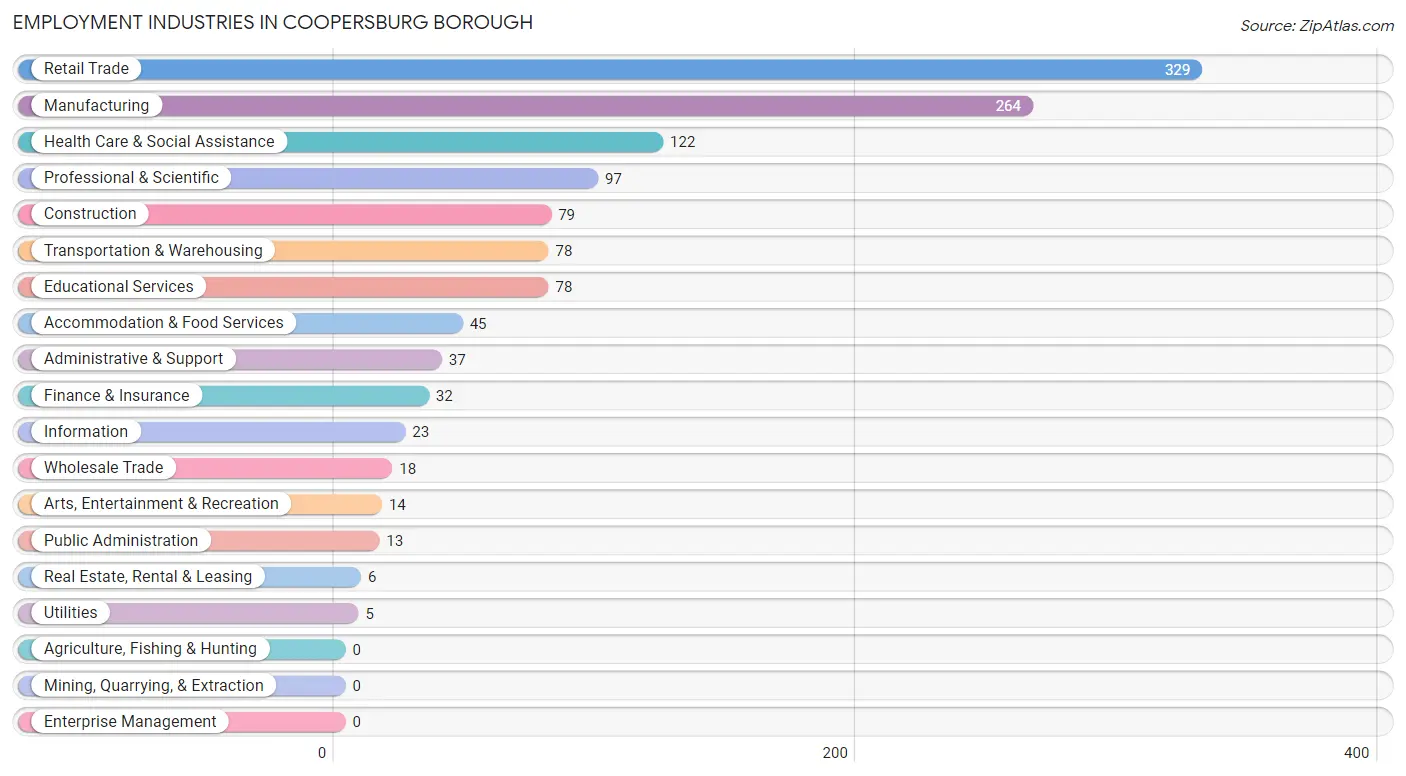
Employment Industries in Coopersburg borough
The major employment industries in Coopersburg borough include Retail Trade (329 | 25.6%), Manufacturing (264 | 20.5%), Health Care & Social Assistance (122 | 9.5%), Professional & Scientific (97 | 7.5%), and Construction (79 | 6.1%).
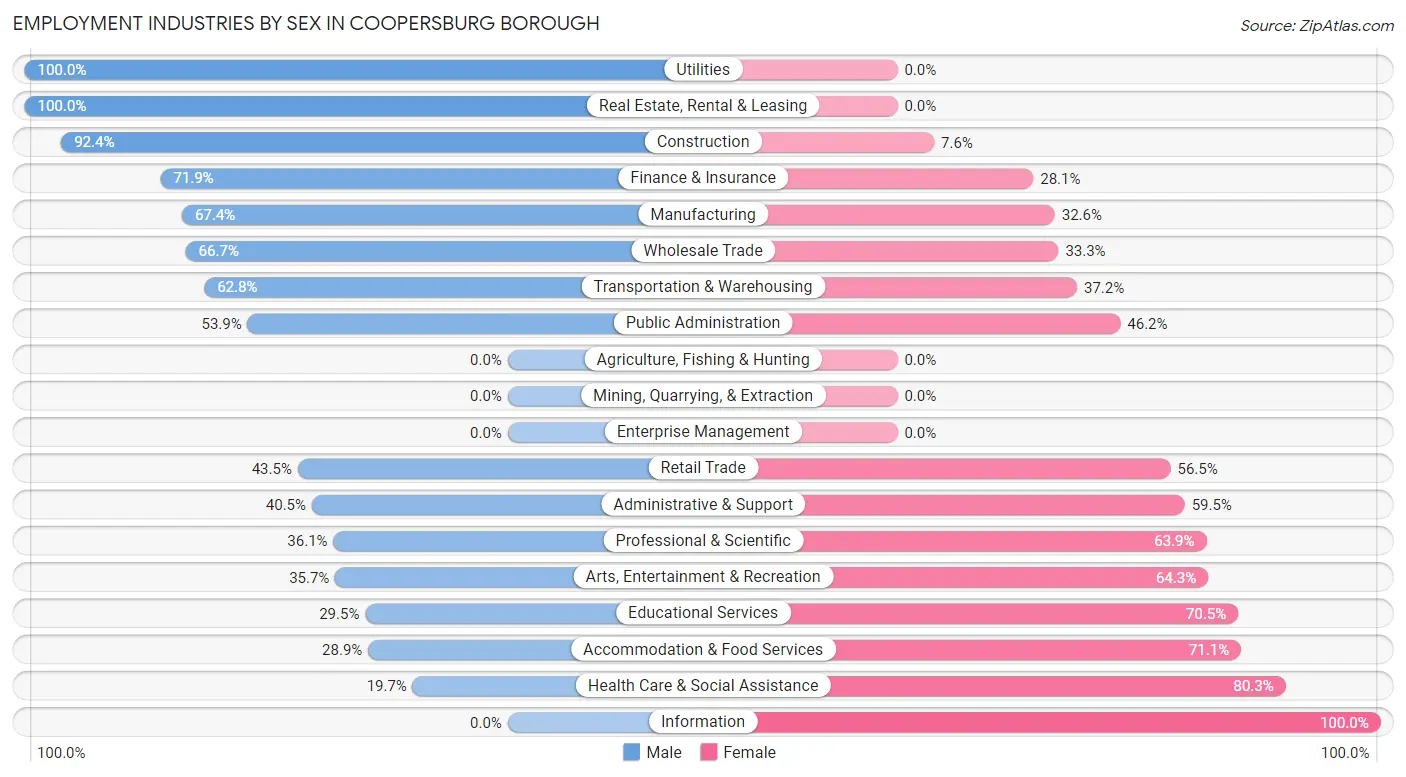
Employment Industries by Sex in Coopersburg borough
The Coopersburg borough industries that see more men than women are Utilities (100.0%), Real Estate, Rental & Leasing (100.0%), and Construction (92.4%), whereas the industries that tend to have a higher number of women are Information (100.0%), Health Care & Social Assistance (80.3%), and Accommodation & Food Services (71.1%).
| Industry | Male | Female |
| Agriculture, Fishing & Hunting | 0 (0.0%) | 0 (0.0%) |
| Mining, Quarrying, & Extraction | 0 (0.0%) | 0 (0.0%) |
| Construction | 73 (92.4%) | 6 (7.6%) |
| Manufacturing | 178 (67.4%) | 86 (32.6%) |
| Wholesale Trade | 12 (66.7%) | 6 (33.3%) |
| Retail Trade | 143 (43.5%) | 186 (56.5%) |
| Transportation & Warehousing | 49 (62.8%) | 29 (37.2%) |
| Utilities | 5 (100.0%) | 0 (0.0%) |
| Information | 0 (0.0%) | 23 (100.0%) |
| Finance & Insurance | 23 (71.9%) | 9 (28.1%) |
| Real Estate, Rental & Leasing | 6 (100.0%) | 0 (0.0%) |
| Professional & Scientific | 35 (36.1%) | 62 (63.9%) |
| Enterprise Management | 0 (0.0%) | 0 (0.0%) |
| Administrative & Support | 15 (40.5%) | 22 (59.5%) |
| Educational Services | 23 (29.5%) | 55 (70.5%) |
| Health Care & Social Assistance | 24 (19.7%) | 98 (80.3%) |
| Arts, Entertainment & Recreation | 5 (35.7%) | 9 (64.3%) |
| Accommodation & Food Services | 13 (28.9%) | 32 (71.1%) |
| Public Administration | 7 (53.8%) | 6 (46.2%) |
| Total | 649 (50.4%) | 638 (49.6%) |
Education in Coopersburg borough
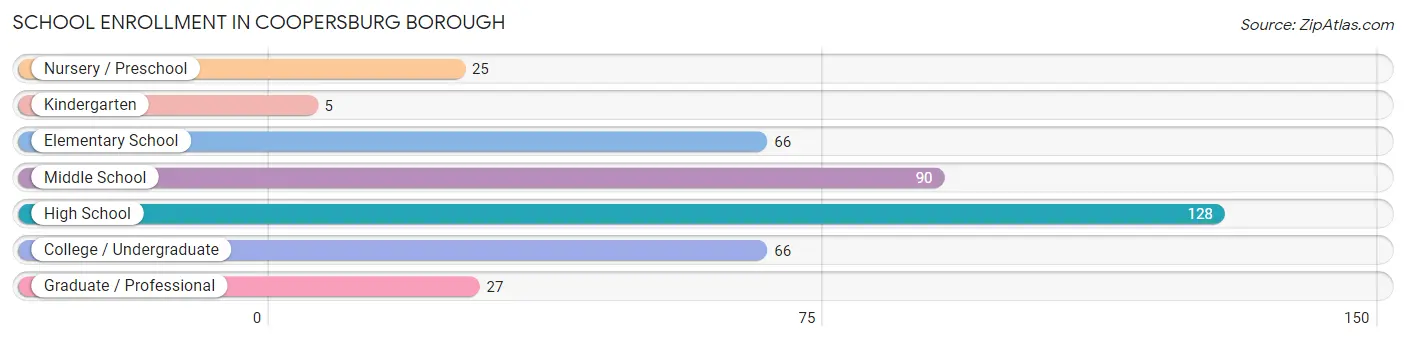
School Enrollment in Coopersburg borough
The most common levels of schooling among the 407 students in Coopersburg borough are high school (128 | 31.5%), middle school (90 | 22.1%), and elementary school (66 | 16.2%).
| School Level | # Students | % Students |
| Nursery / Preschool | 25 | 6.1% |
| Kindergarten | 5 | 1.2% |
| Elementary School | 66 | 16.2% |
| Middle School | 90 | 22.1% |
| High School | 128 | 31.5% |
| College / Undergraduate | 66 | 16.2% |
| Graduate / Professional | 27 | 6.6% |
| Total | 407 | 100.0% |
School Enrollment by Age by Funding Source in Coopersburg borough
Out of a total of 407 students who are enrolled in schools in Coopersburg borough, 32 (7.9%) attend a private institution, while the remaining 375 (92.1%) are enrolled in public schools. The age group of 35 years and over has the highest likelihood of being enrolled in private schools, with 7 (53.8% in the age bracket) enrolled. Conversely, the age group of 3 to 4 year olds has the lowest likelihood of being enrolled in a private school, with 9 (100.0% in the age bracket) attending a public institution.
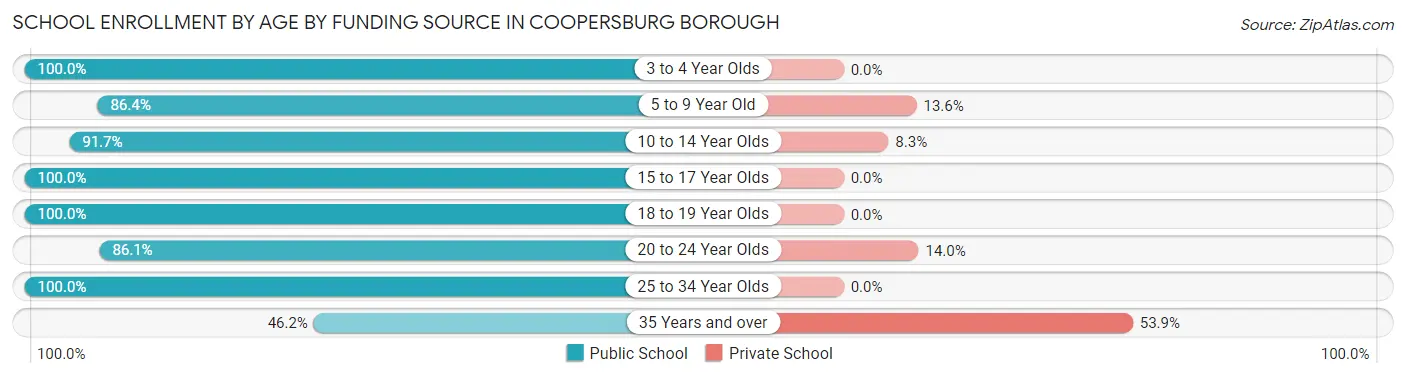
| Age Bracket | Public School | Private School |
| 3 to 4 Year Olds | 9 (100.0%) | 0 (0.0%) |
| 5 to 9 Year Old | 70 (86.4%) | 11 (13.6%) |
| 10 to 14 Year Olds | 88 (91.7%) | 8 (8.3%) |
| 15 to 17 Year Olds | 93 (100.0%) | 0 (0.0%) |
| 18 to 19 Year Olds | 39 (100.0%) | 0 (0.0%) |
| 20 to 24 Year Olds | 37 (86.1%) | 6 (14.0%) |
| 25 to 34 Year Olds | 33 (100.0%) | 0 (0.0%) |
| 35 Years and over | 6 (46.2%) | 7 (53.8%) |
| Total | 375 (92.1%) | 32 (7.9%) |
Educational Attainment by Field of Study in Coopersburg borough
Business (84 | 17.8%), science & technology (66 | 14.0%), education (56 | 11.9%), liberal arts & history (56 | 11.9%), and communications (37 | 7.9%) are the most common fields of study among 471 individuals in Coopersburg borough who have obtained a bachelor's degree or higher.
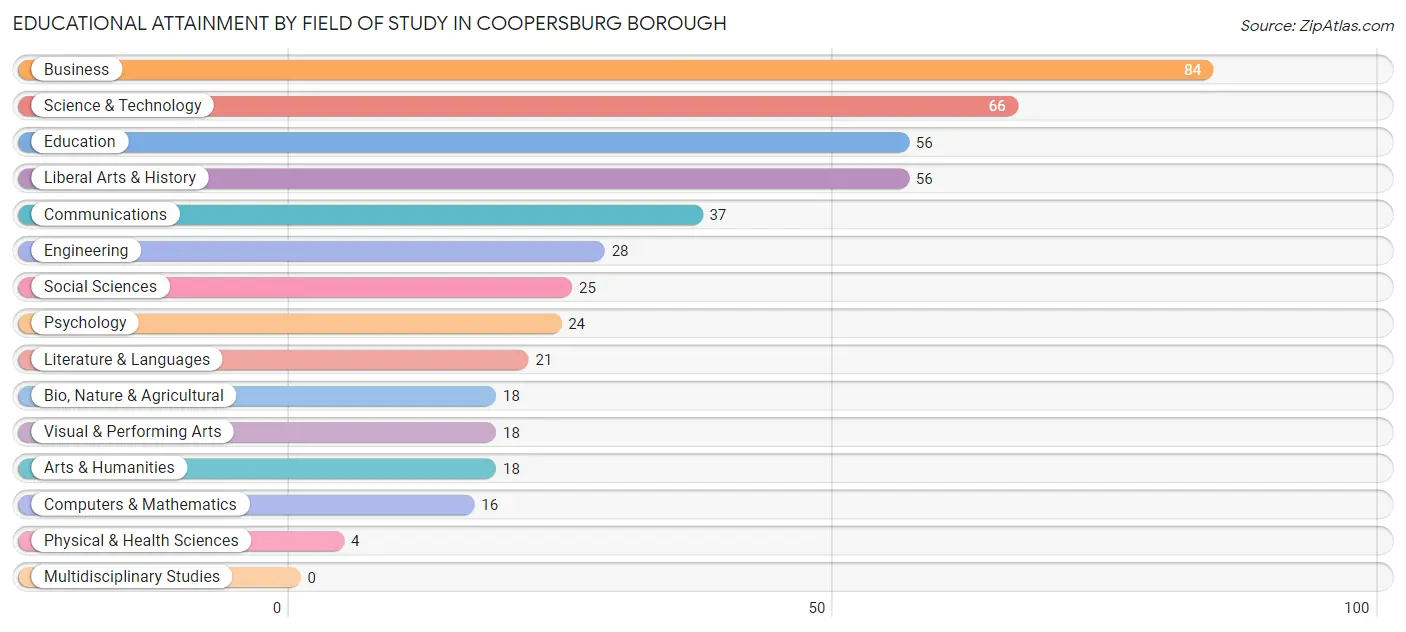
| Field of Study | # Graduates | % Graduates |
| Computers & Mathematics | 16 | 3.4% |
| Bio, Nature & Agricultural | 18 | 3.8% |
| Physical & Health Sciences | 4 | 0.9% |
| Psychology | 24 | 5.1% |
| Social Sciences | 25 | 5.3% |
| Engineering | 28 | 5.9% |
| Multidisciplinary Studies | 0 | 0.0% |
| Science & Technology | 66 | 14.0% |
| Business | 84 | 17.8% |
| Education | 56 | 11.9% |
| Literature & Languages | 21 | 4.5% |
| Liberal Arts & History | 56 | 11.9% |
| Visual & Performing Arts | 18 | 3.8% |
| Communications | 37 | 7.9% |
| Arts & Humanities | 18 | 3.8% |
| Total | 471 | 100.0% |
Transportation & Commute in Coopersburg borough
Vehicle Availability by Sex in Coopersburg borough
The most prevalent vehicle ownership categories in Coopersburg borough are males with 2 vehicles (329, accounting for 51.1%) and females with 2 vehicles (307, making up 52.3%).
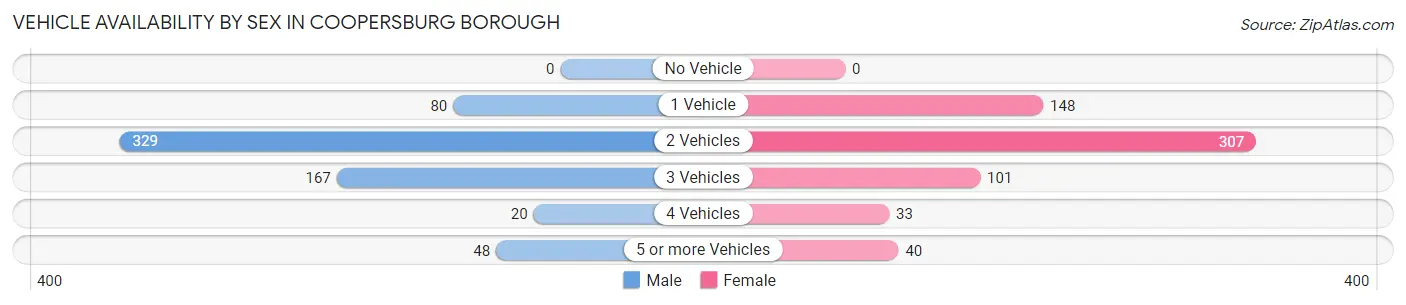
| Vehicles Available | Male | Female |
| No Vehicle | 0 (0.0%) | 0 (0.0%) |
| 1 Vehicle | 80 (12.4%) | 148 (23.5%) |
| 2 Vehicles | 329 (51.1%) | 307 (48.8%) |
| 3 Vehicles | 167 (25.9%) | 101 (16.1%) |
| 4 Vehicles | 20 (3.1%) | 33 (5.2%) |
| 5 or more Vehicles | 48 (7.4%) | 40 (6.4%) |
| Total | 644 (100.0%) | 629 (100.0%) |
Commute Time in Coopersburg borough
The most frequently occuring commute durations in Coopersburg borough are 5 to 9 minutes (260 commuters, 22.7%), 20 to 24 minutes (182 commuters, 15.9%), and 15 to 19 minutes (162 commuters, 14.1%).
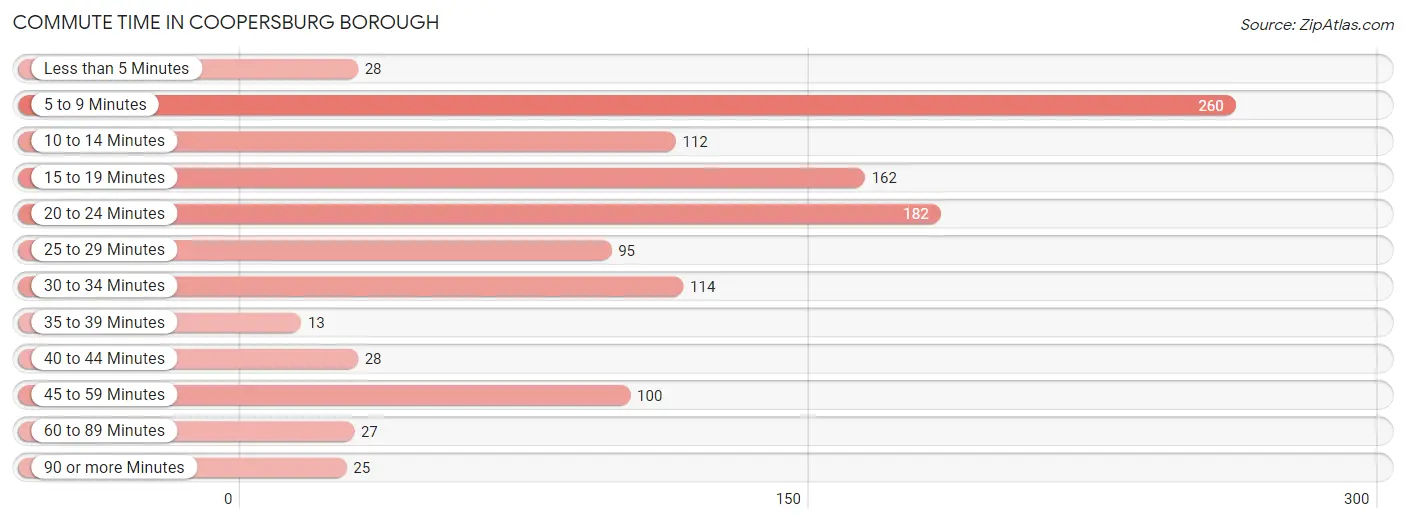
| Commute Time | # Commuters | % Commuters |
| Less than 5 Minutes | 28 | 2.4% |
| 5 to 9 Minutes | 260 | 22.7% |
| 10 to 14 Minutes | 112 | 9.8% |
| 15 to 19 Minutes | 162 | 14.1% |
| 20 to 24 Minutes | 182 | 15.9% |
| 25 to 29 Minutes | 95 | 8.3% |
| 30 to 34 Minutes | 114 | 10.0% |
| 35 to 39 Minutes | 13 | 1.1% |
| 40 to 44 Minutes | 28 | 2.4% |
| 45 to 59 Minutes | 100 | 8.7% |
| 60 to 89 Minutes | 27 | 2.4% |
| 90 or more Minutes | 25 | 2.2% |
Commute Time by Sex in Coopersburg borough
The most common commute times in Coopersburg borough are 20 to 24 minutes (133 commuters, 22.6%) for males and 5 to 9 minutes (146 commuters, 26.2%) for females.
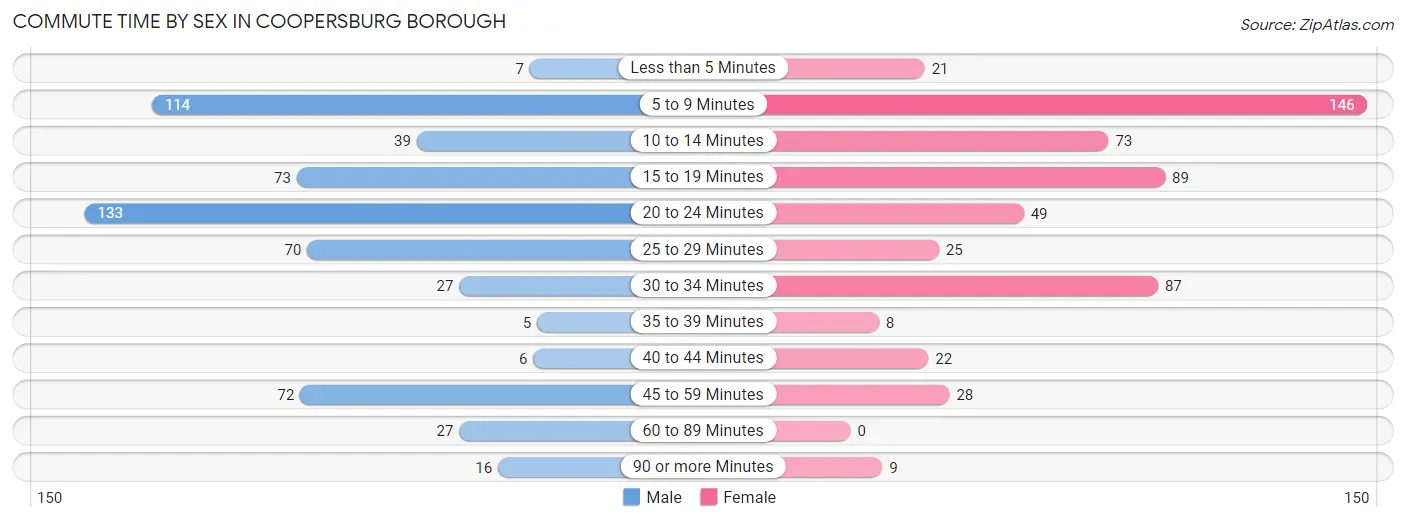
| Commute Time | Male | Female |
| Less than 5 Minutes | 7 (1.2%) | 21 (3.8%) |
| 5 to 9 Minutes | 114 (19.4%) | 146 (26.2%) |
| 10 to 14 Minutes | 39 (6.6%) | 73 (13.1%) |
| 15 to 19 Minutes | 73 (12.4%) | 89 (16.0%) |
| 20 to 24 Minutes | 133 (22.6%) | 49 (8.8%) |
| 25 to 29 Minutes | 70 (11.9%) | 25 (4.5%) |
| 30 to 34 Minutes | 27 (4.6%) | 87 (15.6%) |
| 35 to 39 Minutes | 5 (0.9%) | 8 (1.4%) |
| 40 to 44 Minutes | 6 (1.0%) | 22 (4.0%) |
| 45 to 59 Minutes | 72 (12.2%) | 28 (5.0%) |
| 60 to 89 Minutes | 27 (4.6%) | 0 (0.0%) |
| 90 or more Minutes | 16 (2.7%) | 9 (1.6%) |
Time of Departure to Work by Sex in Coopersburg borough
The most frequent times of departure to work in Coopersburg borough are 7:30 AM to 7:59 AM (93, 15.8%) for males and 6:30 AM to 6:59 AM (89, 16.0%) for females.
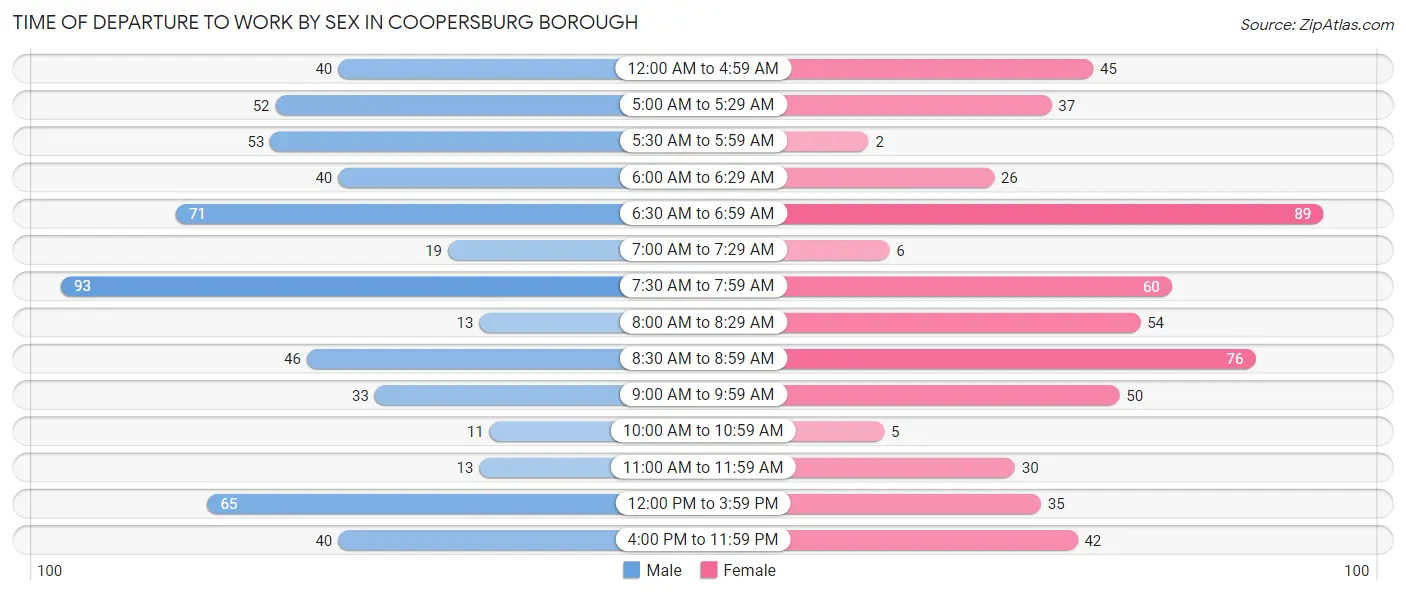
| Time of Departure | Male | Female |
| 12:00 AM to 4:59 AM | 40 (6.8%) | 45 (8.1%) |
| 5:00 AM to 5:29 AM | 52 (8.8%) | 37 (6.6%) |
| 5:30 AM to 5:59 AM | 53 (9.0%) | 2 (0.4%) |
| 6:00 AM to 6:29 AM | 40 (6.8%) | 26 (4.7%) |
| 6:30 AM to 6:59 AM | 71 (12.0%) | 89 (16.0%) |
| 7:00 AM to 7:29 AM | 19 (3.2%) | 6 (1.1%) |
| 7:30 AM to 7:59 AM | 93 (15.8%) | 60 (10.8%) |
| 8:00 AM to 8:29 AM | 13 (2.2%) | 54 (9.7%) |
| 8:30 AM to 8:59 AM | 46 (7.8%) | 76 (13.6%) |
| 9:00 AM to 9:59 AM | 33 (5.6%) | 50 (9.0%) |
| 10:00 AM to 10:59 AM | 11 (1.9%) | 5 (0.9%) |
| 11:00 AM to 11:59 AM | 13 (2.2%) | 30 (5.4%) |
| 12:00 PM to 3:59 PM | 65 (11.0%) | 35 (6.3%) |
| 4:00 PM to 11:59 PM | 40 (6.8%) | 42 (7.5%) |
| Total | 589 (100.0%) | 557 (100.0%) |
Housing Occupancy in Coopersburg borough
Occupancy by Ownership in Coopersburg borough
Of the total 1,050 dwellings in Coopersburg borough, owner-occupied units account for 682 (64.9%), while renter-occupied units make up 368 (35.0%).
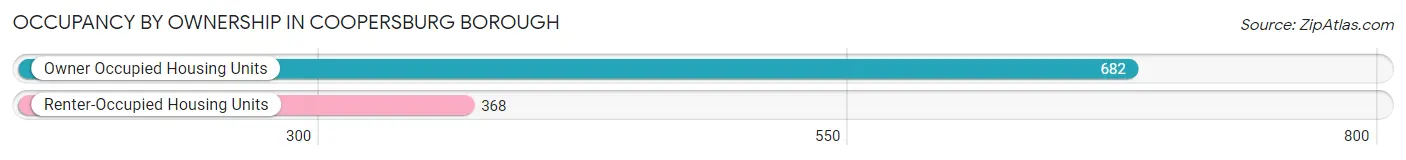
| Occupancy | # Housing Units | % Housing Units |
| Owner Occupied Housing Units | 682 | 64.9% |
| Renter-Occupied Housing Units | 368 | 35.0% |
| Total Occupied Housing Units | 1,050 | 100.0% |
Occupancy by Household Size in Coopersburg borough
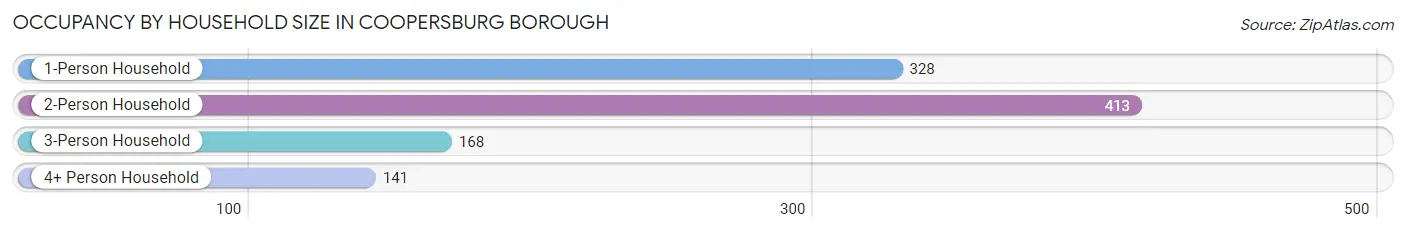
| Household Size | # Housing Units | % Housing Units |
| 1-Person Household | 328 | 31.2% |
| 2-Person Household | 413 | 39.3% |
| 3-Person Household | 168 | 16.0% |
| 4+ Person Household | 141 | 13.4% |
| Total Housing Units | 1,050 | 100.0% |
Occupancy by Ownership by Household Size in Coopersburg borough
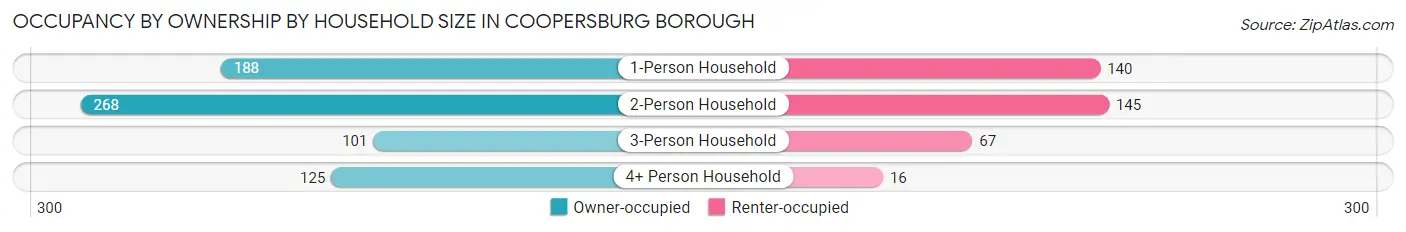
| Household Size | Owner-occupied | Renter-occupied |
| 1-Person Household | 188 (57.3%) | 140 (42.7%) |
| 2-Person Household | 268 (64.9%) | 145 (35.1%) |
| 3-Person Household | 101 (60.1%) | 67 (39.9%) |
| 4+ Person Household | 125 (88.6%) | 16 (11.4%) |
| Total Housing Units | 682 (64.9%) | 368 (35.0%) |
Occupancy by Educational Attainment in Coopersburg borough
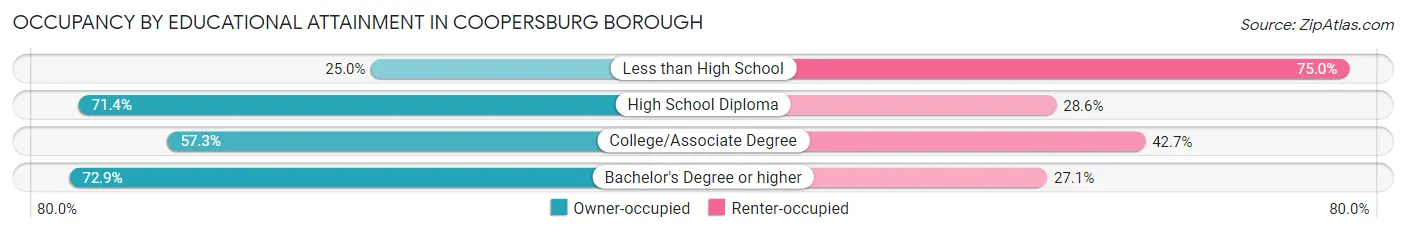
| Household Size | Owner-occupied | Renter-occupied |
| Less than High School | 22 (25.0%) | 66 (75.0%) |
| High School Diploma | 305 (71.4%) | 122 (28.6%) |
| College/Associate Degree | 129 (57.3%) | 96 (42.7%) |
| Bachelor's Degree or higher | 226 (72.9%) | 84 (27.1%) |
Occupancy by Age of Householder in Coopersburg borough
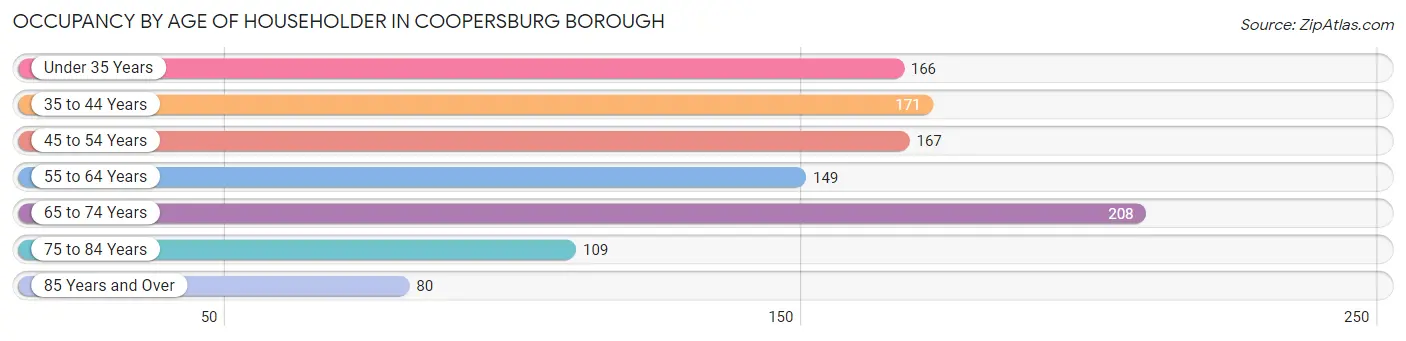
| Age Bracket | # Households | % Households |
| Under 35 Years | 166 | 15.8% |
| 35 to 44 Years | 171 | 16.3% |
| 45 to 54 Years | 167 | 15.9% |
| 55 to 64 Years | 149 | 14.2% |
| 65 to 74 Years | 208 | 19.8% |
| 75 to 84 Years | 109 | 10.4% |
| 85 Years and Over | 80 | 7.6% |
| Total | 1,050 | 100.0% |
Housing Finances in Coopersburg borough
Median Income by Occupancy in Coopersburg borough
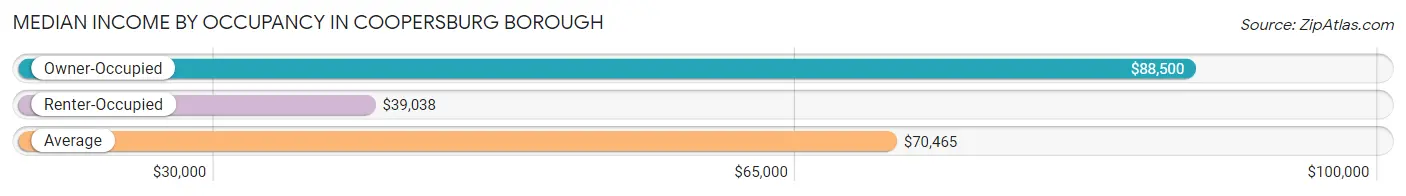
| Occupancy Type | # Households | Median Income |
| Owner-Occupied | 682 (64.9%) | $88,500 |
| Renter-Occupied | 368 (35.0%) | $39,038 |
| Average | 1,050 (100.0%) | $70,465 |
Occupancy by Householder Income Bracket in Coopersburg borough
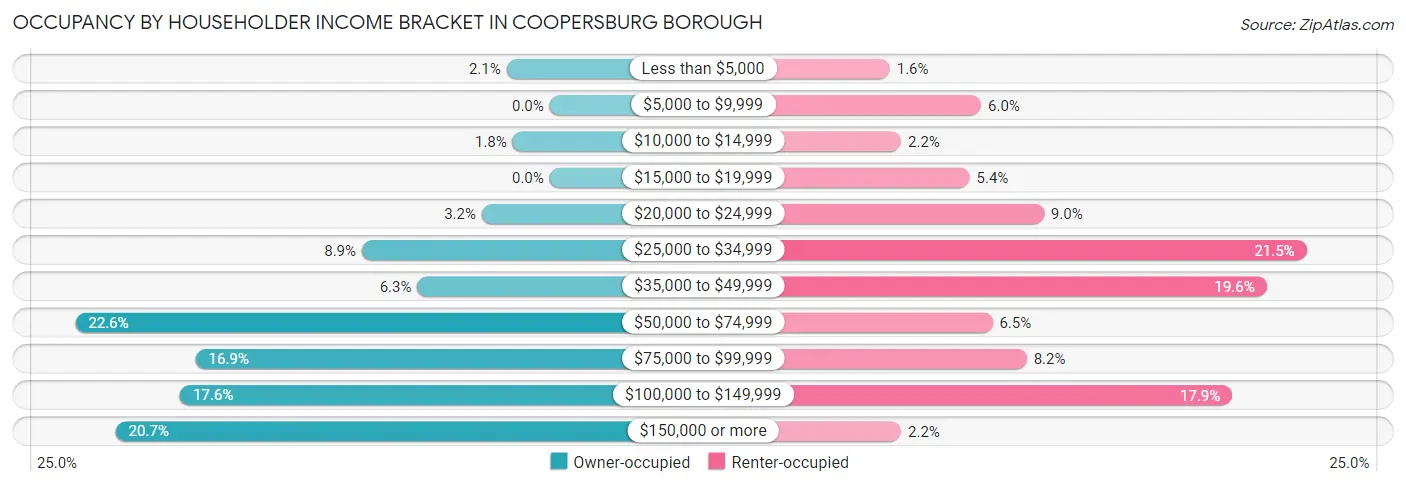
| Income Bracket | Owner-occupied | Renter-occupied |
| Less than $5,000 | 14 (2.1%) | 6 (1.6%) |
| $5,000 to $9,999 | 0 (0.0%) | 22 (6.0%) |
| $10,000 to $14,999 | 12 (1.8%) | 8 (2.2%) |
| $15,000 to $19,999 | 0 (0.0%) | 20 (5.4%) |
| $20,000 to $24,999 | 22 (3.2%) | 33 (9.0%) |
| $25,000 to $34,999 | 61 (8.9%) | 79 (21.5%) |
| $35,000 to $49,999 | 43 (6.3%) | 72 (19.6%) |
| $50,000 to $74,999 | 154 (22.6%) | 24 (6.5%) |
| $75,000 to $99,999 | 115 (16.9%) | 30 (8.2%) |
| $100,000 to $149,999 | 120 (17.6%) | 66 (17.9%) |
| $150,000 or more | 141 (20.7%) | 8 (2.2%) |
| Total | 682 (100.0%) | 368 (100.0%) |
Monthly Housing Cost Tiers in Coopersburg borough
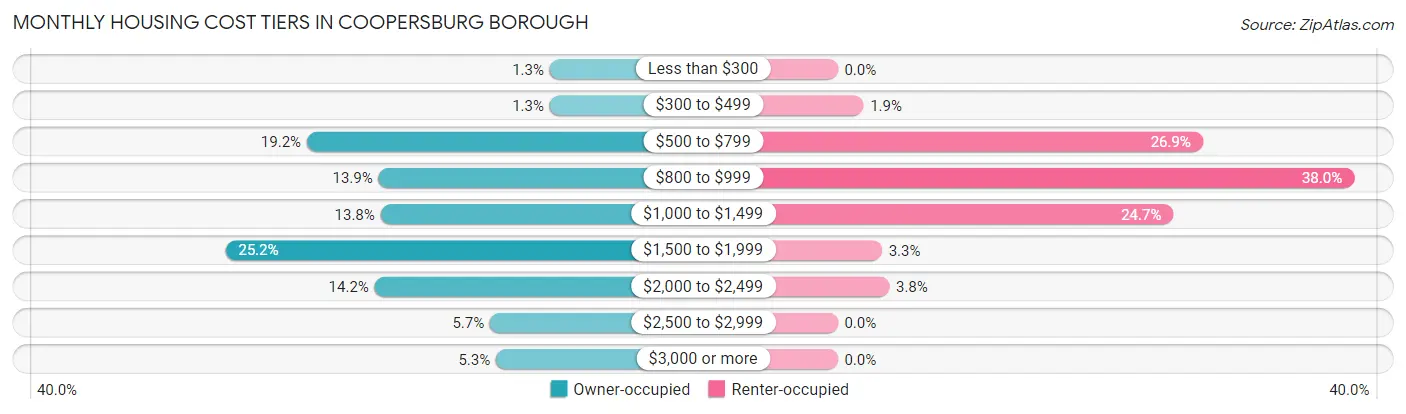
| Monthly Cost | Owner-occupied | Renter-occupied |
| Less than $300 | 9 (1.3%) | 0 (0.0%) |
| $300 to $499 | 9 (1.3%) | 7 (1.9%) |
| $500 to $799 | 131 (19.2%) | 99 (26.9%) |
| $800 to $999 | 95 (13.9%) | 140 (38.0%) |
| $1,000 to $1,499 | 94 (13.8%) | 91 (24.7%) |
| $1,500 to $1,999 | 172 (25.2%) | 12 (3.3%) |
| $2,000 to $2,499 | 97 (14.2%) | 14 (3.8%) |
| $2,500 to $2,999 | 39 (5.7%) | 0 (0.0%) |
| $3,000 or more | 36 (5.3%) | 0 (0.0%) |
| Total | 682 (100.0%) | 368 (100.0%) |
Physical Housing Characteristics in Coopersburg borough
Housing Structures in Coopersburg borough
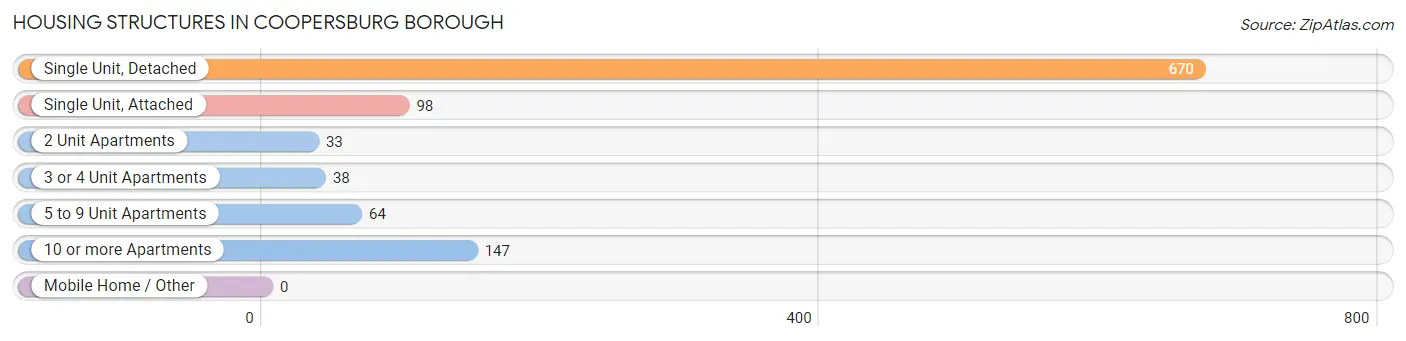
| Structure Type | # Housing Units | % Housing Units |
| Single Unit, Detached | 670 | 63.8% |
| Single Unit, Attached | 98 | 9.3% |
| 2 Unit Apartments | 33 | 3.1% |
| 3 or 4 Unit Apartments | 38 | 3.6% |
| 5 to 9 Unit Apartments | 64 | 6.1% |
| 10 or more Apartments | 147 | 14.0% |
| Mobile Home / Other | 0 | 0.0% |
| Total | 1,050 | 100.0% |
Housing Structures by Occupancy in Coopersburg borough
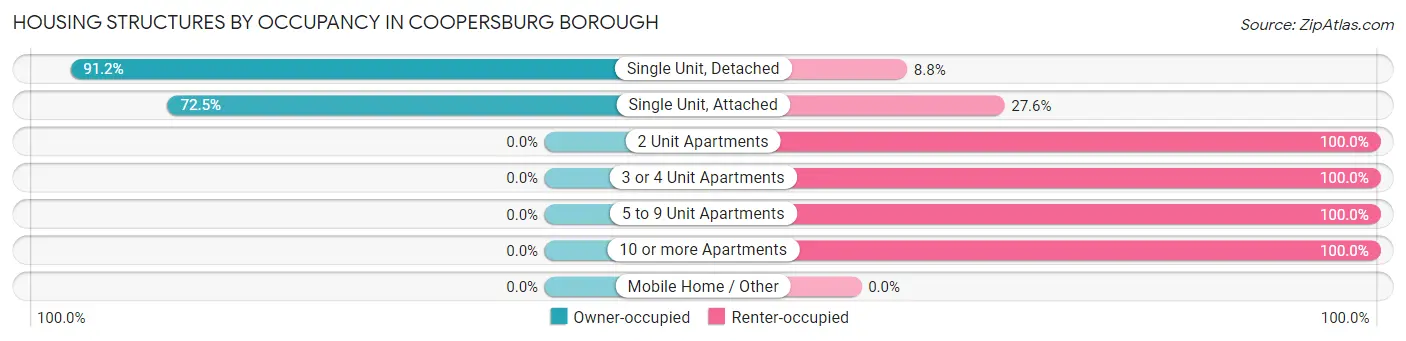
| Structure Type | Owner-occupied | Renter-occupied |
| Single Unit, Detached | 611 (91.2%) | 59 (8.8%) |
| Single Unit, Attached | 71 (72.5%) | 27 (27.6%) |
| 2 Unit Apartments | 0 (0.0%) | 33 (100.0%) |
| 3 or 4 Unit Apartments | 0 (0.0%) | 38 (100.0%) |
| 5 to 9 Unit Apartments | 0 (0.0%) | 64 (100.0%) |
| 10 or more Apartments | 0 (0.0%) | 147 (100.0%) |
| Mobile Home / Other | 0 (0.0%) | 0 (0.0%) |
| Total | 682 (64.9%) | 368 (35.0%) |
Housing Structures by Number of Rooms in Coopersburg borough
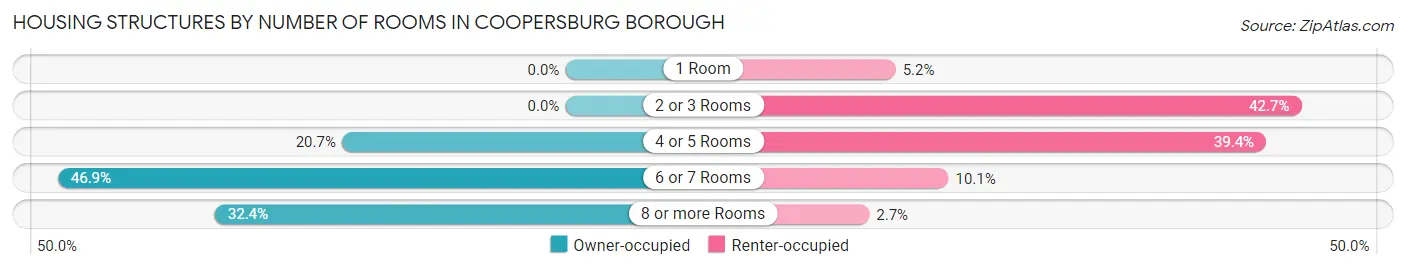
| Number of Rooms | Owner-occupied | Renter-occupied |
| 1 Room | 0 (0.0%) | 19 (5.2%) |
| 2 or 3 Rooms | 0 (0.0%) | 157 (42.7%) |
| 4 or 5 Rooms | 141 (20.7%) | 145 (39.4%) |
| 6 or 7 Rooms | 320 (46.9%) | 37 (10.1%) |
| 8 or more Rooms | 221 (32.4%) | 10 (2.7%) |
| Total | 682 (100.0%) | 368 (100.0%) |
Housing Structure by Heating Type in Coopersburg borough
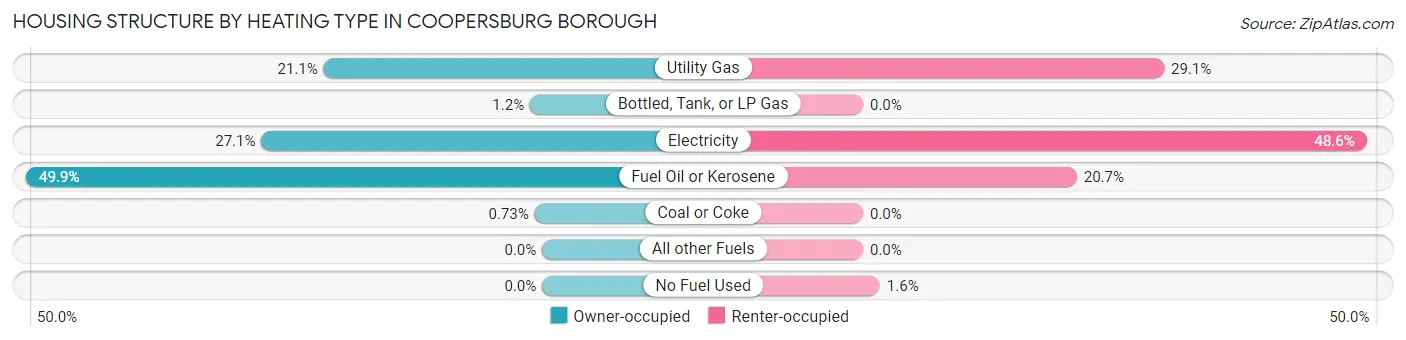
| Heating Type | Owner-occupied | Renter-occupied |
| Utility Gas | 144 (21.1%) | 107 (29.1%) |
| Bottled, Tank, or LP Gas | 8 (1.2%) | 0 (0.0%) |
| Electricity | 185 (27.1%) | 179 (48.6%) |
| Fuel Oil or Kerosene | 340 (49.8%) | 76 (20.6%) |
| Coal or Coke | 5 (0.7%) | 0 (0.0%) |
| All other Fuels | 0 (0.0%) | 0 (0.0%) |
| No Fuel Used | 0 (0.0%) | 6 (1.6%) |
| Total | 682 (100.0%) | 368 (100.0%) |
Household Vehicle Usage in Coopersburg borough
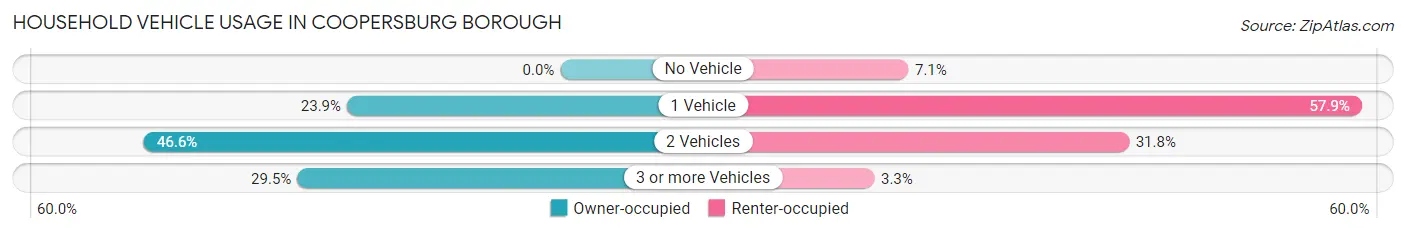
| Vehicles per Household | Owner-occupied | Renter-occupied |
| No Vehicle | 0 (0.0%) | 26 (7.1%) |
| 1 Vehicle | 163 (23.9%) | 213 (57.9%) |
| 2 Vehicles | 318 (46.6%) | 117 (31.8%) |
| 3 or more Vehicles | 201 (29.5%) | 12 (3.3%) |
| Total | 682 (100.0%) | 368 (100.0%) |
Real Estate & Mortgages in Coopersburg borough
Real Estate and Mortgage Overview in Coopersburg borough
| Characteristic | Without Mortgage | With Mortgage |
| Housing Units | 283 | 399 |
| Median Property Value | $243,000 | $305,600 |
| Median Household Income | $53,444 | $111 |
| Monthly Housing Costs | $805 | $28 |
| Real Estate Taxes | $4,456 | $0 |
Property Value by Mortgage Status in Coopersburg borough
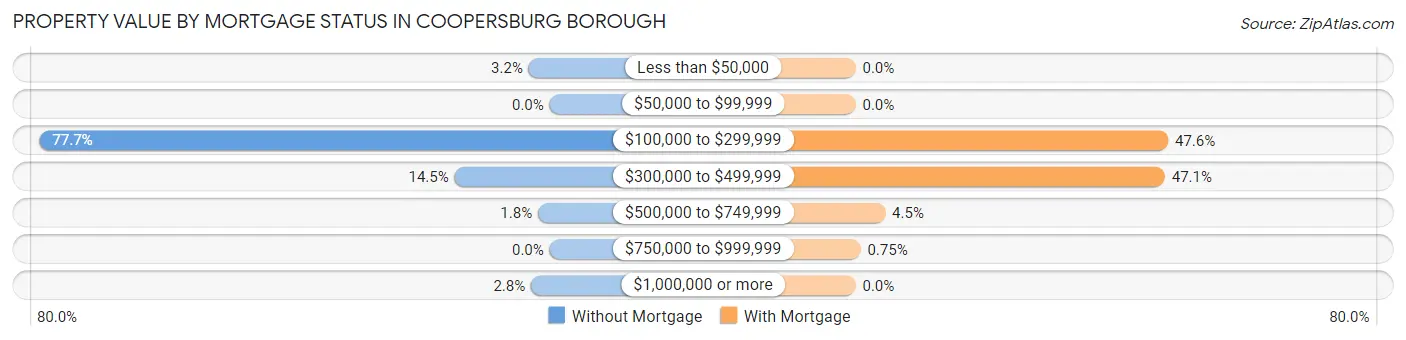
| Property Value | Without Mortgage | With Mortgage |
| Less than $50,000 | 9 (3.2%) | 0 (0.0%) |
| $50,000 to $99,999 | 0 (0.0%) | 0 (0.0%) |
| $100,000 to $299,999 | 220 (77.7%) | 190 (47.6%) |
| $300,000 to $499,999 | 41 (14.5%) | 188 (47.1%) |
| $500,000 to $749,999 | 5 (1.8%) | 18 (4.5%) |
| $750,000 to $999,999 | 0 (0.0%) | 3 (0.7%) |
| $1,000,000 or more | 8 (2.8%) | 0 (0.0%) |
| Total | 283 (100.0%) | 399 (100.0%) |
Household Income by Mortgage Status in Coopersburg borough
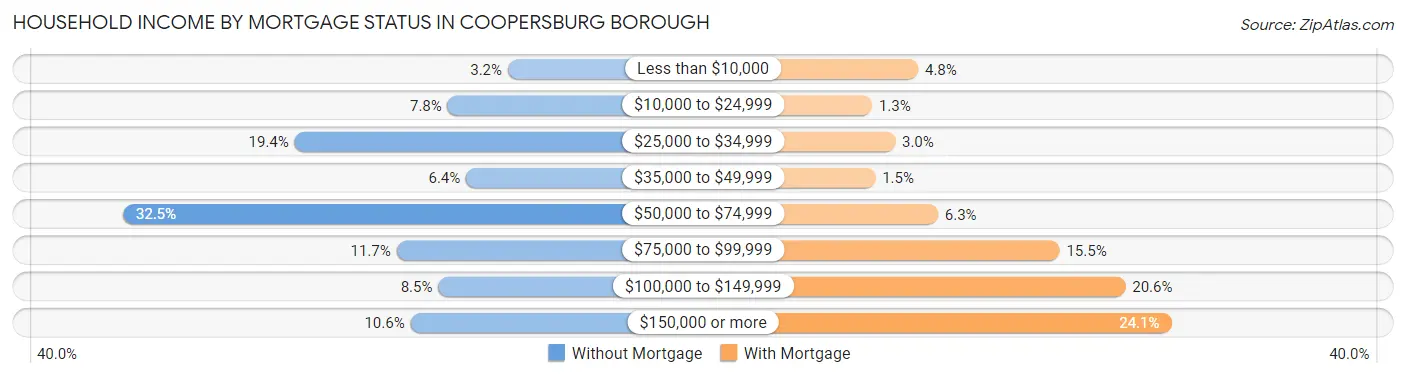
| Household Income | Without Mortgage | With Mortgage |
| Less than $10,000 | 9 (3.2%) | 19 (4.8%) |
| $10,000 to $24,999 | 22 (7.8%) | 5 (1.3%) |
| $25,000 to $34,999 | 55 (19.4%) | 12 (3.0%) |
| $35,000 to $49,999 | 18 (6.4%) | 6 (1.5%) |
| $50,000 to $74,999 | 92 (32.5%) | 25 (6.3%) |
| $75,000 to $99,999 | 33 (11.7%) | 62 (15.5%) |
| $100,000 to $149,999 | 24 (8.5%) | 82 (20.5%) |
| $150,000 or more | 30 (10.6%) | 96 (24.1%) |
| Total | 283 (100.0%) | 399 (100.0%) |
Property Value to Household Income Ratio in Coopersburg borough
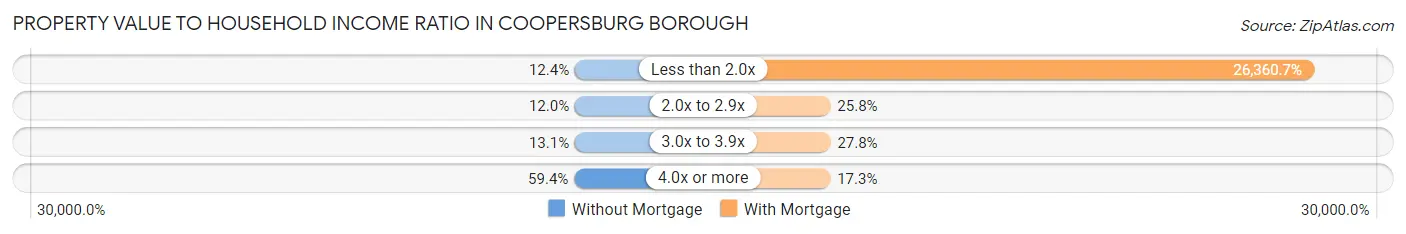
| Value-to-Income Ratio | Without Mortgage | With Mortgage |
| Less than 2.0x | 35 (12.4%) | 105,179 (26,360.6%) |
| 2.0x to 2.9x | 34 (12.0%) | 103 (25.8%) |
| 3.0x to 3.9x | 37 (13.1%) | 111 (27.8%) |
| 4.0x or more | 168 (59.4%) | 69 (17.3%) |
| Total | 283 (100.0%) | 399 (100.0%) |
Real Estate Taxes by Mortgage Status in Coopersburg borough
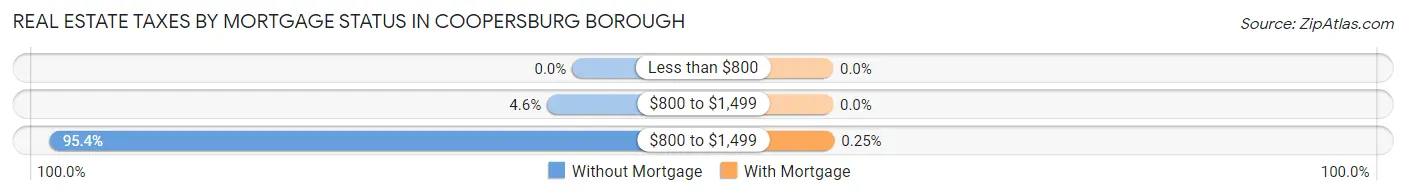
| Property Taxes | Without Mortgage | With Mortgage |
| Less than $800 | 0 (0.0%) | 0 (0.0%) |
| $800 to $1,499 | 13 (4.6%) | 0 (0.0%) |
| $800 to $1,499 | 270 (95.4%) | 1 (0.3%) |
| Total | 283 (100.0%) | 399 (100.0%) |
Health & Disability in Coopersburg borough
Health Insurance Coverage by Age in Coopersburg borough
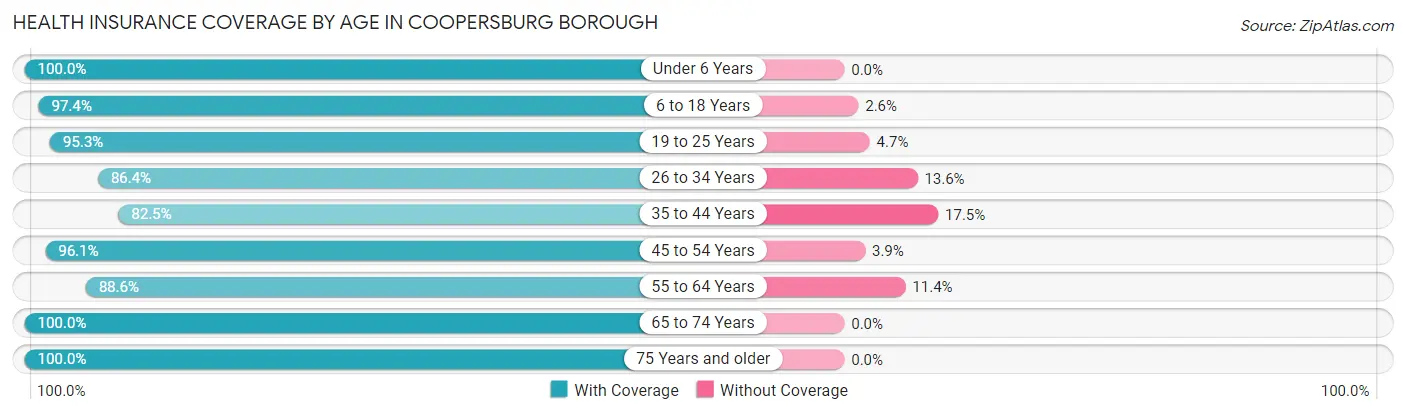
| Age Bracket | With Coverage | Without Coverage |
| Under 6 Years | 162 (100.0%) | 0 (0.0%) |
| 6 to 18 Years | 299 (97.4%) | 8 (2.6%) |
| 19 to 25 Years | 141 (95.3%) | 7 (4.7%) |
| 26 to 34 Years | 285 (86.4%) | 45 (13.6%) |
| 35 to 44 Years | 217 (82.5%) | 46 (17.5%) |
| 45 to 54 Years | 298 (96.1%) | 12 (3.9%) |
| 55 to 64 Years | 202 (88.6%) | 26 (11.4%) |
| 65 to 74 Years | 293 (100.0%) | 0 (0.0%) |
| 75 Years and older | 291 (100.0%) | 0 (0.0%) |
| Total | 2,188 (93.8%) | 144 (6.2%) |
Health Insurance Coverage by Citizenship Status in Coopersburg borough
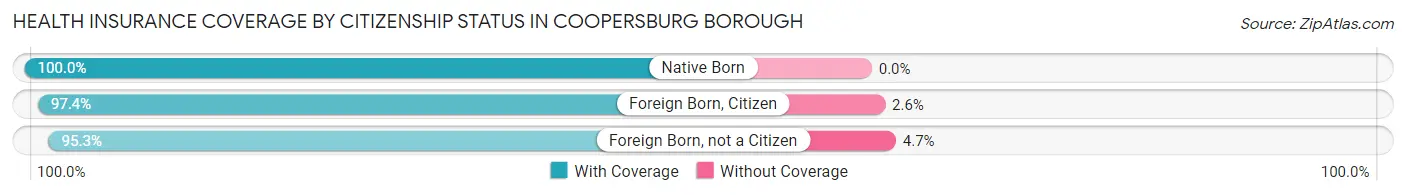
| Citizenship Status | With Coverage | Without Coverage |
| Native Born | 162 (100.0%) | 0 (0.0%) |
| Foreign Born, Citizen | 299 (97.4%) | 8 (2.6%) |
| Foreign Born, not a Citizen | 141 (95.3%) | 7 (4.7%) |
Health Insurance Coverage by Household Income in Coopersburg borough
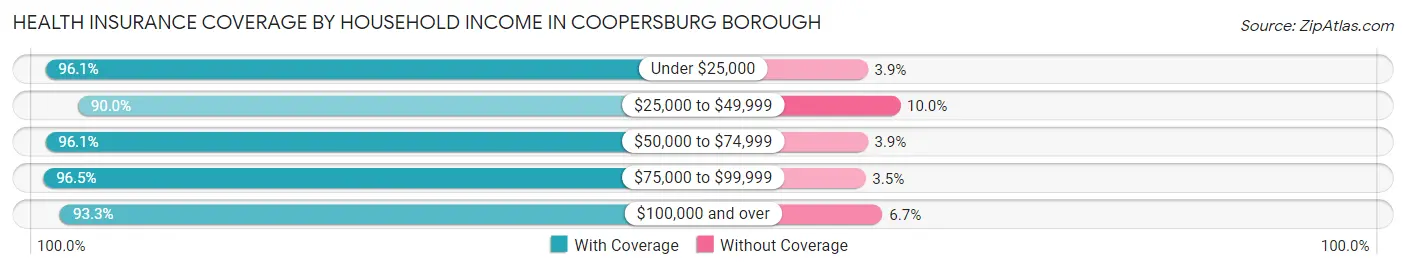
| Household Income | With Coverage | Without Coverage |
| Under $25,000 | 173 (96.1%) | 7 (3.9%) |
| $25,000 to $49,999 | 388 (90.0%) | 43 (10.0%) |
| $50,000 to $74,999 | 372 (96.1%) | 15 (3.9%) |
| $75,000 to $99,999 | 304 (96.5%) | 11 (3.5%) |
| $100,000 and over | 951 (93.3%) | 68 (6.7%) |
Public vs Private Health Insurance Coverage by Age in Coopersburg borough
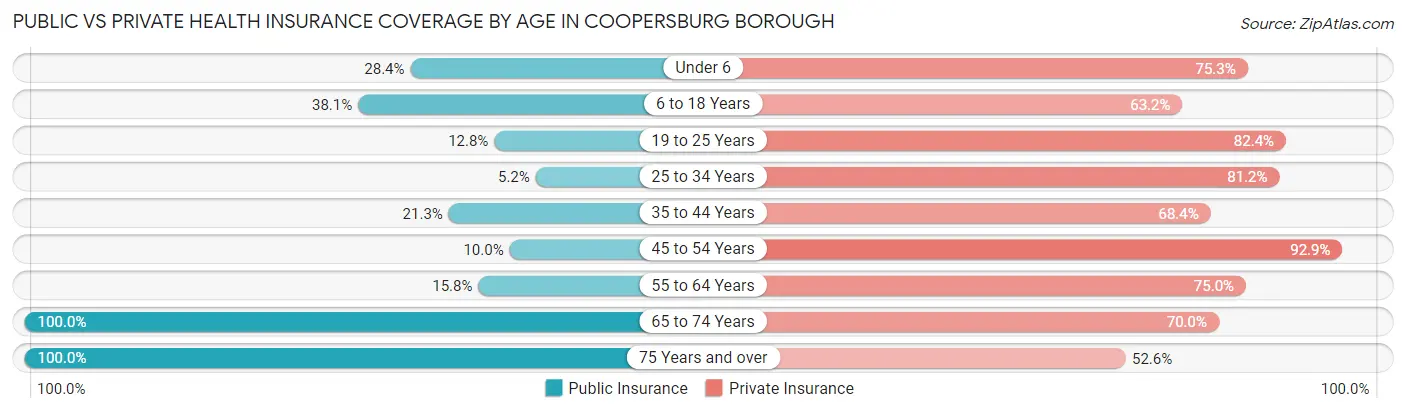
| Age Bracket | Public Insurance | Private Insurance |
| Under 6 | 46 (28.4%) | 122 (75.3%) |
| 6 to 18 Years | 117 (38.1%) | 194 (63.2%) |
| 19 to 25 Years | 19 (12.8%) | 122 (82.4%) |
| 25 to 34 Years | 17 (5.1%) | 268 (81.2%) |
| 35 to 44 Years | 56 (21.3%) | 180 (68.4%) |
| 45 to 54 Years | 31 (10.0%) | 288 (92.9%) |
| 55 to 64 Years | 36 (15.8%) | 171 (75.0%) |
| 65 to 74 Years | 293 (100.0%) | 205 (70.0%) |
| 75 Years and over | 291 (100.0%) | 153 (52.6%) |
| Total | 906 (38.9%) | 1,703 (73.0%) |
Disability Status by Sex by Age in Coopersburg borough
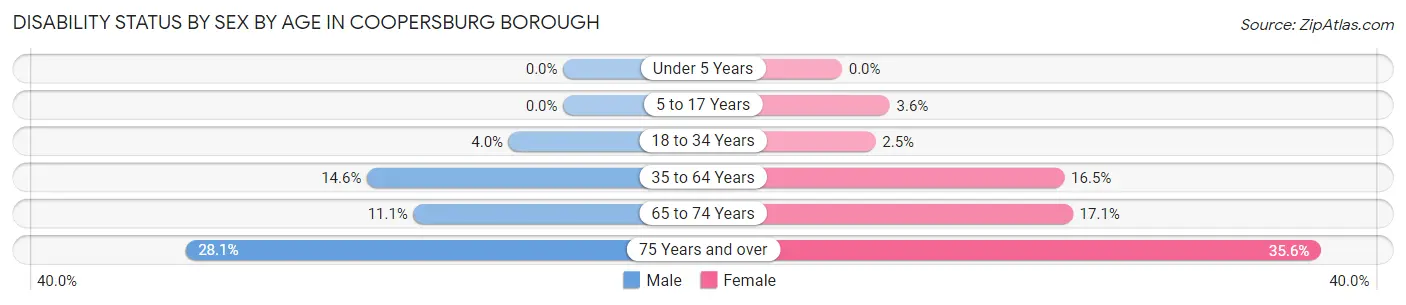
| Age Bracket | Male | Female |
| Under 5 Years | 0 (0.0%) | 0 (0.0%) |
| 5 to 17 Years | 0 (0.0%) | 5 (3.5%) |
| 18 to 34 Years | 11 (4.0%) | 6 (2.5%) |
| 35 to 64 Years | 54 (14.6%) | 71 (16.5%) |
| 65 to 74 Years | 17 (11.1%) | 24 (17.1%) |
| 75 Years and over | 32 (28.1%) | 63 (35.6%) |
Disability Class by Sex by Age in Coopersburg borough
Disability Class: Hearing Difficulty
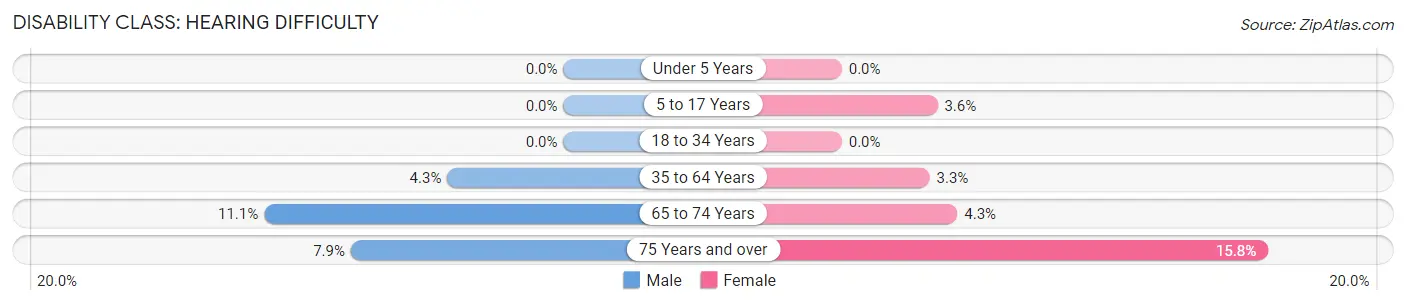
| Age Bracket | Male | Female |
| Under 5 Years | 0 (0.0%) | 0 (0.0%) |
| 5 to 17 Years | 0 (0.0%) | 5 (3.5%) |
| 18 to 34 Years | 0 (0.0%) | 0 (0.0%) |
| 35 to 64 Years | 16 (4.3%) | 14 (3.3%) |
| 65 to 74 Years | 17 (11.1%) | 6 (4.3%) |
| 75 Years and over | 9 (7.9%) | 28 (15.8%) |
Disability Class: Vision Difficulty
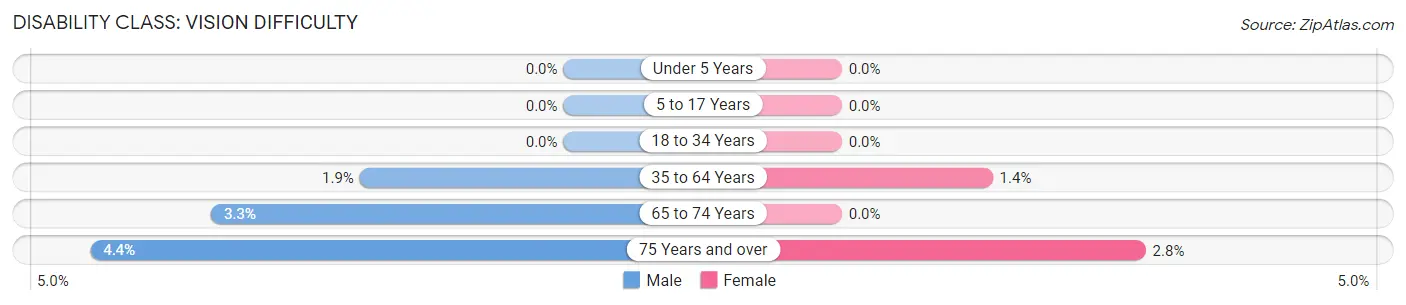
| Age Bracket | Male | Female |
| Under 5 Years | 0 (0.0%) | 0 (0.0%) |
| 5 to 17 Years | 0 (0.0%) | 0 (0.0%) |
| 18 to 34 Years | 0 (0.0%) | 0 (0.0%) |
| 35 to 64 Years | 7 (1.9%) | 6 (1.4%) |
| 65 to 74 Years | 5 (3.3%) | 0 (0.0%) |
| 75 Years and over | 5 (4.4%) | 5 (2.8%) |
Disability Class: Cognitive Difficulty
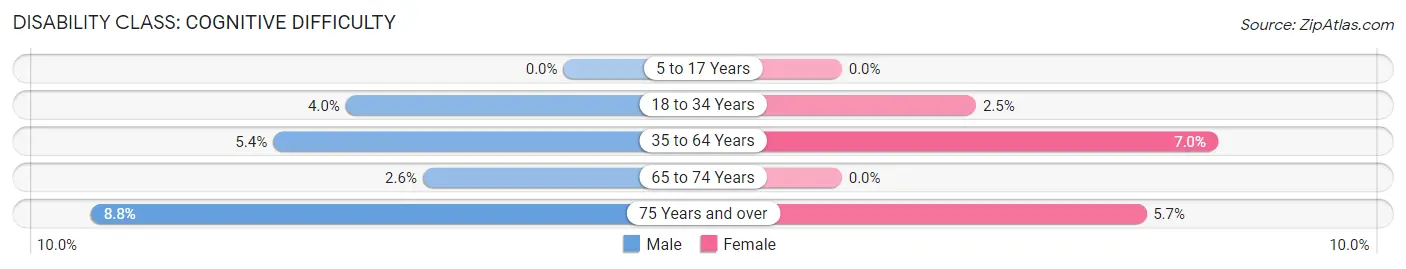
| Age Bracket | Male | Female |
| 5 to 17 Years | 0 (0.0%) | 0 (0.0%) |
| 18 to 34 Years | 11 (4.0%) | 6 (2.5%) |
| 35 to 64 Years | 20 (5.4%) | 30 (7.0%) |
| 65 to 74 Years | 4 (2.6%) | 0 (0.0%) |
| 75 Years and over | 10 (8.8%) | 10 (5.7%) |
Disability Class: Ambulatory Difficulty
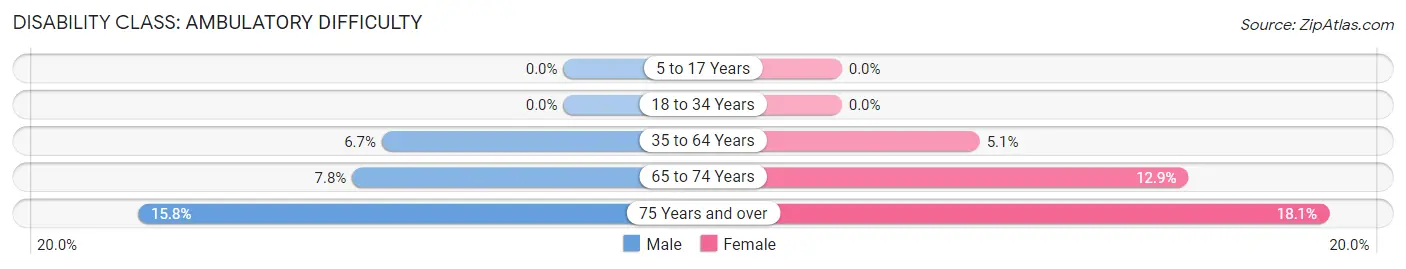
| Age Bracket | Male | Female |
| 5 to 17 Years | 0 (0.0%) | 0 (0.0%) |
| 18 to 34 Years | 0 (0.0%) | 0 (0.0%) |
| 35 to 64 Years | 25 (6.7%) | 22 (5.1%) |
| 65 to 74 Years | 12 (7.8%) | 18 (12.9%) |
| 75 Years and over | 18 (15.8%) | 32 (18.1%) |
Disability Class: Self-Care Difficulty
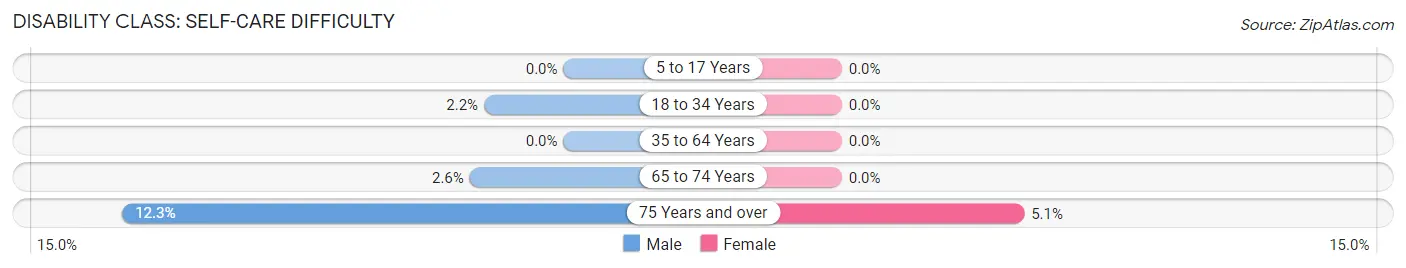
| Age Bracket | Male | Female |
| 5 to 17 Years | 0 (0.0%) | 0 (0.0%) |
| 18 to 34 Years | 6 (2.2%) | 0 (0.0%) |
| 35 to 64 Years | 0 (0.0%) | 0 (0.0%) |
| 65 to 74 Years | 4 (2.6%) | 0 (0.0%) |
| 75 Years and over | 14 (12.3%) | 9 (5.1%) |
Technology Access in Coopersburg borough
Computing Device Access in Coopersburg borough
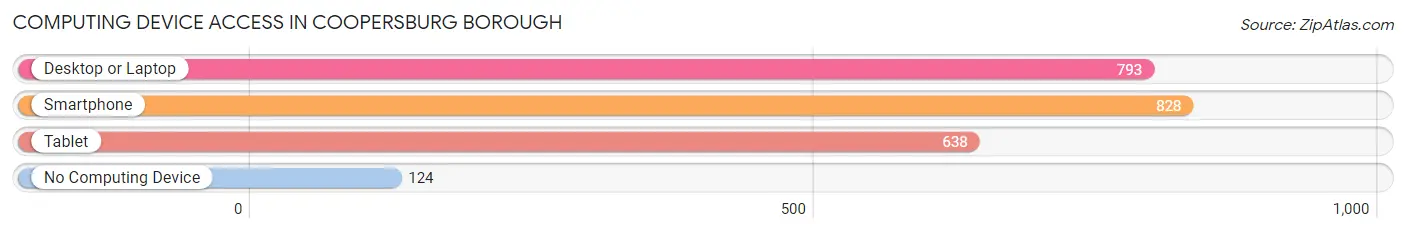
| Device Type | # Households | % Households |
| Desktop or Laptop | 793 | 75.5% |
| Smartphone | 828 | 78.9% |
| Tablet | 638 | 60.8% |
| No Computing Device | 124 | 11.8% |
| Total | 1,050 | 100.0% |
Internet Access in Coopersburg borough
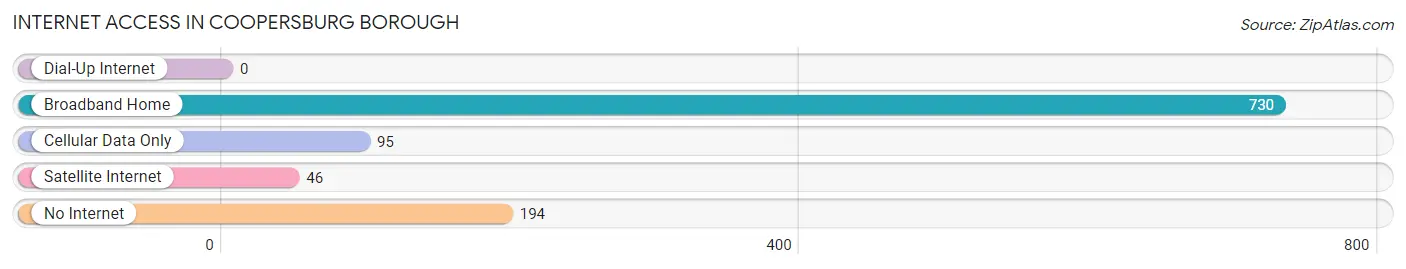
| Internet Type | # Households | % Households |
| Dial-Up Internet | 0 | 0.0% |
| Broadband Home | 730 | 69.5% |
| Cellular Data Only | 95 | 9.0% |
| Satellite Internet | 46 | 4.4% |
| No Internet | 194 | 18.5% |
| Total | 1,050 | 100.0% |
Coopersburg borough Summary
Coopersburg Borough is a small borough located in Lehigh County, Pennsylvania. It is situated in the Lehigh Valley region of the state, approximately 8 miles south of Allentown and about 60 miles north of Philadelphia. The borough is home to a population of approximately 2,500 people, and is part of the Allentown-Bethlehem-Easton metropolitan area.
History
Coopersburg Borough was founded in 1845 by John Cooper, a local farmer and businessman. The borough was named after him, and he was the first mayor of the borough. The area was originally part of Upper Saucon Township, and was incorporated as a borough in 1845.
The borough was originally a rural farming community, but in the late 19th century, it began to develop into a small industrial center. The borough was home to several small factories, including a brickyard, a sawmill, and a tannery. The borough also had a railroad station, which connected it to the larger cities of Allentown and Bethlehem.
In the early 20th century, the borough began to experience a period of growth and development. The borough was home to several small businesses, including a grocery store, a hardware store, and a bank. The borough also had a post office, a library, and a movie theater.
Geography
Coopersburg Borough is located in the Lehigh Valley region of Pennsylvania. It is situated in the southern part of Lehigh County, approximately 8 miles south of Allentown and about 60 miles north of Philadelphia. The borough is bordered by Upper Saucon Township to the north, Lower Milford Township to the east, Springfield Township to the south, and Richland Township to the west.
The borough has a total area of 1.2 square miles, all of which is land. The borough is located in the Lehigh Valley region of Pennsylvania, and is part of the Allentown-Bethlehem-Easton metropolitan area.
Economy
The economy of Coopersburg Borough is largely based on small businesses and services. The borough is home to several small businesses, including restaurants, retail stores, and professional services. The borough also has a few industrial businesses, including a printing company and a metal fabrication shop.
The borough is also home to several educational institutions, including a public elementary school, a private school, and a community college. The borough is also home to a few churches, and a public library.
Demographics
As of the 2010 census, the population of Coopersburg Borough was 2,521. The racial makeup of the borough was 94.3% White, 1.7% African American, 0.2% Native American, 1.2% Asian, 0.1% Pacific Islander, 1.2% from other races, and 1.5% from two or more races. Hispanic or Latino of any race were 3.2% of the population.
The median household income in the borough was $50,938, and the median family income was $60,938. The per capita income in the borough was $25,938. About 5.2% of families and 6.7% of the population were below the poverty line, including 8.2% of those under age 18 and 4.2% of those age 65 or over.
Common Questions
What is Per Capita Income in Coopersburg borough?
Per Capita income in Coopersburg borough is $38,790.
What is the Median Family Income in Coopersburg borough?
Median Family Income in Coopersburg borough is $94,500.
What is the Median Household income in Coopersburg borough?
Median Household Income in Coopersburg borough is $70,465.
What is Income or Wage Gap in Coopersburg borough?
Income or Wage Gap in Coopersburg borough is 30.6%.
Women in Coopersburg borough earn 69.4 cents for every dollar earned by a man.
What is Inequality or Gini Index in Coopersburg borough?
Inequality or Gini Index in Coopersburg borough is 0.41.
What is the Total Population of Coopersburg borough?
Total Population of Coopersburg borough is 2,332.
What is the Total Male Population of Coopersburg borough?
Total Male Population of Coopersburg borough is 1,149.
What is the Total Female Population of Coopersburg borough?
Total Female Population of Coopersburg borough is 1,183.
What is the Ratio of Males per 100 Females in Coopersburg borough?
There are 97.13 Males per 100 Females in Coopersburg borough.
What is the Ratio of Females per 100 Males in Coopersburg borough?
There are 102.96 Females per 100 Males in Coopersburg borough.
What is the Median Population Age in Coopersburg borough?
Median Population Age in Coopersburg borough is 43.2 Years.
What is the Average Family Size in Coopersburg borough
Average Family Size in Coopersburg borough is 2.8 People.
What is the Average Household Size in Coopersburg borough
Average Household Size in Coopersburg borough is 2.2 People.
How Large is the Labor Force in Coopersburg borough?
There are 1,324 People in the Labor Forcein in Coopersburg borough.
What is the Percentage of People in the Labor Force in Coopersburg borough?
67.3% of People are in the Labor Force in Coopersburg borough.
What is the Unemployment Rate in Coopersburg borough?
Unemployment Rate in Coopersburg borough is 2.9%.