Conneaut Lakeshore, PA Map & Demographics
Conneaut Lakeshore Map
Conneaut Lakeshore Overview
$40,983
PER CAPITA INCOME
$93,299
AVG FAMILY INCOME
$67,063
AVG HOUSEHOLD INCOME
48.5%
WAGE / INCOME GAP [ % ]
51.5¢/ $1
WAGE / INCOME GAP [ $ ]
0.47
INEQUALITY / GINI INDEX
1,933
TOTAL POPULATION
901
MALE POPULATION
1,032
FEMALE POPULATION
87.31
MALES / 100 FEMALES
114.54
FEMALES / 100 MALES
55.5
MEDIAN AGE
2.6
AVG FAMILY SIZE
2.0
AVG HOUSEHOLD SIZE
859
LABOR FORCE [ PEOPLE ]
49.1%
PERCENT IN LABOR FORCE
5.5%
UNEMPLOYMENT RATE
Income in Conneaut Lakeshore
Income Overview in Conneaut Lakeshore
Per Capita Income in Conneaut Lakeshore is $40,983, while median incomes of families and households are $93,299 and $67,063 respectively.
| Characteristic | Number | Measure |
| Per Capita Income | 1,933 | $40,983 |
| Median Family Income | 537 | $93,299 |
| Mean Family Income | 537 | $111,504 |
| Median Household Income | 987 | $67,063 |
| Mean Household Income | 987 | $79,633 |
| Income Deficit | 537 | $0 |
| Wage / Income Gap (%) | 1,933 | 48.51% |
| Wage / Income Gap ($) | 1,933 | 51.49¢ per $1 |
| Gini / Inequality Index | 1,933 | 0.47 |
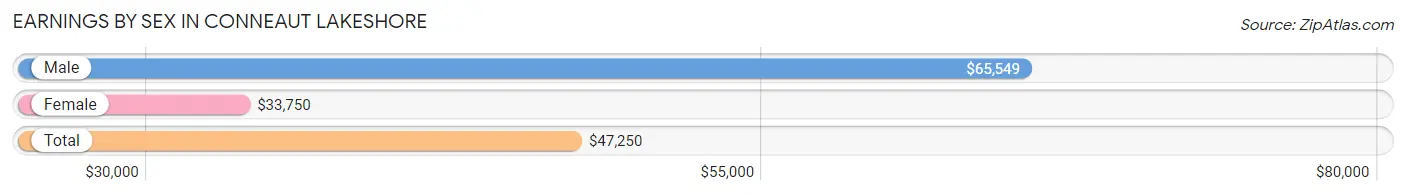
Earnings by Sex in Conneaut Lakeshore
Average Earnings in Conneaut Lakeshore are $47,250, $65,549 for men and $33,750 for women, a difference of 48.5%.
| Sex | Number | Average Earnings |
| Male | 468 (48.3%) | $65,549 |
| Female | 501 (51.7%) | $33,750 |
| Total | 969 (100.0%) | $47,250 |
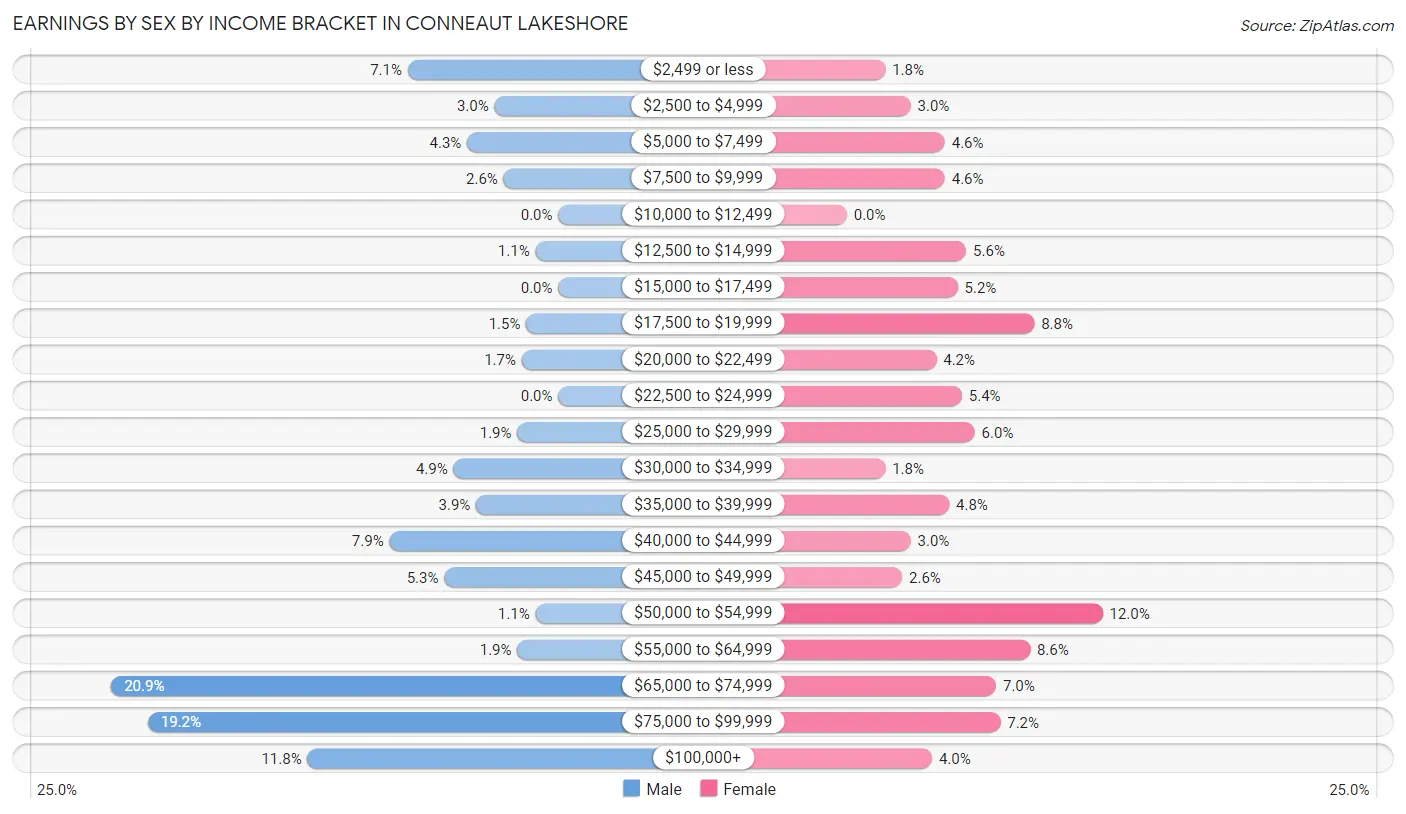
Earnings by Sex by Income Bracket in Conneaut Lakeshore
The most common earnings brackets in Conneaut Lakeshore are $65,000 to $74,999 for men (98 | 20.9%) and $50,000 to $54,999 for women (60 | 12.0%).
| Income | Male | Female |
| $2,499 or less | 33 (7.0%) | 9 (1.8%) |
| $2,500 to $4,999 | 14 (3.0%) | 15 (3.0%) |
| $5,000 to $7,499 | 20 (4.3%) | 23 (4.6%) |
| $7,500 to $9,999 | 12 (2.6%) | 23 (4.6%) |
| $10,000 to $12,499 | 0 (0.0%) | 0 (0.0%) |
| $12,500 to $14,999 | 5 (1.1%) | 28 (5.6%) |
| $15,000 to $17,499 | 0 (0.0%) | 26 (5.2%) |
| $17,500 to $19,999 | 7 (1.5%) | 44 (8.8%) |
| $20,000 to $22,499 | 8 (1.7%) | 21 (4.2%) |
| $22,500 to $24,999 | 0 (0.0%) | 27 (5.4%) |
| $25,000 to $29,999 | 9 (1.9%) | 30 (6.0%) |
| $30,000 to $34,999 | 23 (4.9%) | 9 (1.8%) |
| $35,000 to $39,999 | 18 (3.8%) | 24 (4.8%) |
| $40,000 to $44,999 | 37 (7.9%) | 15 (3.0%) |
| $45,000 to $49,999 | 25 (5.3%) | 13 (2.6%) |
| $50,000 to $54,999 | 5 (1.1%) | 60 (12.0%) |
| $55,000 to $64,999 | 9 (1.9%) | 43 (8.6%) |
| $65,000 to $74,999 | 98 (20.9%) | 35 (7.0%) |
| $75,000 to $99,999 | 90 (19.2%) | 36 (7.2%) |
| $100,000+ | 55 (11.7%) | 20 (4.0%) |
| Total | 468 (100.0%) | 501 (100.0%) |
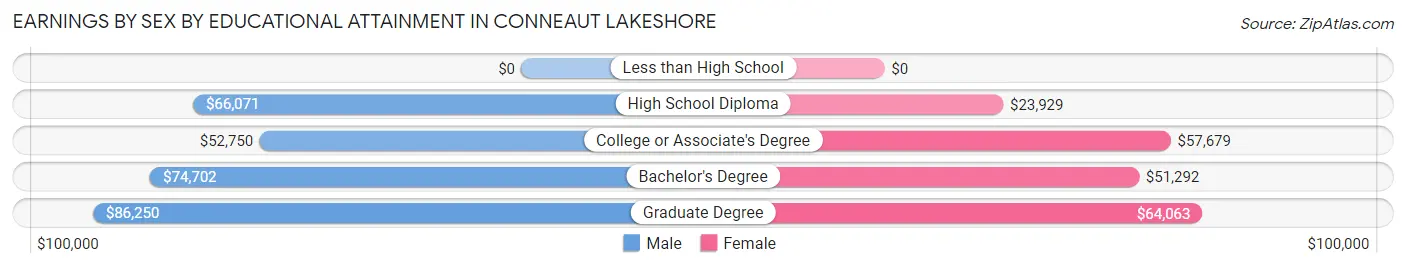
Earnings by Sex by Educational Attainment in Conneaut Lakeshore
Average earnings in Conneaut Lakeshore are $66,921 for men and $40,167 for women, a difference of 40.0%. Men with an educational attainment of graduate degree enjoy the highest average annual earnings of $86,250, while those with college or associate's degree education earn the least with $52,750. Women with an educational attainment of graduate degree earn the most with the average annual earnings of $64,063, while those with high school diploma education have the smallest earnings of $23,929.
| Educational Attainment | Male Income | Female Income |
| Less than High School | - | - |
| High School Diploma | $66,071 | $23,929 |
| College or Associate's Degree | $52,750 | $57,679 |
| Bachelor's Degree | $74,702 | $51,292 |
| Graduate Degree | $86,250 | $64,063 |
| Total | $66,921 | $40,167 |
Family Income in Conneaut Lakeshore
Family Income Brackets in Conneaut Lakeshore
According to the Conneaut Lakeshore family income data, there are 176 families falling into the $75,000 to $99,999 income range, which is the most common income bracket and makes up 32.8% of all families.
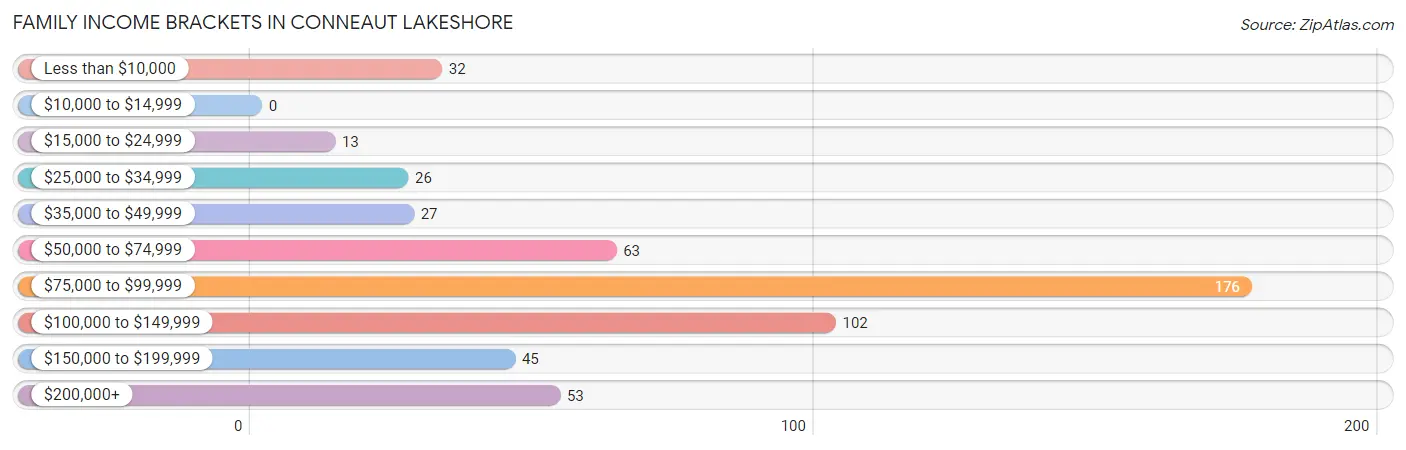
| Income Bracket | # Families | % Families |
| Less than $10,000 | 32 | 6.0% |
| $10,000 to $14,999 | 0 | 0.0% |
| $15,000 to $24,999 | 13 | 2.4% |
| $25,000 to $34,999 | 26 | 4.8% |
| $35,000 to $49,999 | 27 | 5.0% |
| $50,000 to $74,999 | 63 | 11.7% |
| $75,000 to $99,999 | 176 | 32.8% |
| $100,000 to $149,999 | 102 | 19.0% |
| $150,000 to $199,999 | 45 | 8.4% |
| $200,000+ | 53 | 9.9% |
Family Income by Famaliy Size in Conneaut Lakeshore
3-person families (156 | 29.0%) account for the highest median family income in Conneaut Lakeshore with $102,273 per family, while 2-person families (336 | 62.6%) have the highest median income of $41,250 per family member.
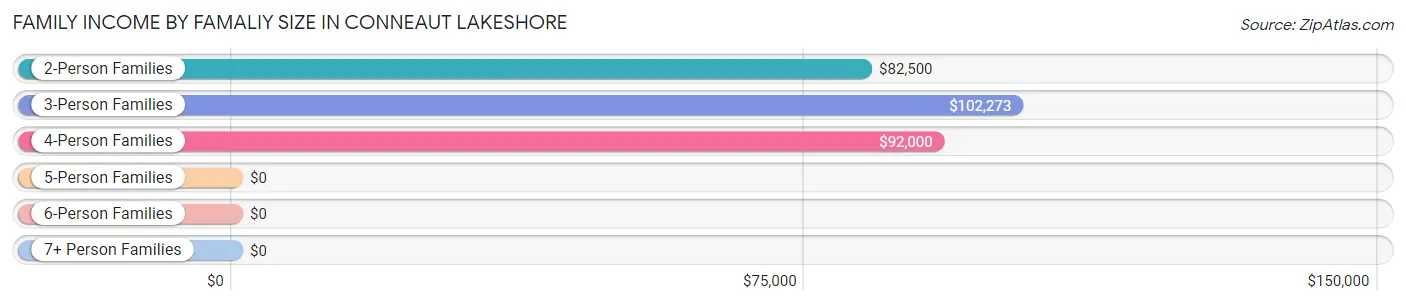
| Income Bracket | # Families | Median Income |
| 2-Person Families | 336 (62.6%) | $82,500 |
| 3-Person Families | 156 (29.0%) | $102,273 |
| 4-Person Families | 38 (7.1%) | $92,000 |
| 5-Person Families | 0 (0.0%) | $0 |
| 6-Person Families | 7 (1.3%) | $0 |
| 7+ Person Families | 0 (0.0%) | $0 |
| Total | 537 (100.0%) | $93,299 |
Family Income by Number of Earners in Conneaut Lakeshore
The median family income in Conneaut Lakeshore is $93,299, with families comprising 3+ earners (41) having the highest median family income of $175,662, while families with no earners (153) have the lowest median family income of $75,664, accounting for 7.6% and 28.5% of families, respectively.
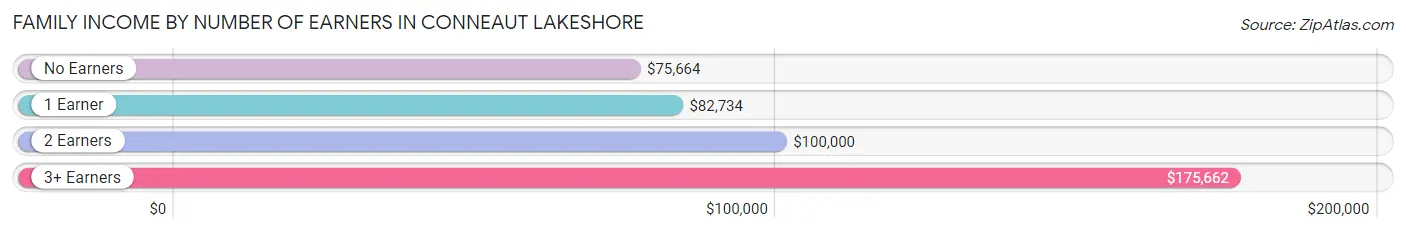
| Number of Earners | # Families | Median Income |
| No Earners | 153 (28.5%) | $75,664 |
| 1 Earner | 145 (27.0%) | $82,734 |
| 2 Earners | 198 (36.9%) | $100,000 |
| 3+ Earners | 41 (7.6%) | $175,662 |
| Total | 537 (100.0%) | $93,299 |
Household Income in Conneaut Lakeshore
Household Income Brackets in Conneaut Lakeshore
With 233 households falling in the category, the $75,000 to $99,999 income range is the most frequent in Conneaut Lakeshore, accounting for 23.6% of all households. In contrast, only 28 households (2.8%) fall into the $150,000 to $199,999 income bracket, making it the least populous group.
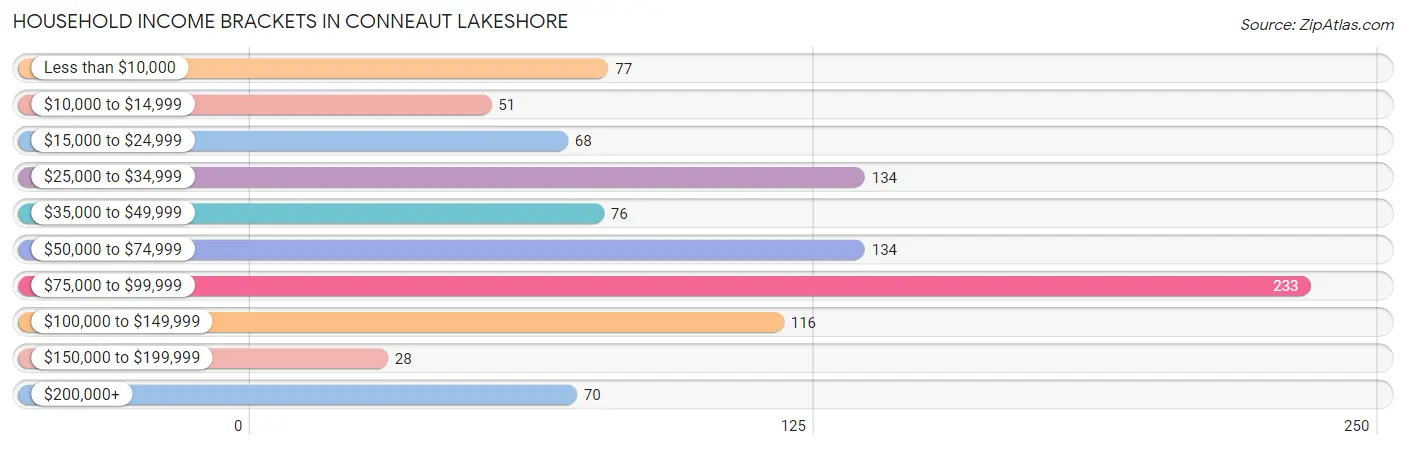
| Income Bracket | # Households | % Households |
| Less than $10,000 | 77 | 7.8% |
| $10,000 to $14,999 | 51 | 5.2% |
| $15,000 to $24,999 | 68 | 6.9% |
| $25,000 to $34,999 | 134 | 13.6% |
| $35,000 to $49,999 | 76 | 7.7% |
| $50,000 to $74,999 | 134 | 13.6% |
| $75,000 to $99,999 | 233 | 23.6% |
| $100,000 to $149,999 | 116 | 11.8% |
| $150,000 to $199,999 | 28 | 2.8% |
| $200,000+ | 70 | 7.1% |
Household Income by Householder Age in Conneaut Lakeshore
The median household income in Conneaut Lakeshore is $67,063, with the highest median household income of $74,167 found in the 25 to 44 years age bracket for the primary householder. A total of 168 households (17.0%) fall into this category. Meanwhile, the 15 to 24 years age bracket for the primary householder has the lowest median household income of $0, with 19 households (1.9%) in this group.
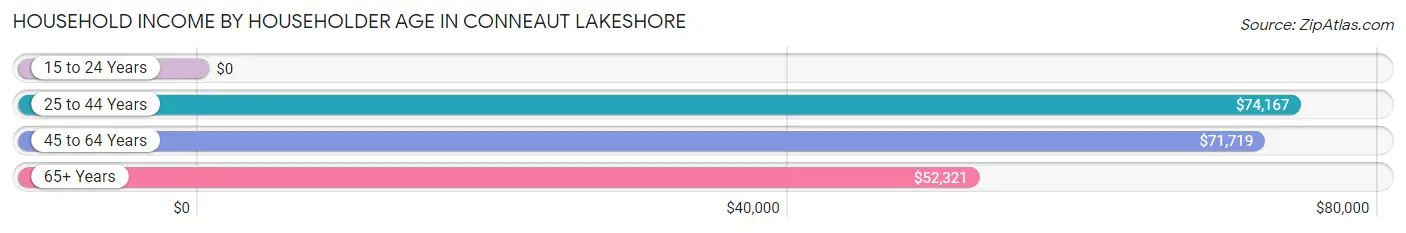
| Income Bracket | # Households | Median Income |
| 15 to 24 Years | 19 (1.9%) | $0 |
| 25 to 44 Years | 168 (17.0%) | $74,167 |
| 45 to 64 Years | 443 (44.9%) | $71,719 |
| 65+ Years | 357 (36.2%) | $52,321 |
| Total | 987 (100.0%) | $67,063 |
Poverty in Conneaut Lakeshore
Income Below Poverty by Sex and Age in Conneaut Lakeshore
With 9.5% poverty level for males and 16.1% for females among the residents of Conneaut Lakeshore, 18 to 24 year old males and 6 to 11 year old females are the most vulnerable to poverty, with 14 males (35.9%) and 13 females (30.2%) in their respective age groups living below the poverty level.
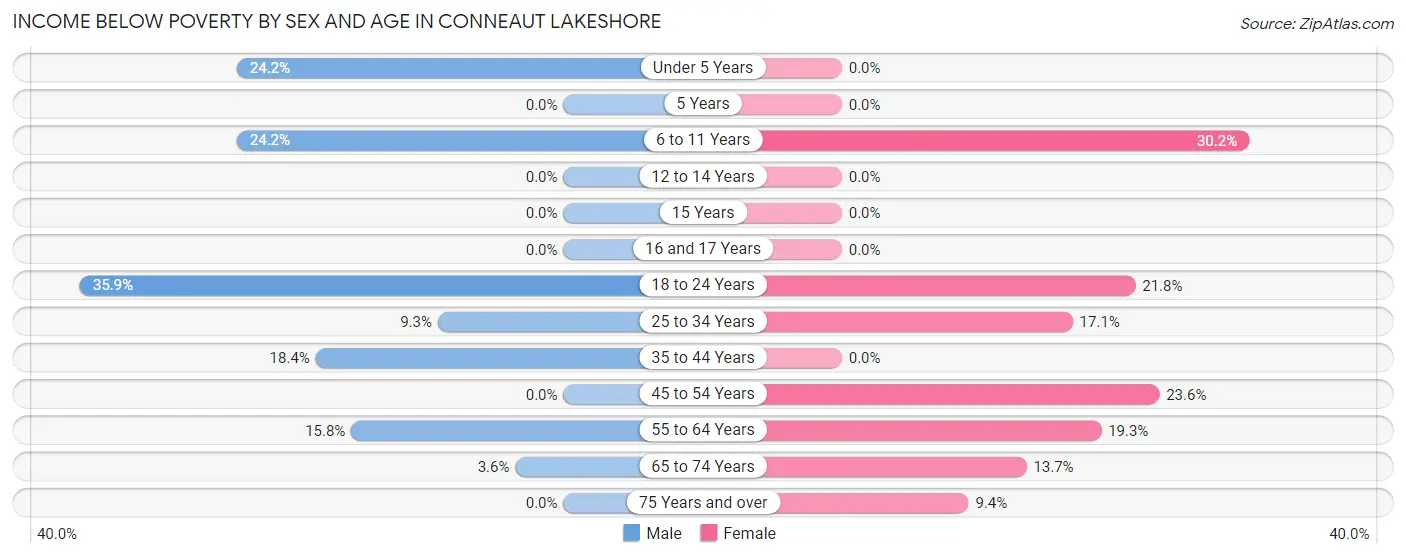
| Age Bracket | Male | Female |
| Under 5 Years | 8 (24.2%) | 0 (0.0%) |
| 5 Years | 0 (0.0%) | 0 (0.0%) |
| 6 to 11 Years | 8 (24.2%) | 13 (30.2%) |
| 12 to 14 Years | 0 (0.0%) | 0 (0.0%) |
| 15 Years | 0 (0.0%) | 0 (0.0%) |
| 16 and 17 Years | 0 (0.0%) | 0 (0.0%) |
| 18 to 24 Years | 14 (35.9%) | 17 (21.8%) |
| 25 to 34 Years | 11 (9.3%) | 12 (17.1%) |
| 35 to 44 Years | 16 (18.4%) | 0 (0.0%) |
| 45 to 54 Years | 0 (0.0%) | 37 (23.6%) |
| 55 to 64 Years | 23 (15.8%) | 52 (19.3%) |
| 65 to 74 Years | 6 (3.6%) | 27 (13.7%) |
| 75 Years and over | 0 (0.0%) | 8 (9.4%) |
| Total | 86 (9.5%) | 166 (16.1%) |
Income Above Poverty by Sex and Age in Conneaut Lakeshore
According to the poverty statistics in Conneaut Lakeshore, males aged 12 to 14 years and females aged under 5 years are the age groups that are most secure financially, with 100.0% of males and 100.0% of females in these age groups living above the poverty line.
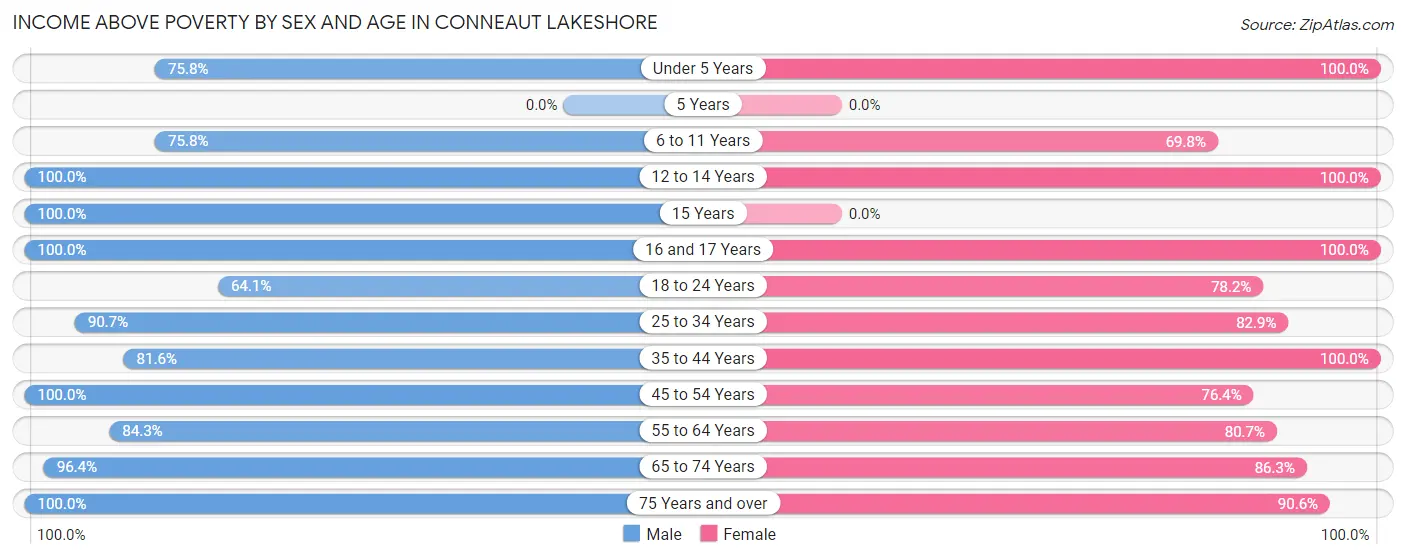
| Age Bracket | Male | Female |
| Under 5 Years | 25 (75.8%) | 24 (100.0%) |
| 5 Years | 0 (0.0%) | 0 (0.0%) |
| 6 to 11 Years | 25 (75.8%) | 30 (69.8%) |
| 12 to 14 Years | 24 (100.0%) | 16 (100.0%) |
| 15 Years | 10 (100.0%) | 0 (0.0%) |
| 16 and 17 Years | 6 (100.0%) | 19 (100.0%) |
| 18 to 24 Years | 25 (64.1%) | 61 (78.2%) |
| 25 to 34 Years | 107 (90.7%) | 58 (82.9%) |
| 35 to 44 Years | 71 (81.6%) | 73 (100.0%) |
| 45 to 54 Years | 121 (100.0%) | 120 (76.4%) |
| 55 to 64 Years | 123 (84.3%) | 218 (80.7%) |
| 65 to 74 Years | 162 (96.4%) | 170 (86.3%) |
| 75 Years and over | 116 (100.0%) | 77 (90.6%) |
| Total | 815 (90.5%) | 866 (83.9%) |
Income Below Poverty Among Married-Couple Families in Conneaut Lakeshore
The poverty statistics for married-couple families in Conneaut Lakeshore show that 5.8% or 26 of the total 450 families live below the poverty line. Families with no children have the highest poverty rate of 6.2%, comprising of 21 families. On the other hand, families with 3 or 4 children have the lowest poverty rate of 0.0%, which includes 0 families.
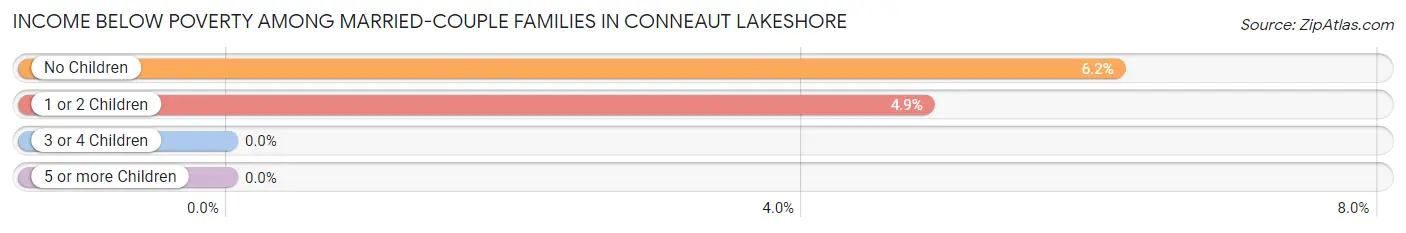
| Children | Above Poverty | Below Poverty |
| No Children | 319 (93.8%) | 21 (6.2%) |
| 1 or 2 Children | 98 (95.2%) | 5 (4.9%) |
| 3 or 4 Children | 7 (100.0%) | 0 (0.0%) |
| 5 or more Children | 0 (0.0%) | 0 (0.0%) |
| Total | 424 (94.2%) | 26 (5.8%) |
Income Below Poverty Among Single-Parent Households in Conneaut Lakeshore
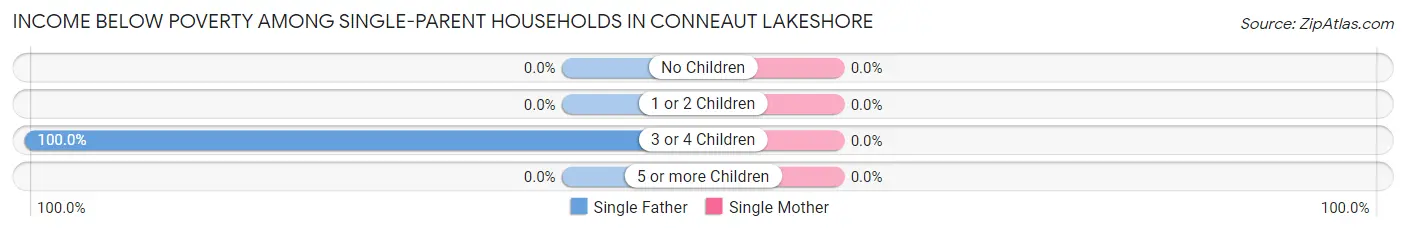
| Children | Single Father | Single Mother |
| No Children | 0 (0.0%) | 0 (0.0%) |
| 1 or 2 Children | 0 (0.0%) | 0 (0.0%) |
| 3 or 4 Children | 6 (100.0%) | 0 (0.0%) |
| 5 or more Children | 0 (0.0%) | 0 (0.0%) |
| Total | 6 (42.9%) | 0 (0.0%) |
Income Below Poverty Among Married-Couple vs Single-Parent Households in Conneaut Lakeshore
The poverty data for Conneaut Lakeshore shows that 26 of the married-couple family households (5.8%) and 6 of the single-parent households (6.9%) are living below the poverty level. Within the married-couple family households, those with no children have the highest poverty rate, with 21 households (6.2%) falling below the poverty line. Among the single-parent households, those with 3 or 4 children have the highest poverty rate, with 6 household (100.0%) living below poverty.
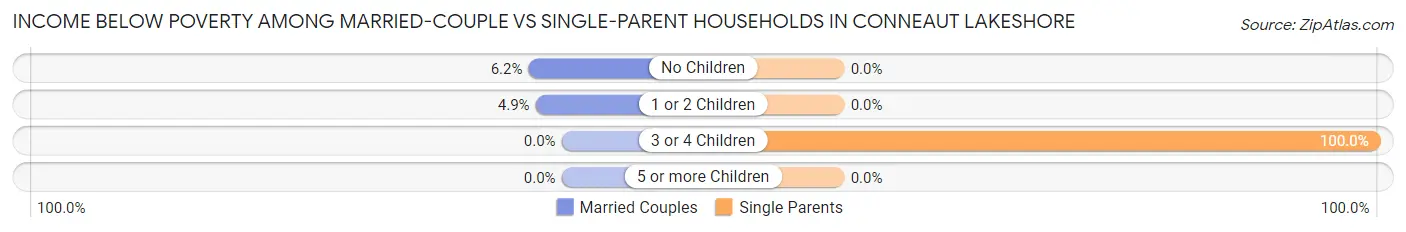
| Children | Married-Couple Families | Single-Parent Households |
| No Children | 21 (6.2%) | 0 (0.0%) |
| 1 or 2 Children | 5 (4.9%) | 0 (0.0%) |
| 3 or 4 Children | 0 (0.0%) | 6 (100.0%) |
| 5 or more Children | 0 (0.0%) | 0 (0.0%) |
| Total | 26 (5.8%) | 6 (6.9%) |
Race in Conneaut Lakeshore
The most populous races in Conneaut Lakeshore are White / Caucasian (1,921 | 99.4%), Two or more Races (10 | 0.5%), and Hispanic or Latino (9 | 0.5%).
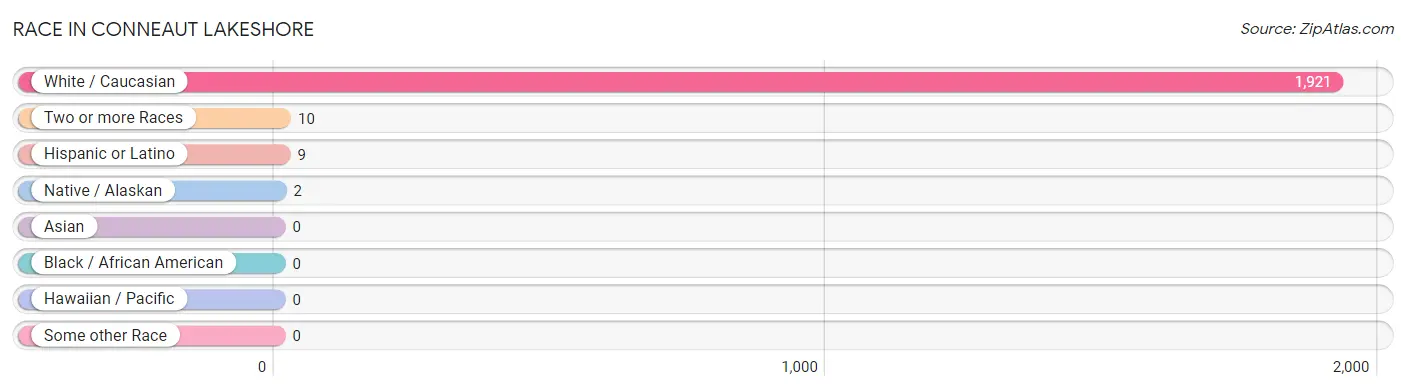
| Race | # Population | % Population |
| Asian | 0 | 0.0% |
| Black / African American | 0 | 0.0% |
| Hawaiian / Pacific | 0 | 0.0% |
| Hispanic or Latino | 9 | 0.5% |
| Native / Alaskan | 2 | 0.1% |
| White / Caucasian | 1,921 | 99.4% |
| Two or more Races | 10 | 0.5% |
| Some other Race | 0 | 0.0% |
| Total | 1,933 | 100.0% |
Ancestry in Conneaut Lakeshore
The most populous ancestries reported in Conneaut Lakeshore are German (554 | 28.7%), Irish (369 | 19.1%), English (365 | 18.9%), American (195 | 10.1%), and Italian (131 | 6.8%), together accounting for 83.5% of all Conneaut Lakeshore residents.
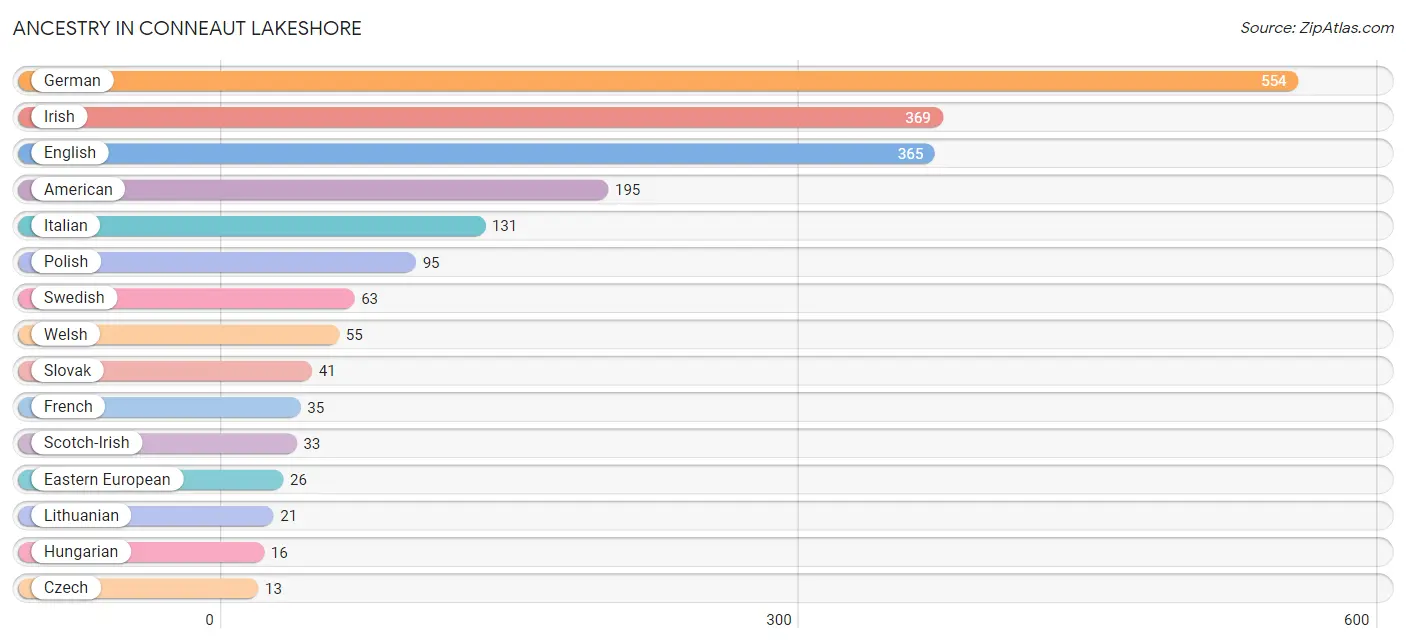
| Ancestry | # Population | % Population |
| Albanian | 9 | 0.5% |
| American | 195 | 10.1% |
| Arab | 5 | 0.3% |
| Canadian | 7 | 0.4% |
| Croatian | 4 | 0.2% |
| Czech | 13 | 0.7% |
| Dutch | 10 | 0.5% |
| Eastern European | 26 | 1.3% |
| English | 365 | 18.9% |
| European | 13 | 0.7% |
| French | 35 | 1.8% |
| German | 554 | 28.7% |
| Hungarian | 16 | 0.8% |
| Irish | 369 | 19.1% |
| Italian | 131 | 6.8% |
| Lebanese | 5 | 0.3% |
| Lithuanian | 21 | 1.1% |
| Norwegian | 9 | 0.5% |
| Polish | 95 | 4.9% |
| Puerto Rican | 9 | 0.5% |
| Russian | 10 | 0.5% |
| Scotch-Irish | 33 | 1.7% |
| Scottish | 9 | 0.5% |
| Serbian | 7 | 0.4% |
| Slovak | 41 | 2.1% |
| Swedish | 63 | 3.3% |
| Welsh | 55 | 2.9% | View All 27 Rows |
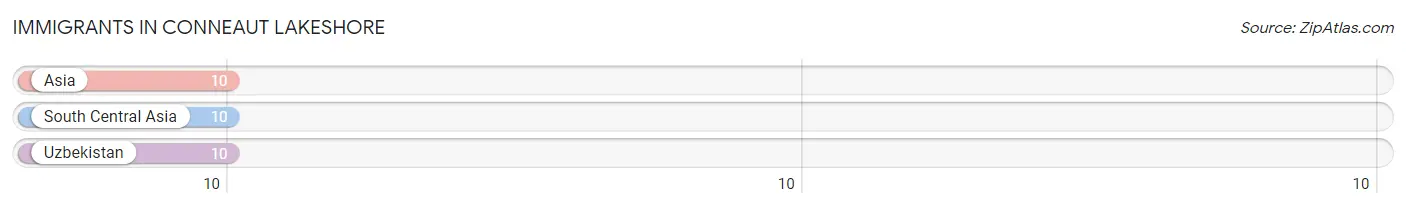
Immigrants in Conneaut Lakeshore
The most numerous immigrant groups reported in Conneaut Lakeshore came from Asia (10 | 0.5%), South Central Asia (10 | 0.5%), and Uzbekistan (10 | 0.5%), together accounting for 1.6% of all Conneaut Lakeshore residents.
| Immigration Origin | # Population | % Population |
| Asia | 10 | 0.5% |
| South Central Asia | 10 | 0.5% |
| Uzbekistan | 10 | 0.5% | View All 3 Rows |
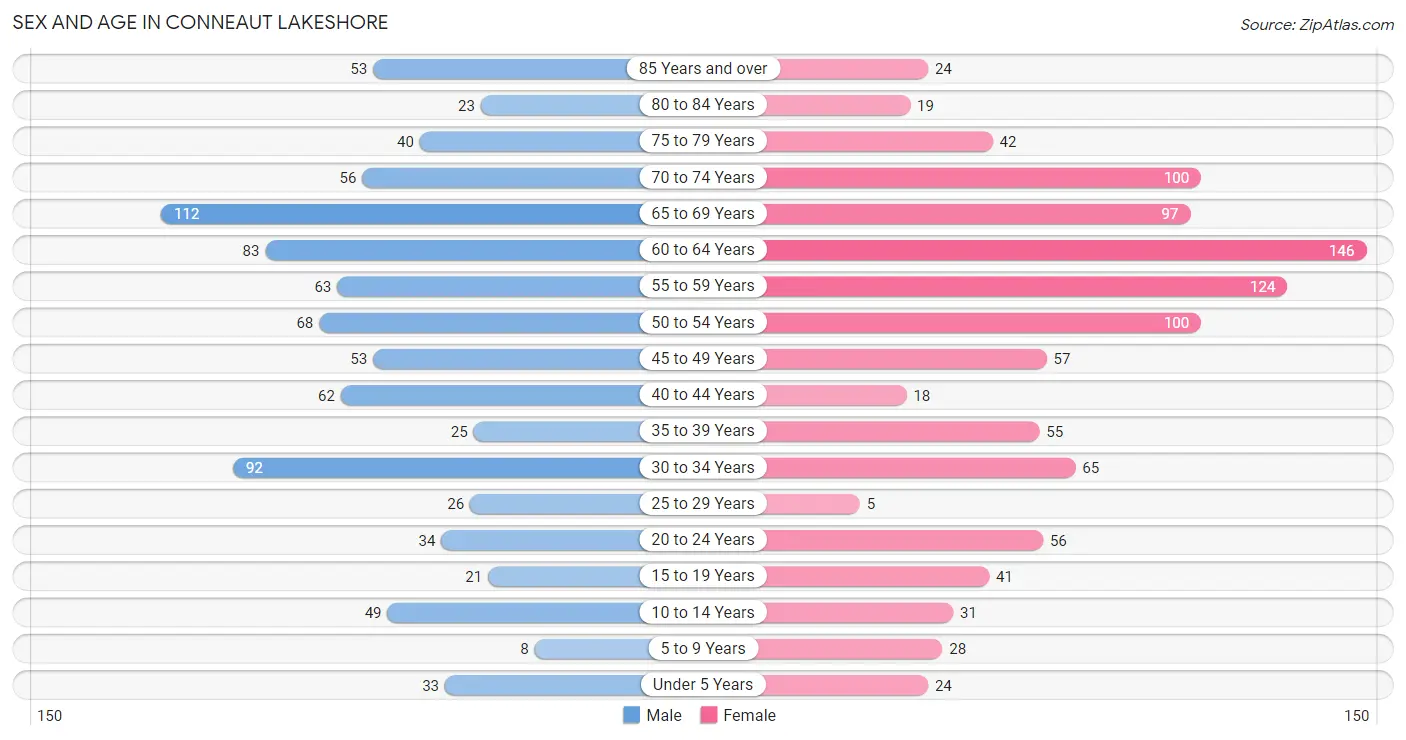
Sex and Age in Conneaut Lakeshore
Sex and Age in Conneaut Lakeshore
The most populous age groups in Conneaut Lakeshore are 65 to 69 Years (112 | 12.4%) for men and 60 to 64 Years (146 | 14.1%) for women.
| Age Bracket | Male | Female |
| Under 5 Years | 33 (3.7%) | 24 (2.3%) |
| 5 to 9 Years | 8 (0.9%) | 28 (2.7%) |
| 10 to 14 Years | 49 (5.4%) | 31 (3.0%) |
| 15 to 19 Years | 21 (2.3%) | 41 (4.0%) |
| 20 to 24 Years | 34 (3.8%) | 56 (5.4%) |
| 25 to 29 Years | 26 (2.9%) | 5 (0.5%) |
| 30 to 34 Years | 92 (10.2%) | 65 (6.3%) |
| 35 to 39 Years | 25 (2.8%) | 55 (5.3%) |
| 40 to 44 Years | 62 (6.9%) | 18 (1.7%) |
| 45 to 49 Years | 53 (5.9%) | 57 (5.5%) |
| 50 to 54 Years | 68 (7.5%) | 100 (9.7%) |
| 55 to 59 Years | 63 (7.0%) | 124 (12.0%) |
| 60 to 64 Years | 83 (9.2%) | 146 (14.1%) |
| 65 to 69 Years | 112 (12.4%) | 97 (9.4%) |
| 70 to 74 Years | 56 (6.2%) | 100 (9.7%) |
| 75 to 79 Years | 40 (4.4%) | 42 (4.1%) |
| 80 to 84 Years | 23 (2.5%) | 19 (1.8%) |
| 85 Years and over | 53 (5.9%) | 24 (2.3%) |
| Total | 901 (100.0%) | 1,032 (100.0%) |
Families and Households in Conneaut Lakeshore
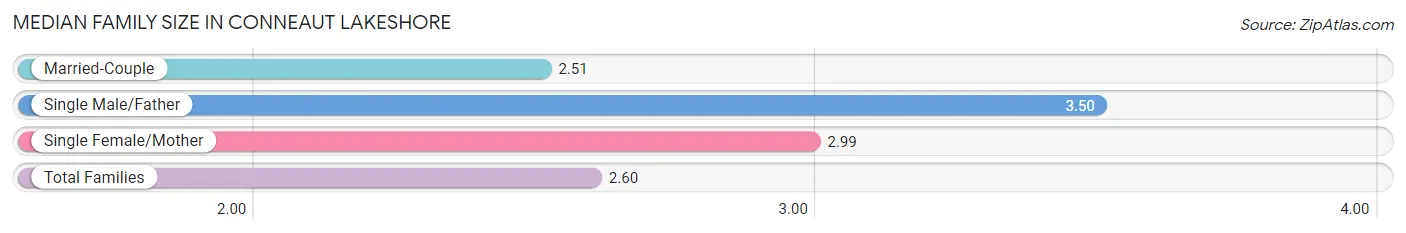
Median Family Size in Conneaut Lakeshore
The median family size in Conneaut Lakeshore is 2.60 persons per family, with single male/father families (14 | 2.6%) accounting for the largest median family size of 3.5 persons per family. On the other hand, married-couple families (450 | 83.8%) represent the smallest median family size with 2.51 persons per family.
| Family Type | # Families | Family Size |
| Married-Couple | 450 (83.8%) | 2.51 |
| Single Male/Father | 14 (2.6%) | 3.50 |
| Single Female/Mother | 73 (13.6%) | 2.99 |
| Total Families | 537 (100.0%) | 2.60 |
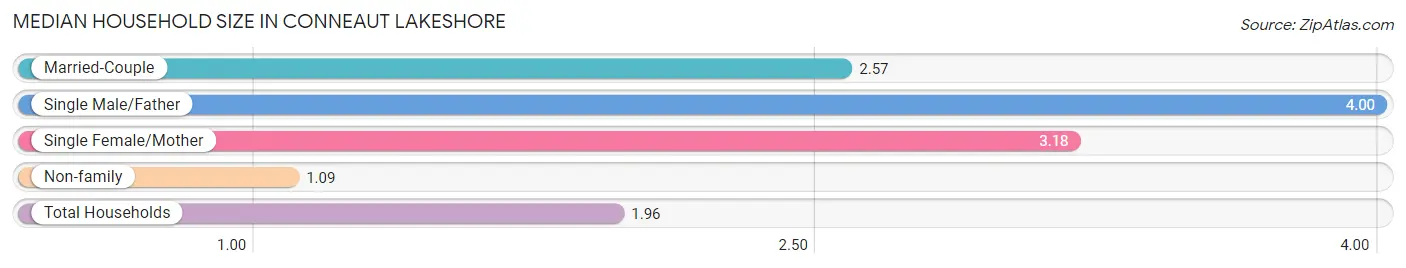
Median Household Size in Conneaut Lakeshore
The median household size in Conneaut Lakeshore is 1.96 persons per household, with single male/father households (14 | 1.4%) accounting for the largest median household size of 4 persons per household. non-family households (450 | 45.6%) represent the smallest median household size with 1.09 persons per household.
| Household Type | # Households | Household Size |
| Married-Couple | 450 (45.6%) | 2.57 |
| Single Male/Father | 14 (1.4%) | 4.00 |
| Single Female/Mother | 73 (7.4%) | 3.18 |
| Non-family | 450 (45.6%) | 1.09 |
| Total Households | 987 (100.0%) | 1.96 |
Household Size by Marriage Status in Conneaut Lakeshore
Out of a total of 987 households in Conneaut Lakeshore, 537 (54.4%) are family households, while 450 (45.6%) are nonfamily households. The most numerous type of family households are 2-person households, comprising 336, and the most common type of nonfamily households are 1-person households, comprising 401.
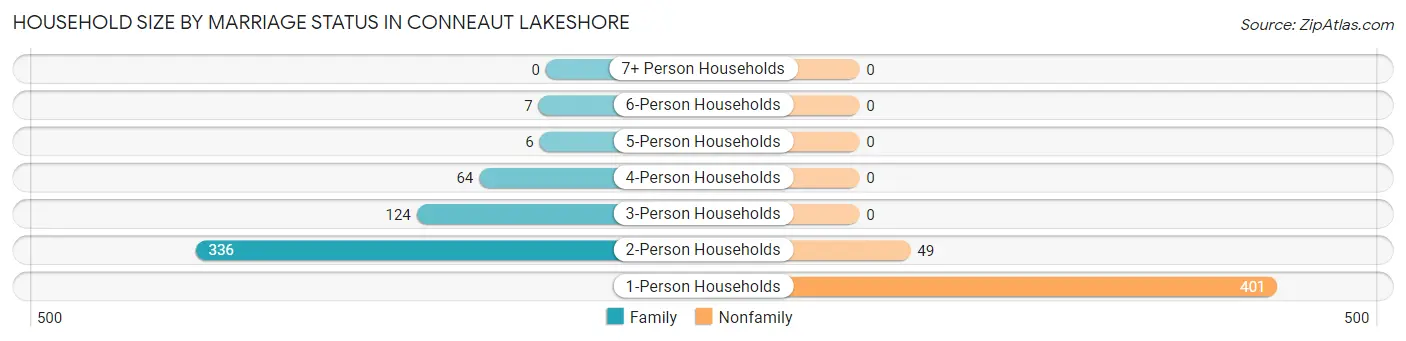
| Household Size | Family Households | Nonfamily Households |
| 1-Person Households | - | 401 (40.6%) |
| 2-Person Households | 336 (34.0%) | 49 (5.0%) |
| 3-Person Households | 124 (12.6%) | 0 (0.0%) |
| 4-Person Households | 64 (6.5%) | 0 (0.0%) |
| 5-Person Households | 6 (0.6%) | 0 (0.0%) |
| 6-Person Households | 7 (0.7%) | 0 (0.0%) |
| 7+ Person Households | 0 (0.0%) | 0 (0.0%) |
| Total | 537 (54.4%) | 450 (45.6%) |
Female Fertility in Conneaut Lakeshore
Fertility by Age in Conneaut Lakeshore
Average fertility rate in Conneaut Lakeshore is 30.0 births per 1,000 women. Women in the age bracket of 15 to 19 years have the highest fertility rate with 220.0 births per 1,000 women. Women in the age bracket of 15 to 19 years acount for 100.0% of all women with births.
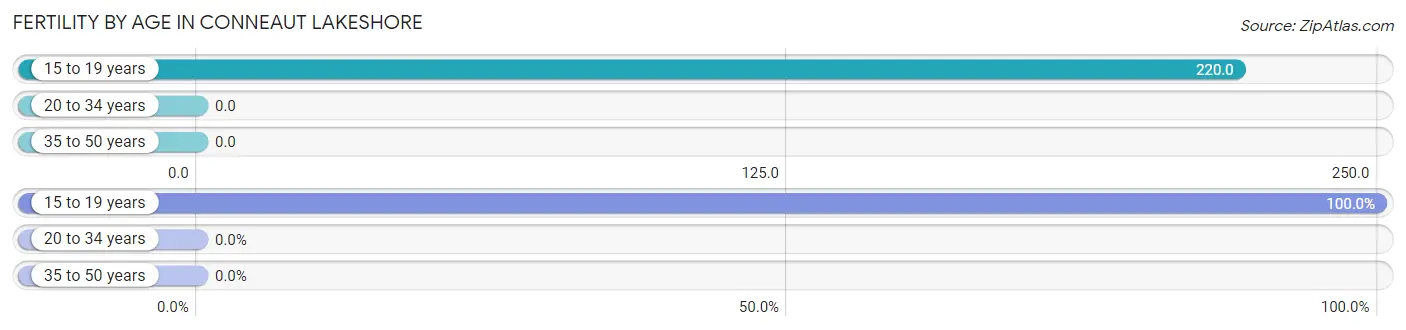
| Age Bracket | Women with Births | Births / 1,000 Women |
| 15 to 19 years | 9 (100.0%) | 220.0 |
| 20 to 34 years | 0 (0.0%) | 0.0 |
| 35 to 50 years | 0 (0.0%) | 0.0 |
| Total | 9 (100.0%) | 30.0 |
Fertility by Age by Marriage Status in Conneaut Lakeshore
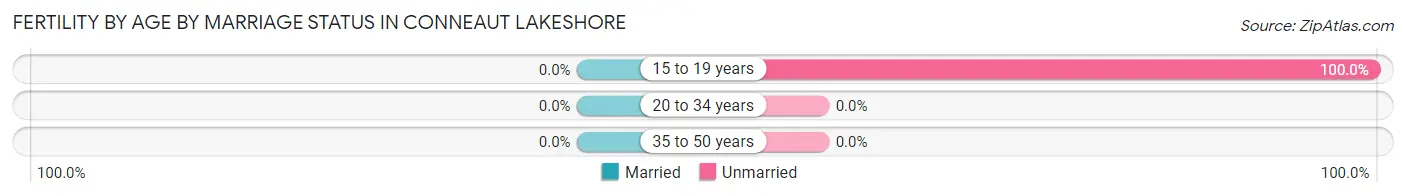
| Age Bracket | Married | Unmarried |
| 15 to 19 years | 0 (0.0%) | 9 (100.0%) |
| 20 to 34 years | 0 (0.0%) | 0 (0.0%) |
| 35 to 50 years | 0 (0.0%) | 0 (0.0%) |
| Total | 0 (0.0%) | 9 (100.0%) |
Fertility by Education in Conneaut Lakeshore
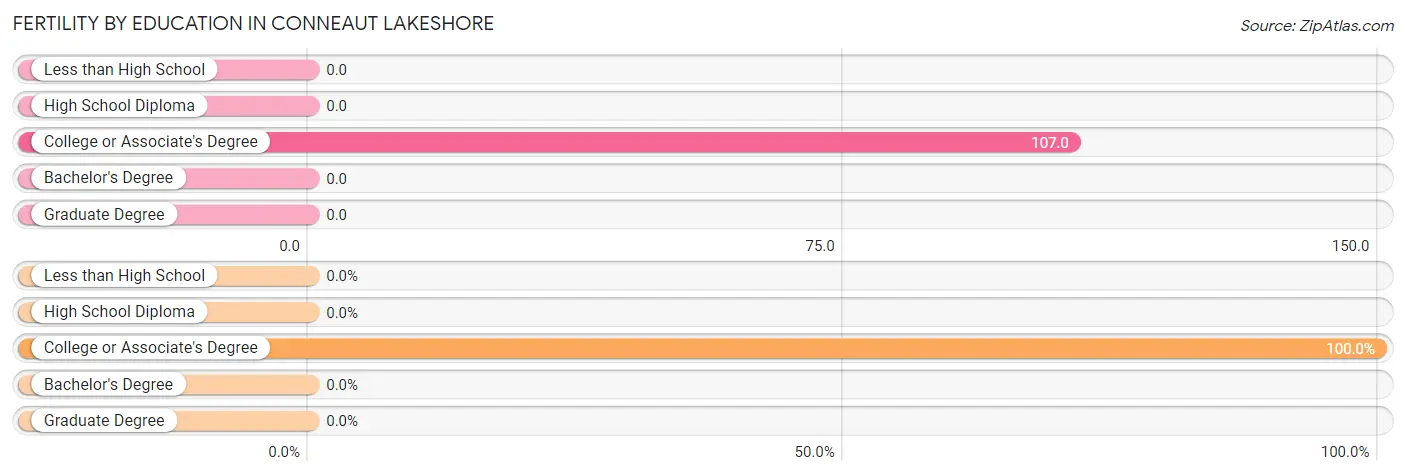
| Educational Attainment | Women with Births | Births / 1,000 Women |
| Less than High School | 0 (0.0%) | 0.0 |
| High School Diploma | 0 (0.0%) | 0.0 |
| College or Associate's Degree | 9 (100.0%) | 107.0 |
| Bachelor's Degree | 0 (0.0%) | 0.0 |
| Graduate Degree | 0 (0.0%) | 0.0 |
| Total | 9 (100.0%) | 30.0 |
Fertility by Education by Marriage Status in Conneaut Lakeshore
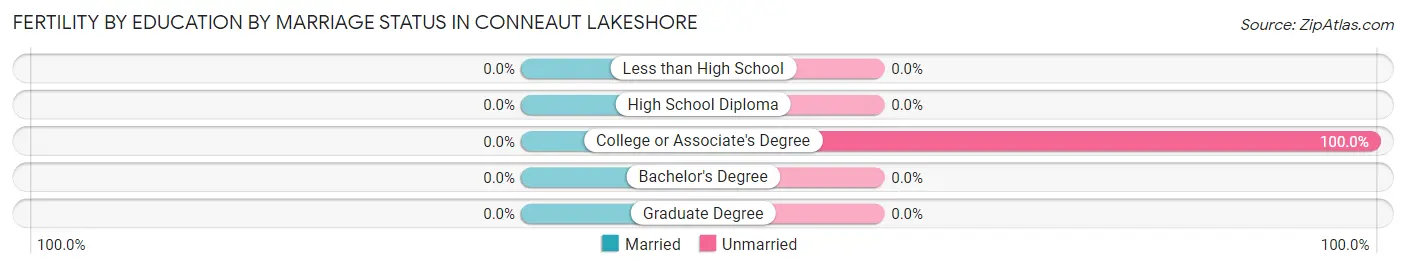
| Educational Attainment | Married | Unmarried |
| Less than High School | 0 (0.0%) | 0 (0.0%) |
| High School Diploma | 0 (0.0%) | 0 (0.0%) |
| College or Associate's Degree | 0 (0.0%) | 9 (100.0%) |
| Bachelor's Degree | 0 (0.0%) | 0 (0.0%) |
| Graduate Degree | 0 (0.0%) | 0 (0.0%) |
| Total | 0 (0.0%) | 9 (100.0%) |
Employment Characteristics in Conneaut Lakeshore
Employment by Class of Employer in Conneaut Lakeshore
Among the 813 employed individuals in Conneaut Lakeshore, private company employees (484 | 59.5%), local government employees (94 | 11.6%), and state government employees (84 | 10.3%) make up the most common classes of employment.
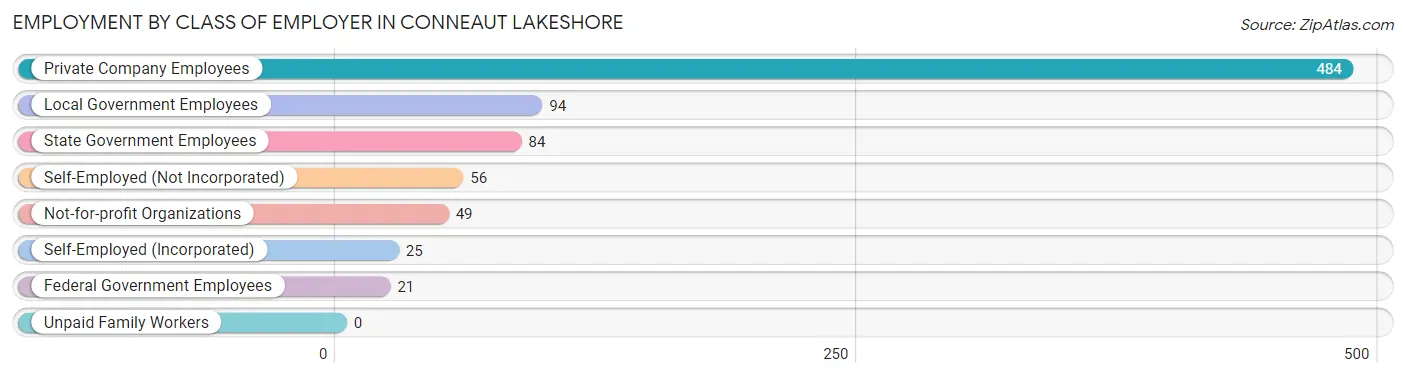
| Employer Class | # Employees | % Employees |
| Private Company Employees | 484 | 59.5% |
| Self-Employed (Incorporated) | 25 | 3.1% |
| Self-Employed (Not Incorporated) | 56 | 6.9% |
| Not-for-profit Organizations | 49 | 6.0% |
| Local Government Employees | 94 | 11.6% |
| State Government Employees | 84 | 10.3% |
| Federal Government Employees | 21 | 2.6% |
| Unpaid Family Workers | 0 | 0.0% |
| Total | 813 | 100.0% |
Employment Status by Age in Conneaut Lakeshore
According to the labor force statistics for Conneaut Lakeshore, out of the total population over 16 years of age (1,750), 49.1% or 859 individuals are in the labor force, with 5.5% or 47 of them unemployed. The age group with the highest labor force participation rate is 35 to 44 years, with 83.1% or 133 individuals in the labor force. Within the labor force, the 20 to 24 years age range has the highest percentage of unemployed individuals, with 28.0% or 14 of them being unemployed.
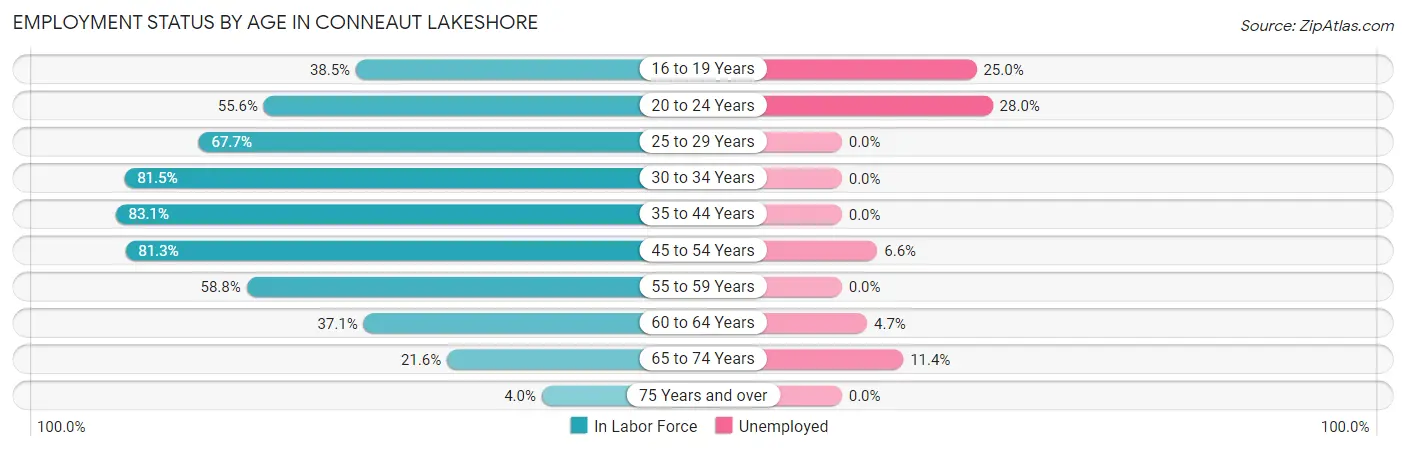
| Age Bracket | In Labor Force | Unemployed |
| 16 to 19 Years | 20 (38.5%) | 5 (25.0%) |
| 20 to 24 Years | 50 (55.6%) | 14 (28.0%) |
| 25 to 29 Years | 21 (67.7%) | 0 (0.0%) |
| 30 to 34 Years | 128 (81.5%) | 0 (0.0%) |
| 35 to 44 Years | 133 (83.1%) | 0 (0.0%) |
| 45 to 54 Years | 226 (81.3%) | 15 (6.6%) |
| 55 to 59 Years | 110 (58.8%) | 0 (0.0%) |
| 60 to 64 Years | 85 (37.1%) | 4 (4.7%) |
| 65 to 74 Years | 79 (21.6%) | 9 (11.4%) |
| 75 Years and over | 8 (4.0%) | 0 (0.0%) |
| Total | 859 (49.1%) | 47 (5.5%) |
Employment Status by Educational Attainment in Conneaut Lakeshore
According to labor force statistics for Conneaut Lakeshore, 67.5% of individuals (703) out of the total population between 25 and 64 years of age (1,042) are in the labor force, with 2.7% or 19 of them being unemployed. The group with the highest labor force participation rate are those with the educational attainment of college / associate degree, with 77.3% or 153 individuals in the labor force. Within the labor force, individuals with high school diploma education have the highest percentage of unemployment, with 8.2% or 19 of them being unemployed.
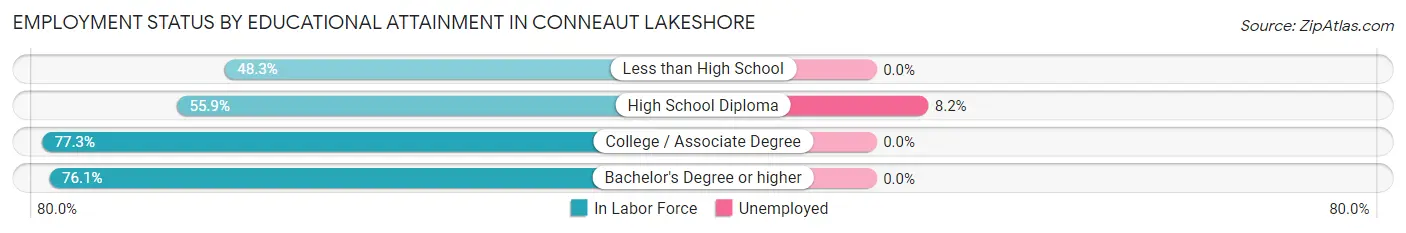
| Educational Attainment | In Labor Force | Unemployed |
| Less than High School | 14 (48.3%) | 0 (0.0%) |
| High School Diploma | 233 (55.9%) | 34 (8.2%) |
| College / Associate Degree | 153 (77.3%) | 0 (0.0%) |
| Bachelor's Degree or higher | 303 (76.1%) | 0 (0.0%) |
| Total | 703 (67.5%) | 28 (2.7%) |
Employment Occupations by Sex in Conneaut Lakeshore
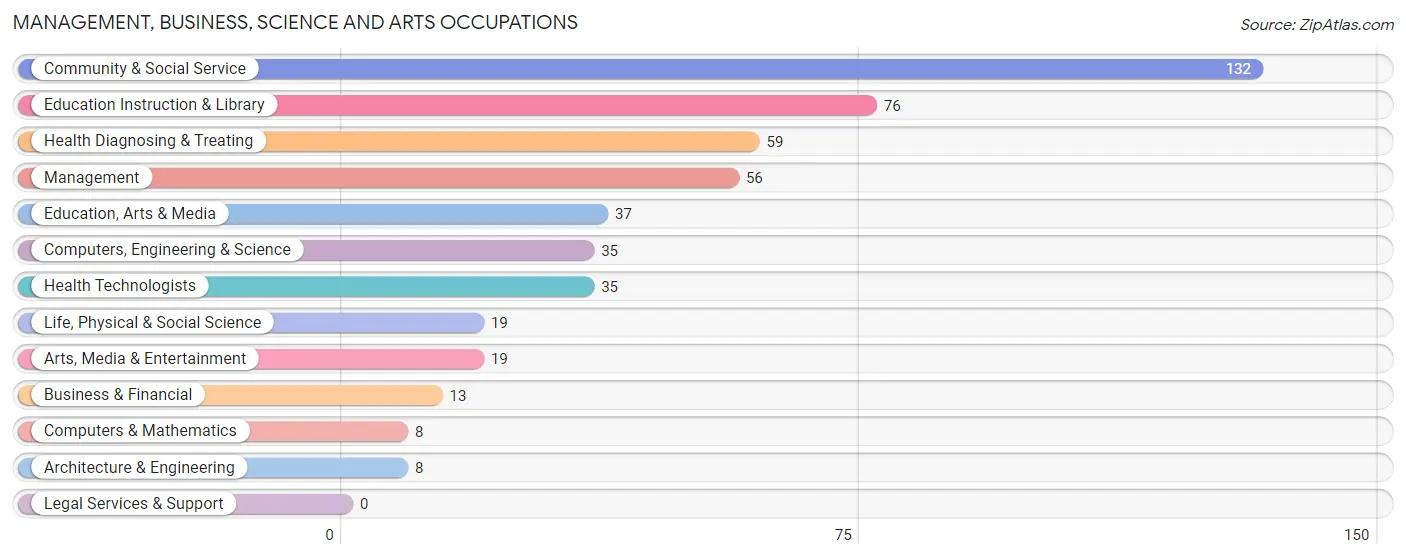
Management, Business, Science and Arts Occupations
The most common Management, Business, Science and Arts occupations in Conneaut Lakeshore are Community & Social Service (132 | 16.2%), Education Instruction & Library (76 | 9.3%), Health Diagnosing & Treating (59 | 7.3%), Management (56 | 6.9%), and Education, Arts & Media (37 | 4.5%).
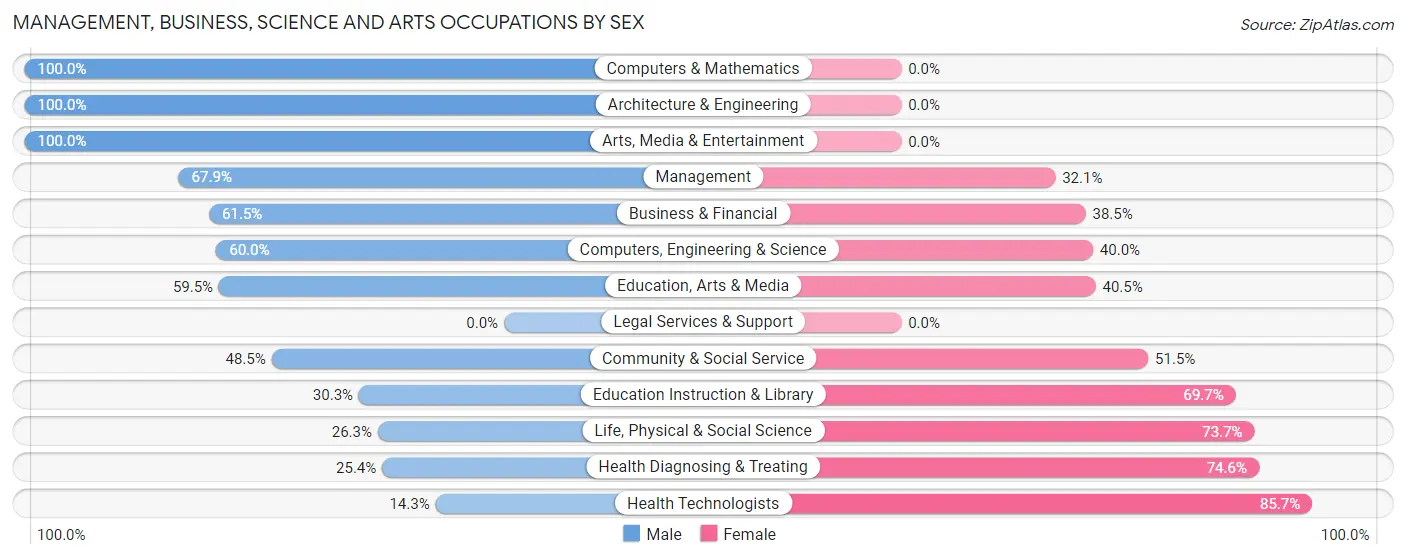
Management, Business, Science and Arts Occupations by Sex
Within the Management, Business, Science and Arts occupations in Conneaut Lakeshore, the most male-oriented occupations are Computers & Mathematics (100.0%), Architecture & Engineering (100.0%), and Arts, Media & Entertainment (100.0%), while the most female-oriented occupations are Health Technologists (85.7%), Health Diagnosing & Treating (74.6%), and Life, Physical & Social Science (73.7%).
| Occupation | Male | Female |
| Management | 38 (67.9%) | 18 (32.1%) |
| Business & Financial | 8 (61.5%) | 5 (38.5%) |
| Computers, Engineering & Science | 21 (60.0%) | 14 (40.0%) |
| Computers & Mathematics | 8 (100.0%) | 0 (0.0%) |
| Architecture & Engineering | 8 (100.0%) | 0 (0.0%) |
| Life, Physical & Social Science | 5 (26.3%) | 14 (73.7%) |
| Community & Social Service | 64 (48.5%) | 68 (51.5%) |
| Education, Arts & Media | 22 (59.5%) | 15 (40.5%) |
| Legal Services & Support | 0 (0.0%) | 0 (0.0%) |
| Education Instruction & Library | 23 (30.3%) | 53 (69.7%) |
| Arts, Media & Entertainment | 19 (100.0%) | 0 (0.0%) |
| Health Diagnosing & Treating | 15 (25.4%) | 44 (74.6%) |
| Health Technologists | 5 (14.3%) | 30 (85.7%) |
| Total (Category) | 146 (49.5%) | 149 (50.5%) |
| Total (Overall) | 398 (48.9%) | 415 (51.0%) |
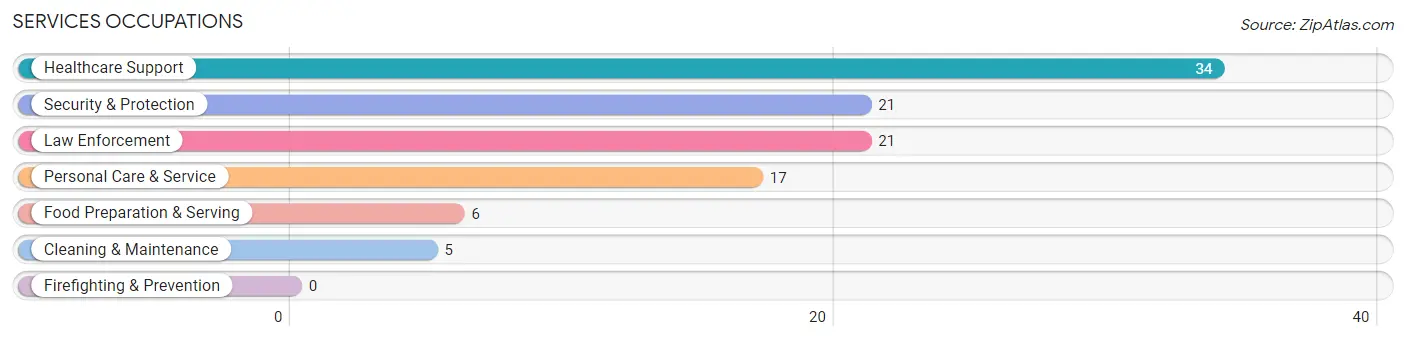
Services Occupations
The most common Services occupations in Conneaut Lakeshore are Healthcare Support (34 | 4.2%), Security & Protection (21 | 2.6%), Law Enforcement (21 | 2.6%), Personal Care & Service (17 | 2.1%), and Food Preparation & Serving (6 | 0.7%).
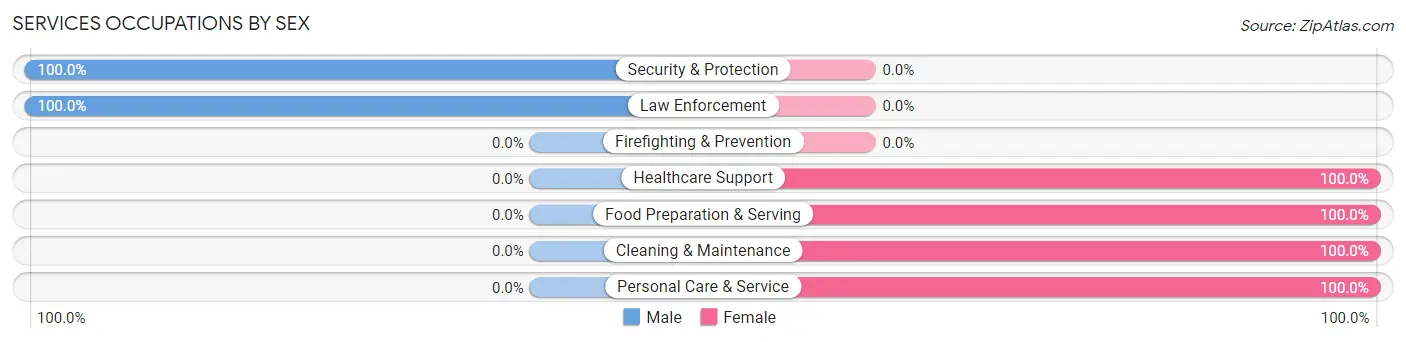
Services Occupations by Sex
Within the Services occupations in Conneaut Lakeshore, the most male-oriented occupations are Security & Protection (100.0%), and Law Enforcement (100.0%), while the most female-oriented occupations are Healthcare Support (100.0%), Food Preparation & Serving (100.0%), and Cleaning & Maintenance (100.0%).
| Occupation | Male | Female |
| Healthcare Support | 0 (0.0%) | 34 (100.0%) |
| Security & Protection | 21 (100.0%) | 0 (0.0%) |
| Firefighting & Prevention | 0 (0.0%) | 0 (0.0%) |
| Law Enforcement | 21 (100.0%) | 0 (0.0%) |
| Food Preparation & Serving | 0 (0.0%) | 6 (100.0%) |
| Cleaning & Maintenance | 0 (0.0%) | 5 (100.0%) |
| Personal Care & Service | 0 (0.0%) | 17 (100.0%) |
| Total (Category) | 21 (25.3%) | 62 (74.7%) |
| Total (Overall) | 398 (48.9%) | 415 (51.0%) |
Sales and Office Occupations
The most common Sales and Office occupations in Conneaut Lakeshore are Sales & Related (172 | 21.2%), and Office & Administration (66 | 8.1%).
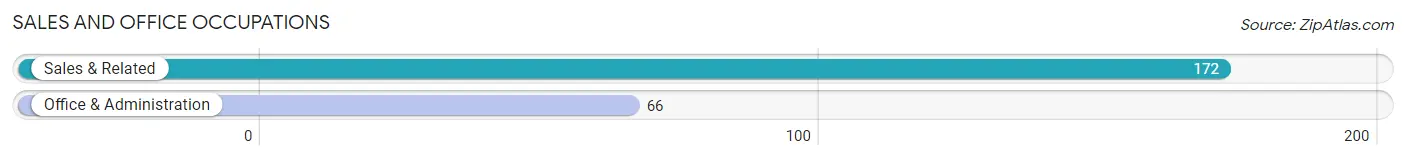
Sales and Office Occupations by Sex
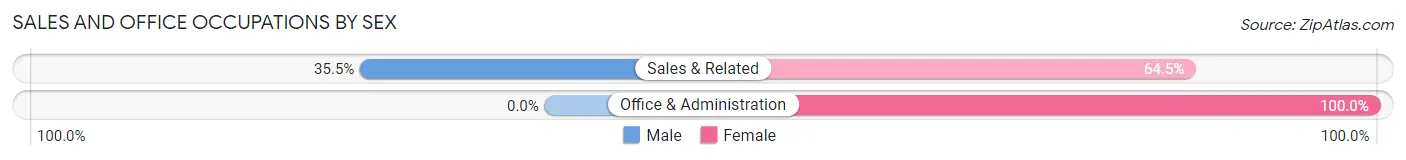
| Occupation | Male | Female |
| Sales & Related | 61 (35.5%) | 111 (64.5%) |
| Office & Administration | 0 (0.0%) | 66 (100.0%) |
| Total (Category) | 61 (25.6%) | 177 (74.4%) |
| Total (Overall) | 398 (48.9%) | 415 (51.0%) |
Natural Resources, Construction and Maintenance Occupations
The most common Natural Resources, Construction and Maintenance occupations in Conneaut Lakeshore are Installation, Maintenance & Repair (24 | 2.9%), Construction & Extraction (21 | 2.6%), and Farming, Fishing & Forestry (9 | 1.1%).
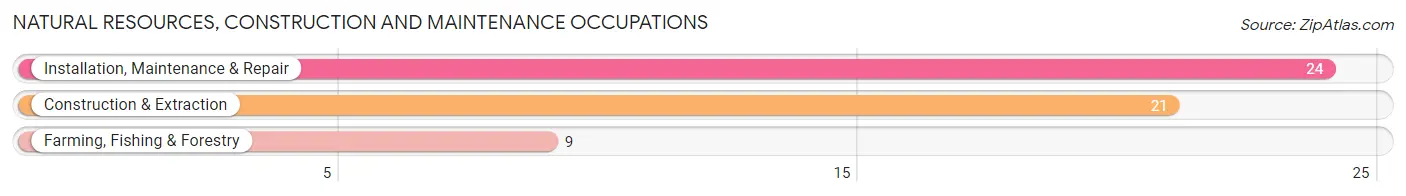
Natural Resources, Construction and Maintenance Occupations by Sex
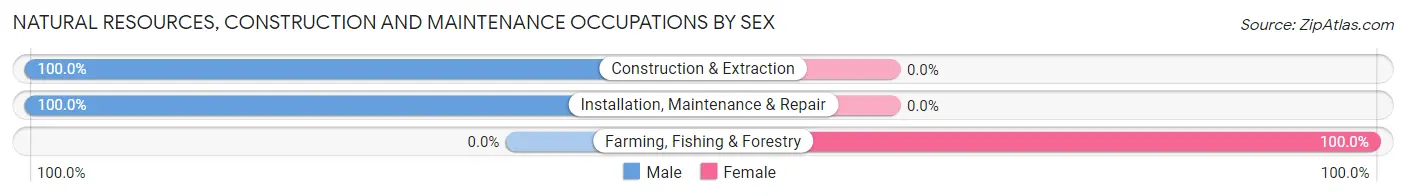
| Occupation | Male | Female |
| Farming, Fishing & Forestry | 0 (0.0%) | 9 (100.0%) |
| Construction & Extraction | 21 (100.0%) | 0 (0.0%) |
| Installation, Maintenance & Repair | 24 (100.0%) | 0 (0.0%) |
| Total (Category) | 45 (83.3%) | 9 (16.7%) |
| Total (Overall) | 398 (48.9%) | 415 (51.0%) |
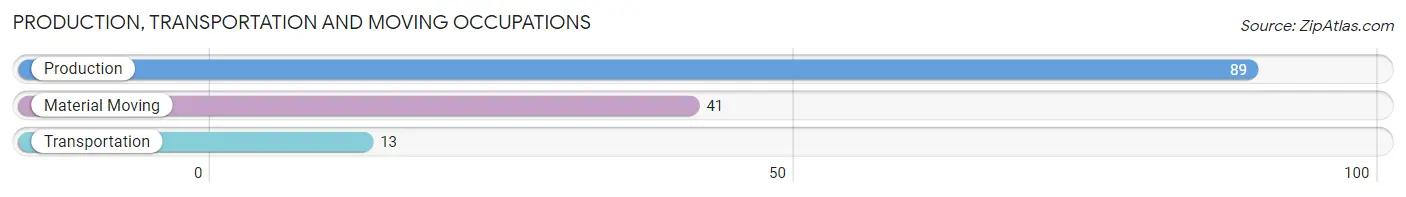
Production, Transportation and Moving Occupations
The most common Production, Transportation and Moving occupations in Conneaut Lakeshore are Production (89 | 11.0%), Material Moving (41 | 5.0%), and Transportation (13 | 1.6%).
Production, Transportation and Moving Occupations by Sex
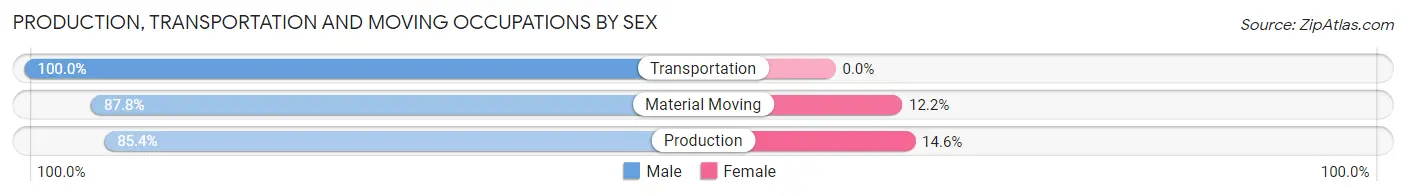
| Occupation | Male | Female |
| Production | 76 (85.4%) | 13 (14.6%) |
| Transportation | 13 (100.0%) | 0 (0.0%) |
| Material Moving | 36 (87.8%) | 5 (12.2%) |
| Total (Category) | 125 (87.4%) | 18 (12.6%) |
| Total (Overall) | 398 (48.9%) | 415 (51.0%) |
Employment Industries by Sex in Conneaut Lakeshore
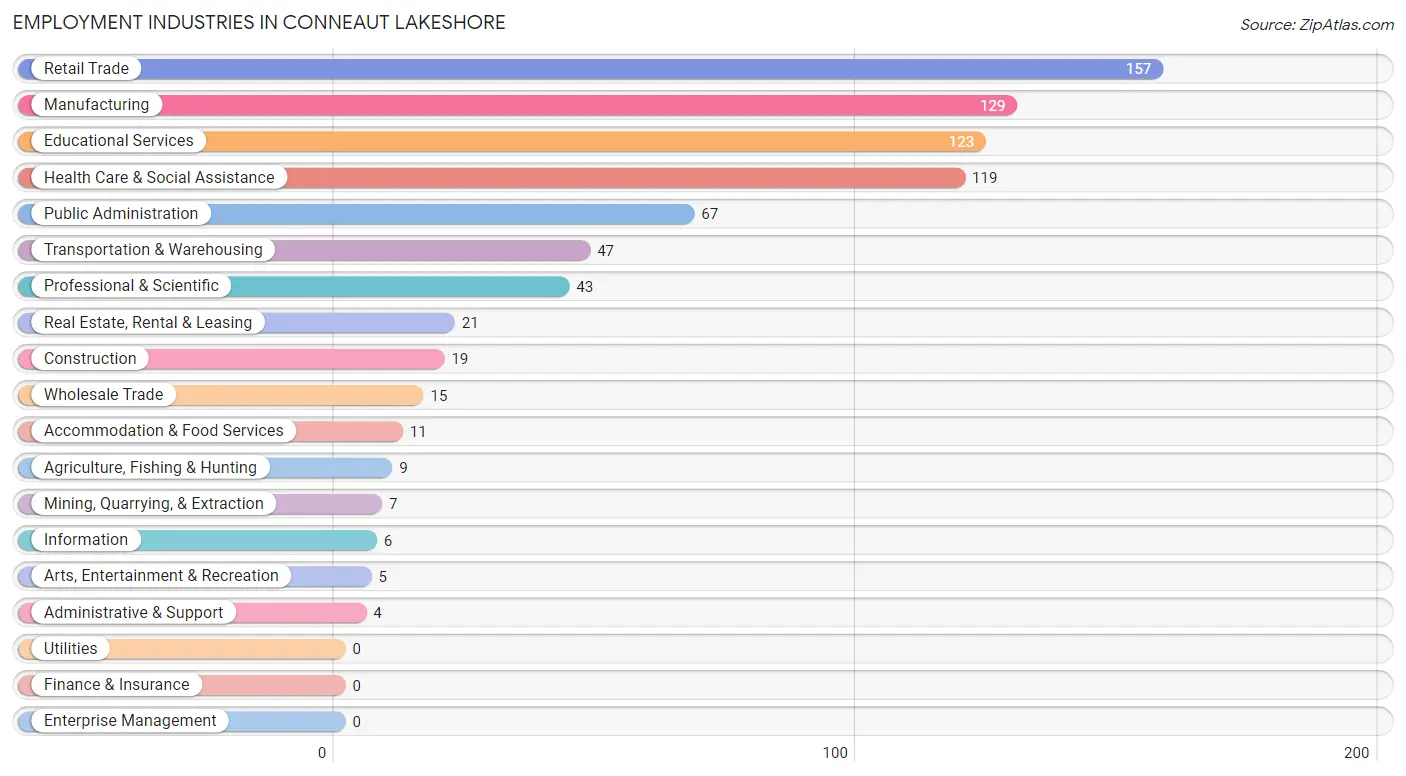
Employment Industries in Conneaut Lakeshore
The major employment industries in Conneaut Lakeshore include Retail Trade (157 | 19.3%), Manufacturing (129 | 15.9%), Educational Services (123 | 15.1%), Health Care & Social Assistance (119 | 14.6%), and Public Administration (67 | 8.2%).
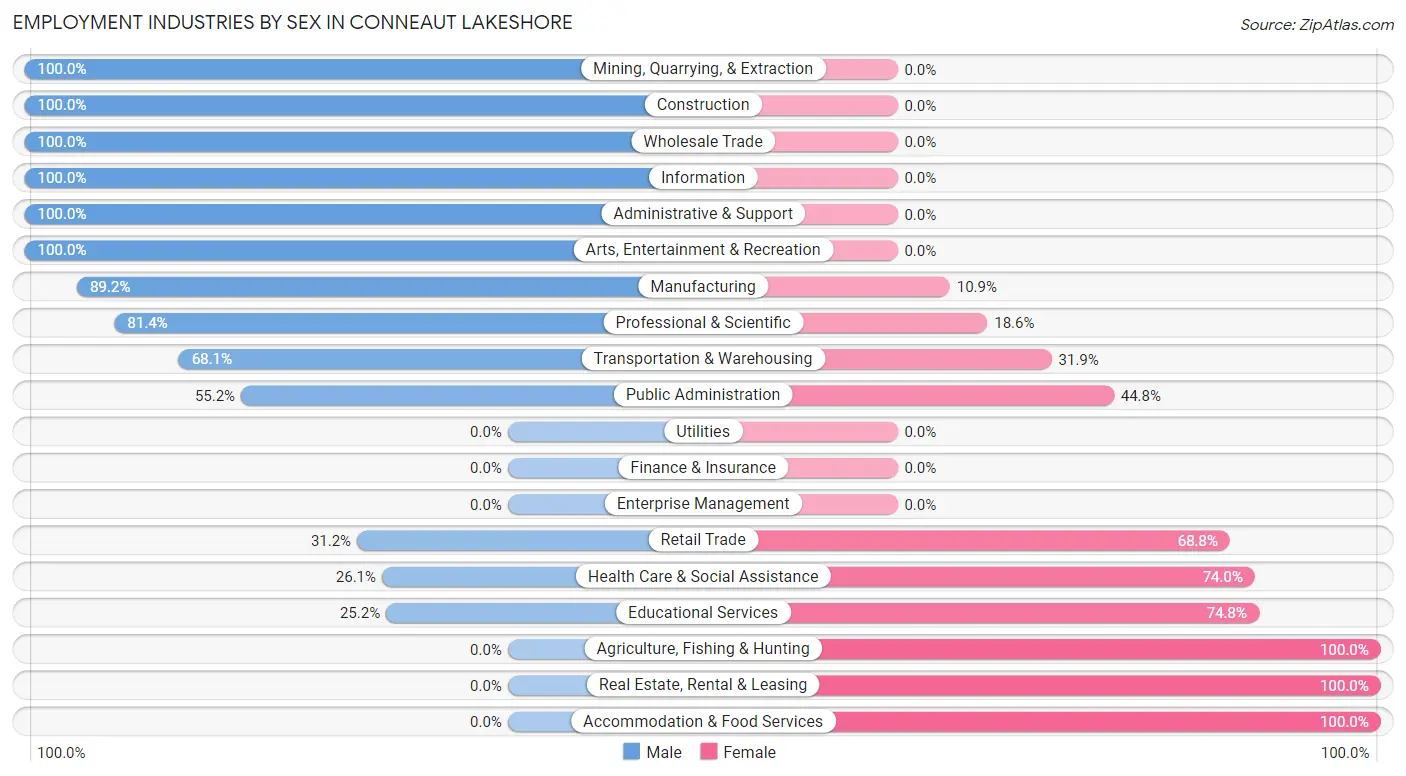
Employment Industries by Sex in Conneaut Lakeshore
The Conneaut Lakeshore industries that see more men than women are Mining, Quarrying, & Extraction (100.0%), Construction (100.0%), and Wholesale Trade (100.0%), whereas the industries that tend to have a higher number of women are Agriculture, Fishing & Hunting (100.0%), Real Estate, Rental & Leasing (100.0%), and Accommodation & Food Services (100.0%).
| Industry | Male | Female |
| Agriculture, Fishing & Hunting | 0 (0.0%) | 9 (100.0%) |
| Mining, Quarrying, & Extraction | 7 (100.0%) | 0 (0.0%) |
| Construction | 19 (100.0%) | 0 (0.0%) |
| Manufacturing | 115 (89.1%) | 14 (10.8%) |
| Wholesale Trade | 15 (100.0%) | 0 (0.0%) |
| Retail Trade | 49 (31.2%) | 108 (68.8%) |
| Transportation & Warehousing | 32 (68.1%) | 15 (31.9%) |
| Utilities | 0 (0.0%) | 0 (0.0%) |
| Information | 6 (100.0%) | 0 (0.0%) |
| Finance & Insurance | 0 (0.0%) | 0 (0.0%) |
| Real Estate, Rental & Leasing | 0 (0.0%) | 21 (100.0%) |
| Professional & Scientific | 35 (81.4%) | 8 (18.6%) |
| Enterprise Management | 0 (0.0%) | 0 (0.0%) |
| Administrative & Support | 4 (100.0%) | 0 (0.0%) |
| Educational Services | 31 (25.2%) | 92 (74.8%) |
| Health Care & Social Assistance | 31 (26.1%) | 88 (74.0%) |
| Arts, Entertainment & Recreation | 5 (100.0%) | 0 (0.0%) |
| Accommodation & Food Services | 0 (0.0%) | 11 (100.0%) |
| Public Administration | 37 (55.2%) | 30 (44.8%) |
| Total | 398 (48.9%) | 415 (51.0%) |
Education in Conneaut Lakeshore
School Enrollment in Conneaut Lakeshore
The most common levels of schooling among the 224 students in Conneaut Lakeshore are middle school (75 | 33.5%), high school (53 | 23.7%), and elementary school (36 | 16.1%).
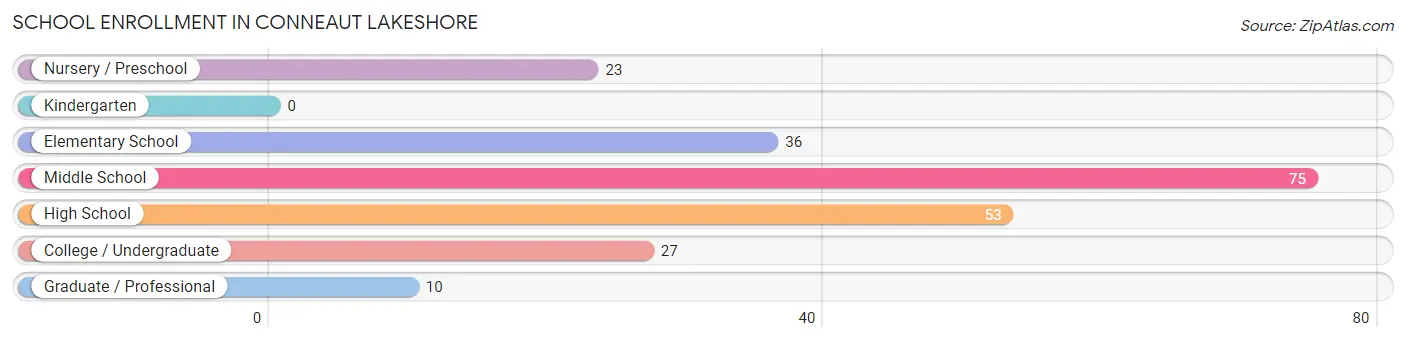
| School Level | # Students | % Students |
| Nursery / Preschool | 23 | 10.3% |
| Kindergarten | 0 | 0.0% |
| Elementary School | 36 | 16.1% |
| Middle School | 75 | 33.5% |
| High School | 53 | 23.7% |
| College / Undergraduate | 27 | 12.0% |
| Graduate / Professional | 10 | 4.5% |
| Total | 224 | 100.0% |
School Enrollment by Age by Funding Source in Conneaut Lakeshore
Out of a total of 224 students who are enrolled in schools in Conneaut Lakeshore, 23 (10.3%) attend a private institution, while the remaining 201 (89.7%) are enrolled in public schools. The age group of 20 to 24 year olds has the highest likelihood of being enrolled in private schools, with 23 (62.2% in the age bracket) enrolled. Conversely, the age group of 3 to 4 year olds has the lowest likelihood of being enrolled in a private school, with 23 (100.0% in the age bracket) attending a public institution.
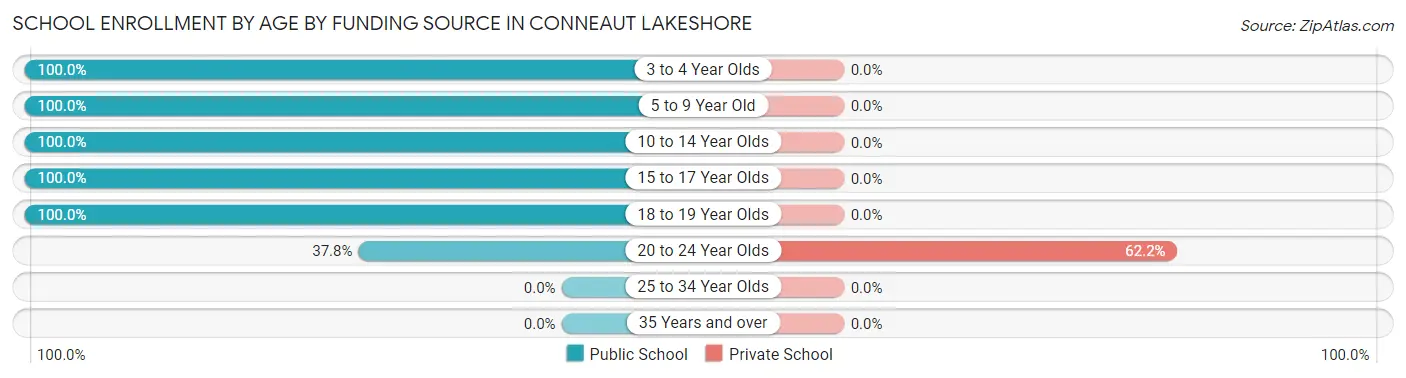
| Age Bracket | Public School | Private School |
| 3 to 4 Year Olds | 23 (100.0%) | 0 (0.0%) |
| 5 to 9 Year Old | 36 (100.0%) | 0 (0.0%) |
| 10 to 14 Year Olds | 80 (100.0%) | 0 (0.0%) |
| 15 to 17 Year Olds | 35 (100.0%) | 0 (0.0%) |
| 18 to 19 Year Olds | 13 (100.0%) | 0 (0.0%) |
| 20 to 24 Year Olds | 14 (37.8%) | 23 (62.2%) |
| 25 to 34 Year Olds | 0 (0.0%) | 0 (0.0%) |
| 35 Years and over | 0 (0.0%) | 0 (0.0%) |
| Total | 201 (89.7%) | 23 (10.3%) |
Educational Attainment by Field of Study in Conneaut Lakeshore
Business (149 | 26.7%), education (149 | 26.7%), science & technology (56 | 10.0%), psychology (46 | 8.2%), and arts & humanities (45 | 8.1%) are the most common fields of study among 558 individuals in Conneaut Lakeshore who have obtained a bachelor's degree or higher.
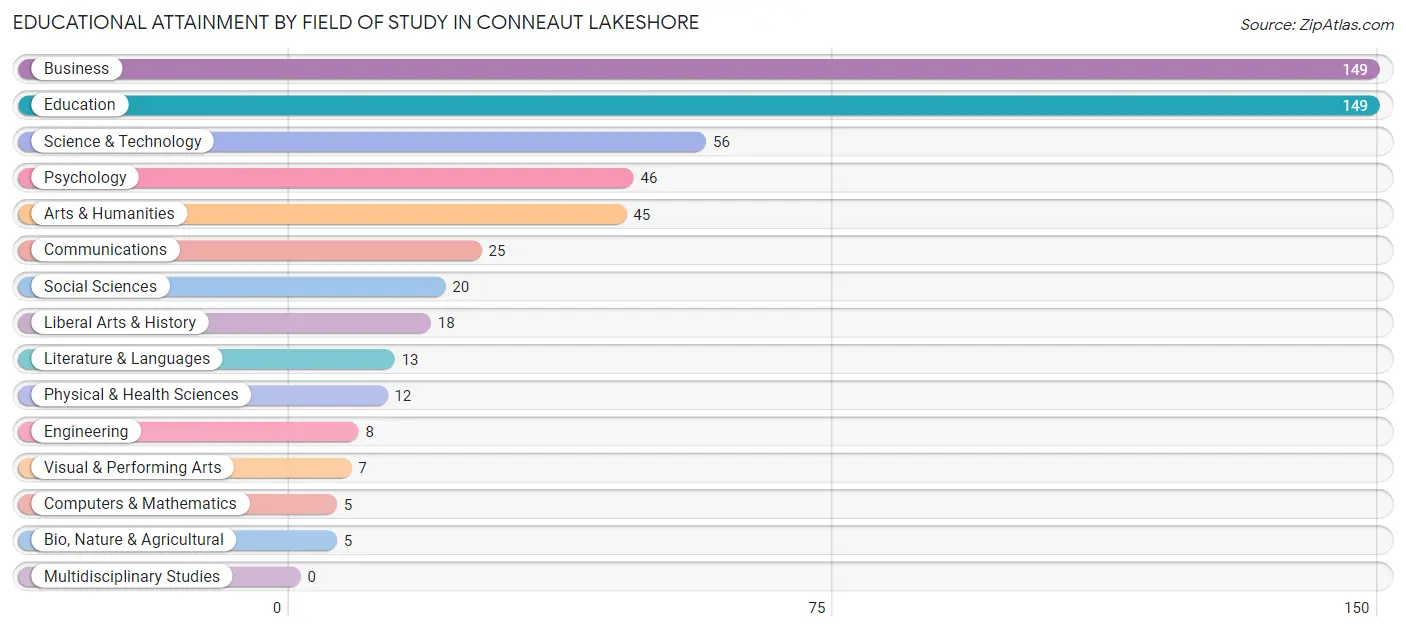
| Field of Study | # Graduates | % Graduates |
| Computers & Mathematics | 5 | 0.9% |
| Bio, Nature & Agricultural | 5 | 0.9% |
| Physical & Health Sciences | 12 | 2.1% |
| Psychology | 46 | 8.2% |
| Social Sciences | 20 | 3.6% |
| Engineering | 8 | 1.4% |
| Multidisciplinary Studies | 0 | 0.0% |
| Science & Technology | 56 | 10.0% |
| Business | 149 | 26.7% |
| Education | 149 | 26.7% |
| Literature & Languages | 13 | 2.3% |
| Liberal Arts & History | 18 | 3.2% |
| Visual & Performing Arts | 7 | 1.3% |
| Communications | 25 | 4.5% |
| Arts & Humanities | 45 | 8.1% |
| Total | 558 | 100.0% |
Transportation & Commute in Conneaut Lakeshore
Vehicle Availability by Sex in Conneaut Lakeshore
The most prevalent vehicle ownership categories in Conneaut Lakeshore are males with 2 vehicles (195, accounting for 49.0%) and females with 2 vehicles (180, making up 47.0%).
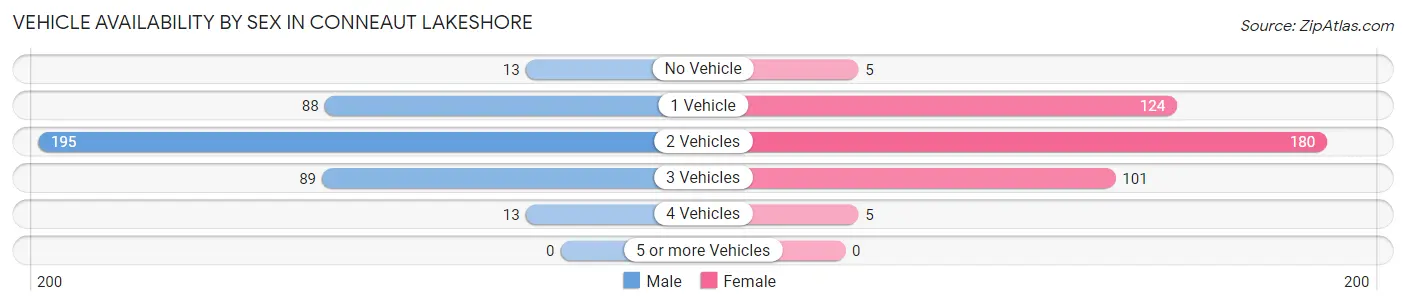
| Vehicles Available | Male | Female |
| No Vehicle | 13 (3.3%) | 5 (1.2%) |
| 1 Vehicle | 88 (22.1%) | 124 (29.9%) |
| 2 Vehicles | 195 (49.0%) | 180 (43.4%) |
| 3 Vehicles | 89 (22.4%) | 101 (24.3%) |
| 4 Vehicles | 13 (3.3%) | 5 (1.2%) |
| 5 or more Vehicles | 0 (0.0%) | 0 (0.0%) |
| Total | 398 (100.0%) | 415 (100.0%) |
Commute Time in Conneaut Lakeshore
The most frequently occuring commute durations in Conneaut Lakeshore are 15 to 19 minutes (175 commuters, 24.6%), 20 to 24 minutes (96 commuters, 13.5%), and 25 to 29 minutes (84 commuters, 11.8%).
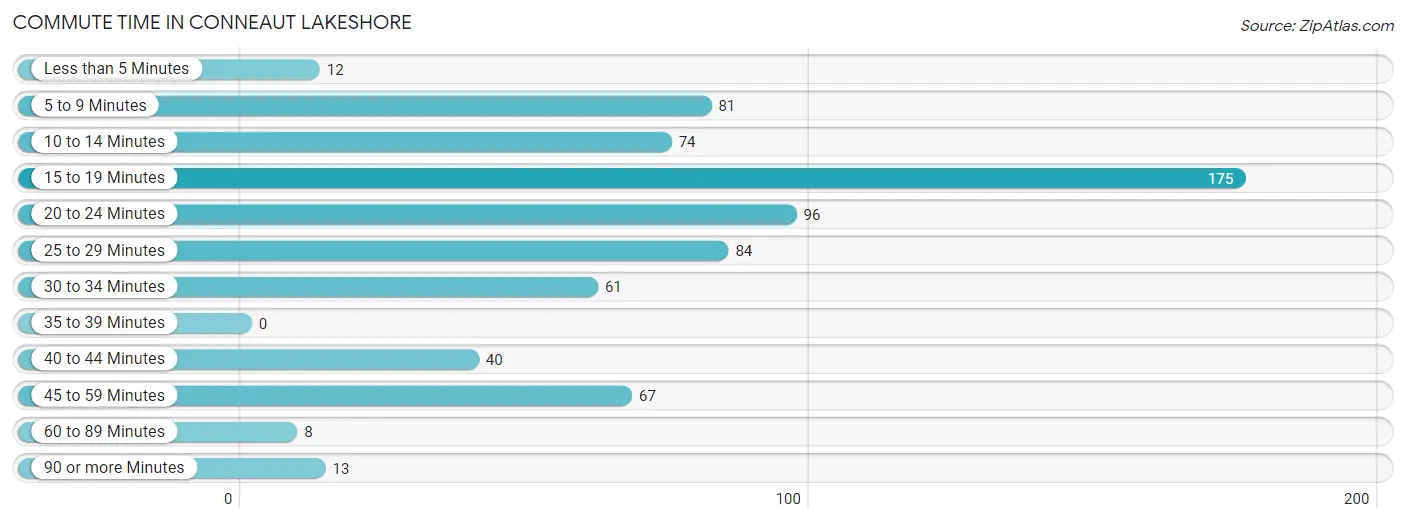
| Commute Time | # Commuters | % Commuters |
| Less than 5 Minutes | 12 | 1.7% |
| 5 to 9 Minutes | 81 | 11.4% |
| 10 to 14 Minutes | 74 | 10.4% |
| 15 to 19 Minutes | 175 | 24.6% |
| 20 to 24 Minutes | 96 | 13.5% |
| 25 to 29 Minutes | 84 | 11.8% |
| 30 to 34 Minutes | 61 | 8.6% |
| 35 to 39 Minutes | 0 | 0.0% |
| 40 to 44 Minutes | 40 | 5.6% |
| 45 to 59 Minutes | 67 | 9.4% |
| 60 to 89 Minutes | 8 | 1.1% |
| 90 or more Minutes | 13 | 1.8% |
Commute Time by Sex in Conneaut Lakeshore
The most common commute times in Conneaut Lakeshore are 15 to 19 minutes (106 commuters, 30.7%) for males and 15 to 19 minutes (69 commuters, 18.9%) for females.
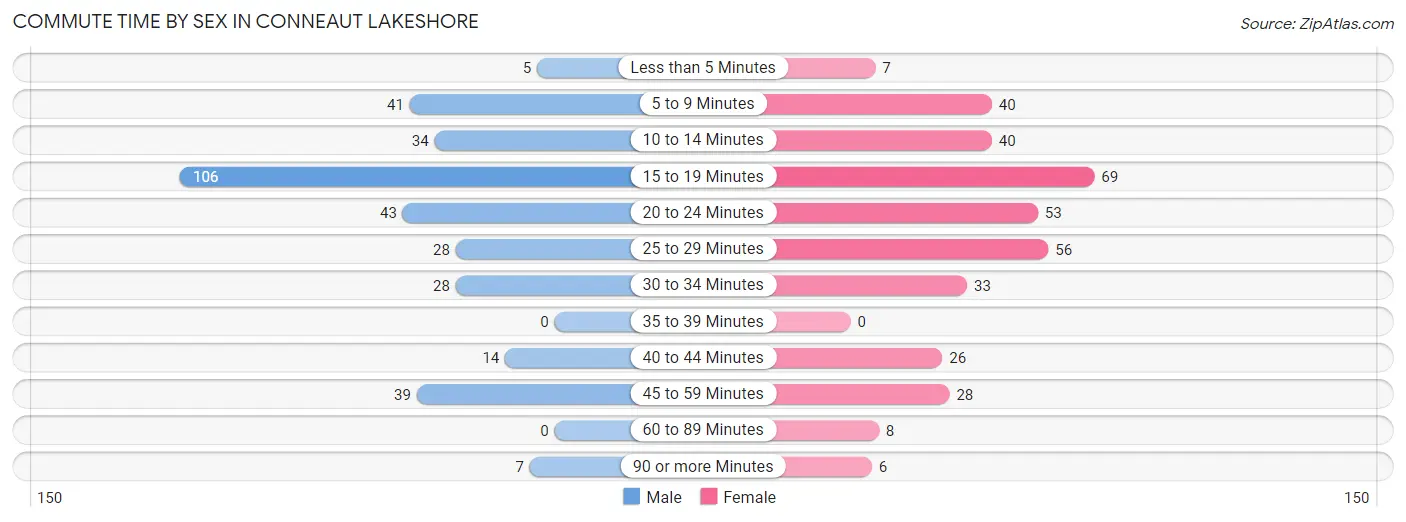
| Commute Time | Male | Female |
| Less than 5 Minutes | 5 (1.5%) | 7 (1.9%) |
| 5 to 9 Minutes | 41 (11.9%) | 40 (10.9%) |
| 10 to 14 Minutes | 34 (9.9%) | 40 (10.9%) |
| 15 to 19 Minutes | 106 (30.7%) | 69 (18.9%) |
| 20 to 24 Minutes | 43 (12.5%) | 53 (14.5%) |
| 25 to 29 Minutes | 28 (8.1%) | 56 (15.3%) |
| 30 to 34 Minutes | 28 (8.1%) | 33 (9.0%) |
| 35 to 39 Minutes | 0 (0.0%) | 0 (0.0%) |
| 40 to 44 Minutes | 14 (4.1%) | 26 (7.1%) |
| 45 to 59 Minutes | 39 (11.3%) | 28 (7.6%) |
| 60 to 89 Minutes | 0 (0.0%) | 8 (2.2%) |
| 90 or more Minutes | 7 (2.0%) | 6 (1.6%) |
Time of Departure to Work by Sex in Conneaut Lakeshore
The most frequent times of departure to work in Conneaut Lakeshore are 6:30 AM to 6:59 AM (76, 22.0%) for males and 7:00 AM to 7:29 AM (96, 26.2%) for females.
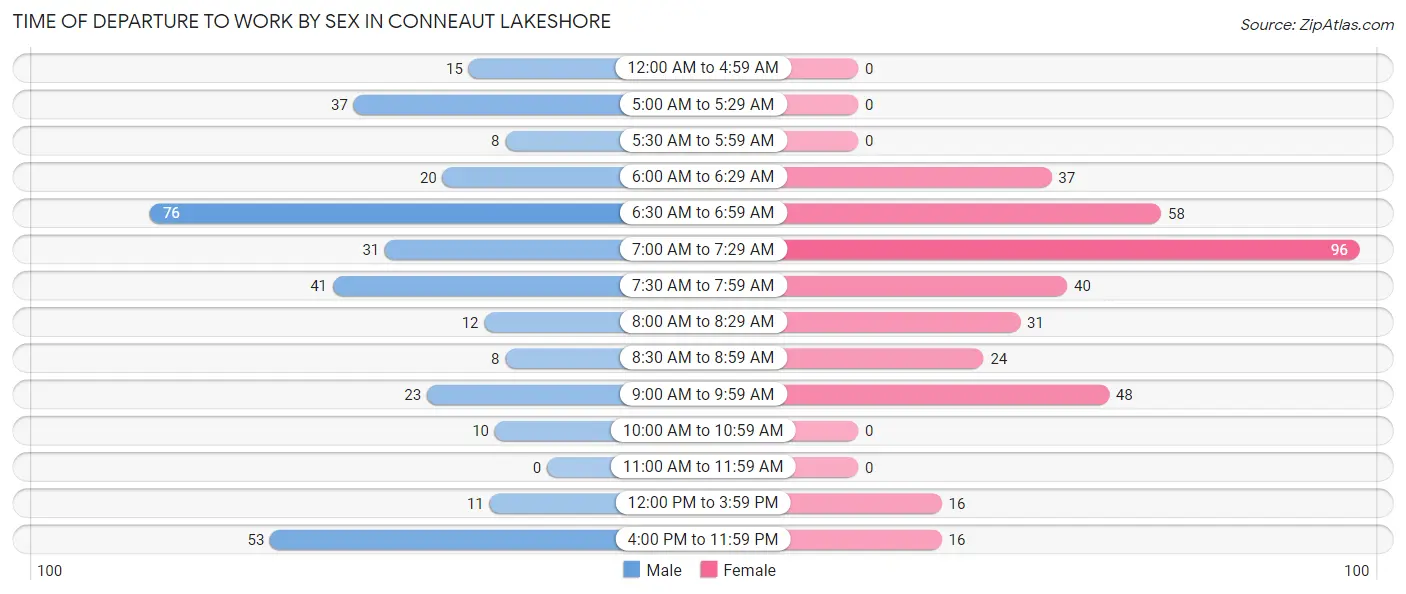
| Time of Departure | Male | Female |
| 12:00 AM to 4:59 AM | 15 (4.3%) | 0 (0.0%) |
| 5:00 AM to 5:29 AM | 37 (10.7%) | 0 (0.0%) |
| 5:30 AM to 5:59 AM | 8 (2.3%) | 0 (0.0%) |
| 6:00 AM to 6:29 AM | 20 (5.8%) | 37 (10.1%) |
| 6:30 AM to 6:59 AM | 76 (22.0%) | 58 (15.9%) |
| 7:00 AM to 7:29 AM | 31 (9.0%) | 96 (26.2%) |
| 7:30 AM to 7:59 AM | 41 (11.9%) | 40 (10.9%) |
| 8:00 AM to 8:29 AM | 12 (3.5%) | 31 (8.5%) |
| 8:30 AM to 8:59 AM | 8 (2.3%) | 24 (6.6%) |
| 9:00 AM to 9:59 AM | 23 (6.7%) | 48 (13.1%) |
| 10:00 AM to 10:59 AM | 10 (2.9%) | 0 (0.0%) |
| 11:00 AM to 11:59 AM | 0 (0.0%) | 0 (0.0%) |
| 12:00 PM to 3:59 PM | 11 (3.2%) | 16 (4.4%) |
| 4:00 PM to 11:59 PM | 53 (15.4%) | 16 (4.4%) |
| Total | 345 (100.0%) | 366 (100.0%) |
Housing Occupancy in Conneaut Lakeshore
Occupancy by Ownership in Conneaut Lakeshore
Of the total 987 dwellings in Conneaut Lakeshore, owner-occupied units account for 799 (80.9%), while renter-occupied units make up 188 (19.1%).
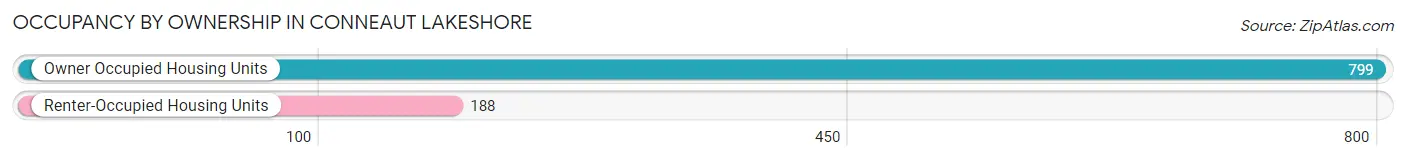
| Occupancy | # Housing Units | % Housing Units |
| Owner Occupied Housing Units | 799 | 80.9% |
| Renter-Occupied Housing Units | 188 | 19.1% |
| Total Occupied Housing Units | 987 | 100.0% |
Occupancy by Household Size in Conneaut Lakeshore
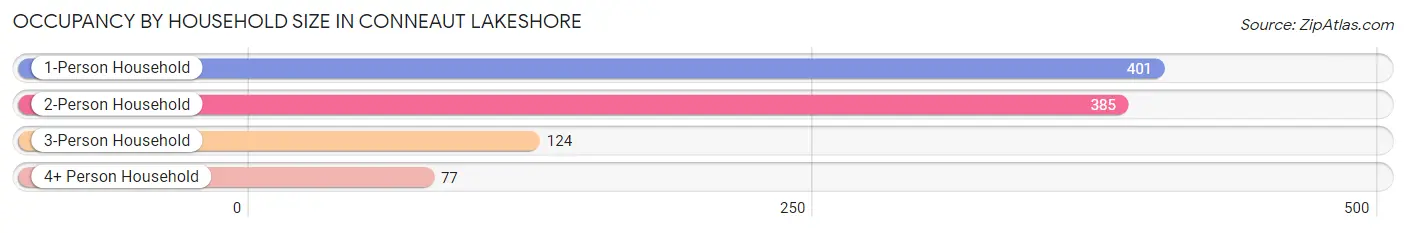
| Household Size | # Housing Units | % Housing Units |
| 1-Person Household | 401 | 40.6% |
| 2-Person Household | 385 | 39.0% |
| 3-Person Household | 124 | 12.6% |
| 4+ Person Household | 77 | 7.8% |
| Total Housing Units | 987 | 100.0% |
Occupancy by Ownership by Household Size in Conneaut Lakeshore
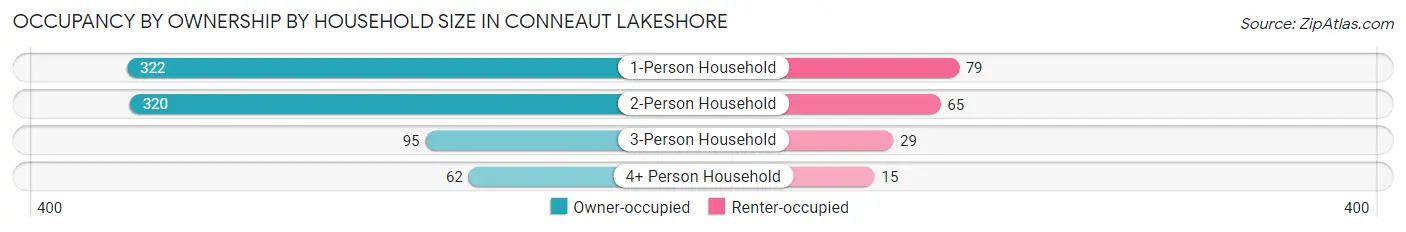
| Household Size | Owner-occupied | Renter-occupied |
| 1-Person Household | 322 (80.3%) | 79 (19.7%) |
| 2-Person Household | 320 (83.1%) | 65 (16.9%) |
| 3-Person Household | 95 (76.6%) | 29 (23.4%) |
| 4+ Person Household | 62 (80.5%) | 15 (19.5%) |
| Total Housing Units | 799 (80.9%) | 188 (19.1%) |
Occupancy by Educational Attainment in Conneaut Lakeshore
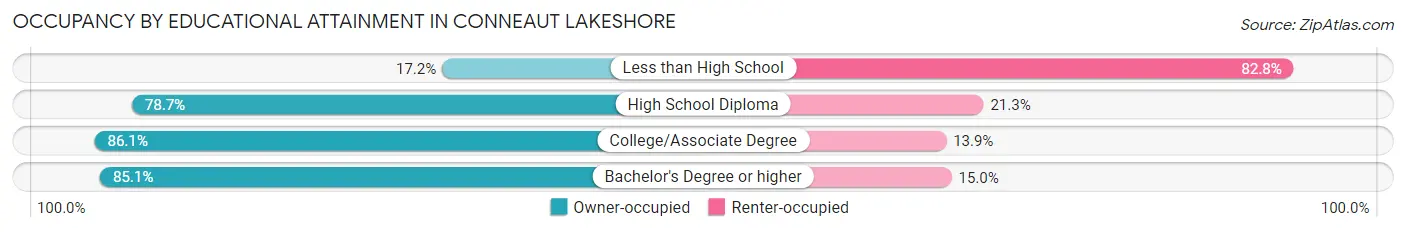
| Household Size | Owner-occupied | Renter-occupied |
| Less than High School | 5 (17.2%) | 24 (82.8%) |
| High School Diploma | 296 (78.7%) | 80 (21.3%) |
| College/Associate Degree | 242 (86.1%) | 39 (13.9%) |
| Bachelor's Degree or higher | 256 (85.1%) | 45 (14.9%) |
Occupancy by Age of Householder in Conneaut Lakeshore
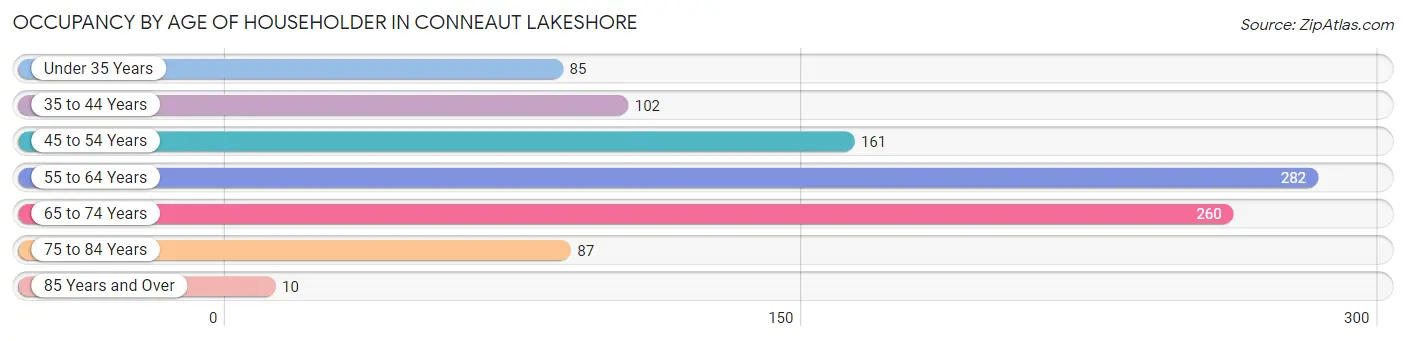
| Age Bracket | # Households | % Households |
| Under 35 Years | 85 | 8.6% |
| 35 to 44 Years | 102 | 10.3% |
| 45 to 54 Years | 161 | 16.3% |
| 55 to 64 Years | 282 | 28.6% |
| 65 to 74 Years | 260 | 26.3% |
| 75 to 84 Years | 87 | 8.8% |
| 85 Years and Over | 10 | 1.0% |
| Total | 987 | 100.0% |
Housing Finances in Conneaut Lakeshore
Median Income by Occupancy in Conneaut Lakeshore
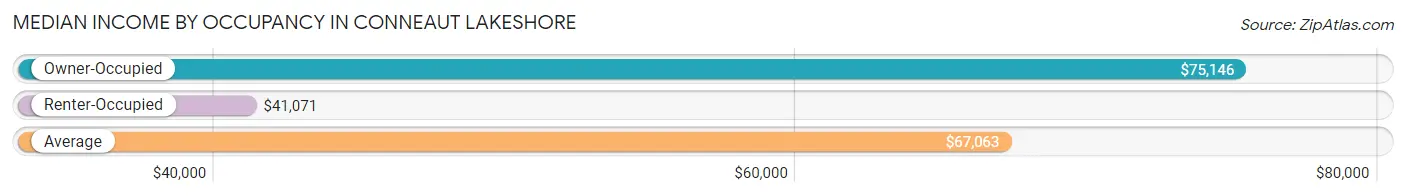
| Occupancy Type | # Households | Median Income |
| Owner-Occupied | 799 (80.9%) | $75,146 |
| Renter-Occupied | 188 (19.1%) | $41,071 |
| Average | 987 (100.0%) | $67,063 |
Occupancy by Householder Income Bracket in Conneaut Lakeshore
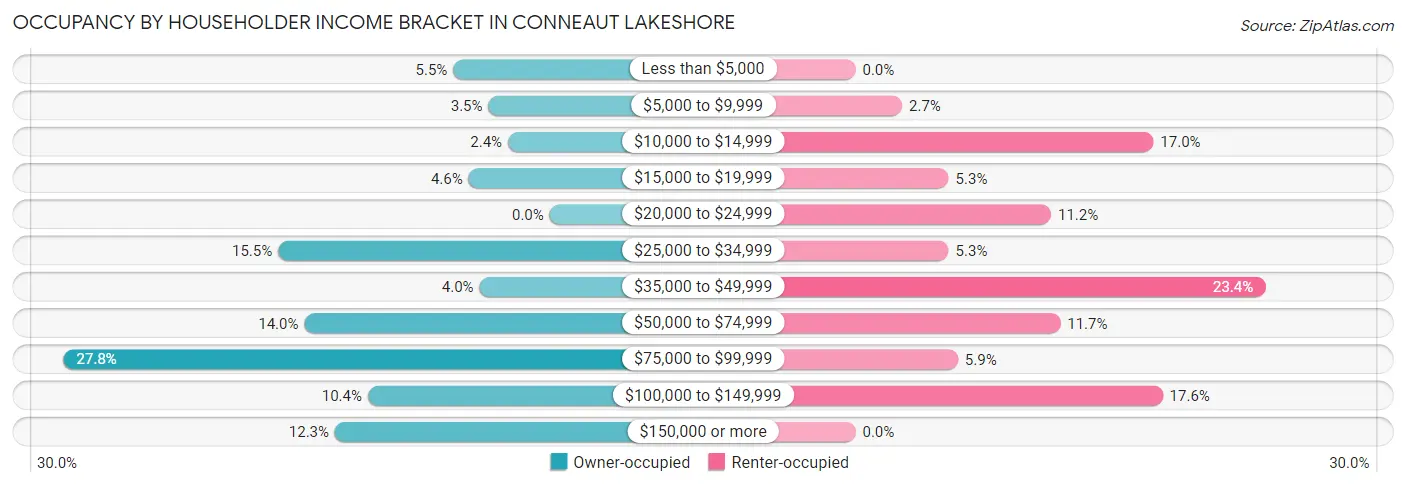
| Income Bracket | Owner-occupied | Renter-occupied |
| Less than $5,000 | 44 (5.5%) | 0 (0.0%) |
| $5,000 to $9,999 | 28 (3.5%) | 5 (2.7%) |
| $10,000 to $14,999 | 19 (2.4%) | 32 (17.0%) |
| $15,000 to $19,999 | 37 (4.6%) | 10 (5.3%) |
| $20,000 to $24,999 | 0 (0.0%) | 21 (11.2%) |
| $25,000 to $34,999 | 124 (15.5%) | 10 (5.3%) |
| $35,000 to $49,999 | 32 (4.0%) | 44 (23.4%) |
| $50,000 to $74,999 | 112 (14.0%) | 22 (11.7%) |
| $75,000 to $99,999 | 222 (27.8%) | 11 (5.9%) |
| $100,000 to $149,999 | 83 (10.4%) | 33 (17.5%) |
| $150,000 or more | 98 (12.3%) | 0 (0.0%) |
| Total | 799 (100.0%) | 188 (100.0%) |
Monthly Housing Cost Tiers in Conneaut Lakeshore
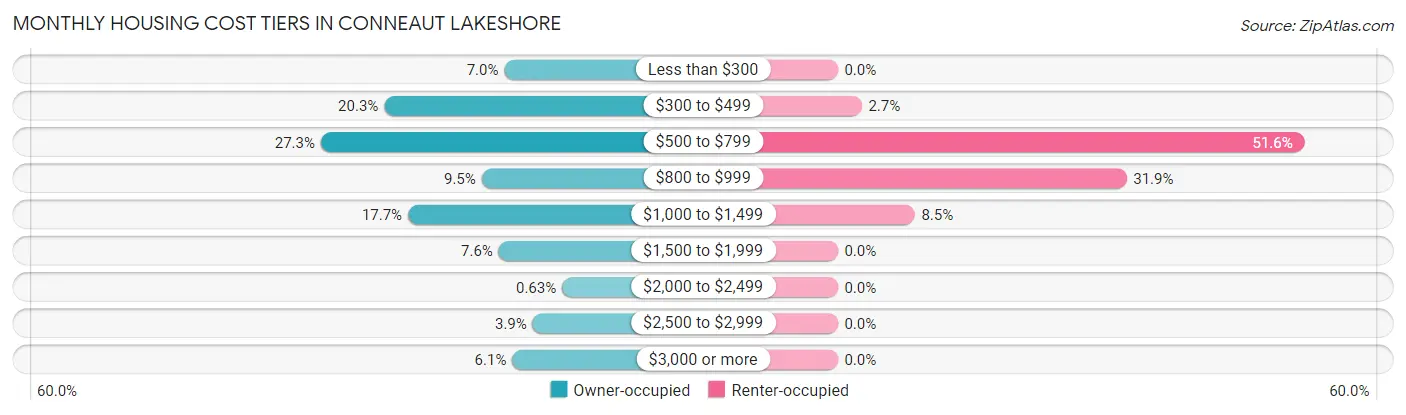
| Monthly Cost | Owner-occupied | Renter-occupied |
| Less than $300 | 56 (7.0%) | 0 (0.0%) |
| $300 to $499 | 162 (20.3%) | 5 (2.7%) |
| $500 to $799 | 218 (27.3%) | 97 (51.6%) |
| $800 to $999 | 76 (9.5%) | 60 (31.9%) |
| $1,000 to $1,499 | 141 (17.6%) | 16 (8.5%) |
| $1,500 to $1,999 | 61 (7.6%) | 0 (0.0%) |
| $2,000 to $2,499 | 5 (0.6%) | 0 (0.0%) |
| $2,500 to $2,999 | 31 (3.9%) | 0 (0.0%) |
| $3,000 or more | 49 (6.1%) | 0 (0.0%) |
| Total | 799 (100.0%) | 188 (100.0%) |
Physical Housing Characteristics in Conneaut Lakeshore
Housing Structures in Conneaut Lakeshore
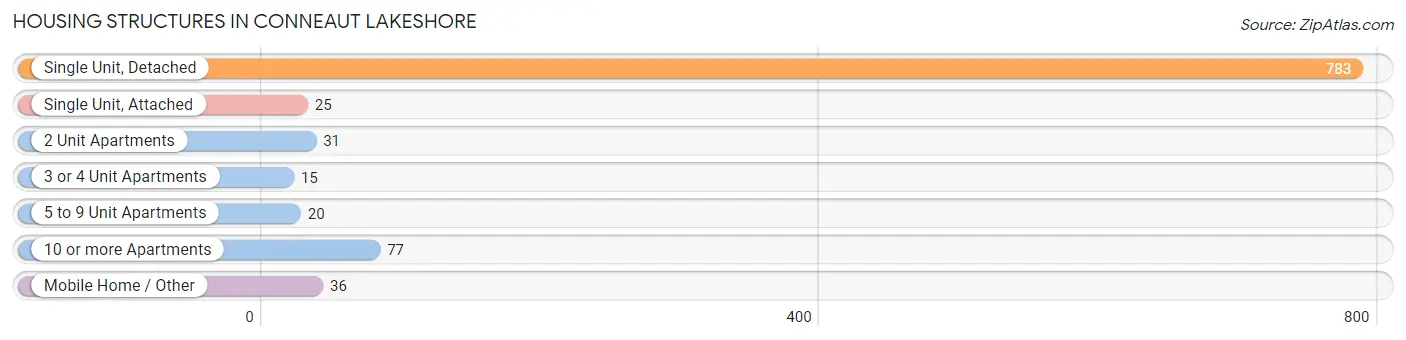
| Structure Type | # Housing Units | % Housing Units |
| Single Unit, Detached | 783 | 79.3% |
| Single Unit, Attached | 25 | 2.5% |
| 2 Unit Apartments | 31 | 3.1% |
| 3 or 4 Unit Apartments | 15 | 1.5% |
| 5 to 9 Unit Apartments | 20 | 2.0% |
| 10 or more Apartments | 77 | 7.8% |
| Mobile Home / Other | 36 | 3.6% |
| Total | 987 | 100.0% |
Housing Structures by Occupancy in Conneaut Lakeshore
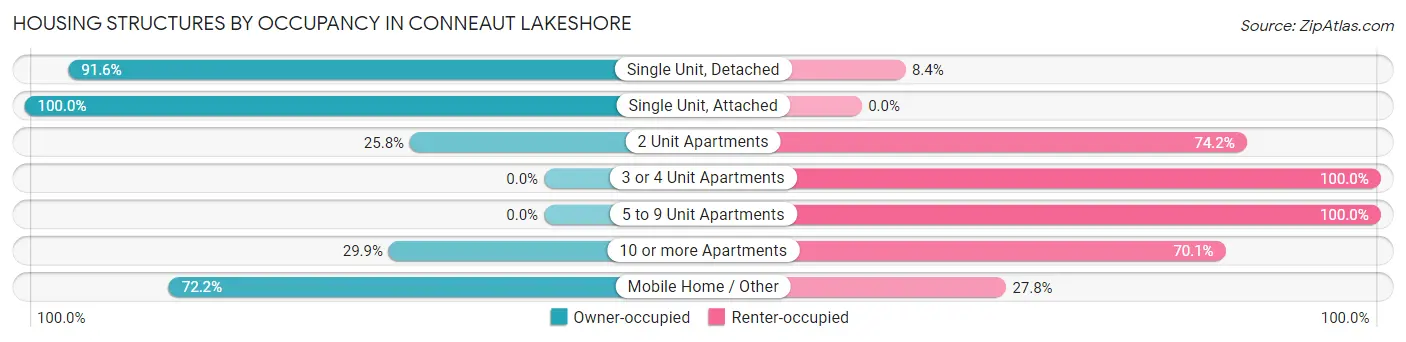
| Structure Type | Owner-occupied | Renter-occupied |
| Single Unit, Detached | 717 (91.6%) | 66 (8.4%) |
| Single Unit, Attached | 25 (100.0%) | 0 (0.0%) |
| 2 Unit Apartments | 8 (25.8%) | 23 (74.2%) |
| 3 or 4 Unit Apartments | 0 (0.0%) | 15 (100.0%) |
| 5 to 9 Unit Apartments | 0 (0.0%) | 20 (100.0%) |
| 10 or more Apartments | 23 (29.9%) | 54 (70.1%) |
| Mobile Home / Other | 26 (72.2%) | 10 (27.8%) |
| Total | 799 (80.9%) | 188 (19.1%) |
Housing Structures by Number of Rooms in Conneaut Lakeshore
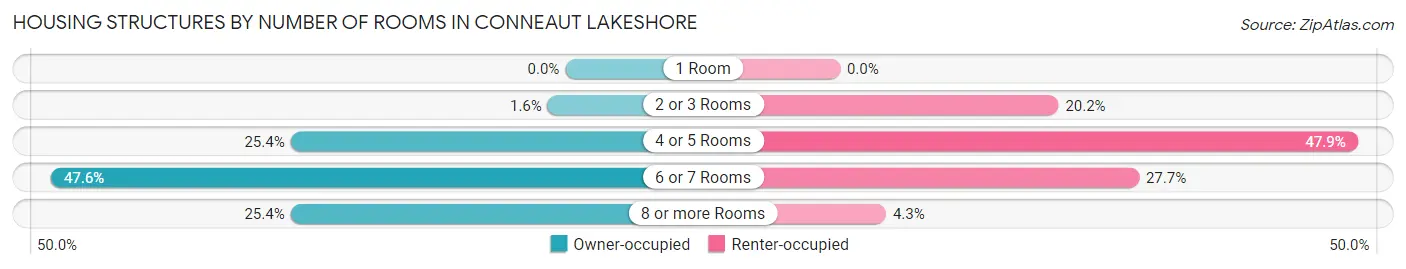
| Number of Rooms | Owner-occupied | Renter-occupied |
| 1 Room | 0 (0.0%) | 0 (0.0%) |
| 2 or 3 Rooms | 13 (1.6%) | 38 (20.2%) |
| 4 or 5 Rooms | 203 (25.4%) | 90 (47.9%) |
| 6 or 7 Rooms | 380 (47.6%) | 52 (27.7%) |
| 8 or more Rooms | 203 (25.4%) | 8 (4.3%) |
| Total | 799 (100.0%) | 188 (100.0%) |
Housing Structure by Heating Type in Conneaut Lakeshore
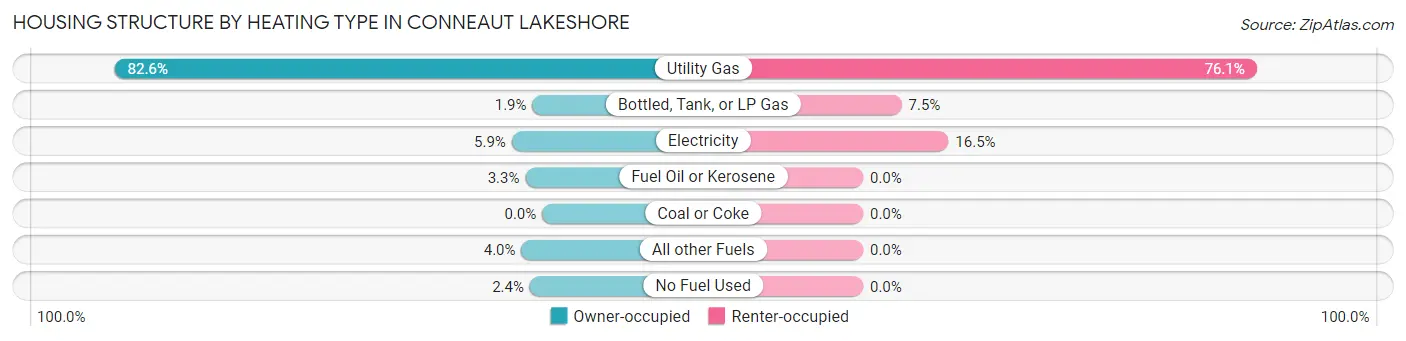
| Heating Type | Owner-occupied | Renter-occupied |
| Utility Gas | 660 (82.6%) | 143 (76.1%) |
| Bottled, Tank, or LP Gas | 15 (1.9%) | 14 (7.4%) |
| Electricity | 47 (5.9%) | 31 (16.5%) |
| Fuel Oil or Kerosene | 26 (3.3%) | 0 (0.0%) |
| Coal or Coke | 0 (0.0%) | 0 (0.0%) |
| All other Fuels | 32 (4.0%) | 0 (0.0%) |
| No Fuel Used | 19 (2.4%) | 0 (0.0%) |
| Total | 799 (100.0%) | 188 (100.0%) |
Household Vehicle Usage in Conneaut Lakeshore
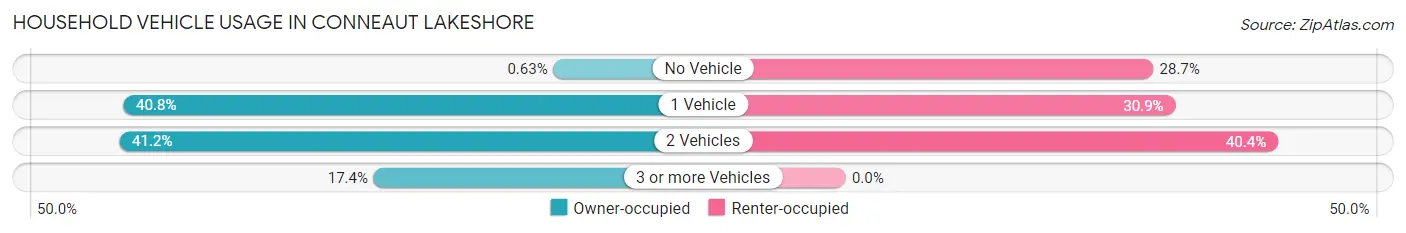
| Vehicles per Household | Owner-occupied | Renter-occupied |
| No Vehicle | 5 (0.6%) | 54 (28.7%) |
| 1 Vehicle | 326 (40.8%) | 58 (30.8%) |
| 2 Vehicles | 329 (41.2%) | 76 (40.4%) |
| 3 or more Vehicles | 139 (17.4%) | 0 (0.0%) |
| Total | 799 (100.0%) | 188 (100.0%) |
Real Estate & Mortgages in Conneaut Lakeshore
Real Estate and Mortgage Overview in Conneaut Lakeshore
| Characteristic | Without Mortgage | With Mortgage |
| Housing Units | 433 | 366 |
| Median Property Value | $169,900 | $168,500 |
| Median Household Income | $75,594 | $66 |
| Monthly Housing Costs | $499 | $49 |
| Real Estate Taxes | $2,494 | $0 |
Property Value by Mortgage Status in Conneaut Lakeshore
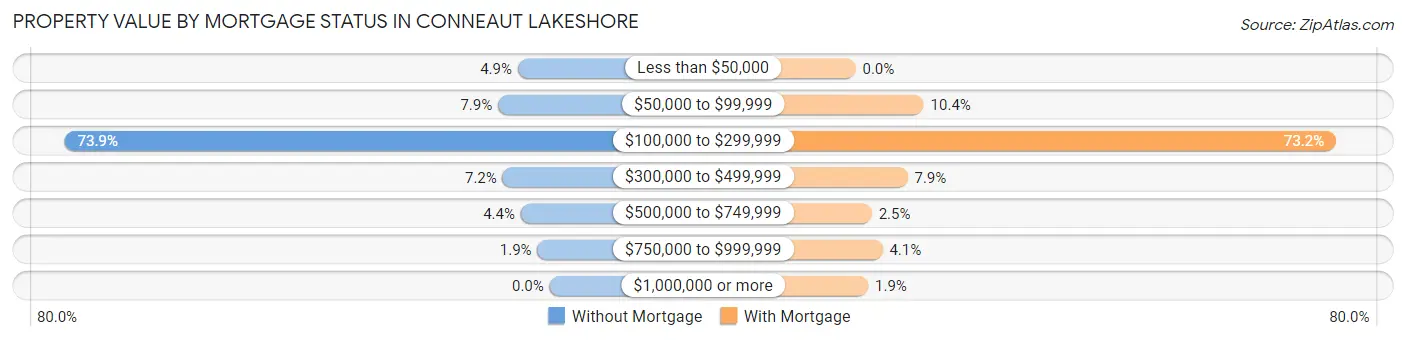
| Property Value | Without Mortgage | With Mortgage |
| Less than $50,000 | 21 (4.9%) | 0 (0.0%) |
| $50,000 to $99,999 | 34 (7.9%) | 38 (10.4%) |
| $100,000 to $299,999 | 320 (73.9%) | 268 (73.2%) |
| $300,000 to $499,999 | 31 (7.2%) | 29 (7.9%) |
| $500,000 to $749,999 | 19 (4.4%) | 9 (2.5%) |
| $750,000 to $999,999 | 8 (1.8%) | 15 (4.1%) |
| $1,000,000 or more | 0 (0.0%) | 7 (1.9%) |
| Total | 433 (100.0%) | 366 (100.0%) |
Household Income by Mortgage Status in Conneaut Lakeshore
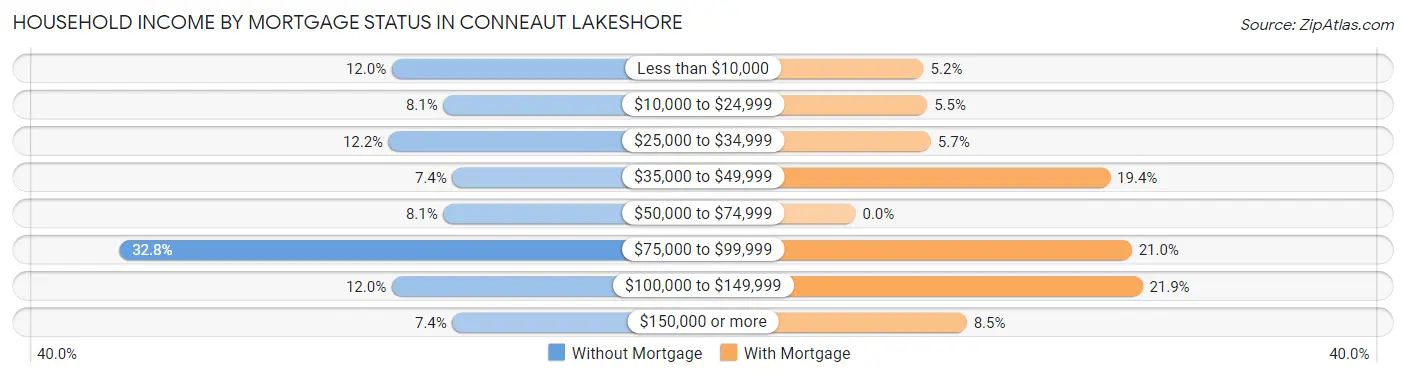
| Household Income | Without Mortgage | With Mortgage |
| Less than $10,000 | 52 (12.0%) | 19 (5.2%) |
| $10,000 to $24,999 | 35 (8.1%) | 20 (5.5%) |
| $25,000 to $34,999 | 53 (12.2%) | 21 (5.7%) |
| $35,000 to $49,999 | 32 (7.4%) | 71 (19.4%) |
| $50,000 to $74,999 | 35 (8.1%) | 0 (0.0%) |
| $75,000 to $99,999 | 142 (32.8%) | 77 (21.0%) |
| $100,000 to $149,999 | 52 (12.0%) | 80 (21.9%) |
| $150,000 or more | 32 (7.4%) | 31 (8.5%) |
| Total | 433 (100.0%) | 366 (100.0%) |
Property Value to Household Income Ratio in Conneaut Lakeshore
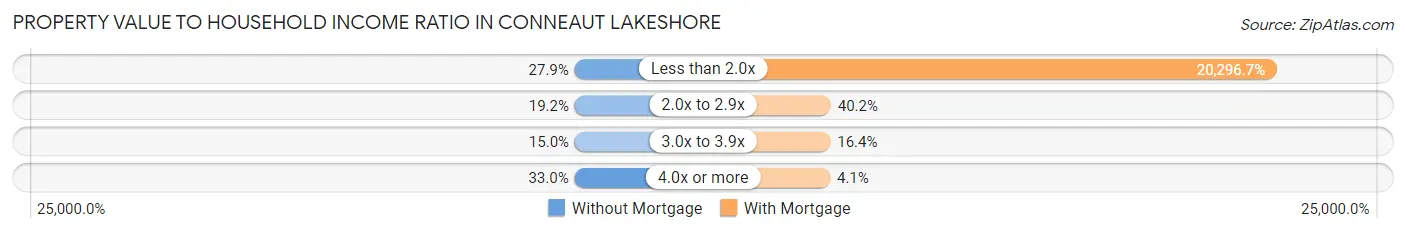
| Value-to-Income Ratio | Without Mortgage | With Mortgage |
| Less than 2.0x | 121 (27.9%) | 74,286 (20,296.7%) |
| 2.0x to 2.9x | 83 (19.2%) | 147 (40.2%) |
| 3.0x to 3.9x | 65 (15.0%) | 60 (16.4%) |
| 4.0x or more | 143 (33.0%) | 15 (4.1%) |
| Total | 433 (100.0%) | 366 (100.0%) |
Real Estate Taxes by Mortgage Status in Conneaut Lakeshore

| Property Taxes | Without Mortgage | With Mortgage |
| Less than $800 | 38 (8.8%) | 0 (0.0%) |
| $800 to $1,499 | 107 (24.7%) | 25 (6.8%) |
| $800 to $1,499 | 278 (64.2%) | 54 (14.7%) |
| Total | 433 (100.0%) | 366 (100.0%) |
Health & Disability in Conneaut Lakeshore
Health Insurance Coverage by Age in Conneaut Lakeshore
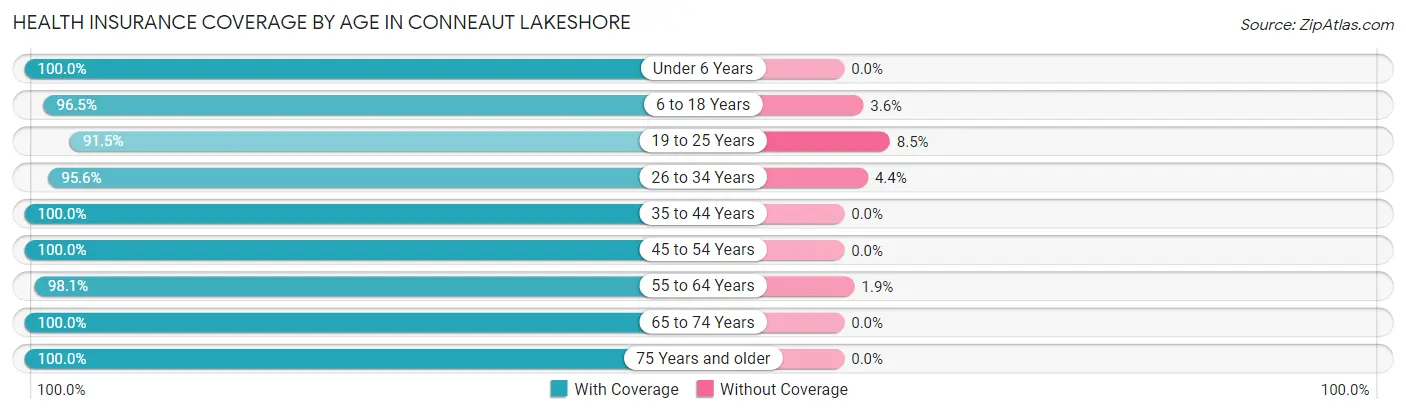
| Age Bracket | With Coverage | Without Coverage |
| Under 6 Years | 57 (100.0%) | 0 (0.0%) |
| 6 to 18 Years | 163 (96.5%) | 6 (3.5%) |
| 19 to 25 Years | 97 (91.5%) | 9 (8.5%) |
| 26 to 34 Years | 173 (95.6%) | 8 (4.4%) |
| 35 to 44 Years | 160 (100.0%) | 0 (0.0%) |
| 45 to 54 Years | 278 (100.0%) | 0 (0.0%) |
| 55 to 64 Years | 408 (98.1%) | 8 (1.9%) |
| 65 to 74 Years | 365 (100.0%) | 0 (0.0%) |
| 75 Years and older | 201 (100.0%) | 0 (0.0%) |
| Total | 1,902 (98.4%) | 31 (1.6%) |
Health Insurance Coverage by Citizenship Status in Conneaut Lakeshore
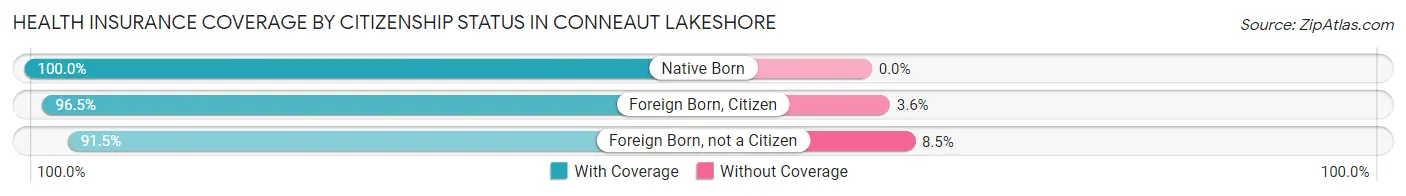
| Citizenship Status | With Coverage | Without Coverage |
| Native Born | 57 (100.0%) | 0 (0.0%) |
| Foreign Born, Citizen | 163 (96.5%) | 6 (3.5%) |
| Foreign Born, not a Citizen | 97 (91.5%) | 9 (8.5%) |
Health Insurance Coverage by Household Income in Conneaut Lakeshore
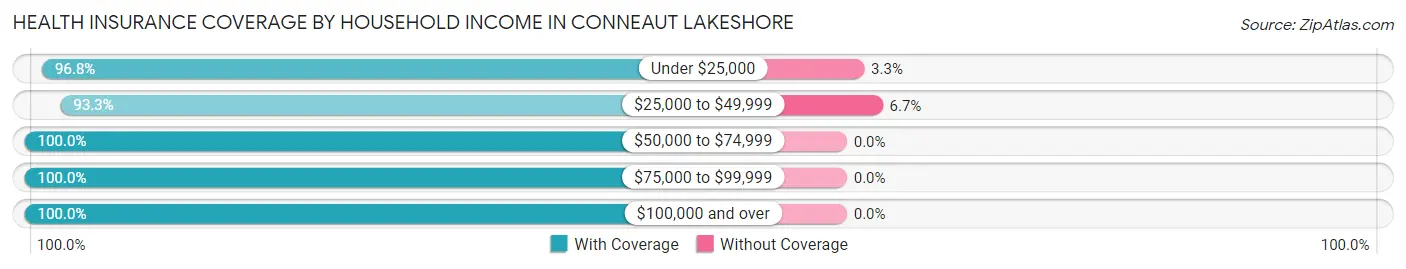
| Household Income | With Coverage | Without Coverage |
| Under $25,000 | 268 (96.8%) | 9 (3.3%) |
| $25,000 to $49,999 | 306 (93.3%) | 22 (6.7%) |
| $50,000 to $74,999 | 215 (100.0%) | 0 (0.0%) |
| $75,000 to $99,999 | 514 (100.0%) | 0 (0.0%) |
| $100,000 and over | 599 (100.0%) | 0 (0.0%) |
Public vs Private Health Insurance Coverage by Age in Conneaut Lakeshore
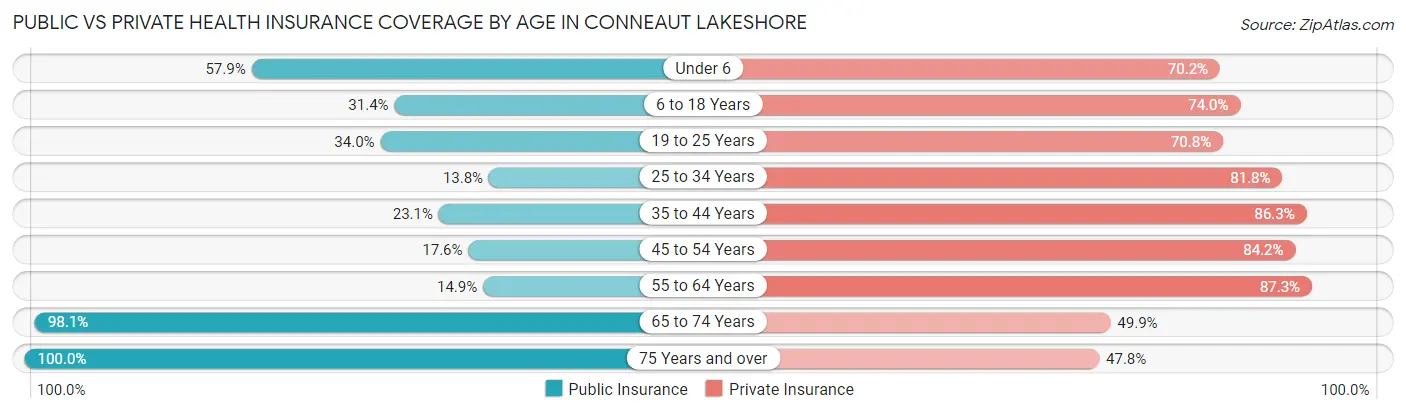
| Age Bracket | Public Insurance | Private Insurance |
| Under 6 | 33 (57.9%) | 40 (70.2%) |
| 6 to 18 Years | 53 (31.4%) | 125 (74.0%) |
| 19 to 25 Years | 36 (34.0%) | 75 (70.8%) |
| 25 to 34 Years | 25 (13.8%) | 148 (81.8%) |
| 35 to 44 Years | 37 (23.1%) | 138 (86.3%) |
| 45 to 54 Years | 49 (17.6%) | 234 (84.2%) |
| 55 to 64 Years | 62 (14.9%) | 363 (87.3%) |
| 65 to 74 Years | 358 (98.1%) | 182 (49.9%) |
| 75 Years and over | 201 (100.0%) | 96 (47.8%) |
| Total | 854 (44.2%) | 1,401 (72.5%) |
Disability Status by Sex by Age in Conneaut Lakeshore
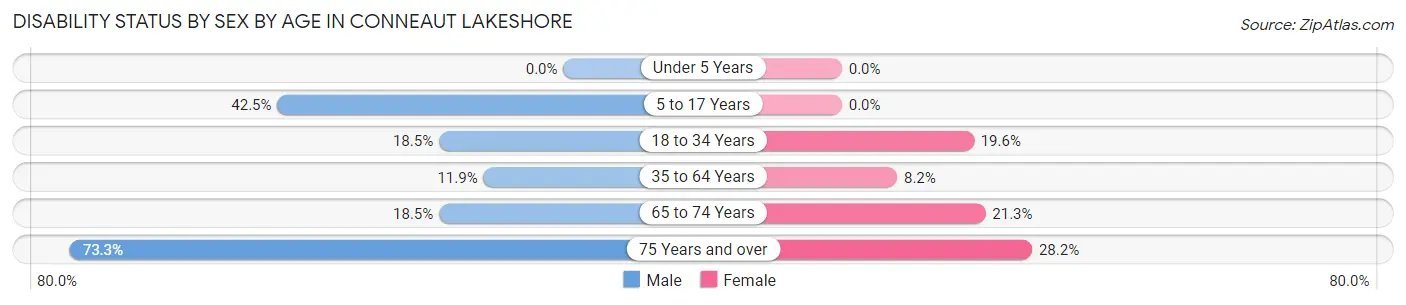
| Age Bracket | Male | Female |
| Under 5 Years | 0 (0.0%) | 0 (0.0%) |
| 5 to 17 Years | 31 (42.5%) | 0 (0.0%) |
| 18 to 34 Years | 29 (18.5%) | 29 (19.6%) |
| 35 to 64 Years | 42 (11.9%) | 41 (8.2%) |
| 65 to 74 Years | 31 (18.4%) | 42 (21.3%) |
| 75 Years and over | 85 (73.3%) | 24 (28.2%) |
Disability Class by Sex by Age in Conneaut Lakeshore
Disability Class: Hearing Difficulty
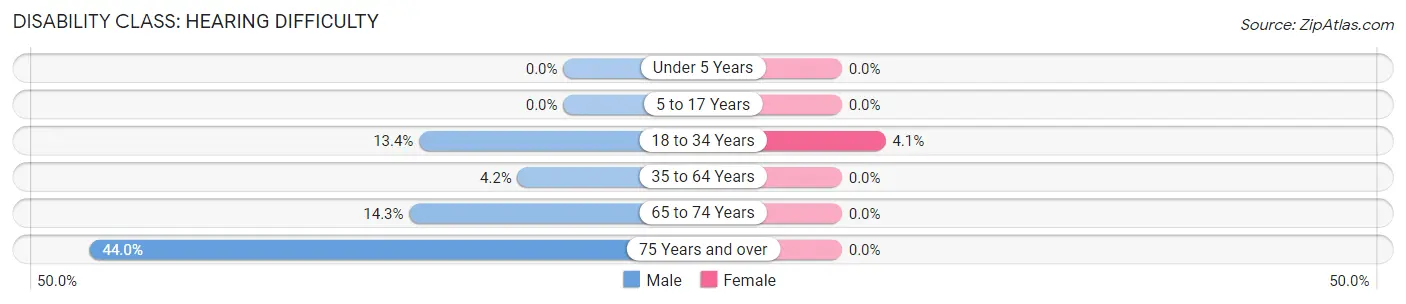
| Age Bracket | Male | Female |
| Under 5 Years | 0 (0.0%) | 0 (0.0%) |
| 5 to 17 Years | 0 (0.0%) | 0 (0.0%) |
| 18 to 34 Years | 21 (13.4%) | 6 (4.1%) |
| 35 to 64 Years | 15 (4.2%) | 0 (0.0%) |
| 65 to 74 Years | 24 (14.3%) | 0 (0.0%) |
| 75 Years and over | 51 (44.0%) | 0 (0.0%) |
Disability Class: Vision Difficulty
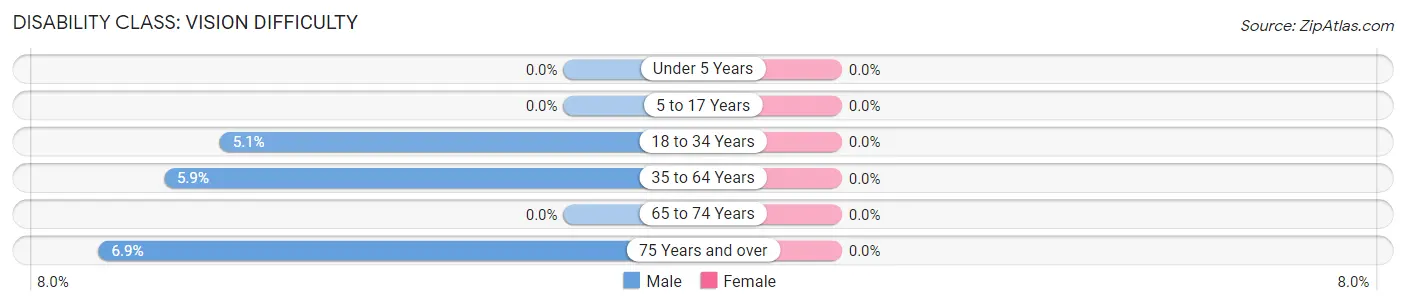
| Age Bracket | Male | Female |
| Under 5 Years | 0 (0.0%) | 0 (0.0%) |
| 5 to 17 Years | 0 (0.0%) | 0 (0.0%) |
| 18 to 34 Years | 8 (5.1%) | 0 (0.0%) |
| 35 to 64 Years | 21 (5.9%) | 0 (0.0%) |
| 65 to 74 Years | 0 (0.0%) | 0 (0.0%) |
| 75 Years and over | 8 (6.9%) | 0 (0.0%) |
Disability Class: Cognitive Difficulty
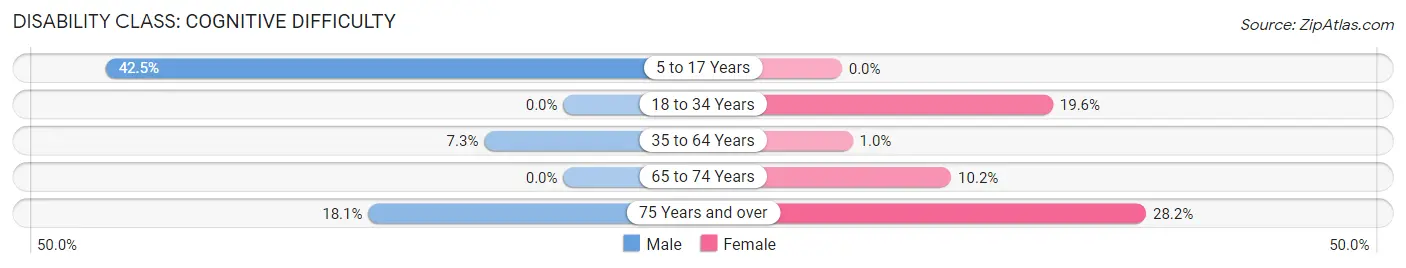
| Age Bracket | Male | Female |
| 5 to 17 Years | 31 (42.5%) | 0 (0.0%) |
| 18 to 34 Years | 0 (0.0%) | 29 (19.6%) |
| 35 to 64 Years | 26 (7.3%) | 5 (1.0%) |
| 65 to 74 Years | 0 (0.0%) | 20 (10.2%) |
| 75 Years and over | 21 (18.1%) | 24 (28.2%) |
Disability Class: Ambulatory Difficulty
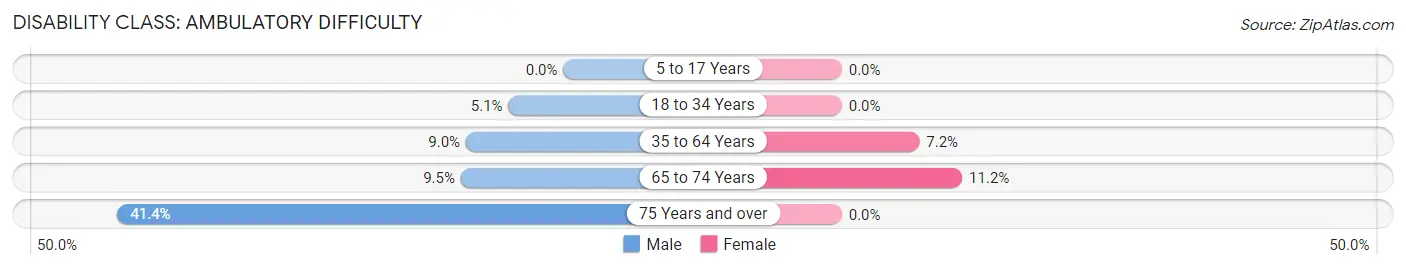
| Age Bracket | Male | Female |
| 5 to 17 Years | 0 (0.0%) | 0 (0.0%) |
| 18 to 34 Years | 8 (5.1%) | 0 (0.0%) |
| 35 to 64 Years | 32 (9.0%) | 36 (7.2%) |
| 65 to 74 Years | 16 (9.5%) | 22 (11.2%) |
| 75 Years and over | 48 (41.4%) | 0 (0.0%) |
Disability Class: Self-Care Difficulty
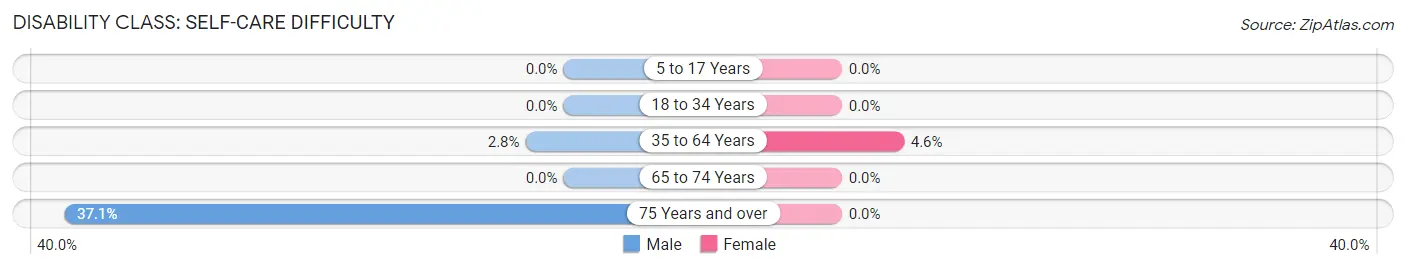
| Age Bracket | Male | Female |
| 5 to 17 Years | 0 (0.0%) | 0 (0.0%) |
| 18 to 34 Years | 0 (0.0%) | 0 (0.0%) |
| 35 to 64 Years | 10 (2.8%) | 23 (4.6%) |
| 65 to 74 Years | 0 (0.0%) | 0 (0.0%) |
| 75 Years and over | 43 (37.1%) | 0 (0.0%) |
Technology Access in Conneaut Lakeshore
Computing Device Access in Conneaut Lakeshore
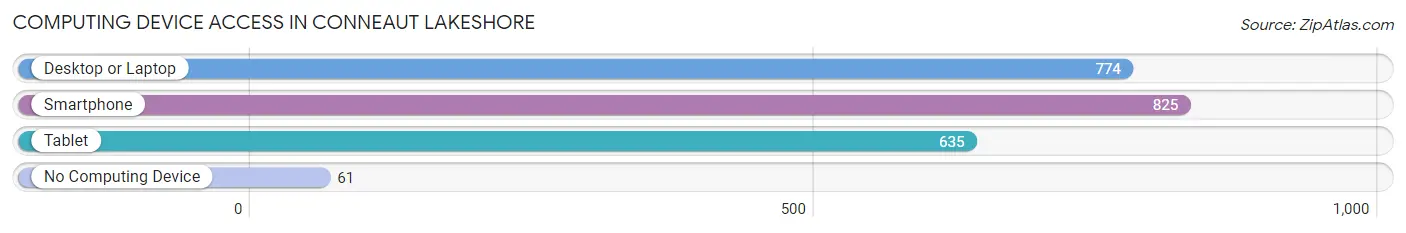
| Device Type | # Households | % Households |
| Desktop or Laptop | 774 | 78.4% |
| Smartphone | 825 | 83.6% |
| Tablet | 635 | 64.3% |
| No Computing Device | 61 | 6.2% |
| Total | 987 | 100.0% |
Internet Access in Conneaut Lakeshore
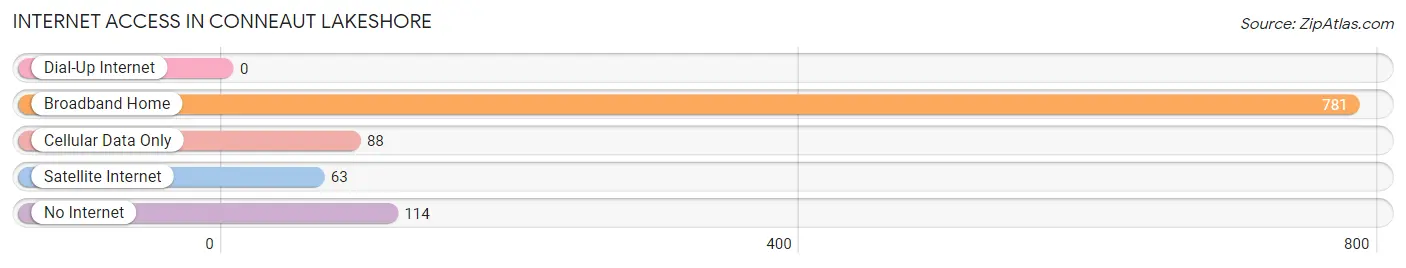
| Internet Type | # Households | % Households |
| Dial-Up Internet | 0 | 0.0% |
| Broadband Home | 781 | 79.1% |
| Cellular Data Only | 88 | 8.9% |
| Satellite Internet | 63 | 6.4% |
| No Internet | 114 | 11.6% |
| Total | 987 | 100.0% |
Conneaut Lakeshore Summary
Conneaut Lakeshore, Pennsylvania is a small town located in Crawford County, Pennsylvania. It is situated on the eastern shore of Lake Erie, and is part of the Erie Metropolitan Statistical Area. The town has a population of approximately 1,500 people, and is known for its beautiful lakefront scenery and recreational activities.
History
The area that is now Conneaut Lakeshore was first settled in the early 1800s by settlers from New England. The town was originally known as “Conneautville”, and was incorporated in 1837. The town was named after the nearby Conneaut Creek, which was named after the Native American tribe that once lived in the area.
In the late 1800s, the town began to develop as a resort destination. The first hotel was built in 1876, and the town soon became a popular destination for vacationers. The town was also home to several amusement parks, including the Conneaut Lake Park, which opened in 1892.
The town experienced a period of decline in the mid-1900s, as the popularity of the amusement parks began to wane. However, the town has since experienced a resurgence in popularity, and is now a popular destination for tourists and vacationers.
Geography
Conneaut Lakeshore is located in the northwest corner of Crawford County, Pennsylvania. It is situated on the eastern shore of Lake Erie, and is part of the Erie Metropolitan Statistical Area. The town is bordered by the towns of Conneautville, Linesville, and Meadville.
The town has a total area of 1.3 square miles, all of which is land. The town is located at an elevation of 845 feet above sea level. The town is located in a humid continental climate zone, and experiences warm summers and cold winters.
Economy
The economy of Conneaut Lakeshore is largely based on tourism and recreation. The town is home to several popular tourist attractions, including the Conneaut Lake Park, which is one of the oldest amusement parks in the United States. The town is also home to several marinas, which offer boat rentals and other recreational activities.
In addition to tourism, the town is also home to several small businesses, including restaurants, retail stores, and other services. The town is also home to several manufacturing companies, which produce a variety of products, including furniture, clothing, and automotive parts.
Demographics
As of the 2010 census, the population of Conneaut Lakeshore was 1,500 people. The town has a population density of 1,150 people per square mile. The median age of the population is 44.7 years, and the median household income is $41,250.
The town is predominantly white, with 92.3% of the population identifying as white. The town also has a small Hispanic population, with 4.3% of the population identifying as Hispanic or Latino. The town also has a small African American population, with 1.3% of the population identifying as African American.
Conclusion
Conneaut Lakeshore, Pennsylvania is a small town located in Crawford County, Pennsylvania. It is situated on the eastern shore of Lake Erie, and is part of the Erie Metropolitan Statistical Area. The town has a population of approximately 1,500 people, and is known for its beautiful lakefront scenery and recreational activities. The economy of the town is largely based on tourism and recreation, and the town is home to several popular tourist attractions. The town is predominantly white, with 92.3% of the population identifying as white. The town also has a small Hispanic population, with 4.3% of the population identifying as Hispanic or Latino. The town also has a small African American population, with 1.3% of the population identifying as African American.
Common Questions
What is Per Capita Income in Conneaut Lakeshore?
Per Capita income in Conneaut Lakeshore is $40,983.
What is the Median Family Income in Conneaut Lakeshore?
Median Family Income in Conneaut Lakeshore is $93,299.
What is the Median Household income in Conneaut Lakeshore?
Median Household Income in Conneaut Lakeshore is $67,063.
What is Income or Wage Gap in Conneaut Lakeshore?
Income or Wage Gap in Conneaut Lakeshore is 48.5%.
Women in Conneaut Lakeshore earn 51.5 cents for every dollar earned by a man.
What is Inequality or Gini Index in Conneaut Lakeshore?
Inequality or Gini Index in Conneaut Lakeshore is 0.47.
What is the Total Population of Conneaut Lakeshore?
Total Population of Conneaut Lakeshore is 1,933.
What is the Total Male Population of Conneaut Lakeshore?
Total Male Population of Conneaut Lakeshore is 901.
What is the Total Female Population of Conneaut Lakeshore?
Total Female Population of Conneaut Lakeshore is 1,032.
What is the Ratio of Males per 100 Females in Conneaut Lakeshore?
There are 87.31 Males per 100 Females in Conneaut Lakeshore.
What is the Ratio of Females per 100 Males in Conneaut Lakeshore?
There are 114.54 Females per 100 Males in Conneaut Lakeshore.
What is the Median Population Age in Conneaut Lakeshore?
Median Population Age in Conneaut Lakeshore is 55.5 Years.
What is the Average Family Size in Conneaut Lakeshore
Average Family Size in Conneaut Lakeshore is 2.6 People.
What is the Average Household Size in Conneaut Lakeshore
Average Household Size in Conneaut Lakeshore is 2.0 People.
How Large is the Labor Force in Conneaut Lakeshore?
There are 859 People in the Labor Forcein in Conneaut Lakeshore.
What is the Percentage of People in the Labor Force in Conneaut Lakeshore?
49.1% of People are in the Labor Force in Conneaut Lakeshore.
What is the Unemployment Rate in Conneaut Lakeshore?
Unemployment Rate in Conneaut Lakeshore is 5.5%.