Conestoga, PA Map & Demographics
Conestoga Map
Conestoga Overview
$37,356
PER CAPITA INCOME
$83,942
AVG FAMILY INCOME
$79,722
AVG HOUSEHOLD INCOME
44.4%
WAGE / INCOME GAP [ % ]
55.6¢/ $1
WAGE / INCOME GAP [ $ ]
0.41
INEQUALITY / GINI INDEX
1,228
TOTAL POPULATION
512
MALE POPULATION
716
FEMALE POPULATION
71.51
MALES / 100 FEMALES
139.84
FEMALES / 100 MALES
49.5
MEDIAN AGE
2.7
AVG FAMILY SIZE
2.6
AVG HOUSEHOLD SIZE
687
LABOR FORCE [ PEOPLE ]
65.0%
PERCENT IN LABOR FORCE
Conestoga Zip Codes
Conestoga Area Codes
Income in Conestoga
Income Overview in Conestoga
Per Capita Income in Conestoga is $37,356, while median incomes of families and households are $83,942 and $79,722 respectively.
| Characteristic | Number | Measure |
| Per Capita Income | 1,228 | $37,356 |
| Median Family Income | 389 | $83,942 |
| Mean Family Income | 389 | $103,206 |
| Median Household Income | 472 | $79,722 |
| Mean Household Income | 472 | $97,055 |
| Income Deficit | 389 | $0 |
| Wage / Income Gap (%) | 1,228 | 44.37% |
| Wage / Income Gap ($) | 1,228 | 55.63¢ per $1 |
| Gini / Inequality Index | 1,228 | 0.41 |
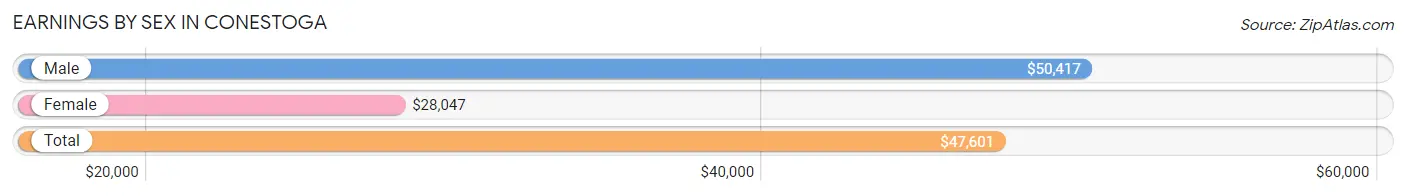
Earnings by Sex in Conestoga
Average Earnings in Conestoga are $47,601, $50,417 for men and $28,047 for women, a difference of 44.4%.
| Sex | Number | Average Earnings |
| Male | 338 (47.5%) | $50,417 |
| Female | 373 (52.5%) | $28,047 |
| Total | 711 (100.0%) | $47,601 |
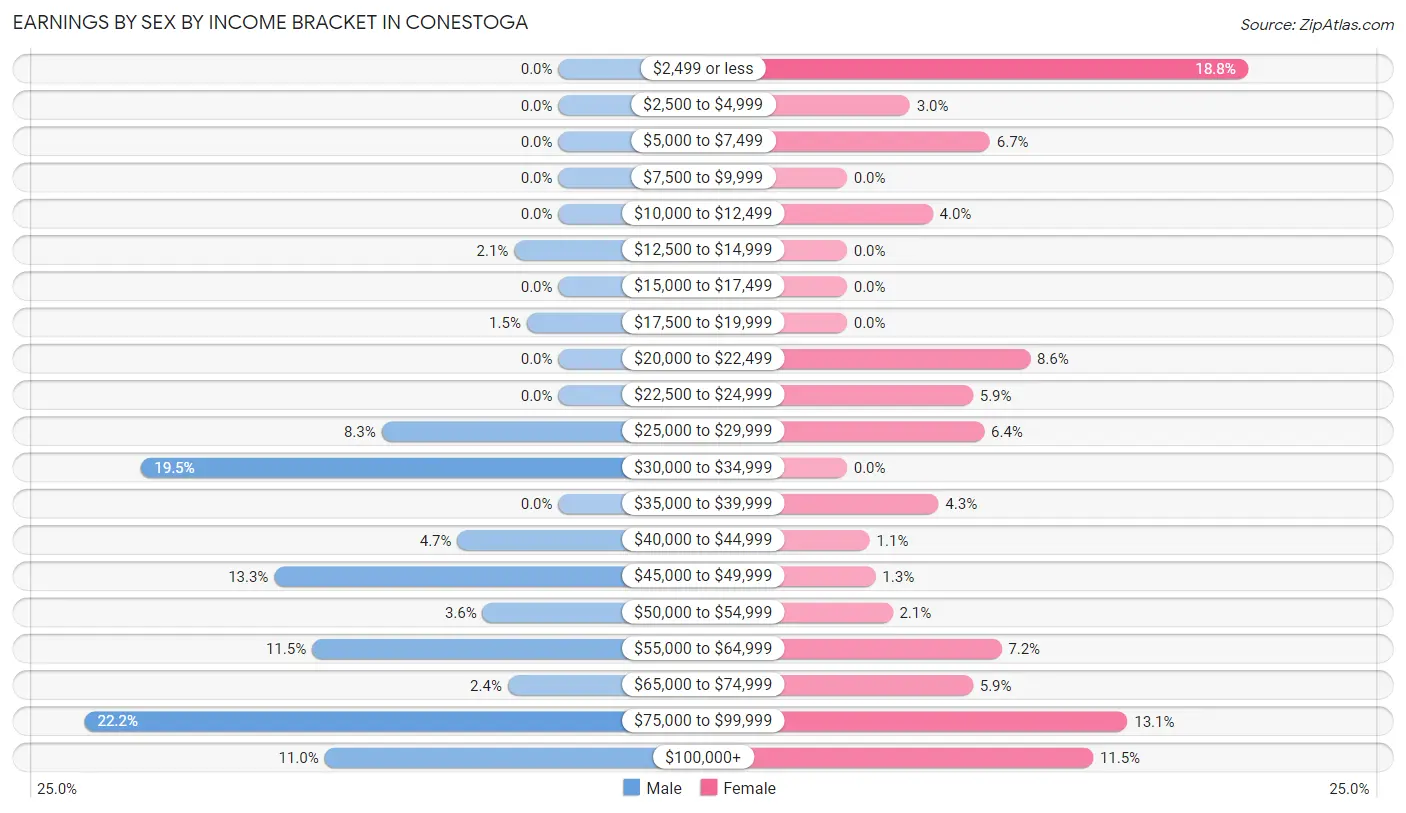
Earnings by Sex by Income Bracket in Conestoga
The most common earnings brackets in Conestoga are $75,000 to $99,999 for men (75 | 22.2%) and $2,499 or less for women (70 | 18.8%).
| Income | Male | Female |
| $2,499 or less | 0 (0.0%) | 70 (18.8%) |
| $2,500 to $4,999 | 0 (0.0%) | 11 (2.9%) |
| $5,000 to $7,499 | 0 (0.0%) | 25 (6.7%) |
| $7,500 to $9,999 | 0 (0.0%) | 0 (0.0%) |
| $10,000 to $12,499 | 0 (0.0%) | 15 (4.0%) |
| $12,500 to $14,999 | 7 (2.1%) | 0 (0.0%) |
| $15,000 to $17,499 | 0 (0.0%) | 0 (0.0%) |
| $17,500 to $19,999 | 5 (1.5%) | 0 (0.0%) |
| $20,000 to $22,499 | 0 (0.0%) | 32 (8.6%) |
| $22,500 to $24,999 | 0 (0.0%) | 22 (5.9%) |
| $25,000 to $29,999 | 28 (8.3%) | 24 (6.4%) |
| $30,000 to $34,999 | 66 (19.5%) | 0 (0.0%) |
| $35,000 to $39,999 | 0 (0.0%) | 16 (4.3%) |
| $40,000 to $44,999 | 16 (4.7%) | 4 (1.1%) |
| $45,000 to $49,999 | 45 (13.3%) | 5 (1.3%) |
| $50,000 to $54,999 | 12 (3.5%) | 8 (2.1%) |
| $55,000 to $64,999 | 39 (11.5%) | 27 (7.2%) |
| $65,000 to $74,999 | 8 (2.4%) | 22 (5.9%) |
| $75,000 to $99,999 | 75 (22.2%) | 49 (13.1%) |
| $100,000+ | 37 (11.0%) | 43 (11.5%) |
| Total | 338 (100.0%) | 373 (100.0%) |
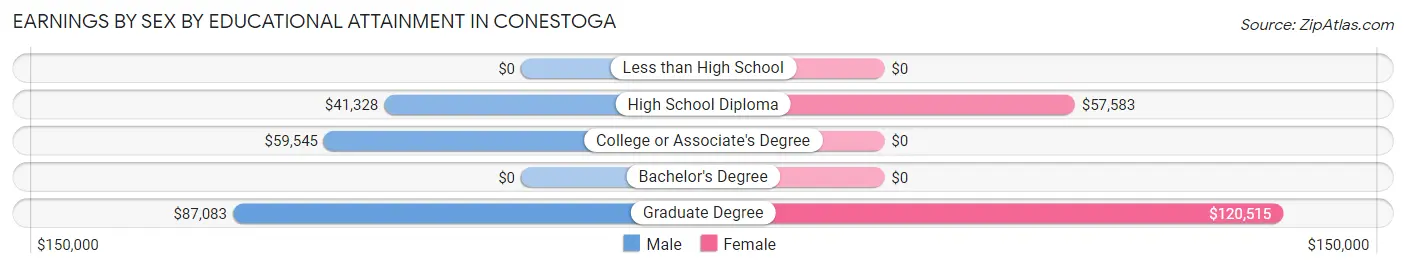
Earnings by Sex by Educational Attainment in Conestoga
Average earnings in Conestoga are $52,396 for men and $45,500 for women, a difference of 13.2%. Men with an educational attainment of graduate degree enjoy the highest average annual earnings of $87,083, while those with high school diploma education earn the least with $41,328. Women with an educational attainment of graduate degree earn the most with the average annual earnings of $120,515, while those with high school diploma education have the smallest earnings of $57,583.
| Educational Attainment | Male Income | Female Income |
| Less than High School | - | - |
| High School Diploma | $41,328 | $57,583 |
| College or Associate's Degree | $59,545 | $0 |
| Bachelor's Degree | - | - |
| Graduate Degree | $87,083 | $120,515 |
| Total | $52,396 | $45,500 |
Family Income in Conestoga
Family Income Brackets in Conestoga
According to the Conestoga family income data, there are 72 families falling into the $200,000+ income range, which is the most common income bracket and makes up 18.5% of all families.
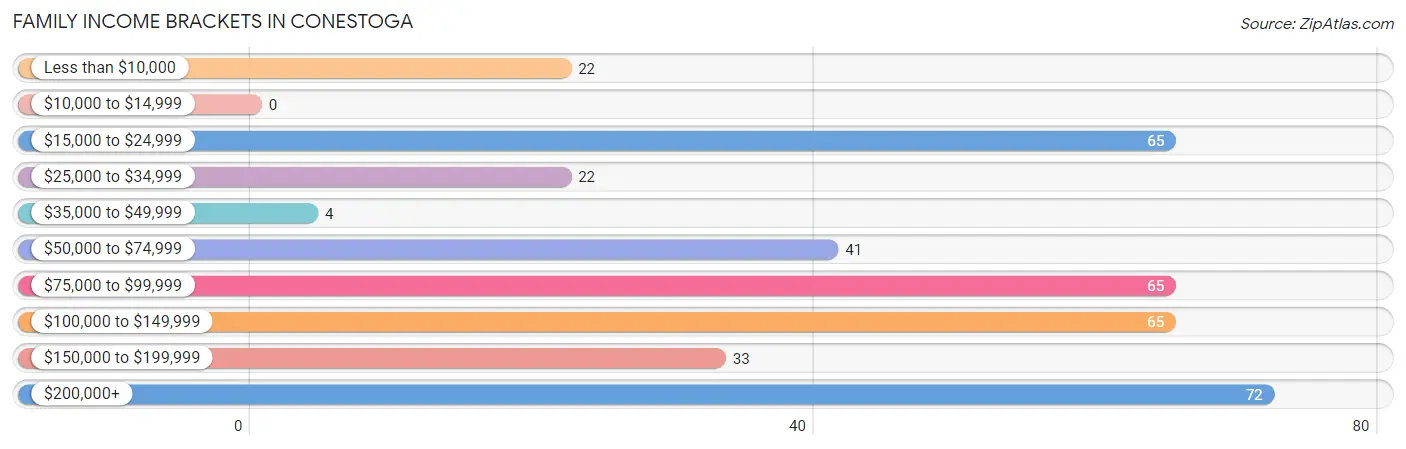
| Income Bracket | # Families | % Families |
| Less than $10,000 | 22 | 5.7% |
| $10,000 to $14,999 | 0 | 0.0% |
| $15,000 to $24,999 | 65 | 16.7% |
| $25,000 to $34,999 | 22 | 5.7% |
| $35,000 to $49,999 | 4 | 1.0% |
| $50,000 to $74,999 | 41 | 10.5% |
| $75,000 to $99,999 | 65 | 16.7% |
| $100,000 to $149,999 | 65 | 16.7% |
| $150,000 to $199,999 | 33 | 8.5% |
| $200,000+ | 72 | 18.5% |
Family Income by Famaliy Size in Conestoga
4-person families (50 | 12.9%) account for the highest median family income in Conestoga with $136,875 per family, while 2-person families (253 | 65.0%) have the highest median income of $40,547 per family member.
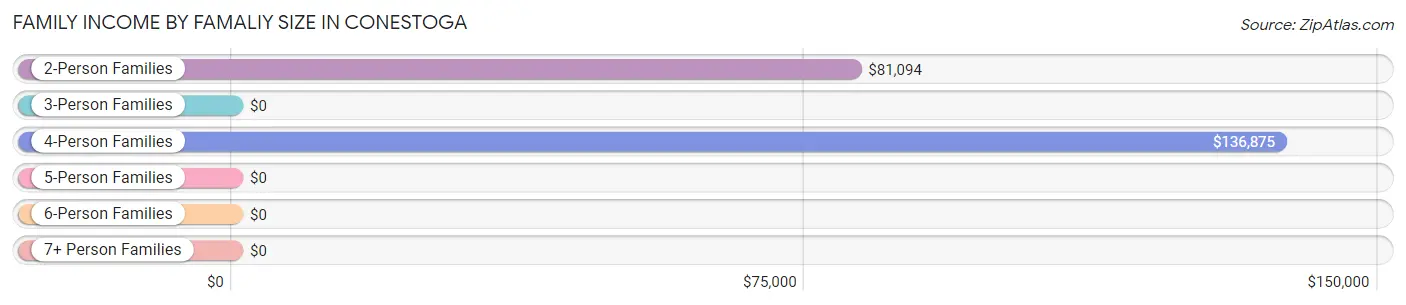
| Income Bracket | # Families | Median Income |
| 2-Person Families | 253 (65.0%) | $81,094 |
| 3-Person Families | 50 (12.9%) | $0 |
| 4-Person Families | 50 (12.9%) | $136,875 |
| 5-Person Families | 15 (3.9%) | $0 |
| 6-Person Families | 21 (5.4%) | $0 |
| 7+ Person Families | 0 (0.0%) | $0 |
| Total | 389 (100.0%) | $83,942 |
Family Income by Number of Earners in Conestoga
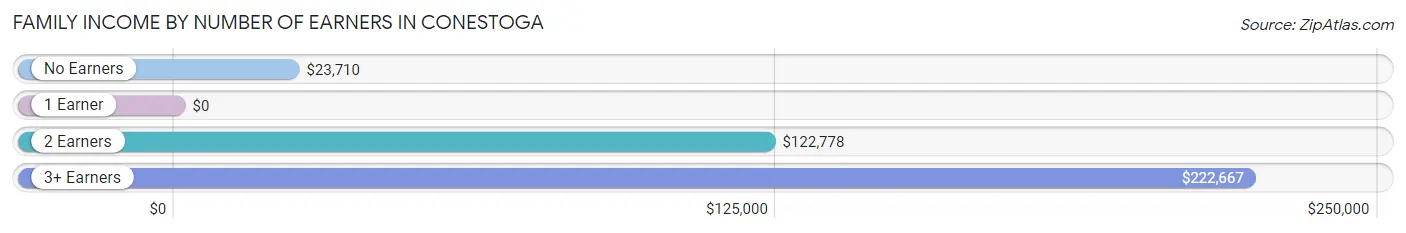
| Number of Earners | # Families | Median Income |
| No Earners | 98 (25.2%) | $23,710 |
| 1 Earner | 51 (13.1%) | $0 |
| 2 Earners | 212 (54.5%) | $122,778 |
| 3+ Earners | 28 (7.2%) | $222,667 |
| Total | 389 (100.0%) | $83,942 |
Household Income in Conestoga
Household Income Brackets in Conestoga
With 90 households falling in the category, the $75,000 to $99,999 income range is the most frequent in Conestoga, accounting for 19.1% of all households.
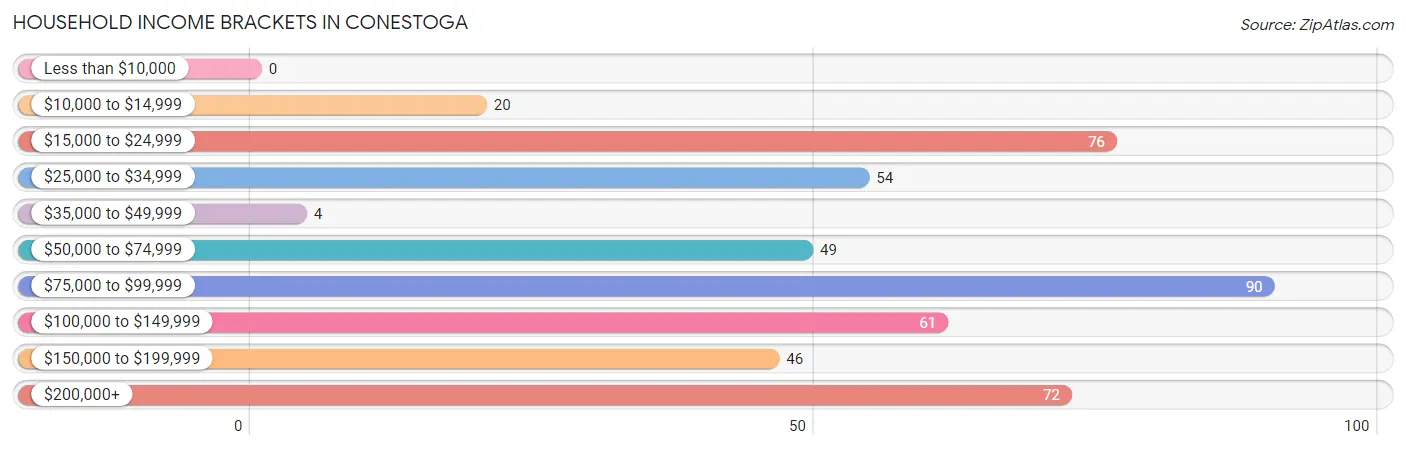
| Income Bracket | # Households | % Households |
| Less than $10,000 | 0 | 0.0% |
| $10,000 to $14,999 | 20 | 4.2% |
| $15,000 to $24,999 | 76 | 16.1% |
| $25,000 to $34,999 | 54 | 11.4% |
| $35,000 to $49,999 | 4 | 0.8% |
| $50,000 to $74,999 | 49 | 10.4% |
| $75,000 to $99,999 | 90 | 19.1% |
| $100,000 to $149,999 | 61 | 12.9% |
| $150,000 to $199,999 | 46 | 9.7% |
| $200,000+ | 72 | 15.3% |
Household Income by Householder Age in Conestoga
The median household income in Conestoga is $79,722, with the highest median household income of $119,643 found in the 45 to 64 years age bracket for the primary householder. A total of 232 households (49.1%) fall into this category.
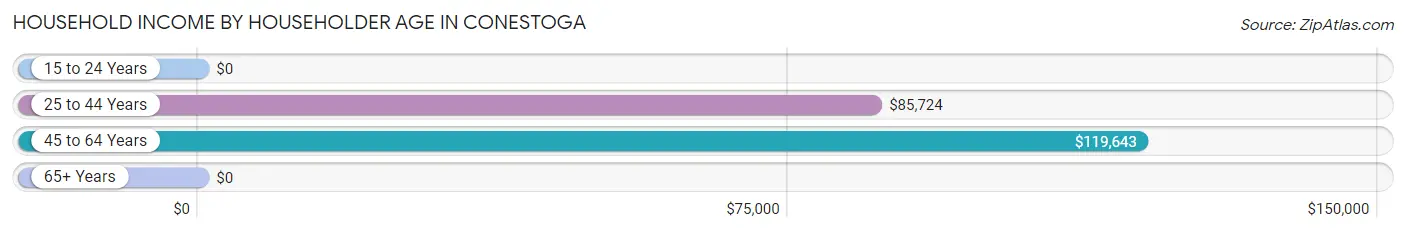
| Income Bracket | # Households | Median Income |
| 15 to 24 Years | 0 (0.0%) | $0 |
| 25 to 44 Years | 119 (25.2%) | $85,724 |
| 45 to 64 Years | 232 (49.1%) | $119,643 |
| 65+ Years | 121 (25.6%) | $0 |
| Total | 472 (100.0%) | $79,722 |
Poverty in Conestoga
Income Below Poverty by Sex and Age in Conestoga
With 12.9% poverty level for males and 17.5% for females among the residents of Conestoga, 55 to 64 year old males and 18 to 24 year old females are the most vulnerable to poverty, with 34 males (29.6%) and 36 females (34.9%) in their respective age groups living below the poverty level.
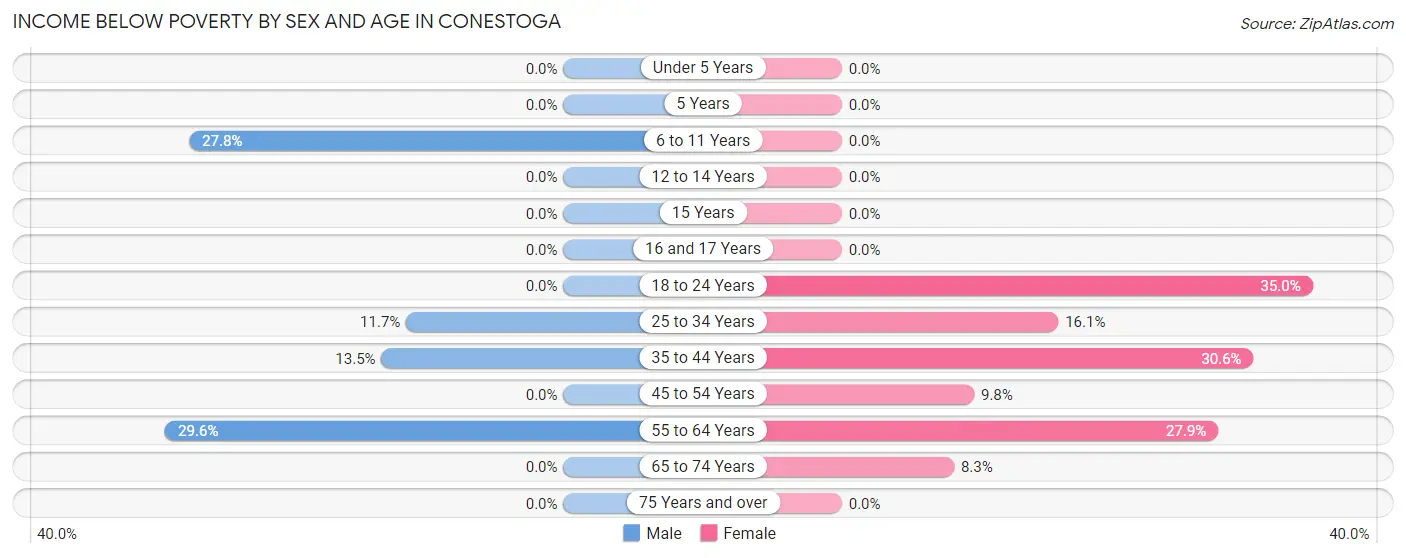
| Age Bracket | Male | Female |
| Under 5 Years | 0 (0.0%) | 0 (0.0%) |
| 5 Years | 0 (0.0%) | 0 (0.0%) |
| 6 to 11 Years | 15 (27.8%) | 0 (0.0%) |
| 12 to 14 Years | 0 (0.0%) | 0 (0.0%) |
| 15 Years | 0 (0.0%) | 0 (0.0%) |
| 16 and 17 Years | 0 (0.0%) | 0 (0.0%) |
| 18 to 24 Years | 0 (0.0%) | 36 (34.9%) |
| 25 to 34 Years | 7 (11.7%) | 9 (16.1%) |
| 35 to 44 Years | 10 (13.5%) | 22 (30.6%) |
| 45 to 54 Years | 0 (0.0%) | 11 (9.8%) |
| 55 to 64 Years | 34 (29.6%) | 38 (27.9%) |
| 65 to 74 Years | 0 (0.0%) | 9 (8.3%) |
| 75 Years and over | 0 (0.0%) | 0 (0.0%) |
| Total | 66 (12.9%) | 125 (17.5%) |
Income Above Poverty by Sex and Age in Conestoga
According to the poverty statistics in Conestoga, males aged 5 years and females aged under 5 years are the age groups that are most secure financially, with 100.0% of males and 100.0% of females in these age groups living above the poverty line.
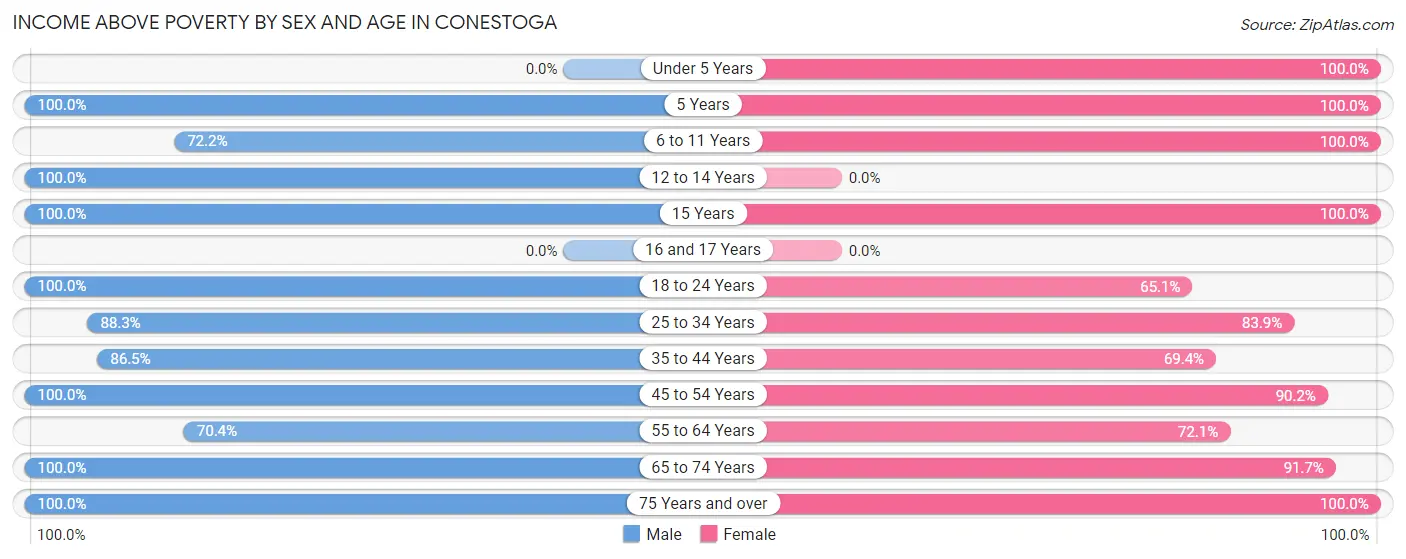
| Age Bracket | Male | Female |
| Under 5 Years | 0 (0.0%) | 20 (100.0%) |
| 5 Years | 13 (100.0%) | 11 (100.0%) |
| 6 to 11 Years | 39 (72.2%) | 33 (100.0%) |
| 12 to 14 Years | 10 (100.0%) | 0 (0.0%) |
| 15 Years | 5 (100.0%) | 25 (100.0%) |
| 16 and 17 Years | 0 (0.0%) | 0 (0.0%) |
| 18 to 24 Years | 19 (100.0%) | 67 (65.0%) |
| 25 to 34 Years | 53 (88.3%) | 47 (83.9%) |
| 35 to 44 Years | 64 (86.5%) | 50 (69.4%) |
| 45 to 54 Years | 104 (100.0%) | 101 (90.2%) |
| 55 to 64 Years | 81 (70.4%) | 98 (72.1%) |
| 65 to 74 Years | 43 (100.0%) | 99 (91.7%) |
| 75 Years and over | 15 (100.0%) | 40 (100.0%) |
| Total | 446 (87.1%) | 591 (82.5%) |
Income Below Poverty Among Married-Couple Families in Conestoga
The poverty statistics for married-couple families in Conestoga show that 10.7% or 34 of the total 319 families live below the poverty line. Families with no children have the highest poverty rate of 13.8%, comprising of 34 families. On the other hand, families with 1 or 2 children have the lowest poverty rate of 0.0%, which includes 0 families.
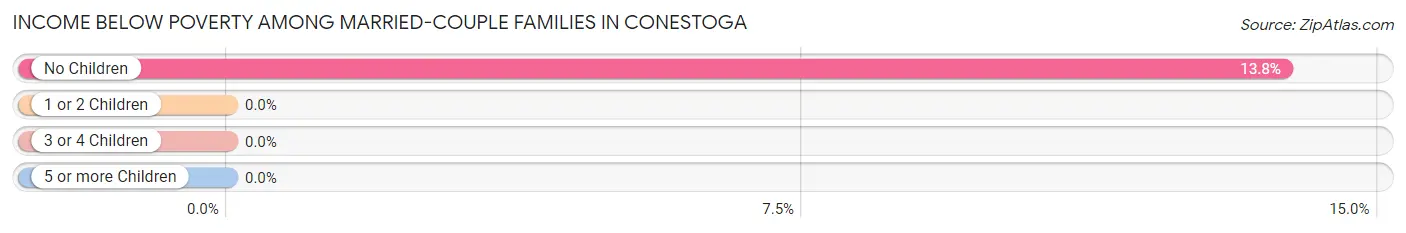
| Children | Above Poverty | Below Poverty |
| No Children | 213 (86.2%) | 34 (13.8%) |
| 1 or 2 Children | 51 (100.0%) | 0 (0.0%) |
| 3 or 4 Children | 21 (100.0%) | 0 (0.0%) |
| 5 or more Children | 0 (0.0%) | 0 (0.0%) |
| Total | 285 (89.3%) | 34 (10.7%) |
Income Below Poverty Among Single-Parent Households in Conestoga
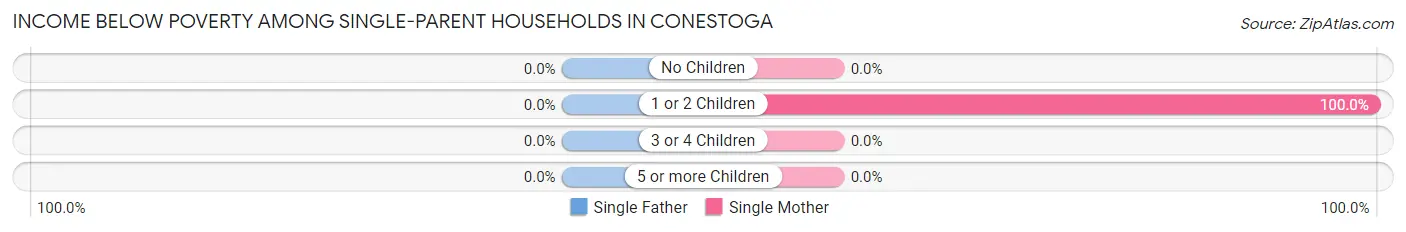
| Children | Single Father | Single Mother |
| No Children | 0 (0.0%) | 0 (0.0%) |
| 1 or 2 Children | 0 (0.0%) | 22 (100.0%) |
| 3 or 4 Children | 0 (0.0%) | 0 (0.0%) |
| 5 or more Children | 0 (0.0%) | 0 (0.0%) |
| Total | 0 (0.0%) | 22 (31.4%) |
Income Below Poverty Among Married-Couple vs Single-Parent Households in Conestoga
The poverty data for Conestoga shows that 34 of the married-couple family households (10.7%) and 22 of the single-parent households (31.4%) are living below the poverty level. Within the married-couple family households, those with no children have the highest poverty rate, with 34 households (13.8%) falling below the poverty line. Among the single-parent households, those with 1 or 2 children have the highest poverty rate, with 22 household (100.0%) living below poverty.
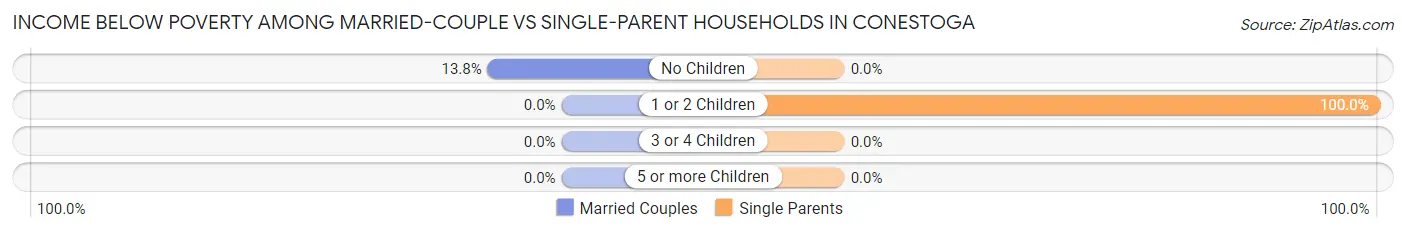
| Children | Married-Couple Families | Single-Parent Households |
| No Children | 34 (13.8%) | 0 (0.0%) |
| 1 or 2 Children | 0 (0.0%) | 22 (100.0%) |
| 3 or 4 Children | 0 (0.0%) | 0 (0.0%) |
| 5 or more Children | 0 (0.0%) | 0 (0.0%) |
| Total | 34 (10.7%) | 22 (31.4%) |
Race in Conestoga
The most populous races in Conestoga are White / Caucasian (1,084 | 88.3%), Asian (86 | 7.0%), and Two or more Races (58 | 4.7%).
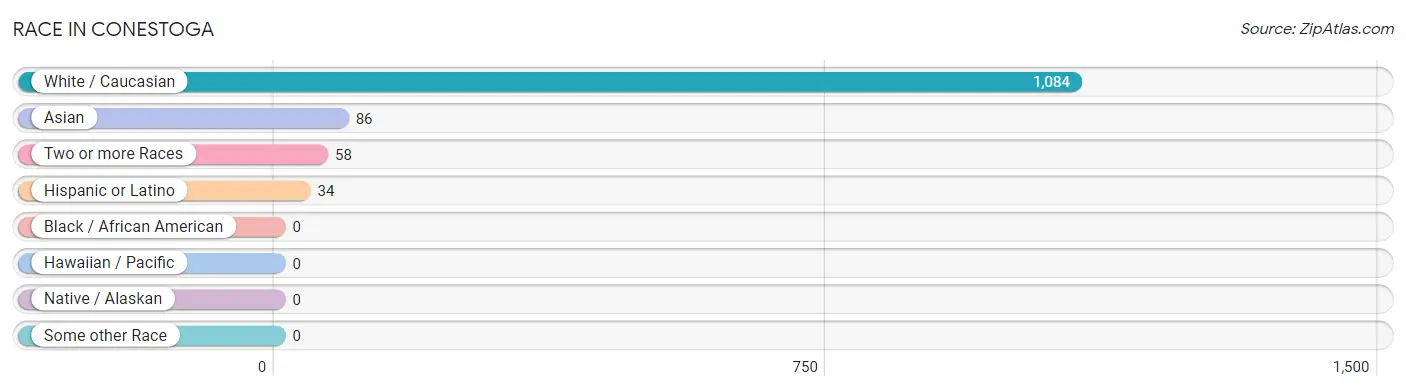
| Race | # Population | % Population |
| Asian | 86 | 7.0% |
| Black / African American | 0 | 0.0% |
| Hawaiian / Pacific | 0 | 0.0% |
| Hispanic or Latino | 34 | 2.8% |
| Native / Alaskan | 0 | 0.0% |
| White / Caucasian | 1,084 | 88.3% |
| Two or more Races | 58 | 4.7% |
| Some other Race | 0 | 0.0% |
| Total | 1,228 | 100.0% |
Ancestry in Conestoga
The most populous ancestries reported in Conestoga are German (350 | 28.5%), Irish (246 | 20.0%), American (182 | 14.8%), English (100 | 8.1%), and Thai (73 | 5.9%), together accounting for 77.4% of all Conestoga residents.
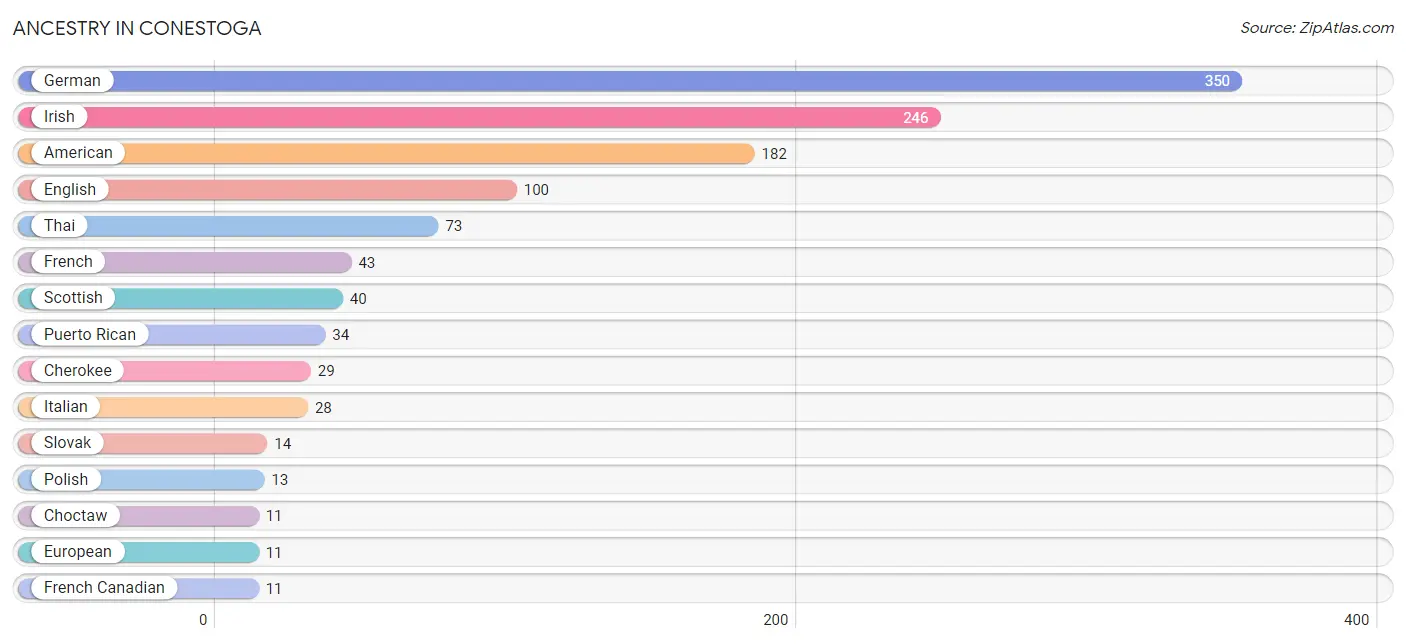
| Ancestry | # Population | % Population |
| American | 182 | 14.8% |
| Austrian | 8 | 0.6% |
| Cherokee | 29 | 2.4% |
| Choctaw | 11 | 0.9% |
| English | 100 | 8.1% |
| European | 11 | 0.9% |
| French | 43 | 3.5% |
| French Canadian | 11 | 0.9% |
| German | 350 | 28.5% |
| Irish | 246 | 20.0% |
| Italian | 28 | 2.3% |
| Polish | 13 | 1.1% |
| Puerto Rican | 34 | 2.8% |
| Scotch-Irish | 9 | 0.7% |
| Scottish | 40 | 3.3% |
| Slovak | 14 | 1.1% |
| Swiss | 9 | 0.7% |
| Thai | 73 | 5.9% | View All 18 Rows |
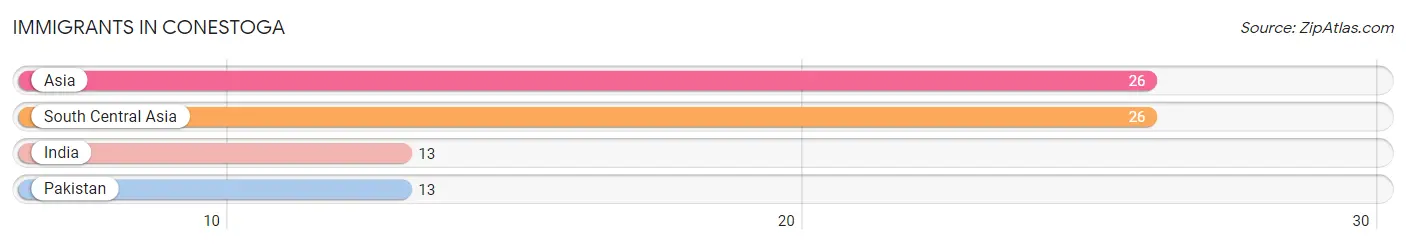
Immigrants in Conestoga
The most numerous immigrant groups reported in Conestoga came from Asia (26 | 2.1%), South Central Asia (26 | 2.1%), India (13 | 1.1%), and Pakistan (13 | 1.1%), together accounting for 6.4% of all Conestoga residents.
| Immigration Origin | # Population | % Population |
| Asia | 26 | 2.1% |
| India | 13 | 1.1% |
| Pakistan | 13 | 1.1% |
| South Central Asia | 26 | 2.1% | View All 4 Rows |
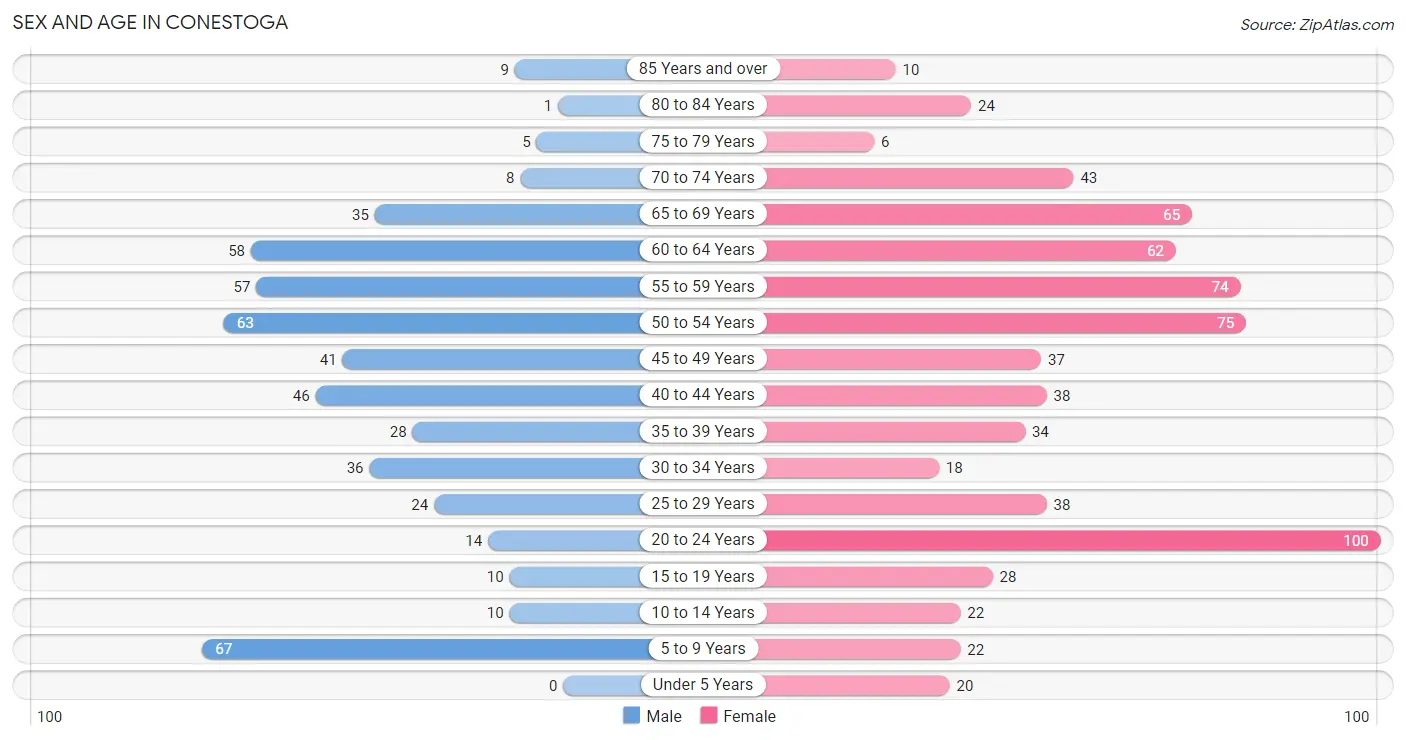
Sex and Age in Conestoga
Sex and Age in Conestoga
The most populous age groups in Conestoga are 5 to 9 Years (67 | 13.1%) for men and 20 to 24 Years (100 | 14.0%) for women.
| Age Bracket | Male | Female |
| Under 5 Years | 0 (0.0%) | 20 (2.8%) |
| 5 to 9 Years | 67 (13.1%) | 22 (3.1%) |
| 10 to 14 Years | 10 (1.9%) | 22 (3.1%) |
| 15 to 19 Years | 10 (1.9%) | 28 (3.9%) |
| 20 to 24 Years | 14 (2.7%) | 100 (14.0%) |
| 25 to 29 Years | 24 (4.7%) | 38 (5.3%) |
| 30 to 34 Years | 36 (7.0%) | 18 (2.5%) |
| 35 to 39 Years | 28 (5.5%) | 34 (4.8%) |
| 40 to 44 Years | 46 (9.0%) | 38 (5.3%) |
| 45 to 49 Years | 41 (8.0%) | 37 (5.2%) |
| 50 to 54 Years | 63 (12.3%) | 75 (10.5%) |
| 55 to 59 Years | 57 (11.1%) | 74 (10.3%) |
| 60 to 64 Years | 58 (11.3%) | 62 (8.7%) |
| 65 to 69 Years | 35 (6.8%) | 65 (9.1%) |
| 70 to 74 Years | 8 (1.6%) | 43 (6.0%) |
| 75 to 79 Years | 5 (1.0%) | 6 (0.8%) |
| 80 to 84 Years | 1 (0.2%) | 24 (3.4%) |
| 85 Years and over | 9 (1.8%) | 10 (1.4%) |
| Total | 512 (100.0%) | 716 (100.0%) |
Families and Households in Conestoga
Median Family Size in Conestoga
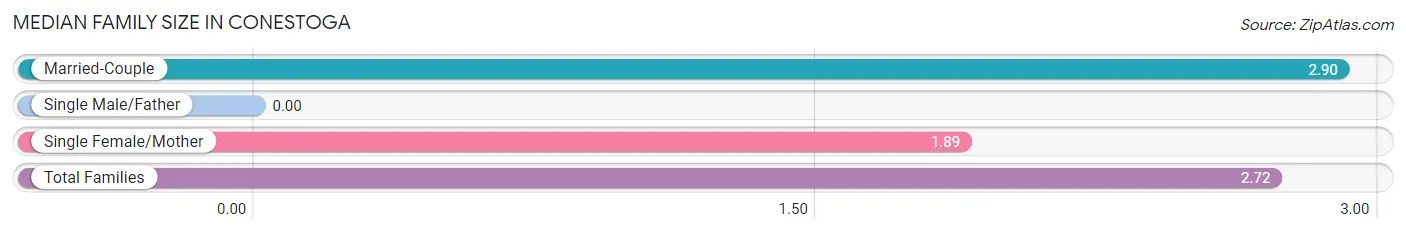
| Family Type | # Families | Family Size |
| Married-Couple | 319 (82.0%) | 2.90 |
| Single Male/Father | 0 (0.0%) | - |
| Single Female/Mother | 70 (18.0%) | 1.89 |
| Total Families | 389 (100.0%) | 2.72 |
Median Household Size in Conestoga
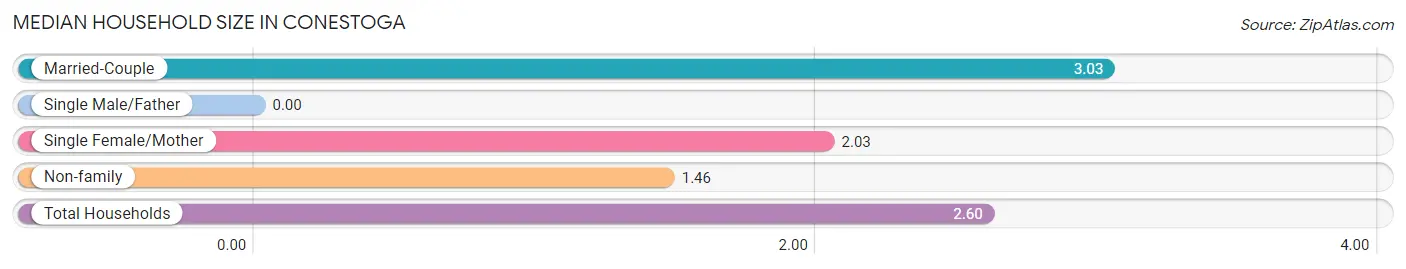
| Household Type | # Households | Household Size |
| Married-Couple | 319 (67.6%) | 3.03 |
| Single Male/Father | 0 (0.0%) | - |
| Single Female/Mother | 70 (14.8%) | 2.03 |
| Non-family | 83 (17.6%) | 1.46 |
| Total Households | 472 (100.0%) | 2.60 |
Household Size by Marriage Status in Conestoga
Out of a total of 472 households in Conestoga, 389 (82.4%) are family households, while 83 (17.6%) are nonfamily households. The most numerous type of family households are 2-person households, comprising 219, and the most common type of nonfamily households are 2-person households, comprising 44.
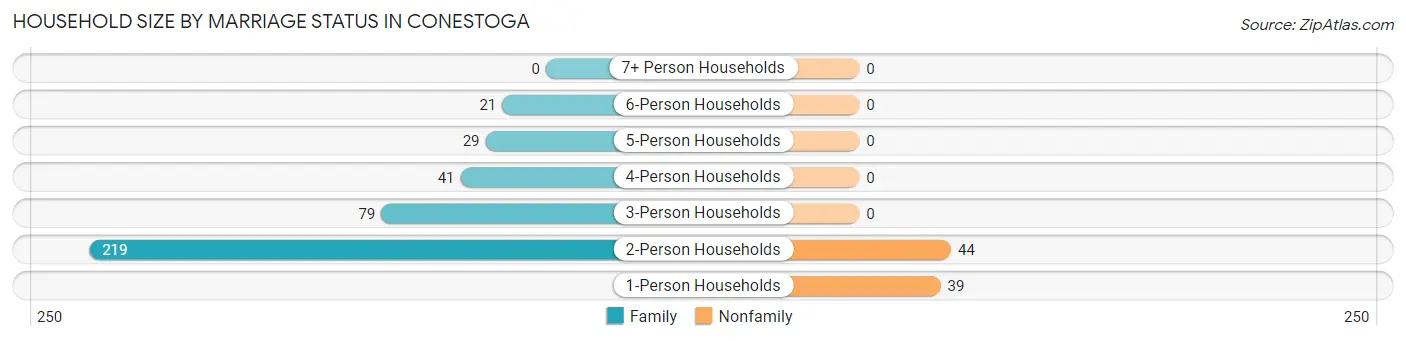
| Household Size | Family Households | Nonfamily Households |
| 1-Person Households | - | 39 (8.3%) |
| 2-Person Households | 219 (46.4%) | 44 (9.3%) |
| 3-Person Households | 79 (16.7%) | 0 (0.0%) |
| 4-Person Households | 41 (8.7%) | 0 (0.0%) |
| 5-Person Households | 29 (6.1%) | 0 (0.0%) |
| 6-Person Households | 21 (4.4%) | 0 (0.0%) |
| 7+ Person Households | 0 (0.0%) | 0 (0.0%) |
| Total | 389 (82.4%) | 83 (17.6%) |
Female Fertility in Conestoga
Fertility by Age in Conestoga
| Age Bracket | Women with Births | Births / 1,000 Women |
| 15 to 19 years | 0 (0.0%) | 0.0 |
| 20 to 34 years | 0 (0.0%) | 0.0 |
| 35 to 50 years | 0 (0.0%) | 0.0 |
| Total | 0 (0.0%) | 0.0 |
Fertility by Age by Marriage Status in Conestoga
| Age Bracket | Married | Unmarried |
| 15 to 19 years | 0 (0.0%) | 0 (0.0%) |
| 20 to 34 years | 0 (0.0%) | 0 (0.0%) |
| 35 to 50 years | 0 (0.0%) | 0 (0.0%) |
| Total | 0 (0.0%) | 0 (0.0%) |
Fertility by Education in Conestoga
| Educational Attainment | Women with Births | Births / 1,000 Women |
| Less than High School | 0 (0.0%) | 0.0 |
| High School Diploma | 0 (0.0%) | 0.0 |
| College or Associate's Degree | 0 (0.0%) | 0.0 |
| Bachelor's Degree | 0 (0.0%) | 0.0 |
| Graduate Degree | 0 (0.0%) | 0.0 |
| Total | 0 (0.0%) | 0.0 |
Fertility by Education by Marriage Status in Conestoga
| Educational Attainment | Married | Unmarried |
| Less than High School | 0 (0.0%) | 0 (0.0%) |
| High School Diploma | 0 (0.0%) | 0 (0.0%) |
| College or Associate's Degree | 0 (0.0%) | 0 (0.0%) |
| Bachelor's Degree | 0 (0.0%) | 0 (0.0%) |
| Graduate Degree | 0 (0.0%) | 0 (0.0%) |
| Total | 0 (0.0%) | 0 (0.0%) |
Employment Characteristics in Conestoga
Employment by Class of Employer in Conestoga
Among the 659 employed individuals in Conestoga, private company employees (456 | 69.2%), not-for-profit organizations (106 | 16.1%), and federal government employees (34 | 5.2%) make up the most common classes of employment.
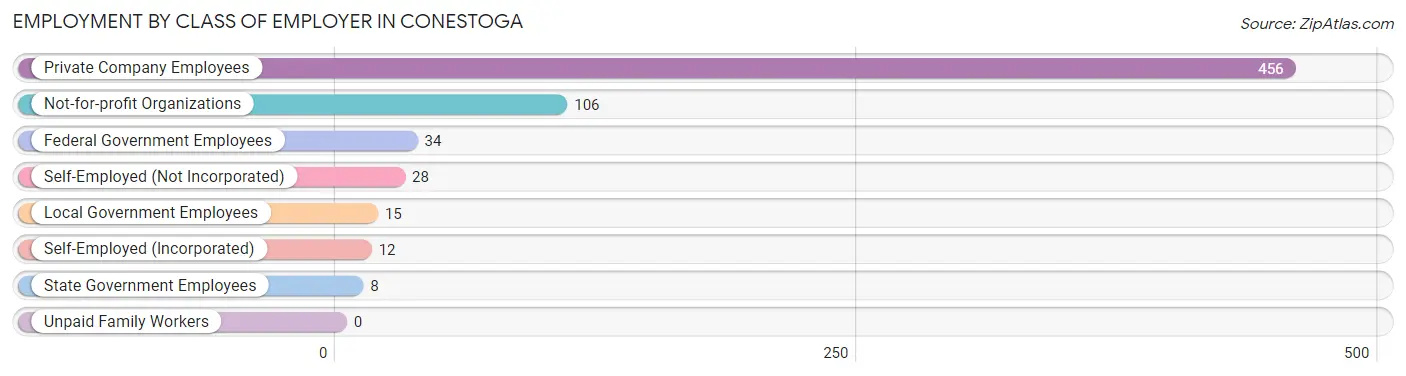
| Employer Class | # Employees | % Employees |
| Private Company Employees | 456 | 69.2% |
| Self-Employed (Incorporated) | 12 | 1.8% |
| Self-Employed (Not Incorporated) | 28 | 4.3% |
| Not-for-profit Organizations | 106 | 16.1% |
| Local Government Employees | 15 | 2.3% |
| State Government Employees | 8 | 1.2% |
| Federal Government Employees | 34 | 5.2% |
| Unpaid Family Workers | 0 | 0.0% |
| Total | 659 | 100.0% |
Employment Status by Age in Conestoga
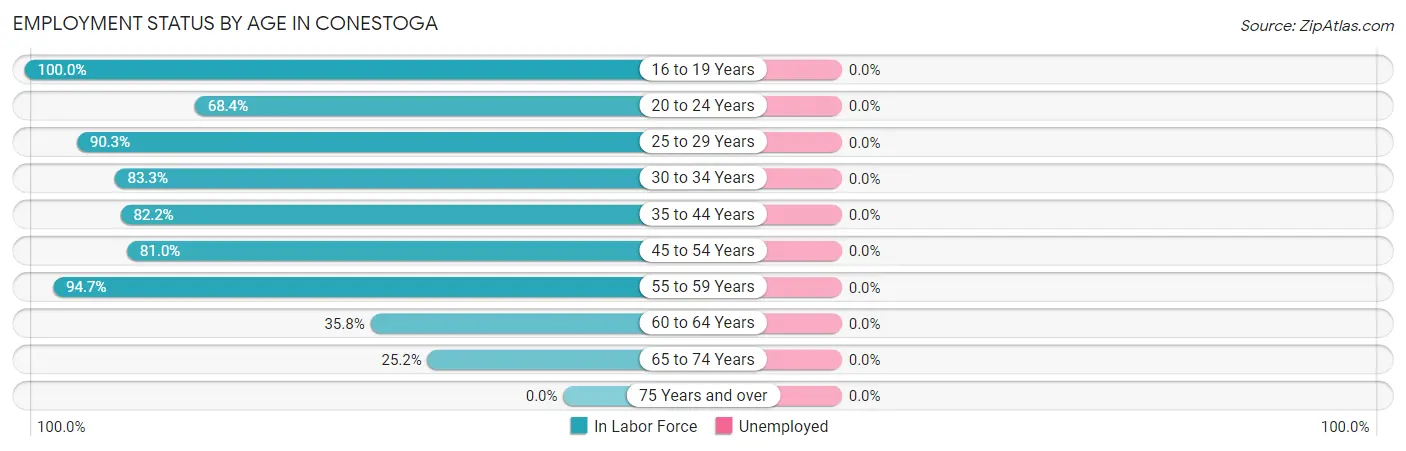
| Age Bracket | In Labor Force | Unemployed |
| 16 to 19 Years | 8 (100.0%) | 0 (0.0%) |
| 20 to 24 Years | 78 (68.4%) | 0 (0.0%) |
| 25 to 29 Years | 56 (90.3%) | 0 (0.0%) |
| 30 to 34 Years | 45 (83.3%) | 0 (0.0%) |
| 35 to 44 Years | 120 (82.2%) | 0 (0.0%) |
| 45 to 54 Years | 175 (81.0%) | 0 (0.0%) |
| 55 to 59 Years | 124 (94.7%) | 0 (0.0%) |
| 60 to 64 Years | 43 (35.8%) | 0 (0.0%) |
| 65 to 74 Years | 38 (25.2%) | 0 (0.0%) |
| 75 Years and over | 0 (0.0%) | 0 (0.0%) |
| Total | 687 (65.0%) | 0 (0.0%) |
Employment Status by Educational Attainment in Conestoga
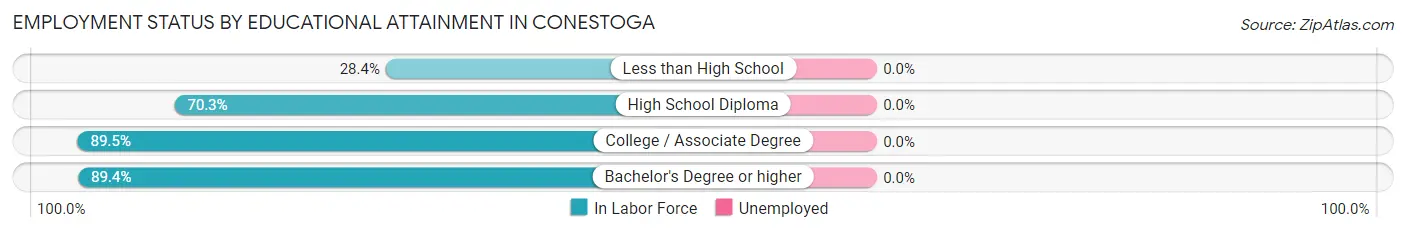
| Educational Attainment | In Labor Force | Unemployed |
| Less than High School | 21 (28.4%) | 0 (0.0%) |
| High School Diploma | 161 (70.3%) | 0 (0.0%) |
| College / Associate Degree | 137 (89.5%) | 0 (0.0%) |
| Bachelor's Degree or higher | 244 (89.4%) | 0 (0.0%) |
| Total | 563 (77.2%) | 0 (0.0%) |
Employment Occupations by Sex in Conestoga
Management, Business, Science and Arts Occupations
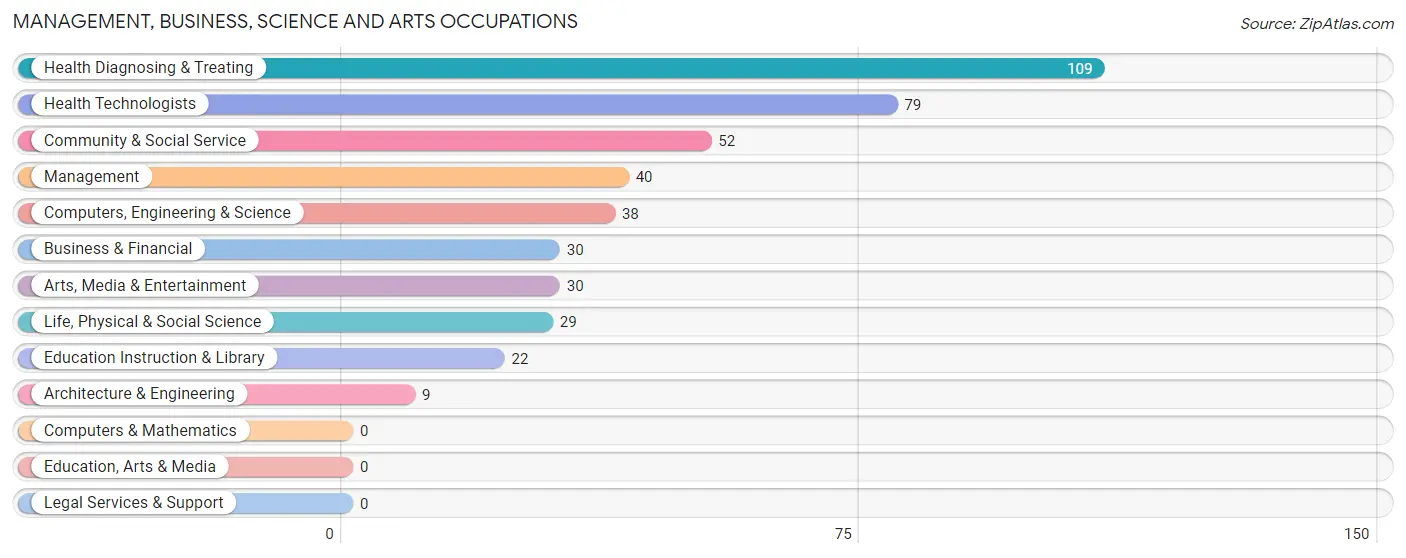
The most common Management, Business, Science and Arts occupations in Conestoga are Health Diagnosing & Treating (109 | 15.9%), Health Technologists (79 | 11.5%), Community & Social Service (52 | 7.6%), Management (40 | 5.8%), and Computers, Engineering & Science (38 | 5.5%).
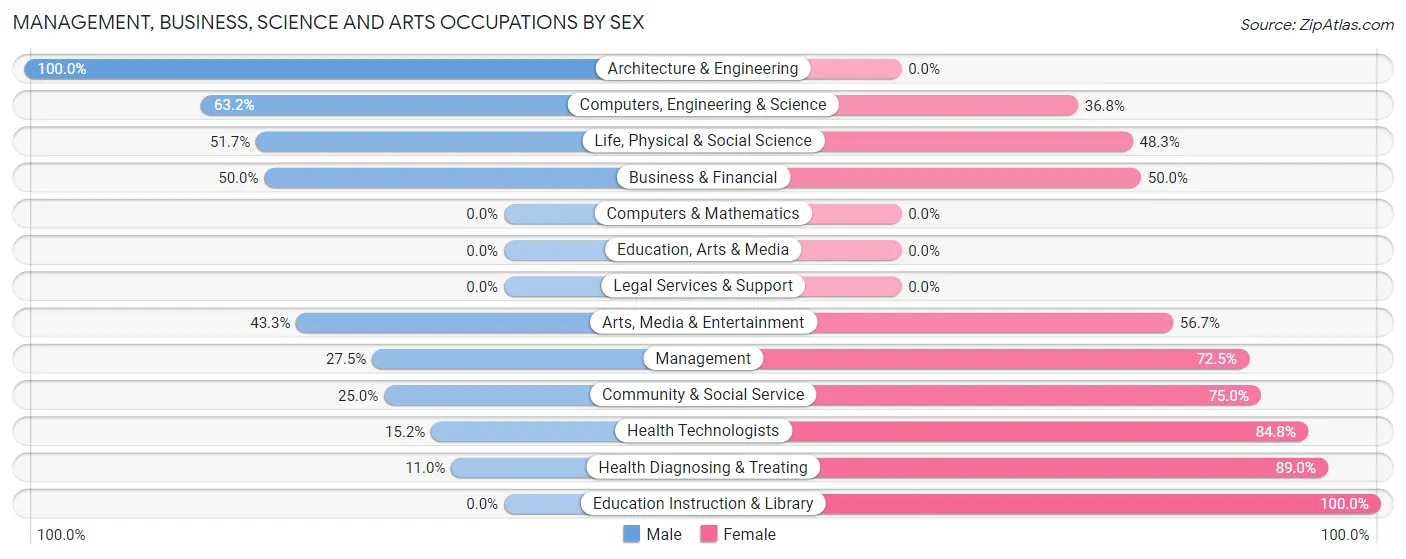
Management, Business, Science and Arts Occupations by Sex
Within the Management, Business, Science and Arts occupations in Conestoga, the most male-oriented occupations are Architecture & Engineering (100.0%), Computers, Engineering & Science (63.2%), and Life, Physical & Social Science (51.7%), while the most female-oriented occupations are Education Instruction & Library (100.0%), Health Diagnosing & Treating (89.0%), and Health Technologists (84.8%).
| Occupation | Male | Female |
| Management | 11 (27.5%) | 29 (72.5%) |
| Business & Financial | 15 (50.0%) | 15 (50.0%) |
| Computers, Engineering & Science | 24 (63.2%) | 14 (36.8%) |
| Computers & Mathematics | 0 (0.0%) | 0 (0.0%) |
| Architecture & Engineering | 9 (100.0%) | 0 (0.0%) |
| Life, Physical & Social Science | 15 (51.7%) | 14 (48.3%) |
| Community & Social Service | 13 (25.0%) | 39 (75.0%) |
| Education, Arts & Media | 0 (0.0%) | 0 (0.0%) |
| Legal Services & Support | 0 (0.0%) | 0 (0.0%) |
| Education Instruction & Library | 0 (0.0%) | 22 (100.0%) |
| Arts, Media & Entertainment | 13 (43.3%) | 17 (56.7%) |
| Health Diagnosing & Treating | 12 (11.0%) | 97 (89.0%) |
| Health Technologists | 12 (15.2%) | 67 (84.8%) |
| Total (Category) | 75 (27.9%) | 194 (72.1%) |
| Total (Overall) | 338 (49.2%) | 349 (50.8%) |
Services Occupations
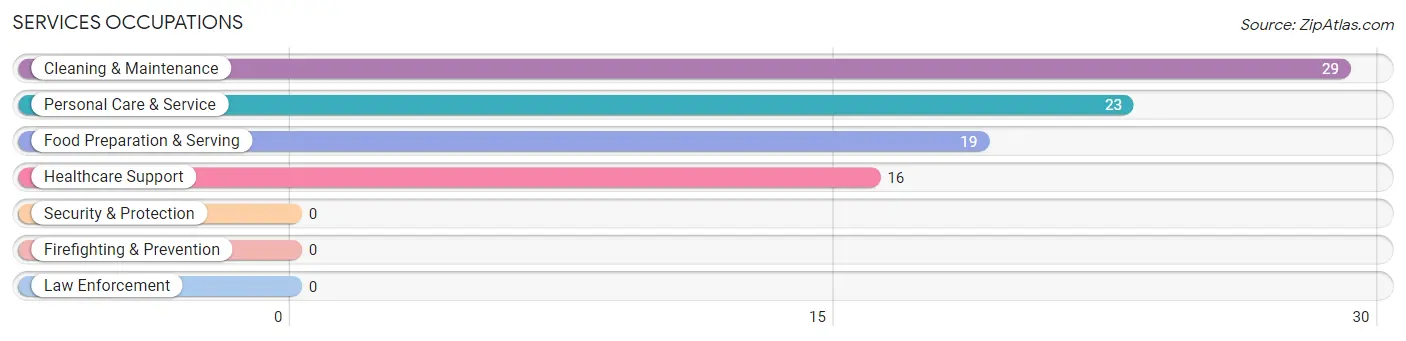
The most common Services occupations in Conestoga are Cleaning & Maintenance (29 | 4.2%), Personal Care & Service (23 | 3.4%), Food Preparation & Serving (19 | 2.8%), and Healthcare Support (16 | 2.3%).
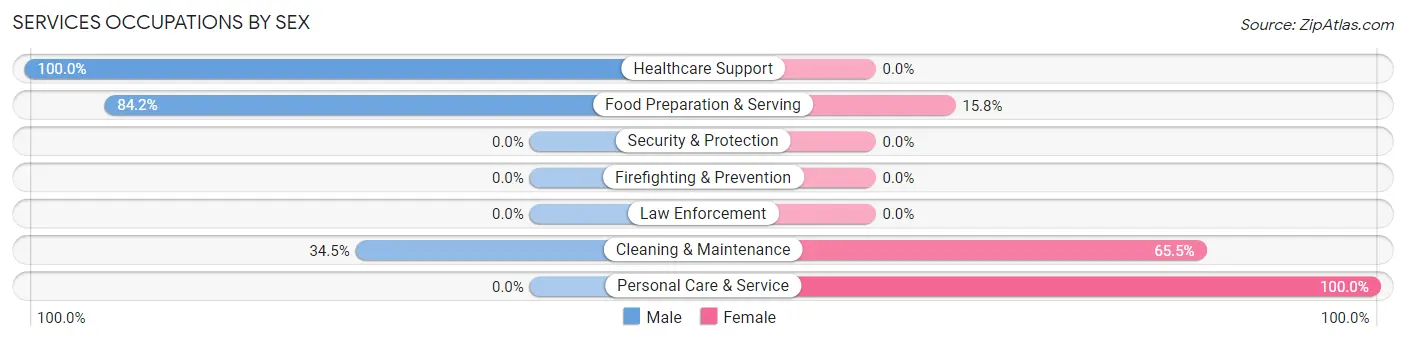
Services Occupations by Sex
Within the Services occupations in Conestoga, the most male-oriented occupations are Healthcare Support (100.0%), Food Preparation & Serving (84.2%), and Cleaning & Maintenance (34.5%), while the most female-oriented occupations are Personal Care & Service (100.0%), Cleaning & Maintenance (65.5%), and Food Preparation & Serving (15.8%).
| Occupation | Male | Female |
| Healthcare Support | 16 (100.0%) | 0 (0.0%) |
| Security & Protection | 0 (0.0%) | 0 (0.0%) |
| Firefighting & Prevention | 0 (0.0%) | 0 (0.0%) |
| Law Enforcement | 0 (0.0%) | 0 (0.0%) |
| Food Preparation & Serving | 16 (84.2%) | 3 (15.8%) |
| Cleaning & Maintenance | 10 (34.5%) | 19 (65.5%) |
| Personal Care & Service | 0 (0.0%) | 23 (100.0%) |
| Total (Category) | 42 (48.3%) | 45 (51.7%) |
| Total (Overall) | 338 (49.2%) | 349 (50.8%) |
Sales and Office Occupations
The most common Sales and Office occupations in Conestoga are Office & Administration (60 | 8.7%), and Sales & Related (10 | 1.5%).
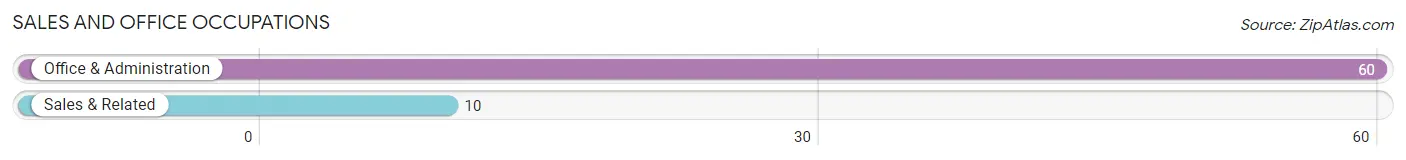
Sales and Office Occupations by Sex

| Occupation | Male | Female |
| Sales & Related | 10 (100.0%) | 0 (0.0%) |
| Office & Administration | 7 (11.7%) | 53 (88.3%) |
| Total (Category) | 17 (24.3%) | 53 (75.7%) |
| Total (Overall) | 338 (49.2%) | 349 (50.8%) |
Natural Resources, Construction and Maintenance Occupations
The most common Natural Resources, Construction and Maintenance occupations in Conestoga are Construction & Extraction (87 | 12.7%), and Installation, Maintenance & Repair (49 | 7.1%).
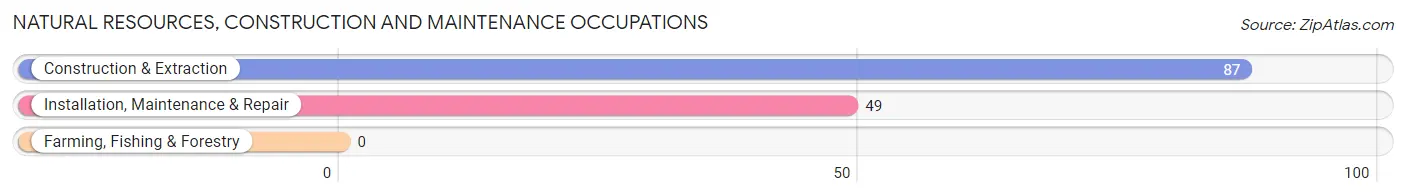
Natural Resources, Construction and Maintenance Occupations by Sex
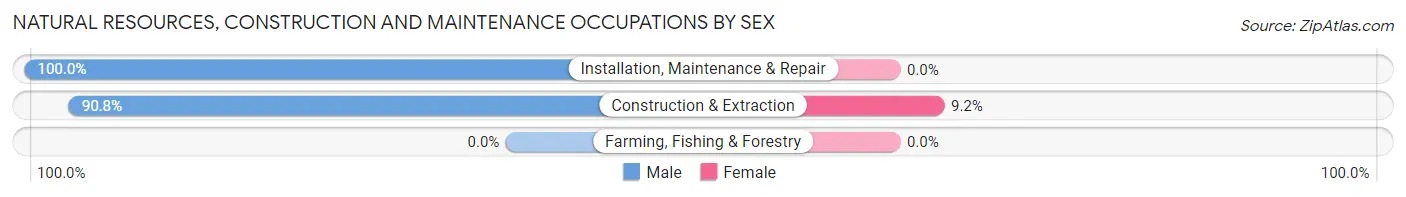
| Occupation | Male | Female |
| Farming, Fishing & Forestry | 0 (0.0%) | 0 (0.0%) |
| Construction & Extraction | 79 (90.8%) | 8 (9.2%) |
| Installation, Maintenance & Repair | 49 (100.0%) | 0 (0.0%) |
| Total (Category) | 128 (94.1%) | 8 (5.9%) |
| Total (Overall) | 338 (49.2%) | 349 (50.8%) |
Production, Transportation and Moving Occupations
The most common Production, Transportation and Moving occupations in Conestoga are Production (88 | 12.8%), Material Moving (29 | 4.2%), and Transportation (8 | 1.2%).
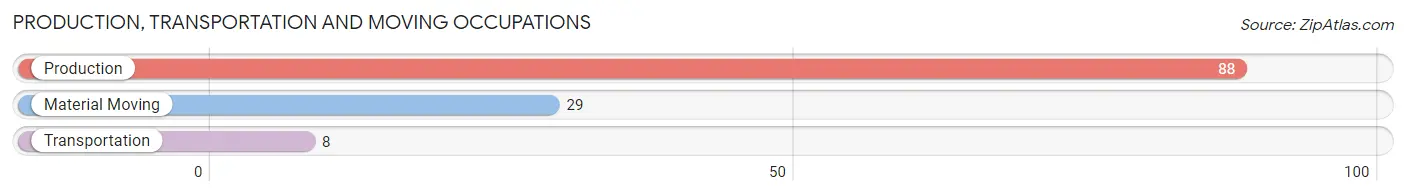
Production, Transportation and Moving Occupations by Sex
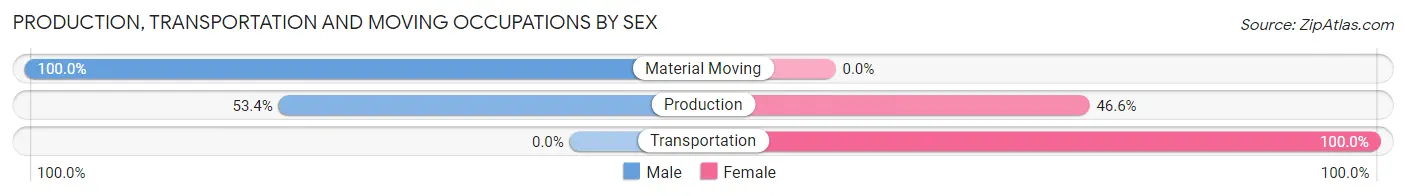
| Occupation | Male | Female |
| Production | 47 (53.4%) | 41 (46.6%) |
| Transportation | 0 (0.0%) | 8 (100.0%) |
| Material Moving | 29 (100.0%) | 0 (0.0%) |
| Total (Category) | 76 (60.8%) | 49 (39.2%) |
| Total (Overall) | 338 (49.2%) | 349 (50.8%) |
Employment Industries by Sex in Conestoga
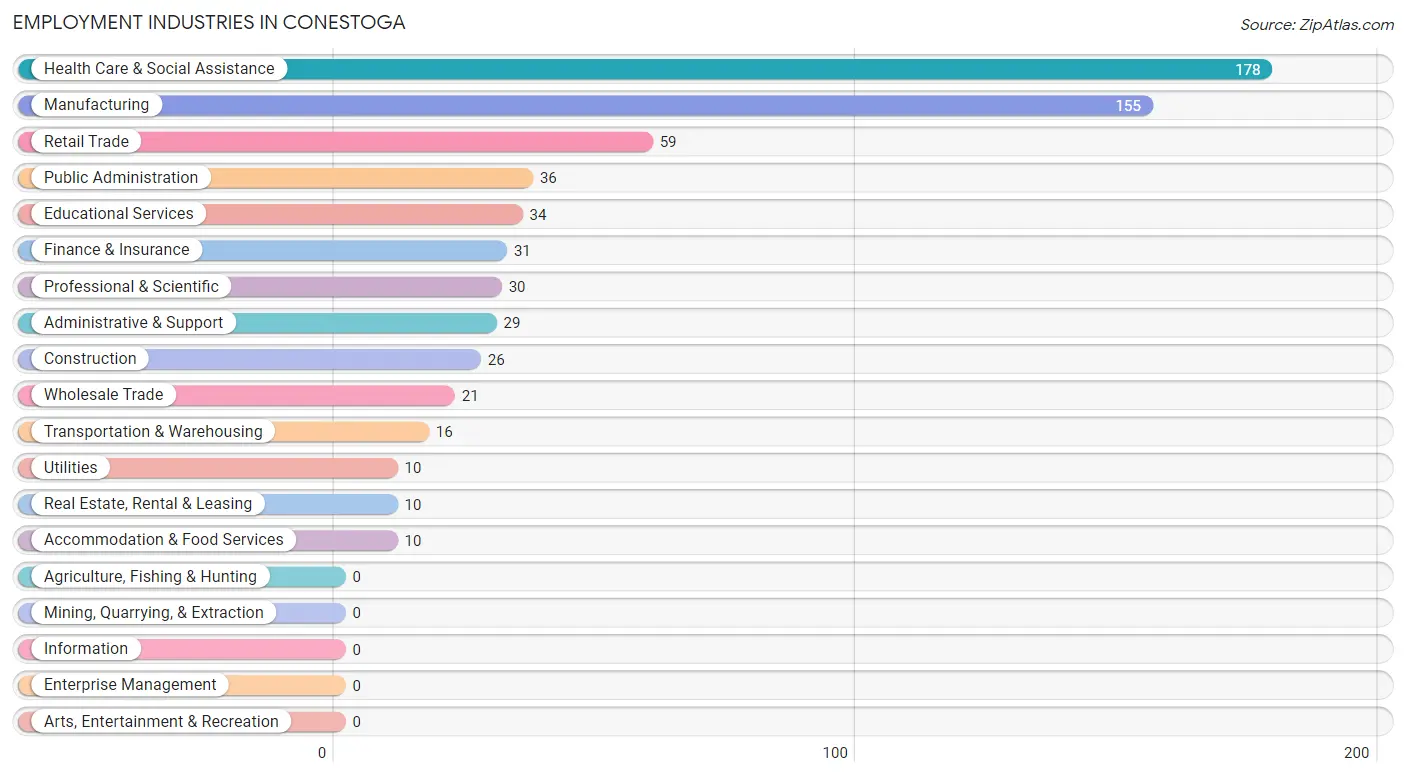
Employment Industries in Conestoga
The major employment industries in Conestoga include Health Care & Social Assistance (178 | 25.9%), Manufacturing (155 | 22.6%), Retail Trade (59 | 8.6%), Public Administration (36 | 5.2%), and Educational Services (34 | 5.0%).
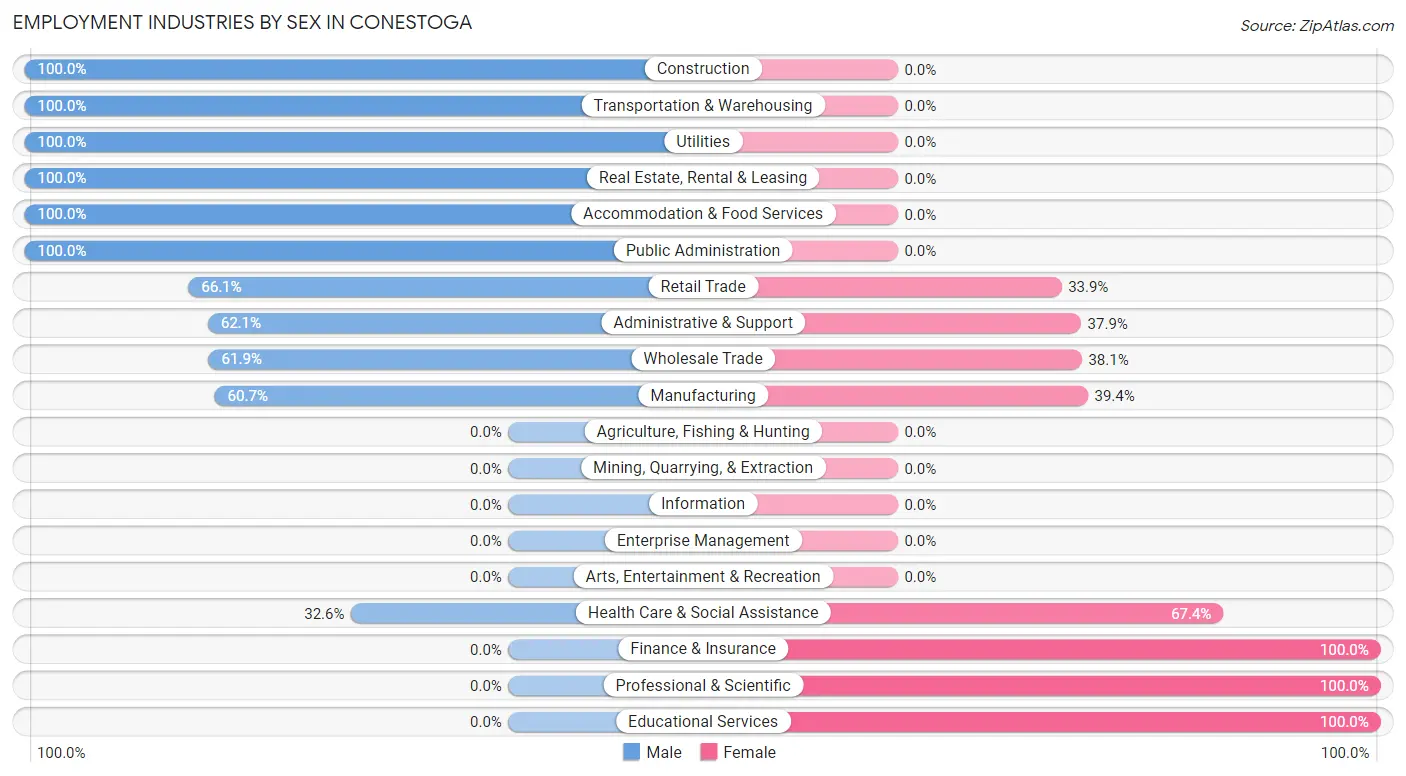
Employment Industries by Sex in Conestoga
The Conestoga industries that see more men than women are Construction (100.0%), Transportation & Warehousing (100.0%), and Utilities (100.0%), whereas the industries that tend to have a higher number of women are Finance & Insurance (100.0%), Professional & Scientific (100.0%), and Educational Services (100.0%).
| Industry | Male | Female |
| Agriculture, Fishing & Hunting | 0 (0.0%) | 0 (0.0%) |
| Mining, Quarrying, & Extraction | 0 (0.0%) | 0 (0.0%) |
| Construction | 26 (100.0%) | 0 (0.0%) |
| Manufacturing | 94 (60.7%) | 61 (39.4%) |
| Wholesale Trade | 13 (61.9%) | 8 (38.1%) |
| Retail Trade | 39 (66.1%) | 20 (33.9%) |
| Transportation & Warehousing | 16 (100.0%) | 0 (0.0%) |
| Utilities | 10 (100.0%) | 0 (0.0%) |
| Information | 0 (0.0%) | 0 (0.0%) |
| Finance & Insurance | 0 (0.0%) | 31 (100.0%) |
| Real Estate, Rental & Leasing | 10 (100.0%) | 0 (0.0%) |
| Professional & Scientific | 0 (0.0%) | 30 (100.0%) |
| Enterprise Management | 0 (0.0%) | 0 (0.0%) |
| Administrative & Support | 18 (62.1%) | 11 (37.9%) |
| Educational Services | 0 (0.0%) | 34 (100.0%) |
| Health Care & Social Assistance | 58 (32.6%) | 120 (67.4%) |
| Arts, Entertainment & Recreation | 0 (0.0%) | 0 (0.0%) |
| Accommodation & Food Services | 10 (100.0%) | 0 (0.0%) |
| Public Administration | 36 (100.0%) | 0 (0.0%) |
| Total | 338 (49.2%) | 349 (50.8%) |
Education in Conestoga
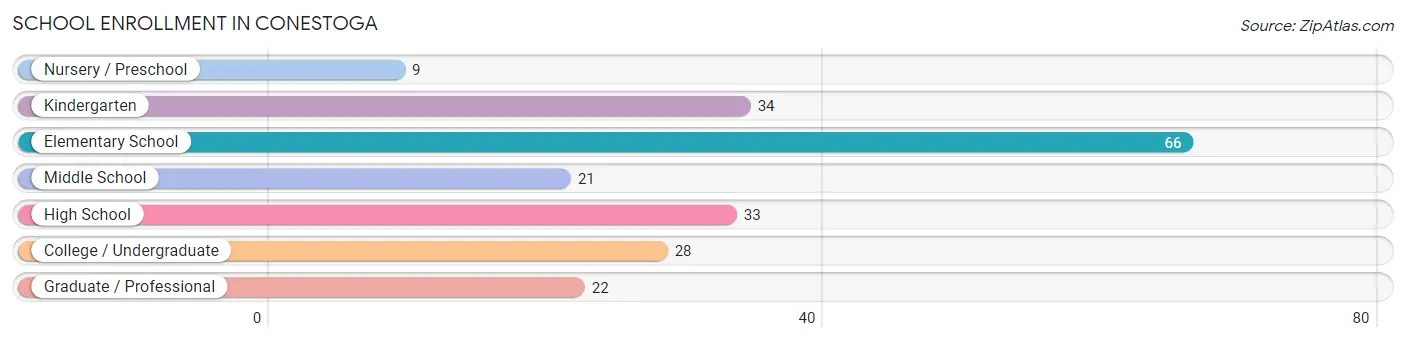
School Enrollment in Conestoga
The most common levels of schooling among the 213 students in Conestoga are elementary school (66 | 31.0%), kindergarten (34 | 16.0%), and high school (33 | 15.5%).
| School Level | # Students | % Students |
| Nursery / Preschool | 9 | 4.2% |
| Kindergarten | 34 | 16.0% |
| Elementary School | 66 | 31.0% |
| Middle School | 21 | 9.9% |
| High School | 33 | 15.5% |
| College / Undergraduate | 28 | 13.2% |
| Graduate / Professional | 22 | 10.3% |
| Total | 213 | 100.0% |
School Enrollment by Age by Funding Source in Conestoga
Out of a total of 213 students who are enrolled in schools in Conestoga, 49 (23.0%) attend a private institution, while the remaining 164 (77.0%) are enrolled in public schools. The age group of 3 to 4 year olds has the highest likelihood of being enrolled in private schools, with 9 (100.0% in the age bracket) enrolled. Conversely, the age group of 10 to 14 year olds has the lowest likelihood of being enrolled in a private school, with 32 (100.0% in the age bracket) attending a public institution.
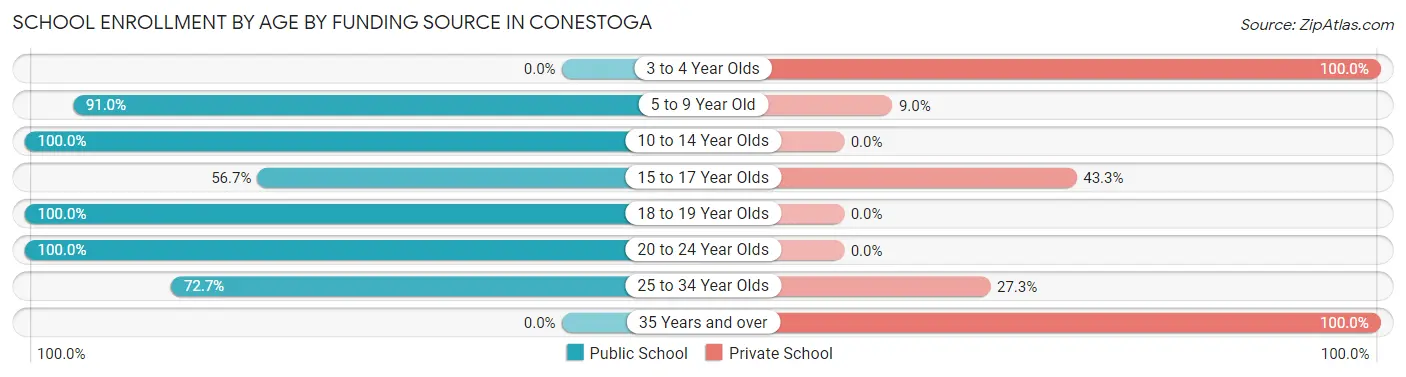
| Age Bracket | Public School | Private School |
| 3 to 4 Year Olds | 0 (0.0%) | 9 (100.0%) |
| 5 to 9 Year Old | 81 (91.0%) | 8 (9.0%) |
| 10 to 14 Year Olds | 32 (100.0%) | 0 (0.0%) |
| 15 to 17 Year Olds | 17 (56.7%) | 13 (43.3%) |
| 18 to 19 Year Olds | 3 (100.0%) | 0 (0.0%) |
| 20 to 24 Year Olds | 15 (100.0%) | 0 (0.0%) |
| 25 to 34 Year Olds | 16 (72.7%) | 6 (27.3%) |
| 35 Years and over | 0 (0.0%) | 13 (100.0%) |
| Total | 164 (77.0%) | 49 (23.0%) |
Educational Attainment by Field of Study in Conestoga
Science & technology (55 | 17.5%), education (47 | 14.9%), psychology (44 | 14.0%), business (37 | 11.7%), and visual & performing arts (33 | 10.5%) are the most common fields of study among 315 individuals in Conestoga who have obtained a bachelor's degree or higher.
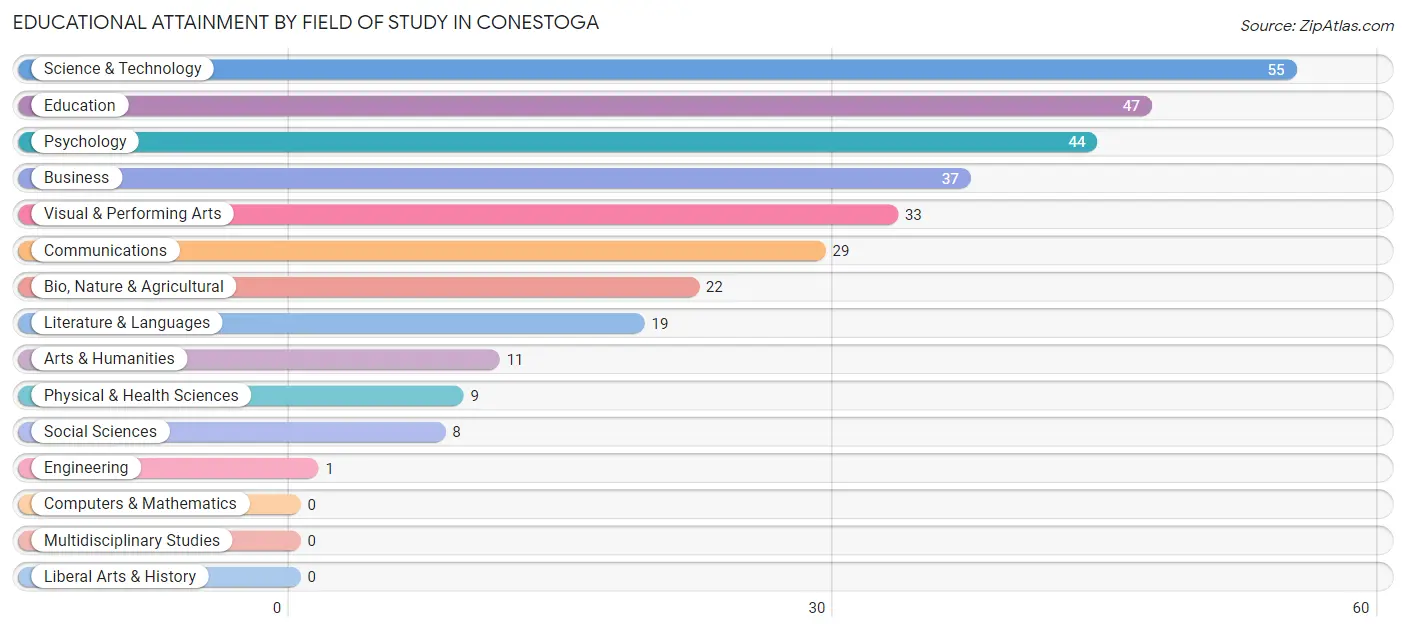
| Field of Study | # Graduates | % Graduates |
| Computers & Mathematics | 0 | 0.0% |
| Bio, Nature & Agricultural | 22 | 7.0% |
| Physical & Health Sciences | 9 | 2.9% |
| Psychology | 44 | 14.0% |
| Social Sciences | 8 | 2.5% |
| Engineering | 1 | 0.3% |
| Multidisciplinary Studies | 0 | 0.0% |
| Science & Technology | 55 | 17.5% |
| Business | 37 | 11.7% |
| Education | 47 | 14.9% |
| Literature & Languages | 19 | 6.0% |
| Liberal Arts & History | 0 | 0.0% |
| Visual & Performing Arts | 33 | 10.5% |
| Communications | 29 | 9.2% |
| Arts & Humanities | 11 | 3.5% |
| Total | 315 | 100.0% |
Transportation & Commute in Conestoga
Vehicle Availability by Sex in Conestoga
The most prevalent vehicle ownership categories in Conestoga are males with 2 vehicles (115, accounting for 34.0%) and females with 2 vehicles (114, making up 35.8%).
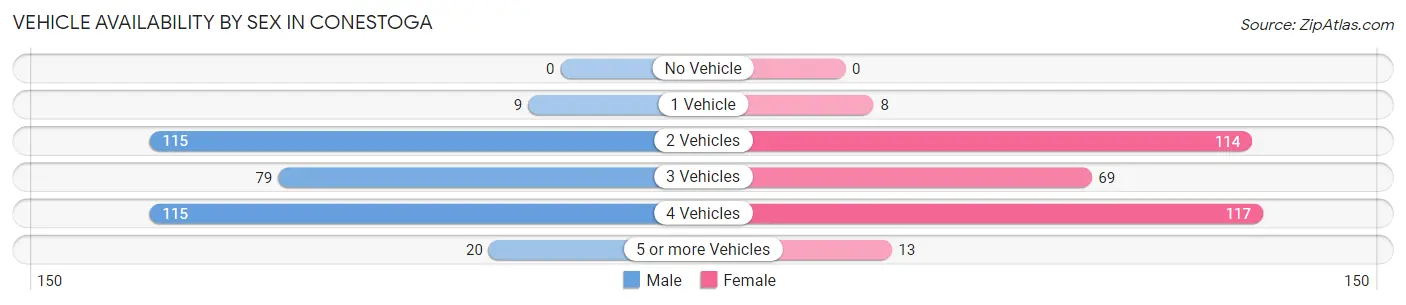
| Vehicles Available | Male | Female |
| No Vehicle | 0 (0.0%) | 0 (0.0%) |
| 1 Vehicle | 9 (2.7%) | 8 (2.5%) |
| 2 Vehicles | 115 (34.0%) | 114 (35.5%) |
| 3 Vehicles | 79 (23.4%) | 69 (21.5%) |
| 4 Vehicles | 115 (34.0%) | 117 (36.4%) |
| 5 or more Vehicles | 20 (5.9%) | 13 (4.1%) |
| Total | 338 (100.0%) | 321 (100.0%) |
Commute Time in Conestoga
The most frequently occuring commute durations in Conestoga are 20 to 24 minutes (154 commuters, 26.3%), 30 to 34 minutes (101 commuters, 17.3%), and 60 to 89 minutes (93 commuters, 15.9%).
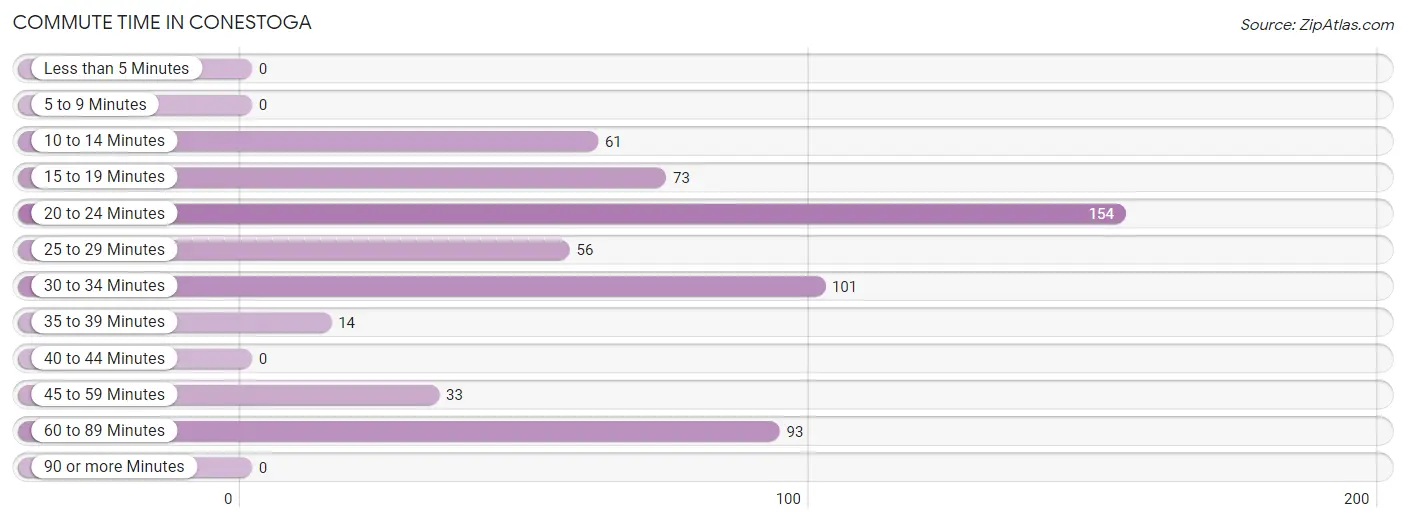
| Commute Time | # Commuters | % Commuters |
| Less than 5 Minutes | 0 | 0.0% |
| 5 to 9 Minutes | 0 | 0.0% |
| 10 to 14 Minutes | 61 | 10.4% |
| 15 to 19 Minutes | 73 | 12.5% |
| 20 to 24 Minutes | 154 | 26.3% |
| 25 to 29 Minutes | 56 | 9.6% |
| 30 to 34 Minutes | 101 | 17.3% |
| 35 to 39 Minutes | 14 | 2.4% |
| 40 to 44 Minutes | 0 | 0.0% |
| 45 to 59 Minutes | 33 | 5.6% |
| 60 to 89 Minutes | 93 | 15.9% |
| 90 or more Minutes | 0 | 0.0% |
Commute Time by Sex in Conestoga
The most common commute times in Conestoga are 20 to 24 minutes (68 commuters, 21.7%) for males and 20 to 24 minutes (86 commuters, 31.6%) for females.
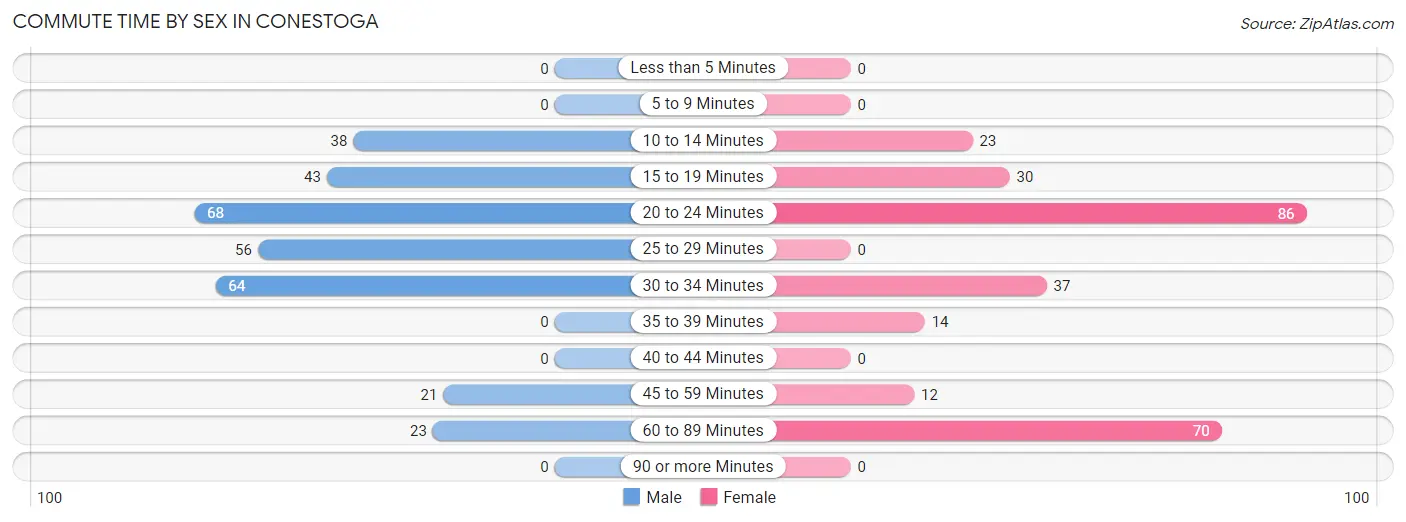
| Commute Time | Male | Female |
| Less than 5 Minutes | 0 (0.0%) | 0 (0.0%) |
| 5 to 9 Minutes | 0 (0.0%) | 0 (0.0%) |
| 10 to 14 Minutes | 38 (12.1%) | 23 (8.5%) |
| 15 to 19 Minutes | 43 (13.7%) | 30 (11.0%) |
| 20 to 24 Minutes | 68 (21.7%) | 86 (31.6%) |
| 25 to 29 Minutes | 56 (17.9%) | 0 (0.0%) |
| 30 to 34 Minutes | 64 (20.4%) | 37 (13.6%) |
| 35 to 39 Minutes | 0 (0.0%) | 14 (5.1%) |
| 40 to 44 Minutes | 0 (0.0%) | 0 (0.0%) |
| 45 to 59 Minutes | 21 (6.7%) | 12 (4.4%) |
| 60 to 89 Minutes | 23 (7.3%) | 70 (25.7%) |
| 90 or more Minutes | 0 (0.0%) | 0 (0.0%) |
Time of Departure to Work by Sex in Conestoga
The most frequent times of departure to work in Conestoga are 6:00 AM to 6:29 AM (78, 24.9%) for males and 4:00 PM to 11:59 PM (113, 41.5%) for females.
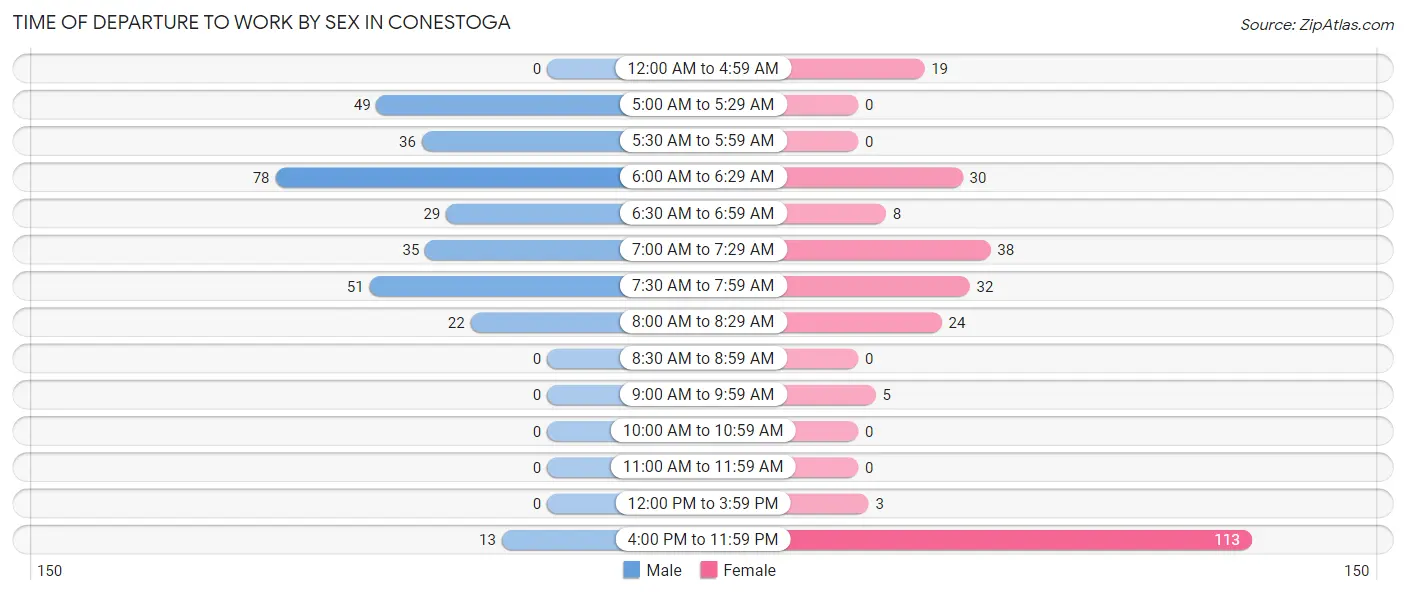
| Time of Departure | Male | Female |
| 12:00 AM to 4:59 AM | 0 (0.0%) | 19 (7.0%) |
| 5:00 AM to 5:29 AM | 49 (15.7%) | 0 (0.0%) |
| 5:30 AM to 5:59 AM | 36 (11.5%) | 0 (0.0%) |
| 6:00 AM to 6:29 AM | 78 (24.9%) | 30 (11.0%) |
| 6:30 AM to 6:59 AM | 29 (9.3%) | 8 (2.9%) |
| 7:00 AM to 7:29 AM | 35 (11.2%) | 38 (14.0%) |
| 7:30 AM to 7:59 AM | 51 (16.3%) | 32 (11.8%) |
| 8:00 AM to 8:29 AM | 22 (7.0%) | 24 (8.8%) |
| 8:30 AM to 8:59 AM | 0 (0.0%) | 0 (0.0%) |
| 9:00 AM to 9:59 AM | 0 (0.0%) | 5 (1.8%) |
| 10:00 AM to 10:59 AM | 0 (0.0%) | 0 (0.0%) |
| 11:00 AM to 11:59 AM | 0 (0.0%) | 0 (0.0%) |
| 12:00 PM to 3:59 PM | 0 (0.0%) | 3 (1.1%) |
| 4:00 PM to 11:59 PM | 13 (4.2%) | 113 (41.5%) |
| Total | 313 (100.0%) | 272 (100.0%) |
Housing Occupancy in Conestoga
Occupancy by Ownership in Conestoga
Of the total 472 dwellings in Conestoga, owner-occupied units account for 420 (89.0%), while renter-occupied units make up 52 (11.0%).
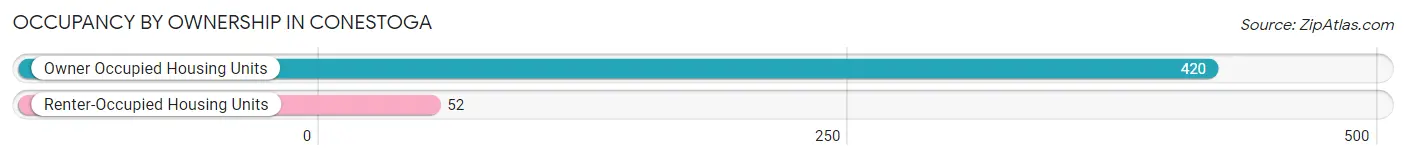
| Occupancy | # Housing Units | % Housing Units |
| Owner Occupied Housing Units | 420 | 89.0% |
| Renter-Occupied Housing Units | 52 | 11.0% |
| Total Occupied Housing Units | 472 | 100.0% |
Occupancy by Household Size in Conestoga
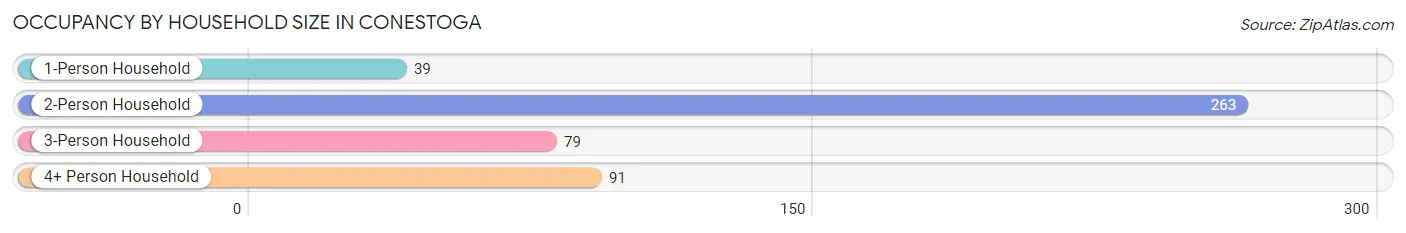
| Household Size | # Housing Units | % Housing Units |
| 1-Person Household | 39 | 8.3% |
| 2-Person Household | 263 | 55.7% |
| 3-Person Household | 79 | 16.7% |
| 4+ Person Household | 91 | 19.3% |
| Total Housing Units | 472 | 100.0% |
Occupancy by Ownership by Household Size in Conestoga
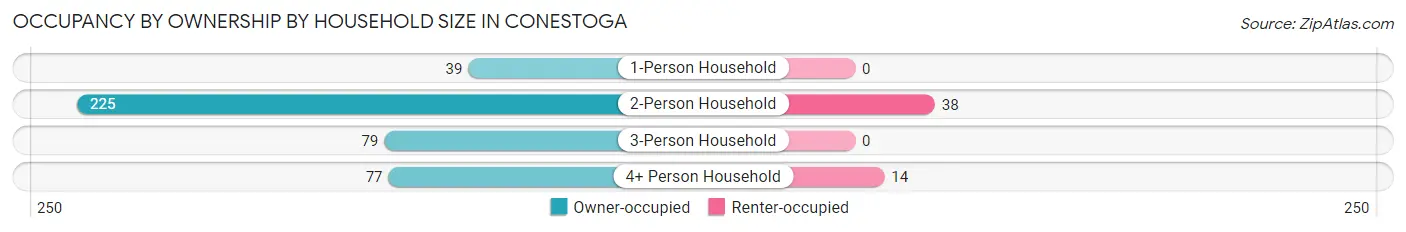
| Household Size | Owner-occupied | Renter-occupied |
| 1-Person Household | 39 (100.0%) | 0 (0.0%) |
| 2-Person Household | 225 (85.6%) | 38 (14.4%) |
| 3-Person Household | 79 (100.0%) | 0 (0.0%) |
| 4+ Person Household | 77 (84.6%) | 14 (15.4%) |
| Total Housing Units | 420 (89.0%) | 52 (11.0%) |
Occupancy by Educational Attainment in Conestoga
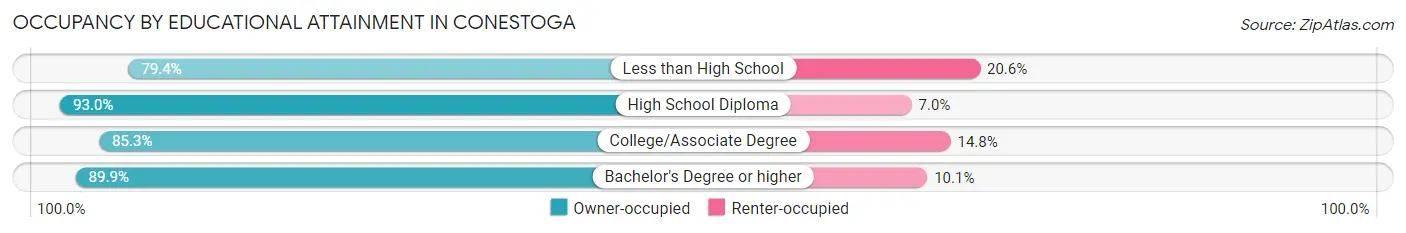
| Household Size | Owner-occupied | Renter-occupied |
| Less than High School | 54 (79.4%) | 14 (20.6%) |
| High School Diploma | 172 (93.0%) | 13 (7.0%) |
| College/Associate Degree | 52 (85.3%) | 9 (14.7%) |
| Bachelor's Degree or higher | 142 (89.9%) | 16 (10.1%) |
Occupancy by Age of Householder in Conestoga
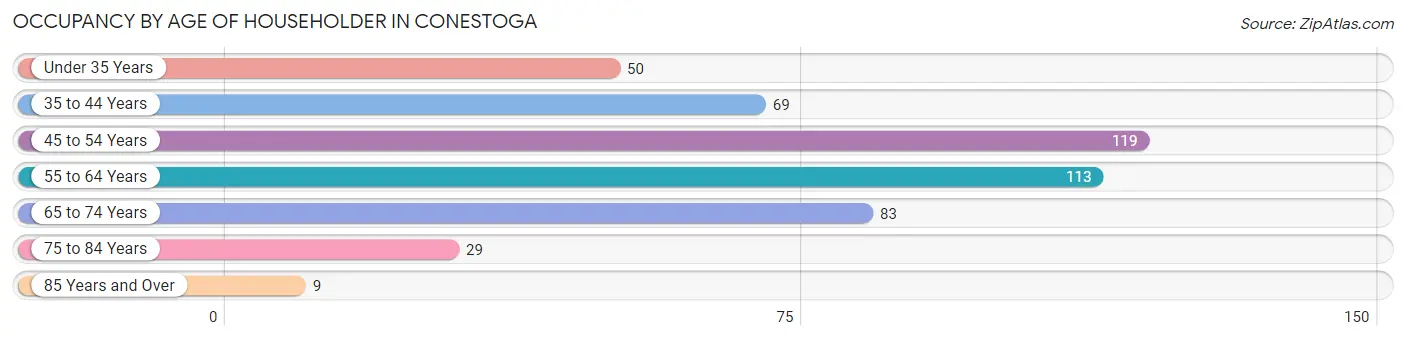
| Age Bracket | # Households | % Households |
| Under 35 Years | 50 | 10.6% |
| 35 to 44 Years | 69 | 14.6% |
| 45 to 54 Years | 119 | 25.2% |
| 55 to 64 Years | 113 | 23.9% |
| 65 to 74 Years | 83 | 17.6% |
| 75 to 84 Years | 29 | 6.1% |
| 85 Years and Over | 9 | 1.9% |
| Total | 472 | 100.0% |
Housing Finances in Conestoga
Median Income by Occupancy in Conestoga
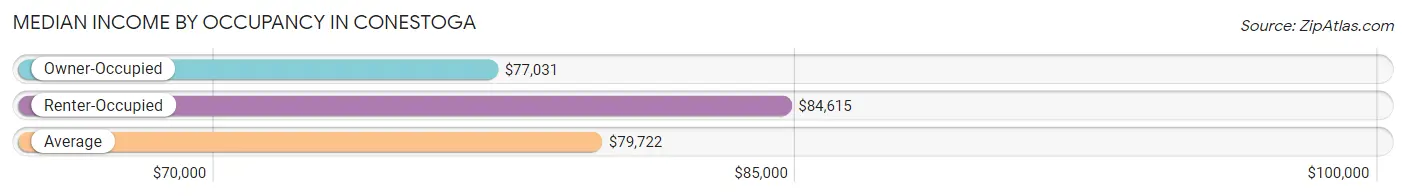
| Occupancy Type | # Households | Median Income |
| Owner-Occupied | 420 (89.0%) | $77,031 |
| Renter-Occupied | 52 (11.0%) | $84,615 |
| Average | 472 (100.0%) | $79,722 |
Occupancy by Householder Income Bracket in Conestoga
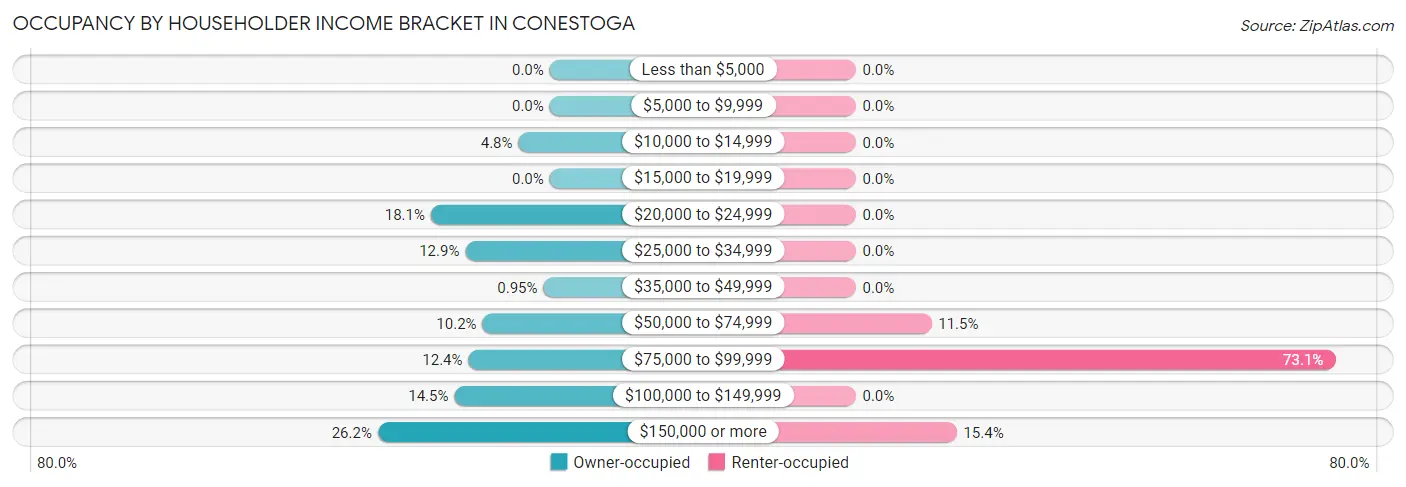
| Income Bracket | Owner-occupied | Renter-occupied |
| Less than $5,000 | 0 (0.0%) | 0 (0.0%) |
| $5,000 to $9,999 | 0 (0.0%) | 0 (0.0%) |
| $10,000 to $14,999 | 20 (4.8%) | 0 (0.0%) |
| $15,000 to $19,999 | 0 (0.0%) | 0 (0.0%) |
| $20,000 to $24,999 | 76 (18.1%) | 0 (0.0%) |
| $25,000 to $34,999 | 54 (12.9%) | 0 (0.0%) |
| $35,000 to $49,999 | 4 (0.9%) | 0 (0.0%) |
| $50,000 to $74,999 | 43 (10.2%) | 6 (11.5%) |
| $75,000 to $99,999 | 52 (12.4%) | 38 (73.1%) |
| $100,000 to $149,999 | 61 (14.5%) | 0 (0.0%) |
| $150,000 or more | 110 (26.2%) | 8 (15.4%) |
| Total | 420 (100.0%) | 52 (100.0%) |
Monthly Housing Cost Tiers in Conestoga
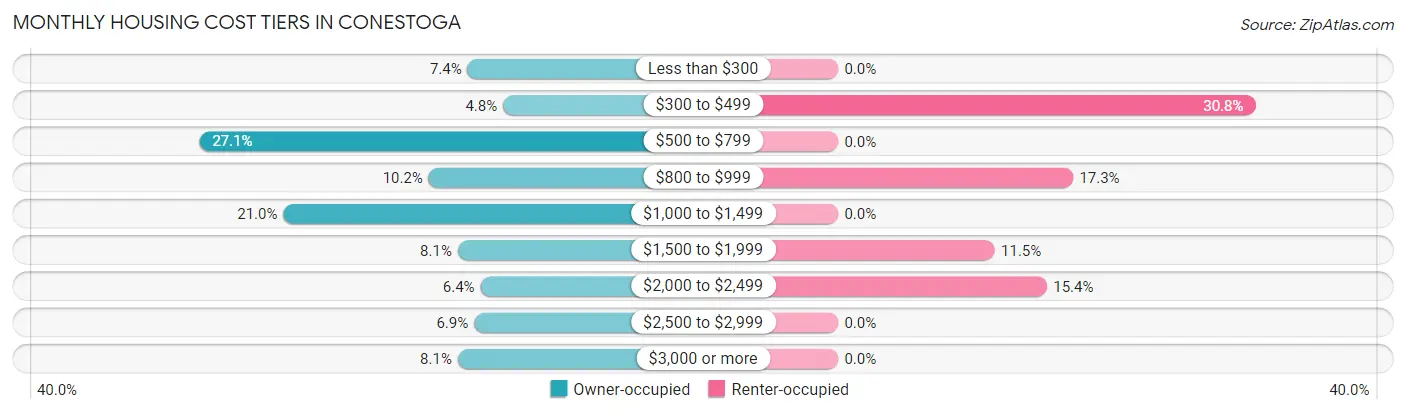
| Monthly Cost | Owner-occupied | Renter-occupied |
| Less than $300 | 31 (7.4%) | 0 (0.0%) |
| $300 to $499 | 20 (4.8%) | 16 (30.8%) |
| $500 to $799 | 114 (27.1%) | 0 (0.0%) |
| $800 to $999 | 43 (10.2%) | 9 (17.3%) |
| $1,000 to $1,499 | 88 (20.9%) | 0 (0.0%) |
| $1,500 to $1,999 | 34 (8.1%) | 6 (11.5%) |
| $2,000 to $2,499 | 27 (6.4%) | 8 (15.4%) |
| $2,500 to $2,999 | 29 (6.9%) | 0 (0.0%) |
| $3,000 or more | 34 (8.1%) | 0 (0.0%) |
| Total | 420 (100.0%) | 52 (100.0%) |
Physical Housing Characteristics in Conestoga
Housing Structures in Conestoga
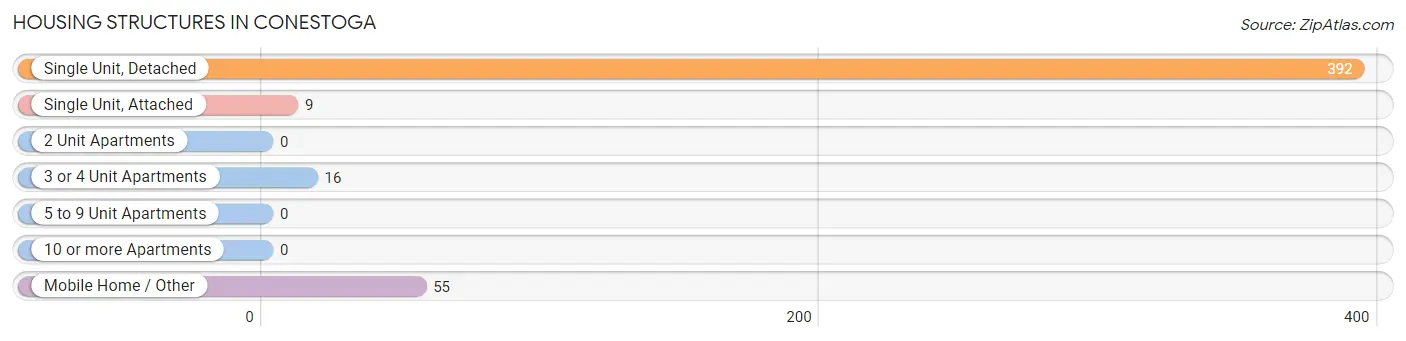
| Structure Type | # Housing Units | % Housing Units |
| Single Unit, Detached | 392 | 83.1% |
| Single Unit, Attached | 9 | 1.9% |
| 2 Unit Apartments | 0 | 0.0% |
| 3 or 4 Unit Apartments | 16 | 3.4% |
| 5 to 9 Unit Apartments | 0 | 0.0% |
| 10 or more Apartments | 0 | 0.0% |
| Mobile Home / Other | 55 | 11.7% |
| Total | 472 | 100.0% |
Housing Structures by Occupancy in Conestoga
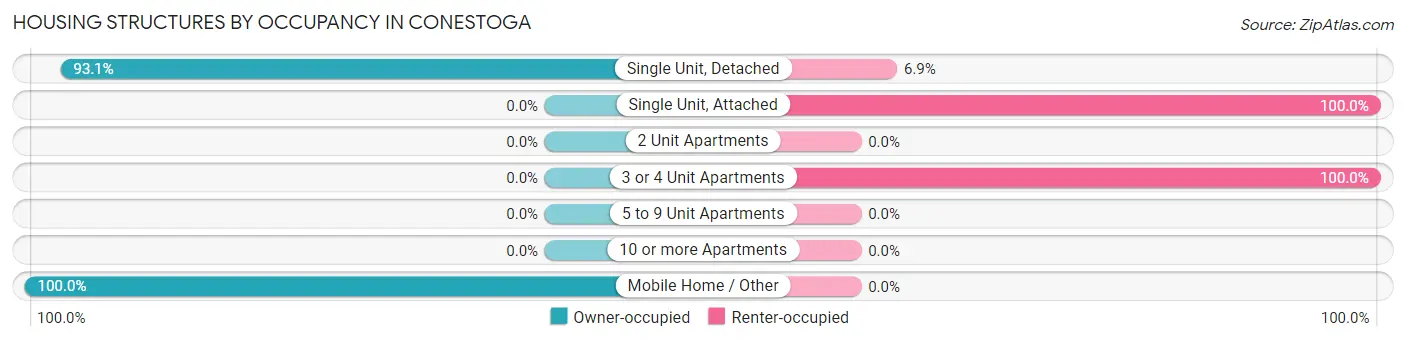
| Structure Type | Owner-occupied | Renter-occupied |
| Single Unit, Detached | 365 (93.1%) | 27 (6.9%) |
| Single Unit, Attached | 0 (0.0%) | 9 (100.0%) |
| 2 Unit Apartments | 0 (0.0%) | 0 (0.0%) |
| 3 or 4 Unit Apartments | 0 (0.0%) | 16 (100.0%) |
| 5 to 9 Unit Apartments | 0 (0.0%) | 0 (0.0%) |
| 10 or more Apartments | 0 (0.0%) | 0 (0.0%) |
| Mobile Home / Other | 55 (100.0%) | 0 (0.0%) |
| Total | 420 (89.0%) | 52 (11.0%) |
Housing Structures by Number of Rooms in Conestoga
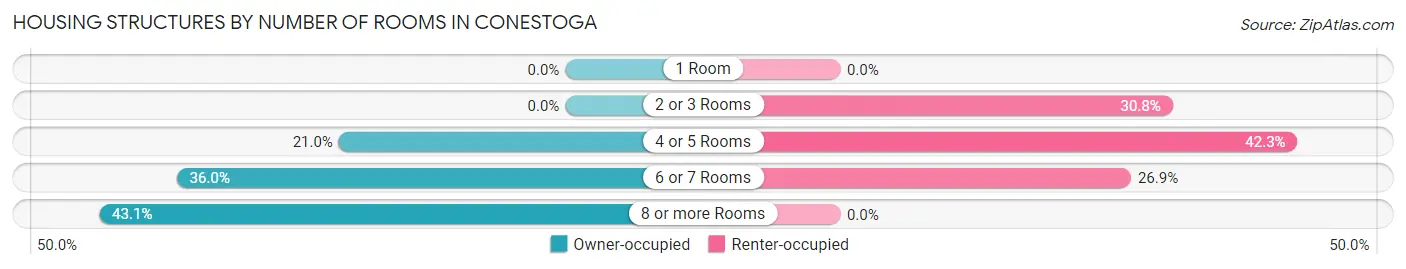
| Number of Rooms | Owner-occupied | Renter-occupied |
| 1 Room | 0 (0.0%) | 0 (0.0%) |
| 2 or 3 Rooms | 0 (0.0%) | 16 (30.8%) |
| 4 or 5 Rooms | 88 (20.9%) | 22 (42.3%) |
| 6 or 7 Rooms | 151 (35.9%) | 14 (26.9%) |
| 8 or more Rooms | 181 (43.1%) | 0 (0.0%) |
| Total | 420 (100.0%) | 52 (100.0%) |
Housing Structure by Heating Type in Conestoga
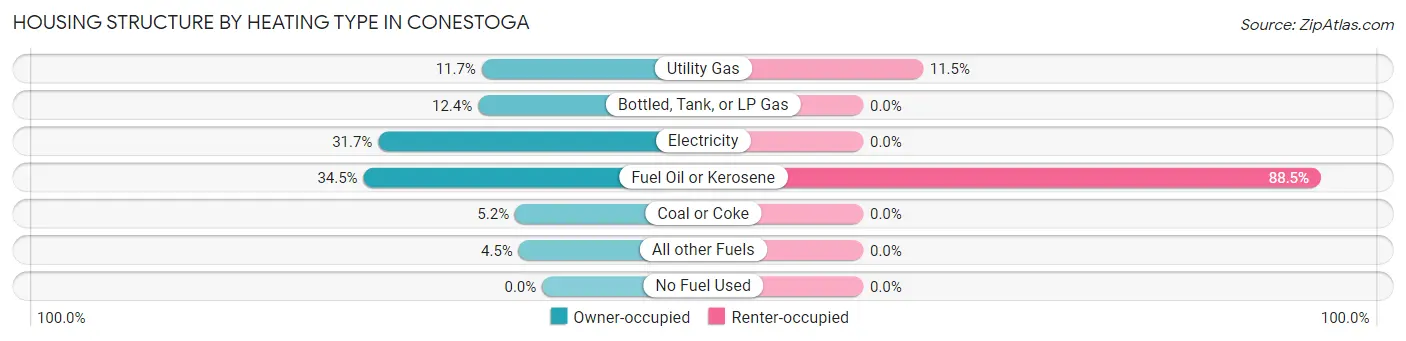
| Heating Type | Owner-occupied | Renter-occupied |
| Utility Gas | 49 (11.7%) | 6 (11.5%) |
| Bottled, Tank, or LP Gas | 52 (12.4%) | 0 (0.0%) |
| Electricity | 133 (31.7%) | 0 (0.0%) |
| Fuel Oil or Kerosene | 145 (34.5%) | 46 (88.5%) |
| Coal or Coke | 22 (5.2%) | 0 (0.0%) |
| All other Fuels | 19 (4.5%) | 0 (0.0%) |
| No Fuel Used | 0 (0.0%) | 0 (0.0%) |
| Total | 420 (100.0%) | 52 (100.0%) |
Household Vehicle Usage in Conestoga
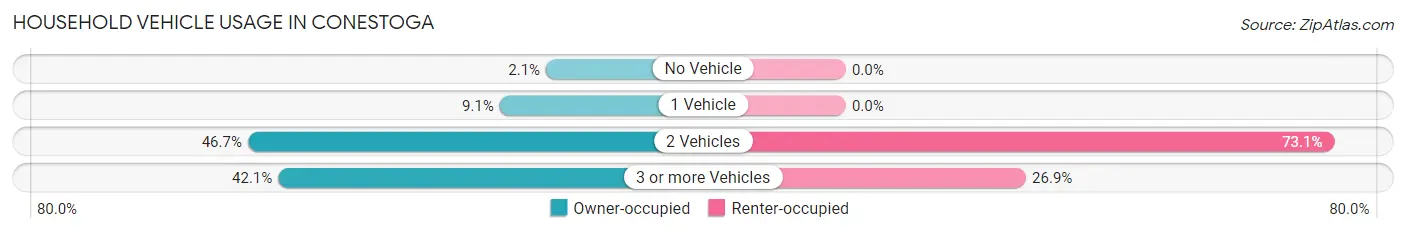
| Vehicles per Household | Owner-occupied | Renter-occupied |
| No Vehicle | 9 (2.1%) | 0 (0.0%) |
| 1 Vehicle | 38 (9.0%) | 0 (0.0%) |
| 2 Vehicles | 196 (46.7%) | 38 (73.1%) |
| 3 or more Vehicles | 177 (42.1%) | 14 (26.9%) |
| Total | 420 (100.0%) | 52 (100.0%) |
Real Estate & Mortgages in Conestoga
Real Estate and Mortgage Overview in Conestoga
| Characteristic | Without Mortgage | With Mortgage |
| Housing Units | 192 | 228 |
| Median Property Value | $181,800 | $255,200 |
| Median Household Income | - | - |
| Monthly Housing Costs | $623 | $34 |
| Real Estate Taxes | $2,870 | $0 |
Property Value by Mortgage Status in Conestoga
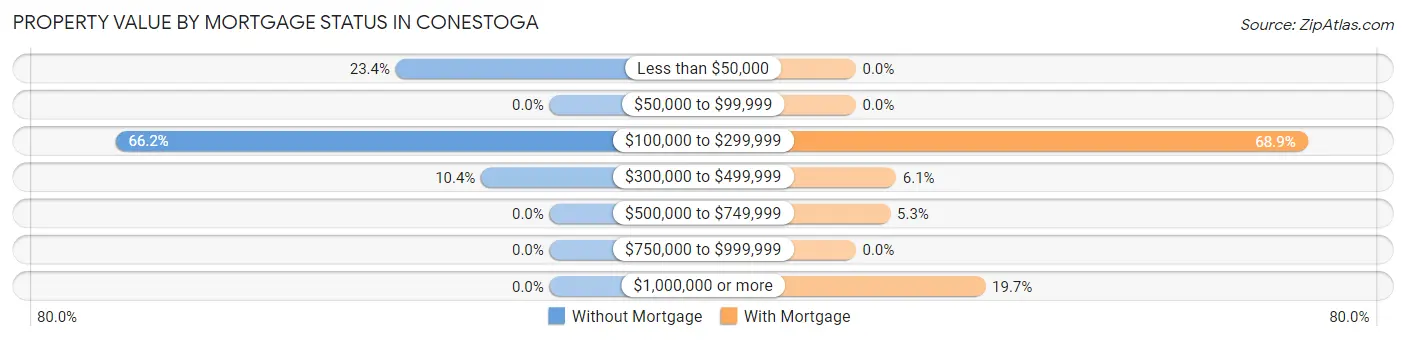
| Property Value | Without Mortgage | With Mortgage |
| Less than $50,000 | 45 (23.4%) | 0 (0.0%) |
| $50,000 to $99,999 | 0 (0.0%) | 0 (0.0%) |
| $100,000 to $299,999 | 127 (66.1%) | 157 (68.9%) |
| $300,000 to $499,999 | 20 (10.4%) | 14 (6.1%) |
| $500,000 to $749,999 | 0 (0.0%) | 12 (5.3%) |
| $750,000 to $999,999 | 0 (0.0%) | 0 (0.0%) |
| $1,000,000 or more | 0 (0.0%) | 45 (19.7%) |
| Total | 192 (100.0%) | 228 (100.0%) |
Household Income by Mortgage Status in Conestoga
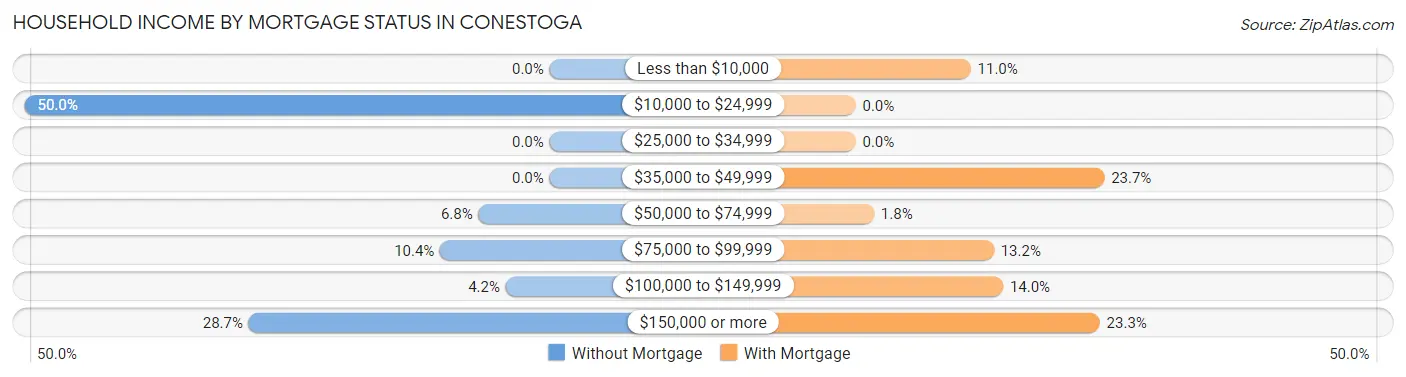
| Household Income | Without Mortgage | With Mortgage |
| Less than $10,000 | 0 (0.0%) | 25 (11.0%) |
| $10,000 to $24,999 | 96 (50.0%) | 0 (0.0%) |
| $25,000 to $34,999 | 0 (0.0%) | 0 (0.0%) |
| $35,000 to $49,999 | 0 (0.0%) | 54 (23.7%) |
| $50,000 to $74,999 | 13 (6.8%) | 4 (1.8%) |
| $75,000 to $99,999 | 20 (10.4%) | 30 (13.2%) |
| $100,000 to $149,999 | 8 (4.2%) | 32 (14.0%) |
| $150,000 or more | 55 (28.6%) | 53 (23.3%) |
| Total | 192 (100.0%) | 228 (100.0%) |
Property Value to Household Income Ratio in Conestoga
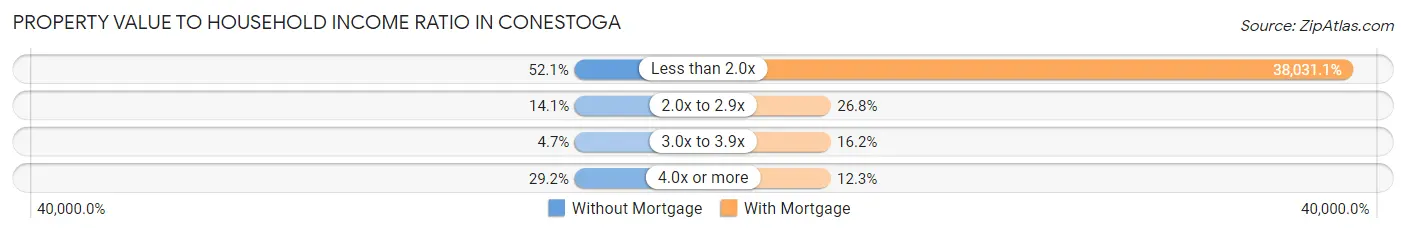
| Value-to-Income Ratio | Without Mortgage | With Mortgage |
| Less than 2.0x | 100 (52.1%) | 86,711 (38,031.1%) |
| 2.0x to 2.9x | 27 (14.1%) | 61 (26.8%) |
| 3.0x to 3.9x | 9 (4.7%) | 37 (16.2%) |
| 4.0x or more | 56 (29.2%) | 28 (12.3%) |
| Total | 192 (100.0%) | 228 (100.0%) |
Real Estate Taxes by Mortgage Status in Conestoga
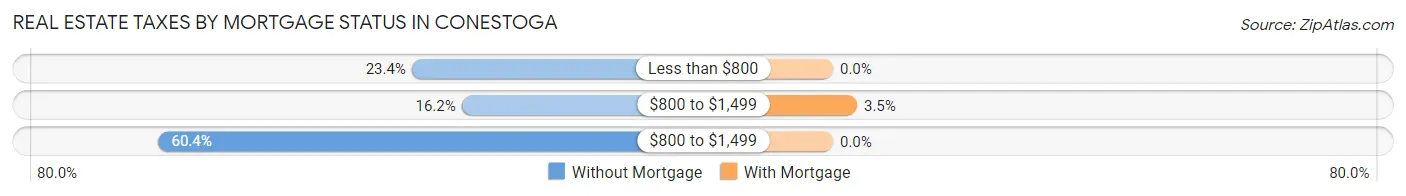
| Property Taxes | Without Mortgage | With Mortgage |
| Less than $800 | 45 (23.4%) | 0 (0.0%) |
| $800 to $1,499 | 31 (16.2%) | 8 (3.5%) |
| $800 to $1,499 | 116 (60.4%) | 0 (0.0%) |
| Total | 192 (100.0%) | 228 (100.0%) |
Health & Disability in Conestoga
Health Insurance Coverage by Age in Conestoga
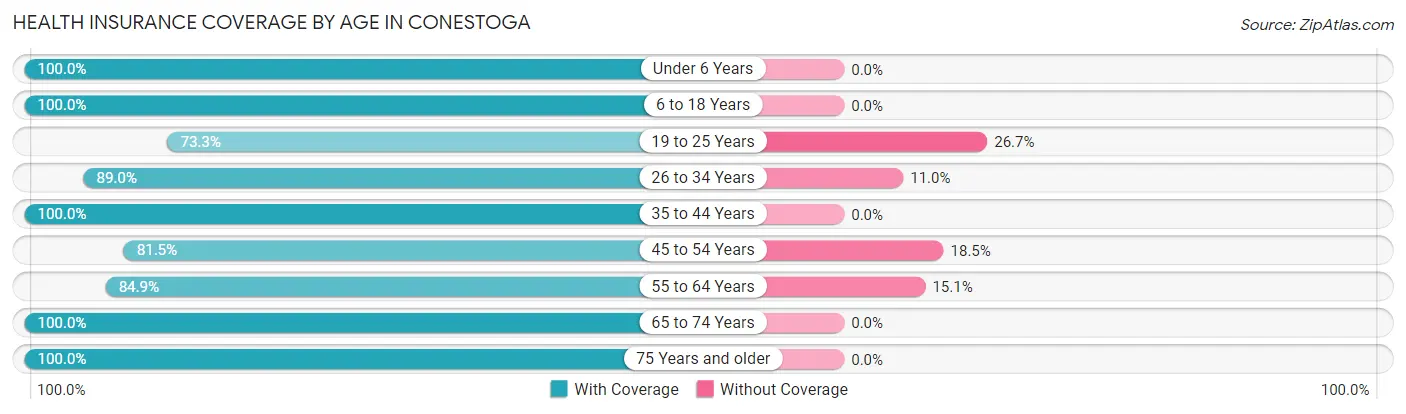
| Age Bracket | With Coverage | Without Coverage |
| Under 6 Years | 44 (100.0%) | 0 (0.0%) |
| 6 to 18 Years | 130 (100.0%) | 0 (0.0%) |
| 19 to 25 Years | 99 (73.3%) | 36 (26.7%) |
| 26 to 34 Years | 89 (89.0%) | 11 (11.0%) |
| 35 to 44 Years | 146 (100.0%) | 0 (0.0%) |
| 45 to 54 Years | 176 (81.5%) | 40 (18.5%) |
| 55 to 64 Years | 213 (84.9%) | 38 (15.1%) |
| 65 to 74 Years | 151 (100.0%) | 0 (0.0%) |
| 75 Years and older | 55 (100.0%) | 0 (0.0%) |
| Total | 1,103 (89.8%) | 125 (10.2%) |
Health Insurance Coverage by Citizenship Status in Conestoga
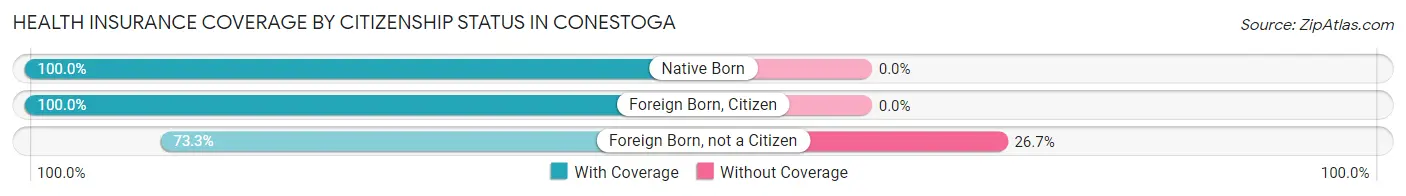
| Citizenship Status | With Coverage | Without Coverage |
| Native Born | 44 (100.0%) | 0 (0.0%) |
| Foreign Born, Citizen | 130 (100.0%) | 0 (0.0%) |
| Foreign Born, not a Citizen | 99 (73.3%) | 36 (26.7%) |
Health Insurance Coverage by Household Income in Conestoga
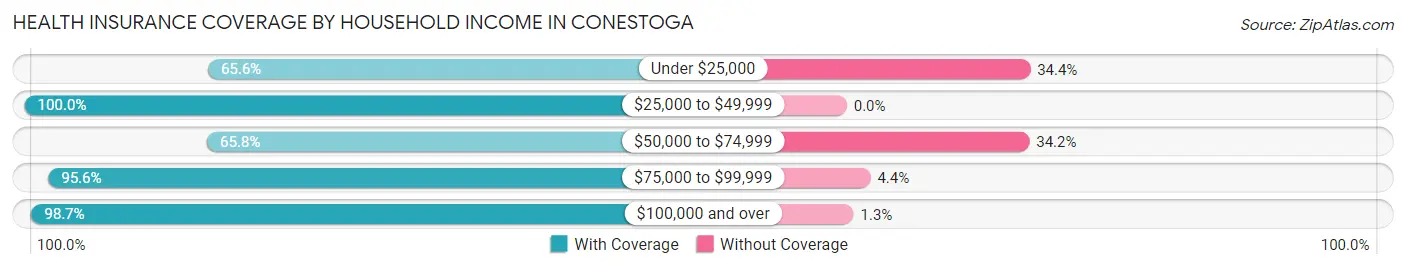
| Household Income | With Coverage | Without Coverage |
| Under $25,000 | 128 (65.6%) | 67 (34.4%) |
| $25,000 to $49,999 | 118 (100.0%) | 0 (0.0%) |
| $50,000 to $74,999 | 77 (65.8%) | 40 (34.2%) |
| $75,000 to $99,999 | 237 (95.6%) | 11 (4.4%) |
| $100,000 and over | 543 (98.7%) | 7 (1.3%) |
Public vs Private Health Insurance Coverage by Age in Conestoga
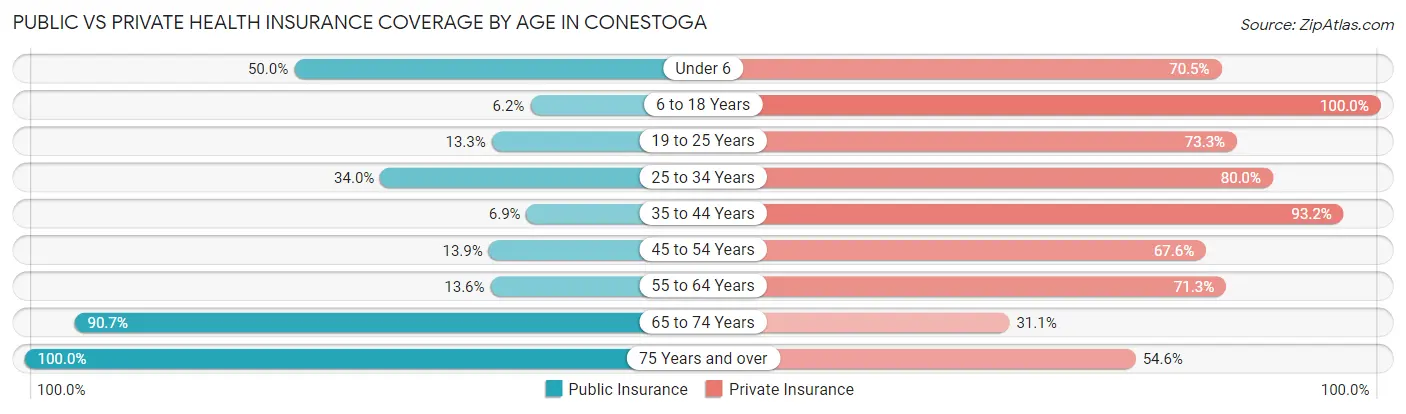
| Age Bracket | Public Insurance | Private Insurance |
| Under 6 | 22 (50.0%) | 31 (70.5%) |
| 6 to 18 Years | 8 (6.1%) | 130 (100.0%) |
| 19 to 25 Years | 18 (13.3%) | 99 (73.3%) |
| 25 to 34 Years | 34 (34.0%) | 80 (80.0%) |
| 35 to 44 Years | 10 (6.9%) | 136 (93.1%) |
| 45 to 54 Years | 30 (13.9%) | 146 (67.6%) |
| 55 to 64 Years | 34 (13.6%) | 179 (71.3%) |
| 65 to 74 Years | 137 (90.7%) | 47 (31.1%) |
| 75 Years and over | 55 (100.0%) | 30 (54.5%) |
| Total | 348 (28.3%) | 878 (71.5%) |
Disability Status by Sex by Age in Conestoga
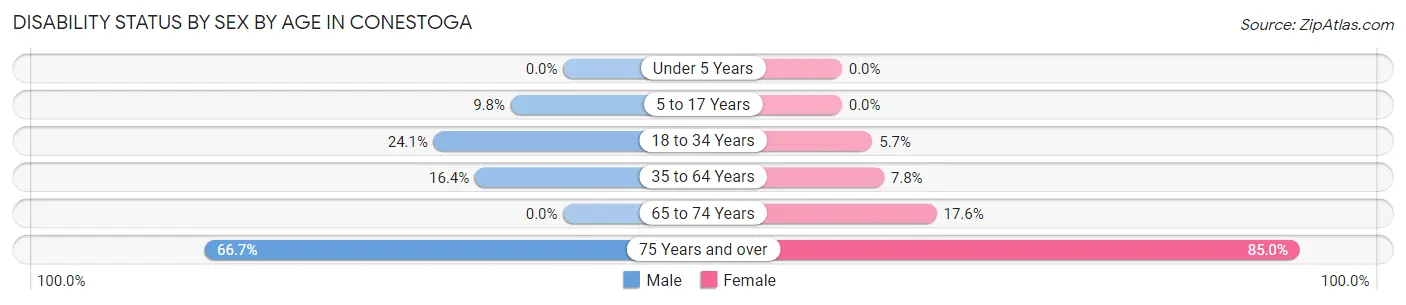
| Age Bracket | Male | Female |
| Under 5 Years | 0 (0.0%) | 0 (0.0%) |
| 5 to 17 Years | 8 (9.8%) | 0 (0.0%) |
| 18 to 34 Years | 19 (24.0%) | 9 (5.7%) |
| 35 to 64 Years | 48 (16.4%) | 25 (7.8%) |
| 65 to 74 Years | 0 (0.0%) | 19 (17.6%) |
| 75 Years and over | 10 (66.7%) | 34 (85.0%) |
Disability Class by Sex by Age in Conestoga
Disability Class: Hearing Difficulty
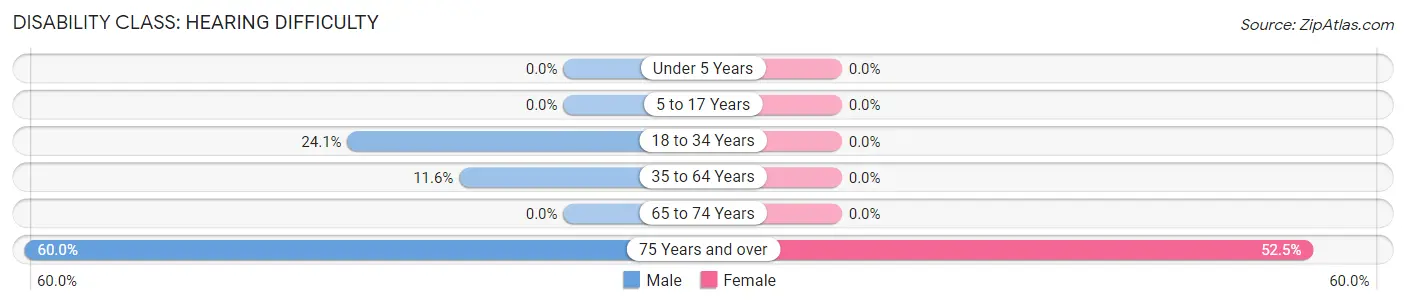
| Age Bracket | Male | Female |
| Under 5 Years | 0 (0.0%) | 0 (0.0%) |
| 5 to 17 Years | 0 (0.0%) | 0 (0.0%) |
| 18 to 34 Years | 19 (24.0%) | 0 (0.0%) |
| 35 to 64 Years | 34 (11.6%) | 0 (0.0%) |
| 65 to 74 Years | 0 (0.0%) | 0 (0.0%) |
| 75 Years and over | 9 (60.0%) | 21 (52.5%) |
Disability Class: Vision Difficulty
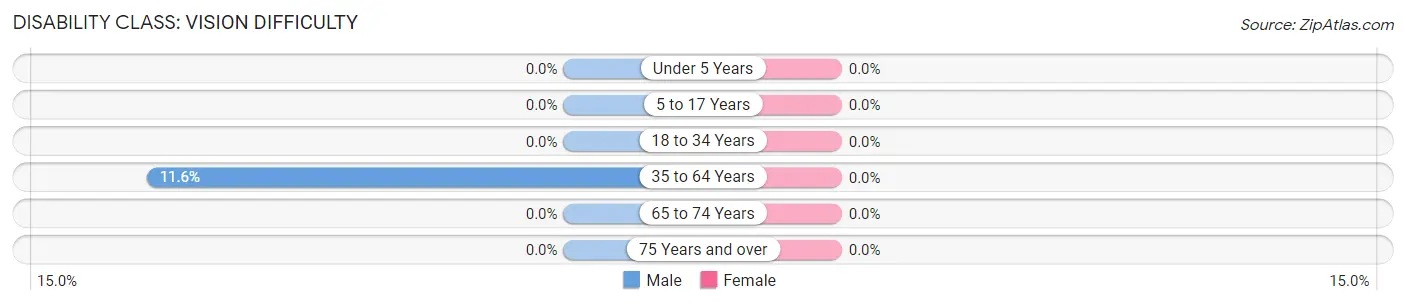
| Age Bracket | Male | Female |
| Under 5 Years | 0 (0.0%) | 0 (0.0%) |
| 5 to 17 Years | 0 (0.0%) | 0 (0.0%) |
| 18 to 34 Years | 0 (0.0%) | 0 (0.0%) |
| 35 to 64 Years | 34 (11.6%) | 0 (0.0%) |
| 65 to 74 Years | 0 (0.0%) | 0 (0.0%) |
| 75 Years and over | 0 (0.0%) | 0 (0.0%) |
Disability Class: Cognitive Difficulty
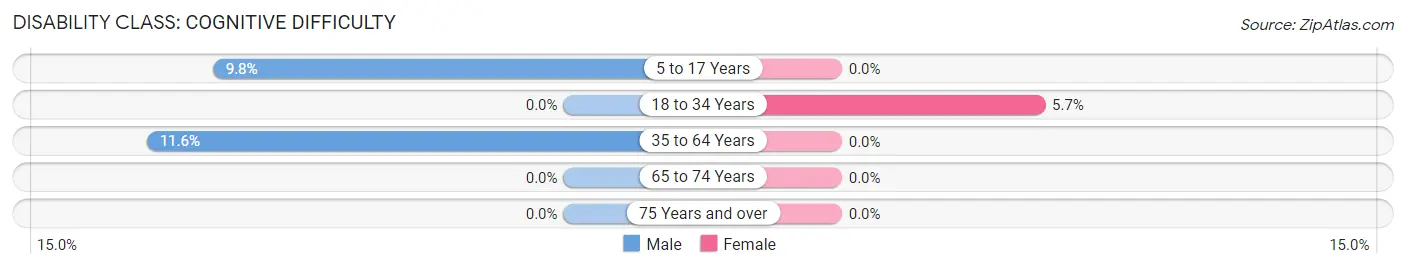
| Age Bracket | Male | Female |
| 5 to 17 Years | 8 (9.8%) | 0 (0.0%) |
| 18 to 34 Years | 0 (0.0%) | 9 (5.7%) |
| 35 to 64 Years | 34 (11.6%) | 0 (0.0%) |
| 65 to 74 Years | 0 (0.0%) | 0 (0.0%) |
| 75 Years and over | 0 (0.0%) | 0 (0.0%) |
Disability Class: Ambulatory Difficulty
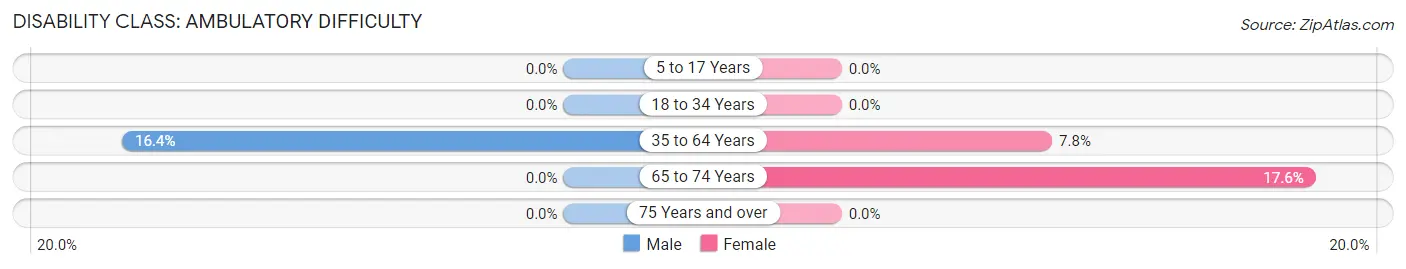
| Age Bracket | Male | Female |
| 5 to 17 Years | 0 (0.0%) | 0 (0.0%) |
| 18 to 34 Years | 0 (0.0%) | 0 (0.0%) |
| 35 to 64 Years | 48 (16.4%) | 25 (7.8%) |
| 65 to 74 Years | 0 (0.0%) | 19 (17.6%) |
| 75 Years and over | 0 (0.0%) | 0 (0.0%) |
Disability Class: Self-Care Difficulty
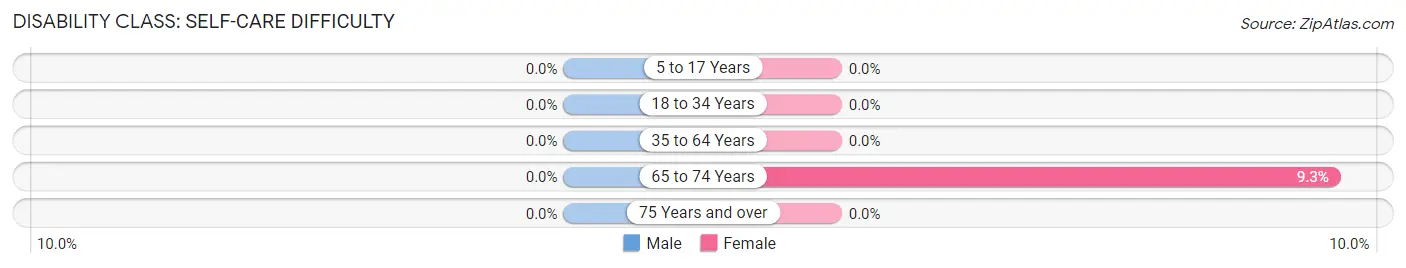
| Age Bracket | Male | Female |
| 5 to 17 Years | 0 (0.0%) | 0 (0.0%) |
| 18 to 34 Years | 0 (0.0%) | 0 (0.0%) |
| 35 to 64 Years | 0 (0.0%) | 0 (0.0%) |
| 65 to 74 Years | 0 (0.0%) | 10 (9.3%) |
| 75 Years and over | 0 (0.0%) | 0 (0.0%) |
Technology Access in Conestoga
Computing Device Access in Conestoga
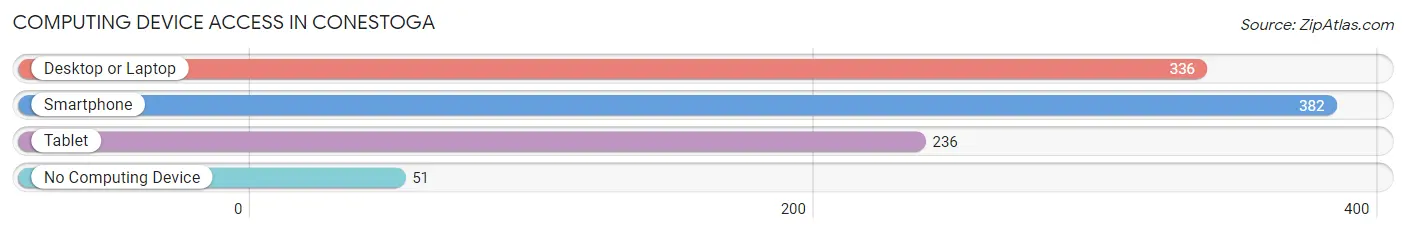
| Device Type | # Households | % Households |
| Desktop or Laptop | 336 | 71.2% |
| Smartphone | 382 | 80.9% |
| Tablet | 236 | 50.0% |
| No Computing Device | 51 | 10.8% |
| Total | 472 | 100.0% |
Internet Access in Conestoga
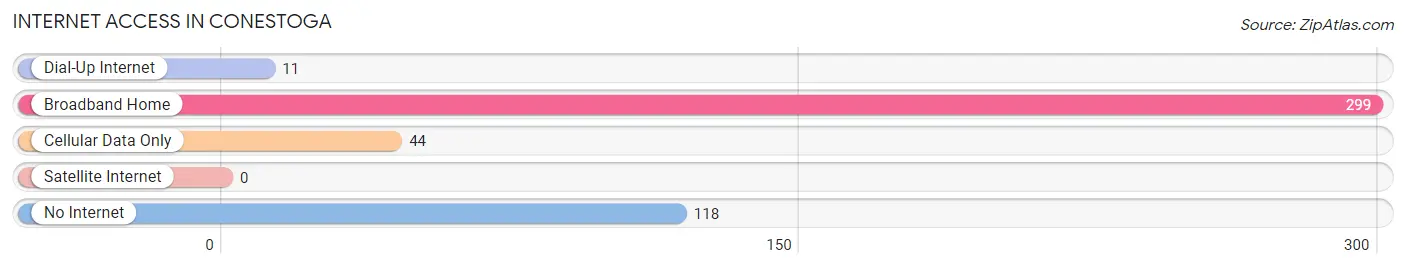
| Internet Type | # Households | % Households |
| Dial-Up Internet | 11 | 2.3% |
| Broadband Home | 299 | 63.3% |
| Cellular Data Only | 44 | 9.3% |
| Satellite Internet | 0 | 0.0% |
| No Internet | 118 | 25.0% |
| Total | 472 | 100.0% |
Conestoga Summary
Conestoga, Pennsylvania is a small borough located in Lancaster County, Pennsylvania. It is situated along the Conestoga River, which is a tributary of the Susquehanna River. The borough is located approximately 20 miles east of the city of Lancaster and is part of the Lancaster Metropolitan Statistical Area. As of the 2010 census, the population of Conestoga was 1,845.
History
The area that is now Conestoga was originally inhabited by the Susquehannock Native American tribe. The first European settlers arrived in the area in the late 17th century. The borough was officially established in 1814 and was named after the Conestoga River. The river was named after the Conestoga wagon, which was a type of covered wagon used by early settlers to transport goods.
The borough was an important stop along the Underground Railroad, which was a network of secret routes and safe houses used by African-American slaves to escape to freedom in the northern United States and Canada. The borough was also home to a number of mills and factories, including a paper mill, a flour mill, and a sawmill.
Geography
Conestoga is located at 40°7'25" North, 76°14'25" West (40.123611, -76.240278). According to the United States Census Bureau, the borough has a total area of 0.7 square miles (1.8 km2), all of which is land.
The borough is located in the Conestoga Valley, which is a long, narrow valley that is bordered by the Susquehanna River to the east and the Conestoga River to the west. The valley is home to a number of small towns and villages, including Conestoga, Brownstown, and Marticville.
Economy
The economy of Conestoga is largely based on agriculture and manufacturing. The borough is home to a number of farms, which produce a variety of crops, including corn, soybeans, and wheat. The borough is also home to a number of small manufacturing businesses, which produce a variety of products, including furniture, paper products, and textiles.
Demographics
As of the 2010 census, there were 1,845 people, 745 households, and 486 families residing in the borough. The population density was 2,637.3 people per square mile (1,017.2/km2). There were 809 housing units at an average density of 1,148.3 per square mile (443.2/km2). The racial makeup of the borough was 97.2% White, 0.7% African American, 0.2% Native American, 0.4% Asian, 0.1% Pacific Islander, 0.4% from other races, and 1.0% from two or more races. Hispanic or Latino of any race were 1.3% of the population.
There were 745 households, out of which 28.2% had children under the age of 18 living with them, 48.2% were married couples living together, 11.2% had a female householder with no husband present, and 35.7% were non-families. 30.2% of all households were made up of individuals, and 14.2% had someone living alone who was 65 years of age or older. The average household size was 2.45 and the average family size was 3.04.
In the borough, the population was spread out, with 24.2% under the age of 18, 7.2% from 18 to 24, 28.2% from 25 to 44, 22.7% from 45 to 64, and 17.7% who were 65 years of age or older. The median age was 38 years. For every 100 females, there were 94.2 males. For every 100 females age 18 and over, there were 91.2 males.
The median income for a household in the borough was $41,250, and the median income for a family was $50,000. Males had a median income of $35,000 versus $25,000 for females. The per capita income for the borough was $20,845. About 4.2% of families and 6.2% of the population were below the poverty line, including 8.2% of those under age 18 and 5.2% of those age 65 or over.
Common Questions
What is Per Capita Income in Conestoga?
Per Capita income in Conestoga is $37,356.
What is the Median Family Income in Conestoga?
Median Family Income in Conestoga is $83,942.
What is the Median Household income in Conestoga?
Median Household Income in Conestoga is $79,722.
What is Income or Wage Gap in Conestoga?
Income or Wage Gap in Conestoga is 44.4%.
Women in Conestoga earn 55.6 cents for every dollar earned by a man.
What is Inequality or Gini Index in Conestoga?
Inequality or Gini Index in Conestoga is 0.41.
What is the Total Population of Conestoga?
Total Population of Conestoga is 1,228.
What is the Total Male Population of Conestoga?
Total Male Population of Conestoga is 512.
What is the Total Female Population of Conestoga?
Total Female Population of Conestoga is 716.
What is the Ratio of Males per 100 Females in Conestoga?
There are 71.51 Males per 100 Females in Conestoga.
What is the Ratio of Females per 100 Males in Conestoga?
There are 139.84 Females per 100 Males in Conestoga.
What is the Median Population Age in Conestoga?
Median Population Age in Conestoga is 49.5 Years.
What is the Average Family Size in Conestoga
Average Family Size in Conestoga is 2.7 People.
What is the Average Household Size in Conestoga
Average Household Size in Conestoga is 2.6 People.
How Large is the Labor Force in Conestoga?
There are 687 People in the Labor Forcein in Conestoga.
What is the Percentage of People in the Labor Force in Conestoga?
65.0% of People are in the Labor Force in Conestoga.