Christiana borough, PA Map & Demographics
Christiana borough Overview
$32,228
PER CAPITA INCOME
$81,635
AVG FAMILY INCOME
$74,821
AVG HOUSEHOLD INCOME
36.3%
WAGE / INCOME GAP [ % ]
63.7¢/ $1
WAGE / INCOME GAP [ $ ]
0.36
INEQUALITY / GINI INDEX
956
TOTAL POPULATION
440
MALE POPULATION
516
FEMALE POPULATION
85.27
MALES / 100 FEMALES
117.27
FEMALES / 100 MALES
43.1
MEDIAN AGE
3.1
AVG FAMILY SIZE
2.5
AVG HOUSEHOLD SIZE
431
LABOR FORCE [ PEOPLE ]
55.3%
PERCENT IN LABOR FORCE
1.9%
UNEMPLOYMENT RATE
Income in Christiana borough
Income Overview in Christiana borough
Per Capita Income in Christiana borough is $32,228, while median incomes of families and households are $81,635 and $74,821 respectively.
| Characteristic | Number | Measure |
| Per Capita Income | 956 | $32,228 |
| Median Family Income | 197 | $81,635 |
| Mean Family Income | 197 | $107,949 |
| Median Household Income | 322 | $74,821 |
| Mean Household Income | 322 | $90,389 |
| Income Deficit | 197 | $0 |
| Wage / Income Gap (%) | 956 | 36.26% |
| Wage / Income Gap ($) | 956 | 63.74¢ per $1 |
| Gini / Inequality Index | 956 | 0.36 |
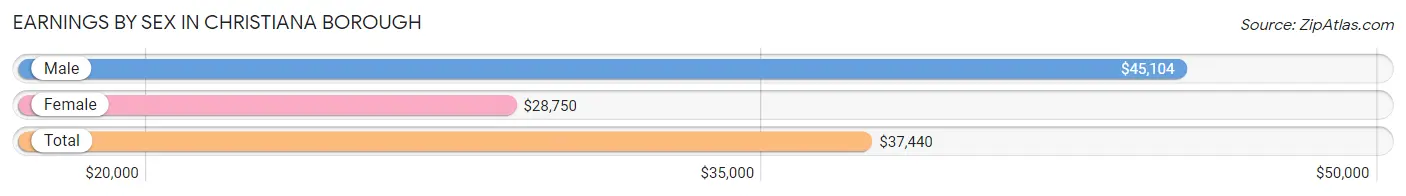
Earnings by Sex in Christiana borough
Average Earnings in Christiana borough are $37,440, $45,104 for men and $28,750 for women, a difference of 36.3%.
| Sex | Number | Average Earnings |
| Male | 259 (56.7%) | $45,104 |
| Female | 198 (43.3%) | $28,750 |
| Total | 457 (100.0%) | $37,440 |
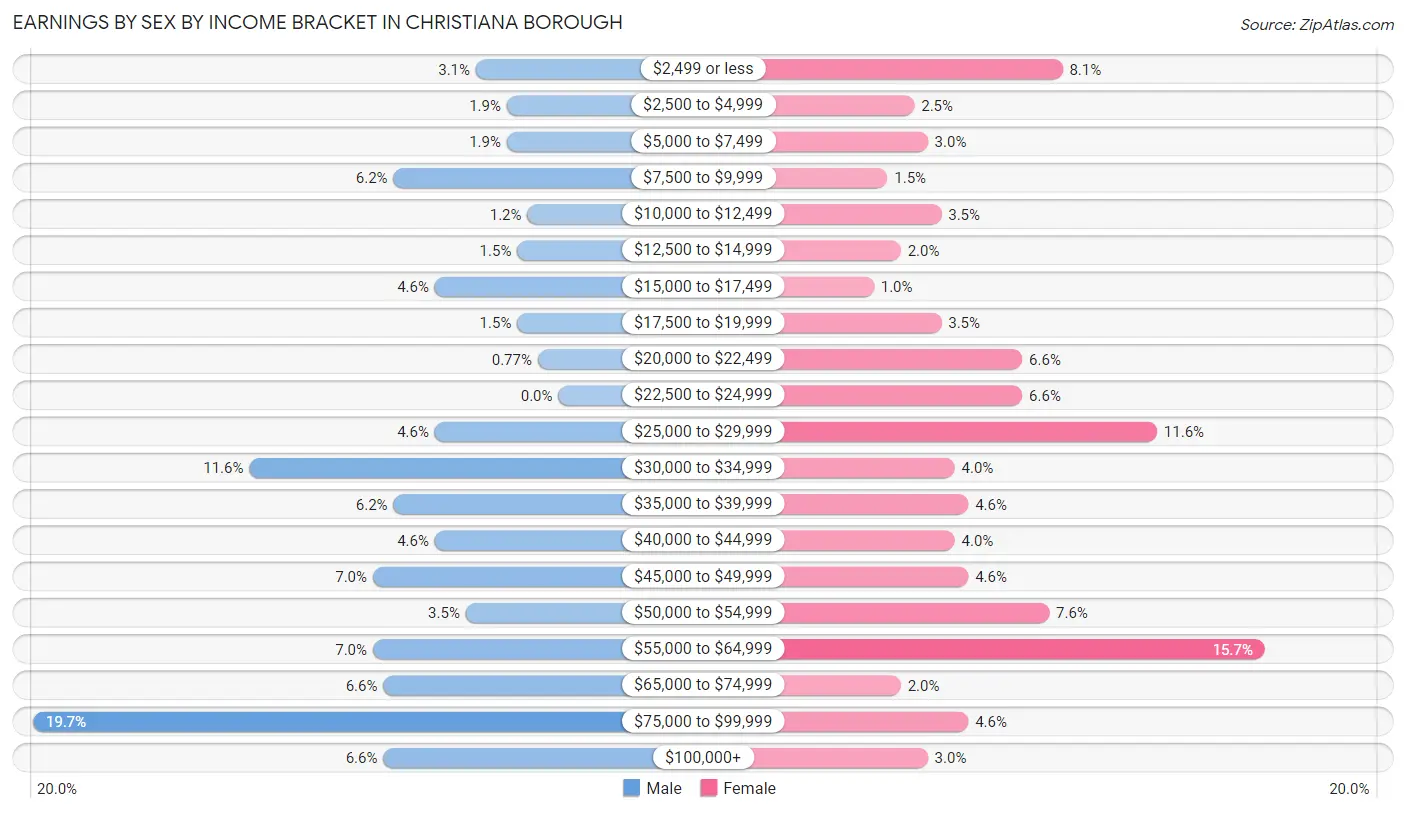
Earnings by Sex by Income Bracket in Christiana borough
The most common earnings brackets in Christiana borough are $75,000 to $99,999 for men (51 | 19.7%) and $55,000 to $64,999 for women (31 | 15.7%).
| Income | Male | Female |
| $2,499 or less | 8 (3.1%) | 16 (8.1%) |
| $2,500 to $4,999 | 5 (1.9%) | 5 (2.5%) |
| $5,000 to $7,499 | 5 (1.9%) | 6 (3.0%) |
| $7,500 to $9,999 | 16 (6.2%) | 3 (1.5%) |
| $10,000 to $12,499 | 3 (1.2%) | 7 (3.5%) |
| $12,500 to $14,999 | 4 (1.5%) | 4 (2.0%) |
| $15,000 to $17,499 | 12 (4.6%) | 2 (1.0%) |
| $17,500 to $19,999 | 4 (1.5%) | 7 (3.5%) |
| $20,000 to $22,499 | 2 (0.8%) | 13 (6.6%) |
| $22,500 to $24,999 | 0 (0.0%) | 13 (6.6%) |
| $25,000 to $29,999 | 12 (4.6%) | 23 (11.6%) |
| $30,000 to $34,999 | 30 (11.6%) | 8 (4.0%) |
| $35,000 to $39,999 | 16 (6.2%) | 9 (4.5%) |
| $40,000 to $44,999 | 12 (4.6%) | 8 (4.0%) |
| $45,000 to $49,999 | 18 (7.0%) | 9 (4.5%) |
| $50,000 to $54,999 | 9 (3.5%) | 15 (7.6%) |
| $55,000 to $64,999 | 18 (7.0%) | 31 (15.7%) |
| $65,000 to $74,999 | 17 (6.6%) | 4 (2.0%) |
| $75,000 to $99,999 | 51 (19.7%) | 9 (4.5%) |
| $100,000+ | 17 (6.6%) | 6 (3.0%) |
| Total | 259 (100.0%) | 198 (100.0%) |
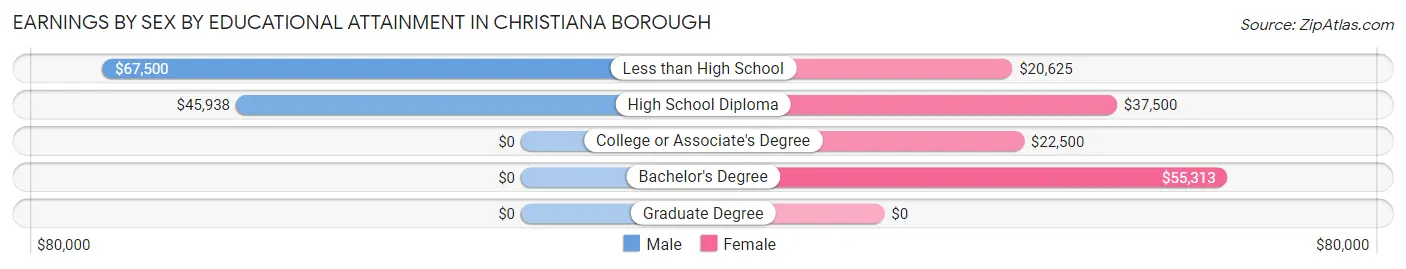
Earnings by Sex by Educational Attainment in Christiana borough
Average earnings in Christiana borough are $51,563 for men and $33,750 for women, a difference of 34.5%. Men with an educational attainment of less than high school enjoy the highest average annual earnings of $67,500, while those with high school diploma education earn the least with $45,938. Women with an educational attainment of bachelor's degree earn the most with the average annual earnings of $55,313, while those with less than high school education have the smallest earnings of $20,625.
| Educational Attainment | Male Income | Female Income |
| Less than High School | $67,500 | $20,625 |
| High School Diploma | $45,938 | $37,500 |
| College or Associate's Degree | - | - |
| Bachelor's Degree | - | - |
| Graduate Degree | - | - |
| Total | $51,563 | $33,750 |
Family Income in Christiana borough
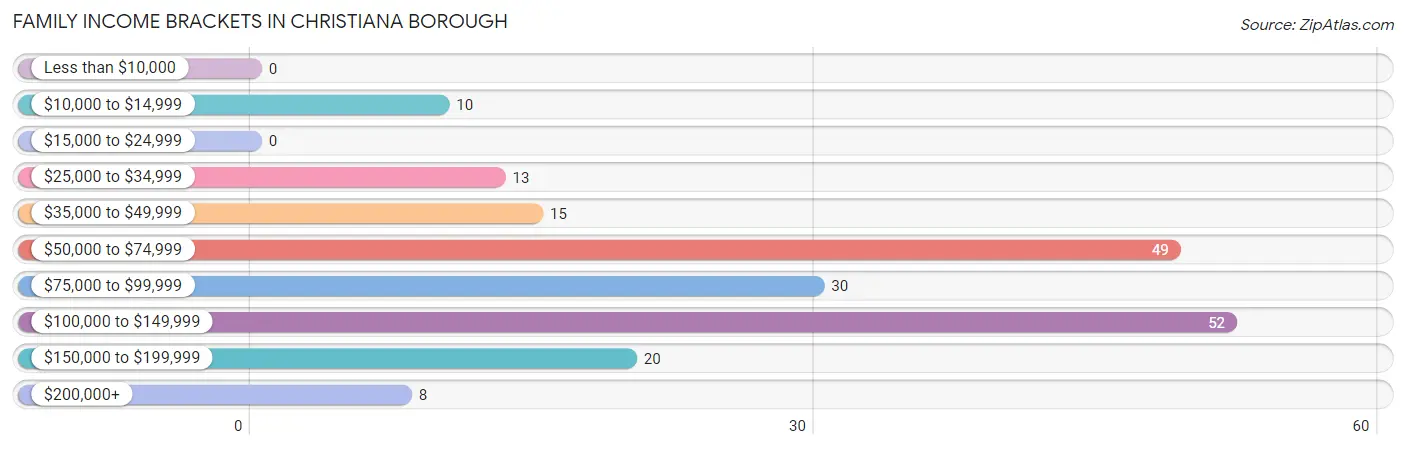
Family Income Brackets in Christiana borough
According to the Christiana borough family income data, there are 52 families falling into the $100,000 to $149,999 income range, which is the most common income bracket and makes up 26.4% of all families.
| Income Bracket | # Families | % Families |
| Less than $10,000 | 0 | 0.0% |
| $10,000 to $14,999 | 10 | 5.1% |
| $15,000 to $24,999 | 0 | 0.0% |
| $25,000 to $34,999 | 13 | 6.6% |
| $35,000 to $49,999 | 15 | 7.6% |
| $50,000 to $74,999 | 49 | 24.9% |
| $75,000 to $99,999 | 30 | 15.2% |
| $100,000 to $149,999 | 52 | 26.4% |
| $150,000 to $199,999 | 20 | 10.2% |
| $200,000+ | 8 | 4.1% |
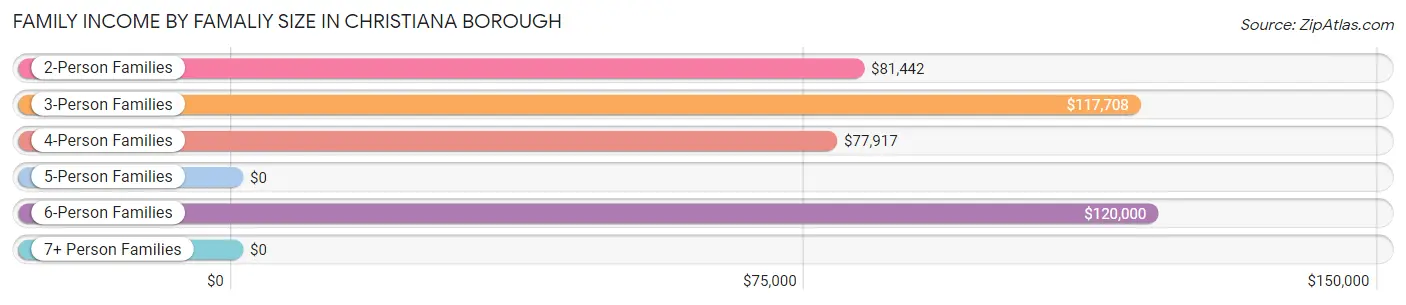
Family Income by Famaliy Size in Christiana borough
6-person families (22 | 11.2%) account for the highest median family income in Christiana borough with $120,000 per family, while 2-person families (97 | 49.2%) have the highest median income of $40,721 per family member.
| Income Bracket | # Families | Median Income |
| 2-Person Families | 97 (49.2%) | $81,442 |
| 3-Person Families | 43 (21.8%) | $117,708 |
| 4-Person Families | 15 (7.6%) | $77,917 |
| 5-Person Families | 17 (8.6%) | $0 |
| 6-Person Families | 22 (11.2%) | $120,000 |
| 7+ Person Families | 3 (1.5%) | $0 |
| Total | 197 (100.0%) | $81,635 |
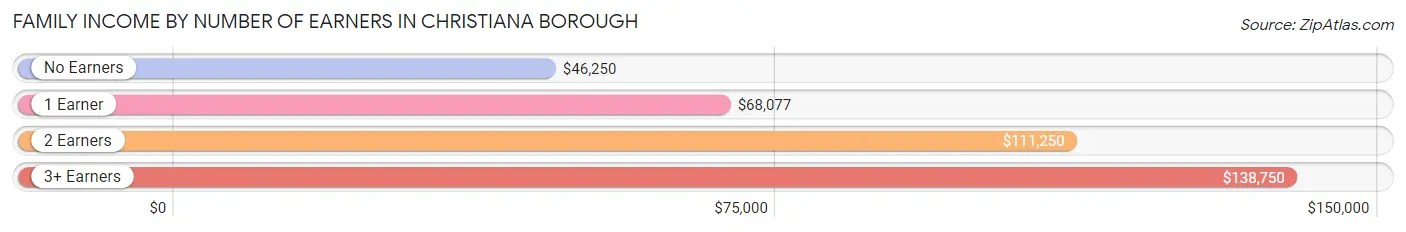
Family Income by Number of Earners in Christiana borough
The median family income in Christiana borough is $81,635, with families comprising 3+ earners (17) having the highest median family income of $138,750, while families with no earners (24) have the lowest median family income of $46,250, accounting for 8.6% and 12.2% of families, respectively.
| Number of Earners | # Families | Median Income |
| No Earners | 24 (12.2%) | $46,250 |
| 1 Earner | 70 (35.5%) | $68,077 |
| 2 Earners | 86 (43.6%) | $111,250 |
| 3+ Earners | 17 (8.6%) | $138,750 |
| Total | 197 (100.0%) | $81,635 |
Household Income in Christiana borough
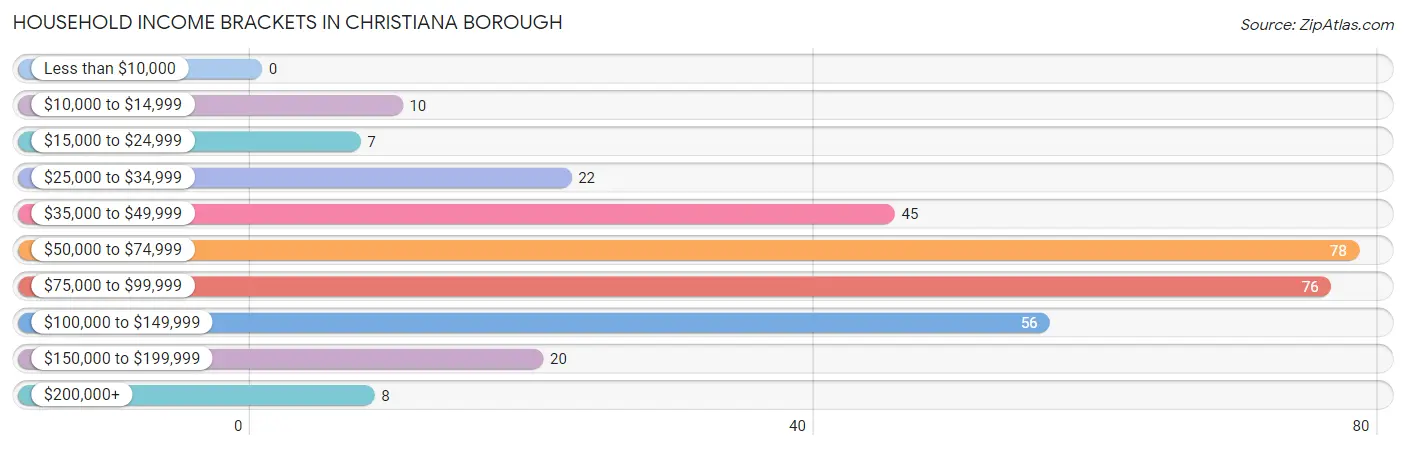
Household Income Brackets in Christiana borough
With 78 households falling in the category, the $50,000 to $74,999 income range is the most frequent in Christiana borough, accounting for 24.2% of all households.
| Income Bracket | # Households | % Households |
| Less than $10,000 | 0 | 0.0% |
| $10,000 to $14,999 | 10 | 3.1% |
| $15,000 to $24,999 | 7 | 2.2% |
| $25,000 to $34,999 | 22 | 6.8% |
| $35,000 to $49,999 | 45 | 14.0% |
| $50,000 to $74,999 | 78 | 24.2% |
| $75,000 to $99,999 | 76 | 23.6% |
| $100,000 to $149,999 | 56 | 17.4% |
| $150,000 to $199,999 | 20 | 6.2% |
| $200,000+ | 8 | 2.5% |
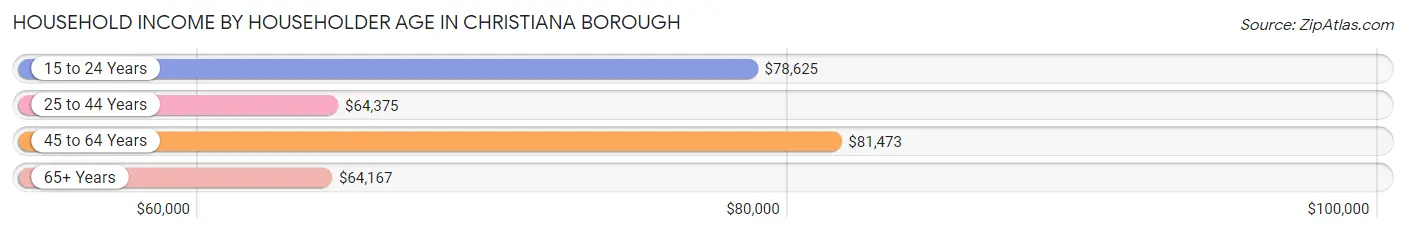
Household Income by Householder Age in Christiana borough
The median household income in Christiana borough is $74,821, with the highest median household income of $81,473 found in the 45 to 64 years age bracket for the primary householder. A total of 135 households (41.9%) fall into this category. Meanwhile, the 65+ years age bracket for the primary householder has the lowest median household income of $64,167, with 74 households (23.0%) in this group.
| Income Bracket | # Households | Median Income |
| 15 to 24 Years | 23 (7.1%) | $78,625 |
| 25 to 44 Years | 90 (28.0%) | $64,375 |
| 45 to 64 Years | 135 (41.9%) | $81,473 |
| 65+ Years | 74 (23.0%) | $64,167 |
| Total | 322 (100.0%) | $74,821 |
Poverty in Christiana borough
Income Below Poverty by Sex and Age in Christiana borough
With 11.3% poverty level for males and 10.2% for females among the residents of Christiana borough, 5 year old males and 6 to 11 year old females are the most vulnerable to poverty, with 4 males (50.0%) and 4 females (21.0%) in their respective age groups living below the poverty level.
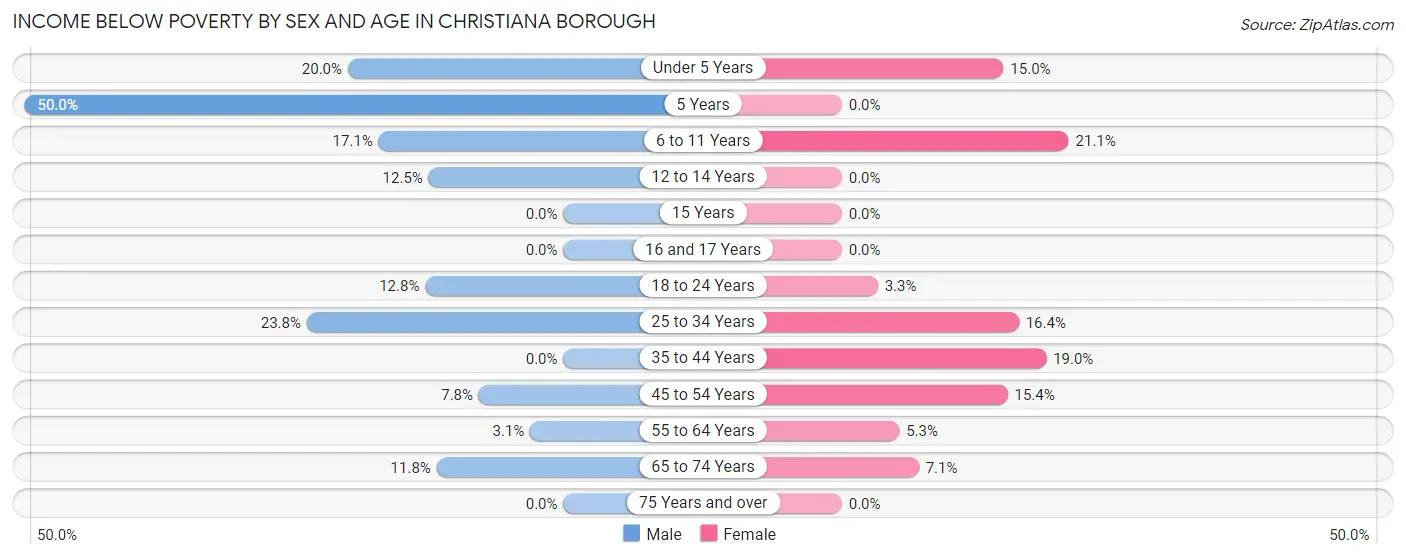
| Age Bracket | Male | Female |
| Under 5 Years | 4 (20.0%) | 6 (15.0%) |
| 5 Years | 4 (50.0%) | 0 (0.0%) |
| 6 to 11 Years | 6 (17.1%) | 4 (21.0%) |
| 12 to 14 Years | 2 (12.5%) | 0 (0.0%) |
| 15 Years | 0 (0.0%) | 0 (0.0%) |
| 16 and 17 Years | 0 (0.0%) | 0 (0.0%) |
| 18 to 24 Years | 5 (12.8%) | 1 (3.3%) |
| 25 to 34 Years | 15 (23.8%) | 11 (16.4%) |
| 35 to 44 Years | 0 (0.0%) | 11 (19.0%) |
| 45 to 54 Years | 4 (7.8%) | 4 (15.4%) |
| 55 to 64 Years | 2 (3.1%) | 4 (5.3%) |
| 65 to 74 Years | 4 (11.8%) | 2 (7.1%) |
| 75 Years and over | 0 (0.0%) | 0 (0.0%) |
| Total | 46 (11.3%) | 43 (10.2%) |
Income Above Poverty by Sex and Age in Christiana borough
According to the poverty statistics in Christiana borough, males aged 15 years and females aged 5 years are the age groups that are most secure financially, with 100.0% of males and 100.0% of females in these age groups living above the poverty line.
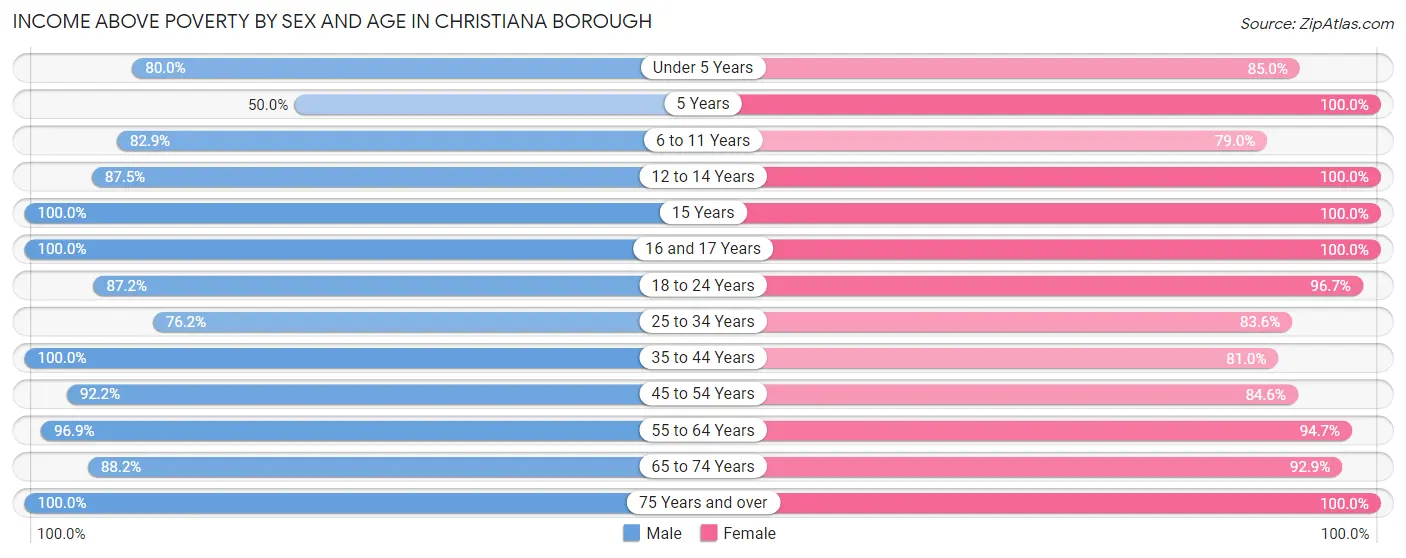
| Age Bracket | Male | Female |
| Under 5 Years | 16 (80.0%) | 34 (85.0%) |
| 5 Years | 4 (50.0%) | 9 (100.0%) |
| 6 to 11 Years | 29 (82.9%) | 15 (78.9%) |
| 12 to 14 Years | 14 (87.5%) | 17 (100.0%) |
| 15 Years | 1 (100.0%) | 5 (100.0%) |
| 16 and 17 Years | 10 (100.0%) | 8 (100.0%) |
| 18 to 24 Years | 34 (87.2%) | 29 (96.7%) |
| 25 to 34 Years | 48 (76.2%) | 56 (83.6%) |
| 35 to 44 Years | 51 (100.0%) | 47 (81.0%) |
| 45 to 54 Years | 47 (92.2%) | 22 (84.6%) |
| 55 to 64 Years | 63 (96.9%) | 71 (94.7%) |
| 65 to 74 Years | 30 (88.2%) | 26 (92.9%) |
| 75 Years and over | 13 (100.0%) | 38 (100.0%) |
| Total | 360 (88.7%) | 377 (89.8%) |
Income Below Poverty Among Married-Couple Families in Christiana borough
The poverty statistics for married-couple families in Christiana borough show that 5.8% or 8 of the total 138 families live below the poverty line. Families with 3 or 4 children have the highest poverty rate of 14.3%, comprising of 4 families. On the other hand, families with 1 or 2 children have the lowest poverty rate of 0.0%, which includes 0 families.
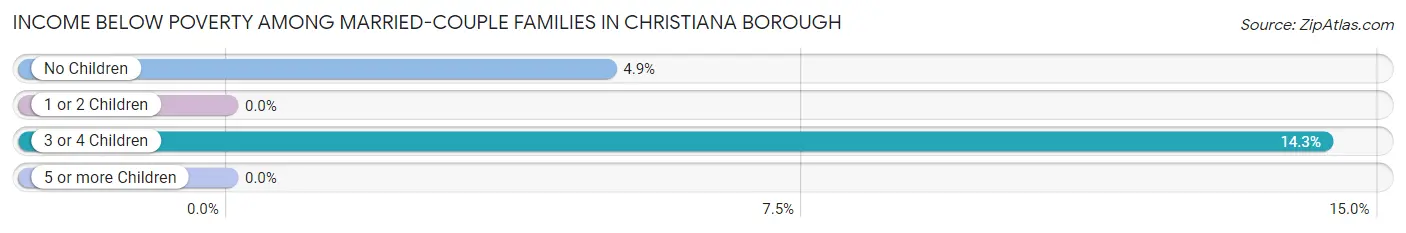
| Children | Above Poverty | Below Poverty |
| No Children | 77 (95.1%) | 4 (4.9%) |
| 1 or 2 Children | 29 (100.0%) | 0 (0.0%) |
| 3 or 4 Children | 24 (85.7%) | 4 (14.3%) |
| 5 or more Children | 0 (0.0%) | 0 (0.0%) |
| Total | 130 (94.2%) | 8 (5.8%) |
Income Below Poverty Among Single-Parent Households in Christiana borough
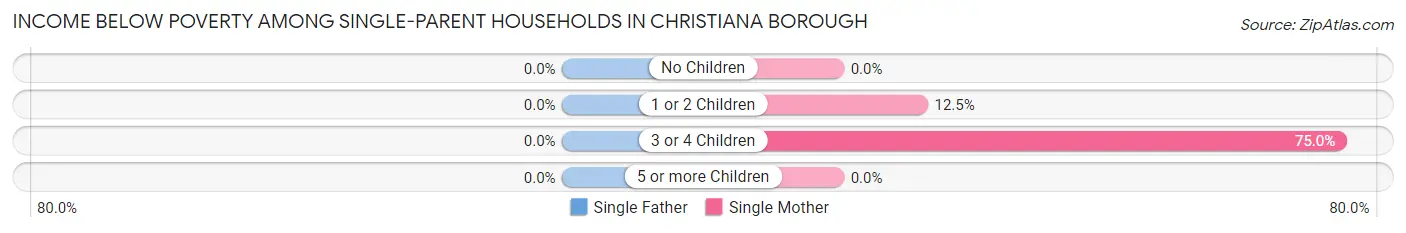
| Children | Single Father | Single Mother |
| No Children | 0 (0.0%) | 0 (0.0%) |
| 1 or 2 Children | 0 (0.0%) | 2 (12.5%) |
| 3 or 4 Children | 0 (0.0%) | 3 (75.0%) |
| 5 or more Children | 0 (0.0%) | 0 (0.0%) |
| Total | 0 (0.0%) | 5 (10.0%) |
Income Below Poverty Among Married-Couple vs Single-Parent Households in Christiana borough
The poverty data for Christiana borough shows that 8 of the married-couple family households (5.8%) and 5 of the single-parent households (8.5%) are living below the poverty level. Within the married-couple family households, those with 3 or 4 children have the highest poverty rate, with 4 households (14.3%) falling below the poverty line. Among the single-parent households, those with 3 or 4 children have the highest poverty rate, with 3 household (75.0%) living below poverty.
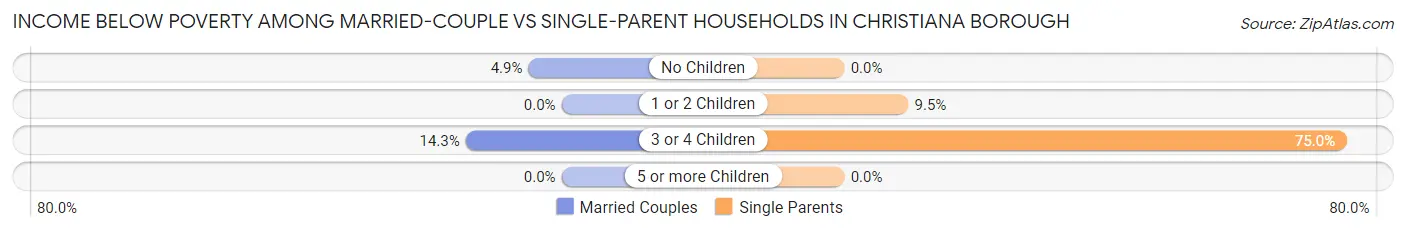
| Children | Married-Couple Families | Single-Parent Households |
| No Children | 4 (4.9%) | 0 (0.0%) |
| 1 or 2 Children | 0 (0.0%) | 2 (9.5%) |
| 3 or 4 Children | 4 (14.3%) | 3 (75.0%) |
| 5 or more Children | 0 (0.0%) | 0 (0.0%) |
| Total | 8 (5.8%) | 5 (8.5%) |
Race in Christiana borough
The most populous races in Christiana borough are White / Caucasian (864 | 90.4%), Hispanic or Latino (40 | 4.2%), and Two or more Races (40 | 4.2%).
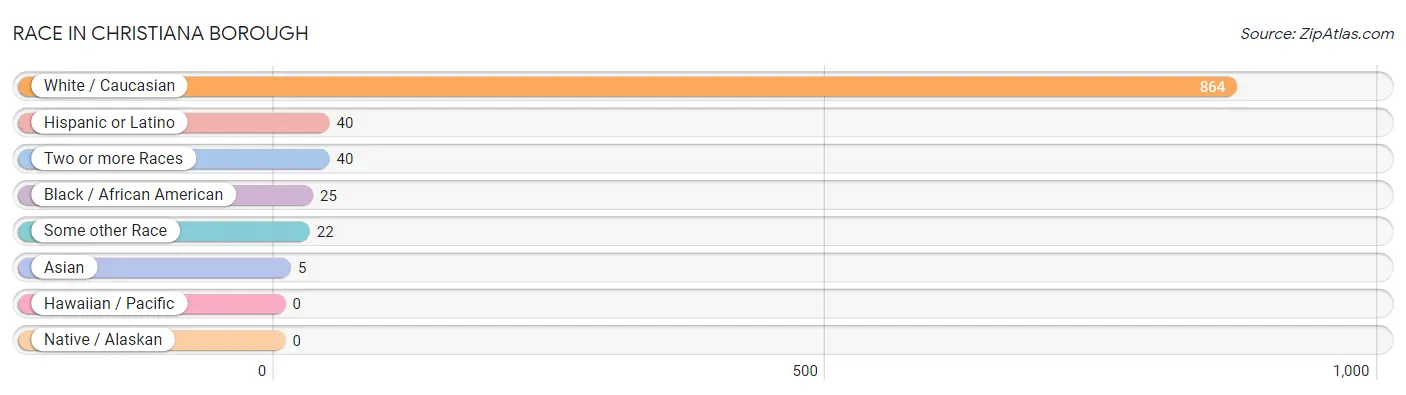
| Race | # Population | % Population |
| Asian | 5 | 0.5% |
| Black / African American | 25 | 2.6% |
| Hawaiian / Pacific | 0 | 0.0% |
| Hispanic or Latino | 40 | 4.2% |
| Native / Alaskan | 0 | 0.0% |
| White / Caucasian | 864 | 90.4% |
| Two or more Races | 40 | 4.2% |
| Some other Race | 22 | 2.3% |
| Total | 956 | 100.0% |
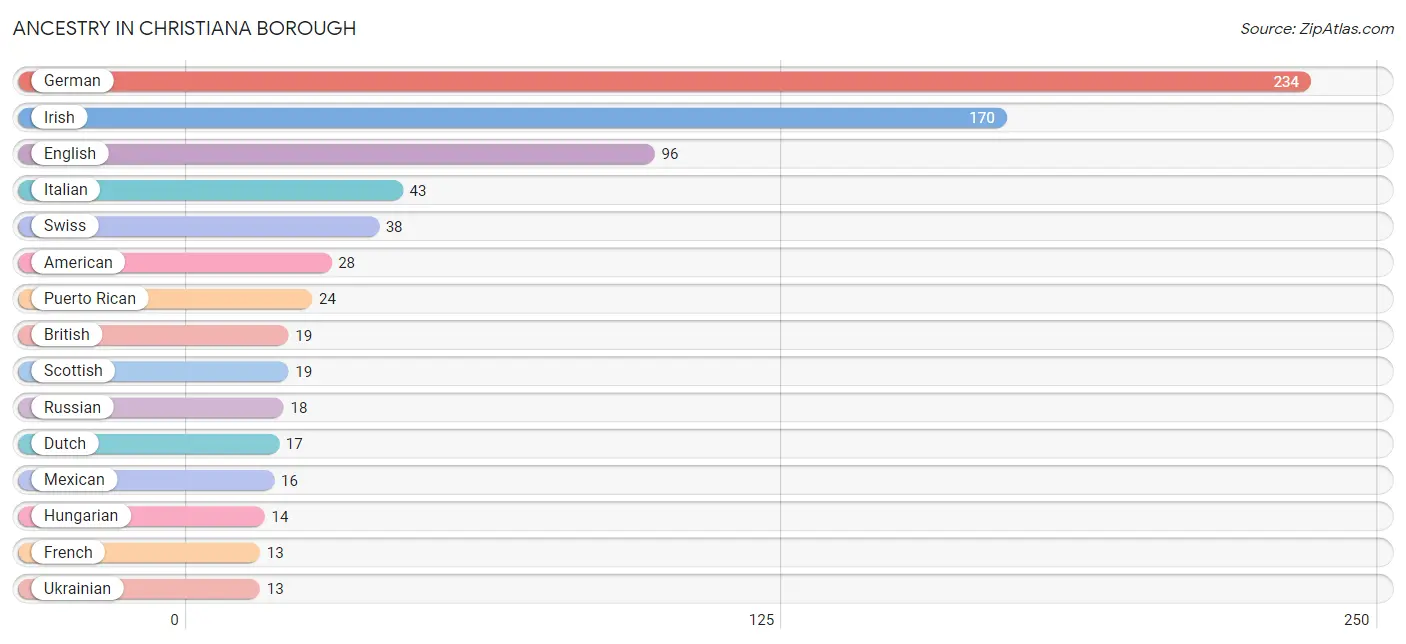
Ancestry in Christiana borough
The most populous ancestries reported in Christiana borough are German (234 | 24.5%), Irish (170 | 17.8%), English (96 | 10.0%), Italian (43 | 4.5%), and Swiss (38 | 4.0%), together accounting for 60.8% of all Christiana borough residents.
| Ancestry | # Population | % Population |
| African | 2 | 0.2% |
| American | 28 | 2.9% |
| Austrian | 3 | 0.3% |
| Bahamian | 2 | 0.2% |
| British | 19 | 2.0% |
| Danish | 2 | 0.2% |
| Dutch | 17 | 1.8% |
| English | 96 | 10.0% |
| Estonian | 3 | 0.3% |
| European | 7 | 0.7% |
| French | 13 | 1.4% |
| French Canadian | 6 | 0.6% |
| German | 234 | 24.5% |
| Hungarian | 14 | 1.5% |
| Indian (Asian) | 5 | 0.5% |
| Irish | 170 | 17.8% |
| Italian | 43 | 4.5% |
| Korean | 11 | 1.1% |
| Mexican | 16 | 1.7% |
| Pennsylvania German | 2 | 0.2% |
| Polish | 9 | 0.9% |
| Portuguese | 2 | 0.2% |
| Puerto Rican | 24 | 2.5% |
| Russian | 18 | 1.9% |
| Scandinavian | 2 | 0.2% |
| Scotch-Irish | 9 | 0.9% |
| Scottish | 19 | 2.0% |
| Subsaharan African | 2 | 0.2% |
| Swedish | 6 | 0.6% |
| Swiss | 38 | 4.0% |
| Ukrainian | 13 | 1.4% |
| Welsh | 7 | 0.7% | View All 32 Rows |
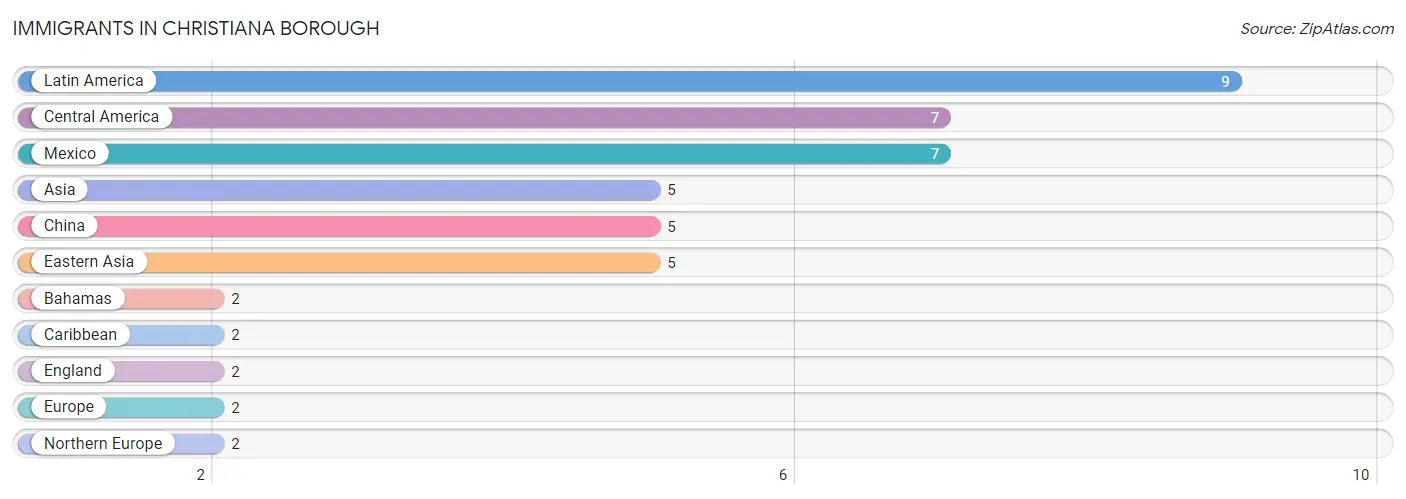
Immigrants in Christiana borough
The most numerous immigrant groups reported in Christiana borough came from Latin America (9 | 0.9%), Central America (7 | 0.7%), Mexico (7 | 0.7%), Asia (5 | 0.5%), and China (5 | 0.5%), together accounting for 3.4% of all Christiana borough residents.
| Immigration Origin | # Population | % Population |
| Asia | 5 | 0.5% |
| Bahamas | 2 | 0.2% |
| Caribbean | 2 | 0.2% |
| Central America | 7 | 0.7% |
| China | 5 | 0.5% |
| Eastern Asia | 5 | 0.5% |
| England | 2 | 0.2% |
| Europe | 2 | 0.2% |
| Latin America | 9 | 0.9% |
| Mexico | 7 | 0.7% |
| Northern Europe | 2 | 0.2% | View All 11 Rows |
Sex and Age in Christiana borough
Sex and Age in Christiana borough
The most populous age groups in Christiana borough are 30 to 34 Years (43 | 9.8%) for men and 85 Years and over (52 | 10.1%) for women.
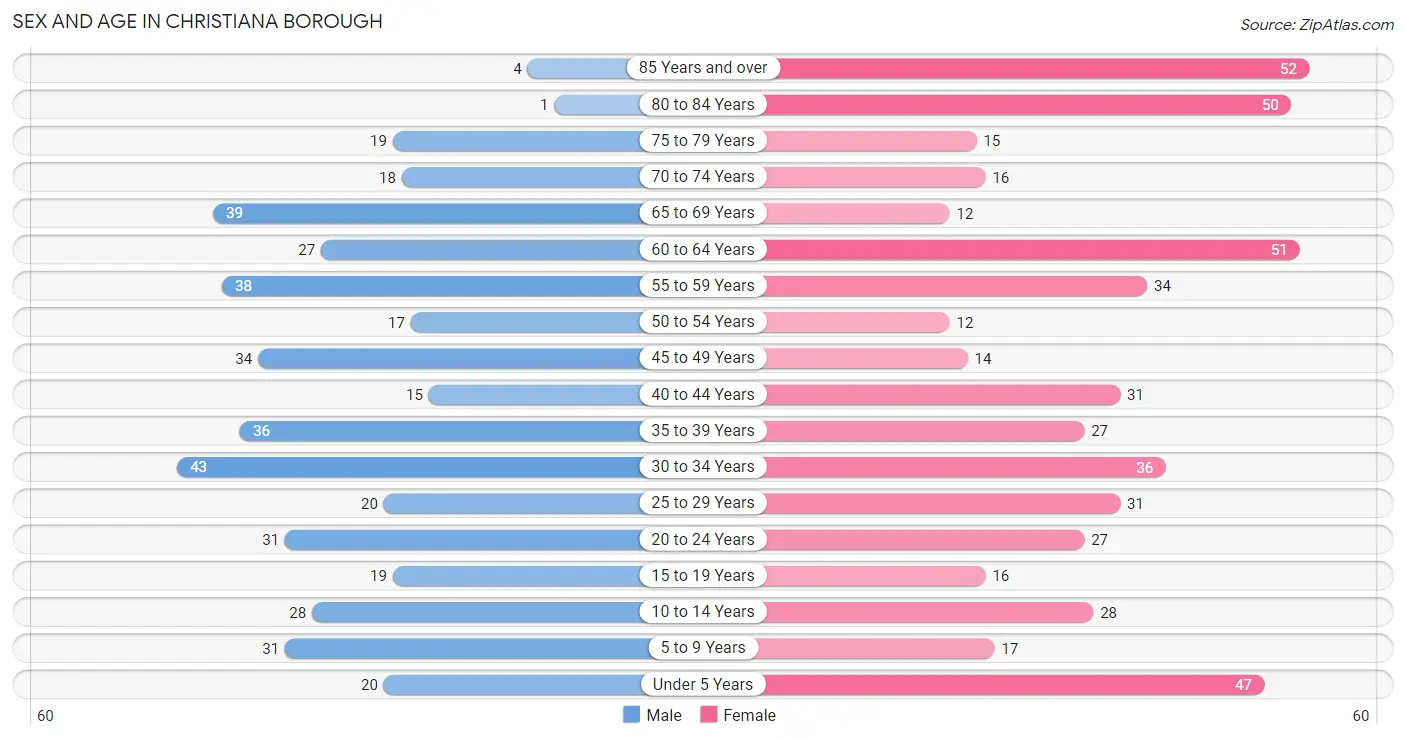
| Age Bracket | Male | Female |
| Under 5 Years | 20 (4.5%) | 47 (9.1%) |
| 5 to 9 Years | 31 (7.0%) | 17 (3.3%) |
| 10 to 14 Years | 28 (6.4%) | 28 (5.4%) |
| 15 to 19 Years | 19 (4.3%) | 16 (3.1%) |
| 20 to 24 Years | 31 (7.0%) | 27 (5.2%) |
| 25 to 29 Years | 20 (4.5%) | 31 (6.0%) |
| 30 to 34 Years | 43 (9.8%) | 36 (7.0%) |
| 35 to 39 Years | 36 (8.2%) | 27 (5.2%) |
| 40 to 44 Years | 15 (3.4%) | 31 (6.0%) |
| 45 to 49 Years | 34 (7.7%) | 14 (2.7%) |
| 50 to 54 Years | 17 (3.9%) | 12 (2.3%) |
| 55 to 59 Years | 38 (8.6%) | 34 (6.6%) |
| 60 to 64 Years | 27 (6.1%) | 51 (9.9%) |
| 65 to 69 Years | 39 (8.9%) | 12 (2.3%) |
| 70 to 74 Years | 18 (4.1%) | 16 (3.1%) |
| 75 to 79 Years | 19 (4.3%) | 15 (2.9%) |
| 80 to 84 Years | 1 (0.2%) | 50 (9.7%) |
| 85 Years and over | 4 (0.9%) | 52 (10.1%) |
| Total | 440 (100.0%) | 516 (100.0%) |
Families and Households in Christiana borough
Median Family Size in Christiana borough
The median family size in Christiana borough is 3.15 persons per family, with married-couple families (138 | 70.1%) accounting for the largest median family size of 3.3 persons per family. On the other hand, single male/father families (9 | 4.6%) represent the smallest median family size with 2.67 persons per family.
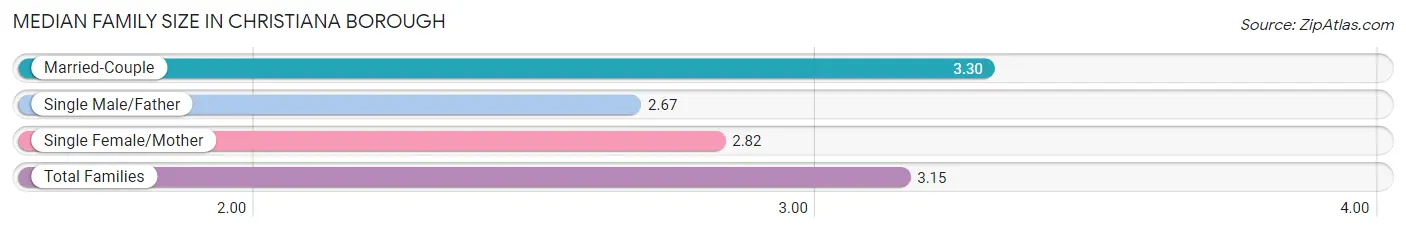
| Family Type | # Families | Family Size |
| Married-Couple | 138 (70.1%) | 3.30 |
| Single Male/Father | 9 (4.6%) | 2.67 |
| Single Female/Mother | 50 (25.4%) | 2.82 |
| Total Families | 197 (100.0%) | 3.15 |
Median Household Size in Christiana borough
The median household size in Christiana borough is 2.54 persons per household, with married-couple households (138 | 42.9%) accounting for the largest median household size of 3.3 persons per household. non-family households (125 | 38.8%) represent the smallest median household size with 1.52 persons per household.
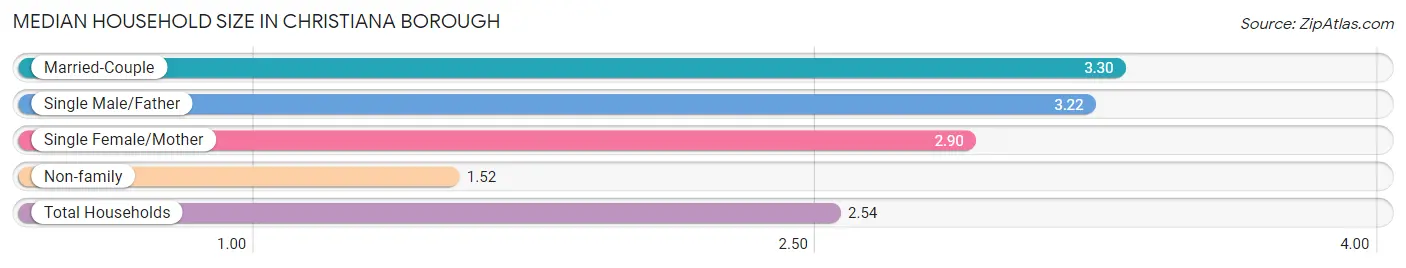
| Household Type | # Households | Household Size |
| Married-Couple | 138 (42.9%) | 3.30 |
| Single Male/Father | 9 (2.8%) | 3.22 |
| Single Female/Mother | 50 (15.5%) | 2.90 |
| Non-family | 125 (38.8%) | 1.52 |
| Total Households | 322 (100.0%) | 2.54 |
Household Size by Marriage Status in Christiana borough
Out of a total of 322 households in Christiana borough, 197 (61.2%) are family households, while 125 (38.8%) are nonfamily households. The most numerous type of family households are 2-person households, comprising 96, and the most common type of nonfamily households are 1-person households, comprising 74.
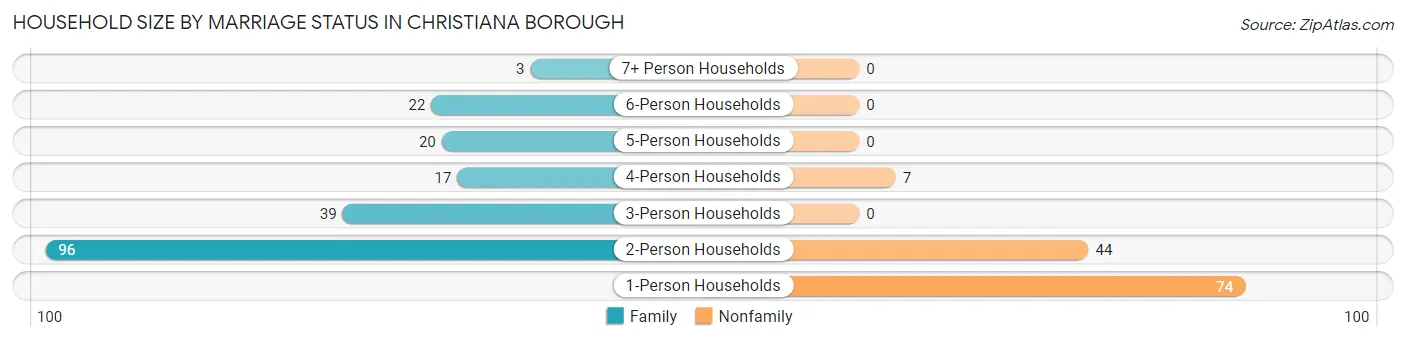
| Household Size | Family Households | Nonfamily Households |
| 1-Person Households | - | 74 (23.0%) |
| 2-Person Households | 96 (29.8%) | 44 (13.7%) |
| 3-Person Households | 39 (12.1%) | 0 (0.0%) |
| 4-Person Households | 17 (5.3%) | 7 (2.2%) |
| 5-Person Households | 20 (6.2%) | 0 (0.0%) |
| 6-Person Households | 22 (6.8%) | 0 (0.0%) |
| 7+ Person Households | 3 (0.9%) | 0 (0.0%) |
| Total | 197 (61.2%) | 125 (38.8%) |
Female Fertility in Christiana borough
Fertility by Age in Christiana borough
Average fertility rate in Christiana borough is 71.0 births per 1,000 women. Women in the age bracket of 20 to 34 years have the highest fertility rate with 138.0 births per 1,000 women. Women in the age bracket of 20 to 34 years acount for 100.0% of all women with births.
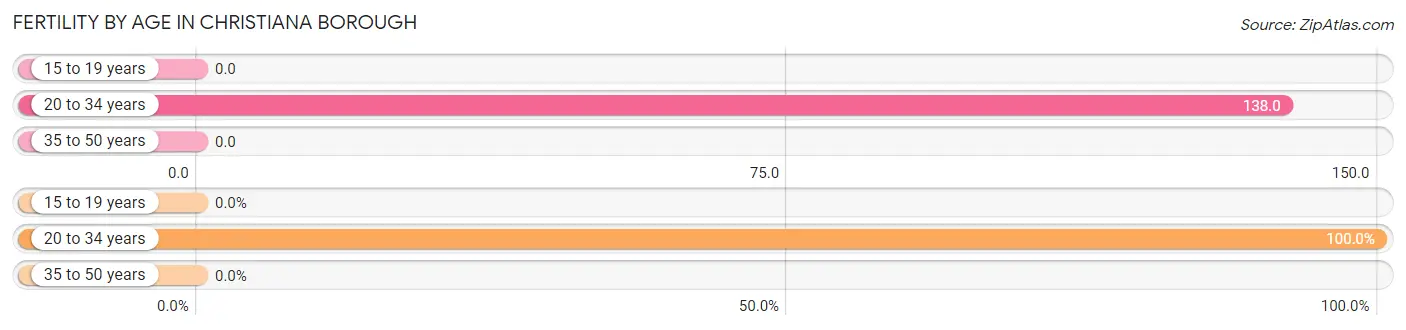
| Age Bracket | Women with Births | Births / 1,000 Women |
| 15 to 19 years | 0 (0.0%) | 0.0 |
| 20 to 34 years | 13 (100.0%) | 138.0 |
| 35 to 50 years | 0 (0.0%) | 0.0 |
| Total | 13 (100.0%) | 71.0 |
Fertility by Age by Marriage Status in Christiana borough
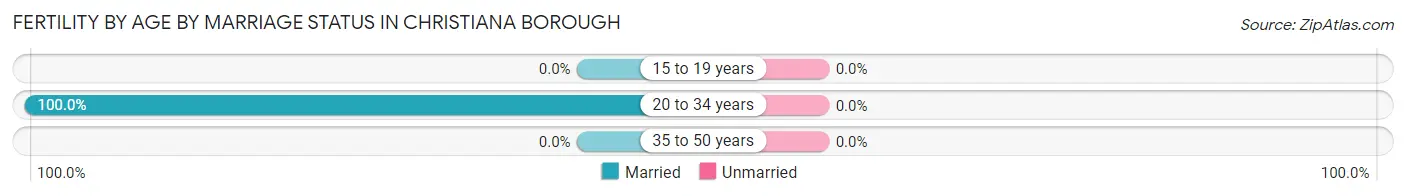
| Age Bracket | Married | Unmarried |
| 15 to 19 years | 0 (0.0%) | 0 (0.0%) |
| 20 to 34 years | 13 (100.0%) | 0 (0.0%) |
| 35 to 50 years | 0 (0.0%) | 0 (0.0%) |
| Total | 13 (100.0%) | 0 (0.0%) |
Fertility by Education in Christiana borough
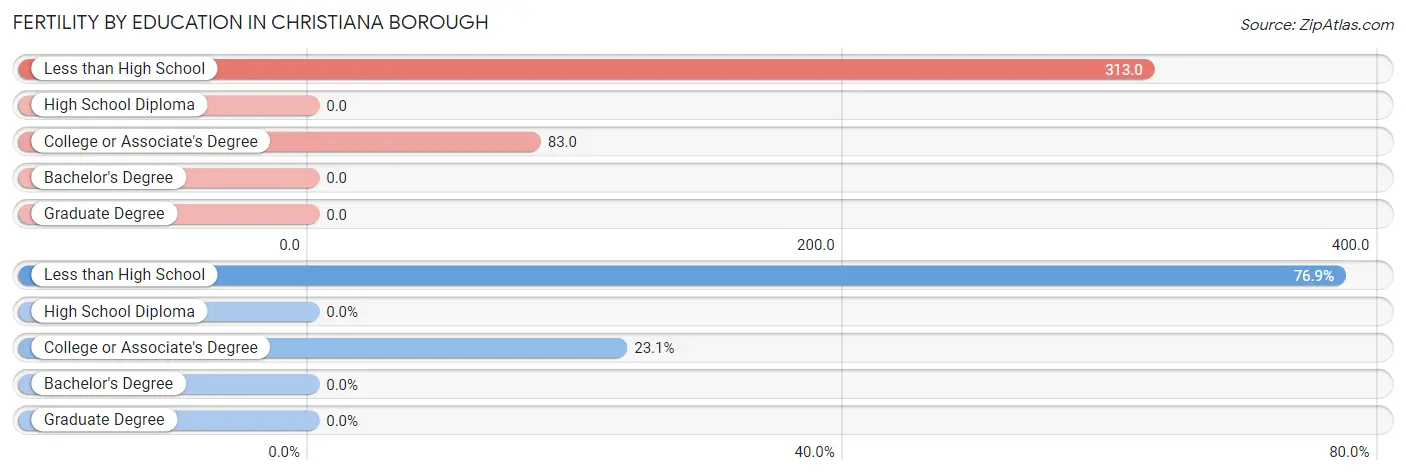
| Educational Attainment | Women with Births | Births / 1,000 Women |
| Less than High School | 10 (76.9%) | 313.0 |
| High School Diploma | 0 (0.0%) | 0.0 |
| College or Associate's Degree | 3 (23.1%) | 83.0 |
| Bachelor's Degree | 0 (0.0%) | 0.0 |
| Graduate Degree | 0 (0.0%) | 0.0 |
| Total | 13 (100.0%) | 71.0 |
Fertility by Education by Marriage Status in Christiana borough
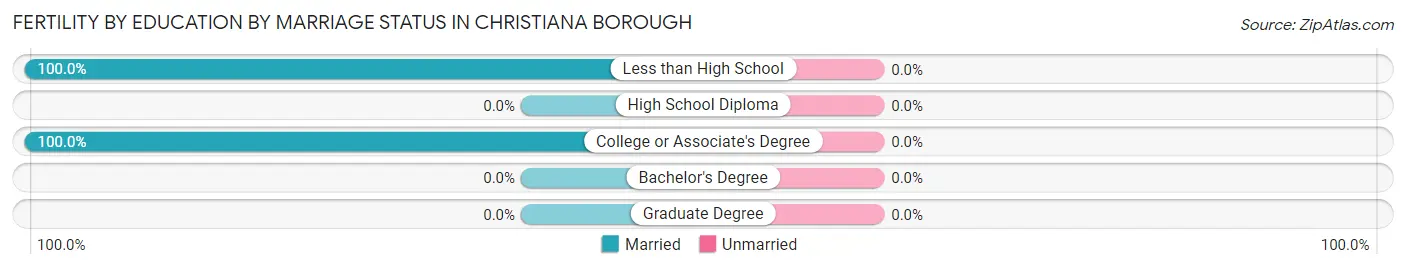
| Educational Attainment | Married | Unmarried |
| Less than High School | 10 (100.0%) | 0 (0.0%) |
| High School Diploma | 0 (0.0%) | 0 (0.0%) |
| College or Associate's Degree | 3 (100.0%) | 0 (0.0%) |
| Bachelor's Degree | 0 (0.0%) | 0 (0.0%) |
| Graduate Degree | 0 (0.0%) | 0 (0.0%) |
| Total | 13 (100.0%) | 0 (0.0%) |
Employment Characteristics in Christiana borough
Employment by Class of Employer in Christiana borough
Among the 417 employed individuals in Christiana borough, private company employees (329 | 78.9%), not-for-profit organizations (41 | 9.8%), and self-employed (incorporated) (11 | 2.6%) make up the most common classes of employment.
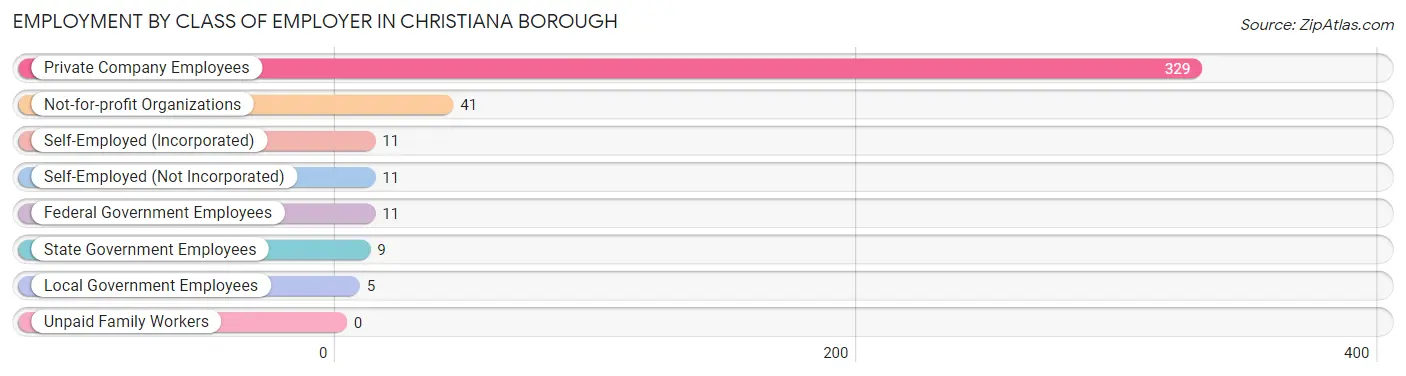
| Employer Class | # Employees | % Employees |
| Private Company Employees | 329 | 78.9% |
| Self-Employed (Incorporated) | 11 | 2.6% |
| Self-Employed (Not Incorporated) | 11 | 2.6% |
| Not-for-profit Organizations | 41 | 9.8% |
| Local Government Employees | 5 | 1.2% |
| State Government Employees | 9 | 2.2% |
| Federal Government Employees | 11 | 2.6% |
| Unpaid Family Workers | 0 | 0.0% |
| Total | 417 | 100.0% |
Employment Status by Age in Christiana borough
According to the labor force statistics for Christiana borough, out of the total population over 16 years of age (779), 55.3% or 431 individuals are in the labor force, with 1.9% or 8 of them unemployed. The age group with the highest labor force participation rate is 20 to 24 years, with 96.6% or 56 individuals in the labor force. Within the labor force, the 65 to 74 years age range has the highest percentage of unemployed individuals, with 11.8% or 2 of them being unemployed.
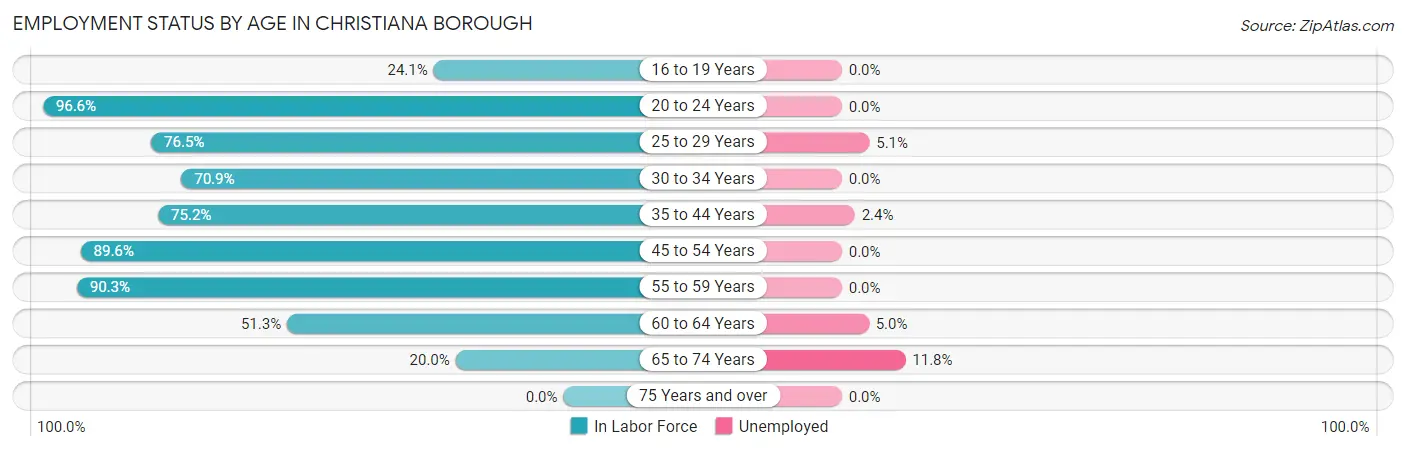
| Age Bracket | In Labor Force | Unemployed |
| 16 to 19 Years | 7 (24.1%) | 0 (0.0%) |
| 20 to 24 Years | 56 (96.6%) | 0 (0.0%) |
| 25 to 29 Years | 39 (76.5%) | 2 (5.1%) |
| 30 to 34 Years | 56 (70.9%) | 0 (0.0%) |
| 35 to 44 Years | 82 (75.2%) | 2 (2.4%) |
| 45 to 54 Years | 69 (89.6%) | 0 (0.0%) |
| 55 to 59 Years | 65 (90.3%) | 0 (0.0%) |
| 60 to 64 Years | 40 (51.3%) | 2 (5.0%) |
| 65 to 74 Years | 17 (20.0%) | 2 (11.8%) |
| 75 Years and over | 0 (0.0%) | 0 (0.0%) |
| Total | 431 (55.3%) | 8 (1.9%) |
Employment Status by Educational Attainment in Christiana borough
According to labor force statistics for Christiana borough, 75.3% of individuals (351) out of the total population between 25 and 64 years of age (466) are in the labor force, with 1.7% or 6 of them being unemployed. The group with the highest labor force participation rate are those with the educational attainment of college / associate degree, with 85.5% or 94 individuals in the labor force. Within the labor force, individuals with high school diploma education have the highest percentage of unemployment, with 4.7% or 6 of them being unemployed.
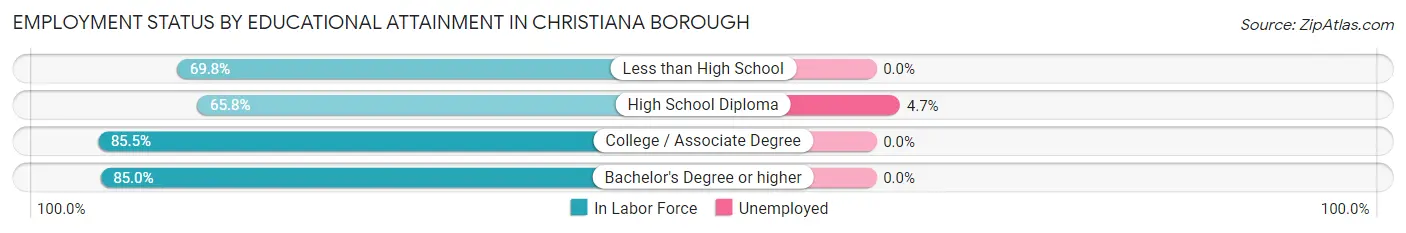
| Educational Attainment | In Labor Force | Unemployed |
| Less than High School | 37 (69.8%) | 0 (0.0%) |
| High School Diploma | 129 (65.8%) | 9 (4.7%) |
| College / Associate Degree | 94 (85.5%) | 0 (0.0%) |
| Bachelor's Degree or higher | 91 (85.0%) | 0 (0.0%) |
| Total | 351 (75.3%) | 8 (1.7%) |
Employment Occupations by Sex in Christiana borough
Management, Business, Science and Arts Occupations
The most common Management, Business, Science and Arts occupations in Christiana borough are Management (43 | 10.2%), Business & Financial (33 | 7.8%), Community & Social Service (33 | 7.8%), Education Instruction & Library (23 | 5.4%), and Health Diagnosing & Treating (23 | 5.4%).
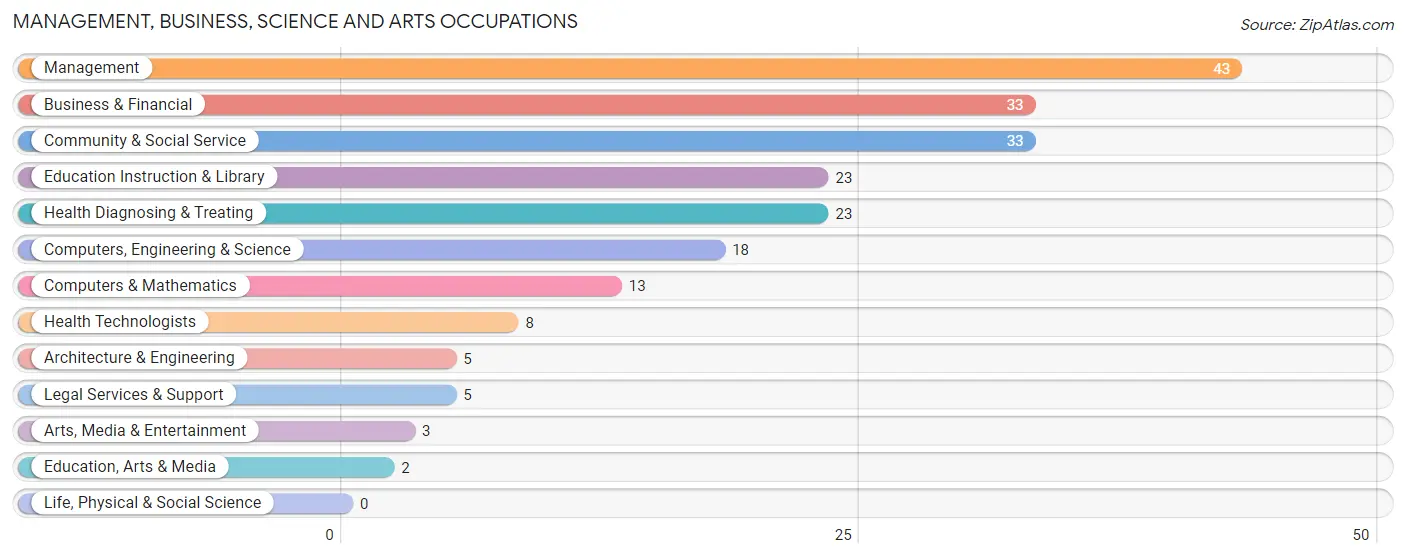
Management, Business, Science and Arts Occupations by Sex
Within the Management, Business, Science and Arts occupations in Christiana borough, the most male-oriented occupations are Computers, Engineering & Science (100.0%), Computers & Mathematics (100.0%), and Architecture & Engineering (100.0%), while the most female-oriented occupations are Education, Arts & Media (100.0%), Legal Services & Support (100.0%), and Health Diagnosing & Treating (100.0%).
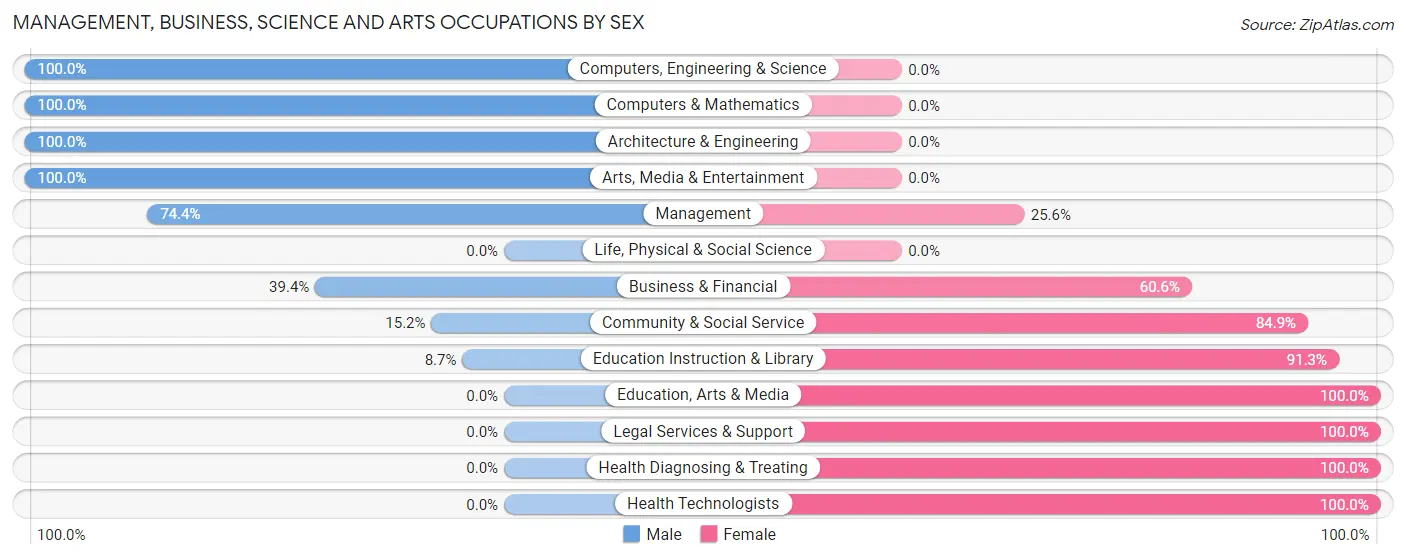
| Occupation | Male | Female |
| Management | 32 (74.4%) | 11 (25.6%) |
| Business & Financial | 13 (39.4%) | 20 (60.6%) |
| Computers, Engineering & Science | 18 (100.0%) | 0 (0.0%) |
| Computers & Mathematics | 13 (100.0%) | 0 (0.0%) |
| Architecture & Engineering | 5 (100.0%) | 0 (0.0%) |
| Life, Physical & Social Science | 0 (0.0%) | 0 (0.0%) |
| Community & Social Service | 5 (15.1%) | 28 (84.9%) |
| Education, Arts & Media | 0 (0.0%) | 2 (100.0%) |
| Legal Services & Support | 0 (0.0%) | 5 (100.0%) |
| Education Instruction & Library | 2 (8.7%) | 21 (91.3%) |
| Arts, Media & Entertainment | 3 (100.0%) | 0 (0.0%) |
| Health Diagnosing & Treating | 0 (0.0%) | 23 (100.0%) |
| Health Technologists | 0 (0.0%) | 8 (100.0%) |
| Total (Category) | 68 (45.3%) | 82 (54.7%) |
| Total (Overall) | 242 (57.2%) | 181 (42.8%) |
Services Occupations
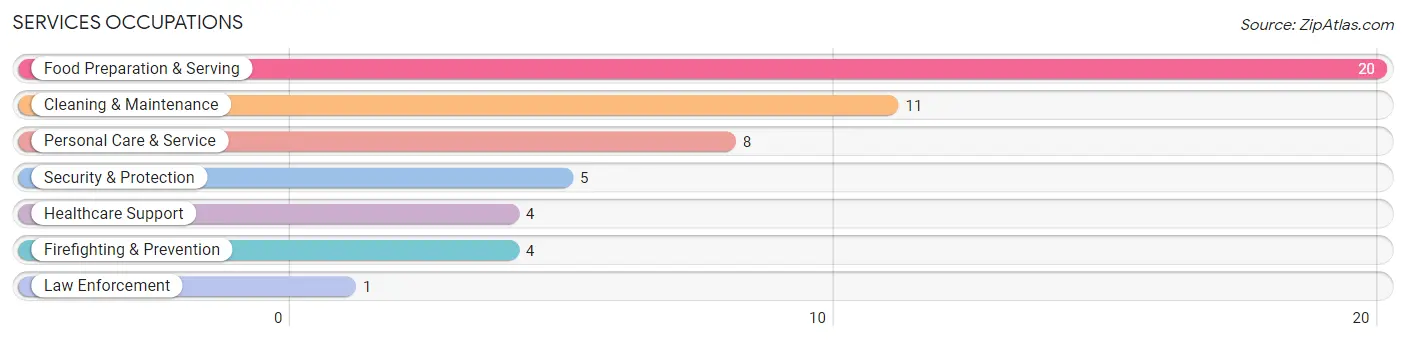
The most common Services occupations in Christiana borough are Food Preparation & Serving (20 | 4.7%), Cleaning & Maintenance (11 | 2.6%), Personal Care & Service (8 | 1.9%), Security & Protection (5 | 1.2%), and Healthcare Support (4 | 0.9%).
Services Occupations by Sex
Within the Services occupations in Christiana borough, the most male-oriented occupations are Law Enforcement (100.0%), Security & Protection (60.0%), and Firefighting & Prevention (50.0%), while the most female-oriented occupations are Healthcare Support (100.0%), Food Preparation & Serving (70.0%), and Cleaning & Maintenance (54.5%).
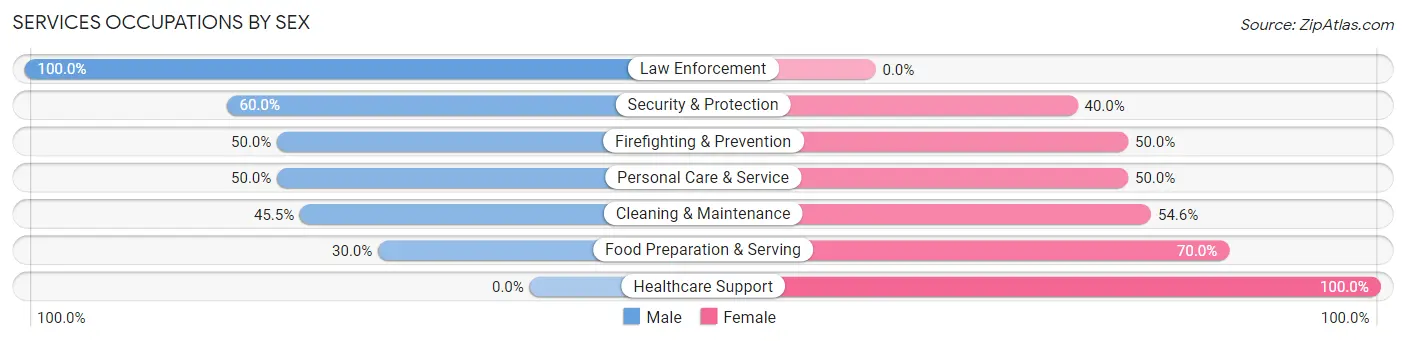
| Occupation | Male | Female |
| Healthcare Support | 0 (0.0%) | 4 (100.0%) |
| Security & Protection | 3 (60.0%) | 2 (40.0%) |
| Firefighting & Prevention | 2 (50.0%) | 2 (50.0%) |
| Law Enforcement | 1 (100.0%) | 0 (0.0%) |
| Food Preparation & Serving | 6 (30.0%) | 14 (70.0%) |
| Cleaning & Maintenance | 5 (45.5%) | 6 (54.5%) |
| Personal Care & Service | 4 (50.0%) | 4 (50.0%) |
| Total (Category) | 18 (37.5%) | 30 (62.5%) |
| Total (Overall) | 242 (57.2%) | 181 (42.8%) |
Sales and Office Occupations
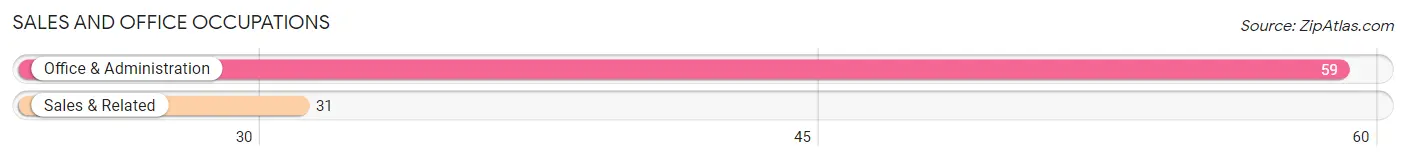
The most common Sales and Office occupations in Christiana borough are Office & Administration (59 | 14.0%), and Sales & Related (31 | 7.3%).
Sales and Office Occupations by Sex
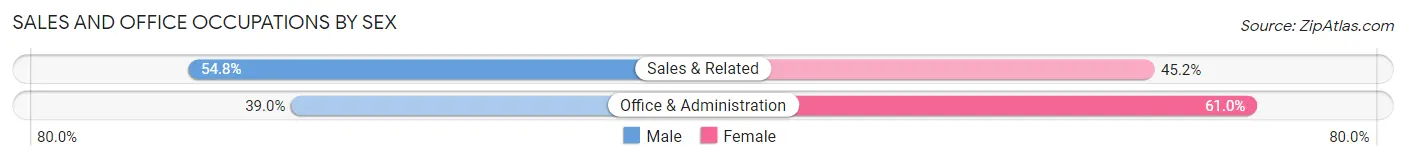
| Occupation | Male | Female |
| Sales & Related | 17 (54.8%) | 14 (45.2%) |
| Office & Administration | 23 (39.0%) | 36 (61.0%) |
| Total (Category) | 40 (44.4%) | 50 (55.6%) |
| Total (Overall) | 242 (57.2%) | 181 (42.8%) |
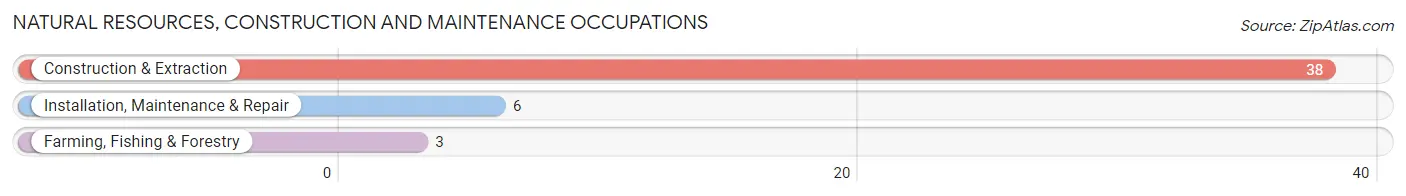
Natural Resources, Construction and Maintenance Occupations
The most common Natural Resources, Construction and Maintenance occupations in Christiana borough are Construction & Extraction (38 | 9.0%), Installation, Maintenance & Repair (6 | 1.4%), and Farming, Fishing & Forestry (3 | 0.7%).
Natural Resources, Construction and Maintenance Occupations by Sex
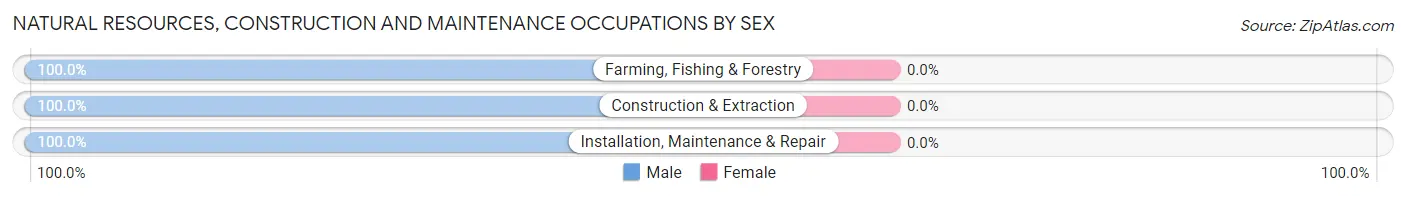
| Occupation | Male | Female |
| Farming, Fishing & Forestry | 3 (100.0%) | 0 (0.0%) |
| Construction & Extraction | 38 (100.0%) | 0 (0.0%) |
| Installation, Maintenance & Repair | 6 (100.0%) | 0 (0.0%) |
| Total (Category) | 47 (100.0%) | 0 (0.0%) |
| Total (Overall) | 242 (57.2%) | 181 (42.8%) |
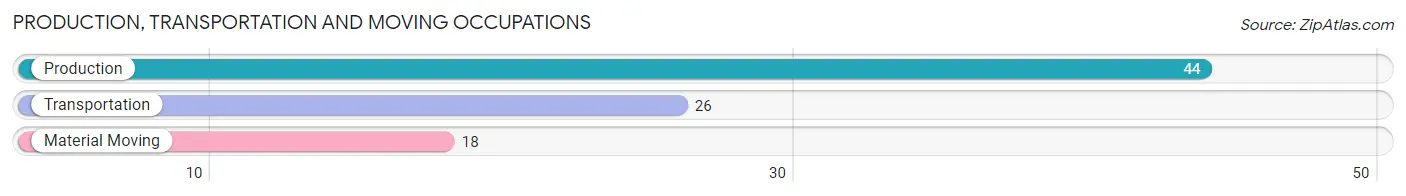
Production, Transportation and Moving Occupations
The most common Production, Transportation and Moving occupations in Christiana borough are Production (44 | 10.4%), Transportation (26 | 6.1%), and Material Moving (18 | 4.3%).
Production, Transportation and Moving Occupations by Sex
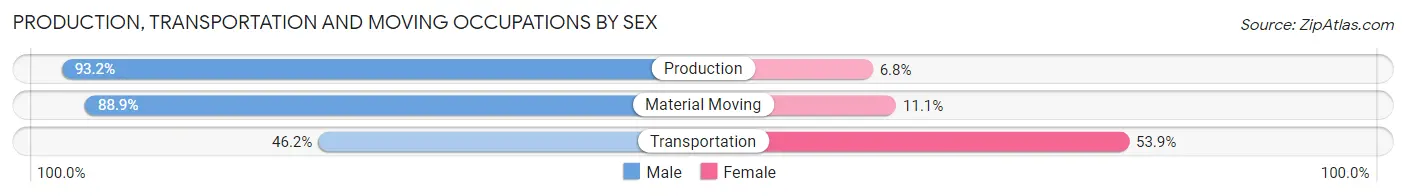
| Occupation | Male | Female |
| Production | 41 (93.2%) | 3 (6.8%) |
| Transportation | 12 (46.2%) | 14 (53.8%) |
| Material Moving | 16 (88.9%) | 2 (11.1%) |
| Total (Category) | 69 (78.4%) | 19 (21.6%) |
| Total (Overall) | 242 (57.2%) | 181 (42.8%) |
Employment Industries by Sex in Christiana borough
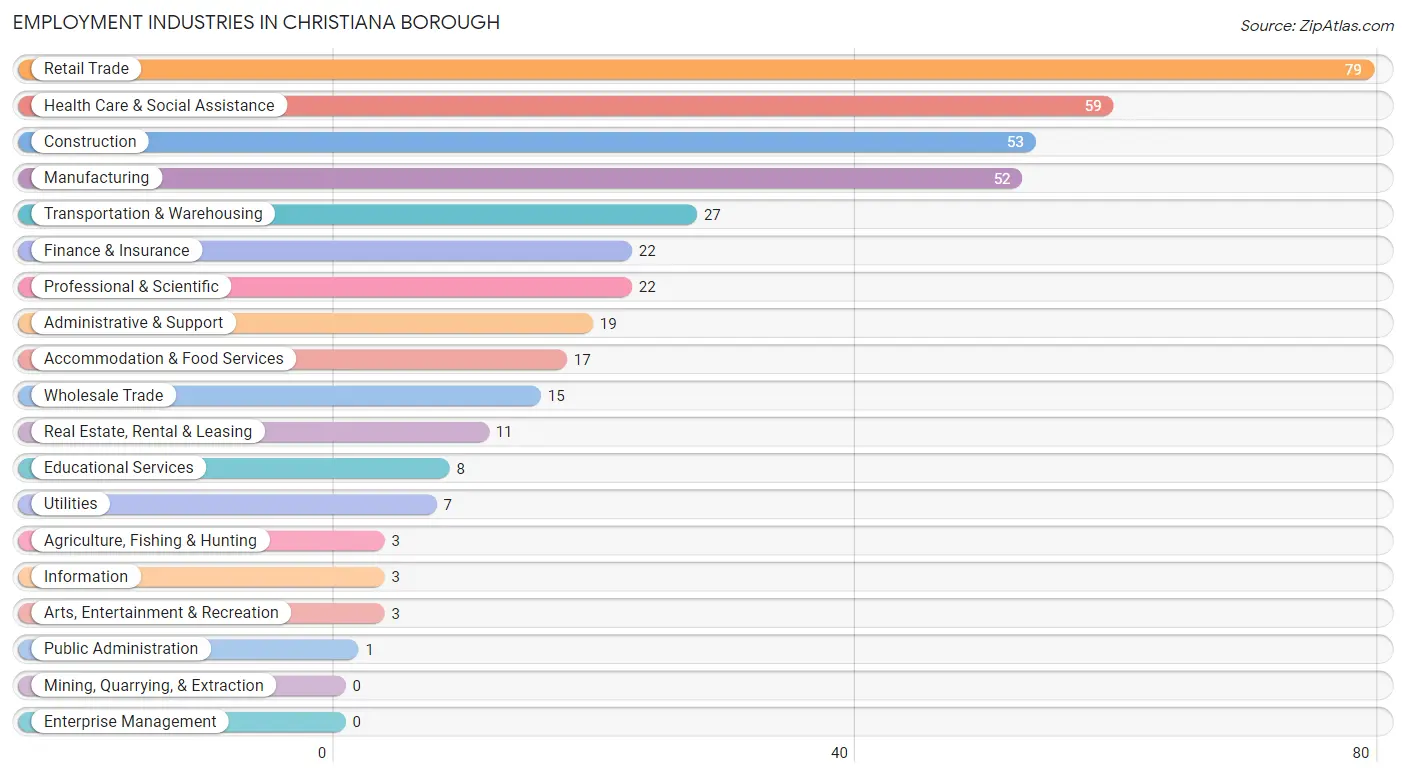
Employment Industries in Christiana borough
The major employment industries in Christiana borough include Retail Trade (79 | 18.7%), Health Care & Social Assistance (59 | 14.0%), Construction (53 | 12.5%), Manufacturing (52 | 12.3%), and Transportation & Warehousing (27 | 6.4%).
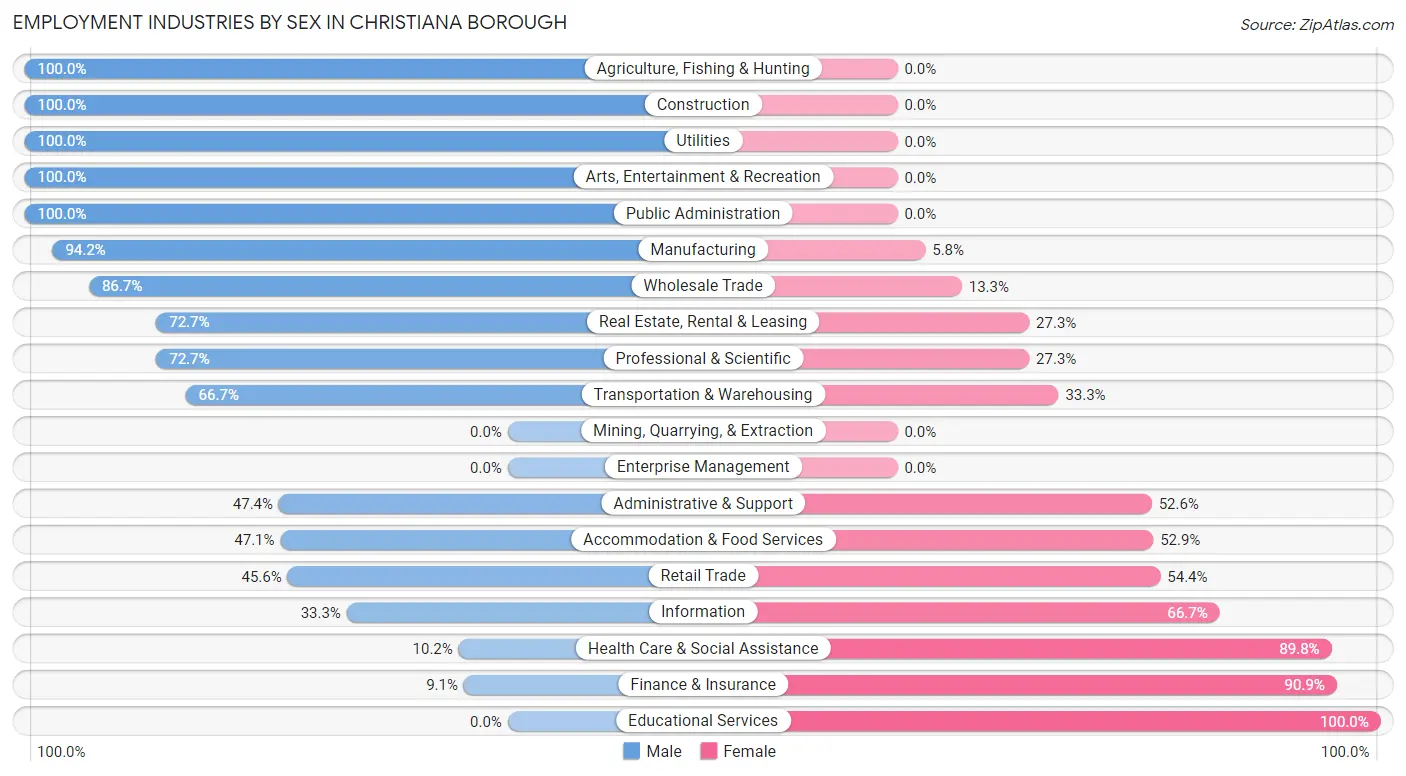
Employment Industries by Sex in Christiana borough
The Christiana borough industries that see more men than women are Agriculture, Fishing & Hunting (100.0%), Construction (100.0%), and Utilities (100.0%), whereas the industries that tend to have a higher number of women are Educational Services (100.0%), Finance & Insurance (90.9%), and Health Care & Social Assistance (89.8%).
| Industry | Male | Female |
| Agriculture, Fishing & Hunting | 3 (100.0%) | 0 (0.0%) |
| Mining, Quarrying, & Extraction | 0 (0.0%) | 0 (0.0%) |
| Construction | 53 (100.0%) | 0 (0.0%) |
| Manufacturing | 49 (94.2%) | 3 (5.8%) |
| Wholesale Trade | 13 (86.7%) | 2 (13.3%) |
| Retail Trade | 36 (45.6%) | 43 (54.4%) |
| Transportation & Warehousing | 18 (66.7%) | 9 (33.3%) |
| Utilities | 7 (100.0%) | 0 (0.0%) |
| Information | 1 (33.3%) | 2 (66.7%) |
| Finance & Insurance | 2 (9.1%) | 20 (90.9%) |
| Real Estate, Rental & Leasing | 8 (72.7%) | 3 (27.3%) |
| Professional & Scientific | 16 (72.7%) | 6 (27.3%) |
| Enterprise Management | 0 (0.0%) | 0 (0.0%) |
| Administrative & Support | 9 (47.4%) | 10 (52.6%) |
| Educational Services | 0 (0.0%) | 8 (100.0%) |
| Health Care & Social Assistance | 6 (10.2%) | 53 (89.8%) |
| Arts, Entertainment & Recreation | 3 (100.0%) | 0 (0.0%) |
| Accommodation & Food Services | 8 (47.1%) | 9 (52.9%) |
| Public Administration | 1 (100.0%) | 0 (0.0%) |
| Total | 242 (57.2%) | 181 (42.8%) |
Education in Christiana borough
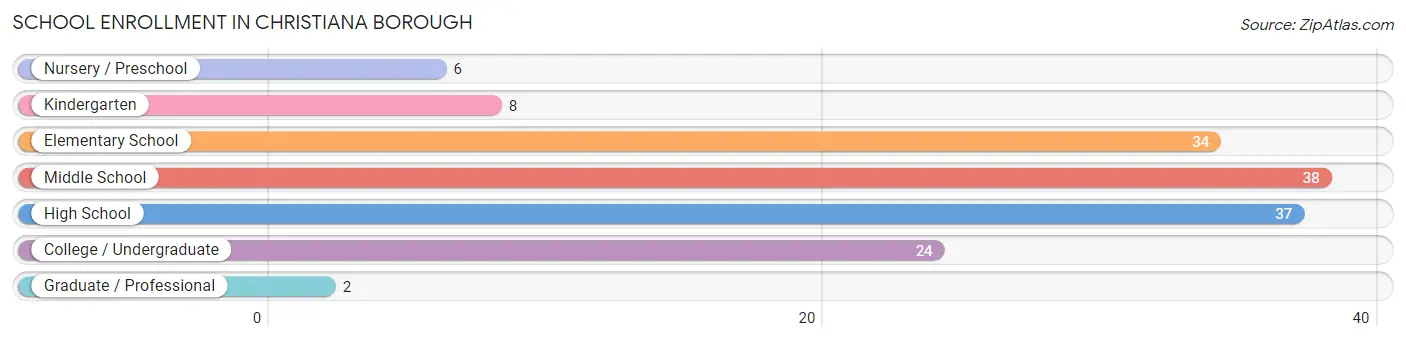
School Enrollment in Christiana borough
The most common levels of schooling among the 149 students in Christiana borough are middle school (38 | 25.5%), high school (37 | 24.8%), and elementary school (34 | 22.8%).
| School Level | # Students | % Students |
| Nursery / Preschool | 6 | 4.0% |
| Kindergarten | 8 | 5.4% |
| Elementary School | 34 | 22.8% |
| Middle School | 38 | 25.5% |
| High School | 37 | 24.8% |
| College / Undergraduate | 24 | 16.1% |
| Graduate / Professional | 2 | 1.3% |
| Total | 149 | 100.0% |
School Enrollment by Age by Funding Source in Christiana borough
Out of a total of 149 students who are enrolled in schools in Christiana borough, 54 (36.2%) attend a private institution, while the remaining 95 (63.8%) are enrolled in public schools. The age group of 3 to 4 year olds has the highest likelihood of being enrolled in private schools, with 6 (100.0% in the age bracket) enrolled. Conversely, the age group of 10 to 14 year olds has the lowest likelihood of being enrolled in a private school, with 49 (87.5% in the age bracket) attending a public institution.
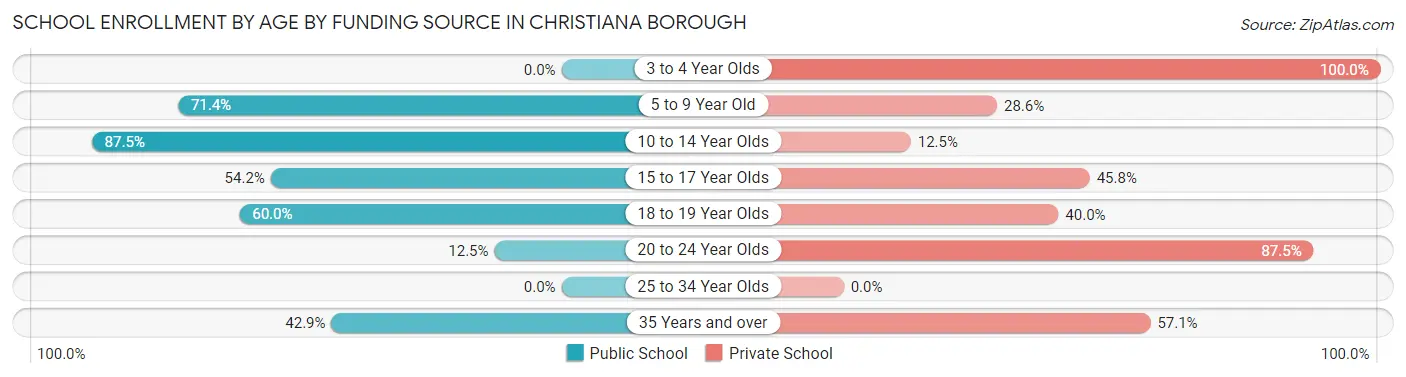
| Age Bracket | Public School | Private School |
| 3 to 4 Year Olds | 0 (0.0%) | 6 (100.0%) |
| 5 to 9 Year Old | 25 (71.4%) | 10 (28.6%) |
| 10 to 14 Year Olds | 49 (87.5%) | 7 (12.5%) |
| 15 to 17 Year Olds | 13 (54.2%) | 11 (45.8%) |
| 18 to 19 Year Olds | 3 (60.0%) | 2 (40.0%) |
| 20 to 24 Year Olds | 2 (12.5%) | 14 (87.5%) |
| 25 to 34 Year Olds | 0 (0.0%) | 0 (0.0%) |
| 35 Years and over | 3 (42.9%) | 4 (57.1%) |
| Total | 95 (63.8%) | 54 (36.2%) |
Educational Attainment by Field of Study in Christiana borough
Education (59 | 29.3%), science & technology (47 | 23.4%), business (23 | 11.4%), engineering (18 | 9.0%), and liberal arts & history (18 | 9.0%) are the most common fields of study among 201 individuals in Christiana borough who have obtained a bachelor's degree or higher.
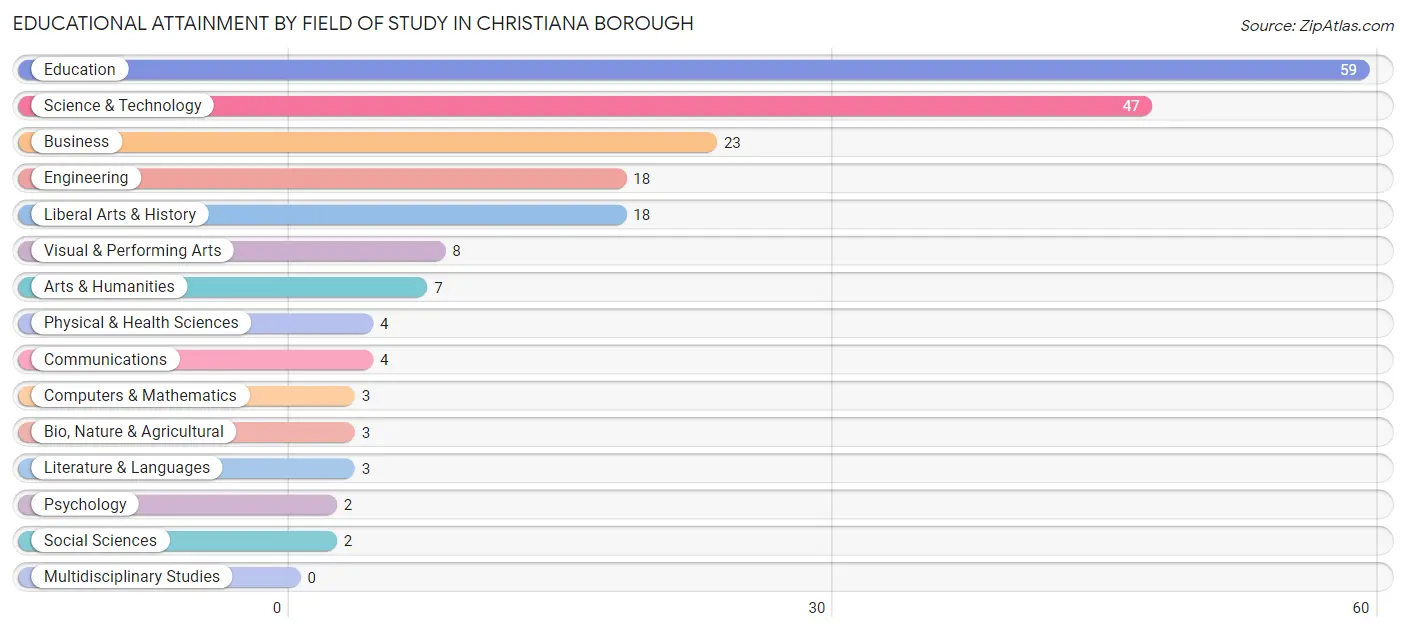
| Field of Study | # Graduates | % Graduates |
| Computers & Mathematics | 3 | 1.5% |
| Bio, Nature & Agricultural | 3 | 1.5% |
| Physical & Health Sciences | 4 | 2.0% |
| Psychology | 2 | 1.0% |
| Social Sciences | 2 | 1.0% |
| Engineering | 18 | 9.0% |
| Multidisciplinary Studies | 0 | 0.0% |
| Science & Technology | 47 | 23.4% |
| Business | 23 | 11.4% |
| Education | 59 | 29.3% |
| Literature & Languages | 3 | 1.5% |
| Liberal Arts & History | 18 | 9.0% |
| Visual & Performing Arts | 8 | 4.0% |
| Communications | 4 | 2.0% |
| Arts & Humanities | 7 | 3.5% |
| Total | 201 | 100.0% |
Transportation & Commute in Christiana borough
Vehicle Availability by Sex in Christiana borough
The most prevalent vehicle ownership categories in Christiana borough are males with 2 vehicles (113, accounting for 47.3%) and females with 2 vehicles (114, making up 64.6%).
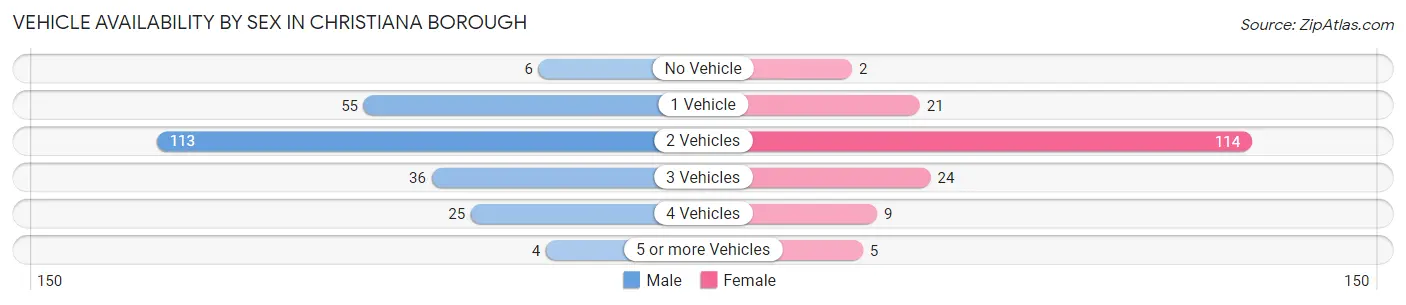
| Vehicles Available | Male | Female |
| No Vehicle | 6 (2.5%) | 2 (1.1%) |
| 1 Vehicle | 55 (23.0%) | 21 (12.0%) |
| 2 Vehicles | 113 (47.3%) | 114 (65.1%) |
| 3 Vehicles | 36 (15.1%) | 24 (13.7%) |
| 4 Vehicles | 25 (10.5%) | 9 (5.1%) |
| 5 or more Vehicles | 4 (1.7%) | 5 (2.9%) |
| Total | 239 (100.0%) | 175 (100.0%) |
Commute Time in Christiana borough
The most frequently occuring commute durations in Christiana borough are 10 to 14 minutes (75 commuters, 19.0%), 20 to 24 minutes (46 commuters, 11.7%), and 30 to 34 minutes (43 commuters, 10.9%).
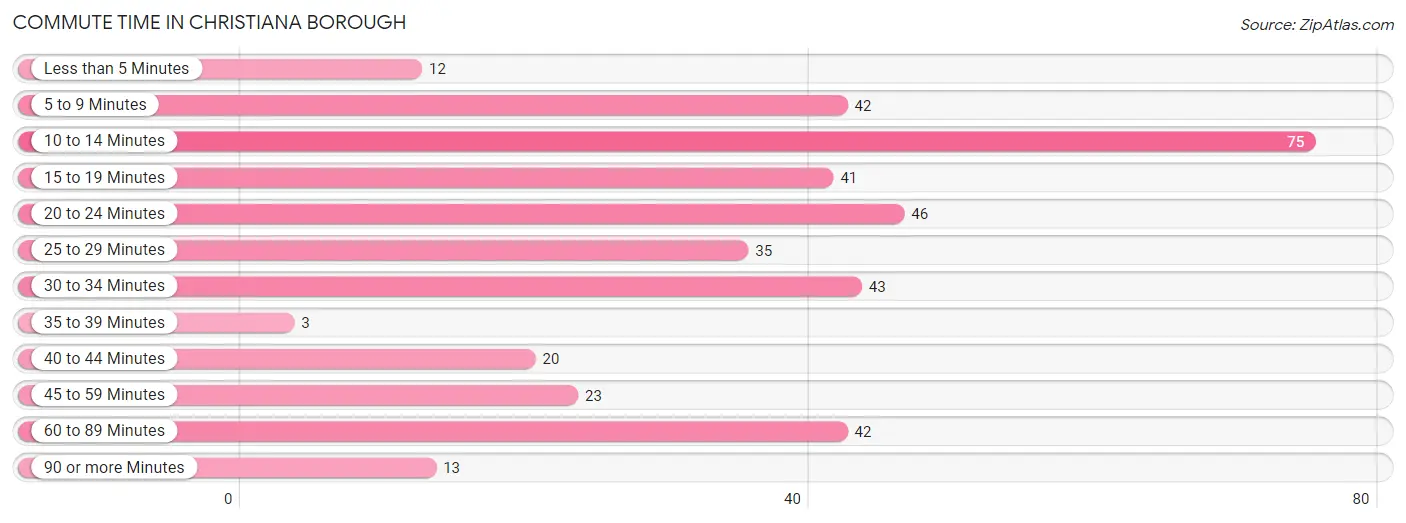
| Commute Time | # Commuters | % Commuters |
| Less than 5 Minutes | 12 | 3.0% |
| 5 to 9 Minutes | 42 | 10.6% |
| 10 to 14 Minutes | 75 | 19.0% |
| 15 to 19 Minutes | 41 | 10.4% |
| 20 to 24 Minutes | 46 | 11.7% |
| 25 to 29 Minutes | 35 | 8.9% |
| 30 to 34 Minutes | 43 | 10.9% |
| 35 to 39 Minutes | 3 | 0.8% |
| 40 to 44 Minutes | 20 | 5.1% |
| 45 to 59 Minutes | 23 | 5.8% |
| 60 to 89 Minutes | 42 | 10.6% |
| 90 or more Minutes | 13 | 3.3% |
Commute Time by Sex in Christiana borough
The most common commute times in Christiana borough are 5 to 9 minutes (32 commuters, 14.2%) for males and 10 to 14 minutes (50 commuters, 29.6%) for females.
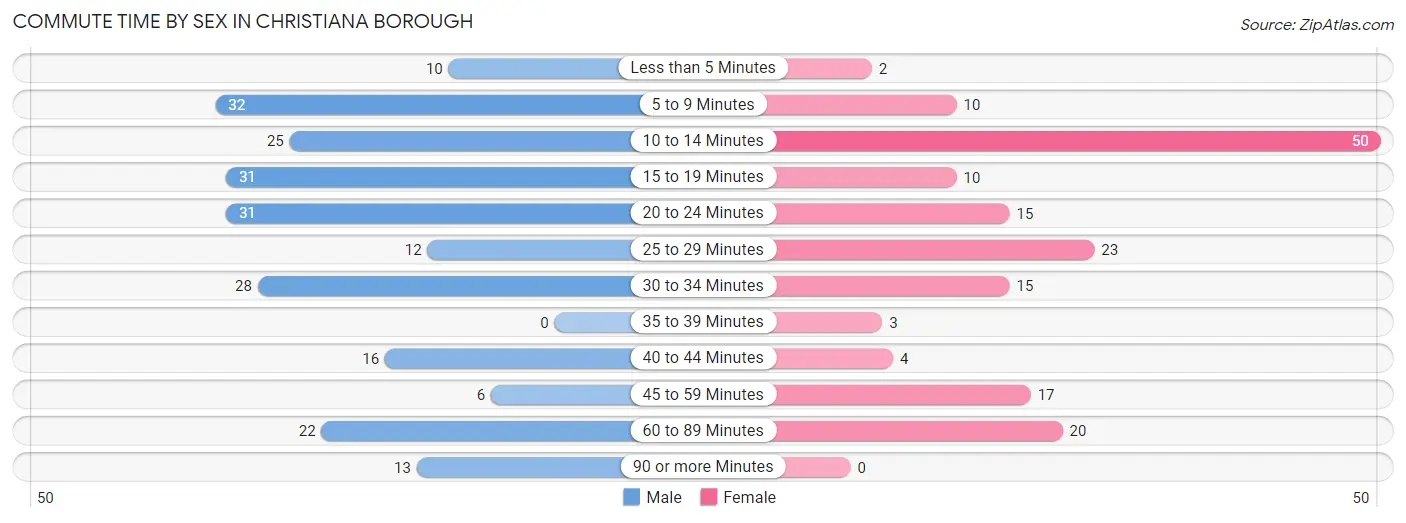
| Commute Time | Male | Female |
| Less than 5 Minutes | 10 (4.4%) | 2 (1.2%) |
| 5 to 9 Minutes | 32 (14.2%) | 10 (5.9%) |
| 10 to 14 Minutes | 25 (11.1%) | 50 (29.6%) |
| 15 to 19 Minutes | 31 (13.7%) | 10 (5.9%) |
| 20 to 24 Minutes | 31 (13.7%) | 15 (8.9%) |
| 25 to 29 Minutes | 12 (5.3%) | 23 (13.6%) |
| 30 to 34 Minutes | 28 (12.4%) | 15 (8.9%) |
| 35 to 39 Minutes | 0 (0.0%) | 3 (1.8%) |
| 40 to 44 Minutes | 16 (7.1%) | 4 (2.4%) |
| 45 to 59 Minutes | 6 (2.6%) | 17 (10.1%) |
| 60 to 89 Minutes | 22 (9.7%) | 20 (11.8%) |
| 90 or more Minutes | 13 (5.8%) | 0 (0.0%) |
Time of Departure to Work by Sex in Christiana borough
The most frequent times of departure to work in Christiana borough are 12:00 AM to 4:59 AM (48, 21.2%) for males and 6:00 AM to 6:29 AM (37, 21.9%) for females.
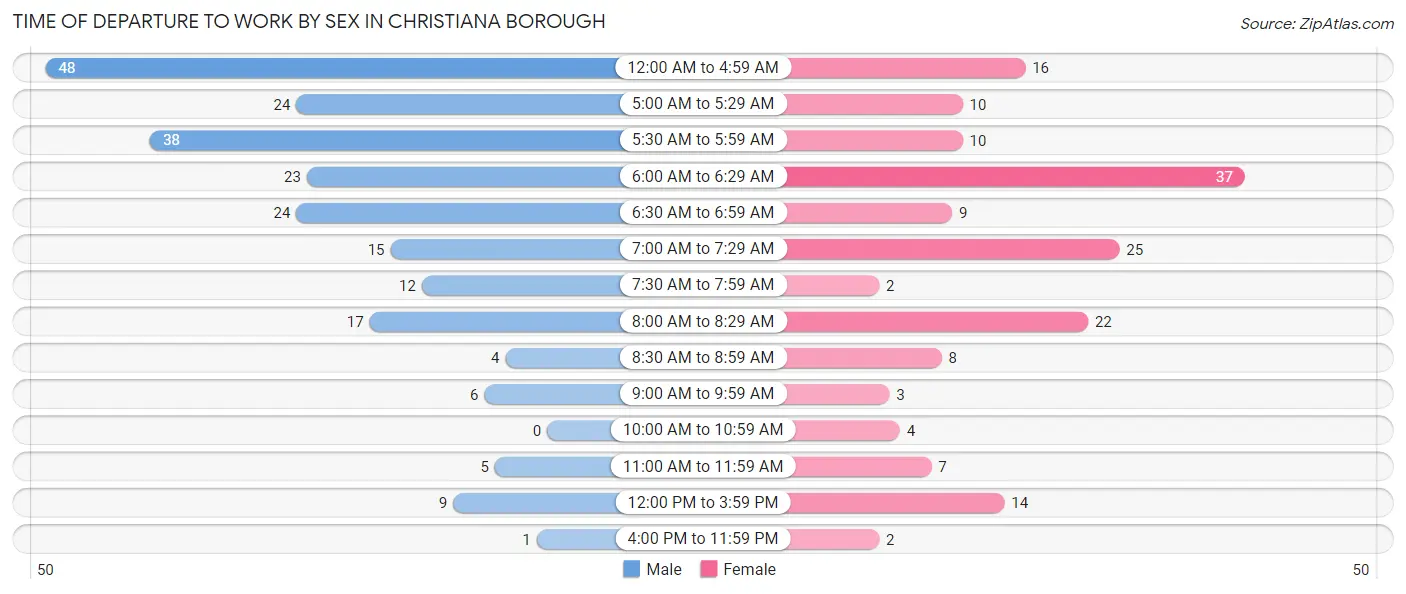
| Time of Departure | Male | Female |
| 12:00 AM to 4:59 AM | 48 (21.2%) | 16 (9.5%) |
| 5:00 AM to 5:29 AM | 24 (10.6%) | 10 (5.9%) |
| 5:30 AM to 5:59 AM | 38 (16.8%) | 10 (5.9%) |
| 6:00 AM to 6:29 AM | 23 (10.2%) | 37 (21.9%) |
| 6:30 AM to 6:59 AM | 24 (10.6%) | 9 (5.3%) |
| 7:00 AM to 7:29 AM | 15 (6.6%) | 25 (14.8%) |
| 7:30 AM to 7:59 AM | 12 (5.3%) | 2 (1.2%) |
| 8:00 AM to 8:29 AM | 17 (7.5%) | 22 (13.0%) |
| 8:30 AM to 8:59 AM | 4 (1.8%) | 8 (4.7%) |
| 9:00 AM to 9:59 AM | 6 (2.6%) | 3 (1.8%) |
| 10:00 AM to 10:59 AM | 0 (0.0%) | 4 (2.4%) |
| 11:00 AM to 11:59 AM | 5 (2.2%) | 7 (4.1%) |
| 12:00 PM to 3:59 PM | 9 (4.0%) | 14 (8.3%) |
| 4:00 PM to 11:59 PM | 1 (0.4%) | 2 (1.2%) |
| Total | 226 (100.0%) | 169 (100.0%) |
Housing Occupancy in Christiana borough
Occupancy by Ownership in Christiana borough
Of the total 322 dwellings in Christiana borough, owner-occupied units account for 202 (62.7%), while renter-occupied units make up 120 (37.3%).
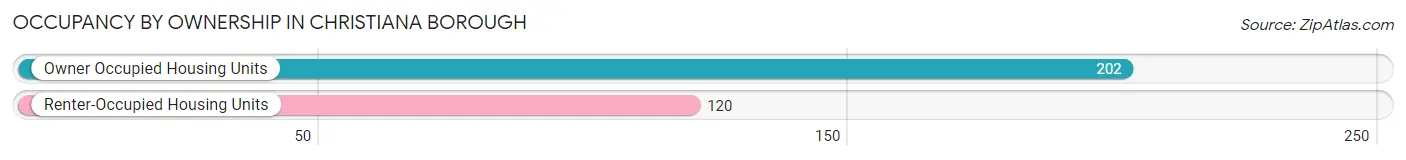
| Occupancy | # Housing Units | % Housing Units |
| Owner Occupied Housing Units | 202 | 62.7% |
| Renter-Occupied Housing Units | 120 | 37.3% |
| Total Occupied Housing Units | 322 | 100.0% |
Occupancy by Household Size in Christiana borough
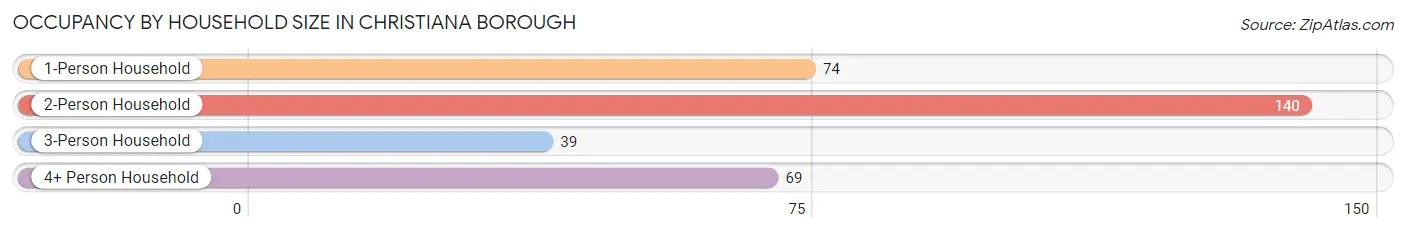
| Household Size | # Housing Units | % Housing Units |
| 1-Person Household | 74 | 23.0% |
| 2-Person Household | 140 | 43.5% |
| 3-Person Household | 39 | 12.1% |
| 4+ Person Household | 69 | 21.4% |
| Total Housing Units | 322 | 100.0% |
Occupancy by Ownership by Household Size in Christiana borough
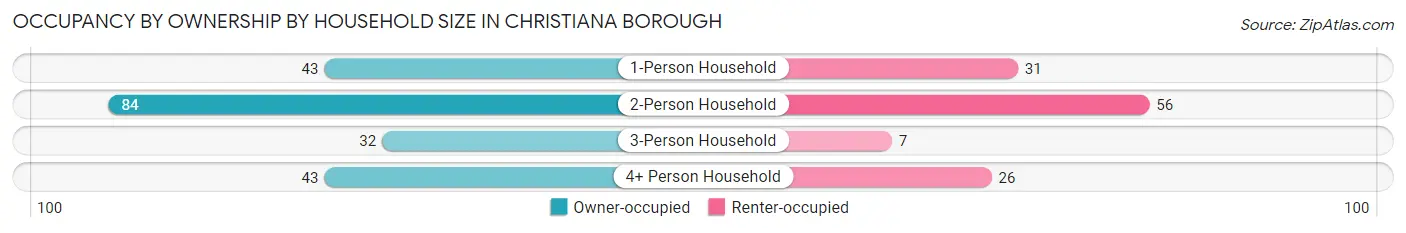
| Household Size | Owner-occupied | Renter-occupied |
| 1-Person Household | 43 (58.1%) | 31 (41.9%) |
| 2-Person Household | 84 (60.0%) | 56 (40.0%) |
| 3-Person Household | 32 (82.1%) | 7 (17.9%) |
| 4+ Person Household | 43 (62.3%) | 26 (37.7%) |
| Total Housing Units | 202 (62.7%) | 120 (37.3%) |
Occupancy by Educational Attainment in Christiana borough
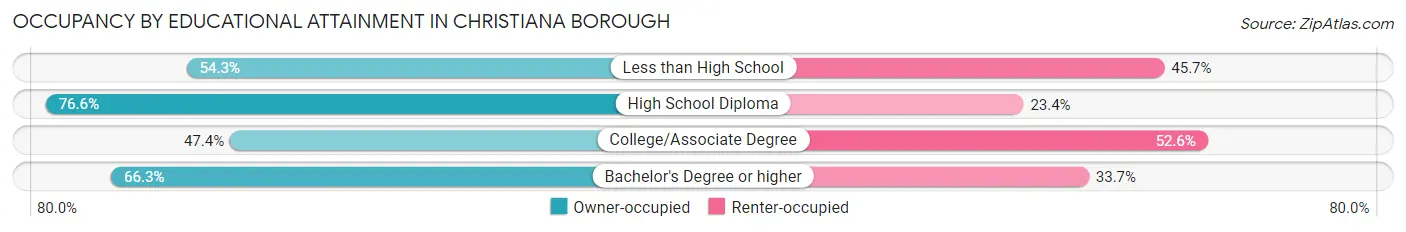
| Household Size | Owner-occupied | Renter-occupied |
| Less than High School | 19 (54.3%) | 16 (45.7%) |
| High School Diploma | 82 (76.6%) | 25 (23.4%) |
| College/Associate Degree | 46 (47.4%) | 51 (52.6%) |
| Bachelor's Degree or higher | 55 (66.3%) | 28 (33.7%) |
Occupancy by Age of Householder in Christiana borough
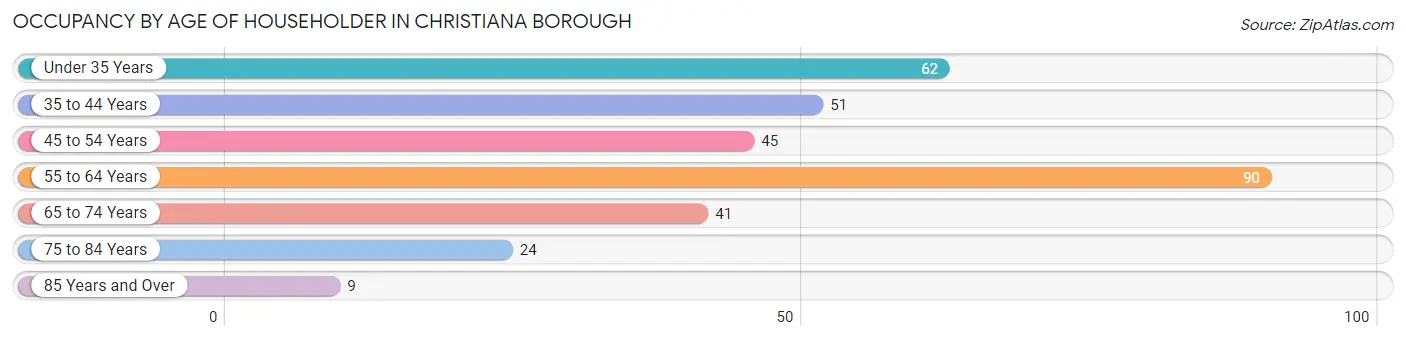
| Age Bracket | # Households | % Households |
| Under 35 Years | 62 | 19.3% |
| 35 to 44 Years | 51 | 15.8% |
| 45 to 54 Years | 45 | 14.0% |
| 55 to 64 Years | 90 | 28.0% |
| 65 to 74 Years | 41 | 12.7% |
| 75 to 84 Years | 24 | 7.4% |
| 85 Years and Over | 9 | 2.8% |
| Total | 322 | 100.0% |
Housing Finances in Christiana borough
Median Income by Occupancy in Christiana borough
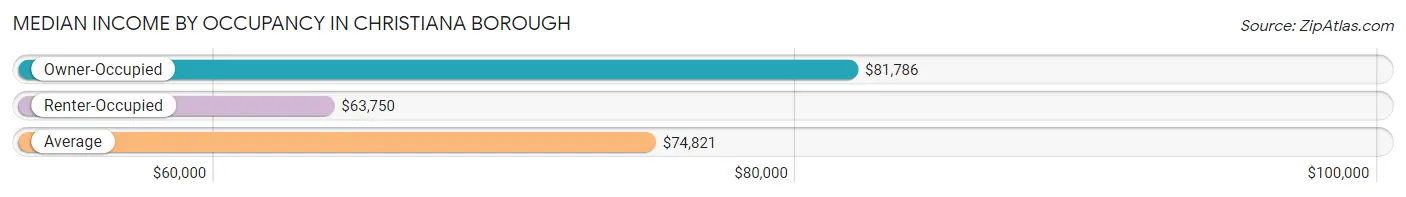
| Occupancy Type | # Households | Median Income |
| Owner-Occupied | 202 (62.7%) | $81,786 |
| Renter-Occupied | 120 (37.3%) | $63,750 |
| Average | 322 (100.0%) | $74,821 |
Occupancy by Householder Income Bracket in Christiana borough
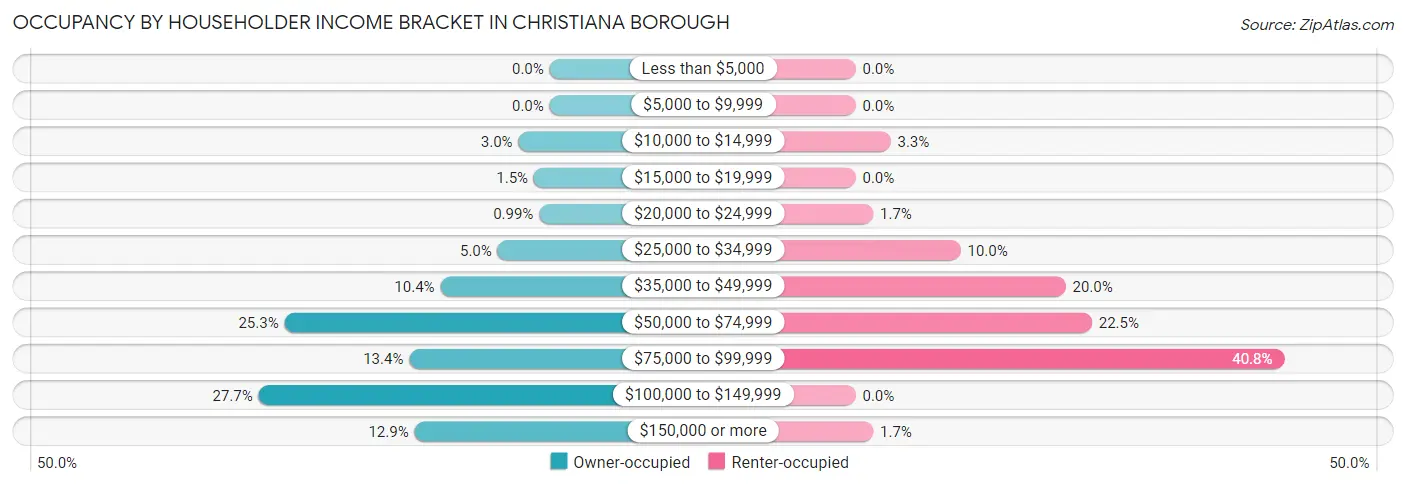
| Income Bracket | Owner-occupied | Renter-occupied |
| Less than $5,000 | 0 (0.0%) | 0 (0.0%) |
| $5,000 to $9,999 | 0 (0.0%) | 0 (0.0%) |
| $10,000 to $14,999 | 6 (3.0%) | 4 (3.3%) |
| $15,000 to $19,999 | 3 (1.5%) | 0 (0.0%) |
| $20,000 to $24,999 | 2 (1.0%) | 2 (1.7%) |
| $25,000 to $34,999 | 10 (5.0%) | 12 (10.0%) |
| $35,000 to $49,999 | 21 (10.4%) | 24 (20.0%) |
| $50,000 to $74,999 | 51 (25.3%) | 27 (22.5%) |
| $75,000 to $99,999 | 27 (13.4%) | 49 (40.8%) |
| $100,000 to $149,999 | 56 (27.7%) | 0 (0.0%) |
| $150,000 or more | 26 (12.9%) | 2 (1.7%) |
| Total | 202 (100.0%) | 120 (100.0%) |
Monthly Housing Cost Tiers in Christiana borough
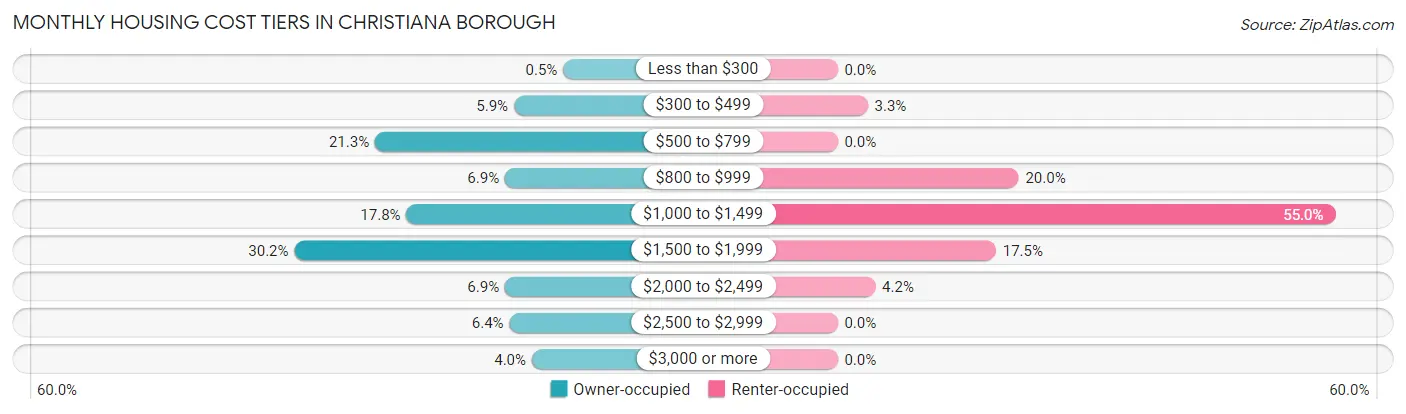
| Monthly Cost | Owner-occupied | Renter-occupied |
| Less than $300 | 1 (0.5%) | 0 (0.0%) |
| $300 to $499 | 12 (5.9%) | 4 (3.3%) |
| $500 to $799 | 43 (21.3%) | 0 (0.0%) |
| $800 to $999 | 14 (6.9%) | 24 (20.0%) |
| $1,000 to $1,499 | 36 (17.8%) | 66 (55.0%) |
| $1,500 to $1,999 | 61 (30.2%) | 21 (17.5%) |
| $2,000 to $2,499 | 14 (6.9%) | 5 (4.2%) |
| $2,500 to $2,999 | 13 (6.4%) | 0 (0.0%) |
| $3,000 or more | 8 (4.0%) | 0 (0.0%) |
| Total | 202 (100.0%) | 120 (100.0%) |
Physical Housing Characteristics in Christiana borough
Housing Structures in Christiana borough
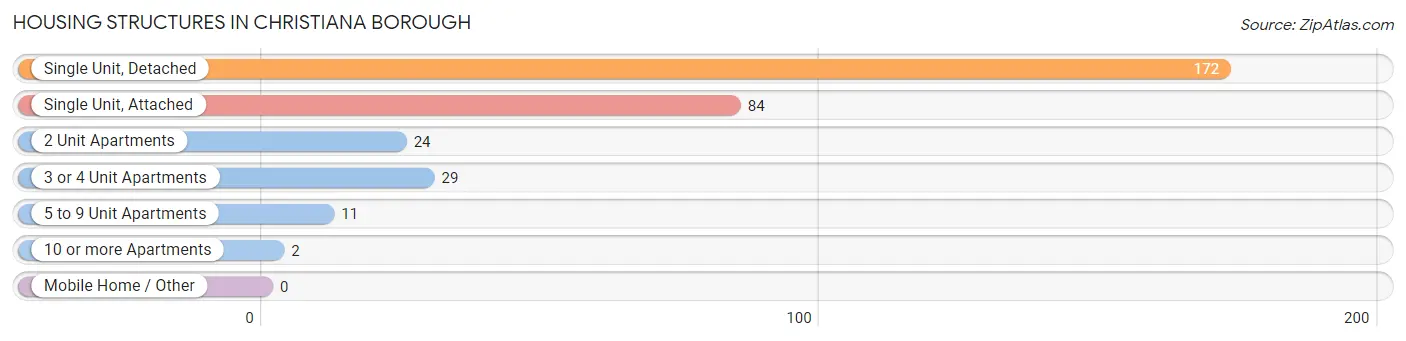
| Structure Type | # Housing Units | % Housing Units |
| Single Unit, Detached | 172 | 53.4% |
| Single Unit, Attached | 84 | 26.1% |
| 2 Unit Apartments | 24 | 7.4% |
| 3 or 4 Unit Apartments | 29 | 9.0% |
| 5 to 9 Unit Apartments | 11 | 3.4% |
| 10 or more Apartments | 2 | 0.6% |
| Mobile Home / Other | 0 | 0.0% |
| Total | 322 | 100.0% |
Housing Structures by Occupancy in Christiana borough
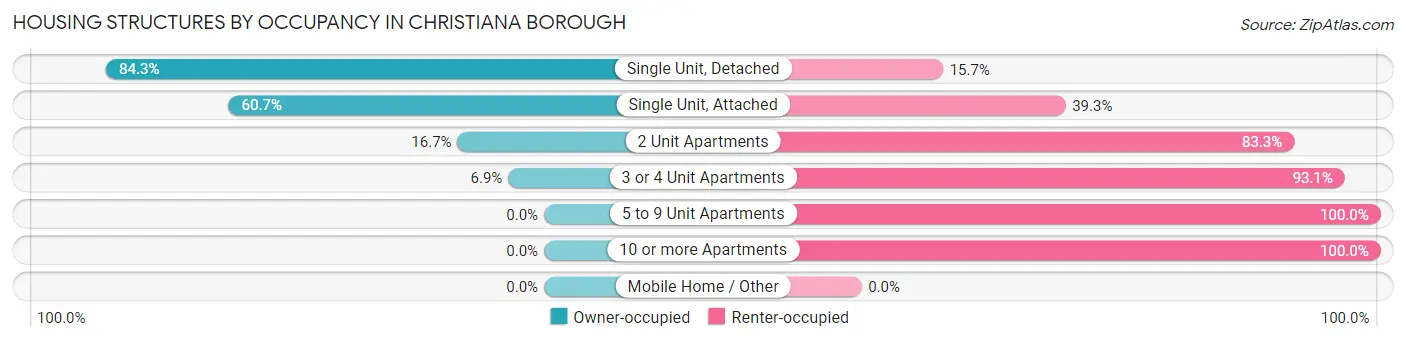
| Structure Type | Owner-occupied | Renter-occupied |
| Single Unit, Detached | 145 (84.3%) | 27 (15.7%) |
| Single Unit, Attached | 51 (60.7%) | 33 (39.3%) |
| 2 Unit Apartments | 4 (16.7%) | 20 (83.3%) |
| 3 or 4 Unit Apartments | 2 (6.9%) | 27 (93.1%) |
| 5 to 9 Unit Apartments | 0 (0.0%) | 11 (100.0%) |
| 10 or more Apartments | 0 (0.0%) | 2 (100.0%) |
| Mobile Home / Other | 0 (0.0%) | 0 (0.0%) |
| Total | 202 (62.7%) | 120 (37.3%) |
Housing Structures by Number of Rooms in Christiana borough
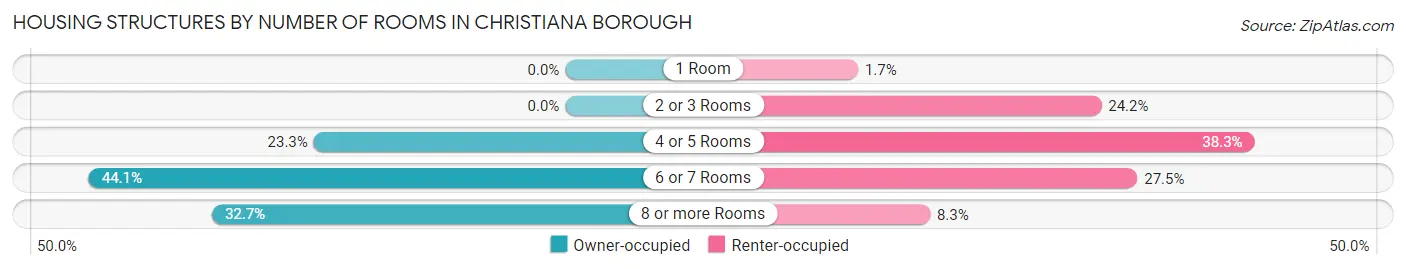
| Number of Rooms | Owner-occupied | Renter-occupied |
| 1 Room | 0 (0.0%) | 2 (1.7%) |
| 2 or 3 Rooms | 0 (0.0%) | 29 (24.2%) |
| 4 or 5 Rooms | 47 (23.3%) | 46 (38.3%) |
| 6 or 7 Rooms | 89 (44.1%) | 33 (27.5%) |
| 8 or more Rooms | 66 (32.7%) | 10 (8.3%) |
| Total | 202 (100.0%) | 120 (100.0%) |
Housing Structure by Heating Type in Christiana borough
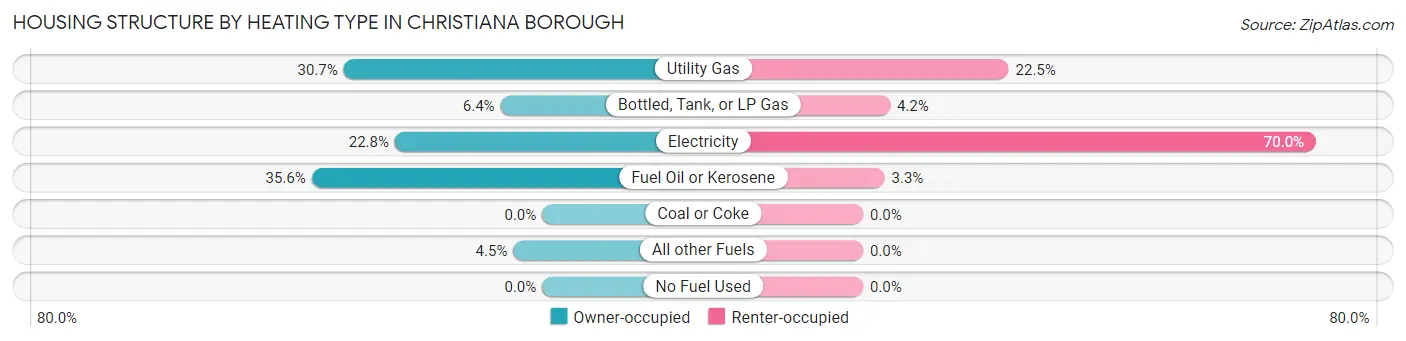
| Heating Type | Owner-occupied | Renter-occupied |
| Utility Gas | 62 (30.7%) | 27 (22.5%) |
| Bottled, Tank, or LP Gas | 13 (6.4%) | 5 (4.2%) |
| Electricity | 46 (22.8%) | 84 (70.0%) |
| Fuel Oil or Kerosene | 72 (35.6%) | 4 (3.3%) |
| Coal or Coke | 0 (0.0%) | 0 (0.0%) |
| All other Fuels | 9 (4.5%) | 0 (0.0%) |
| No Fuel Used | 0 (0.0%) | 0 (0.0%) |
| Total | 202 (100.0%) | 120 (100.0%) |
Household Vehicle Usage in Christiana borough
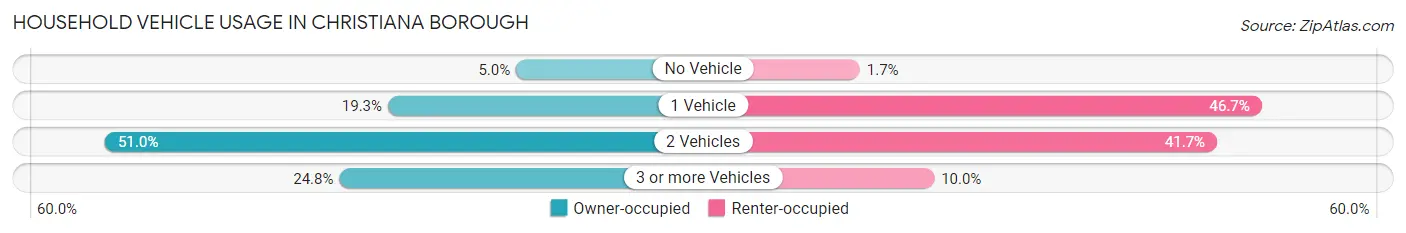
| Vehicles per Household | Owner-occupied | Renter-occupied |
| No Vehicle | 10 (5.0%) | 2 (1.7%) |
| 1 Vehicle | 39 (19.3%) | 56 (46.7%) |
| 2 Vehicles | 103 (51.0%) | 50 (41.7%) |
| 3 or more Vehicles | 50 (24.7%) | 12 (10.0%) |
| Total | 202 (100.0%) | 120 (100.0%) |
Real Estate & Mortgages in Christiana borough
Real Estate and Mortgage Overview in Christiana borough
| Characteristic | Without Mortgage | With Mortgage |
| Housing Units | 73 | 129 |
| Median Property Value | $203,300 | $205,000 |
| Median Household Income | $62,750 | $23 |
| Monthly Housing Costs | $717 | $6 |
| Real Estate Taxes | $3,604 | $3 |
Property Value by Mortgage Status in Christiana borough
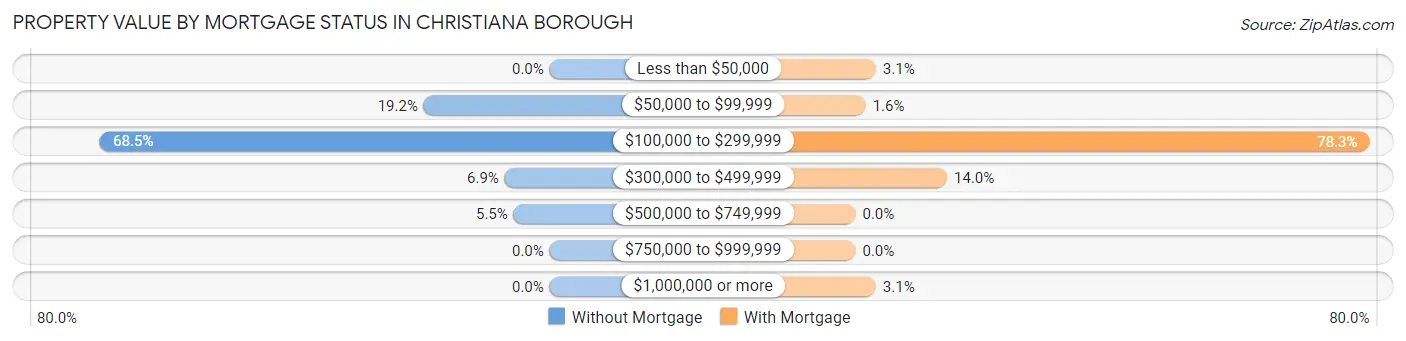
| Property Value | Without Mortgage | With Mortgage |
| Less than $50,000 | 0 (0.0%) | 4 (3.1%) |
| $50,000 to $99,999 | 14 (19.2%) | 2 (1.5%) |
| $100,000 to $299,999 | 50 (68.5%) | 101 (78.3%) |
| $300,000 to $499,999 | 5 (6.9%) | 18 (14.0%) |
| $500,000 to $749,999 | 4 (5.5%) | 0 (0.0%) |
| $750,000 to $999,999 | 0 (0.0%) | 0 (0.0%) |
| $1,000,000 or more | 0 (0.0%) | 4 (3.1%) |
| Total | 73 (100.0%) | 129 (100.0%) |
Household Income by Mortgage Status in Christiana borough
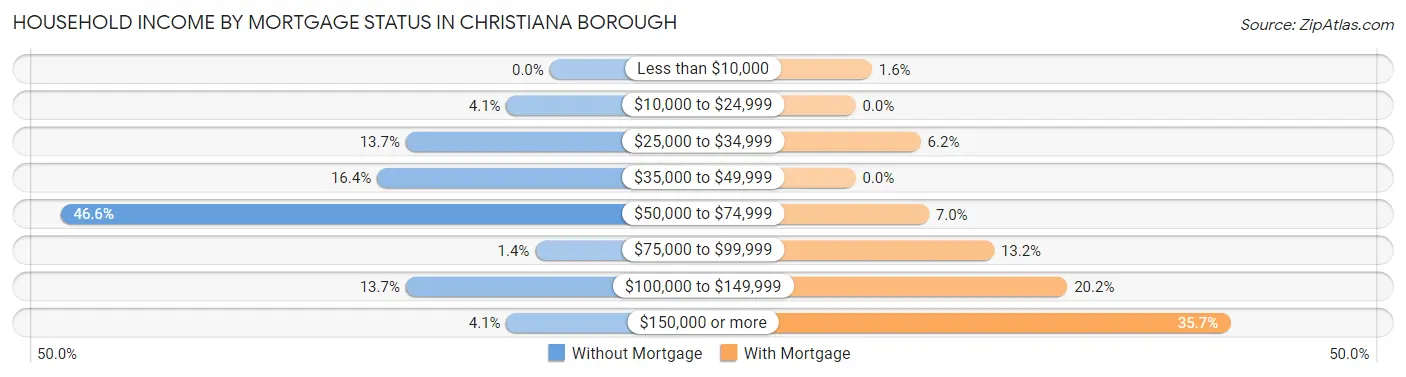
| Household Income | Without Mortgage | With Mortgage |
| Less than $10,000 | 0 (0.0%) | 2 (1.5%) |
| $10,000 to $24,999 | 3 (4.1%) | 0 (0.0%) |
| $25,000 to $34,999 | 10 (13.7%) | 8 (6.2%) |
| $35,000 to $49,999 | 12 (16.4%) | 0 (0.0%) |
| $50,000 to $74,999 | 34 (46.6%) | 9 (7.0%) |
| $75,000 to $99,999 | 1 (1.4%) | 17 (13.2%) |
| $100,000 to $149,999 | 10 (13.7%) | 26 (20.2%) |
| $150,000 or more | 3 (4.1%) | 46 (35.7%) |
| Total | 73 (100.0%) | 129 (100.0%) |
Property Value to Household Income Ratio in Christiana borough
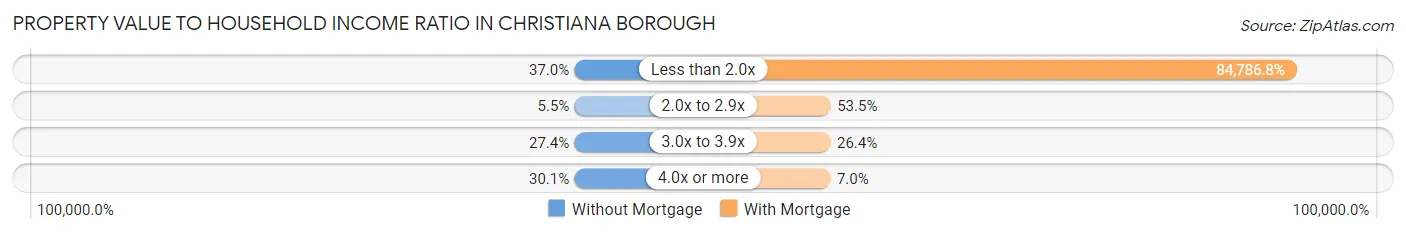
| Value-to-Income Ratio | Without Mortgage | With Mortgage |
| Less than 2.0x | 27 (37.0%) | 109,375 (84,786.8%) |
| 2.0x to 2.9x | 4 (5.5%) | 69 (53.5%) |
| 3.0x to 3.9x | 20 (27.4%) | 34 (26.4%) |
| 4.0x or more | 22 (30.1%) | 9 (7.0%) |
| Total | 73 (100.0%) | 129 (100.0%) |
Real Estate Taxes by Mortgage Status in Christiana borough
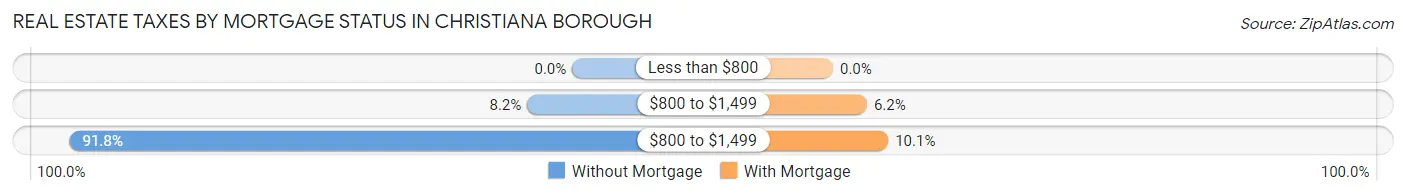
| Property Taxes | Without Mortgage | With Mortgage |
| Less than $800 | 0 (0.0%) | 0 (0.0%) |
| $800 to $1,499 | 6 (8.2%) | 8 (6.2%) |
| $800 to $1,499 | 67 (91.8%) | 13 (10.1%) |
| Total | 73 (100.0%) | 129 (100.0%) |
Health & Disability in Christiana borough
Health Insurance Coverage by Age in Christiana borough
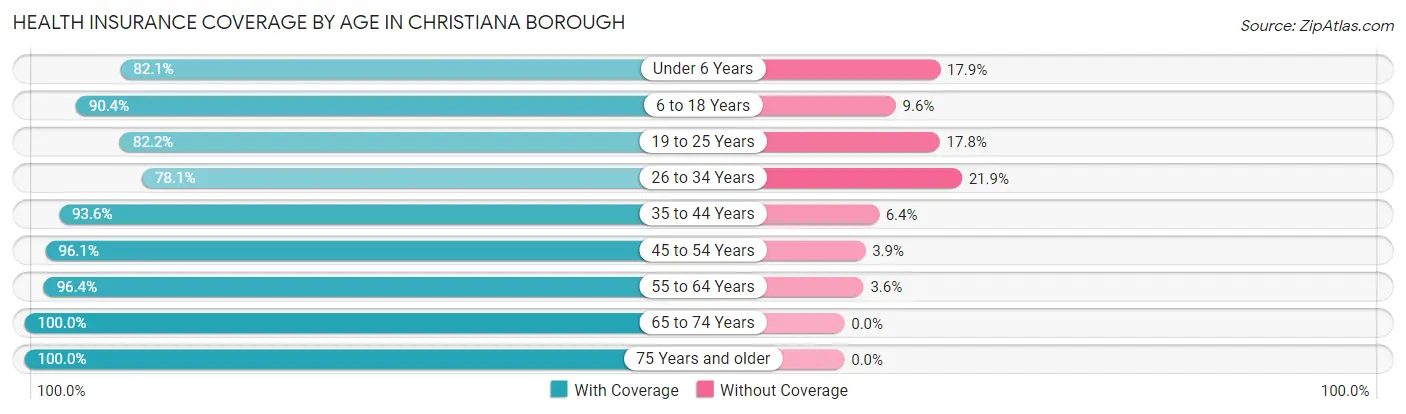
| Age Bracket | With Coverage | Without Coverage |
| Under 6 Years | 69 (82.1%) | 15 (17.9%) |
| 6 to 18 Years | 104 (90.4%) | 11 (9.6%) |
| 19 to 25 Years | 74 (82.2%) | 16 (17.8%) |
| 26 to 34 Years | 82 (78.1%) | 23 (21.9%) |
| 35 to 44 Years | 102 (93.6%) | 7 (6.4%) |
| 45 to 54 Years | 74 (96.1%) | 3 (3.9%) |
| 55 to 64 Years | 135 (96.4%) | 5 (3.6%) |
| 65 to 74 Years | 62 (100.0%) | 0 (0.0%) |
| 75 Years and older | 51 (100.0%) | 0 (0.0%) |
| Total | 753 (90.4%) | 80 (9.6%) |
Health Insurance Coverage by Citizenship Status in Christiana borough
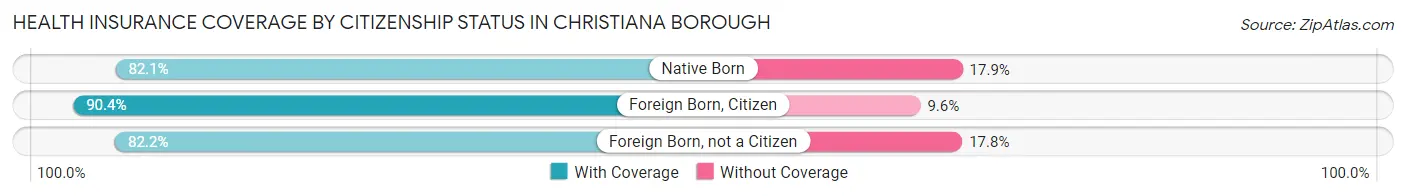
| Citizenship Status | With Coverage | Without Coverage |
| Native Born | 69 (82.1%) | 15 (17.9%) |
| Foreign Born, Citizen | 104 (90.4%) | 11 (9.6%) |
| Foreign Born, not a Citizen | 74 (82.2%) | 16 (17.8%) |
Health Insurance Coverage by Household Income in Christiana borough
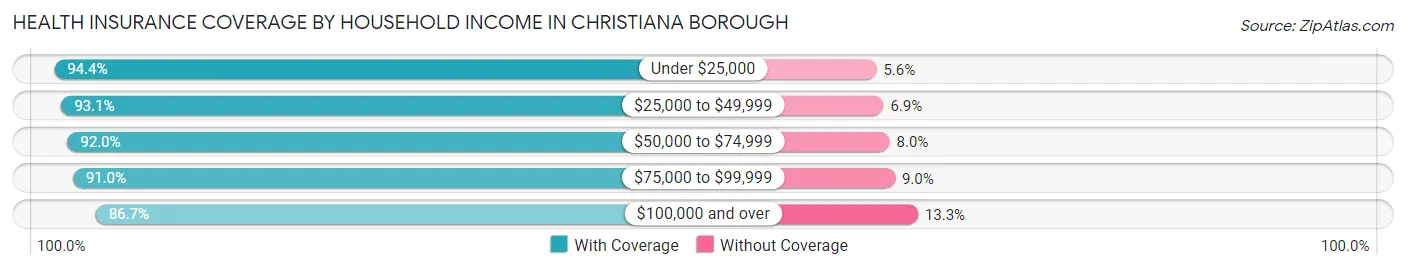
| Household Income | With Coverage | Without Coverage |
| Under $25,000 | 34 (94.4%) | 2 (5.6%) |
| $25,000 to $49,999 | 122 (93.1%) | 9 (6.9%) |
| $50,000 to $74,999 | 195 (92.0%) | 17 (8.0%) |
| $75,000 to $99,999 | 141 (91.0%) | 14 (9.0%) |
| $100,000 and over | 247 (86.7%) | 38 (13.3%) |
Public vs Private Health Insurance Coverage by Age in Christiana borough
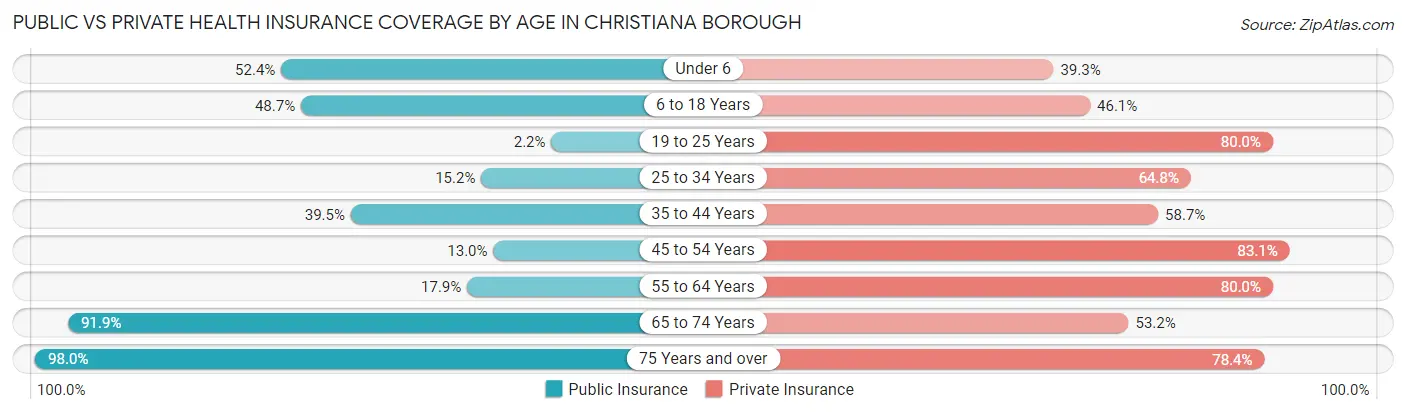
| Age Bracket | Public Insurance | Private Insurance |
| Under 6 | 44 (52.4%) | 33 (39.3%) |
| 6 to 18 Years | 56 (48.7%) | 53 (46.1%) |
| 19 to 25 Years | 2 (2.2%) | 72 (80.0%) |
| 25 to 34 Years | 16 (15.2%) | 68 (64.8%) |
| 35 to 44 Years | 43 (39.5%) | 64 (58.7%) |
| 45 to 54 Years | 10 (13.0%) | 64 (83.1%) |
| 55 to 64 Years | 25 (17.9%) | 112 (80.0%) |
| 65 to 74 Years | 57 (91.9%) | 33 (53.2%) |
| 75 Years and over | 50 (98.0%) | 40 (78.4%) |
| Total | 303 (36.4%) | 539 (64.7%) |
Disability Status by Sex by Age in Christiana borough
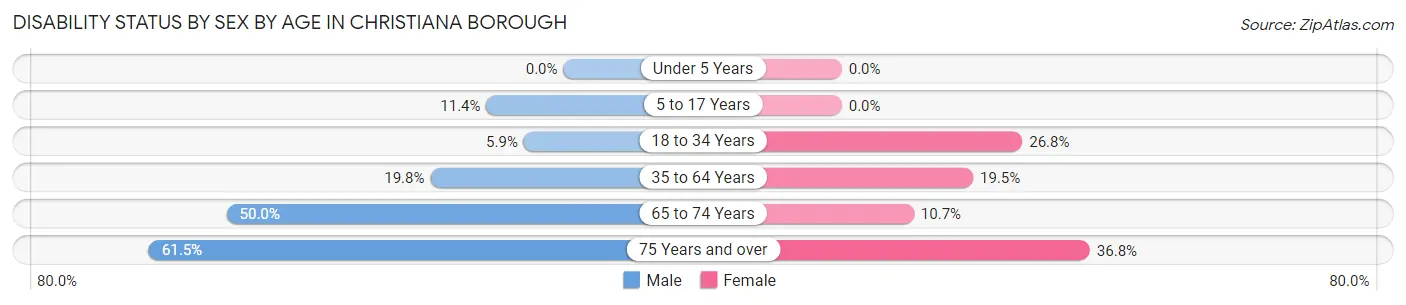
| Age Bracket | Male | Female |
| Under 5 Years | 0 (0.0%) | 0 (0.0%) |
| 5 to 17 Years | 8 (11.4%) | 0 (0.0%) |
| 18 to 34 Years | 6 (5.9%) | 26 (26.8%) |
| 35 to 64 Years | 33 (19.8%) | 31 (19.5%) |
| 65 to 74 Years | 17 (50.0%) | 3 (10.7%) |
| 75 Years and over | 8 (61.5%) | 14 (36.8%) |
Disability Class by Sex by Age in Christiana borough
Disability Class: Hearing Difficulty
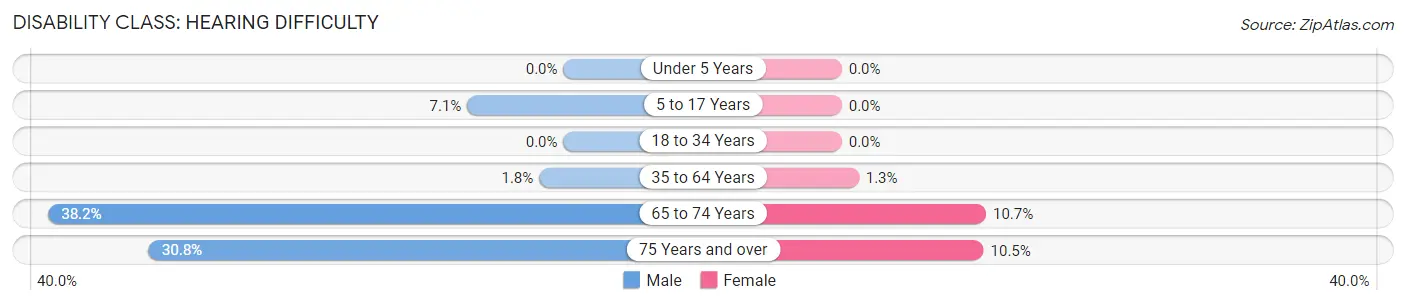
| Age Bracket | Male | Female |
| Under 5 Years | 0 (0.0%) | 0 (0.0%) |
| 5 to 17 Years | 5 (7.1%) | 0 (0.0%) |
| 18 to 34 Years | 0 (0.0%) | 0 (0.0%) |
| 35 to 64 Years | 3 (1.8%) | 2 (1.3%) |
| 65 to 74 Years | 13 (38.2%) | 3 (10.7%) |
| 75 Years and over | 4 (30.8%) | 4 (10.5%) |
Disability Class: Vision Difficulty
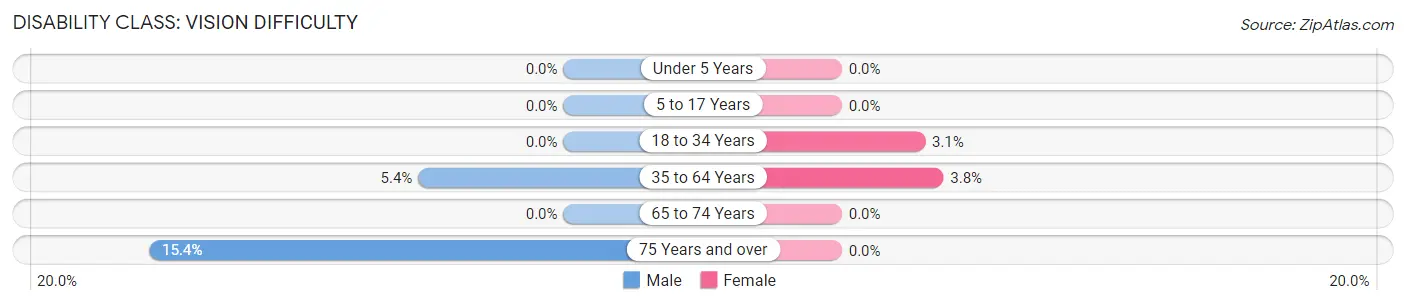
| Age Bracket | Male | Female |
| Under 5 Years | 0 (0.0%) | 0 (0.0%) |
| 5 to 17 Years | 0 (0.0%) | 0 (0.0%) |
| 18 to 34 Years | 0 (0.0%) | 3 (3.1%) |
| 35 to 64 Years | 9 (5.4%) | 6 (3.8%) |
| 65 to 74 Years | 0 (0.0%) | 0 (0.0%) |
| 75 Years and over | 2 (15.4%) | 0 (0.0%) |
Disability Class: Cognitive Difficulty
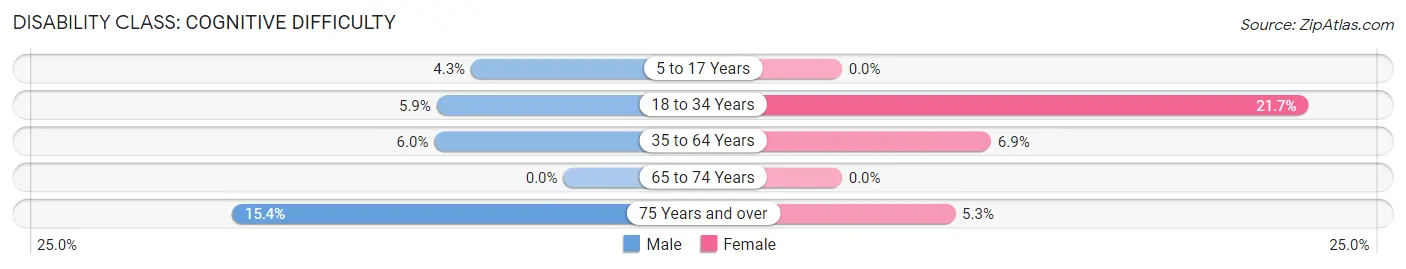
| Age Bracket | Male | Female |
| 5 to 17 Years | 3 (4.3%) | 0 (0.0%) |
| 18 to 34 Years | 6 (5.9%) | 21 (21.6%) |
| 35 to 64 Years | 10 (6.0%) | 11 (6.9%) |
| 65 to 74 Years | 0 (0.0%) | 0 (0.0%) |
| 75 Years and over | 2 (15.4%) | 2 (5.3%) |
Disability Class: Ambulatory Difficulty
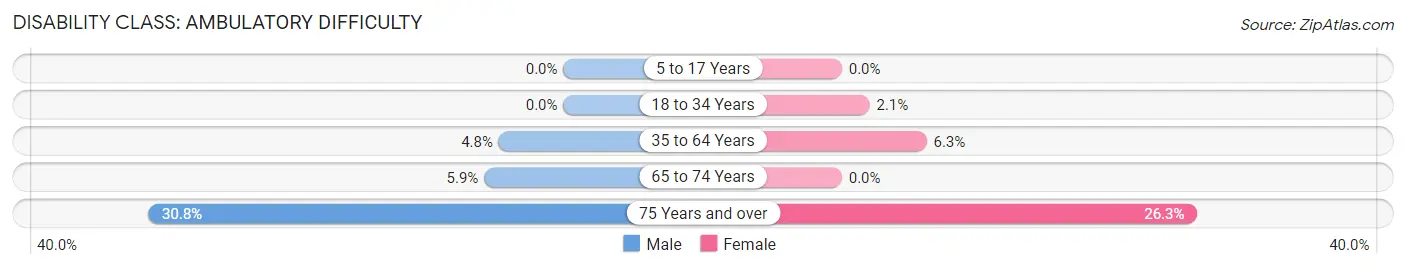
| Age Bracket | Male | Female |
| 5 to 17 Years | 0 (0.0%) | 0 (0.0%) |
| 18 to 34 Years | 0 (0.0%) | 2 (2.1%) |
| 35 to 64 Years | 8 (4.8%) | 10 (6.3%) |
| 65 to 74 Years | 2 (5.9%) | 0 (0.0%) |
| 75 Years and over | 4 (30.8%) | 10 (26.3%) |
Disability Class: Self-Care Difficulty
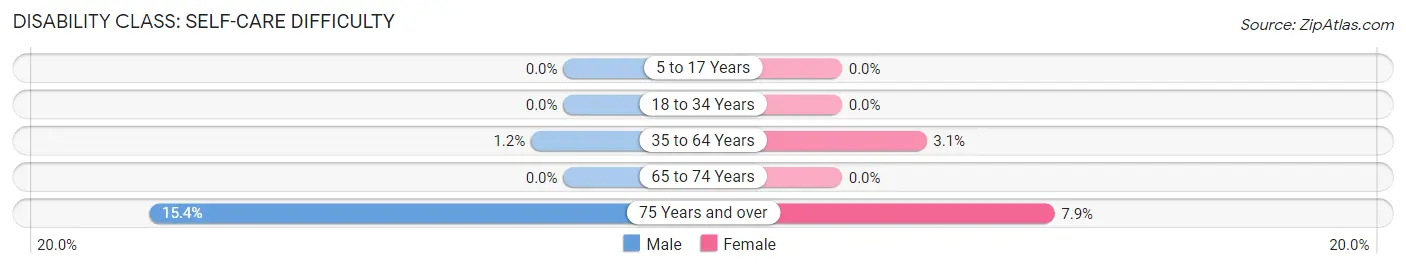
| Age Bracket | Male | Female |
| 5 to 17 Years | 0 (0.0%) | 0 (0.0%) |
| 18 to 34 Years | 0 (0.0%) | 0 (0.0%) |
| 35 to 64 Years | 2 (1.2%) | 5 (3.1%) |
| 65 to 74 Years | 0 (0.0%) | 0 (0.0%) |
| 75 Years and over | 2 (15.4%) | 3 (7.9%) |
Technology Access in Christiana borough
Computing Device Access in Christiana borough
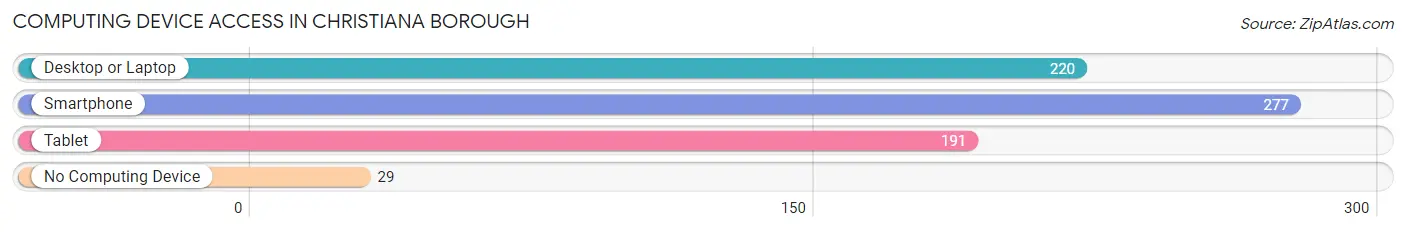
| Device Type | # Households | % Households |
| Desktop or Laptop | 220 | 68.3% |
| Smartphone | 277 | 86.0% |
| Tablet | 191 | 59.3% |
| No Computing Device | 29 | 9.0% |
| Total | 322 | 100.0% |
Internet Access in Christiana borough
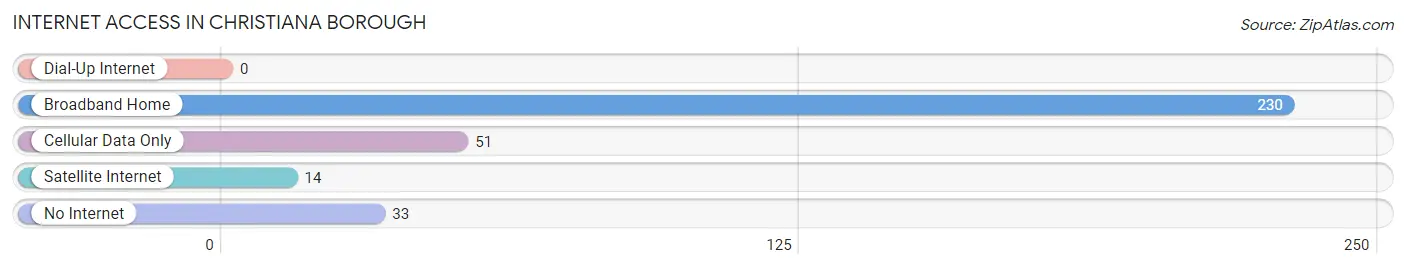
| Internet Type | # Households | % Households |
| Dial-Up Internet | 0 | 0.0% |
| Broadband Home | 230 | 71.4% |
| Cellular Data Only | 51 | 15.8% |
| Satellite Internet | 14 | 4.3% |
| No Internet | 33 | 10.2% |
| Total | 322 | 100.0% |
Christiana borough Summary
Christiana Borough is a small borough located in Lancaster County, Pennsylvania. It is situated in the southeastern corner of the county, just north of the city of Lancaster. The borough is home to a population of approximately 1,400 people, and is part of the Lancaster Metropolitan Statistical Area.
History
The area that is now Christiana Borough was first settled in the late 1700s by German immigrants. The town was originally known as “Christiana”, after the Christiana River, which runs through the area. The town was officially incorporated in 1851, and was named after the river.
In the late 1800s, the town was a major hub for the Pennsylvania Railroad. The railroad ran through the town, and the town was home to several train stations. The railroad was a major source of employment for the town, and it helped to spur economic growth in the area.
The town was also home to several mills, which were powered by the Christiana River. These mills provided employment for many of the town’s residents, and helped to make the town a prosperous place.
Geography
Christiana Borough is located in southeastern Lancaster County, Pennsylvania. It is situated just north of the city of Lancaster, and is bordered by East Lampeter Township to the north, West Lampeter Township to the east, and the city of Lancaster to the south and west.
The borough is located in the Piedmont region of Pennsylvania, and is characterized by rolling hills and valleys. The Christiana River runs through the borough, and is a major source of water for the area.
Economy
The economy of Christiana Borough is largely based on agriculture and manufacturing. The town is home to several farms, which produce a variety of crops, including corn, soybeans, and hay. The town is also home to several manufacturing companies, which produce a variety of products, including furniture, clothing, and electronics.
The town is also home to several small businesses, including restaurants, retail stores, and professional services. The town is also home to several churches, which provide employment for many of the town’s residents.
Demographics
As of the 2010 census, the population of Christiana Borough was 1,400. The racial makeup of the borough was 95.3% White, 1.3% African American, 0.3% Native American, 0.7% Asian, 0.1% Pacific Islander, and 2.3% from other races. Hispanic or Latino of any race were 3.3% of the population.
The median household income in the borough was $45,000, and the median family income was $50,000. The per capita income in the borough was $20,000. About 8.3% of the population was below the poverty line.
The town is served by the Lampeter-Strasburg School District, which includes two elementary schools, one middle school, and one high school. The town is also home to several churches, including the Christiana United Methodist Church, the Christiana Presbyterian Church, and the Christiana Lutheran Church.
Common Questions
What is Per Capita Income in Christiana borough?
Per Capita income in Christiana borough is $32,228.
What is the Median Family Income in Christiana borough?
Median Family Income in Christiana borough is $81,635.
What is the Median Household income in Christiana borough?
Median Household Income in Christiana borough is $74,821.
What is Income or Wage Gap in Christiana borough?
Income or Wage Gap in Christiana borough is 36.3%.
Women in Christiana borough earn 63.7 cents for every dollar earned by a man.
What is Inequality or Gini Index in Christiana borough?
Inequality or Gini Index in Christiana borough is 0.36.
What is the Total Population of Christiana borough?
Total Population of Christiana borough is 956.
What is the Total Male Population of Christiana borough?
Total Male Population of Christiana borough is 440.
What is the Total Female Population of Christiana borough?
Total Female Population of Christiana borough is 516.
What is the Ratio of Males per 100 Females in Christiana borough?
There are 85.27 Males per 100 Females in Christiana borough.
What is the Ratio of Females per 100 Males in Christiana borough?
There are 117.27 Females per 100 Males in Christiana borough.
What is the Median Population Age in Christiana borough?
Median Population Age in Christiana borough is 43.1 Years.
What is the Average Family Size in Christiana borough
Average Family Size in Christiana borough is 3.1 People.
What is the Average Household Size in Christiana borough
Average Household Size in Christiana borough is 2.5 People.
How Large is the Labor Force in Christiana borough?
There are 431 People in the Labor Forcein in Christiana borough.
What is the Percentage of People in the Labor Force in Christiana borough?
55.3% of People are in the Labor Force in Christiana borough.
What is the Unemployment Rate in Christiana borough?
Unemployment Rate in Christiana borough is 1.9%.