Chester Hill borough, PA Map & Demographics
Chester Hill borough Overview
$35,823
PER CAPITA INCOME
$53,750
AVG FAMILY INCOME
$48,438
AVG HOUSEHOLD INCOME
30.6%
WAGE / INCOME GAP [ % ]
69.4¢/ $1
WAGE / INCOME GAP [ $ ]
0.59
INEQUALITY / GINI INDEX
717
TOTAL POPULATION
409
MALE POPULATION
308
FEMALE POPULATION
132.79
MALES / 100 FEMALES
75.31
FEMALES / 100 MALES
37.0
MEDIAN AGE
3.3
AVG FAMILY SIZE
2.4
AVG HOUSEHOLD SIZE
391
LABOR FORCE [ PEOPLE ]
63.7%
PERCENT IN LABOR FORCE
6.2%
UNEMPLOYMENT RATE
Income in Chester Hill borough
Income Overview in Chester Hill borough
Per Capita Income in Chester Hill borough is $35,823, while median incomes of families and households are $53,750 and $48,438 respectively.
| Characteristic | Number | Measure |
| Per Capita Income | 717 | $35,823 |
| Median Family Income | 160 | $53,750 |
| Mean Family Income | 160 | $82,369 |
| Median Household Income | 295 | $48,438 |
| Mean Household Income | 295 | $81,825 |
| Income Deficit | 160 | $0 |
| Wage / Income Gap (%) | 717 | 30.55% |
| Wage / Income Gap ($) | 717 | 69.45¢ per $1 |
| Gini / Inequality Index | 717 | 0.59 |
Earnings by Sex in Chester Hill borough
Average Earnings in Chester Hill borough are $29,458, $33,750 for men and $23,438 for women, a difference of 30.5%.
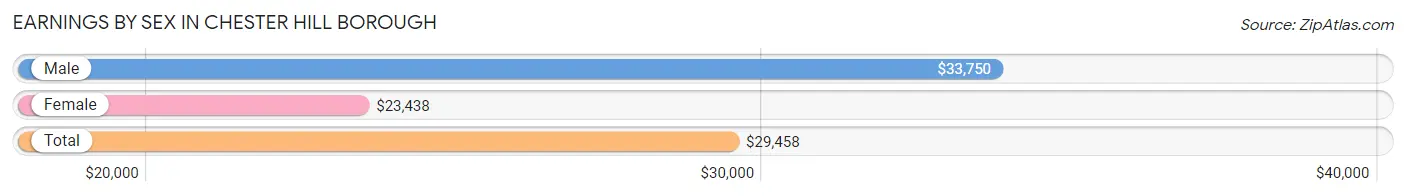
| Sex | Number | Average Earnings |
| Male | 248 (62.5%) | $33,750 |
| Female | 149 (37.5%) | $23,438 |
| Total | 397 (100.0%) | $29,458 |
Earnings by Sex by Income Bracket in Chester Hill borough
The most common earnings brackets in Chester Hill borough are $10,000 to $12,499 for men (48 | 19.4%) and $15,000 to $17,499 for women (22 | 14.8%).
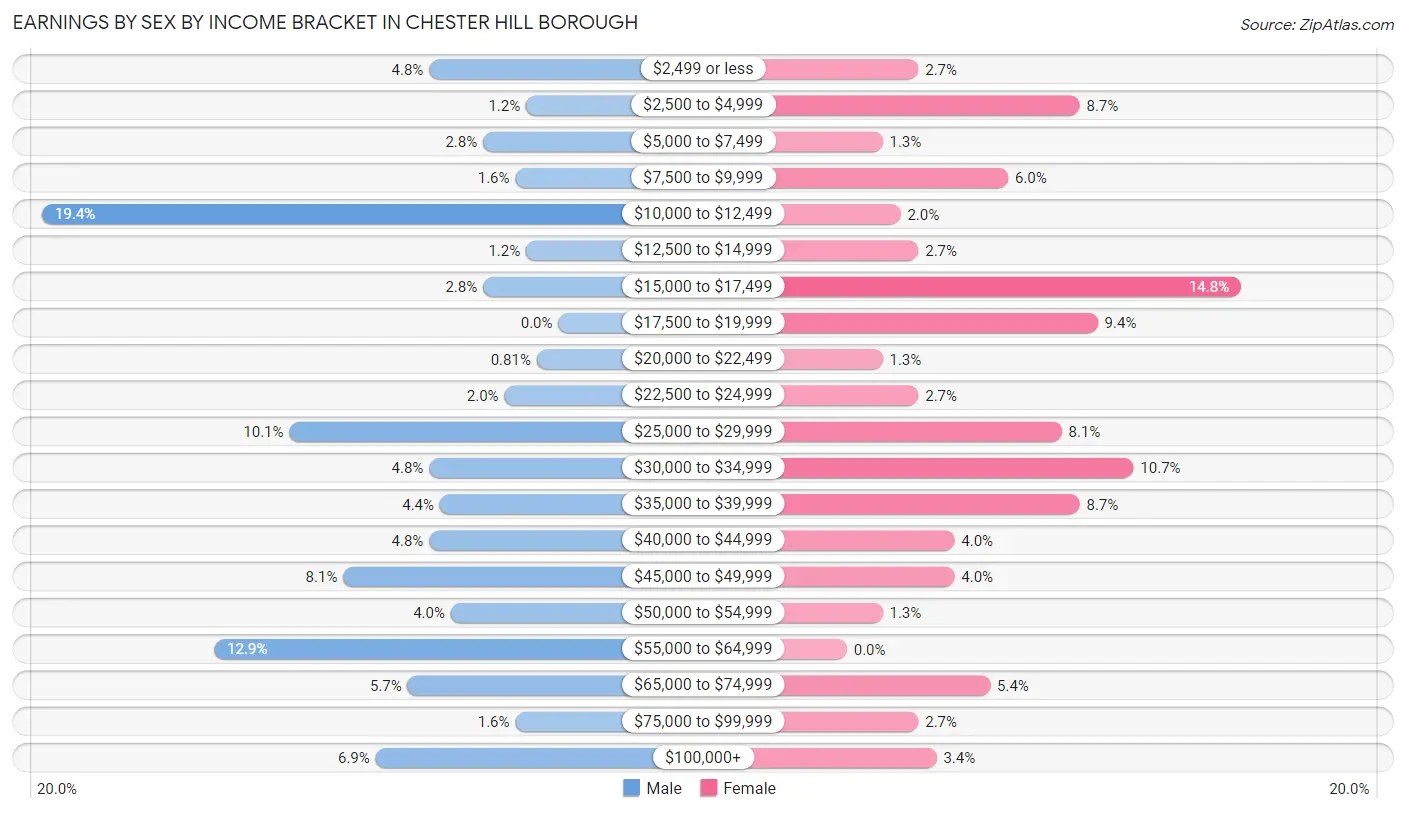
| Income | Male | Female |
| $2,499 or less | 12 (4.8%) | 4 (2.7%) |
| $2,500 to $4,999 | 3 (1.2%) | 13 (8.7%) |
| $5,000 to $7,499 | 7 (2.8%) | 2 (1.3%) |
| $7,500 to $9,999 | 4 (1.6%) | 9 (6.0%) |
| $10,000 to $12,499 | 48 (19.4%) | 3 (2.0%) |
| $12,500 to $14,999 | 3 (1.2%) | 4 (2.7%) |
| $15,000 to $17,499 | 7 (2.8%) | 22 (14.8%) |
| $17,500 to $19,999 | 0 (0.0%) | 14 (9.4%) |
| $20,000 to $22,499 | 2 (0.8%) | 2 (1.3%) |
| $22,500 to $24,999 | 5 (2.0%) | 4 (2.7%) |
| $25,000 to $29,999 | 25 (10.1%) | 12 (8.1%) |
| $30,000 to $34,999 | 12 (4.8%) | 16 (10.7%) |
| $35,000 to $39,999 | 11 (4.4%) | 13 (8.7%) |
| $40,000 to $44,999 | 12 (4.8%) | 6 (4.0%) |
| $45,000 to $49,999 | 20 (8.1%) | 6 (4.0%) |
| $50,000 to $54,999 | 10 (4.0%) | 2 (1.3%) |
| $55,000 to $64,999 | 32 (12.9%) | 0 (0.0%) |
| $65,000 to $74,999 | 14 (5.7%) | 8 (5.4%) |
| $75,000 to $99,999 | 4 (1.6%) | 4 (2.7%) |
| $100,000+ | 17 (6.9%) | 5 (3.4%) |
| Total | 248 (100.0%) | 149 (100.0%) |
Earnings by Sex by Educational Attainment in Chester Hill borough
Average earnings in Chester Hill borough are $35,833 for men and $26,750 for women, a difference of 25.4%. Men with an educational attainment of graduate degree enjoy the highest average annual earnings of $96,250, while those with college or associate's degree education earn the least with $29,511. Women with an educational attainment of bachelor's degree earn the most with the average annual earnings of $41,875, while those with high school diploma education have the smallest earnings of $20,625.
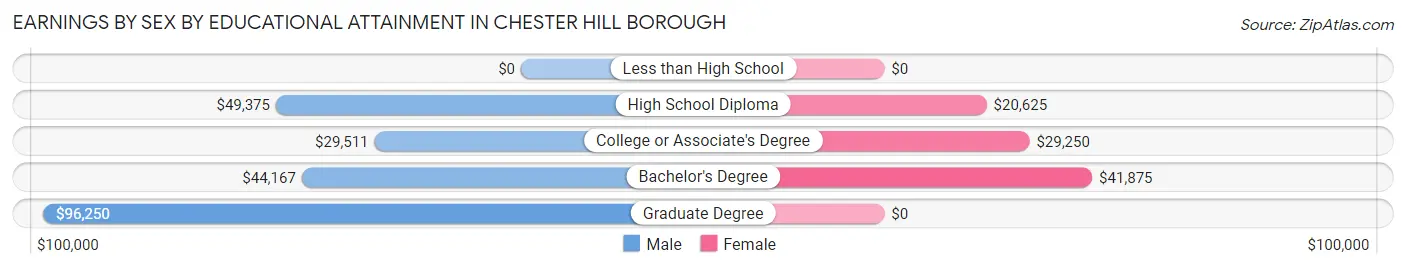
| Educational Attainment | Male Income | Female Income |
| Less than High School | - | - |
| High School Diploma | $49,375 | $20,625 |
| College or Associate's Degree | $29,511 | $29,250 |
| Bachelor's Degree | $44,167 | $41,875 |
| Graduate Degree | $96,250 | $0 |
| Total | $35,833 | $26,750 |
Family Income in Chester Hill borough
Family Income Brackets in Chester Hill borough
According to the Chester Hill borough family income data, there are 32 families falling into the $50,000 to $74,999 income range, which is the most common income bracket and makes up 20.0% of all families. Conversely, the $150,000 to $199,999 income bracket is the least frequent group with only 5 families (3.1%) belonging to this category.
| Income Bracket | # Families | % Families |
| Less than $10,000 | 16 | 10.0% |
| $10,000 to $14,999 | 10 | 6.3% |
| $15,000 to $24,999 | 22 | 13.8% |
| $25,000 to $34,999 | 6 | 3.8% |
| $35,000 to $49,999 | 21 | 13.1% |
| $50,000 to $74,999 | 32 | 20.0% |
| $75,000 to $99,999 | 20 | 12.5% |
| $100,000 to $149,999 | 23 | 14.4% |
| $150,000 to $199,999 | 5 | 3.1% |
| $200,000+ | 5 | 3.1% |
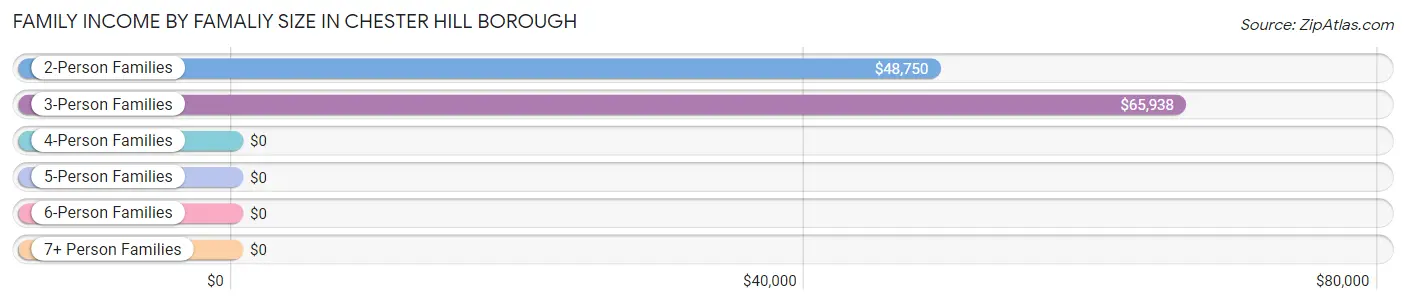
Family Income by Famaliy Size in Chester Hill borough
3-person families (41 | 25.6%) account for the highest median family income in Chester Hill borough with $65,938 per family, while 2-person families (87 | 54.4%) have the highest median income of $24,375 per family member.
| Income Bracket | # Families | Median Income |
| 2-Person Families | 87 (54.4%) | $48,750 |
| 3-Person Families | 41 (25.6%) | $65,938 |
| 4-Person Families | 19 (11.9%) | $0 |
| 5-Person Families | 7 (4.4%) | $0 |
| 6-Person Families | 5 (3.1%) | $0 |
| 7+ Person Families | 1 (0.6%) | $0 |
| Total | 160 (100.0%) | $53,750 |
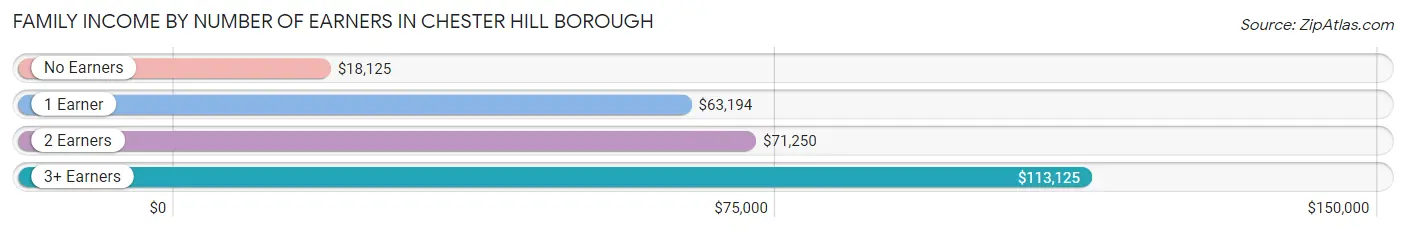
Family Income by Number of Earners in Chester Hill borough
The median family income in Chester Hill borough is $53,750, with families comprising 3+ earners (20) having the highest median family income of $113,125, while families with no earners (45) have the lowest median family income of $18,125, accounting for 12.5% and 28.1% of families, respectively.
| Number of Earners | # Families | Median Income |
| No Earners | 45 (28.1%) | $18,125 |
| 1 Earner | 47 (29.4%) | $63,194 |
| 2 Earners | 48 (30.0%) | $71,250 |
| 3+ Earners | 20 (12.5%) | $113,125 |
| Total | 160 (100.0%) | $53,750 |
Household Income in Chester Hill borough
Household Income Brackets in Chester Hill borough
With 57 households falling in the category, the $15,000 to $24,999 income range is the most frequent in Chester Hill borough, accounting for 19.3% of all households. In contrast, only 14 households (4.8%) fall into the $10,000 to $14,999 income bracket, making it the least populous group.
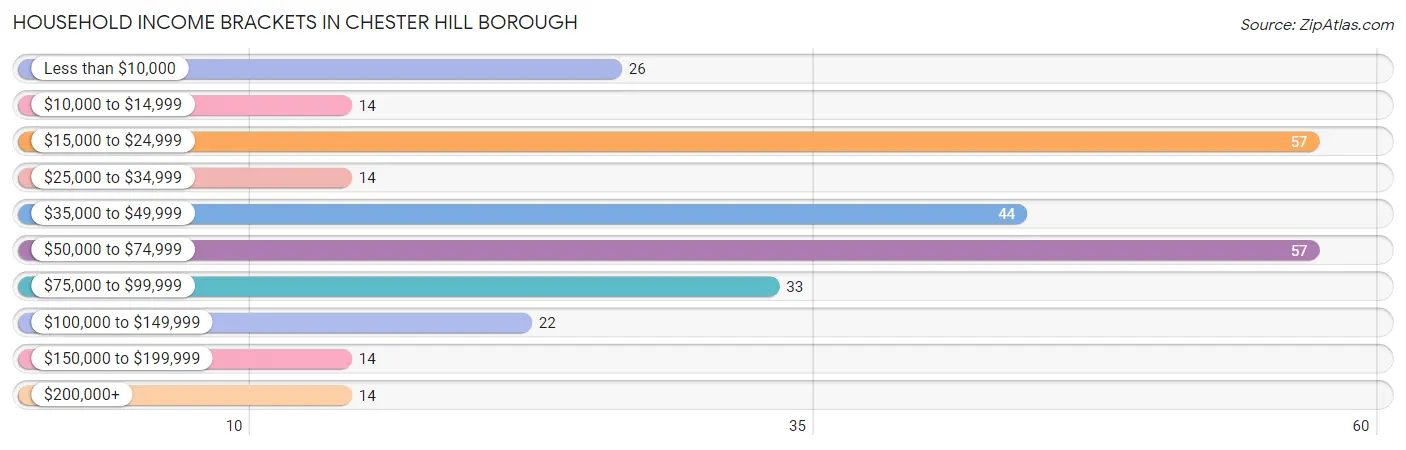
| Income Bracket | # Households | % Households |
| Less than $10,000 | 26 | 8.8% |
| $10,000 to $14,999 | 14 | 4.7% |
| $15,000 to $24,999 | 57 | 19.3% |
| $25,000 to $34,999 | 14 | 4.7% |
| $35,000 to $49,999 | 44 | 14.9% |
| $50,000 to $74,999 | 57 | 19.3% |
| $75,000 to $99,999 | 33 | 11.2% |
| $100,000 to $149,999 | 22 | 7.5% |
| $150,000 to $199,999 | 14 | 4.7% |
| $200,000+ | 14 | 4.7% |
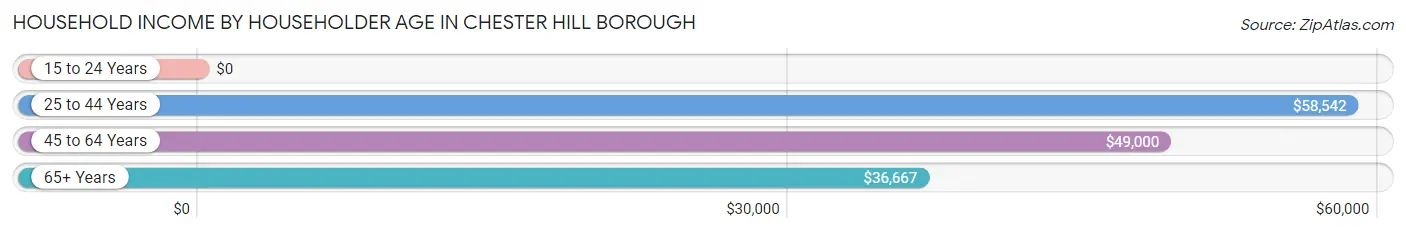
Household Income by Householder Age in Chester Hill borough
The median household income in Chester Hill borough is $48,438, with the highest median household income of $58,542 found in the 25 to 44 years age bracket for the primary householder. A total of 91 households (30.8%) fall into this category. Meanwhile, the 15 to 24 years age bracket for the primary householder has the lowest median household income of $0, with 12 households (4.1%) in this group.
| Income Bracket | # Households | Median Income |
| 15 to 24 Years | 12 (4.1%) | $0 |
| 25 to 44 Years | 91 (30.8%) | $58,542 |
| 45 to 64 Years | 112 (38.0%) | $49,000 |
| 65+ Years | 80 (27.1%) | $36,667 |
| Total | 295 (100.0%) | $48,438 |
Poverty in Chester Hill borough
Income Below Poverty by Sex and Age in Chester Hill borough
With 15.4% poverty level for males and 26.6% for females among the residents of Chester Hill borough, 12 to 14 year old males and 5 year old females are the most vulnerable to poverty, with 4 males (100.0%) and 9 females (100.0%) in their respective age groups living below the poverty level.
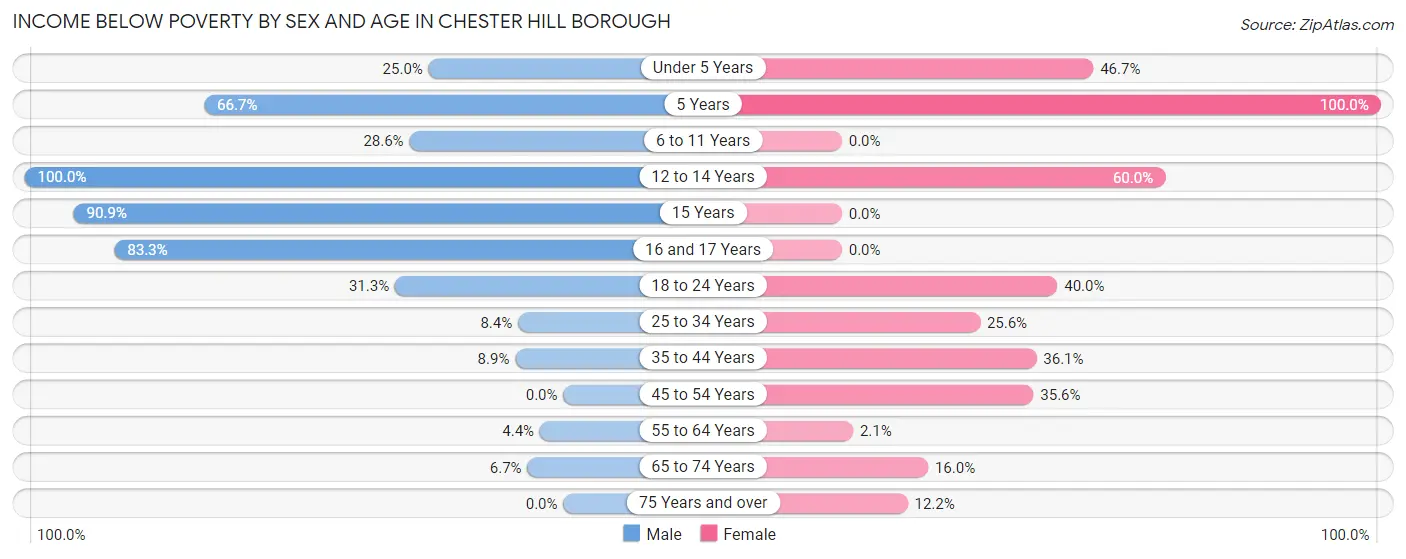
| Age Bracket | Male | Female |
| Under 5 Years | 2 (25.0%) | 7 (46.7%) |
| 5 Years | 2 (66.7%) | 9 (100.0%) |
| 6 to 11 Years | 10 (28.6%) | 0 (0.0%) |
| 12 to 14 Years | 4 (100.0%) | 6 (60.0%) |
| 15 Years | 10 (90.9%) | 0 (0.0%) |
| 16 and 17 Years | 10 (83.3%) | 0 (0.0%) |
| 18 to 24 Years | 5 (31.2%) | 10 (40.0%) |
| 25 to 34 Years | 11 (8.4%) | 10 (25.6%) |
| 35 to 44 Years | 5 (8.9%) | 13 (36.1%) |
| 45 to 54 Years | 0 (0.0%) | 16 (35.6%) |
| 55 to 64 Years | 2 (4.3%) | 1 (2.1%) |
| 65 to 74 Years | 2 (6.7%) | 4 (16.0%) |
| 75 Years and over | 0 (0.0%) | 5 (12.2%) |
| Total | 63 (15.4%) | 81 (26.6%) |
Income Above Poverty by Sex and Age in Chester Hill borough
According to the poverty statistics in Chester Hill borough, males aged 45 to 54 years and females aged 6 to 11 years are the age groups that are most secure financially, with 100.0% of males and 100.0% of females in these age groups living above the poverty line.
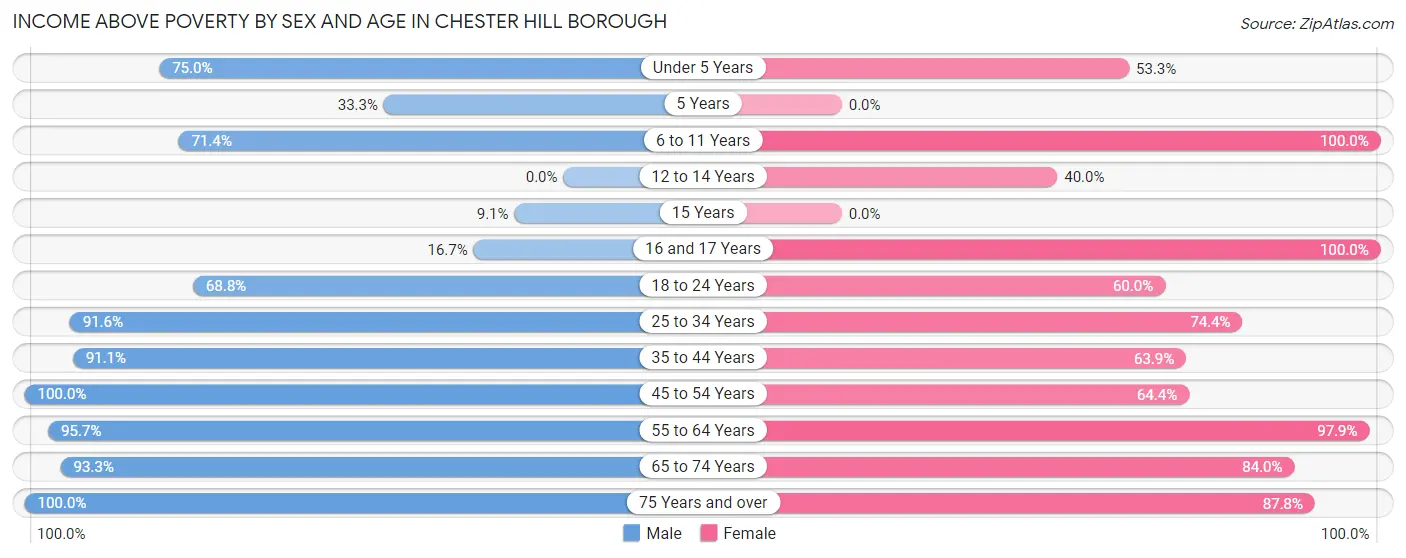
| Age Bracket | Male | Female |
| Under 5 Years | 6 (75.0%) | 8 (53.3%) |
| 5 Years | 1 (33.3%) | 0 (0.0%) |
| 6 to 11 Years | 25 (71.4%) | 5 (100.0%) |
| 12 to 14 Years | 0 (0.0%) | 4 (40.0%) |
| 15 Years | 1 (9.1%) | 0 (0.0%) |
| 16 and 17 Years | 2 (16.7%) | 7 (100.0%) |
| 18 to 24 Years | 11 (68.8%) | 15 (60.0%) |
| 25 to 34 Years | 120 (91.6%) | 29 (74.4%) |
| 35 to 44 Years | 51 (91.1%) | 23 (63.9%) |
| 45 to 54 Years | 39 (100.0%) | 29 (64.4%) |
| 55 to 64 Years | 44 (95.7%) | 47 (97.9%) |
| 65 to 74 Years | 28 (93.3%) | 21 (84.0%) |
| 75 Years and over | 18 (100.0%) | 36 (87.8%) |
| Total | 346 (84.6%) | 224 (73.4%) |
Income Below Poverty Among Married-Couple Families in Chester Hill borough
The poverty statistics for married-couple families in Chester Hill borough show that 4.4% or 4 of the total 90 families live below the poverty line. Families with 3 or 4 children have the highest poverty rate of 14.3%, comprising of 1 families. On the other hand, families with 1 or 2 children have the lowest poverty rate of 0.0%, which includes 0 families.
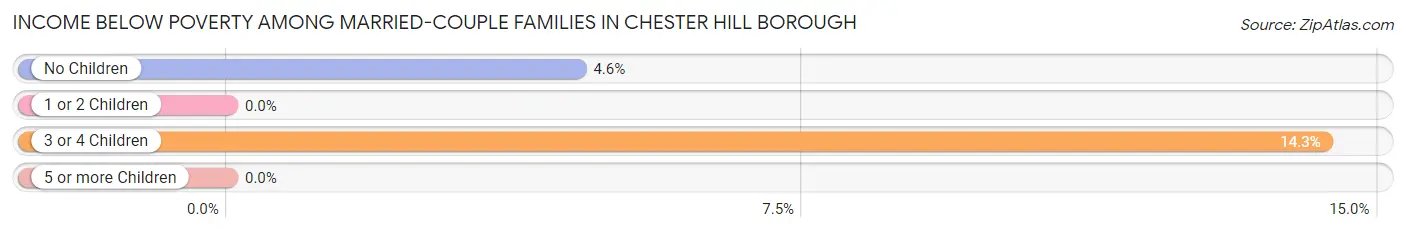
| Children | Above Poverty | Below Poverty |
| No Children | 63 (95.5%) | 3 (4.5%) |
| 1 or 2 Children | 17 (100.0%) | 0 (0.0%) |
| 3 or 4 Children | 6 (85.7%) | 1 (14.3%) |
| 5 or more Children | 0 (0.0%) | 0 (0.0%) |
| Total | 86 (95.6%) | 4 (4.4%) |
Income Below Poverty Among Single-Parent Households in Chester Hill borough
According to the poverty data in Chester Hill borough, 40.0% or 6 single-father households and 61.8% or 34 single-mother households are living below the poverty line. Among single-father households, those with no children have the highest poverty rate, with 2 households (100.0%) experiencing poverty. Likewise, among single-mother households, those with 3 or 4 children have the highest poverty rate, with 2 households (100.0%) falling below the poverty line.
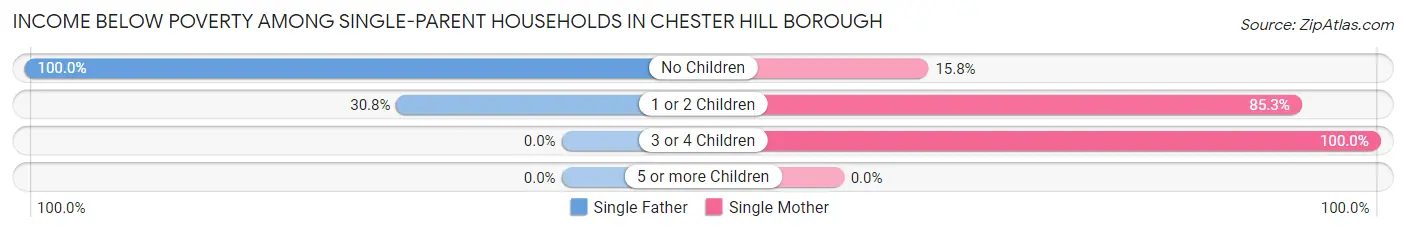
| Children | Single Father | Single Mother |
| No Children | 2 (100.0%) | 3 (15.8%) |
| 1 or 2 Children | 4 (30.8%) | 29 (85.3%) |
| 3 or 4 Children | 0 (0.0%) | 2 (100.0%) |
| 5 or more Children | 0 (0.0%) | 0 (0.0%) |
| Total | 6 (40.0%) | 34 (61.8%) |
Income Below Poverty Among Married-Couple vs Single-Parent Households in Chester Hill borough
The poverty data for Chester Hill borough shows that 4 of the married-couple family households (4.4%) and 40 of the single-parent households (57.1%) are living below the poverty level. Within the married-couple family households, those with 3 or 4 children have the highest poverty rate, with 1 households (14.3%) falling below the poverty line. Among the single-parent households, those with 3 or 4 children have the highest poverty rate, with 2 household (100.0%) living below poverty.
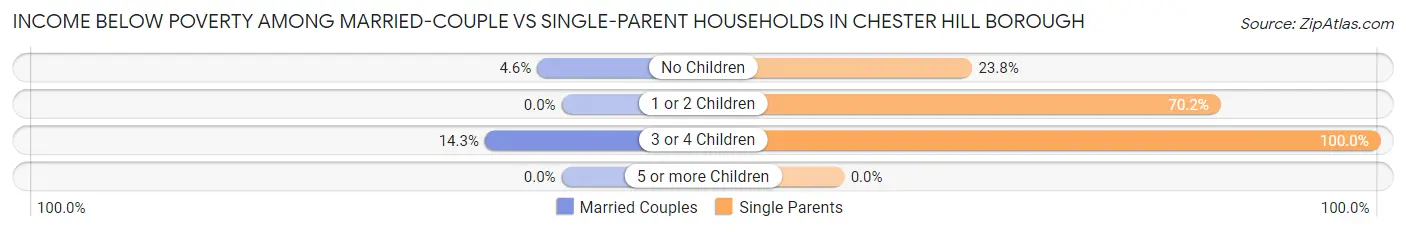
| Children | Married-Couple Families | Single-Parent Households |
| No Children | 3 (4.5%) | 5 (23.8%) |
| 1 or 2 Children | 0 (0.0%) | 33 (70.2%) |
| 3 or 4 Children | 1 (14.3%) | 2 (100.0%) |
| 5 or more Children | 0 (0.0%) | 0 (0.0%) |
| Total | 4 (4.4%) | 40 (57.1%) |
Race in Chester Hill borough
The most populous races in Chester Hill borough are White / Caucasian (646 | 90.1%), Two or more Races (65 | 9.1%), and Asian (6 | 0.8%).
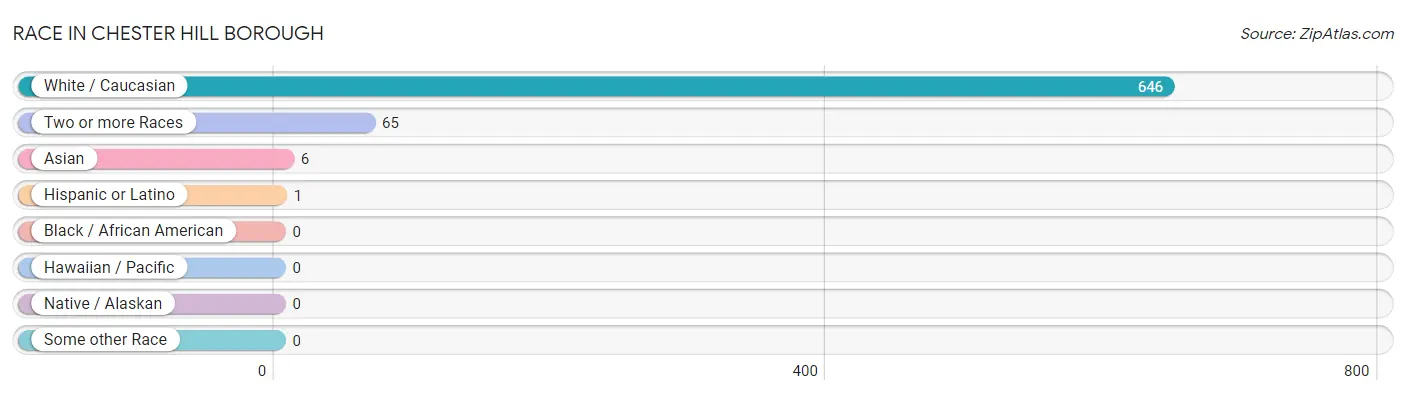
| Race | # Population | % Population |
| Asian | 6 | 0.8% |
| Black / African American | 0 | 0.0% |
| Hawaiian / Pacific | 0 | 0.0% |
| Hispanic or Latino | 1 | 0.1% |
| Native / Alaskan | 0 | 0.0% |
| White / Caucasian | 646 | 90.1% |
| Two or more Races | 65 | 9.1% |
| Some other Race | 0 | 0.0% |
| Total | 717 | 100.0% |
Ancestry in Chester Hill borough
The most populous ancestries reported in Chester Hill borough are German (137 | 19.1%), American (72 | 10.0%), Italian (71 | 9.9%), English (65 | 9.1%), and Irish (49 | 6.8%), together accounting for 54.9% of all Chester Hill borough residents.
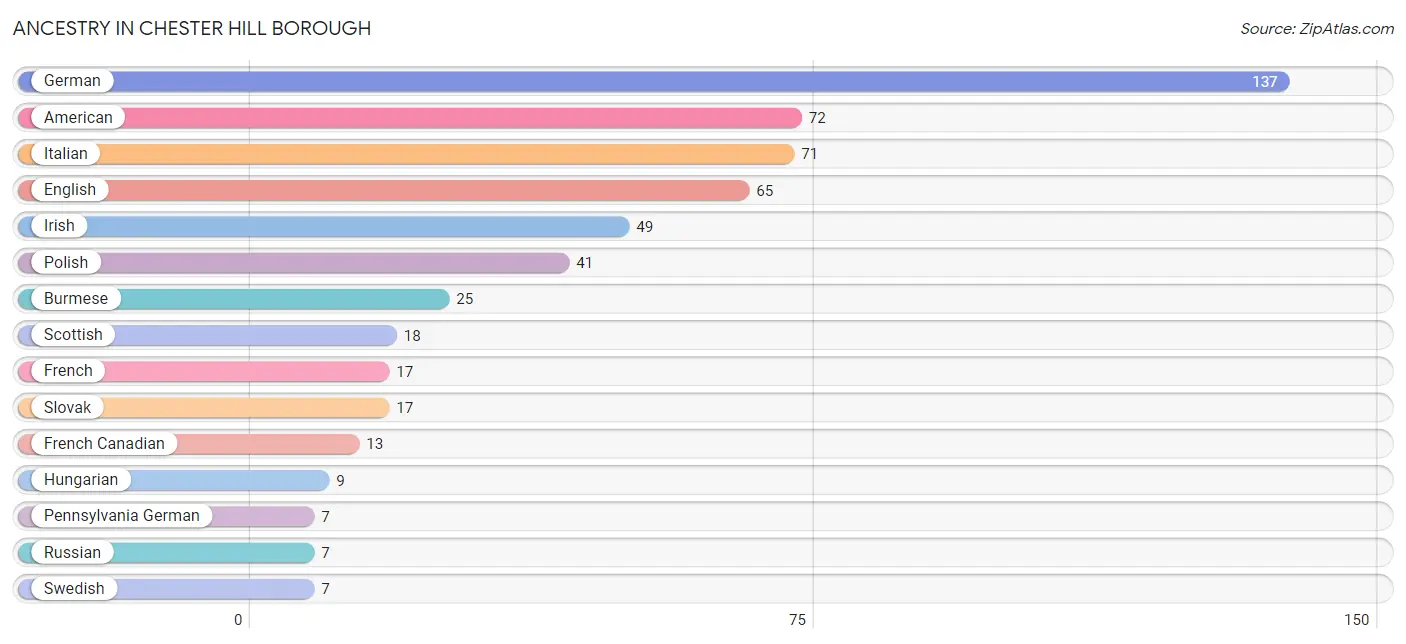
| Ancestry | # Population | % Population |
| American | 72 | 10.0% |
| Austrian | 4 | 0.6% |
| British | 2 | 0.3% |
| Burmese | 25 | 3.5% |
| Cherokee | 1 | 0.1% |
| Czech | 3 | 0.4% |
| Dutch | 5 | 0.7% |
| Eastern European | 2 | 0.3% |
| English | 65 | 9.1% |
| European | 2 | 0.3% |
| Finnish | 2 | 0.3% |
| French | 17 | 2.4% |
| French Canadian | 13 | 1.8% |
| German | 137 | 19.1% |
| Hungarian | 9 | 1.3% |
| Irish | 49 | 6.8% |
| Italian | 71 | 9.9% |
| Mexican | 1 | 0.1% |
| Pennsylvania German | 7 | 1.0% |
| Polish | 41 | 5.7% |
| Russian | 7 | 1.0% |
| Scotch-Irish | 4 | 0.6% |
| Scottish | 18 | 2.5% |
| Slovak | 17 | 2.4% |
| Swedish | 7 | 1.0% |
| Ukrainian | 5 | 0.7% |
| Ute | 1 | 0.1% |
| Welsh | 1 | 0.1% | View All 28 Rows |
Immigrants in Chester Hill borough
The most numerous immigrant groups reported in Chester Hill borough came from Asia (6 | 0.8%), Eastern Asia (6 | 0.8%), and Korea (6 | 0.8%), together accounting for 2.5% of all Chester Hill borough residents.
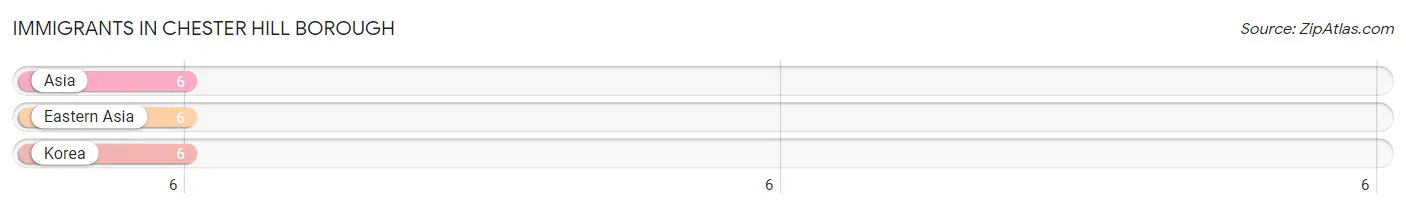
| Immigration Origin | # Population | % Population |
| Asia | 6 | 0.8% |
| Eastern Asia | 6 | 0.8% |
| Korea | 6 | 0.8% | View All 3 Rows |
Sex and Age in Chester Hill borough
Sex and Age in Chester Hill borough
The most populous age groups in Chester Hill borough are 30 to 34 Years (85 | 20.8%) for men and 50 to 54 Years (33 | 10.7%) for women.
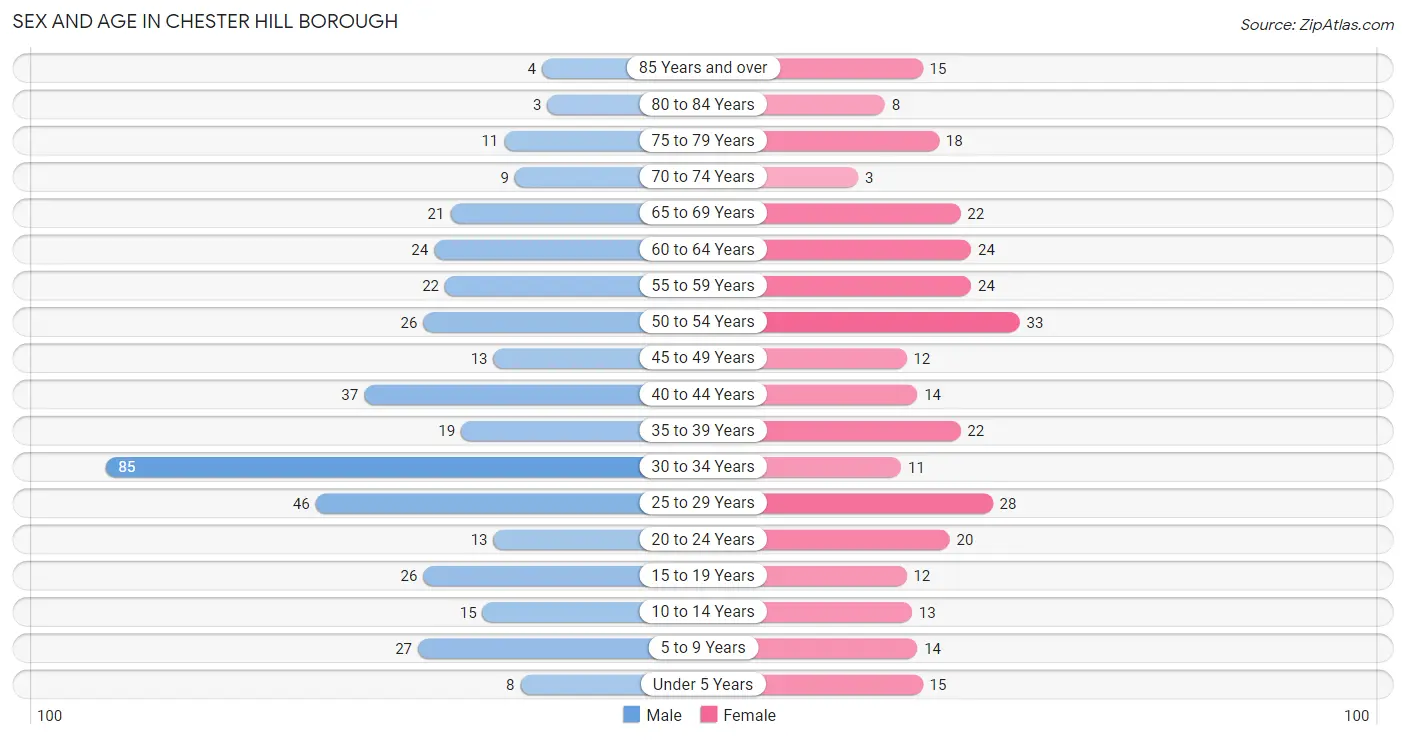
| Age Bracket | Male | Female |
| Under 5 Years | 8 (2.0%) | 15 (4.9%) |
| 5 to 9 Years | 27 (6.6%) | 14 (4.5%) |
| 10 to 14 Years | 15 (3.7%) | 13 (4.2%) |
| 15 to 19 Years | 26 (6.4%) | 12 (3.9%) |
| 20 to 24 Years | 13 (3.2%) | 20 (6.5%) |
| 25 to 29 Years | 46 (11.3%) | 28 (9.1%) |
| 30 to 34 Years | 85 (20.8%) | 11 (3.6%) |
| 35 to 39 Years | 19 (4.6%) | 22 (7.1%) |
| 40 to 44 Years | 37 (9.0%) | 14 (4.5%) |
| 45 to 49 Years | 13 (3.2%) | 12 (3.9%) |
| 50 to 54 Years | 26 (6.4%) | 33 (10.7%) |
| 55 to 59 Years | 22 (5.4%) | 24 (7.8%) |
| 60 to 64 Years | 24 (5.9%) | 24 (7.8%) |
| 65 to 69 Years | 21 (5.1%) | 22 (7.1%) |
| 70 to 74 Years | 9 (2.2%) | 3 (1.0%) |
| 75 to 79 Years | 11 (2.7%) | 18 (5.8%) |
| 80 to 84 Years | 3 (0.7%) | 8 (2.6%) |
| 85 Years and over | 4 (1.0%) | 15 (4.9%) |
| Total | 409 (100.0%) | 308 (100.0%) |
Families and Households in Chester Hill borough
Median Family Size in Chester Hill borough
The median family size in Chester Hill borough is 3.28 persons per family, with single female/mother families (55 | 34.4%) accounting for the largest median family size of 3.91 persons per family. On the other hand, single male/father families (15 | 9.4%) represent the smallest median family size with 1.87 persons per family.
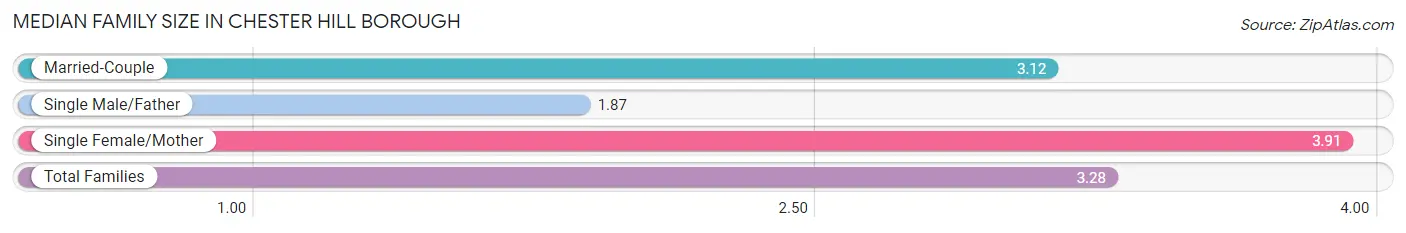
| Family Type | # Families | Family Size |
| Married-Couple | 90 (56.2%) | 3.12 |
| Single Male/Father | 15 (9.4%) | 1.87 |
| Single Female/Mother | 55 (34.4%) | 3.91 |
| Total Families | 160 (100.0%) | 3.28 |
Median Household Size in Chester Hill borough
The median household size in Chester Hill borough is 2.43 persons per household, with single female/mother households (55 | 18.6%) accounting for the largest median household size of 3.95 persons per household. non-family households (135 | 45.8%) represent the smallest median household size with 1.36 persons per household.
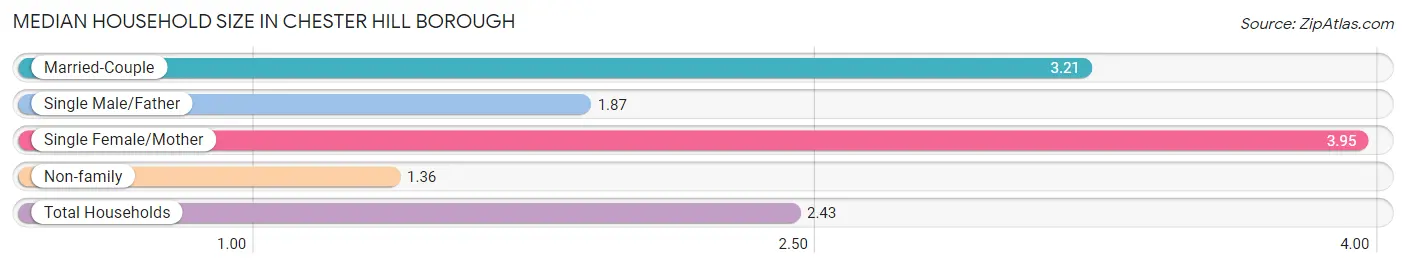
| Household Type | # Households | Household Size |
| Married-Couple | 90 (30.5%) | 3.21 |
| Single Male/Father | 15 (5.1%) | 1.87 |
| Single Female/Mother | 55 (18.6%) | 3.95 |
| Non-family | 135 (45.8%) | 1.36 |
| Total Households | 295 (100.0%) | 2.43 |
Household Size by Marriage Status in Chester Hill borough
Out of a total of 295 households in Chester Hill borough, 160 (54.2%) are family households, while 135 (45.8%) are nonfamily households. The most numerous type of family households are 2-person households, comprising 87, and the most common type of nonfamily households are 1-person households, comprising 109.
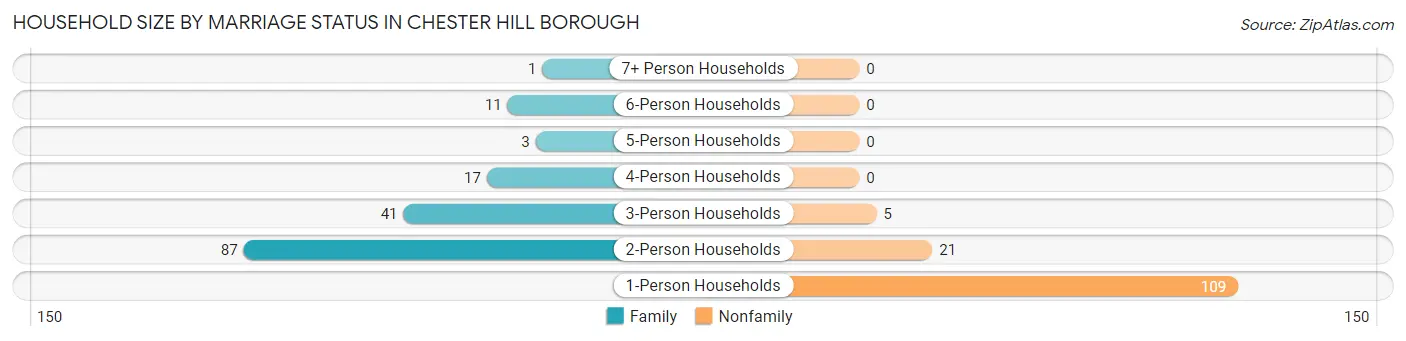
| Household Size | Family Households | Nonfamily Households |
| 1-Person Households | - | 109 (36.9%) |
| 2-Person Households | 87 (29.5%) | 21 (7.1%) |
| 3-Person Households | 41 (13.9%) | 5 (1.7%) |
| 4-Person Households | 17 (5.8%) | 0 (0.0%) |
| 5-Person Households | 3 (1.0%) | 0 (0.0%) |
| 6-Person Households | 11 (3.7%) | 0 (0.0%) |
| 7+ Person Households | 1 (0.3%) | 0 (0.0%) |
| Total | 160 (54.2%) | 135 (45.8%) |
Female Fertility in Chester Hill borough
Fertility by Age in Chester Hill borough
Average fertility rate in Chester Hill borough is 102.0 births per 1,000 women. Women in the age bracket of 20 to 34 years have the highest fertility rate with 220.0 births per 1,000 women. Women in the age bracket of 20 to 34 years acount for 100.0% of all women with births.
| Age Bracket | Women with Births | Births / 1,000 Women |
| 15 to 19 years | 0 (0.0%) | 0.0 |
| 20 to 34 years | 13 (100.0%) | 220.0 |
| 35 to 50 years | 0 (0.0%) | 0.0 |
| Total | 13 (100.0%) | 102.0 |
Fertility by Age by Marriage Status in Chester Hill borough
76.9% of women with births (13) in Chester Hill borough are married. The highest percentage of unmarried women with births falls into 20 to 34 years age bracket with 23.1% of them unmarried at the time of birth, while the lowest percentage of unmarried women with births belong to 20 to 34 years age bracket with 23.1% of them unmarried.
| Age Bracket | Married | Unmarried |
| 15 to 19 years | 0 (0.0%) | 0 (0.0%) |
| 20 to 34 years | 10 (76.9%) | 3 (23.1%) |
| 35 to 50 years | 0 (0.0%) | 0 (0.0%) |
| Total | 10 (76.9%) | 3 (23.1%) |
Fertility by Education in Chester Hill borough
| Educational Attainment | Women with Births | Births / 1,000 Women |
| Less than High School | 11 (84.6%) | 478.0 |
| High School Diploma | 0 (0.0%) | 0.0 |
| College or Associate's Degree | 2 (15.4%) | 80.0 |
| Bachelor's Degree | 0 (0.0%) | 0.0 |
| Graduate Degree | 0 (0.0%) | 0.0 |
| Total | 13 (100.0%) | 102.0 |
Fertility by Education by Marriage Status in Chester Hill borough
23.1% of women with births in Chester Hill borough are unmarried. Women with the educational attainment of college or associate's degree are most likely to be married with 100.0% of them married at childbirth, while women with the educational attainment of less than high school are least likely to be married with 27.3% of them unmarried at childbirth.
| Educational Attainment | Married | Unmarried |
| Less than High School | 8 (72.7%) | 3 (27.3%) |
| High School Diploma | 0 (0.0%) | 0 (0.0%) |
| College or Associate's Degree | 2 (100.0%) | 0 (0.0%) |
| Bachelor's Degree | 0 (0.0%) | 0 (0.0%) |
| Graduate Degree | 0 (0.0%) | 0 (0.0%) |
| Total | 10 (76.9%) | 3 (23.1%) |
Employment Characteristics in Chester Hill borough
Employment by Class of Employer in Chester Hill borough
Among the 360 employed individuals in Chester Hill borough, private company employees (237 | 65.8%), not-for-profit organizations (42 | 11.7%), and self-employed (not incorporated) (26 | 7.2%) make up the most common classes of employment.
| Employer Class | # Employees | % Employees |
| Private Company Employees | 237 | 65.8% |
| Self-Employed (Incorporated) | 5 | 1.4% |
| Self-Employed (Not Incorporated) | 26 | 7.2% |
| Not-for-profit Organizations | 42 | 11.7% |
| Local Government Employees | 25 | 6.9% |
| State Government Employees | 13 | 3.6% |
| Federal Government Employees | 12 | 3.3% |
| Unpaid Family Workers | 0 | 0.0% |
| Total | 360 | 100.0% |
Employment Status by Age in Chester Hill borough
According to the labor force statistics for Chester Hill borough, out of the total population over 16 years of age (614), 63.7% or 391 individuals are in the labor force, with 6.2% or 24 of them unemployed. The age group with the highest labor force participation rate is 20 to 24 years, with 93.9% or 31 individuals in the labor force. Within the labor force, the 20 to 24 years age range has the highest percentage of unemployed individuals, with 41.9% or 13 of them being unemployed.
| Age Bracket | In Labor Force | Unemployed |
| 16 to 19 Years | 7 (25.9%) | 0 (0.0%) |
| 20 to 24 Years | 31 (93.9%) | 13 (41.9%) |
| 25 to 29 Years | 38 (51.4%) | 0 (0.0%) |
| 30 to 34 Years | 89 (92.7%) | 11 (12.4%) |
| 35 to 44 Years | 86 (93.5%) | 0 (0.0%) |
| 45 to 54 Years | 56 (66.7%) | 0 (0.0%) |
| 55 to 59 Years | 36 (78.3%) | 0 (0.0%) |
| 60 to 64 Years | 22 (45.8%) | 0 (0.0%) |
| 65 to 74 Years | 15 (27.3%) | 0 (0.0%) |
| 75 Years and over | 11 (18.6%) | 0 (0.0%) |
| Total | 391 (63.7%) | 24 (6.2%) |
Employment Status by Educational Attainment in Chester Hill borough
According to labor force statistics for Chester Hill borough, 74.3% of individuals (327) out of the total population between 25 and 64 years of age (440) are in the labor force, with 3.4% or 11 of them being unemployed. The group with the highest labor force participation rate are those with the educational attainment of college / associate degree, with 84.8% or 89 individuals in the labor force. Within the labor force, individuals with high school diploma education have the highest percentage of unemployment, with 8.0% or 11 of them being unemployed.
| Educational Attainment | In Labor Force | Unemployed |
| Less than High School | 57 (68.7%) | 0 (0.0%) |
| High School Diploma | 138 (69.7%) | 16 (8.0%) |
| College / Associate Degree | 89 (84.8%) | 0 (0.0%) |
| Bachelor's Degree or higher | 43 (79.6%) | 0 (0.0%) |
| Total | 327 (74.3%) | 15 (3.4%) |
Employment Occupations by Sex in Chester Hill borough
Management, Business, Science and Arts Occupations
The most common Management, Business, Science and Arts occupations in Chester Hill borough are Health Diagnosing & Treating (35 | 9.6%), Management (31 | 8.5%), Community & Social Service (24 | 6.6%), Education Instruction & Library (17 | 4.7%), and Computers, Engineering & Science (15 | 4.1%).
Management, Business, Science and Arts Occupations by Sex
Within the Management, Business, Science and Arts occupations in Chester Hill borough, the most male-oriented occupations are Computers & Mathematics (100.0%), Architecture & Engineering (100.0%), and Education, Arts & Media (100.0%), while the most female-oriented occupations are Life, Physical & Social Science (100.0%), Legal Services & Support (100.0%), and Health Technologists (100.0%).
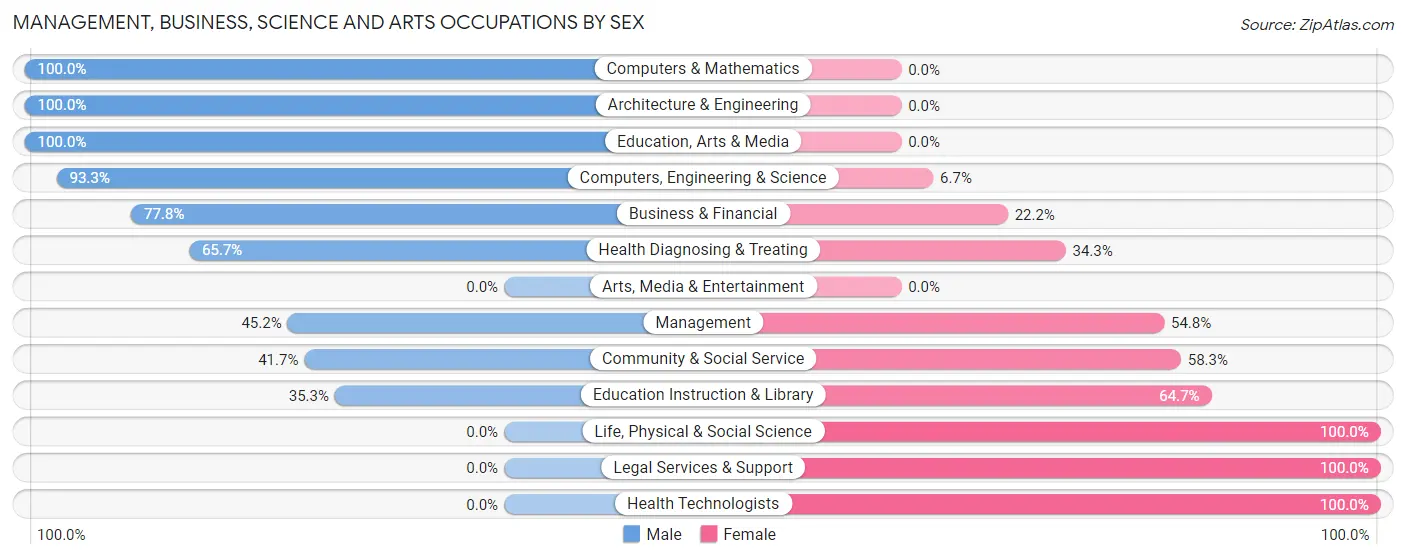
| Occupation | Male | Female |
| Management | 14 (45.2%) | 17 (54.8%) |
| Business & Financial | 7 (77.8%) | 2 (22.2%) |
| Computers, Engineering & Science | 14 (93.3%) | 1 (6.7%) |
| Computers & Mathematics | 6 (100.0%) | 0 (0.0%) |
| Architecture & Engineering | 8 (100.0%) | 0 (0.0%) |
| Life, Physical & Social Science | 0 (0.0%) | 1 (100.0%) |
| Community & Social Service | 10 (41.7%) | 14 (58.3%) |
| Education, Arts & Media | 4 (100.0%) | 0 (0.0%) |
| Legal Services & Support | 0 (0.0%) | 3 (100.0%) |
| Education Instruction & Library | 6 (35.3%) | 11 (64.7%) |
| Arts, Media & Entertainment | 0 (0.0%) | 0 (0.0%) |
| Health Diagnosing & Treating | 23 (65.7%) | 12 (34.3%) |
| Health Technologists | 0 (0.0%) | 7 (100.0%) |
| Total (Category) | 68 (59.7%) | 46 (40.4%) |
| Total (Overall) | 223 (61.1%) | 142 (38.9%) |
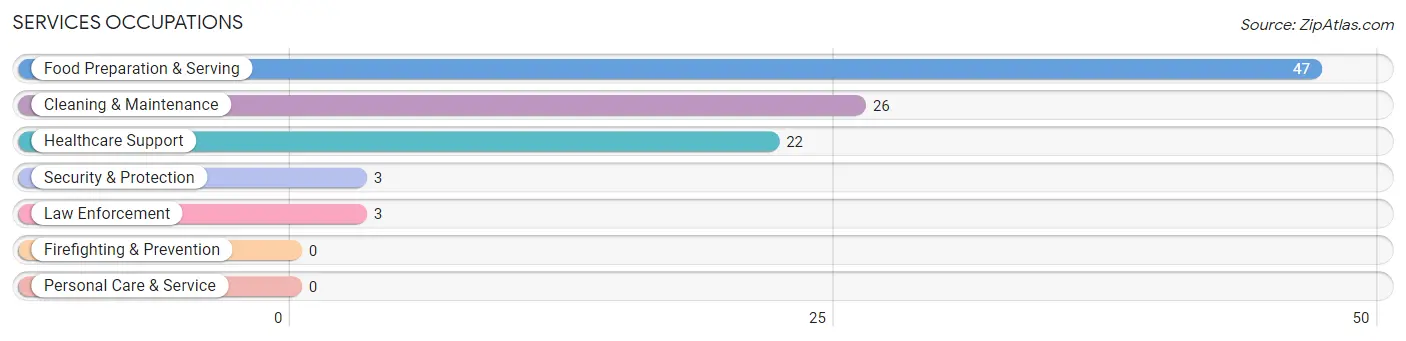
Services Occupations
The most common Services occupations in Chester Hill borough are Food Preparation & Serving (47 | 12.9%), Cleaning & Maintenance (26 | 7.1%), Healthcare Support (22 | 6.0%), Security & Protection (3 | 0.8%), and Law Enforcement (3 | 0.8%).
Services Occupations by Sex
Within the Services occupations in Chester Hill borough, the most male-oriented occupations are Security & Protection (100.0%), Law Enforcement (100.0%), and Food Preparation & Serving (89.4%), while the most female-oriented occupations are Healthcare Support (100.0%), Cleaning & Maintenance (23.1%), and Food Preparation & Serving (10.6%).
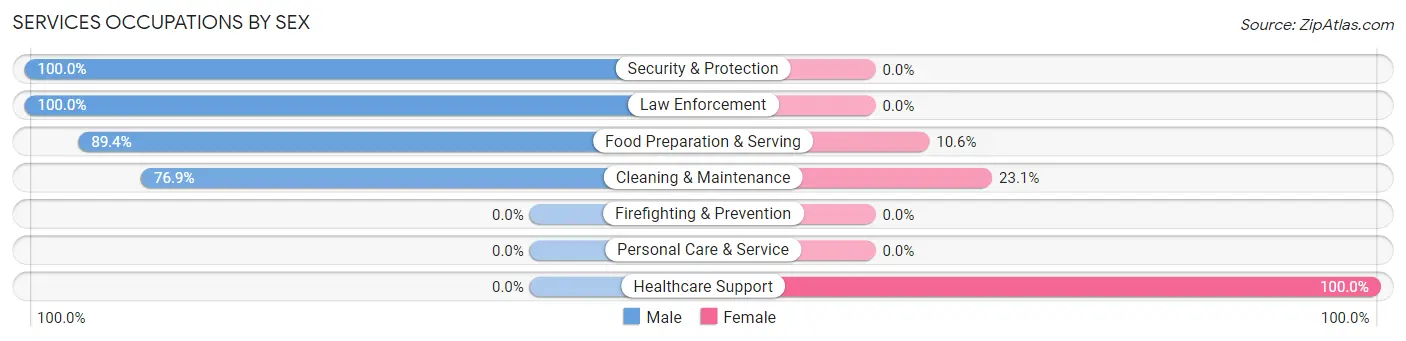
| Occupation | Male | Female |
| Healthcare Support | 0 (0.0%) | 22 (100.0%) |
| Security & Protection | 3 (100.0%) | 0 (0.0%) |
| Firefighting & Prevention | 0 (0.0%) | 0 (0.0%) |
| Law Enforcement | 3 (100.0%) | 0 (0.0%) |
| Food Preparation & Serving | 42 (89.4%) | 5 (10.6%) |
| Cleaning & Maintenance | 20 (76.9%) | 6 (23.1%) |
| Personal Care & Service | 0 (0.0%) | 0 (0.0%) |
| Total (Category) | 65 (66.3%) | 33 (33.7%) |
| Total (Overall) | 223 (61.1%) | 142 (38.9%) |
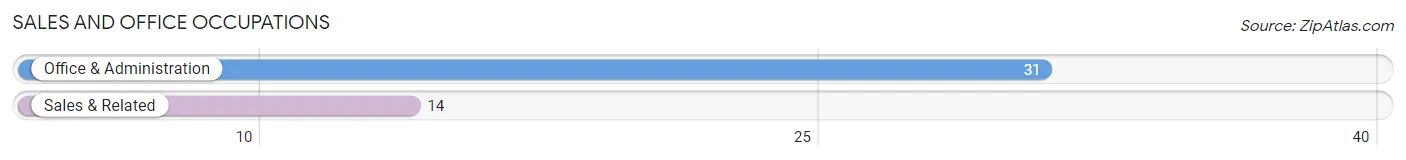
Sales and Office Occupations
The most common Sales and Office occupations in Chester Hill borough are Office & Administration (31 | 8.5%), and Sales & Related (14 | 3.8%).
Sales and Office Occupations by Sex
| Occupation | Male | Female |
| Sales & Related | 7 (50.0%) | 7 (50.0%) |
| Office & Administration | 9 (29.0%) | 22 (71.0%) |
| Total (Category) | 16 (35.6%) | 29 (64.4%) |
| Total (Overall) | 223 (61.1%) | 142 (38.9%) |
Natural Resources, Construction and Maintenance Occupations
The most common Natural Resources, Construction and Maintenance occupations in Chester Hill borough are Construction & Extraction (9 | 2.5%), and Installation, Maintenance & Repair (2 | 0.5%).
Natural Resources, Construction and Maintenance Occupations by Sex
| Occupation | Male | Female |
| Farming, Fishing & Forestry | 0 (0.0%) | 0 (0.0%) |
| Construction & Extraction | 9 (100.0%) | 0 (0.0%) |
| Installation, Maintenance & Repair | 2 (100.0%) | 0 (0.0%) |
| Total (Category) | 11 (100.0%) | 0 (0.0%) |
| Total (Overall) | 223 (61.1%) | 142 (38.9%) |
Production, Transportation and Moving Occupations
The most common Production, Transportation and Moving occupations in Chester Hill borough are Production (40 | 11.0%), Material Moving (38 | 10.4%), and Transportation (19 | 5.2%).
Production, Transportation and Moving Occupations by Sex
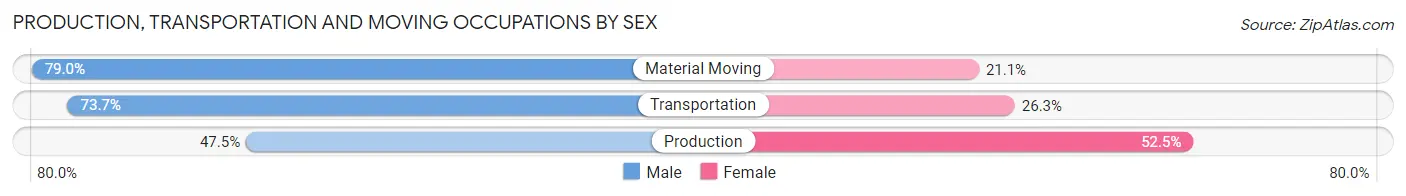
| Occupation | Male | Female |
| Production | 19 (47.5%) | 21 (52.5%) |
| Transportation | 14 (73.7%) | 5 (26.3%) |
| Material Moving | 30 (78.9%) | 8 (21.0%) |
| Total (Category) | 63 (64.9%) | 34 (35.0%) |
| Total (Overall) | 223 (61.1%) | 142 (38.9%) |
Employment Industries by Sex in Chester Hill borough
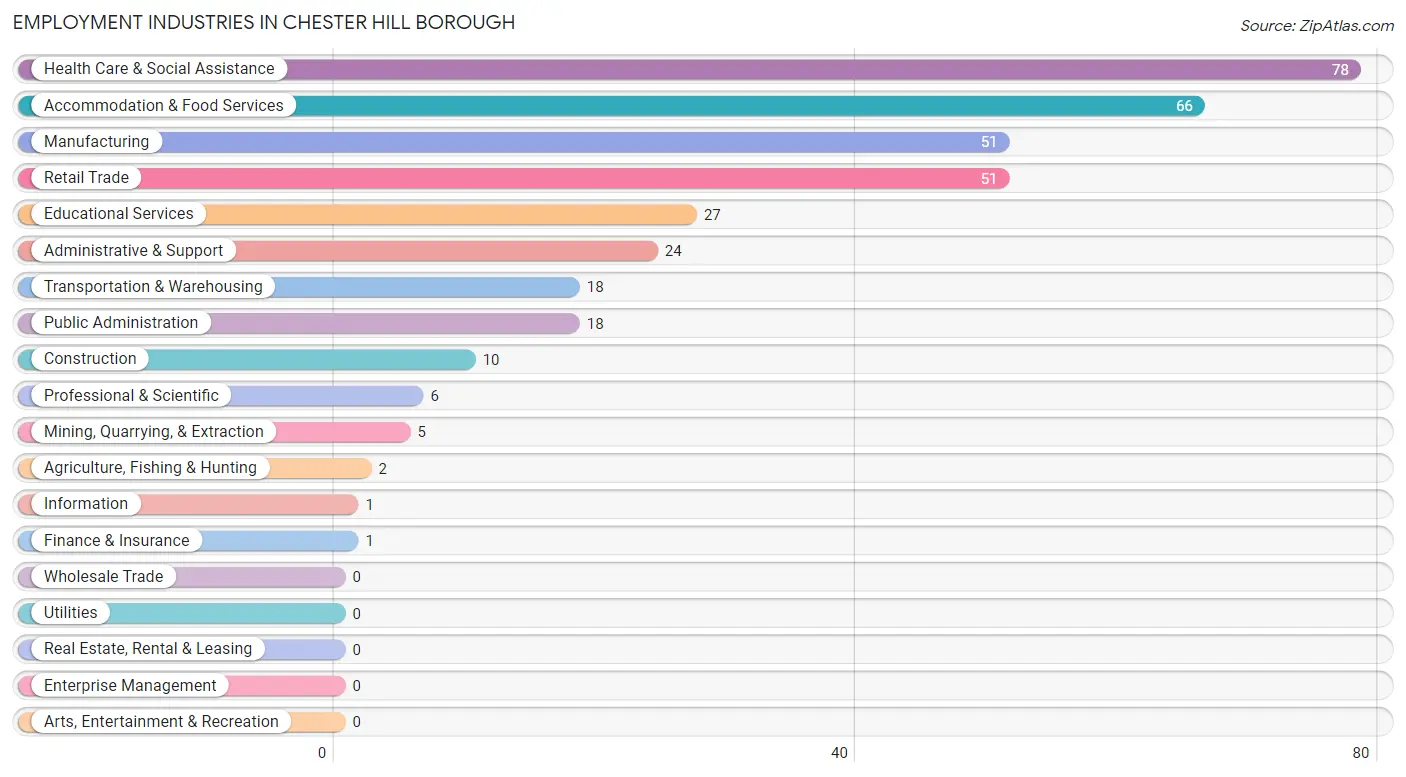
Employment Industries in Chester Hill borough
The major employment industries in Chester Hill borough include Health Care & Social Assistance (78 | 21.4%), Accommodation & Food Services (66 | 18.1%), Manufacturing (51 | 14.0%), Retail Trade (51 | 14.0%), and Educational Services (27 | 7.4%).
Employment Industries by Sex in Chester Hill borough
The Chester Hill borough industries that see more men than women are Agriculture, Fishing & Hunting (100.0%), Mining, Quarrying, & Extraction (100.0%), and Construction (100.0%), whereas the industries that tend to have a higher number of women are Finance & Insurance (100.0%), Health Care & Social Assistance (65.4%), and Educational Services (59.3%).
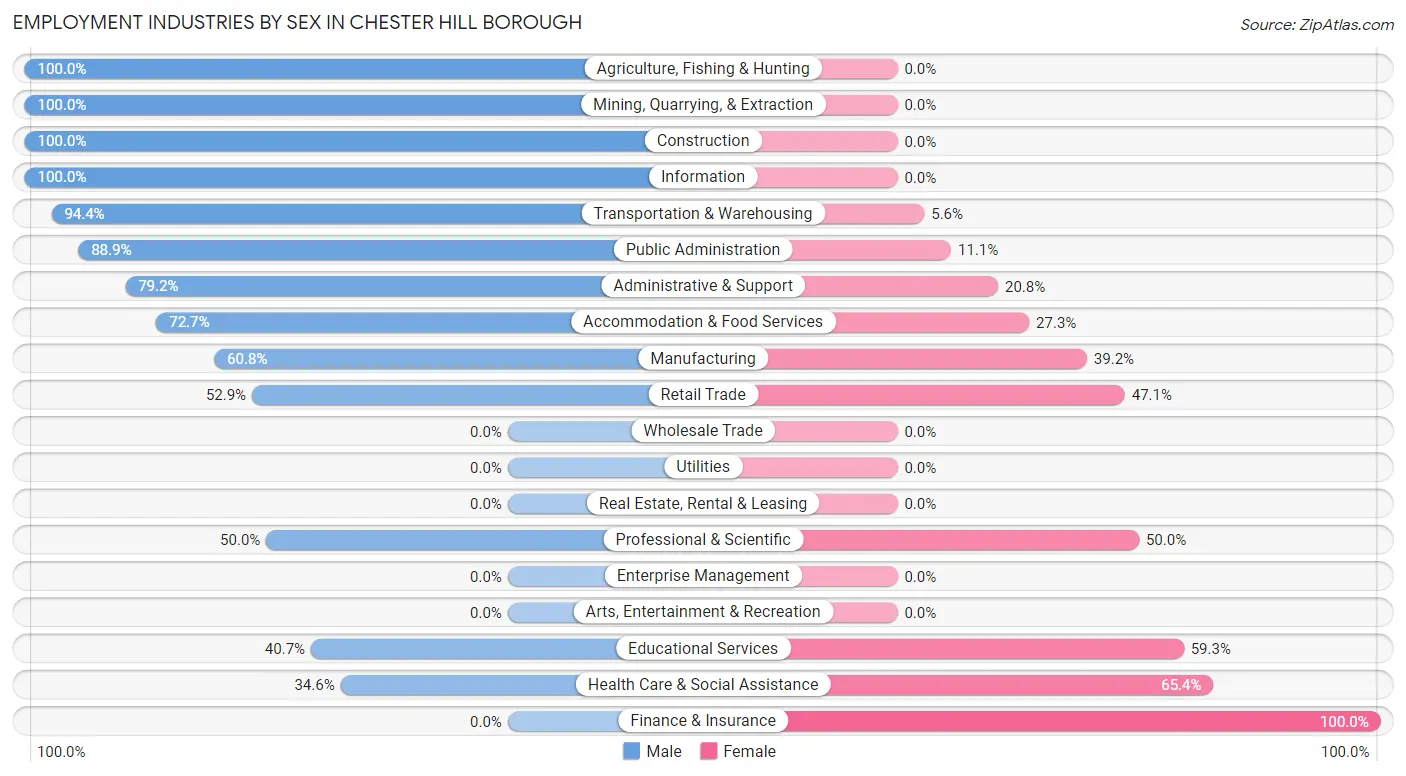
| Industry | Male | Female |
| Agriculture, Fishing & Hunting | 2 (100.0%) | 0 (0.0%) |
| Mining, Quarrying, & Extraction | 5 (100.0%) | 0 (0.0%) |
| Construction | 10 (100.0%) | 0 (0.0%) |
| Manufacturing | 31 (60.8%) | 20 (39.2%) |
| Wholesale Trade | 0 (0.0%) | 0 (0.0%) |
| Retail Trade | 27 (52.9%) | 24 (47.1%) |
| Transportation & Warehousing | 17 (94.4%) | 1 (5.6%) |
| Utilities | 0 (0.0%) | 0 (0.0%) |
| Information | 1 (100.0%) | 0 (0.0%) |
| Finance & Insurance | 0 (0.0%) | 1 (100.0%) |
| Real Estate, Rental & Leasing | 0 (0.0%) | 0 (0.0%) |
| Professional & Scientific | 3 (50.0%) | 3 (50.0%) |
| Enterprise Management | 0 (0.0%) | 0 (0.0%) |
| Administrative & Support | 19 (79.2%) | 5 (20.8%) |
| Educational Services | 11 (40.7%) | 16 (59.3%) |
| Health Care & Social Assistance | 27 (34.6%) | 51 (65.4%) |
| Arts, Entertainment & Recreation | 0 (0.0%) | 0 (0.0%) |
| Accommodation & Food Services | 48 (72.7%) | 18 (27.3%) |
| Public Administration | 16 (88.9%) | 2 (11.1%) |
| Total | 223 (61.1%) | 142 (38.9%) |
Education in Chester Hill borough
School Enrollment in Chester Hill borough
The most common levels of schooling among the 116 students in Chester Hill borough are high school (35 | 30.2%), elementary school (28 | 24.1%), and middle school (28 | 24.1%).
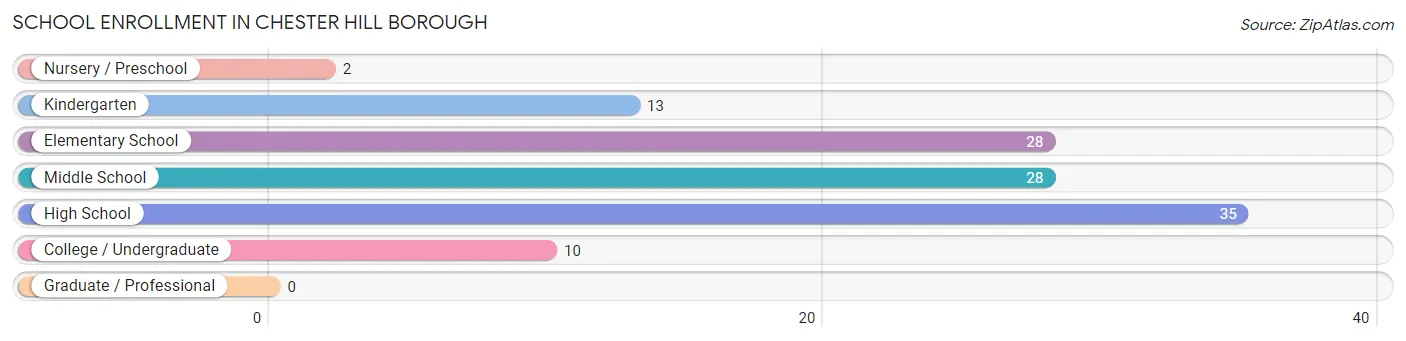
| School Level | # Students | % Students |
| Nursery / Preschool | 2 | 1.7% |
| Kindergarten | 13 | 11.2% |
| Elementary School | 28 | 24.1% |
| Middle School | 28 | 24.1% |
| High School | 35 | 30.2% |
| College / Undergraduate | 10 | 8.6% |
| Graduate / Professional | 0 | 0.0% |
| Total | 116 | 100.0% |
School Enrollment by Age by Funding Source in Chester Hill borough
Out of a total of 116 students who are enrolled in schools in Chester Hill borough, 2 (1.7%) attend a private institution, while the remaining 114 (98.3%) are enrolled in public schools. The age group of 25 to 34 year olds has the highest likelihood of being enrolled in private schools, with 2 (28.6% in the age bracket) enrolled. Conversely, the age group of 3 to 4 year olds has the lowest likelihood of being enrolled in a private school, with 2 (100.0% in the age bracket) attending a public institution.
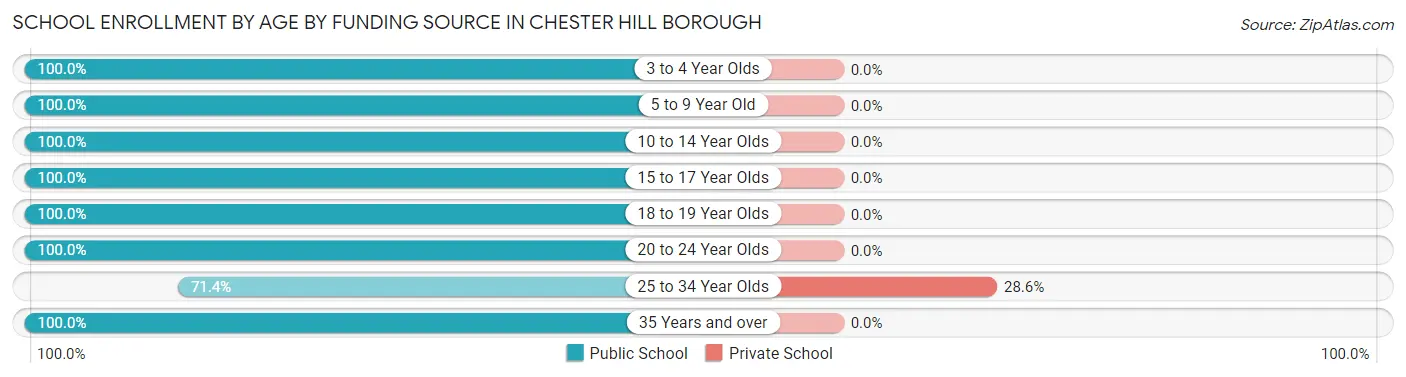
| Age Bracket | Public School | Private School |
| 3 to 4 Year Olds | 2 (100.0%) | 0 (0.0%) |
| 5 to 9 Year Old | 41 (100.0%) | 0 (0.0%) |
| 10 to 14 Year Olds | 28 (100.0%) | 0 (0.0%) |
| 15 to 17 Year Olds | 30 (100.0%) | 0 (0.0%) |
| 18 to 19 Year Olds | 3 (100.0%) | 0 (0.0%) |
| 20 to 24 Year Olds | 2 (100.0%) | 0 (0.0%) |
| 25 to 34 Year Olds | 5 (71.4%) | 2 (28.6%) |
| 35 Years and over | 3 (100.0%) | 0 (0.0%) |
| Total | 114 (98.3%) | 2 (1.7%) |
Educational Attainment by Field of Study in Chester Hill borough
Education (20 | 29.4%), business (10 | 14.7%), social sciences (9 | 13.2%), bio, nature & agricultural (6 | 8.8%), and psychology (6 | 8.8%) are the most common fields of study among 68 individuals in Chester Hill borough who have obtained a bachelor's degree or higher.
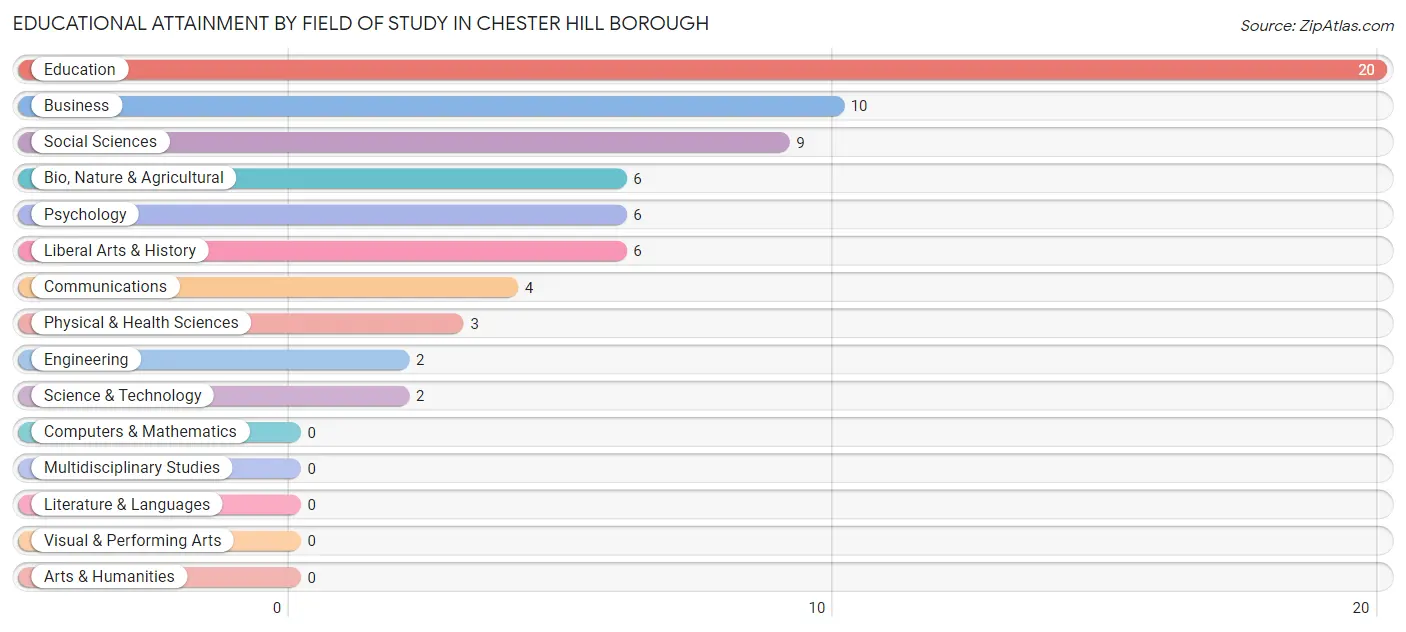
| Field of Study | # Graduates | % Graduates |
| Computers & Mathematics | 0 | 0.0% |
| Bio, Nature & Agricultural | 6 | 8.8% |
| Physical & Health Sciences | 3 | 4.4% |
| Psychology | 6 | 8.8% |
| Social Sciences | 9 | 13.2% |
| Engineering | 2 | 2.9% |
| Multidisciplinary Studies | 0 | 0.0% |
| Science & Technology | 2 | 2.9% |
| Business | 10 | 14.7% |
| Education | 20 | 29.4% |
| Literature & Languages | 0 | 0.0% |
| Liberal Arts & History | 6 | 8.8% |
| Visual & Performing Arts | 0 | 0.0% |
| Communications | 4 | 5.9% |
| Arts & Humanities | 0 | 0.0% |
| Total | 68 | 100.0% |
Transportation & Commute in Chester Hill borough
Vehicle Availability by Sex in Chester Hill borough
The most prevalent vehicle ownership categories in Chester Hill borough are males with 1 vehicle (90, accounting for 40.7%) and females with 1 vehicle (32, making up 64.7%).
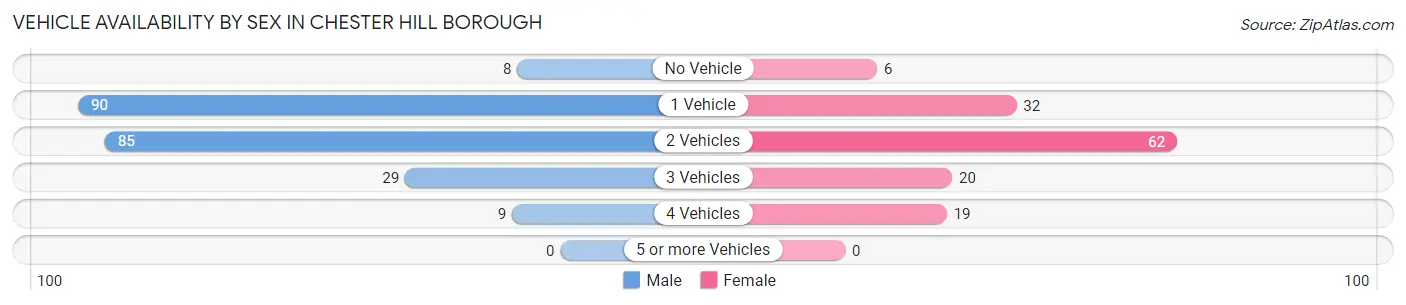
| Vehicles Available | Male | Female |
| No Vehicle | 8 (3.6%) | 6 (4.3%) |
| 1 Vehicle | 90 (40.7%) | 32 (23.0%) |
| 2 Vehicles | 85 (38.5%) | 62 (44.6%) |
| 3 Vehicles | 29 (13.1%) | 20 (14.4%) |
| 4 Vehicles | 9 (4.1%) | 19 (13.7%) |
| 5 or more Vehicles | 0 (0.0%) | 0 (0.0%) |
| Total | 221 (100.0%) | 139 (100.0%) |
Commute Time in Chester Hill borough
The most frequently occuring commute durations in Chester Hill borough are 5 to 9 minutes (93 commuters, 26.6%), 30 to 34 minutes (55 commuters, 15.7%), and 35 to 39 minutes (51 commuters, 14.6%).
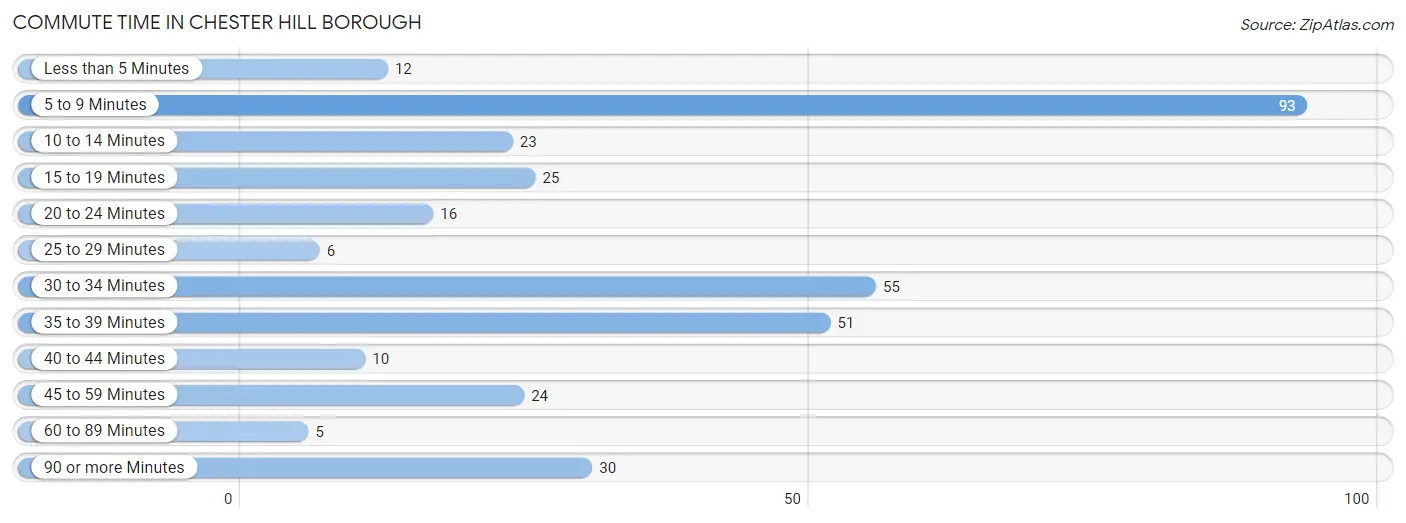
| Commute Time | # Commuters | % Commuters |
| Less than 5 Minutes | 12 | 3.4% |
| 5 to 9 Minutes | 93 | 26.6% |
| 10 to 14 Minutes | 23 | 6.6% |
| 15 to 19 Minutes | 25 | 7.1% |
| 20 to 24 Minutes | 16 | 4.6% |
| 25 to 29 Minutes | 6 | 1.7% |
| 30 to 34 Minutes | 55 | 15.7% |
| 35 to 39 Minutes | 51 | 14.6% |
| 40 to 44 Minutes | 10 | 2.9% |
| 45 to 59 Minutes | 24 | 6.9% |
| 60 to 89 Minutes | 5 | 1.4% |
| 90 or more Minutes | 30 | 8.6% |
Commute Time by Sex in Chester Hill borough
The most common commute times in Chester Hill borough are 5 to 9 minutes (56 commuters, 25.9%) for males and 5 to 9 minutes (37 commuters, 27.6%) for females.
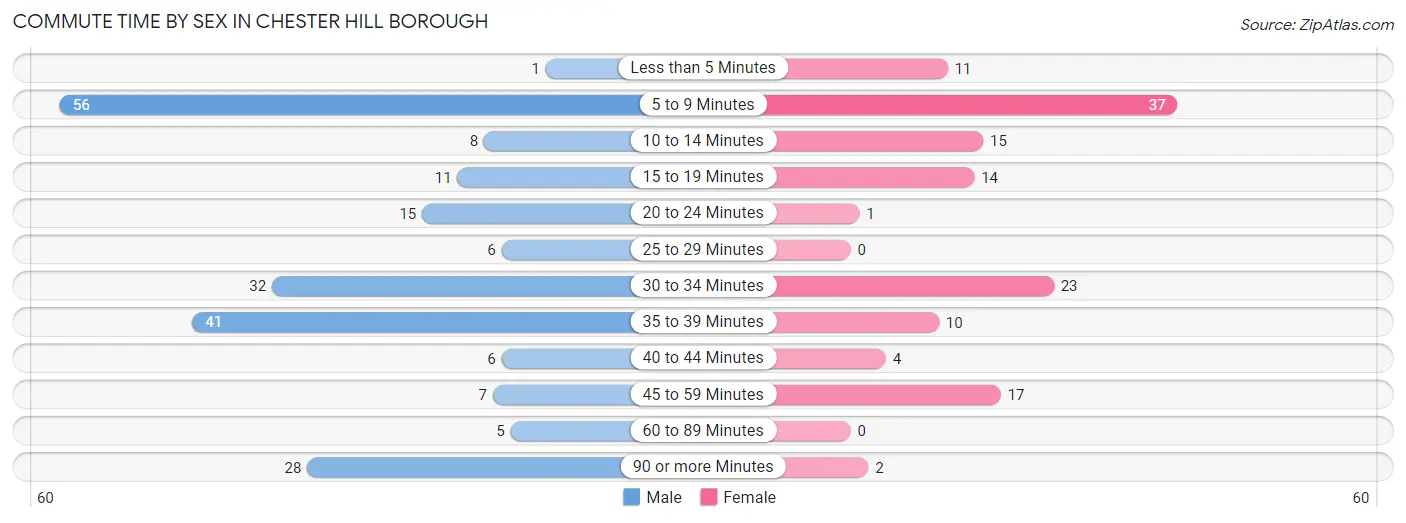
| Commute Time | Male | Female |
| Less than 5 Minutes | 1 (0.5%) | 11 (8.2%) |
| 5 to 9 Minutes | 56 (25.9%) | 37 (27.6%) |
| 10 to 14 Minutes | 8 (3.7%) | 15 (11.2%) |
| 15 to 19 Minutes | 11 (5.1%) | 14 (10.4%) |
| 20 to 24 Minutes | 15 (6.9%) | 1 (0.7%) |
| 25 to 29 Minutes | 6 (2.8%) | 0 (0.0%) |
| 30 to 34 Minutes | 32 (14.8%) | 23 (17.2%) |
| 35 to 39 Minutes | 41 (19.0%) | 10 (7.5%) |
| 40 to 44 Minutes | 6 (2.8%) | 4 (3.0%) |
| 45 to 59 Minutes | 7 (3.2%) | 17 (12.7%) |
| 60 to 89 Minutes | 5 (2.3%) | 0 (0.0%) |
| 90 or more Minutes | 28 (13.0%) | 2 (1.5%) |
Time of Departure to Work by Sex in Chester Hill borough
The most frequent times of departure to work in Chester Hill borough are 11:00 AM to 11:59 AM (40, 18.5%) for males and 6:30 AM to 6:59 AM (27, 20.2%) for females.
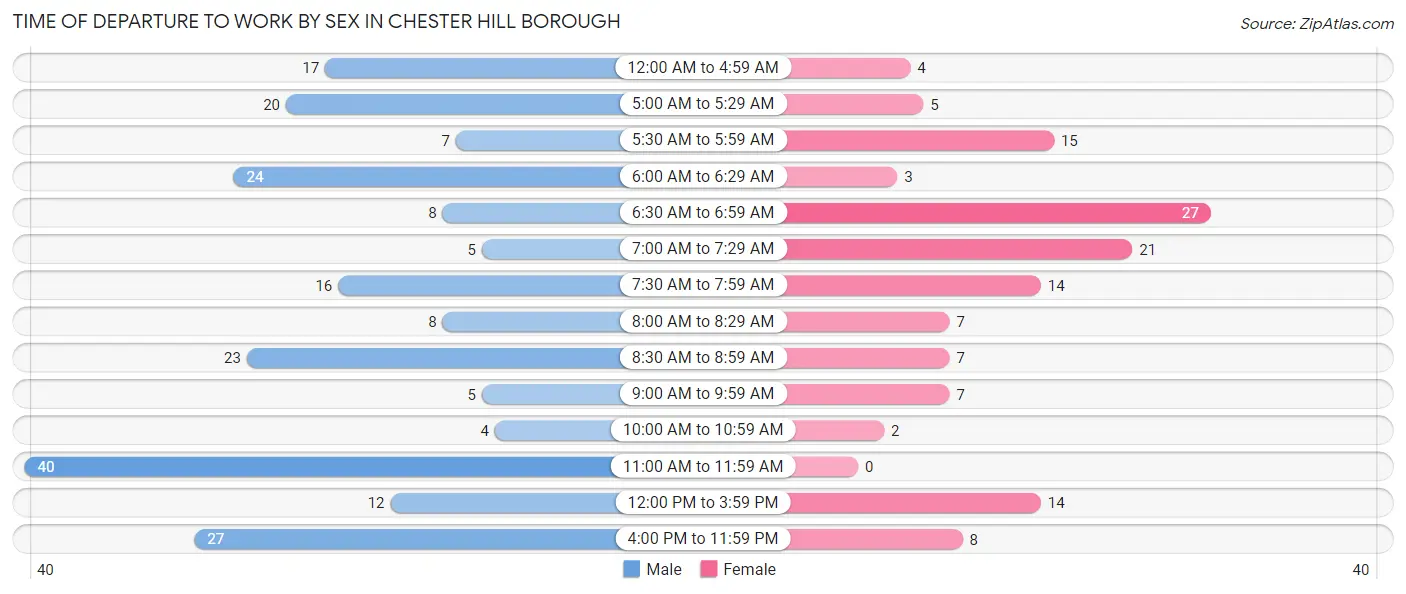
| Time of Departure | Male | Female |
| 12:00 AM to 4:59 AM | 17 (7.9%) | 4 (3.0%) |
| 5:00 AM to 5:29 AM | 20 (9.3%) | 5 (3.7%) |
| 5:30 AM to 5:59 AM | 7 (3.2%) | 15 (11.2%) |
| 6:00 AM to 6:29 AM | 24 (11.1%) | 3 (2.2%) |
| 6:30 AM to 6:59 AM | 8 (3.7%) | 27 (20.2%) |
| 7:00 AM to 7:29 AM | 5 (2.3%) | 21 (15.7%) |
| 7:30 AM to 7:59 AM | 16 (7.4%) | 14 (10.4%) |
| 8:00 AM to 8:29 AM | 8 (3.7%) | 7 (5.2%) |
| 8:30 AM to 8:59 AM | 23 (10.6%) | 7 (5.2%) |
| 9:00 AM to 9:59 AM | 5 (2.3%) | 7 (5.2%) |
| 10:00 AM to 10:59 AM | 4 (1.8%) | 2 (1.5%) |
| 11:00 AM to 11:59 AM | 40 (18.5%) | 0 (0.0%) |
| 12:00 PM to 3:59 PM | 12 (5.6%) | 14 (10.4%) |
| 4:00 PM to 11:59 PM | 27 (12.5%) | 8 (6.0%) |
| Total | 216 (100.0%) | 134 (100.0%) |
Housing Occupancy in Chester Hill borough
Occupancy by Ownership in Chester Hill borough
Of the total 295 dwellings in Chester Hill borough, owner-occupied units account for 175 (59.3%), while renter-occupied units make up 120 (40.7%).
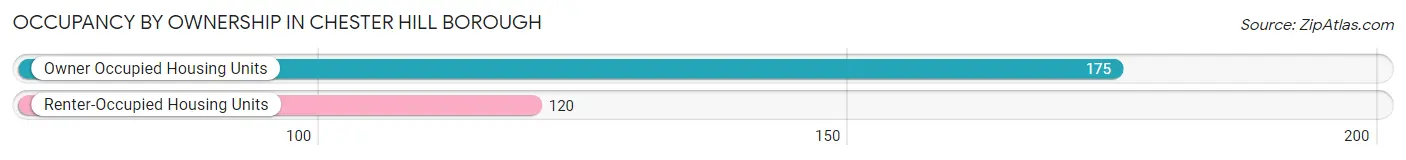
| Occupancy | # Housing Units | % Housing Units |
| Owner Occupied Housing Units | 175 | 59.3% |
| Renter-Occupied Housing Units | 120 | 40.7% |
| Total Occupied Housing Units | 295 | 100.0% |
Occupancy by Household Size in Chester Hill borough
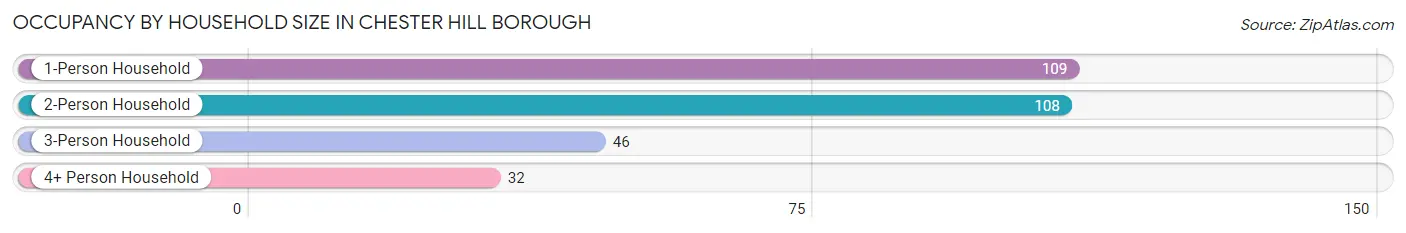
| Household Size | # Housing Units | % Housing Units |
| 1-Person Household | 109 | 36.9% |
| 2-Person Household | 108 | 36.6% |
| 3-Person Household | 46 | 15.6% |
| 4+ Person Household | 32 | 10.8% |
| Total Housing Units | 295 | 100.0% |
Occupancy by Ownership by Household Size in Chester Hill borough
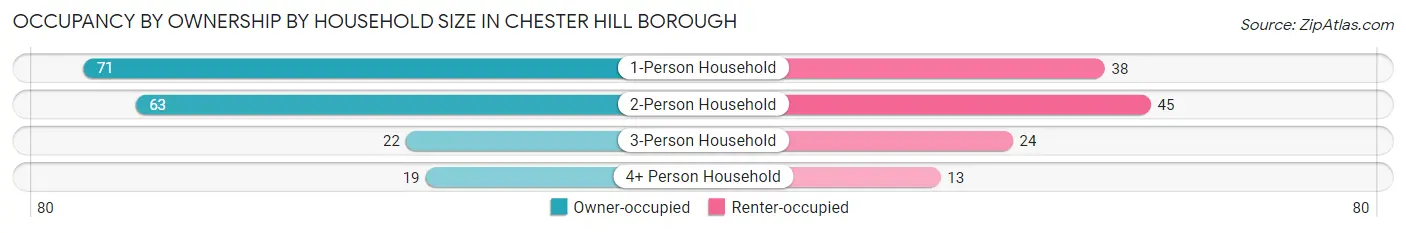
| Household Size | Owner-occupied | Renter-occupied |
| 1-Person Household | 71 (65.1%) | 38 (34.9%) |
| 2-Person Household | 63 (58.3%) | 45 (41.7%) |
| 3-Person Household | 22 (47.8%) | 24 (52.2%) |
| 4+ Person Household | 19 (59.4%) | 13 (40.6%) |
| Total Housing Units | 175 (59.3%) | 120 (40.7%) |
Occupancy by Educational Attainment in Chester Hill borough
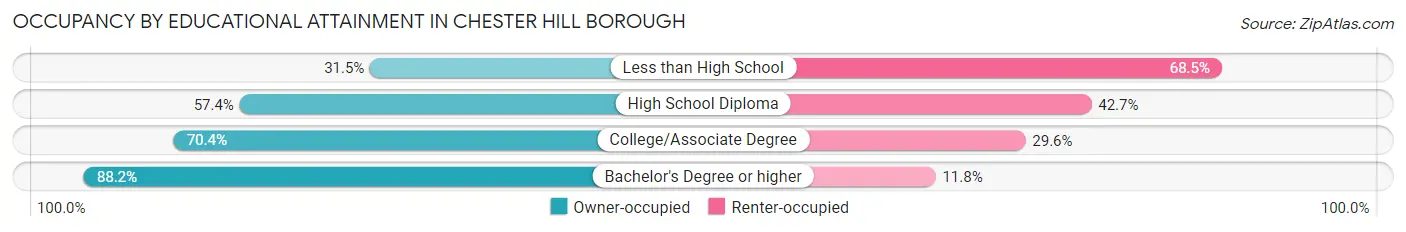
| Household Size | Owner-occupied | Renter-occupied |
| Less than High School | 17 (31.5%) | 37 (68.5%) |
| High School Diploma | 78 (57.4%) | 58 (42.6%) |
| College/Associate Degree | 50 (70.4%) | 21 (29.6%) |
| Bachelor's Degree or higher | 30 (88.2%) | 4 (11.8%) |
Occupancy by Age of Householder in Chester Hill borough
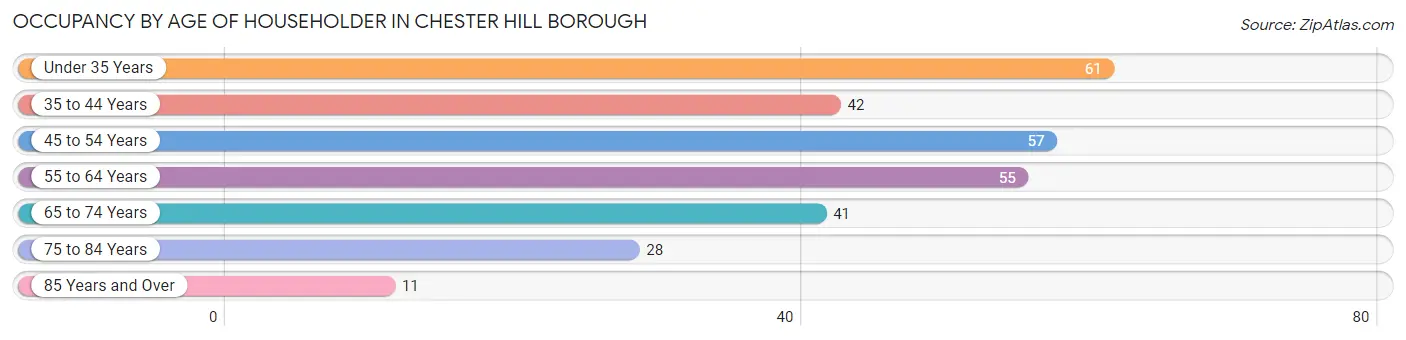
| Age Bracket | # Households | % Households |
| Under 35 Years | 61 | 20.7% |
| 35 to 44 Years | 42 | 14.2% |
| 45 to 54 Years | 57 | 19.3% |
| 55 to 64 Years | 55 | 18.6% |
| 65 to 74 Years | 41 | 13.9% |
| 75 to 84 Years | 28 | 9.5% |
| 85 Years and Over | 11 | 3.7% |
| Total | 295 | 100.0% |
Housing Finances in Chester Hill borough
Median Income by Occupancy in Chester Hill borough
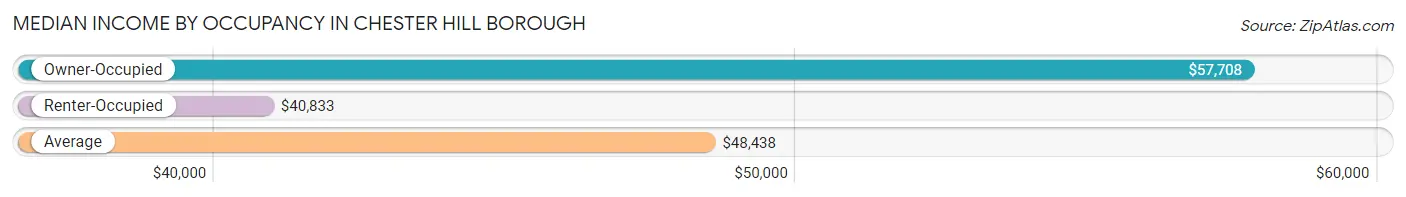
| Occupancy Type | # Households | Median Income |
| Owner-Occupied | 175 (59.3%) | $57,708 |
| Renter-Occupied | 120 (40.7%) | $40,833 |
| Average | 295 (100.0%) | $48,438 |
Occupancy by Householder Income Bracket in Chester Hill borough
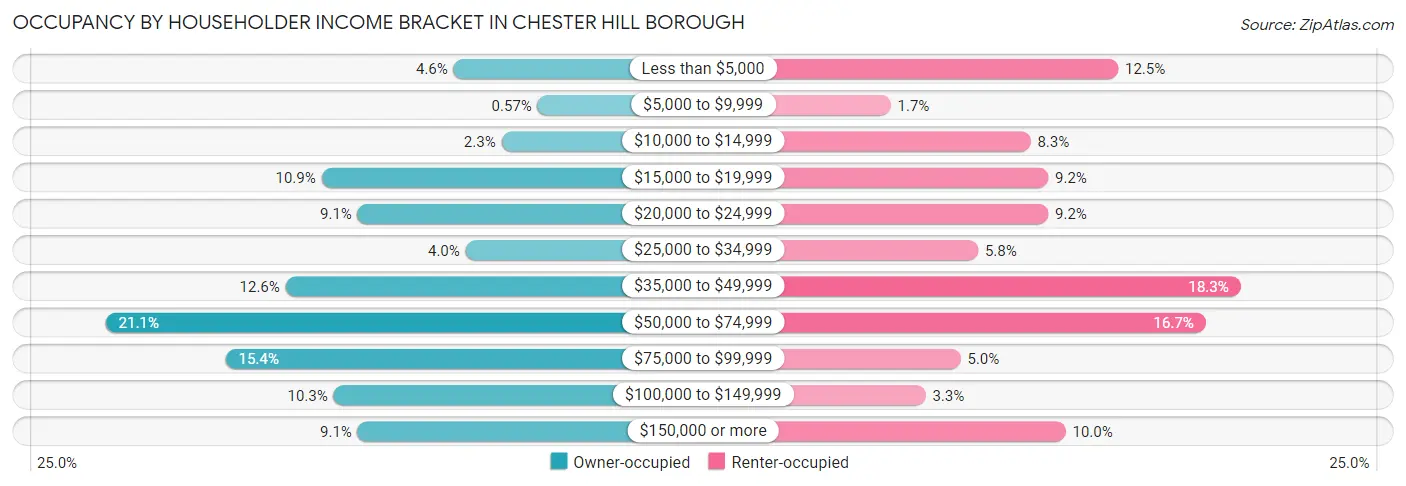
| Income Bracket | Owner-occupied | Renter-occupied |
| Less than $5,000 | 8 (4.6%) | 15 (12.5%) |
| $5,000 to $9,999 | 1 (0.6%) | 2 (1.7%) |
| $10,000 to $14,999 | 4 (2.3%) | 10 (8.3%) |
| $15,000 to $19,999 | 19 (10.9%) | 11 (9.2%) |
| $20,000 to $24,999 | 16 (9.1%) | 11 (9.2%) |
| $25,000 to $34,999 | 7 (4.0%) | 7 (5.8%) |
| $35,000 to $49,999 | 22 (12.6%) | 22 (18.3%) |
| $50,000 to $74,999 | 37 (21.1%) | 20 (16.7%) |
| $75,000 to $99,999 | 27 (15.4%) | 6 (5.0%) |
| $100,000 to $149,999 | 18 (10.3%) | 4 (3.3%) |
| $150,000 or more | 16 (9.1%) | 12 (10.0%) |
| Total | 175 (100.0%) | 120 (100.0%) |
Monthly Housing Cost Tiers in Chester Hill borough
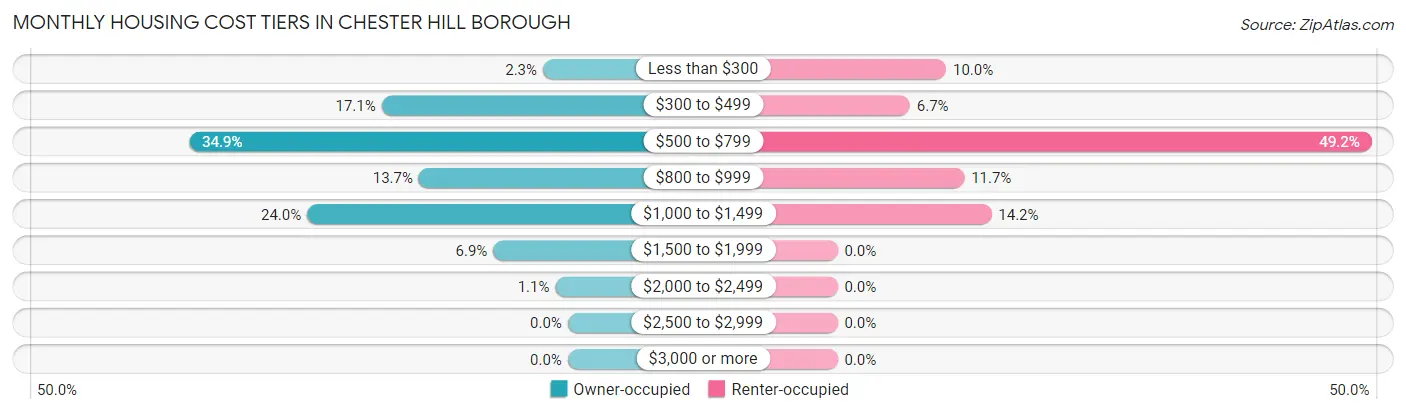
| Monthly Cost | Owner-occupied | Renter-occupied |
| Less than $300 | 4 (2.3%) | 12 (10.0%) |
| $300 to $499 | 30 (17.1%) | 8 (6.7%) |
| $500 to $799 | 61 (34.9%) | 59 (49.2%) |
| $800 to $999 | 24 (13.7%) | 14 (11.7%) |
| $1,000 to $1,499 | 42 (24.0%) | 17 (14.2%) |
| $1,500 to $1,999 | 12 (6.9%) | 0 (0.0%) |
| $2,000 to $2,499 | 2 (1.1%) | 0 (0.0%) |
| $2,500 to $2,999 | 0 (0.0%) | 0 (0.0%) |
| $3,000 or more | 0 (0.0%) | 0 (0.0%) |
| Total | 175 (100.0%) | 120 (100.0%) |
Physical Housing Characteristics in Chester Hill borough
Housing Structures in Chester Hill borough
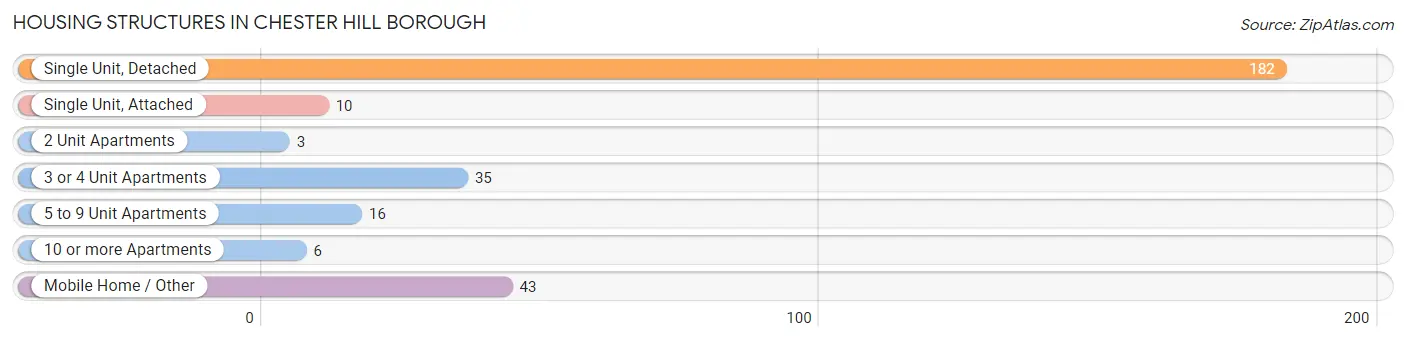
| Structure Type | # Housing Units | % Housing Units |
| Single Unit, Detached | 182 | 61.7% |
| Single Unit, Attached | 10 | 3.4% |
| 2 Unit Apartments | 3 | 1.0% |
| 3 or 4 Unit Apartments | 35 | 11.9% |
| 5 to 9 Unit Apartments | 16 | 5.4% |
| 10 or more Apartments | 6 | 2.0% |
| Mobile Home / Other | 43 | 14.6% |
| Total | 295 | 100.0% |
Housing Structures by Occupancy in Chester Hill borough
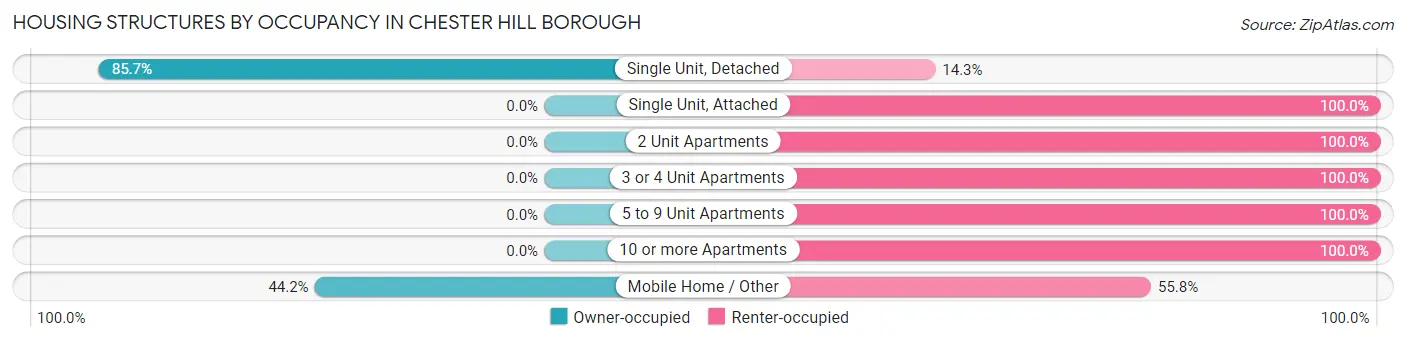
| Structure Type | Owner-occupied | Renter-occupied |
| Single Unit, Detached | 156 (85.7%) | 26 (14.3%) |
| Single Unit, Attached | 0 (0.0%) | 10 (100.0%) |
| 2 Unit Apartments | 0 (0.0%) | 3 (100.0%) |
| 3 or 4 Unit Apartments | 0 (0.0%) | 35 (100.0%) |
| 5 to 9 Unit Apartments | 0 (0.0%) | 16 (100.0%) |
| 10 or more Apartments | 0 (0.0%) | 6 (100.0%) |
| Mobile Home / Other | 19 (44.2%) | 24 (55.8%) |
| Total | 175 (59.3%) | 120 (40.7%) |
Housing Structures by Number of Rooms in Chester Hill borough
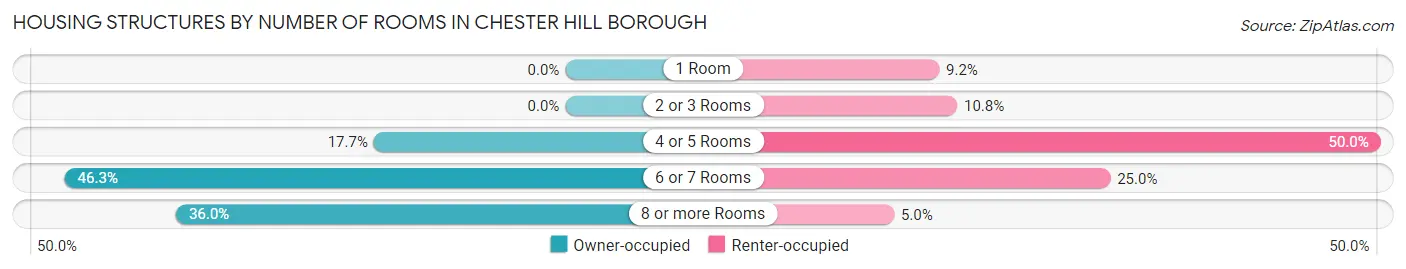
| Number of Rooms | Owner-occupied | Renter-occupied |
| 1 Room | 0 (0.0%) | 11 (9.2%) |
| 2 or 3 Rooms | 0 (0.0%) | 13 (10.8%) |
| 4 or 5 Rooms | 31 (17.7%) | 60 (50.0%) |
| 6 or 7 Rooms | 81 (46.3%) | 30 (25.0%) |
| 8 or more Rooms | 63 (36.0%) | 6 (5.0%) |
| Total | 175 (100.0%) | 120 (100.0%) |
Housing Structure by Heating Type in Chester Hill borough
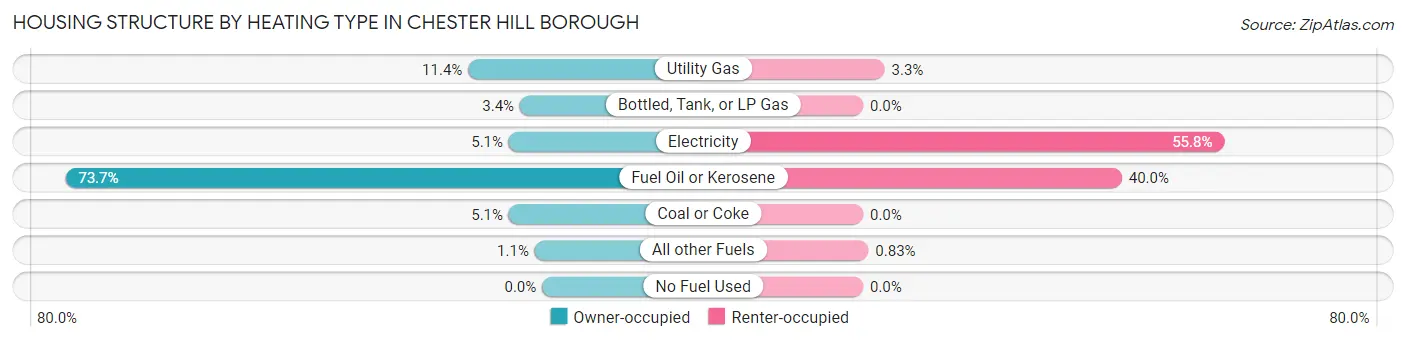
| Heating Type | Owner-occupied | Renter-occupied |
| Utility Gas | 20 (11.4%) | 4 (3.3%) |
| Bottled, Tank, or LP Gas | 6 (3.4%) | 0 (0.0%) |
| Electricity | 9 (5.1%) | 67 (55.8%) |
| Fuel Oil or Kerosene | 129 (73.7%) | 48 (40.0%) |
| Coal or Coke | 9 (5.1%) | 0 (0.0%) |
| All other Fuels | 2 (1.1%) | 1 (0.8%) |
| No Fuel Used | 0 (0.0%) | 0 (0.0%) |
| Total | 175 (100.0%) | 120 (100.0%) |
Household Vehicle Usage in Chester Hill borough
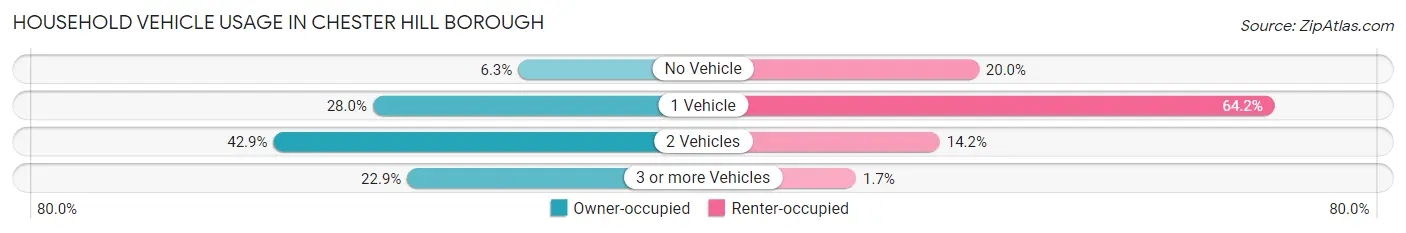
| Vehicles per Household | Owner-occupied | Renter-occupied |
| No Vehicle | 11 (6.3%) | 24 (20.0%) |
| 1 Vehicle | 49 (28.0%) | 77 (64.2%) |
| 2 Vehicles | 75 (42.9%) | 17 (14.2%) |
| 3 or more Vehicles | 40 (22.9%) | 2 (1.7%) |
| Total | 175 (100.0%) | 120 (100.0%) |
Real Estate & Mortgages in Chester Hill borough
Real Estate and Mortgage Overview in Chester Hill borough
| Characteristic | Without Mortgage | With Mortgage |
| Housing Units | 87 | 88 |
| Median Property Value | $107,500 | $92,500 |
| Median Household Income | $42,083 | $16 |
| Monthly Housing Costs | $563 | $0 |
| Real Estate Taxes | $1,900 | $2 |
Property Value by Mortgage Status in Chester Hill borough
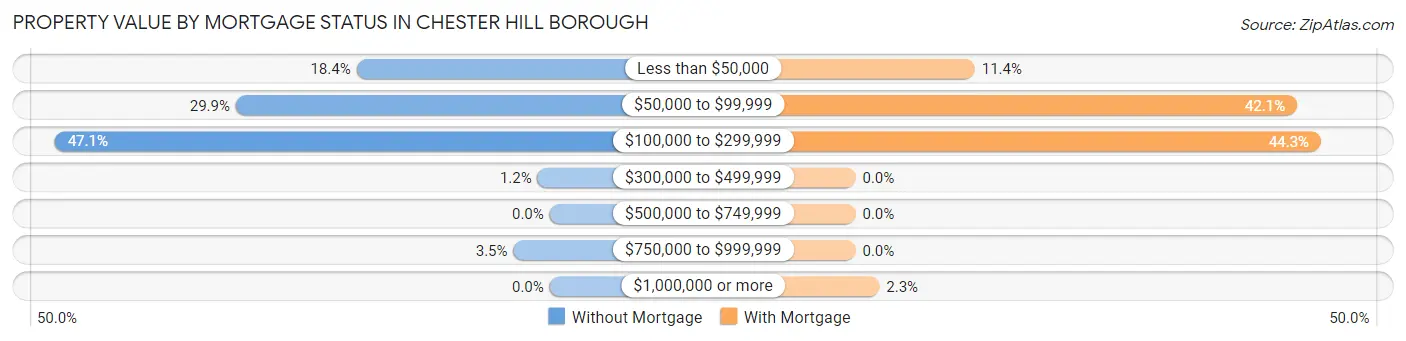
| Property Value | Without Mortgage | With Mortgage |
| Less than $50,000 | 16 (18.4%) | 10 (11.4%) |
| $50,000 to $99,999 | 26 (29.9%) | 37 (42.0%) |
| $100,000 to $299,999 | 41 (47.1%) | 39 (44.3%) |
| $300,000 to $499,999 | 1 (1.1%) | 0 (0.0%) |
| $500,000 to $749,999 | 0 (0.0%) | 0 (0.0%) |
| $750,000 to $999,999 | 3 (3.5%) | 0 (0.0%) |
| $1,000,000 or more | 0 (0.0%) | 2 (2.3%) |
| Total | 87 (100.0%) | 88 (100.0%) |
Household Income by Mortgage Status in Chester Hill borough
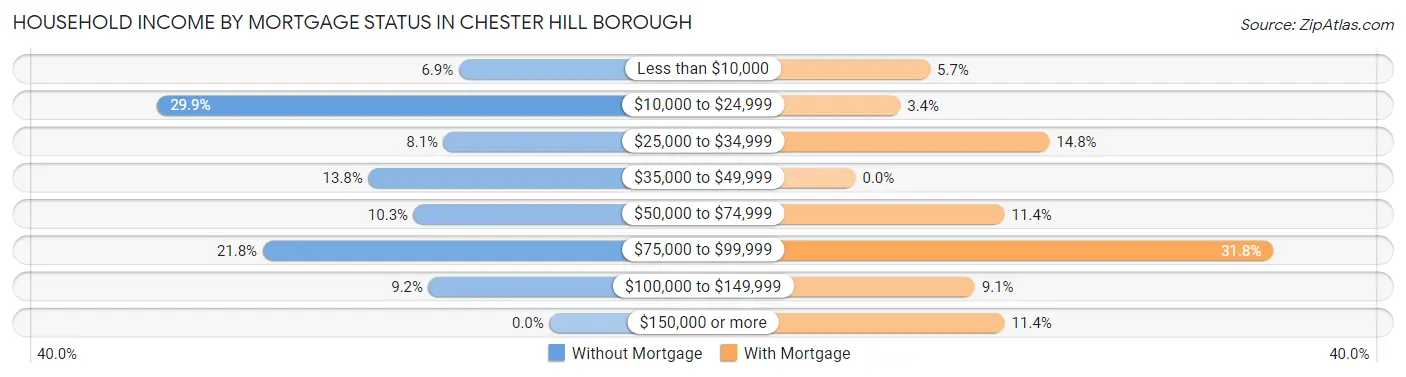
| Household Income | Without Mortgage | With Mortgage |
| Less than $10,000 | 6 (6.9%) | 5 (5.7%) |
| $10,000 to $24,999 | 26 (29.9%) | 3 (3.4%) |
| $25,000 to $34,999 | 7 (8.1%) | 13 (14.8%) |
| $35,000 to $49,999 | 12 (13.8%) | 0 (0.0%) |
| $50,000 to $74,999 | 9 (10.3%) | 10 (11.4%) |
| $75,000 to $99,999 | 19 (21.8%) | 28 (31.8%) |
| $100,000 to $149,999 | 8 (9.2%) | 8 (9.1%) |
| $150,000 or more | 0 (0.0%) | 10 (11.4%) |
| Total | 87 (100.0%) | 88 (100.0%) |
Property Value to Household Income Ratio in Chester Hill borough
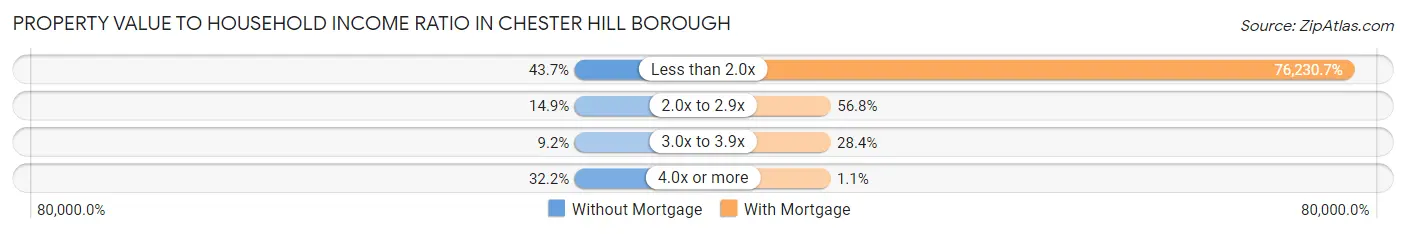
| Value-to-Income Ratio | Without Mortgage | With Mortgage |
| Less than 2.0x | 38 (43.7%) | 67,083 (76,230.7%) |
| 2.0x to 2.9x | 13 (14.9%) | 50 (56.8%) |
| 3.0x to 3.9x | 8 (9.2%) | 25 (28.4%) |
| 4.0x or more | 28 (32.2%) | 1 (1.1%) |
| Total | 87 (100.0%) | 88 (100.0%) |
Real Estate Taxes by Mortgage Status in Chester Hill borough
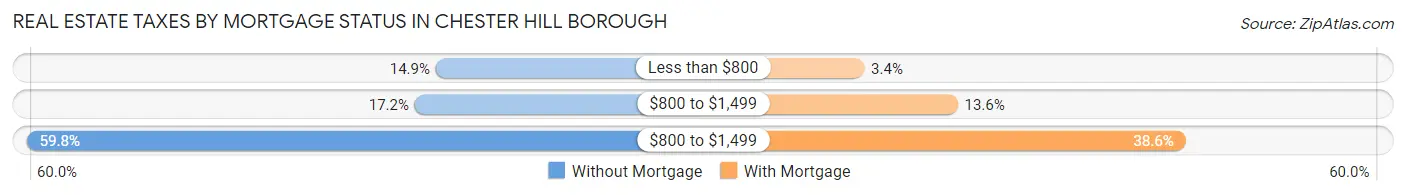
| Property Taxes | Without Mortgage | With Mortgage |
| Less than $800 | 13 (14.9%) | 3 (3.4%) |
| $800 to $1,499 | 15 (17.2%) | 12 (13.6%) |
| $800 to $1,499 | 52 (59.8%) | 34 (38.6%) |
| Total | 87 (100.0%) | 88 (100.0%) |
Health & Disability in Chester Hill borough
Health Insurance Coverage by Age in Chester Hill borough

| Age Bracket | With Coverage | Without Coverage |
| Under 6 Years | 35 (100.0%) | 0 (0.0%) |
| 6 to 18 Years | 89 (100.0%) | 0 (0.0%) |
| 19 to 25 Years | 43 (95.6%) | 2 (4.4%) |
| 26 to 34 Years | 118 (72.0%) | 46 (28.1%) |
| 35 to 44 Years | 80 (88.9%) | 10 (11.1%) |
| 45 to 54 Years | 78 (92.9%) | 6 (7.1%) |
| 55 to 64 Years | 90 (95.7%) | 4 (4.3%) |
| 65 to 74 Years | 55 (100.0%) | 0 (0.0%) |
| 75 Years and older | 59 (100.0%) | 0 (0.0%) |
| Total | 647 (90.5%) | 68 (9.5%) |
Health Insurance Coverage by Citizenship Status in Chester Hill borough
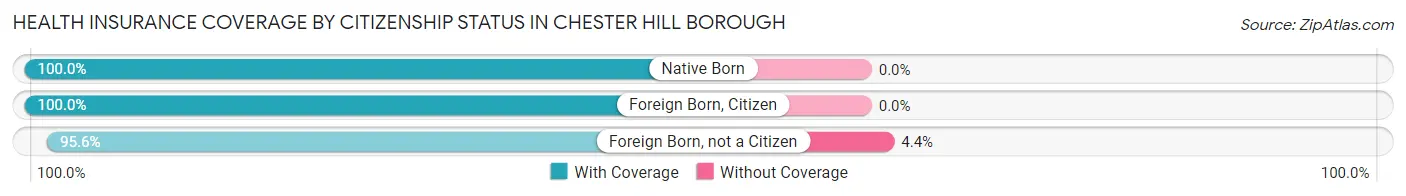
| Citizenship Status | With Coverage | Without Coverage |
| Native Born | 35 (100.0%) | 0 (0.0%) |
| Foreign Born, Citizen | 89 (100.0%) | 0 (0.0%) |
| Foreign Born, not a Citizen | 43 (95.6%) | 2 (4.4%) |
Health Insurance Coverage by Household Income in Chester Hill borough
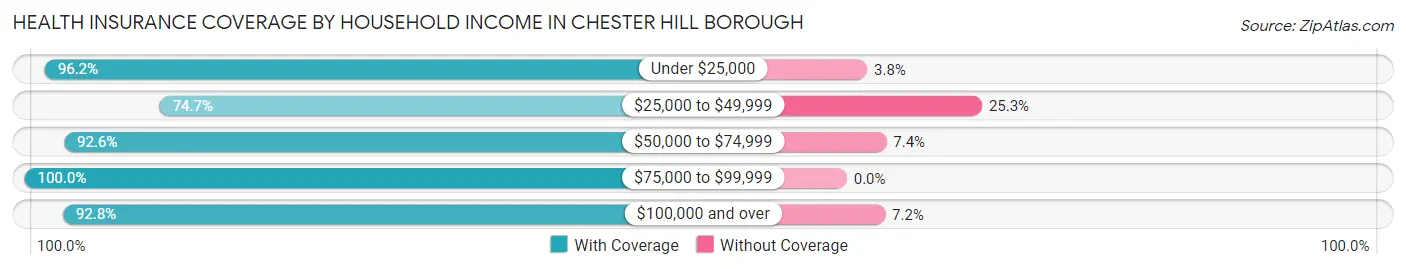
| Household Income | With Coverage | Without Coverage |
| Under $25,000 | 177 (96.2%) | 7 (3.8%) |
| $25,000 to $49,999 | 118 (74.7%) | 40 (25.3%) |
| $50,000 to $74,999 | 100 (92.6%) | 8 (7.4%) |
| $75,000 to $99,999 | 84 (100.0%) | 0 (0.0%) |
| $100,000 and over | 168 (92.8%) | 13 (7.2%) |
Public vs Private Health Insurance Coverage by Age in Chester Hill borough
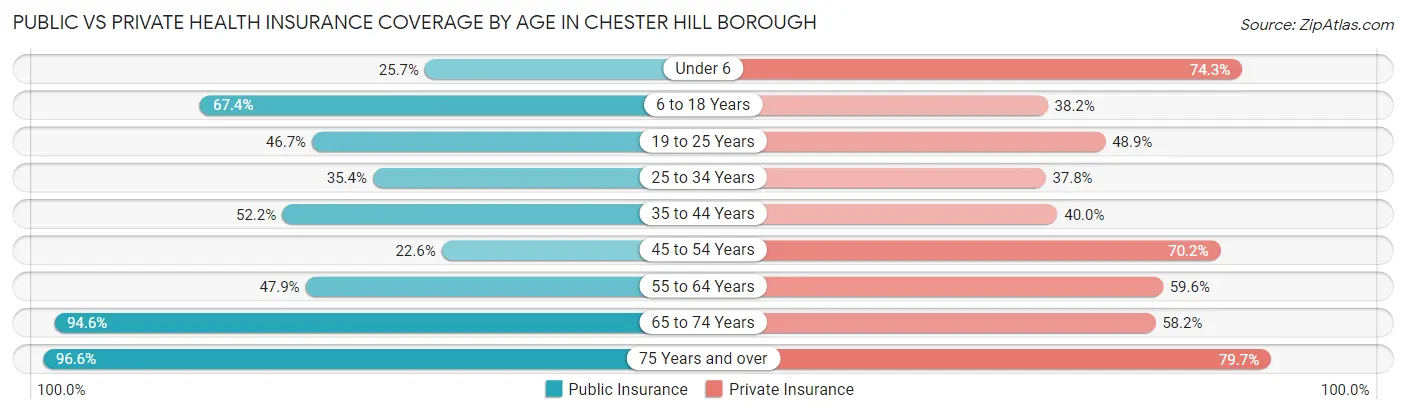
| Age Bracket | Public Insurance | Private Insurance |
| Under 6 | 9 (25.7%) | 26 (74.3%) |
| 6 to 18 Years | 60 (67.4%) | 34 (38.2%) |
| 19 to 25 Years | 21 (46.7%) | 22 (48.9%) |
| 25 to 34 Years | 58 (35.4%) | 62 (37.8%) |
| 35 to 44 Years | 47 (52.2%) | 36 (40.0%) |
| 45 to 54 Years | 19 (22.6%) | 59 (70.2%) |
| 55 to 64 Years | 45 (47.9%) | 56 (59.6%) |
| 65 to 74 Years | 52 (94.6%) | 32 (58.2%) |
| 75 Years and over | 57 (96.6%) | 47 (79.7%) |
| Total | 368 (51.5%) | 374 (52.3%) |
Disability Status by Sex by Age in Chester Hill borough
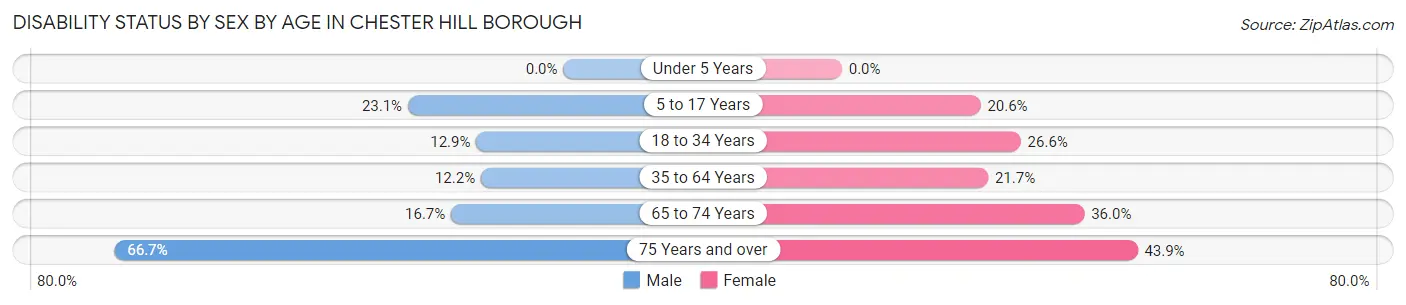
| Age Bracket | Male | Female |
| Under 5 Years | 0 (0.0%) | 0 (0.0%) |
| 5 to 17 Years | 15 (23.1%) | 7 (20.6%) |
| 18 to 34 Years | 19 (12.9%) | 17 (26.6%) |
| 35 to 64 Years | 17 (12.2%) | 28 (21.7%) |
| 65 to 74 Years | 5 (16.7%) | 9 (36.0%) |
| 75 Years and over | 12 (66.7%) | 18 (43.9%) |
Disability Class by Sex by Age in Chester Hill borough
Disability Class: Hearing Difficulty
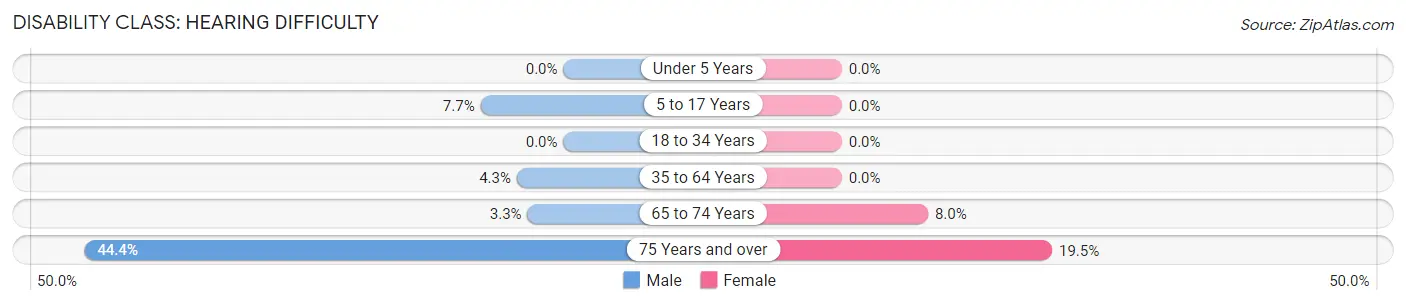
| Age Bracket | Male | Female |
| Under 5 Years | 0 (0.0%) | 0 (0.0%) |
| 5 to 17 Years | 5 (7.7%) | 0 (0.0%) |
| 18 to 34 Years | 0 (0.0%) | 0 (0.0%) |
| 35 to 64 Years | 6 (4.3%) | 0 (0.0%) |
| 65 to 74 Years | 1 (3.3%) | 2 (8.0%) |
| 75 Years and over | 8 (44.4%) | 8 (19.5%) |
Disability Class: Vision Difficulty
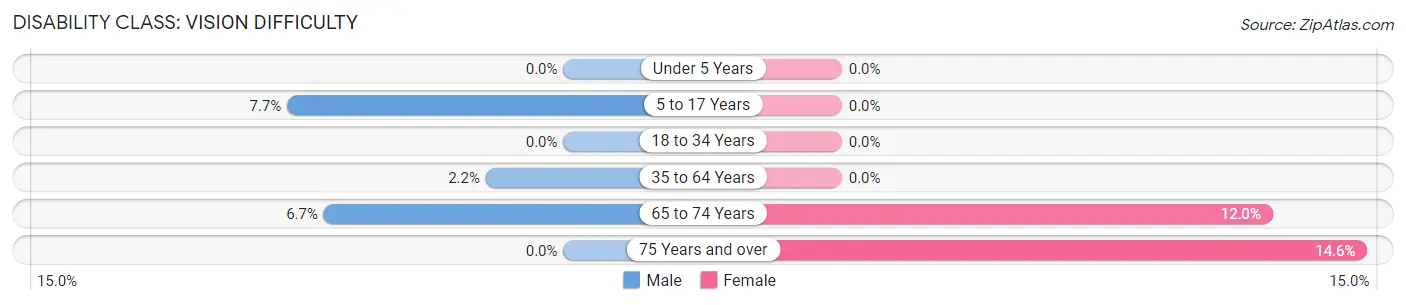
| Age Bracket | Male | Female |
| Under 5 Years | 0 (0.0%) | 0 (0.0%) |
| 5 to 17 Years | 5 (7.7%) | 0 (0.0%) |
| 18 to 34 Years | 0 (0.0%) | 0 (0.0%) |
| 35 to 64 Years | 3 (2.2%) | 0 (0.0%) |
| 65 to 74 Years | 2 (6.7%) | 3 (12.0%) |
| 75 Years and over | 0 (0.0%) | 6 (14.6%) |
Disability Class: Cognitive Difficulty
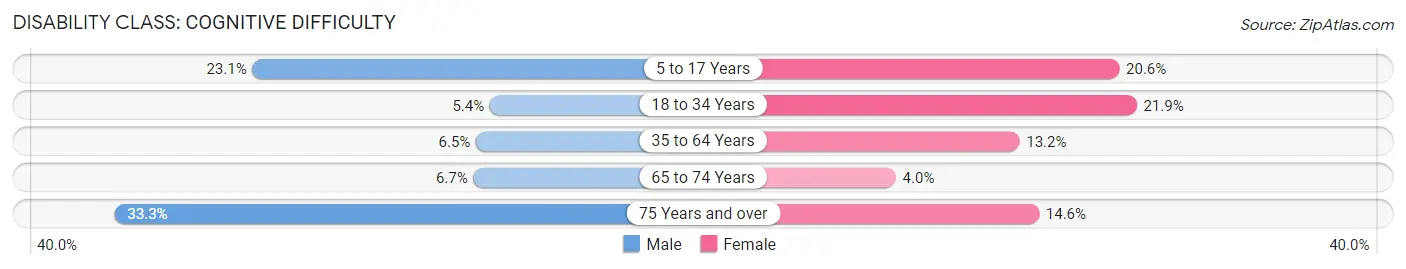
| Age Bracket | Male | Female |
| 5 to 17 Years | 15 (23.1%) | 7 (20.6%) |
| 18 to 34 Years | 8 (5.4%) | 14 (21.9%) |
| 35 to 64 Years | 9 (6.5%) | 17 (13.2%) |
| 65 to 74 Years | 2 (6.7%) | 1 (4.0%) |
| 75 Years and over | 6 (33.3%) | 6 (14.6%) |
Disability Class: Ambulatory Difficulty
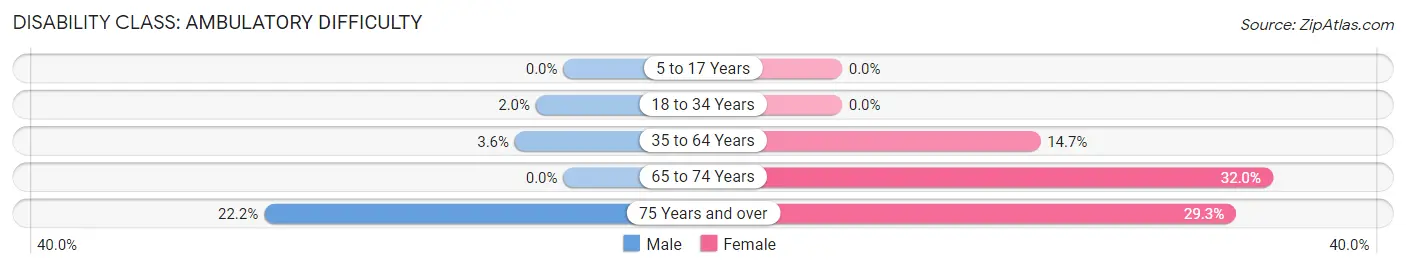
| Age Bracket | Male | Female |
| 5 to 17 Years | 0 (0.0%) | 0 (0.0%) |
| 18 to 34 Years | 3 (2.0%) | 0 (0.0%) |
| 35 to 64 Years | 5 (3.6%) | 19 (14.7%) |
| 65 to 74 Years | 0 (0.0%) | 8 (32.0%) |
| 75 Years and over | 4 (22.2%) | 12 (29.3%) |
Disability Class: Self-Care Difficulty
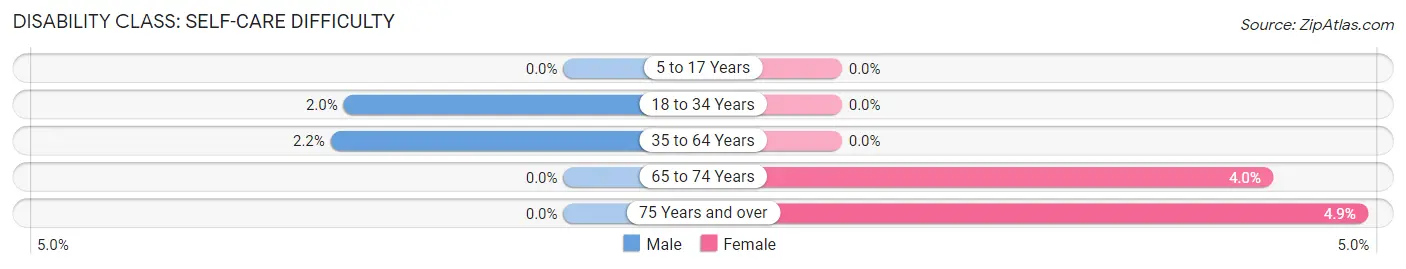
| Age Bracket | Male | Female |
| 5 to 17 Years | 0 (0.0%) | 0 (0.0%) |
| 18 to 34 Years | 3 (2.0%) | 0 (0.0%) |
| 35 to 64 Years | 3 (2.2%) | 0 (0.0%) |
| 65 to 74 Years | 0 (0.0%) | 1 (4.0%) |
| 75 Years and over | 0 (0.0%) | 2 (4.9%) |
Technology Access in Chester Hill borough
Computing Device Access in Chester Hill borough
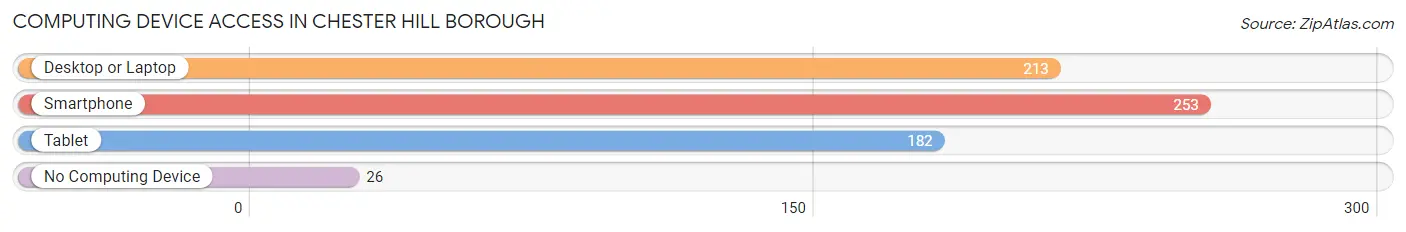
| Device Type | # Households | % Households |
| Desktop or Laptop | 213 | 72.2% |
| Smartphone | 253 | 85.8% |
| Tablet | 182 | 61.7% |
| No Computing Device | 26 | 8.8% |
| Total | 295 | 100.0% |
Internet Access in Chester Hill borough
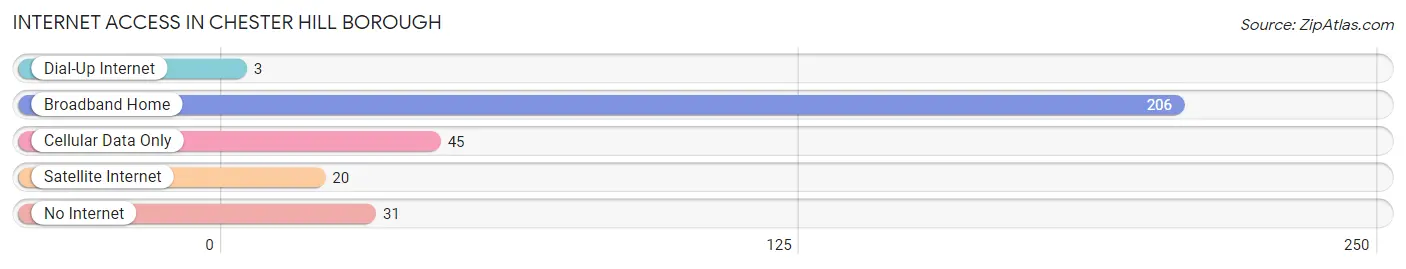
| Internet Type | # Households | % Households |
| Dial-Up Internet | 3 | 1.0% |
| Broadband Home | 206 | 69.8% |
| Cellular Data Only | 45 | 15.2% |
| Satellite Internet | 20 | 6.8% |
| No Internet | 31 | 10.5% |
| Total | 295 | 100.0% |
Chester Hill borough Summary
Chester Hill Borough is a small borough located in Cambria County, Pennsylvania. It is situated in the foothills of the Allegheny Mountains, approximately 10 miles east of Johnstown. The borough has a population of 1,845 as of the 2010 census.
History
Chester Hill Borough was founded in 1876 by a group of settlers from Chester County, Pennsylvania. The settlers were attracted to the area by the abundance of natural resources, including coal, timber, and iron ore. The borough was named after the nearby town of Chester, which was founded in 1790.
The first settlers in the area were mostly farmers and loggers. The first industry in the area was a sawmill, which was built in 1877. This sawmill was the first of many industries that would be established in the area.
In the late 19th century, the borough began to grow rapidly. The population increased from just over 500 in 1880 to over 1,000 in 1900. This growth was due to the influx of immigrants from Europe, as well as the development of the coal and iron ore industries.
The borough continued to grow throughout the 20th century. In the 1950s, the population reached its peak of 2,000. Since then, the population has declined slightly, but the borough remains a vibrant community.
Geography
Chester Hill Borough is located in the foothills of the Allegheny Mountains. The borough is situated in a valley, with the Allegheny River to the north and the Conemaugh River to the south. The borough is bordered by the townships of East Taylor, West Taylor, and Conemaugh.
The borough has a total area of 1.2 square miles, all of which is land. The terrain is mostly hilly, with some flat areas. The borough is located at an elevation of 1,400 feet above sea level.
Economy
The economy of Chester Hill Borough is largely based on the coal and iron ore industries. The borough is home to several coal mines, as well as several iron ore processing plants. The borough also has a number of small businesses, including restaurants, retail stores, and service providers.
The borough is also home to a number of manufacturing companies, including a steel mill and a paper mill. The borough is also home to a number of small farms, which produce a variety of crops, including corn, soybeans, and hay.
Demographics
As of the 2010 census, the population of Chester Hill Borough was 1,845. The racial makeup of the borough was 97.3% White, 0.7% African American, 0.2% Native American, 0.2% Asian, 0.1% Pacific Islander, 0.4% from other races, and 1.1% from two or more races. Hispanic or Latino of any race were 1.2% of the population.
The median household income in the borough was $37,917, and the median family income was $45,625. The per capita income was $19,945. About 11.3% of families and 14.2% of the population were below the poverty line, including 19.2% of those under age 18 and 8.2% of those age 65 or over.
Common Questions
What is Per Capita Income in Chester Hill borough?
Per Capita income in Chester Hill borough is $35,823.
What is the Median Family Income in Chester Hill borough?
Median Family Income in Chester Hill borough is $53,750.
What is the Median Household income in Chester Hill borough?
Median Household Income in Chester Hill borough is $48,438.
What is Income or Wage Gap in Chester Hill borough?
Income or Wage Gap in Chester Hill borough is 30.6%.
Women in Chester Hill borough earn 69.4 cents for every dollar earned by a man.
What is Inequality or Gini Index in Chester Hill borough?
Inequality or Gini Index in Chester Hill borough is 0.59.
What is the Total Population of Chester Hill borough?
Total Population of Chester Hill borough is 717.
What is the Total Male Population of Chester Hill borough?
Total Male Population of Chester Hill borough is 409.
What is the Total Female Population of Chester Hill borough?
Total Female Population of Chester Hill borough is 308.
What is the Ratio of Males per 100 Females in Chester Hill borough?
There are 132.79 Males per 100 Females in Chester Hill borough.
What is the Ratio of Females per 100 Males in Chester Hill borough?
There are 75.31 Females per 100 Males in Chester Hill borough.
What is the Median Population Age in Chester Hill borough?
Median Population Age in Chester Hill borough is 37.0 Years.
What is the Average Family Size in Chester Hill borough
Average Family Size in Chester Hill borough is 3.3 People.
What is the Average Household Size in Chester Hill borough
Average Household Size in Chester Hill borough is 2.4 People.
How Large is the Labor Force in Chester Hill borough?
There are 391 People in the Labor Forcein in Chester Hill borough.
What is the Percentage of People in the Labor Force in Chester Hill borough?
63.7% of People are in the Labor Force in Chester Hill borough.
What is the Unemployment Rate in Chester Hill borough?
Unemployment Rate in Chester Hill borough is 6.2%.