Chest Springs borough, PA Map & Demographics
Chest Springs borough Overview
$33,731
PER CAPITA INCOME
$103,750
AVG FAMILY INCOME
$80,625
AVG HOUSEHOLD INCOME
24.8%
WAGE / INCOME GAP [ % ]
75.2¢/ $1
WAGE / INCOME GAP [ $ ]
0.32
INEQUALITY / GINI INDEX
118
TOTAL POPULATION
65
MALE POPULATION
53
FEMALE POPULATION
122.64
MALES / 100 FEMALES
81.54
FEMALES / 100 MALES
43.5
MEDIAN AGE
3.4
AVG FAMILY SIZE
2.6
AVG HOUSEHOLD SIZE
58
LABOR FORCE [ PEOPLE ]
64.4%
PERCENT IN LABOR FORCE
1.7%
UNEMPLOYMENT RATE
Income in Chest Springs borough
Income Overview in Chest Springs borough
Per Capita Income in Chest Springs borough is $33,731, while median incomes of families and households are $103,750 and $80,625 respectively.
| Characteristic | Number | Measure |
| Per Capita Income | 118 | $33,731 |
| Median Family Income | 30 | $103,750 |
| Mean Family Income | 30 | $103,137 |
| Median Household Income | 45 | $80,625 |
| Mean Household Income | 45 | $84,958 |
| Income Deficit | 30 | $0 |
| Wage / Income Gap (%) | 118 | 24.79% |
| Wage / Income Gap ($) | 118 | 75.21¢ per $1 |
| Gini / Inequality Index | 118 | 0.32 |
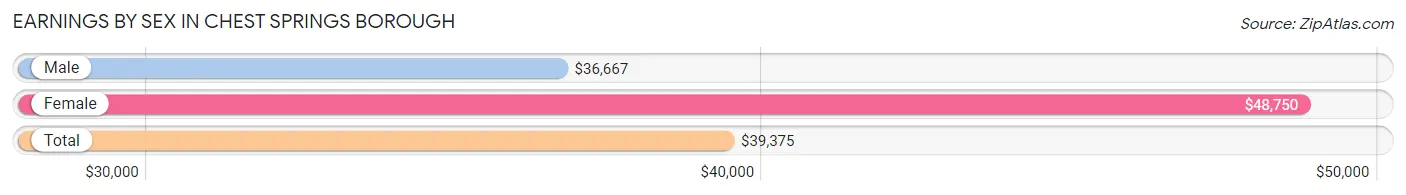
Earnings by Sex in Chest Springs borough
Average Earnings in Chest Springs borough are $39,375, $36,667 for men and $48,750 for women, a difference of 24.8%.
| Sex | Number | Average Earnings |
| Male | 38 (59.4%) | $36,667 |
| Female | 26 (40.6%) | $48,750 |
| Total | 64 (100.0%) | $39,375 |
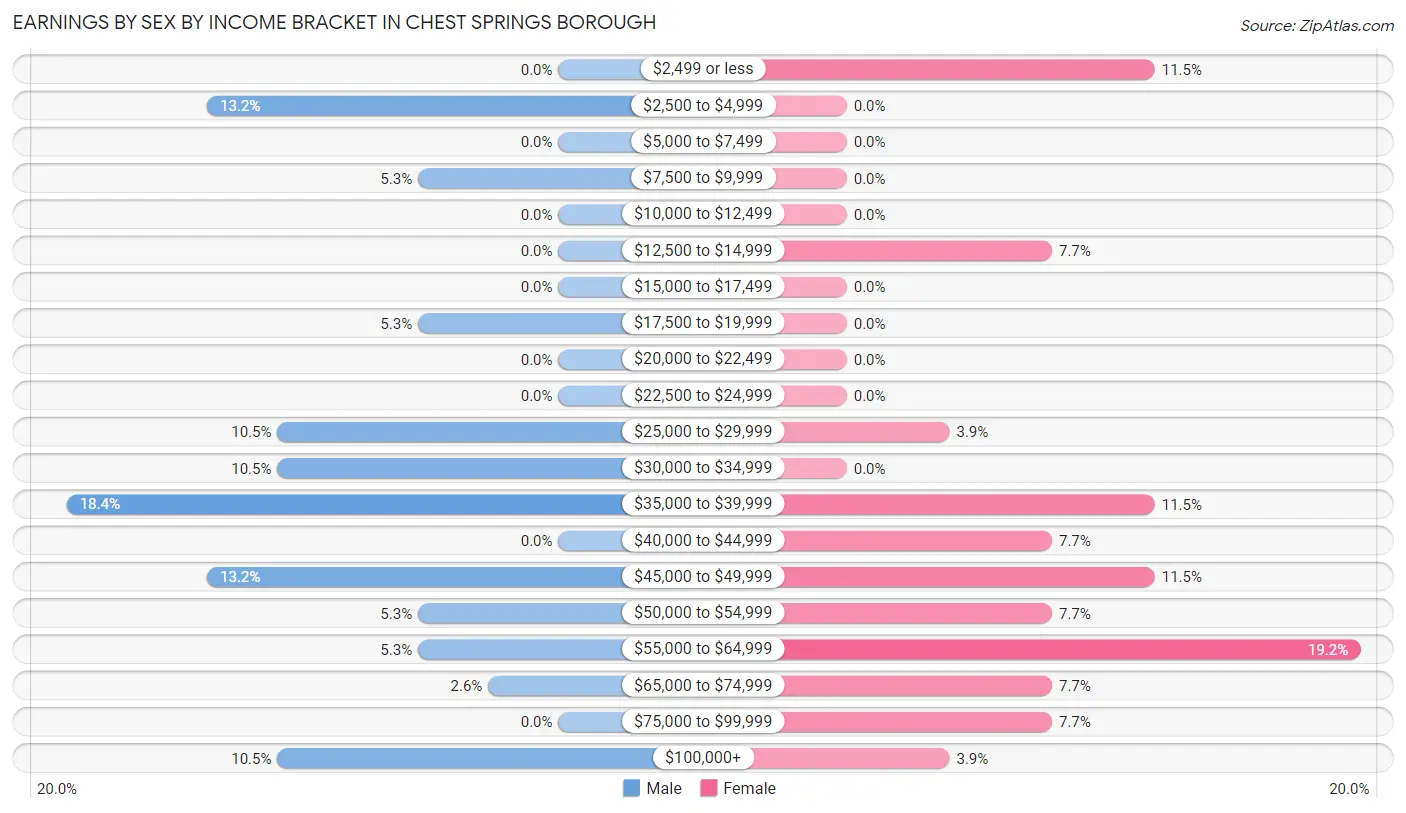
Earnings by Sex by Income Bracket in Chest Springs borough
The most common earnings brackets in Chest Springs borough are $35,000 to $39,999 for men (7 | 18.4%) and $55,000 to $64,999 for women (5 | 19.2%).
| Income | Male | Female |
| $2,499 or less | 0 (0.0%) | 3 (11.5%) |
| $2,500 to $4,999 | 5 (13.2%) | 0 (0.0%) |
| $5,000 to $7,499 | 0 (0.0%) | 0 (0.0%) |
| $7,500 to $9,999 | 2 (5.3%) | 0 (0.0%) |
| $10,000 to $12,499 | 0 (0.0%) | 0 (0.0%) |
| $12,500 to $14,999 | 0 (0.0%) | 2 (7.7%) |
| $15,000 to $17,499 | 0 (0.0%) | 0 (0.0%) |
| $17,500 to $19,999 | 2 (5.3%) | 0 (0.0%) |
| $20,000 to $22,499 | 0 (0.0%) | 0 (0.0%) |
| $22,500 to $24,999 | 0 (0.0%) | 0 (0.0%) |
| $25,000 to $29,999 | 4 (10.5%) | 1 (3.8%) |
| $30,000 to $34,999 | 4 (10.5%) | 0 (0.0%) |
| $35,000 to $39,999 | 7 (18.4%) | 3 (11.5%) |
| $40,000 to $44,999 | 0 (0.0%) | 2 (7.7%) |
| $45,000 to $49,999 | 5 (13.2%) | 3 (11.5%) |
| $50,000 to $54,999 | 2 (5.3%) | 2 (7.7%) |
| $55,000 to $64,999 | 2 (5.3%) | 5 (19.2%) |
| $65,000 to $74,999 | 1 (2.6%) | 2 (7.7%) |
| $75,000 to $99,999 | 0 (0.0%) | 2 (7.7%) |
| $100,000+ | 4 (10.5%) | 1 (3.8%) |
| Total | 38 (100.0%) | 26 (100.0%) |
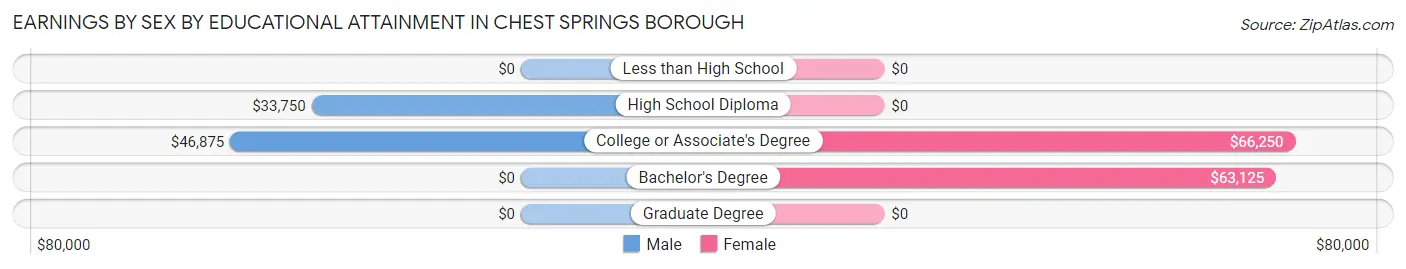
Earnings by Sex by Educational Attainment in Chest Springs borough
Average earnings in Chest Springs borough are $38,438 for men and $49,375 for women, a difference of 22.2%. Men with an educational attainment of college or associate's degree enjoy the highest average annual earnings of $46,875, while those with high school diploma education earn the least with $33,750. Women with an educational attainment of college or associate's degree earn the most with the average annual earnings of $66,250, while those with bachelor's degree education have the smallest earnings of $63,125.
| Educational Attainment | Male Income | Female Income |
| Less than High School | - | - |
| High School Diploma | $33,750 | $0 |
| College or Associate's Degree | $46,875 | $66,250 |
| Bachelor's Degree | - | - |
| Graduate Degree | - | - |
| Total | $38,438 | $49,375 |
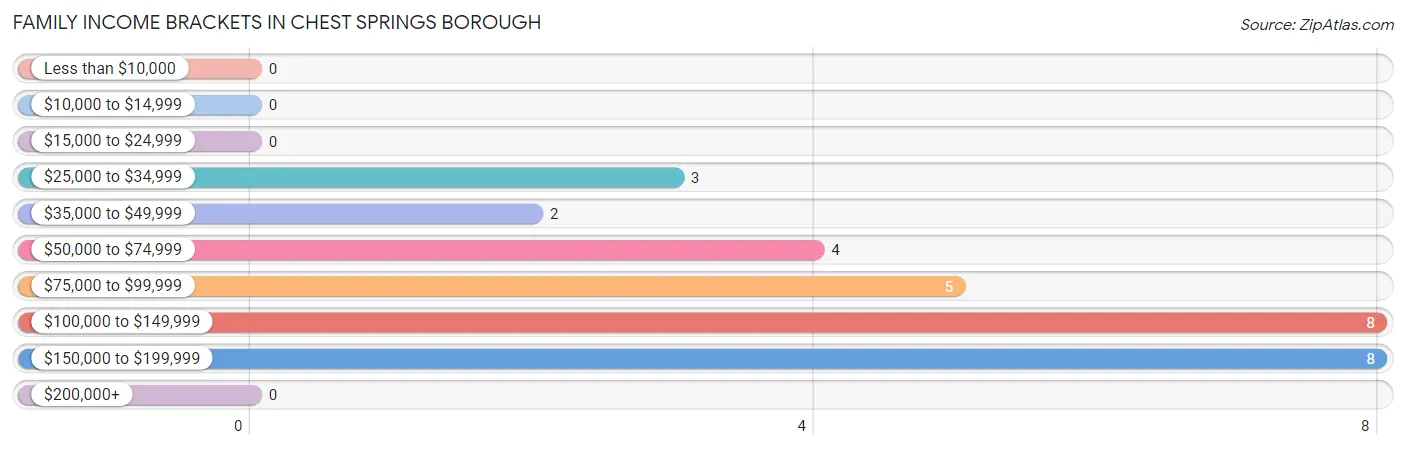
Family Income in Chest Springs borough
Family Income Brackets in Chest Springs borough
According to the Chest Springs borough family income data, there are 8 families falling into the $100,000 to $149,999 income range, which is the most common income bracket and makes up 26.7% of all families.
| Income Bracket | # Families | % Families |
| Less than $10,000 | 0 | 0.0% |
| $10,000 to $14,999 | 0 | 0.0% |
| $15,000 to $24,999 | 0 | 0.0% |
| $25,000 to $34,999 | 3 | 10.0% |
| $35,000 to $49,999 | 2 | 6.7% |
| $50,000 to $74,999 | 4 | 13.3% |
| $75,000 to $99,999 | 5 | 16.7% |
| $100,000 to $149,999 | 8 | 26.7% |
| $150,000 to $199,999 | 8 | 26.7% |
| $200,000+ | 0 | 0.0% |
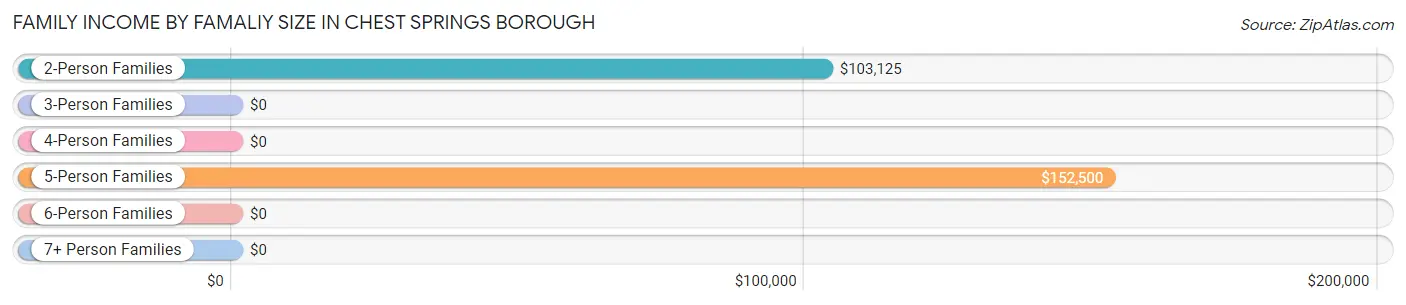
Family Income by Famaliy Size in Chest Springs borough
5-person families (6 | 20.0%) account for the highest median family income in Chest Springs borough with $152,500 per family, while 2-person families (15 | 50.0%) have the highest median income of $51,562 per family member.
| Income Bracket | # Families | Median Income |
| 2-Person Families | 15 (50.0%) | $103,125 |
| 3-Person Families | 5 (16.7%) | $0 |
| 4-Person Families | 4 (13.3%) | $0 |
| 5-Person Families | 6 (20.0%) | $152,500 |
| 6-Person Families | 0 (0.0%) | $0 |
| 7+ Person Families | 0 (0.0%) | $0 |
| Total | 30 (100.0%) | $103,750 |
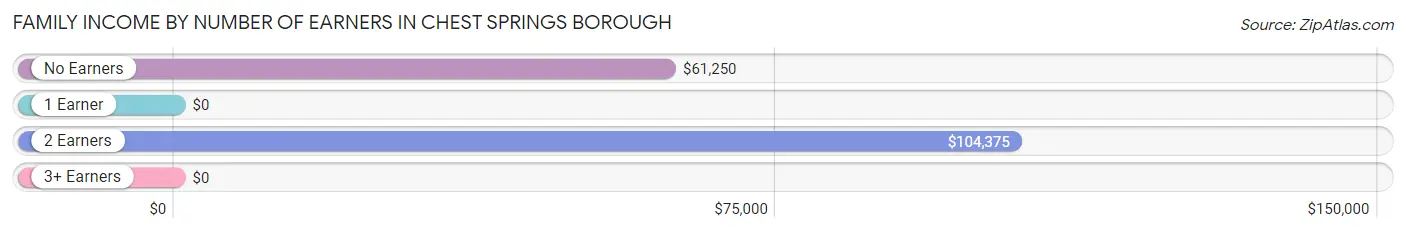
Family Income by Number of Earners in Chest Springs borough
| Number of Earners | # Families | Median Income |
| No Earners | 4 (13.3%) | $61,250 |
| 1 Earner | 8 (26.7%) | $0 |
| 2 Earners | 15 (50.0%) | $104,375 |
| 3+ Earners | 3 (10.0%) | $0 |
| Total | 30 (100.0%) | $103,750 |
Household Income in Chest Springs borough
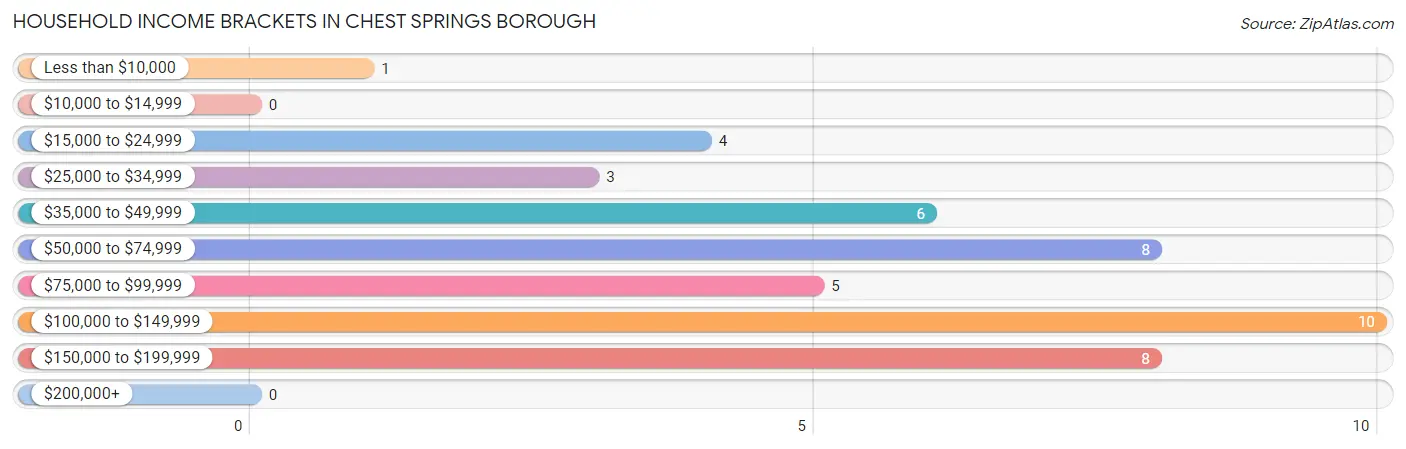
Household Income Brackets in Chest Springs borough
With 10 households falling in the category, the $100,000 to $149,999 income range is the most frequent in Chest Springs borough, accounting for 22.2% of all households.
| Income Bracket | # Households | % Households |
| Less than $10,000 | 1 | 2.2% |
| $10,000 to $14,999 | 0 | 0.0% |
| $15,000 to $24,999 | 4 | 8.9% |
| $25,000 to $34,999 | 3 | 6.7% |
| $35,000 to $49,999 | 6 | 13.3% |
| $50,000 to $74,999 | 8 | 17.8% |
| $75,000 to $99,999 | 5 | 11.1% |
| $100,000 to $149,999 | 10 | 22.2% |
| $150,000 to $199,999 | 8 | 17.8% |
| $200,000+ | 0 | 0.0% |
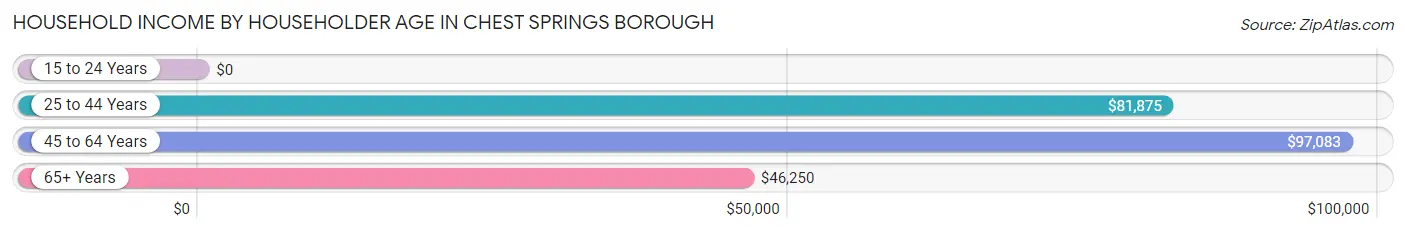
Household Income by Householder Age in Chest Springs borough
The median household income in Chest Springs borough is $80,625, with the highest median household income of $97,083 found in the 45 to 64 years age bracket for the primary householder. A total of 19 households (42.2%) fall into this category.
| Income Bracket | # Households | Median Income |
| 15 to 24 Years | 0 (0.0%) | $0 |
| 25 to 44 Years | 15 (33.3%) | $81,875 |
| 45 to 64 Years | 19 (42.2%) | $97,083 |
| 65+ Years | 11 (24.4%) | $46,250 |
| Total | 45 (100.0%) | $80,625 |
Poverty in Chest Springs borough
Income Below Poverty by Sex and Age in Chest Springs borough
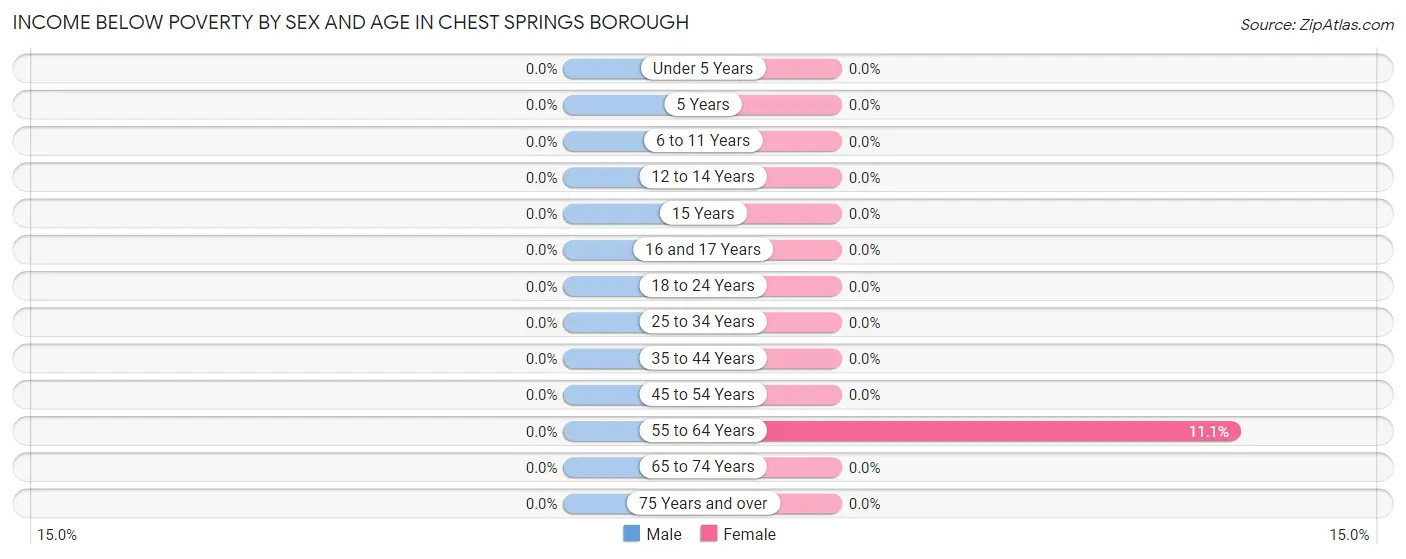
| Age Bracket | Male | Female |
| Under 5 Years | 0 (0.0%) | 0 (0.0%) |
| 5 Years | 0 (0.0%) | 0 (0.0%) |
| 6 to 11 Years | 0 (0.0%) | 0 (0.0%) |
| 12 to 14 Years | 0 (0.0%) | 0 (0.0%) |
| 15 Years | 0 (0.0%) | 0 (0.0%) |
| 16 and 17 Years | 0 (0.0%) | 0 (0.0%) |
| 18 to 24 Years | 0 (0.0%) | 0 (0.0%) |
| 25 to 34 Years | 0 (0.0%) | 0 (0.0%) |
| 35 to 44 Years | 0 (0.0%) | 0 (0.0%) |
| 45 to 54 Years | 0 (0.0%) | 0 (0.0%) |
| 55 to 64 Years | 0 (0.0%) | 1 (11.1%) |
| 65 to 74 Years | 0 (0.0%) | 0 (0.0%) |
| 75 Years and over | 0 (0.0%) | 0 (0.0%) |
| Total | 0 (0.0%) | 1 (1.9%) |
Income Above Poverty by Sex and Age in Chest Springs borough
According to the poverty statistics in Chest Springs borough, males aged under 5 years and females aged under 5 years are the age groups that are most secure financially, with 100.0% of males and 100.0% of females in these age groups living above the poverty line.
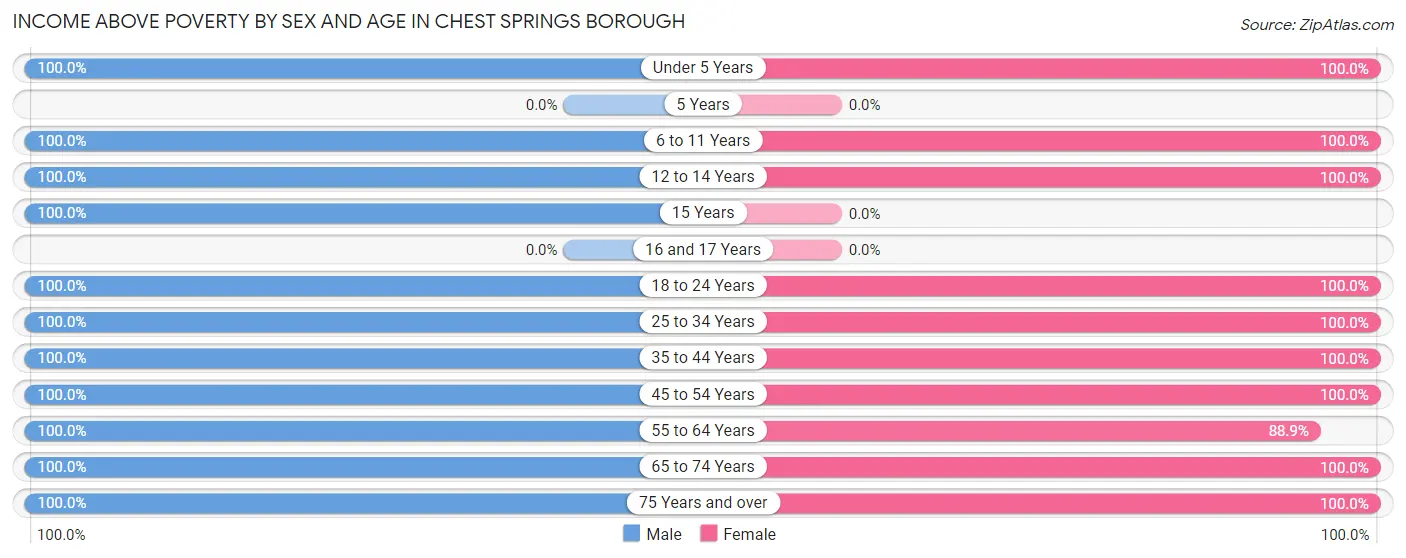
| Age Bracket | Male | Female |
| Under 5 Years | 4 (100.0%) | 4 (100.0%) |
| 5 Years | 0 (0.0%) | 0 (0.0%) |
| 6 to 11 Years | 4 (100.0%) | 8 (100.0%) |
| 12 to 14 Years | 4 (100.0%) | 2 (100.0%) |
| 15 Years | 2 (100.0%) | 0 (0.0%) |
| 16 and 17 Years | 0 (0.0%) | 0 (0.0%) |
| 18 to 24 Years | 5 (100.0%) | 1 (100.0%) |
| 25 to 34 Years | 4 (100.0%) | 5 (100.0%) |
| 35 to 44 Years | 11 (100.0%) | 7 (100.0%) |
| 45 to 54 Years | 5 (100.0%) | 8 (100.0%) |
| 55 to 64 Years | 15 (100.0%) | 8 (88.9%) |
| 65 to 74 Years | 9 (100.0%) | 6 (100.0%) |
| 75 Years and over | 2 (100.0%) | 3 (100.0%) |
| Total | 65 (100.0%) | 52 (98.1%) |
Income Below Poverty Among Married-Couple Families in Chest Springs borough
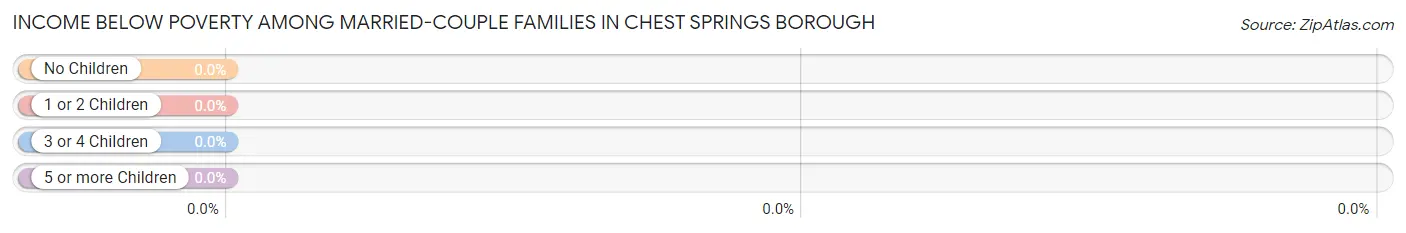
| Children | Above Poverty | Below Poverty |
| No Children | 15 (100.0%) | 0 (0.0%) |
| 1 or 2 Children | 8 (100.0%) | 0 (0.0%) |
| 3 or 4 Children | 4 (100.0%) | 0 (0.0%) |
| 5 or more Children | 0 (0.0%) | 0 (0.0%) |
| Total | 27 (100.0%) | 0 (0.0%) |
Income Below Poverty Among Single-Parent Households in Chest Springs borough
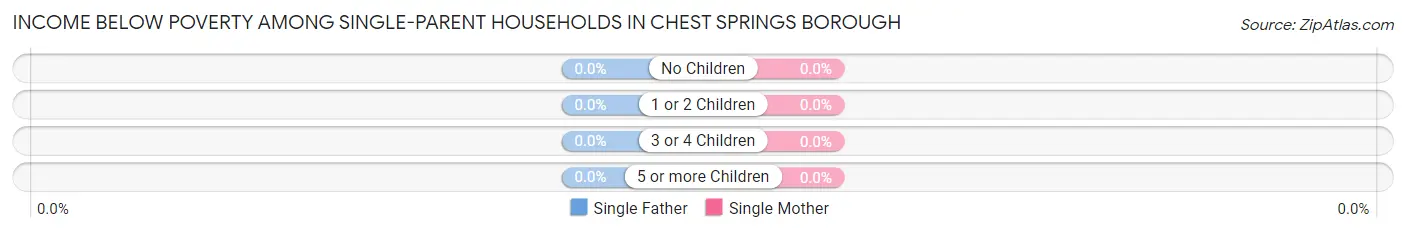
| Children | Single Father | Single Mother |
| No Children | 0 (0.0%) | 0 (0.0%) |
| 1 or 2 Children | 0 (0.0%) | 0 (0.0%) |
| 3 or 4 Children | 0 (0.0%) | 0 (0.0%) |
| 5 or more Children | 0 (0.0%) | 0 (0.0%) |
| Total | 0 (0.0%) | 0 (0.0%) |
Income Below Poverty Among Married-Couple vs Single-Parent Households in Chest Springs borough
| Children | Married-Couple Families | Single-Parent Households |
| No Children | 0 (0.0%) | 0 (0.0%) |
| 1 or 2 Children | 0 (0.0%) | 0 (0.0%) |
| 3 or 4 Children | 0 (0.0%) | 0 (0.0%) |
| 5 or more Children | 0 (0.0%) | 0 (0.0%) |
| Total | 0 (0.0%) | 0 (0.0%) |
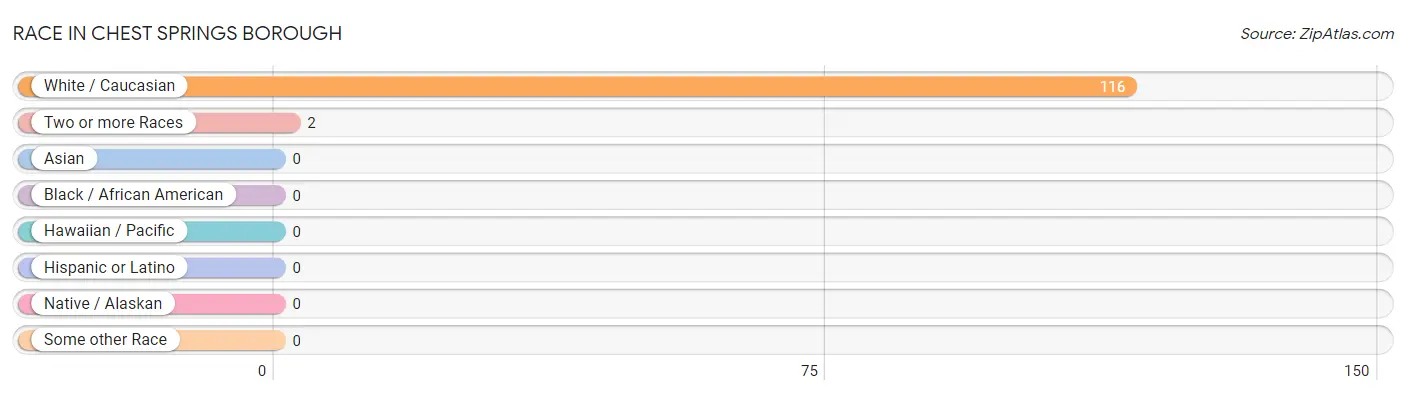
Race in Chest Springs borough
The most populous races in Chest Springs borough are White / Caucasian (116 | 98.3%), and Two or more Races (2 | 1.7%).
| Race | # Population | % Population |
| Asian | 0 | 0.0% |
| Black / African American | 0 | 0.0% |
| Hawaiian / Pacific | 0 | 0.0% |
| Hispanic or Latino | 0 | 0.0% |
| Native / Alaskan | 0 | 0.0% |
| White / Caucasian | 116 | 98.3% |
| Two or more Races | 2 | 1.7% |
| Some other Race | 0 | 0.0% |
| Total | 118 | 100.0% |
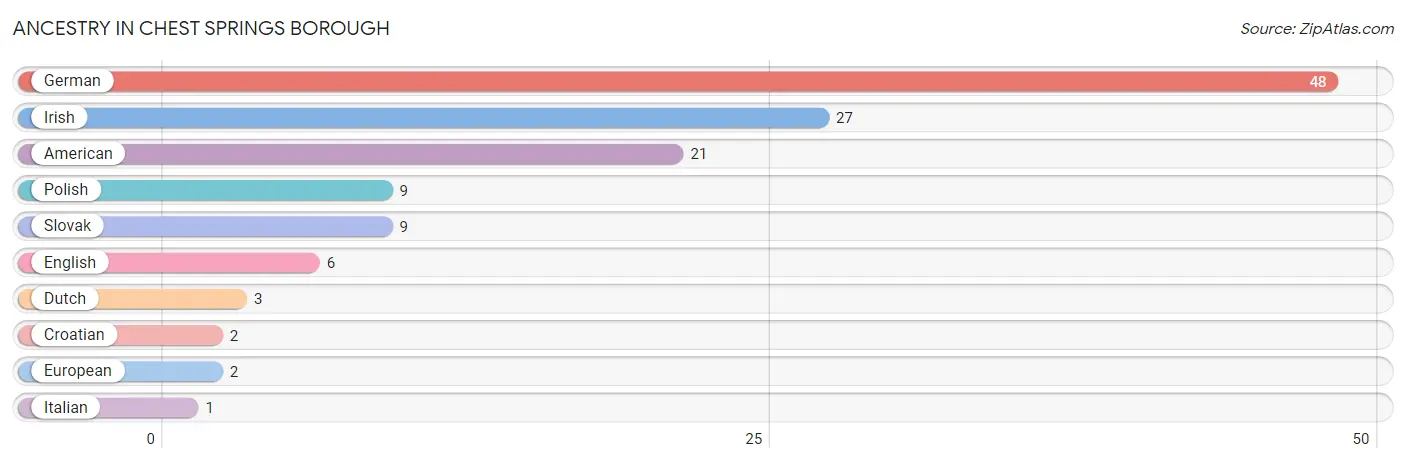
Ancestry in Chest Springs borough
The most populous ancestries reported in Chest Springs borough are German (48 | 40.7%), Irish (27 | 22.9%), American (21 | 17.8%), Polish (9 | 7.6%), and Slovak (9 | 7.6%), together accounting for 96.6% of all Chest Springs borough residents.
| Ancestry | # Population | % Population |
| American | 21 | 17.8% |
| Croatian | 2 | 1.7% |
| Dutch | 3 | 2.5% |
| English | 6 | 5.1% |
| European | 2 | 1.7% |
| German | 48 | 40.7% |
| Irish | 27 | 22.9% |
| Italian | 1 | 0.9% |
| Polish | 9 | 7.6% |
| Slovak | 9 | 7.6% | View All 10 Rows |
Immigrants in Chest Springs borough

| Immigration Origin | # Population | % Population | View All 0 Rows |
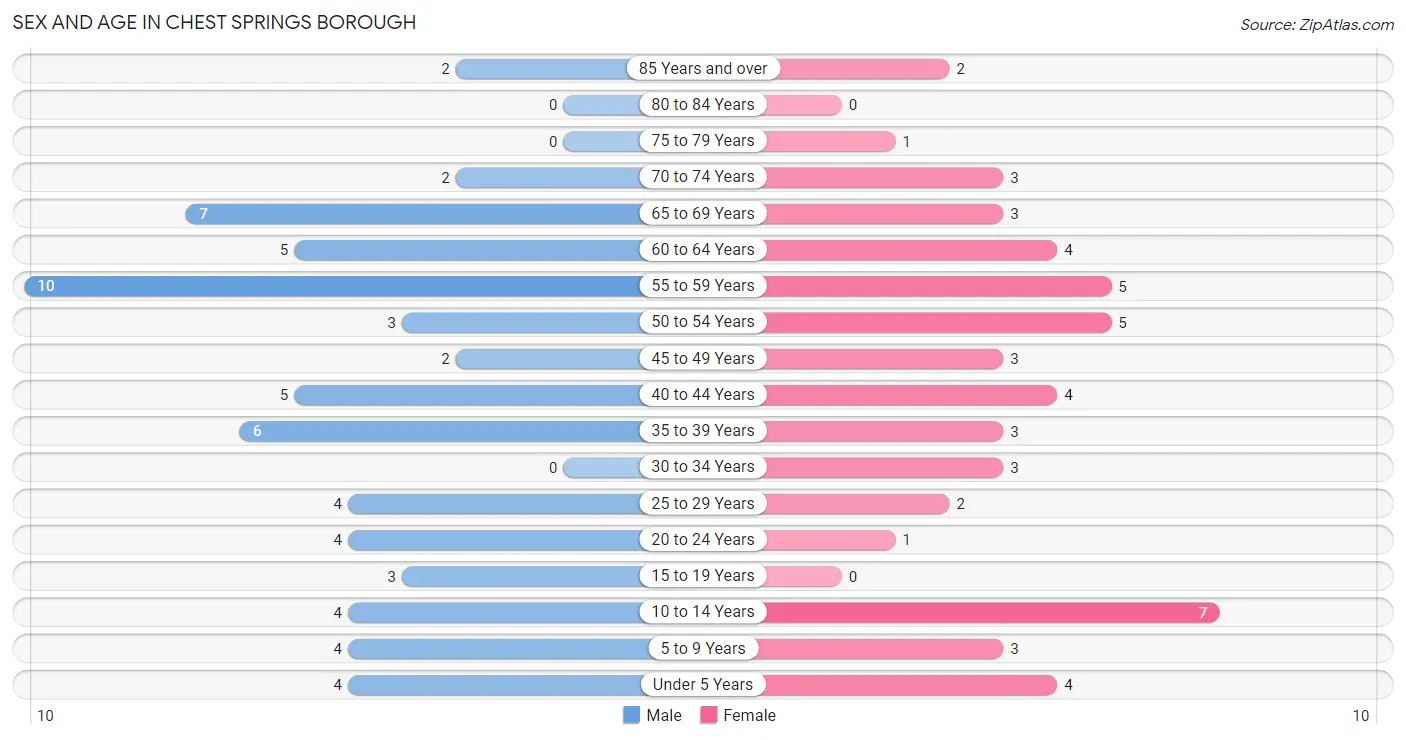
Sex and Age in Chest Springs borough
Sex and Age in Chest Springs borough
The most populous age groups in Chest Springs borough are 55 to 59 Years (10 | 15.4%) for men and 10 to 14 Years (7 | 13.2%) for women.
| Age Bracket | Male | Female |
| Under 5 Years | 4 (6.1%) | 4 (7.5%) |
| 5 to 9 Years | 4 (6.1%) | 3 (5.7%) |
| 10 to 14 Years | 4 (6.1%) | 7 (13.2%) |
| 15 to 19 Years | 3 (4.6%) | 0 (0.0%) |
| 20 to 24 Years | 4 (6.1%) | 1 (1.9%) |
| 25 to 29 Years | 4 (6.1%) | 2 (3.8%) |
| 30 to 34 Years | 0 (0.0%) | 3 (5.7%) |
| 35 to 39 Years | 6 (9.2%) | 3 (5.7%) |
| 40 to 44 Years | 5 (7.7%) | 4 (7.5%) |
| 45 to 49 Years | 2 (3.1%) | 3 (5.7%) |
| 50 to 54 Years | 3 (4.6%) | 5 (9.4%) |
| 55 to 59 Years | 10 (15.4%) | 5 (9.4%) |
| 60 to 64 Years | 5 (7.7%) | 4 (7.5%) |
| 65 to 69 Years | 7 (10.8%) | 3 (5.7%) |
| 70 to 74 Years | 2 (3.1%) | 3 (5.7%) |
| 75 to 79 Years | 0 (0.0%) | 1 (1.9%) |
| 80 to 84 Years | 0 (0.0%) | 0 (0.0%) |
| 85 Years and over | 2 (3.1%) | 2 (3.8%) |
| Total | 65 (100.0%) | 53 (100.0%) |
Families and Households in Chest Springs borough
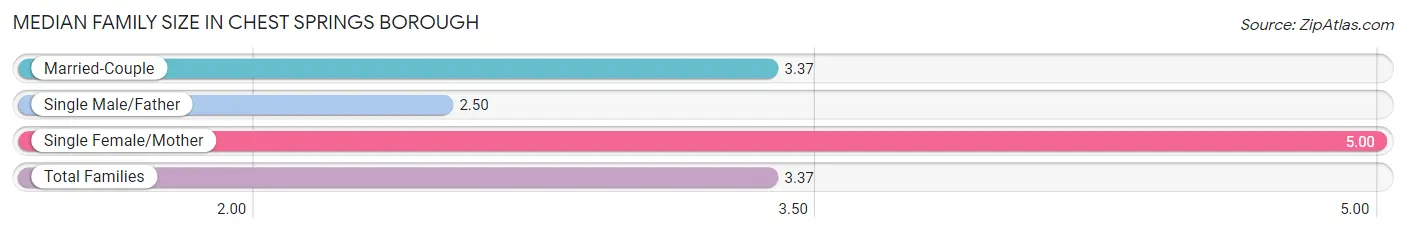
Median Family Size in Chest Springs borough
The median family size in Chest Springs borough is 3.37 persons per family, with single female/mother families (1 | 3.3%) accounting for the largest median family size of 5 persons per family. On the other hand, single male/father families (2 | 6.7%) represent the smallest median family size with 2.50 persons per family.
| Family Type | # Families | Family Size |
| Married-Couple | 27 (90.0%) | 3.37 |
| Single Male/Father | 2 (6.7%) | 2.50 |
| Single Female/Mother | 1 (3.3%) | 5.00 |
| Total Families | 30 (100.0%) | 3.37 |
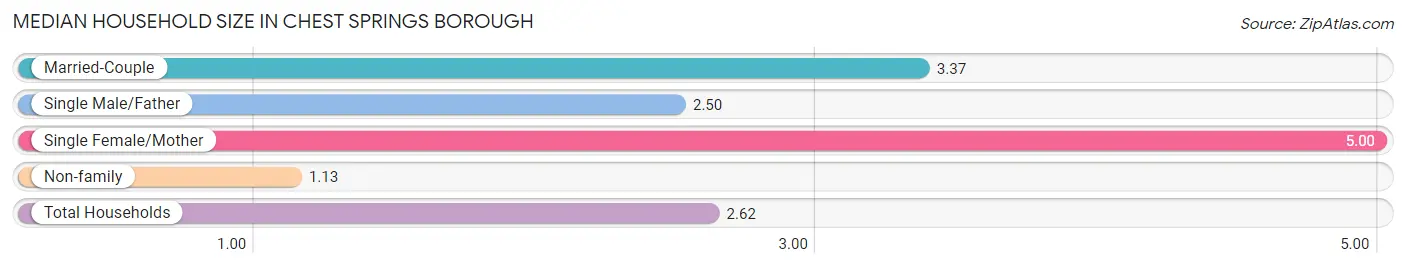
Median Household Size in Chest Springs borough
The median household size in Chest Springs borough is 2.62 persons per household, with single female/mother households (1 | 2.2%) accounting for the largest median household size of 5 persons per household. non-family households (15 | 33.3%) represent the smallest median household size with 1.13 persons per household.
| Household Type | # Households | Household Size |
| Married-Couple | 27 (60.0%) | 3.37 |
| Single Male/Father | 2 (4.4%) | 2.50 |
| Single Female/Mother | 1 (2.2%) | 5.00 |
| Non-family | 15 (33.3%) | 1.13 |
| Total Households | 45 (100.0%) | 2.62 |
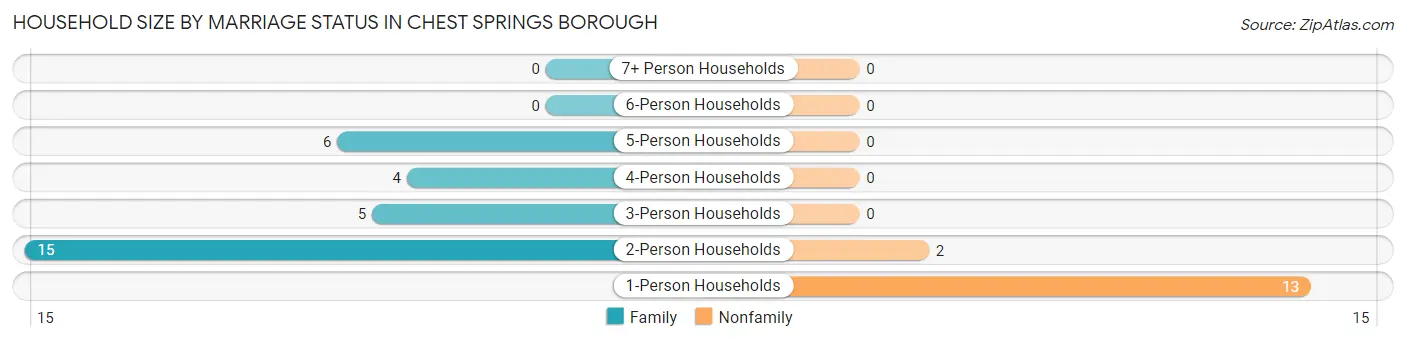
Household Size by Marriage Status in Chest Springs borough
Out of a total of 45 households in Chest Springs borough, 30 (66.7%) are family households, while 15 (33.3%) are nonfamily households. The most numerous type of family households are 2-person households, comprising 15, and the most common type of nonfamily households are 1-person households, comprising 13.
| Household Size | Family Households | Nonfamily Households |
| 1-Person Households | - | 13 (28.9%) |
| 2-Person Households | 15 (33.3%) | 2 (4.4%) |
| 3-Person Households | 5 (11.1%) | 0 (0.0%) |
| 4-Person Households | 4 (8.9%) | 0 (0.0%) |
| 5-Person Households | 6 (13.3%) | 0 (0.0%) |
| 6-Person Households | 0 (0.0%) | 0 (0.0%) |
| 7+ Person Households | 0 (0.0%) | 0 (0.0%) |
| Total | 30 (66.7%) | 15 (33.3%) |
Female Fertility in Chest Springs borough
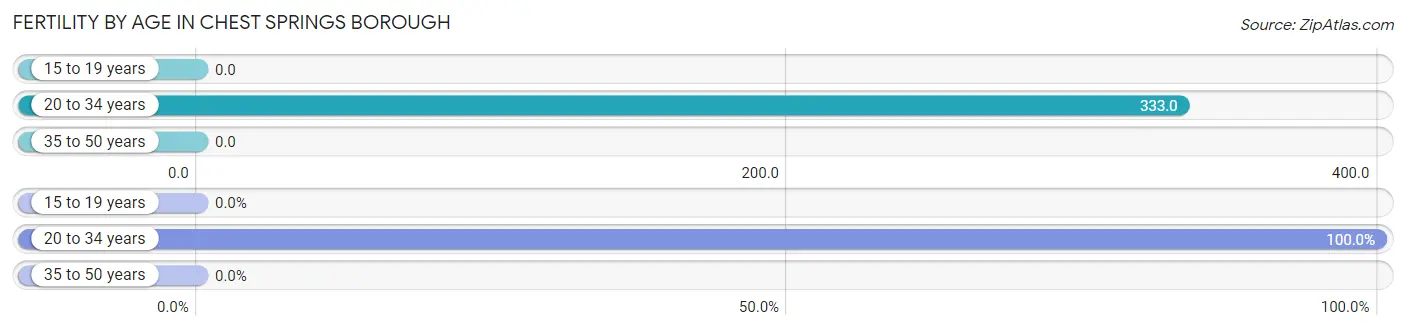
Fertility by Age in Chest Springs borough
Average fertility rate in Chest Springs borough is 118.0 births per 1,000 women. Women in the age bracket of 20 to 34 years have the highest fertility rate with 333.0 births per 1,000 women. Women in the age bracket of 20 to 34 years acount for 100.0% of all women with births.
| Age Bracket | Women with Births | Births / 1,000 Women |
| 15 to 19 years | 0 (0.0%) | 0.0 |
| 20 to 34 years | 2 (100.0%) | 333.0 |
| 35 to 50 years | 0 (0.0%) | 0.0 |
| Total | 2 (100.0%) | 118.0 |
Fertility by Age by Marriage Status in Chest Springs borough
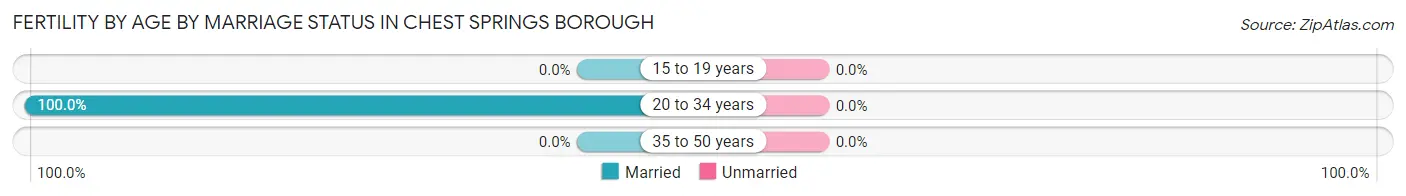
| Age Bracket | Married | Unmarried |
| 15 to 19 years | 0 (0.0%) | 0 (0.0%) |
| 20 to 34 years | 2 (100.0%) | 0 (0.0%) |
| 35 to 50 years | 0 (0.0%) | 0 (0.0%) |
| Total | 2 (100.0%) | 0 (0.0%) |
Fertility by Education in Chest Springs borough
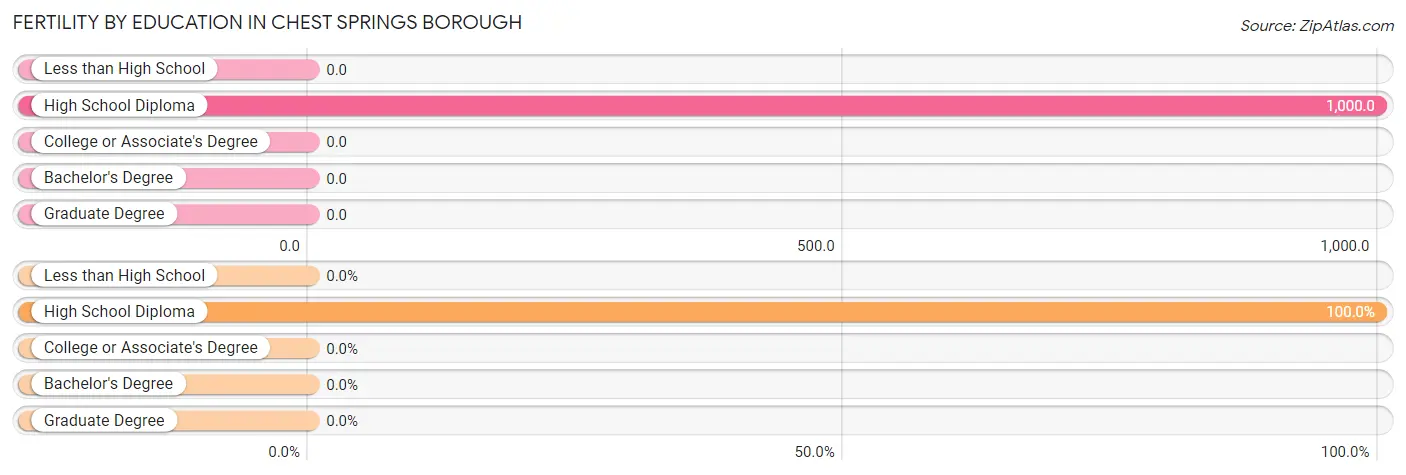
| Educational Attainment | Women with Births | Births / 1,000 Women |
| Less than High School | 0 (0.0%) | 0.0 |
| High School Diploma | 2 (100.0%) | 1,000.0 |
| College or Associate's Degree | 0 (0.0%) | 0.0 |
| Bachelor's Degree | 0 (0.0%) | 0.0 |
| Graduate Degree | 0 (0.0%) | 0.0 |
| Total | 2 (100.0%) | 118.0 |
Fertility by Education by Marriage Status in Chest Springs borough
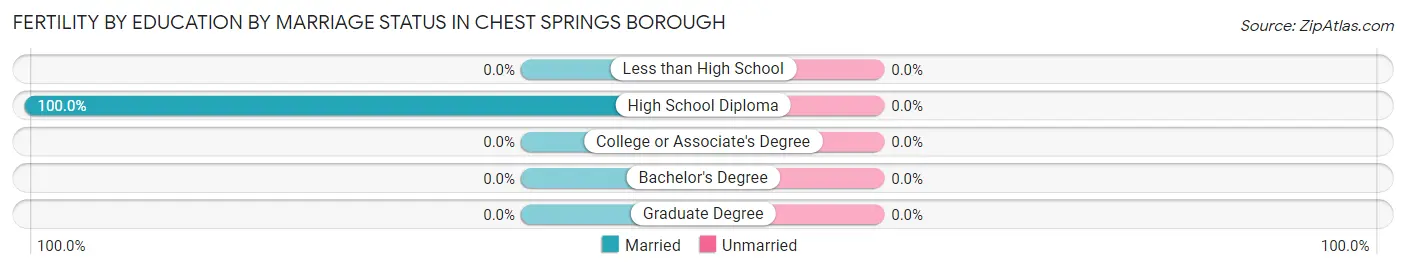
| Educational Attainment | Married | Unmarried |
| Less than High School | 0 (0.0%) | 0 (0.0%) |
| High School Diploma | 2 (100.0%) | 0 (0.0%) |
| College or Associate's Degree | 0 (0.0%) | 0 (0.0%) |
| Bachelor's Degree | 0 (0.0%) | 0 (0.0%) |
| Graduate Degree | 0 (0.0%) | 0 (0.0%) |
| Total | 2 (100.0%) | 0 (0.0%) |
Employment Characteristics in Chest Springs borough
Employment by Class of Employer in Chest Springs borough
Among the 53 employed individuals in Chest Springs borough, private company employees (35 | 66.0%), not-for-profit organizations (5 | 9.4%), and self-employed (not incorporated) (4 | 7.5%) make up the most common classes of employment.
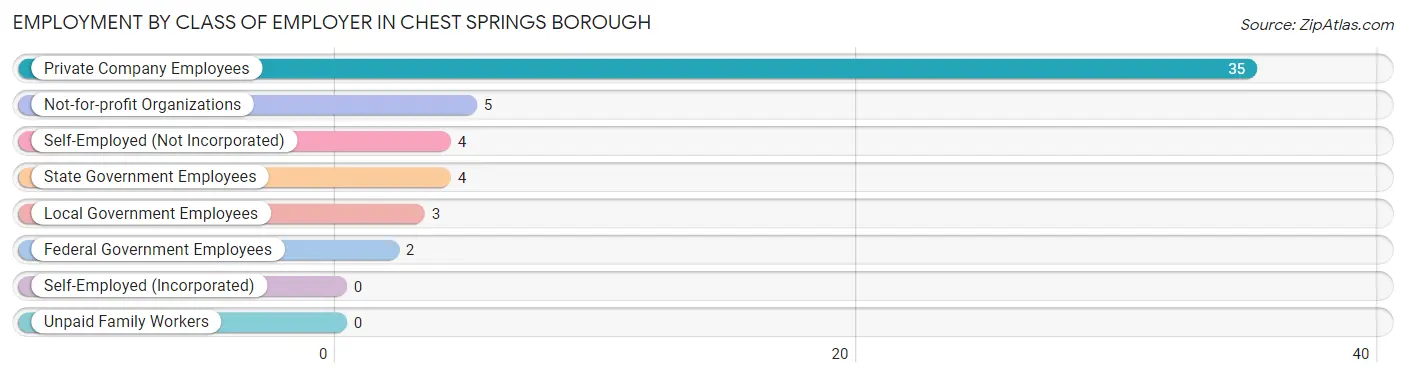
| Employer Class | # Employees | % Employees |
| Private Company Employees | 35 | 66.0% |
| Self-Employed (Incorporated) | 0 | 0.0% |
| Self-Employed (Not Incorporated) | 4 | 7.5% |
| Not-for-profit Organizations | 5 | 9.4% |
| Local Government Employees | 3 | 5.7% |
| State Government Employees | 4 | 7.5% |
| Federal Government Employees | 2 | 3.8% |
| Unpaid Family Workers | 0 | 0.0% |
| Total | 53 | 100.0% |
Employment Status by Age in Chest Springs borough
According to the labor force statistics for Chest Springs borough, out of the total population over 16 years of age (90), 64.4% or 58 individuals are in the labor force, with 1.7% or 1 of them unemployed. The age group with the highest labor force participation rate is 16 to 19 years, with 100.0% or 1 individuals in the labor force. Within the labor force, the 55 to 59 years age range has the highest percentage of unemployed individuals, with 8.3% or 1 of them being unemployed.
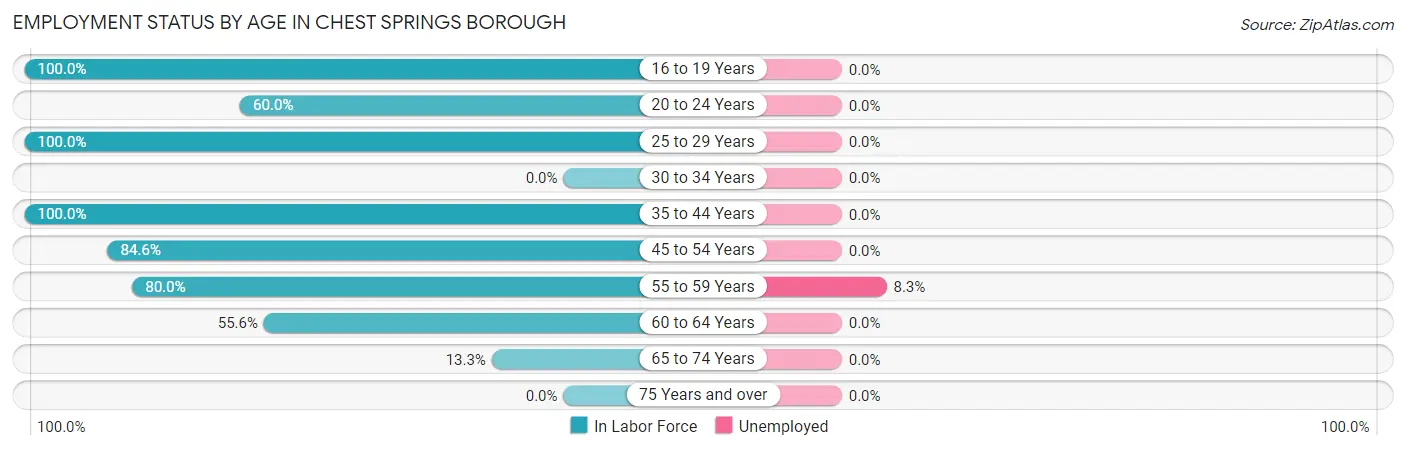
| Age Bracket | In Labor Force | Unemployed |
| 16 to 19 Years | 1 (100.0%) | 0 (0.0%) |
| 20 to 24 Years | 3 (60.0%) | 0 (0.0%) |
| 25 to 29 Years | 6 (100.0%) | 0 (0.0%) |
| 30 to 34 Years | 0 (0.0%) | 0 (0.0%) |
| 35 to 44 Years | 18 (100.0%) | 0 (0.0%) |
| 45 to 54 Years | 11 (84.6%) | 0 (0.0%) |
| 55 to 59 Years | 12 (80.0%) | 1 (8.3%) |
| 60 to 64 Years | 5 (55.6%) | 0 (0.0%) |
| 65 to 74 Years | 2 (13.3%) | 0 (0.0%) |
| 75 Years and over | 0 (0.0%) | 0 (0.0%) |
| Total | 58 (64.4%) | 1 (1.7%) |
Employment Status by Educational Attainment in Chest Springs borough
According to labor force statistics for Chest Springs borough, 81.3% of individuals (52) out of the total population between 25 and 64 years of age (64) are in the labor force, with 1.9% or 1 of them being unemployed. The group with the highest labor force participation rate are those with the educational attainment of bachelor's degree or higher, with 100.0% or 16 individuals in the labor force. Within the labor force, individuals with college / associate degree education have the highest percentage of unemployment, with 7.7% or 1 of them being unemployed.
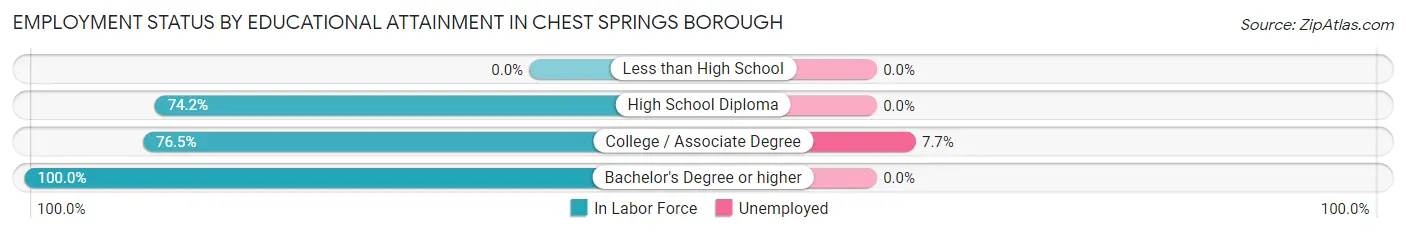
| Educational Attainment | In Labor Force | Unemployed |
| Less than High School | 0 (0.0%) | 0 (0.0%) |
| High School Diploma | 23 (74.2%) | 0 (0.0%) |
| College / Associate Degree | 13 (76.5%) | 1 (7.7%) |
| Bachelor's Degree or higher | 16 (100.0%) | 0 (0.0%) |
| Total | 52 (81.3%) | 1 (1.9%) |
Employment Occupations by Sex in Chest Springs borough
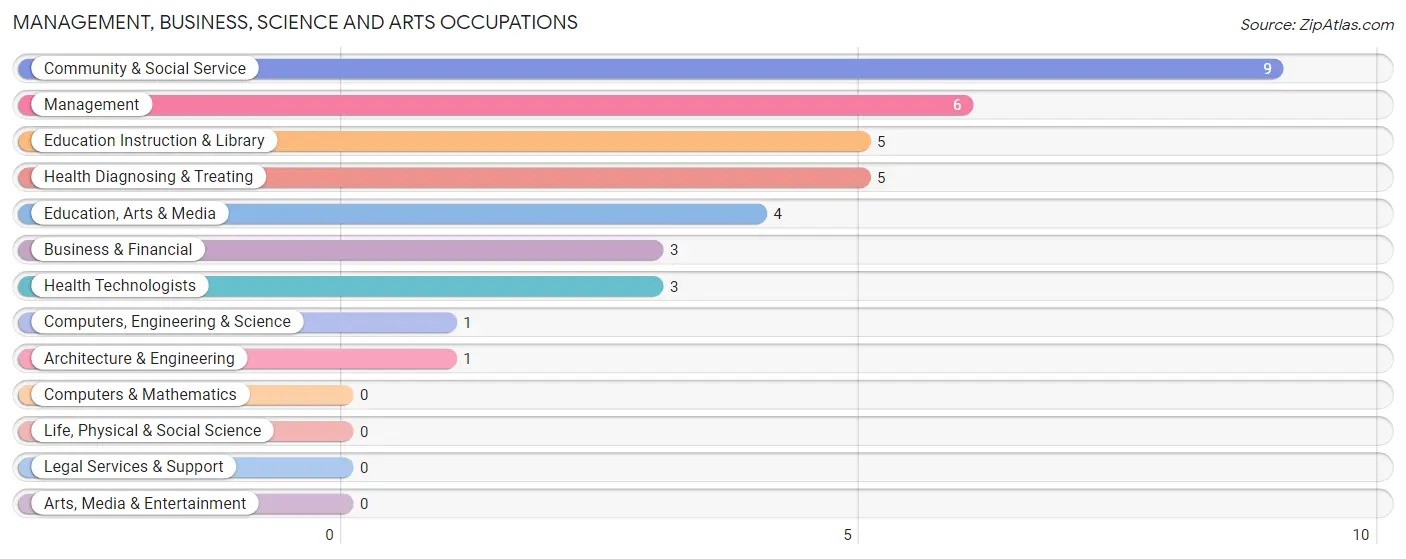
Management, Business, Science and Arts Occupations
The most common Management, Business, Science and Arts occupations in Chest Springs borough are Community & Social Service (9 | 15.8%), Management (6 | 10.5%), Education Instruction & Library (5 | 8.8%), Health Diagnosing & Treating (5 | 8.8%), and Education, Arts & Media (4 | 7.0%).
Management, Business, Science and Arts Occupations by Sex
Within the Management, Business, Science and Arts occupations in Chest Springs borough, the most male-oriented occupations are Computers, Engineering & Science (100.0%), Architecture & Engineering (100.0%), and Management (66.7%), while the most female-oriented occupations are Business & Financial (100.0%), Community & Social Service (100.0%), and Education, Arts & Media (100.0%).
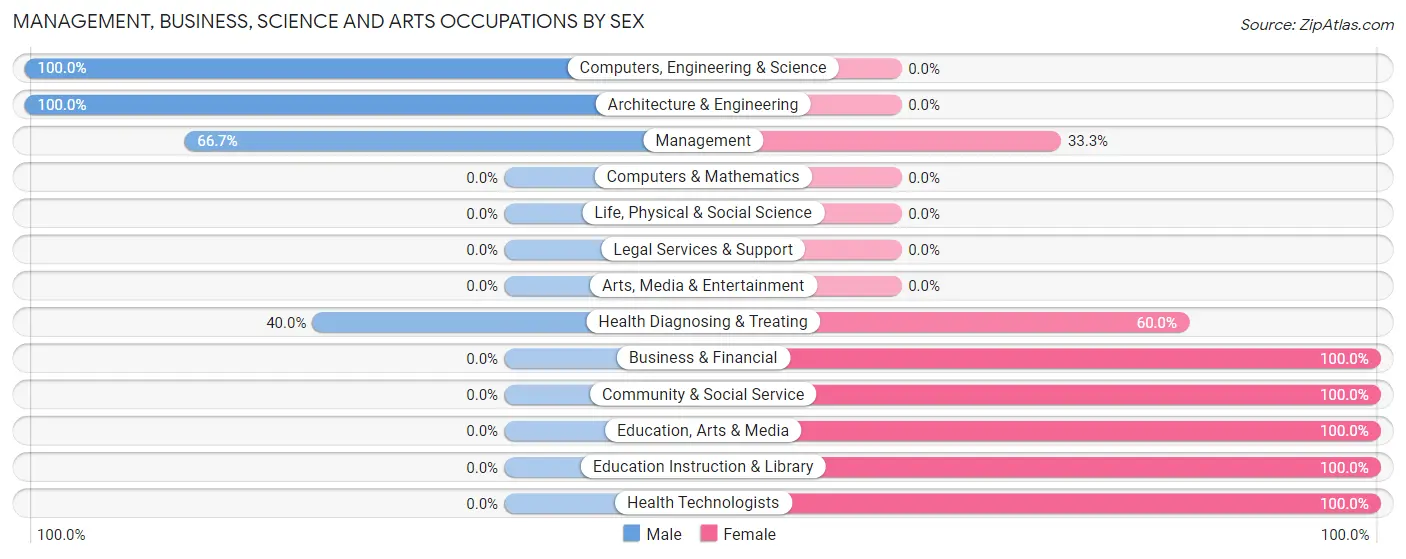
| Occupation | Male | Female |
| Management | 4 (66.7%) | 2 (33.3%) |
| Business & Financial | 0 (0.0%) | 3 (100.0%) |
| Computers, Engineering & Science | 1 (100.0%) | 0 (0.0%) |
| Computers & Mathematics | 0 (0.0%) | 0 (0.0%) |
| Architecture & Engineering | 1 (100.0%) | 0 (0.0%) |
| Life, Physical & Social Science | 0 (0.0%) | 0 (0.0%) |
| Community & Social Service | 0 (0.0%) | 9 (100.0%) |
| Education, Arts & Media | 0 (0.0%) | 4 (100.0%) |
| Legal Services & Support | 0 (0.0%) | 0 (0.0%) |
| Education Instruction & Library | 0 (0.0%) | 5 (100.0%) |
| Arts, Media & Entertainment | 0 (0.0%) | 0 (0.0%) |
| Health Diagnosing & Treating | 2 (40.0%) | 3 (60.0%) |
| Health Technologists | 0 (0.0%) | 3 (100.0%) |
| Total (Category) | 7 (29.2%) | 17 (70.8%) |
| Total (Overall) | 31 (54.4%) | 26 (45.6%) |
Services Occupations
The most common Services occupations in Chest Springs borough are Healthcare Support (2 | 3.5%), and Personal Care & Service (1 | 1.8%).
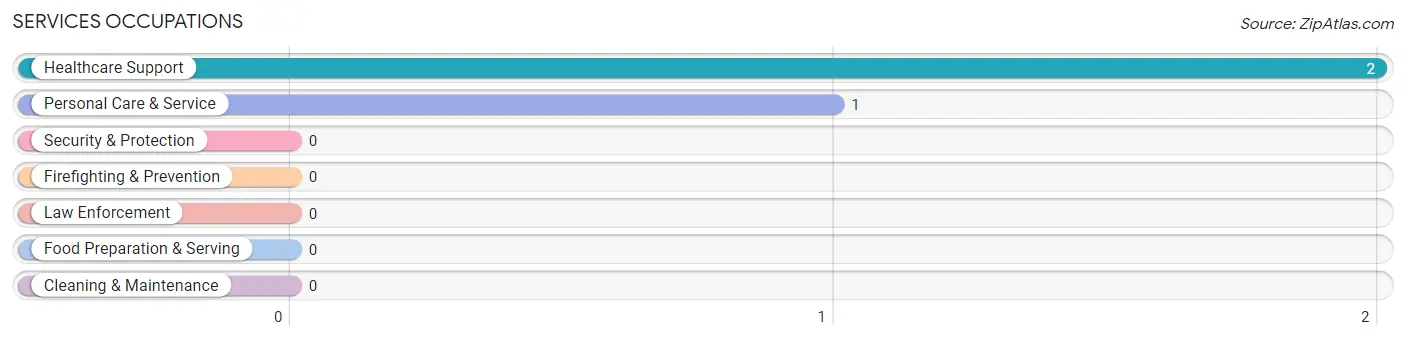
Services Occupations by Sex
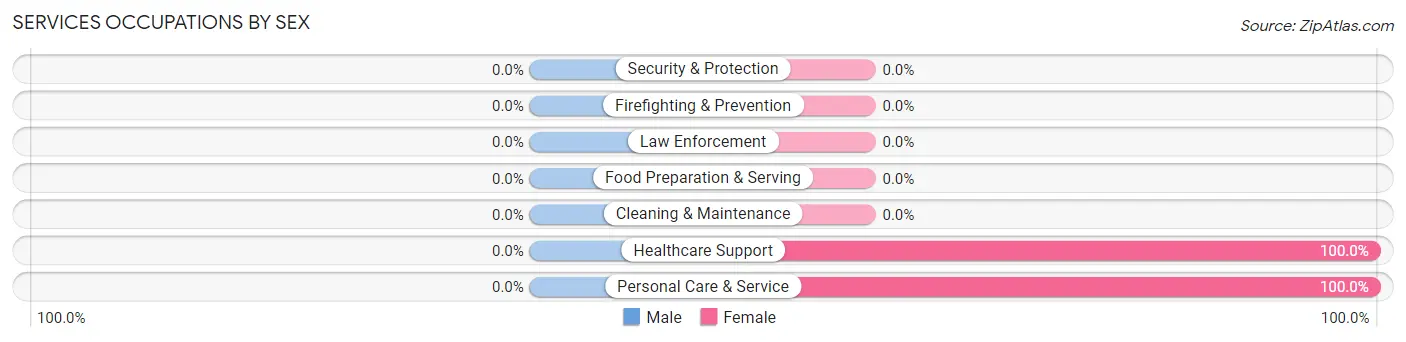
| Occupation | Male | Female |
| Healthcare Support | 0 (0.0%) | 2 (100.0%) |
| Security & Protection | 0 (0.0%) | 0 (0.0%) |
| Firefighting & Prevention | 0 (0.0%) | 0 (0.0%) |
| Law Enforcement | 0 (0.0%) | 0 (0.0%) |
| Food Preparation & Serving | 0 (0.0%) | 0 (0.0%) |
| Cleaning & Maintenance | 0 (0.0%) | 0 (0.0%) |
| Personal Care & Service | 0 (0.0%) | 1 (100.0%) |
| Total (Category) | 0 (0.0%) | 3 (100.0%) |
| Total (Overall) | 31 (54.4%) | 26 (45.6%) |
Sales and Office Occupations
The most common Sales and Office occupations in Chest Springs borough are Office & Administration (7 | 12.3%), and Sales & Related (4 | 7.0%).
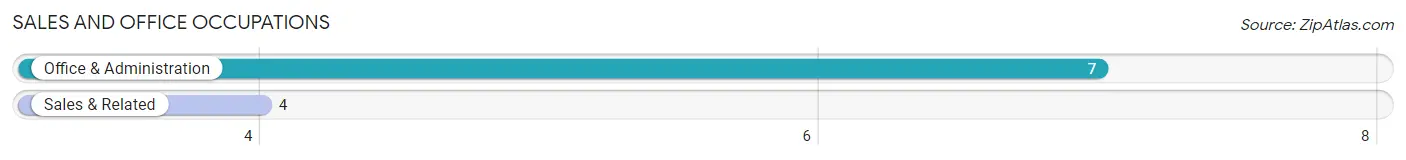
Sales and Office Occupations by Sex
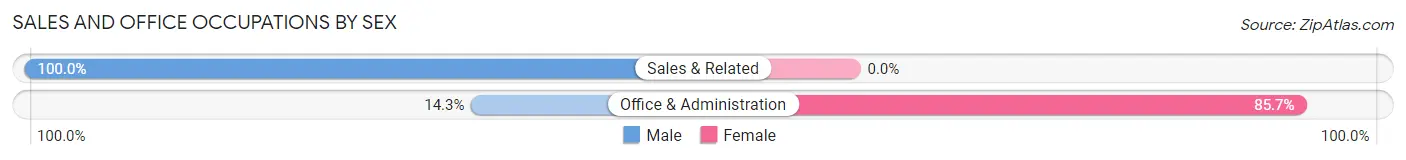
| Occupation | Male | Female |
| Sales & Related | 4 (100.0%) | 0 (0.0%) |
| Office & Administration | 1 (14.3%) | 6 (85.7%) |
| Total (Category) | 5 (45.5%) | 6 (54.5%) |
| Total (Overall) | 31 (54.4%) | 26 (45.6%) |
Natural Resources, Construction and Maintenance Occupations
The most common Natural Resources, Construction and Maintenance occupations in Chest Springs borough are Installation, Maintenance & Repair (6 | 10.5%), and Construction & Extraction (5 | 8.8%).
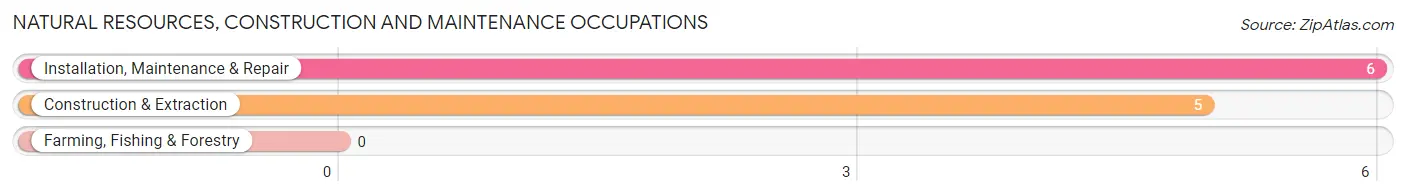
Natural Resources, Construction and Maintenance Occupations by Sex
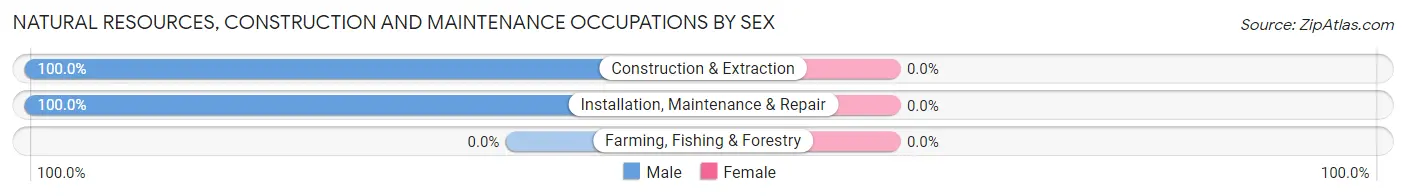
| Occupation | Male | Female |
| Farming, Fishing & Forestry | 0 (0.0%) | 0 (0.0%) |
| Construction & Extraction | 5 (100.0%) | 0 (0.0%) |
| Installation, Maintenance & Repair | 6 (100.0%) | 0 (0.0%) |
| Total (Category) | 11 (100.0%) | 0 (0.0%) |
| Total (Overall) | 31 (54.4%) | 26 (45.6%) |
Production, Transportation and Moving Occupations
The most common Production, Transportation and Moving occupations in Chest Springs borough are Material Moving (4 | 7.0%), Production (2 | 3.5%), and Transportation (2 | 3.5%).
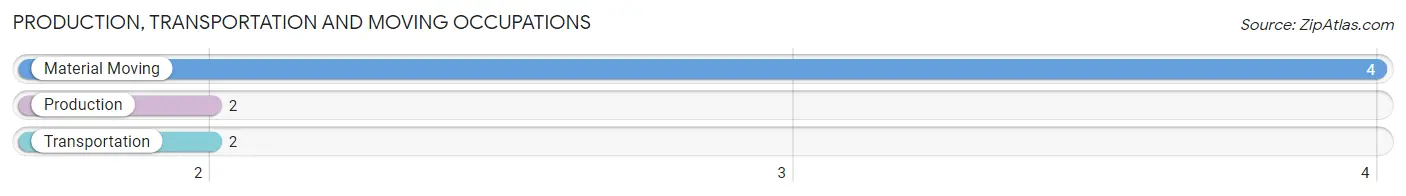
Production, Transportation and Moving Occupations by Sex
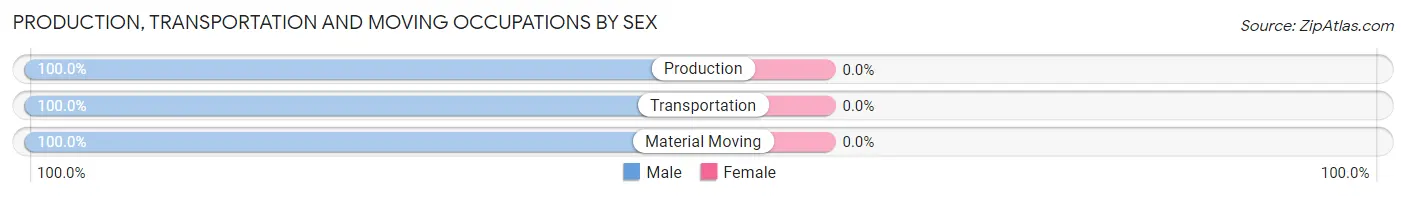
| Occupation | Male | Female |
| Production | 2 (100.0%) | 0 (0.0%) |
| Transportation | 2 (100.0%) | 0 (0.0%) |
| Material Moving | 4 (100.0%) | 0 (0.0%) |
| Total (Category) | 8 (100.0%) | 0 (0.0%) |
| Total (Overall) | 31 (54.4%) | 26 (45.6%) |
Employment Industries by Sex in Chest Springs borough
Employment Industries in Chest Springs borough
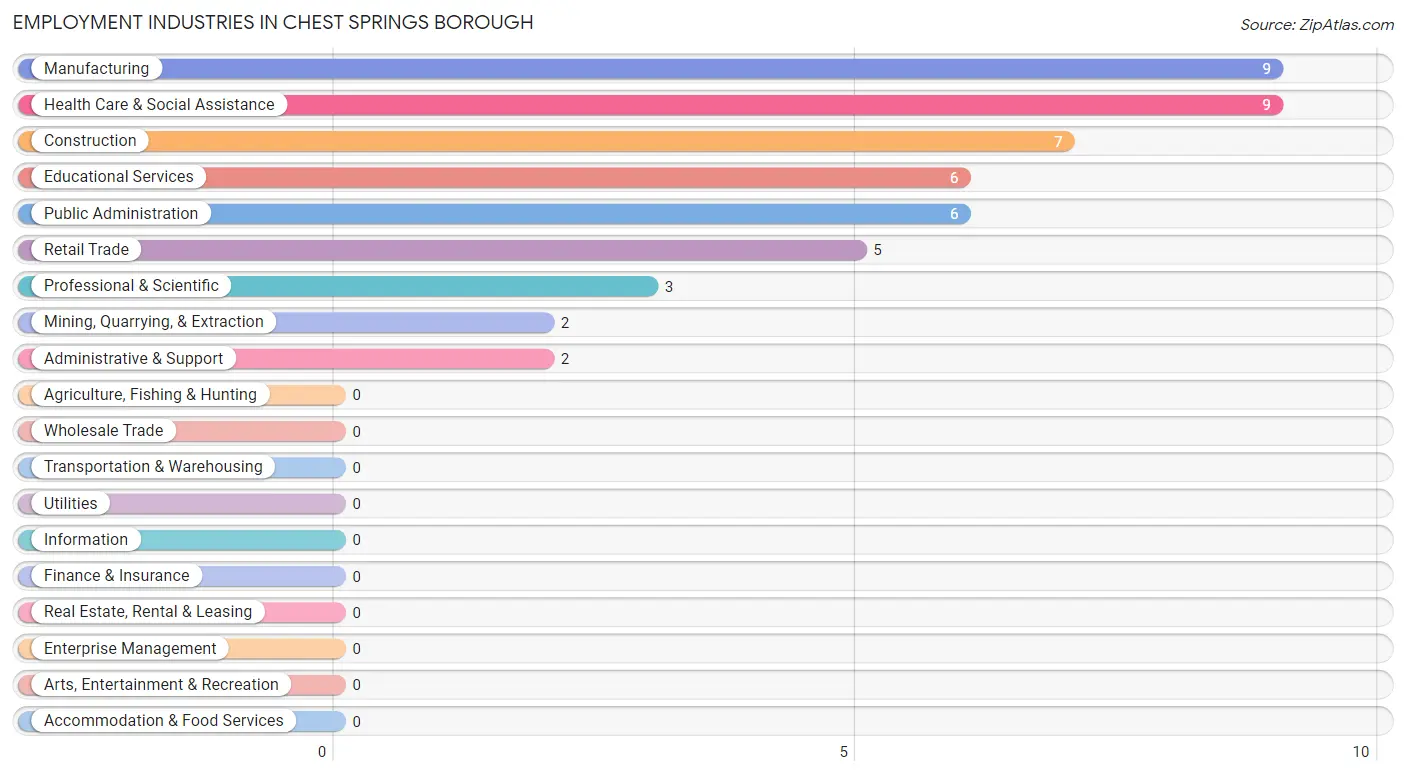
The major employment industries in Chest Springs borough include Manufacturing (9 | 15.8%), Health Care & Social Assistance (9 | 15.8%), Construction (7 | 12.3%), Educational Services (6 | 10.5%), and Public Administration (6 | 10.5%).
Employment Industries by Sex in Chest Springs borough
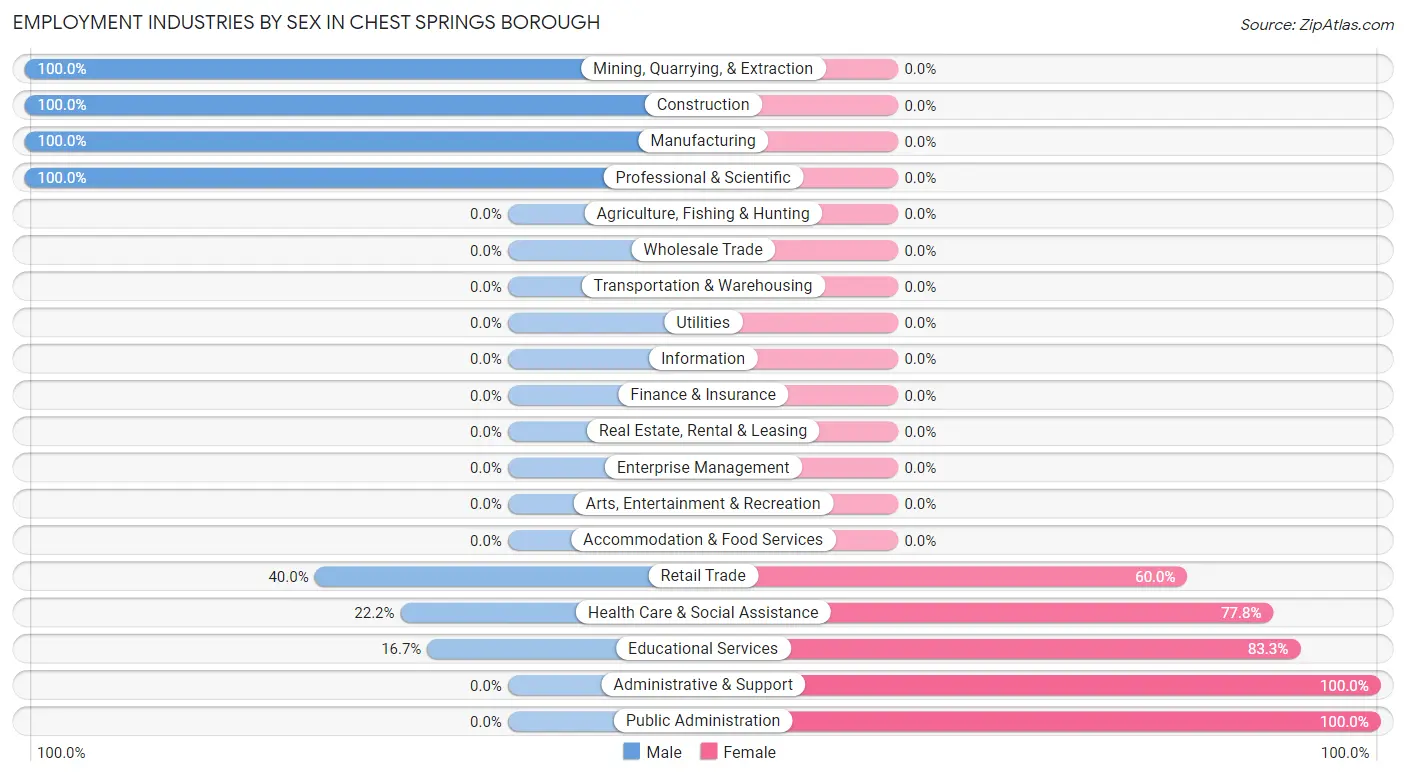
The Chest Springs borough industries that see more men than women are Mining, Quarrying, & Extraction (100.0%), Construction (100.0%), and Manufacturing (100.0%), whereas the industries that tend to have a higher number of women are Administrative & Support (100.0%), Public Administration (100.0%), and Educational Services (83.3%).
| Industry | Male | Female |
| Agriculture, Fishing & Hunting | 0 (0.0%) | 0 (0.0%) |
| Mining, Quarrying, & Extraction | 2 (100.0%) | 0 (0.0%) |
| Construction | 7 (100.0%) | 0 (0.0%) |
| Manufacturing | 9 (100.0%) | 0 (0.0%) |
| Wholesale Trade | 0 (0.0%) | 0 (0.0%) |
| Retail Trade | 2 (40.0%) | 3 (60.0%) |
| Transportation & Warehousing | 0 (0.0%) | 0 (0.0%) |
| Utilities | 0 (0.0%) | 0 (0.0%) |
| Information | 0 (0.0%) | 0 (0.0%) |
| Finance & Insurance | 0 (0.0%) | 0 (0.0%) |
| Real Estate, Rental & Leasing | 0 (0.0%) | 0 (0.0%) |
| Professional & Scientific | 3 (100.0%) | 0 (0.0%) |
| Enterprise Management | 0 (0.0%) | 0 (0.0%) |
| Administrative & Support | 0 (0.0%) | 2 (100.0%) |
| Educational Services | 1 (16.7%) | 5 (83.3%) |
| Health Care & Social Assistance | 2 (22.2%) | 7 (77.8%) |
| Arts, Entertainment & Recreation | 0 (0.0%) | 0 (0.0%) |
| Accommodation & Food Services | 0 (0.0%) | 0 (0.0%) |
| Public Administration | 0 (0.0%) | 6 (100.0%) |
| Total | 31 (54.4%) | 26 (45.6%) |
Education in Chest Springs borough
School Enrollment in Chest Springs borough
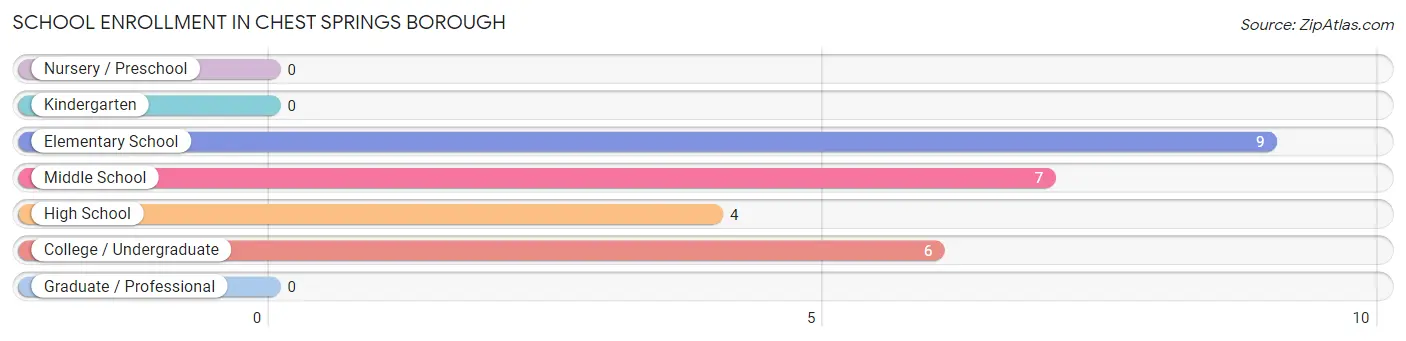
The most common levels of schooling among the 26 students in Chest Springs borough are elementary school (9 | 34.6%), middle school (7 | 26.9%), and college / undergraduate (6 | 23.1%).
| School Level | # Students | % Students |
| Nursery / Preschool | 0 | 0.0% |
| Kindergarten | 0 | 0.0% |
| Elementary School | 9 | 34.6% |
| Middle School | 7 | 26.9% |
| High School | 4 | 15.4% |
| College / Undergraduate | 6 | 23.1% |
| Graduate / Professional | 0 | 0.0% |
| Total | 26 | 100.0% |
School Enrollment by Age by Funding Source in Chest Springs borough
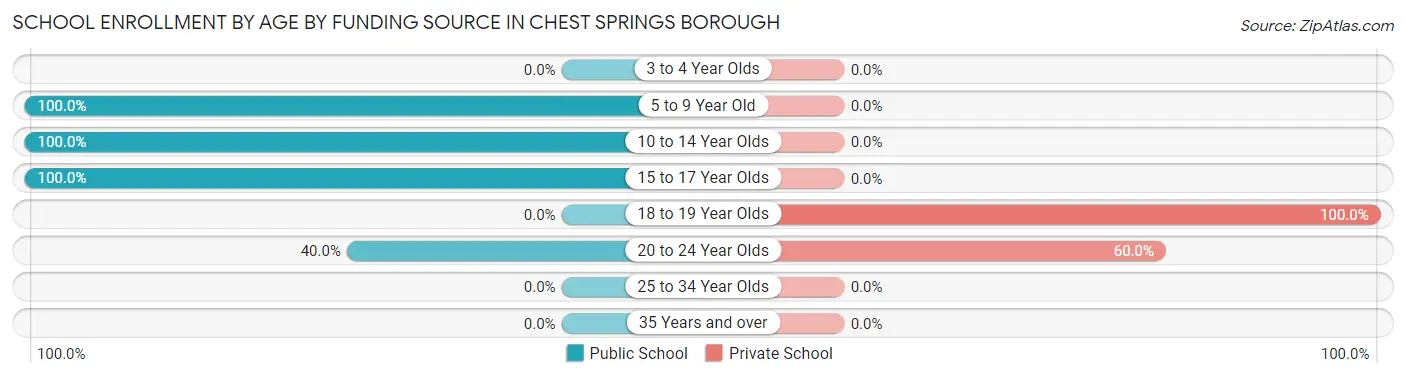
Out of a total of 26 students who are enrolled in schools in Chest Springs borough, 4 (15.4%) attend a private institution, while the remaining 22 (84.6%) are enrolled in public schools. The age group of 18 to 19 year olds has the highest likelihood of being enrolled in private schools, with 1 (100.0% in the age bracket) enrolled. Conversely, the age group of 5 to 9 year old has the lowest likelihood of being enrolled in a private school, with 7 (100.0% in the age bracket) attending a public institution.
| Age Bracket | Public School | Private School |
| 3 to 4 Year Olds | 0 (0.0%) | 0 (0.0%) |
| 5 to 9 Year Old | 7 (100.0%) | 0 (0.0%) |
| 10 to 14 Year Olds | 11 (100.0%) | 0 (0.0%) |
| 15 to 17 Year Olds | 2 (100.0%) | 0 (0.0%) |
| 18 to 19 Year Olds | 0 (0.0%) | 1 (100.0%) |
| 20 to 24 Year Olds | 2 (40.0%) | 3 (60.0%) |
| 25 to 34 Year Olds | 0 (0.0%) | 0 (0.0%) |
| 35 Years and over | 0 (0.0%) | 0 (0.0%) |
| Total | 22 (84.6%) | 4 (15.4%) |
Educational Attainment by Field of Study in Chest Springs borough
Science & technology (6 | 28.6%), visual & performing arts (4 | 19.1%), bio, nature & agricultural (2 | 9.5%), engineering (2 | 9.5%), and business (2 | 9.5%) are the most common fields of study among 21 individuals in Chest Springs borough who have obtained a bachelor's degree or higher.
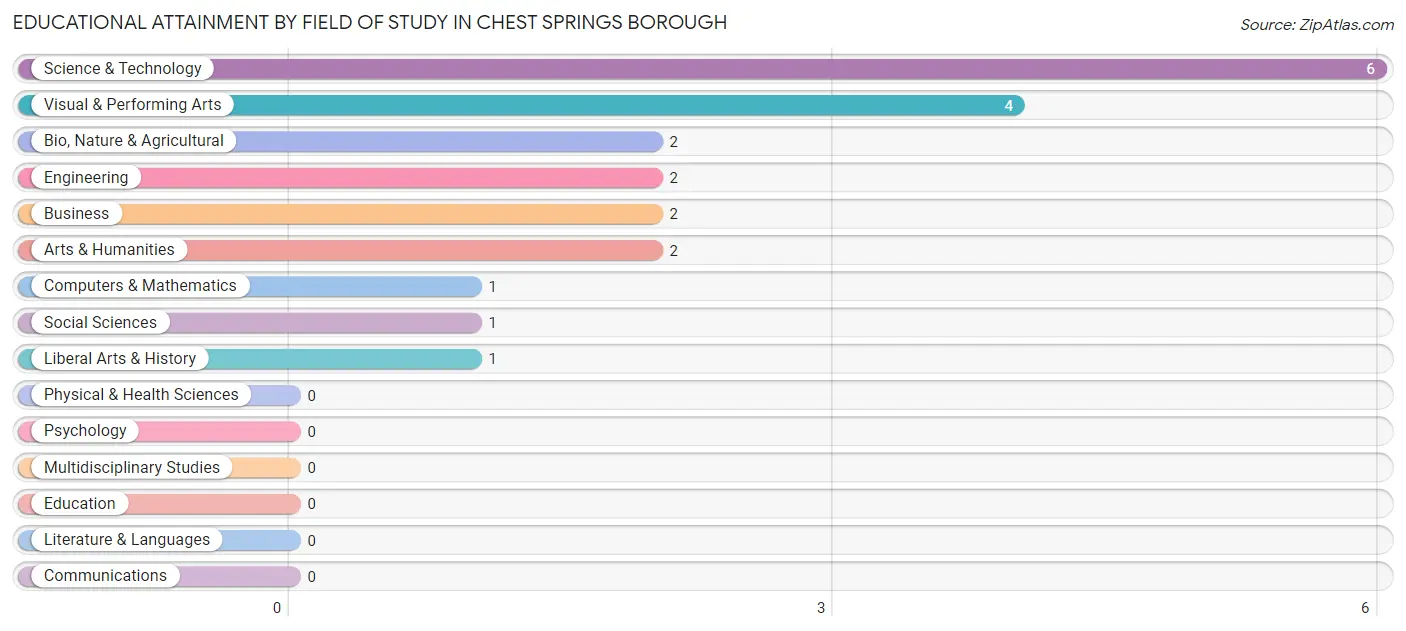
| Field of Study | # Graduates | % Graduates |
| Computers & Mathematics | 1 | 4.8% |
| Bio, Nature & Agricultural | 2 | 9.5% |
| Physical & Health Sciences | 0 | 0.0% |
| Psychology | 0 | 0.0% |
| Social Sciences | 1 | 4.8% |
| Engineering | 2 | 9.5% |
| Multidisciplinary Studies | 0 | 0.0% |
| Science & Technology | 6 | 28.6% |
| Business | 2 | 9.5% |
| Education | 0 | 0.0% |
| Literature & Languages | 0 | 0.0% |
| Liberal Arts & History | 1 | 4.8% |
| Visual & Performing Arts | 4 | 19.1% |
| Communications | 0 | 0.0% |
| Arts & Humanities | 2 | 9.5% |
| Total | 21 | 100.0% |
Transportation & Commute in Chest Springs borough
Vehicle Availability by Sex in Chest Springs borough
The most prevalent vehicle ownership categories in Chest Springs borough are males with 2 vehicles (11, accounting for 37.9%) and females with 2 vehicles (11, making up 45.8%).
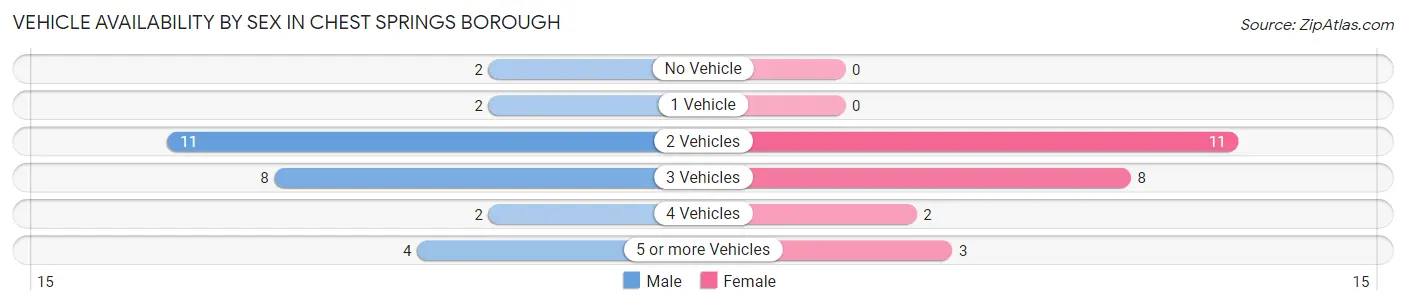
| Vehicles Available | Male | Female |
| No Vehicle | 2 (6.9%) | 0 (0.0%) |
| 1 Vehicle | 2 (6.9%) | 0 (0.0%) |
| 2 Vehicles | 11 (37.9%) | 11 (45.8%) |
| 3 Vehicles | 8 (27.6%) | 8 (33.3%) |
| 4 Vehicles | 2 (6.9%) | 2 (8.3%) |
| 5 or more Vehicles | 4 (13.8%) | 3 (12.5%) |
| Total | 29 (100.0%) | 24 (100.0%) |
Commute Time in Chest Springs borough
The most frequently occuring commute durations in Chest Springs borough are 30 to 34 minutes (12 commuters, 23.1%), 20 to 24 minutes (7 commuters, 13.5%), and 25 to 29 minutes (6 commuters, 11.5%).
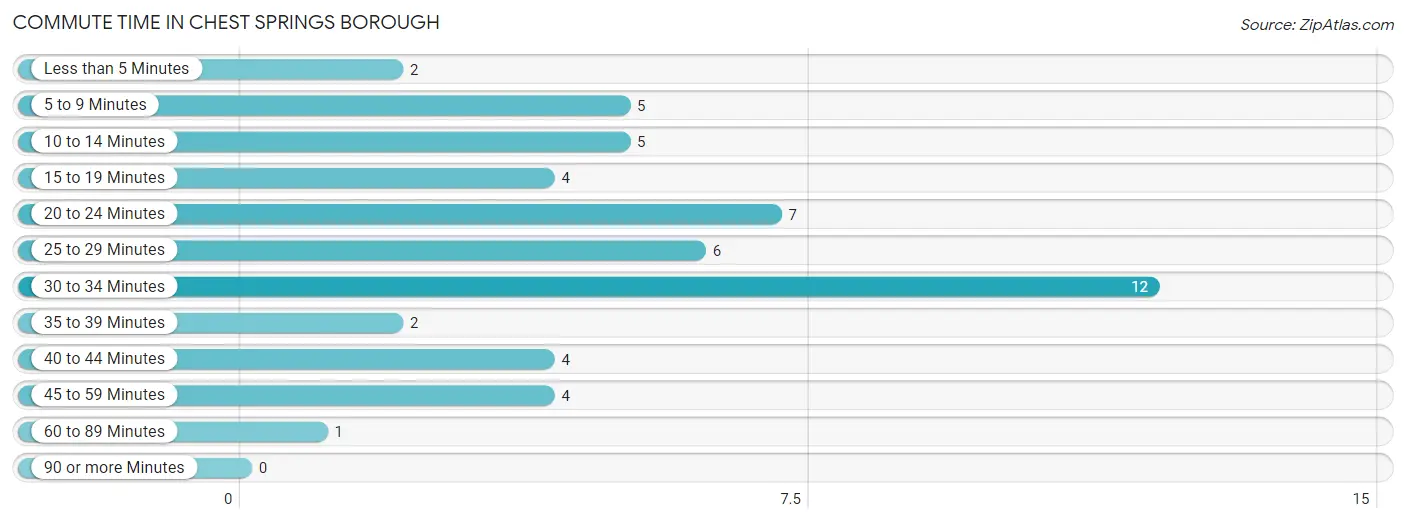
| Commute Time | # Commuters | % Commuters |
| Less than 5 Minutes | 2 | 3.8% |
| 5 to 9 Minutes | 5 | 9.6% |
| 10 to 14 Minutes | 5 | 9.6% |
| 15 to 19 Minutes | 4 | 7.7% |
| 20 to 24 Minutes | 7 | 13.5% |
| 25 to 29 Minutes | 6 | 11.5% |
| 30 to 34 Minutes | 12 | 23.1% |
| 35 to 39 Minutes | 2 | 3.8% |
| 40 to 44 Minutes | 4 | 7.7% |
| 45 to 59 Minutes | 4 | 7.7% |
| 60 to 89 Minutes | 1 | 1.9% |
| 90 or more Minutes | 0 | 0.0% |
Commute Time by Sex in Chest Springs borough
The most common commute times in Chest Springs borough are 30 to 34 minutes (6 commuters, 20.7%) for males and 30 to 34 minutes (6 commuters, 26.1%) for females.
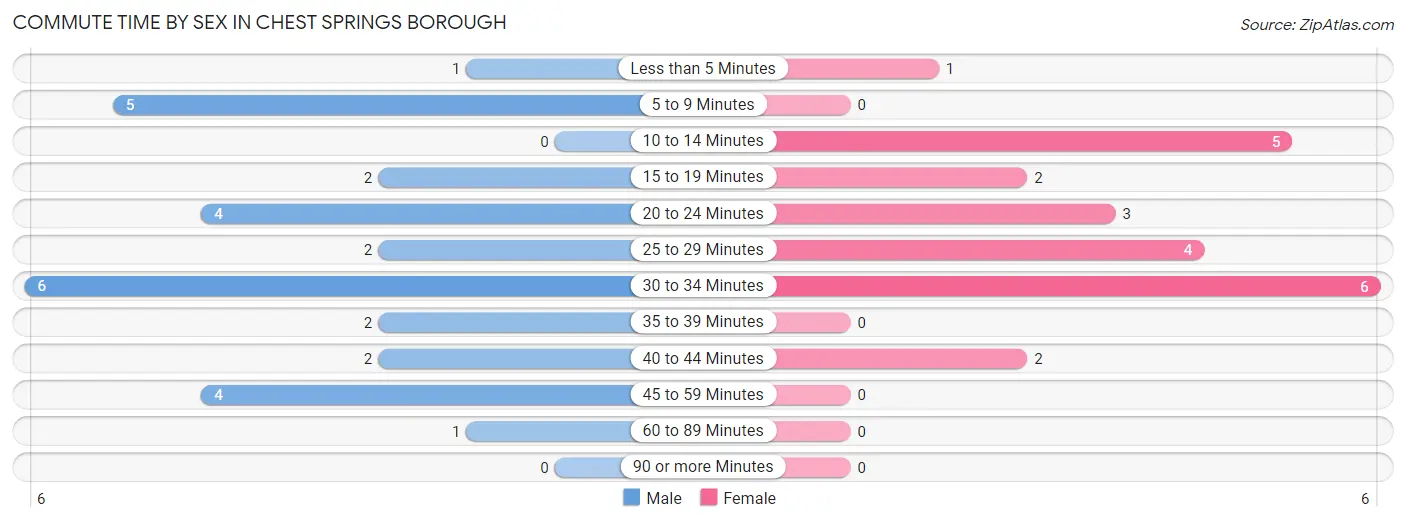
| Commute Time | Male | Female |
| Less than 5 Minutes | 1 (3.5%) | 1 (4.3%) |
| 5 to 9 Minutes | 5 (17.2%) | 0 (0.0%) |
| 10 to 14 Minutes | 0 (0.0%) | 5 (21.7%) |
| 15 to 19 Minutes | 2 (6.9%) | 2 (8.7%) |
| 20 to 24 Minutes | 4 (13.8%) | 3 (13.0%) |
| 25 to 29 Minutes | 2 (6.9%) | 4 (17.4%) |
| 30 to 34 Minutes | 6 (20.7%) | 6 (26.1%) |
| 35 to 39 Minutes | 2 (6.9%) | 0 (0.0%) |
| 40 to 44 Minutes | 2 (6.9%) | 2 (8.7%) |
| 45 to 59 Minutes | 4 (13.8%) | 0 (0.0%) |
| 60 to 89 Minutes | 1 (3.5%) | 0 (0.0%) |
| 90 or more Minutes | 0 (0.0%) | 0 (0.0%) |
Time of Departure to Work by Sex in Chest Springs borough
The most frequent times of departure to work in Chest Springs borough are 4:00 PM to 11:59 PM (6, 20.7%) for males and 7:00 AM to 7:29 AM (10, 43.5%) for females.
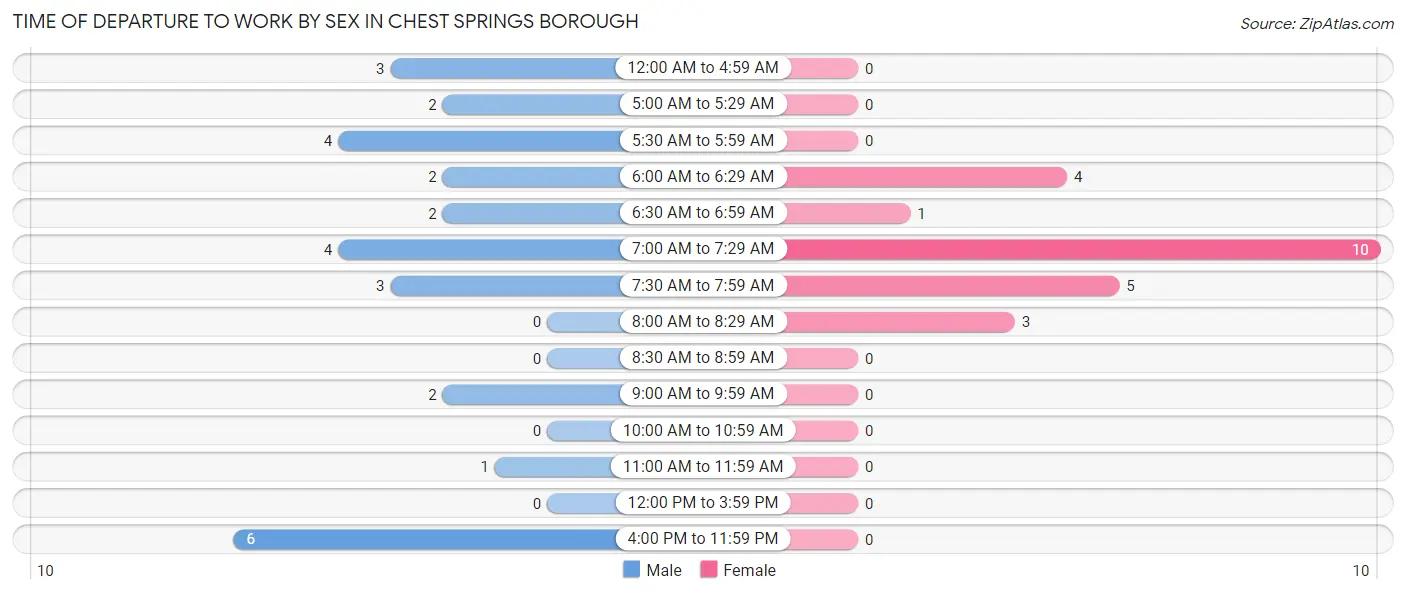
| Time of Departure | Male | Female |
| 12:00 AM to 4:59 AM | 3 (10.3%) | 0 (0.0%) |
| 5:00 AM to 5:29 AM | 2 (6.9%) | 0 (0.0%) |
| 5:30 AM to 5:59 AM | 4 (13.8%) | 0 (0.0%) |
| 6:00 AM to 6:29 AM | 2 (6.9%) | 4 (17.4%) |
| 6:30 AM to 6:59 AM | 2 (6.9%) | 1 (4.3%) |
| 7:00 AM to 7:29 AM | 4 (13.8%) | 10 (43.5%) |
| 7:30 AM to 7:59 AM | 3 (10.3%) | 5 (21.7%) |
| 8:00 AM to 8:29 AM | 0 (0.0%) | 3 (13.0%) |
| 8:30 AM to 8:59 AM | 0 (0.0%) | 0 (0.0%) |
| 9:00 AM to 9:59 AM | 2 (6.9%) | 0 (0.0%) |
| 10:00 AM to 10:59 AM | 0 (0.0%) | 0 (0.0%) |
| 11:00 AM to 11:59 AM | 1 (3.5%) | 0 (0.0%) |
| 12:00 PM to 3:59 PM | 0 (0.0%) | 0 (0.0%) |
| 4:00 PM to 11:59 PM | 6 (20.7%) | 0 (0.0%) |
| Total | 29 (100.0%) | 23 (100.0%) |
Housing Occupancy in Chest Springs borough
Occupancy by Ownership in Chest Springs borough
Of the total 45 dwellings in Chest Springs borough, owner-occupied units account for 40 (88.9%), while renter-occupied units make up 5 (11.1%).
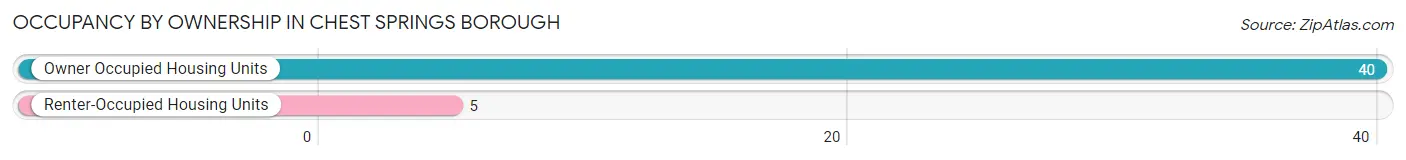
| Occupancy | # Housing Units | % Housing Units |
| Owner Occupied Housing Units | 40 | 88.9% |
| Renter-Occupied Housing Units | 5 | 11.1% |
| Total Occupied Housing Units | 45 | 100.0% |
Occupancy by Household Size in Chest Springs borough
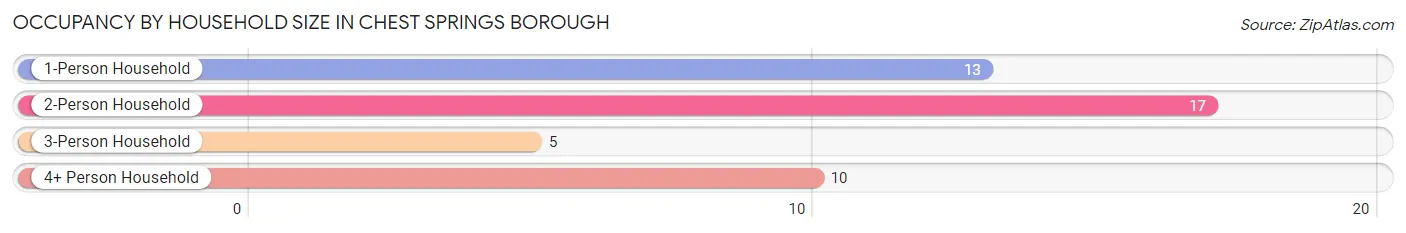
| Household Size | # Housing Units | % Housing Units |
| 1-Person Household | 13 | 28.9% |
| 2-Person Household | 17 | 37.8% |
| 3-Person Household | 5 | 11.1% |
| 4+ Person Household | 10 | 22.2% |
| Total Housing Units | 45 | 100.0% |
Occupancy by Ownership by Household Size in Chest Springs borough
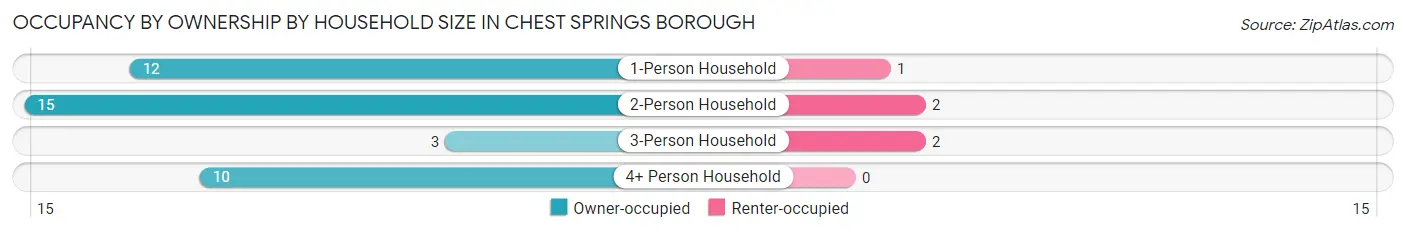
| Household Size | Owner-occupied | Renter-occupied |
| 1-Person Household | 12 (92.3%) | 1 (7.7%) |
| 2-Person Household | 15 (88.2%) | 2 (11.8%) |
| 3-Person Household | 3 (60.0%) | 2 (40.0%) |
| 4+ Person Household | 10 (100.0%) | 0 (0.0%) |
| Total Housing Units | 40 (88.9%) | 5 (11.1%) |
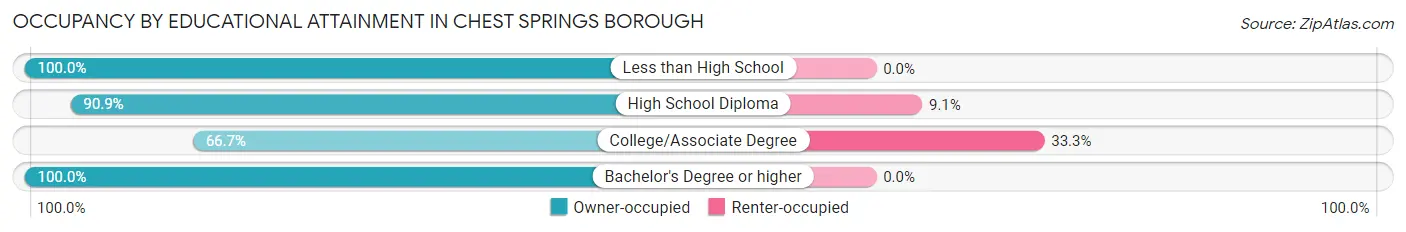
Occupancy by Educational Attainment in Chest Springs borough
| Household Size | Owner-occupied | Renter-occupied |
| Less than High School | 3 (100.0%) | 0 (0.0%) |
| High School Diploma | 20 (90.9%) | 2 (9.1%) |
| College/Associate Degree | 6 (66.7%) | 3 (33.3%) |
| Bachelor's Degree or higher | 11 (100.0%) | 0 (0.0%) |
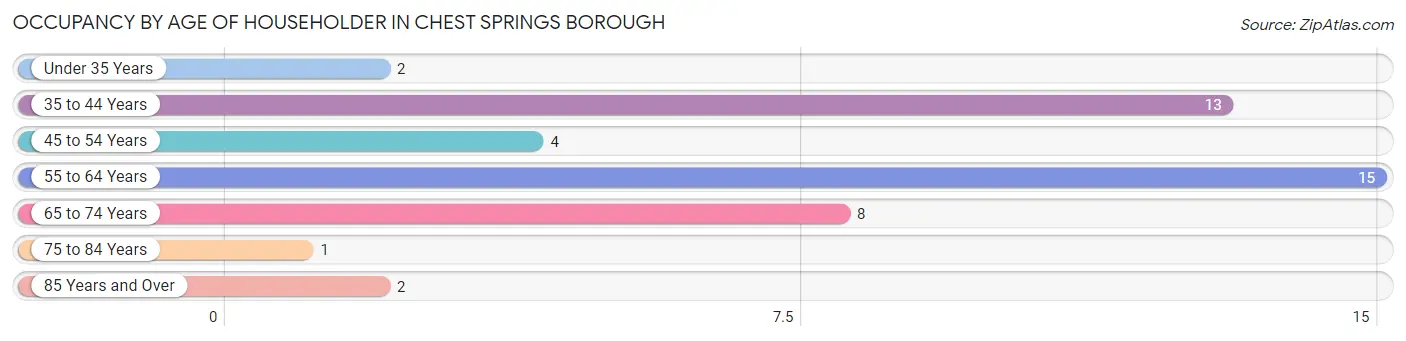
Occupancy by Age of Householder in Chest Springs borough
| Age Bracket | # Households | % Households |
| Under 35 Years | 2 | 4.4% |
| 35 to 44 Years | 13 | 28.9% |
| 45 to 54 Years | 4 | 8.9% |
| 55 to 64 Years | 15 | 33.3% |
| 65 to 74 Years | 8 | 17.8% |
| 75 to 84 Years | 1 | 2.2% |
| 85 Years and Over | 2 | 4.4% |
| Total | 45 | 100.0% |
Housing Finances in Chest Springs borough
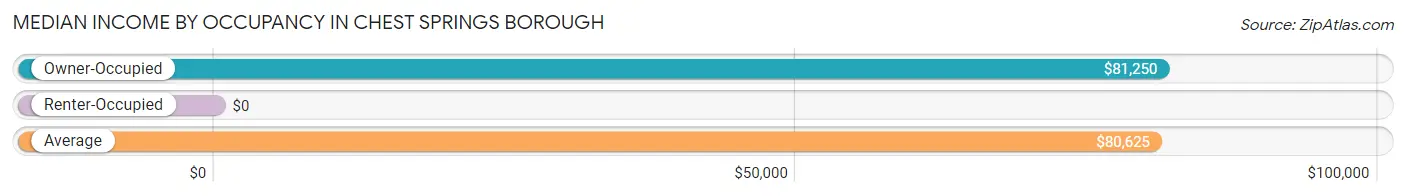
Median Income by Occupancy in Chest Springs borough
| Occupancy Type | # Households | Median Income |
| Owner-Occupied | 40 (88.9%) | $81,250 |
| Renter-Occupied | 5 (11.1%) | $0 |
| Average | 45 (100.0%) | $80,625 |
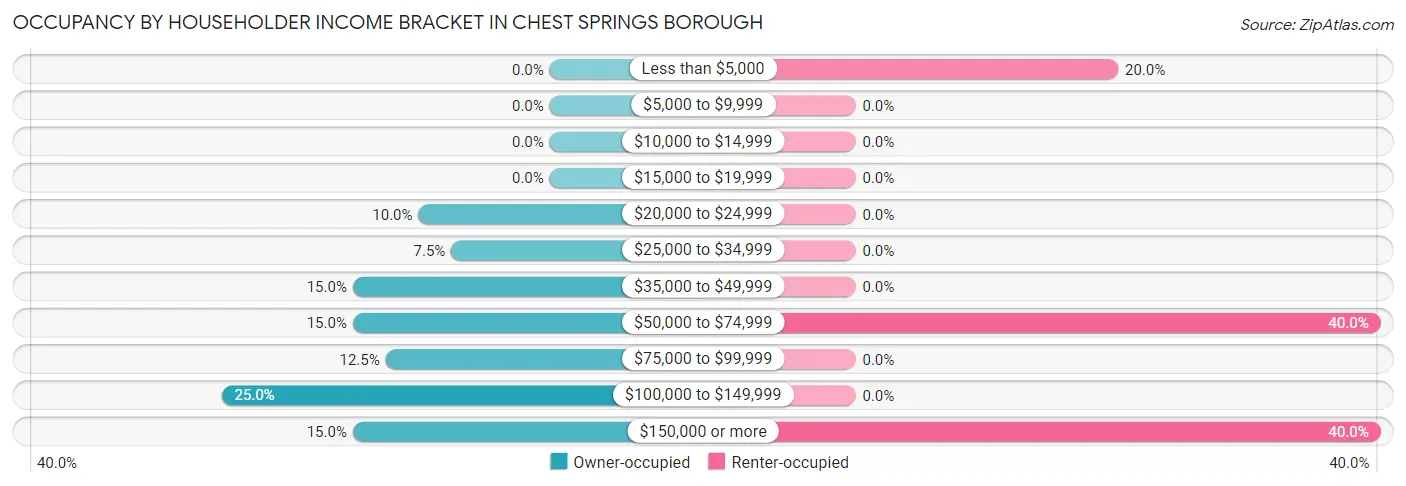
Occupancy by Householder Income Bracket in Chest Springs borough
| Income Bracket | Owner-occupied | Renter-occupied |
| Less than $5,000 | 0 (0.0%) | 1 (20.0%) |
| $5,000 to $9,999 | 0 (0.0%) | 0 (0.0%) |
| $10,000 to $14,999 | 0 (0.0%) | 0 (0.0%) |
| $15,000 to $19,999 | 0 (0.0%) | 0 (0.0%) |
| $20,000 to $24,999 | 4 (10.0%) | 0 (0.0%) |
| $25,000 to $34,999 | 3 (7.5%) | 0 (0.0%) |
| $35,000 to $49,999 | 6 (15.0%) | 0 (0.0%) |
| $50,000 to $74,999 | 6 (15.0%) | 2 (40.0%) |
| $75,000 to $99,999 | 5 (12.5%) | 0 (0.0%) |
| $100,000 to $149,999 | 10 (25.0%) | 0 (0.0%) |
| $150,000 or more | 6 (15.0%) | 2 (40.0%) |
| Total | 40 (100.0%) | 5 (100.0%) |
Monthly Housing Cost Tiers in Chest Springs borough
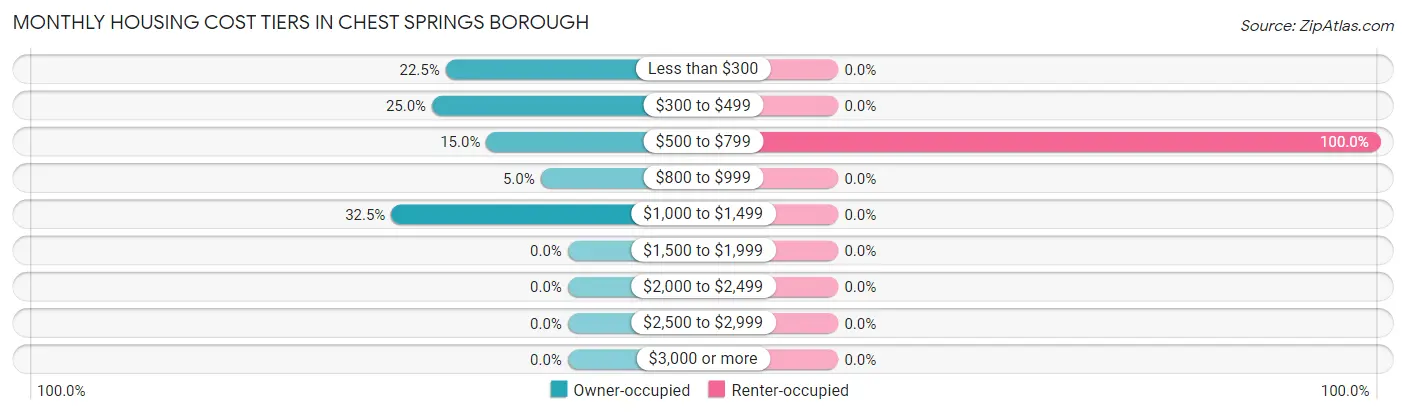
| Monthly Cost | Owner-occupied | Renter-occupied |
| Less than $300 | 9 (22.5%) | 0 (0.0%) |
| $300 to $499 | 10 (25.0%) | 0 (0.0%) |
| $500 to $799 | 6 (15.0%) | 5 (100.0%) |
| $800 to $999 | 2 (5.0%) | 0 (0.0%) |
| $1,000 to $1,499 | 13 (32.5%) | 0 (0.0%) |
| $1,500 to $1,999 | 0 (0.0%) | 0 (0.0%) |
| $2,000 to $2,499 | 0 (0.0%) | 0 (0.0%) |
| $2,500 to $2,999 | 0 (0.0%) | 0 (0.0%) |
| $3,000 or more | 0 (0.0%) | 0 (0.0%) |
| Total | 40 (100.0%) | 5 (100.0%) |
Physical Housing Characteristics in Chest Springs borough
Housing Structures in Chest Springs borough
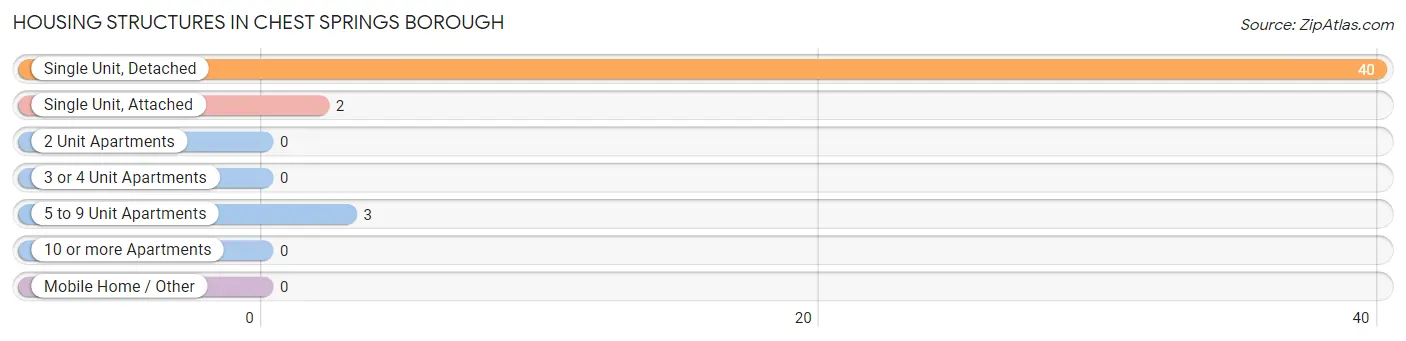
| Structure Type | # Housing Units | % Housing Units |
| Single Unit, Detached | 40 | 88.9% |
| Single Unit, Attached | 2 | 4.4% |
| 2 Unit Apartments | 0 | 0.0% |
| 3 or 4 Unit Apartments | 0 | 0.0% |
| 5 to 9 Unit Apartments | 3 | 6.7% |
| 10 or more Apartments | 0 | 0.0% |
| Mobile Home / Other | 0 | 0.0% |
| Total | 45 | 100.0% |
Housing Structures by Occupancy in Chest Springs borough
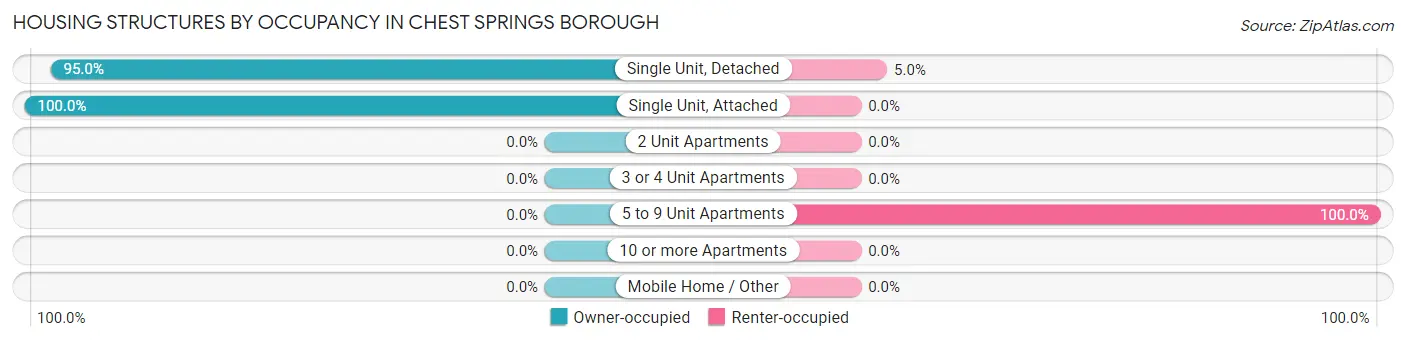
| Structure Type | Owner-occupied | Renter-occupied |
| Single Unit, Detached | 38 (95.0%) | 2 (5.0%) |
| Single Unit, Attached | 2 (100.0%) | 0 (0.0%) |
| 2 Unit Apartments | 0 (0.0%) | 0 (0.0%) |
| 3 or 4 Unit Apartments | 0 (0.0%) | 0 (0.0%) |
| 5 to 9 Unit Apartments | 0 (0.0%) | 3 (100.0%) |
| 10 or more Apartments | 0 (0.0%) | 0 (0.0%) |
| Mobile Home / Other | 0 (0.0%) | 0 (0.0%) |
| Total | 40 (88.9%) | 5 (11.1%) |
Housing Structures by Number of Rooms in Chest Springs borough
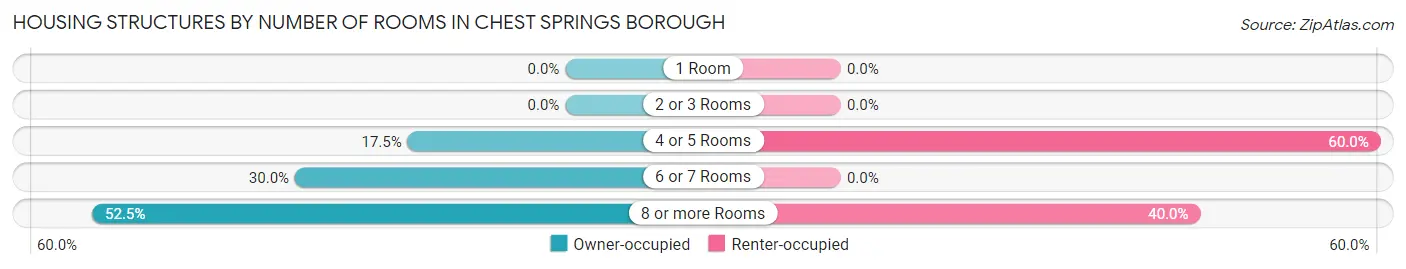
| Number of Rooms | Owner-occupied | Renter-occupied |
| 1 Room | 0 (0.0%) | 0 (0.0%) |
| 2 or 3 Rooms | 0 (0.0%) | 0 (0.0%) |
| 4 or 5 Rooms | 7 (17.5%) | 3 (60.0%) |
| 6 or 7 Rooms | 12 (30.0%) | 0 (0.0%) |
| 8 or more Rooms | 21 (52.5%) | 2 (40.0%) |
| Total | 40 (100.0%) | 5 (100.0%) |
Housing Structure by Heating Type in Chest Springs borough
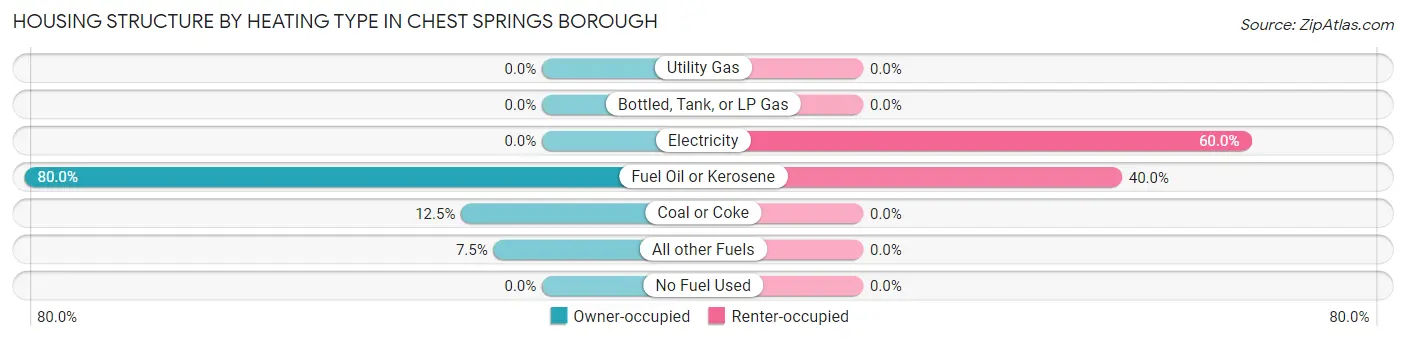
| Heating Type | Owner-occupied | Renter-occupied |
| Utility Gas | 0 (0.0%) | 0 (0.0%) |
| Bottled, Tank, or LP Gas | 0 (0.0%) | 0 (0.0%) |
| Electricity | 0 (0.0%) | 3 (60.0%) |
| Fuel Oil or Kerosene | 32 (80.0%) | 2 (40.0%) |
| Coal or Coke | 5 (12.5%) | 0 (0.0%) |
| All other Fuels | 3 (7.5%) | 0 (0.0%) |
| No Fuel Used | 0 (0.0%) | 0 (0.0%) |
| Total | 40 (100.0%) | 5 (100.0%) |
Household Vehicle Usage in Chest Springs borough
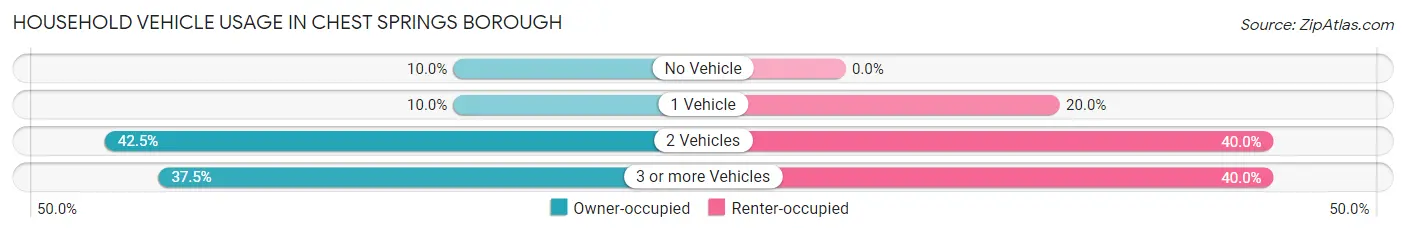
| Vehicles per Household | Owner-occupied | Renter-occupied |
| No Vehicle | 4 (10.0%) | 0 (0.0%) |
| 1 Vehicle | 4 (10.0%) | 1 (20.0%) |
| 2 Vehicles | 17 (42.5%) | 2 (40.0%) |
| 3 or more Vehicles | 15 (37.5%) | 2 (40.0%) |
| Total | 40 (100.0%) | 5 (100.0%) |
Real Estate & Mortgages in Chest Springs borough
Real Estate and Mortgage Overview in Chest Springs borough
| Characteristic | Without Mortgage | With Mortgage |
| Housing Units | 25 | 15 |
| Median Property Value | $96,300 | $144,600 |
| Median Household Income | $61,875 | $1 |
| Monthly Housing Costs | $363 | $0 |
| Real Estate Taxes | $950 | $0 |
Property Value by Mortgage Status in Chest Springs borough
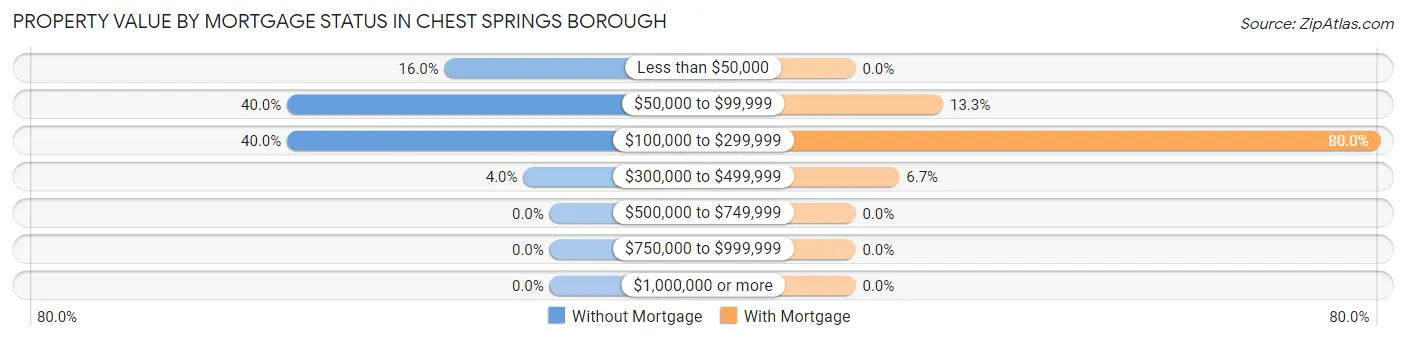
| Property Value | Without Mortgage | With Mortgage |
| Less than $50,000 | 4 (16.0%) | 0 (0.0%) |
| $50,000 to $99,999 | 10 (40.0%) | 2 (13.3%) |
| $100,000 to $299,999 | 10 (40.0%) | 12 (80.0%) |
| $300,000 to $499,999 | 1 (4.0%) | 1 (6.7%) |
| $500,000 to $749,999 | 0 (0.0%) | 0 (0.0%) |
| $750,000 to $999,999 | 0 (0.0%) | 0 (0.0%) |
| $1,000,000 or more | 0 (0.0%) | 0 (0.0%) |
| Total | 25 (100.0%) | 15 (100.0%) |
Household Income by Mortgage Status in Chest Springs borough
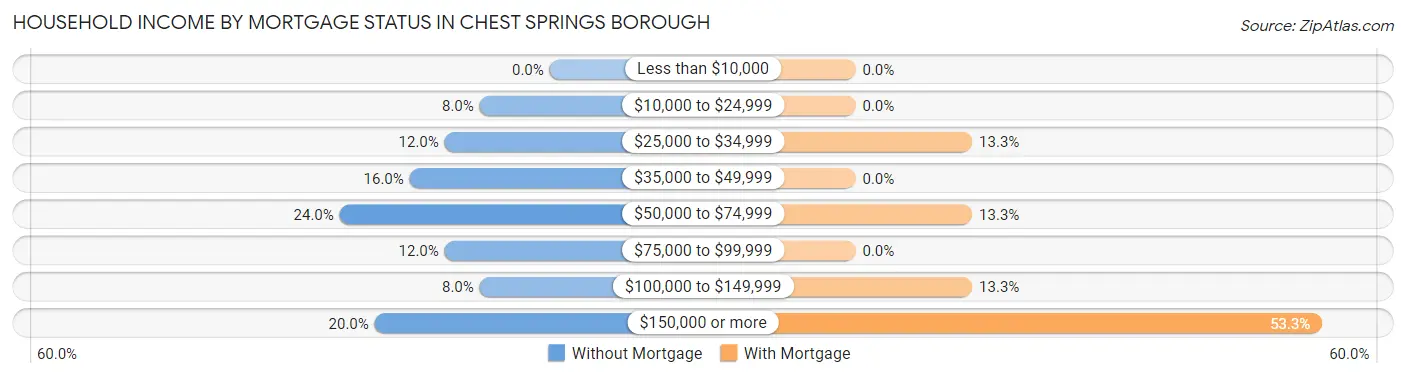
| Household Income | Without Mortgage | With Mortgage |
| Less than $10,000 | 0 (0.0%) | 0 (0.0%) |
| $10,000 to $24,999 | 2 (8.0%) | 0 (0.0%) |
| $25,000 to $34,999 | 3 (12.0%) | 2 (13.3%) |
| $35,000 to $49,999 | 4 (16.0%) | 0 (0.0%) |
| $50,000 to $74,999 | 6 (24.0%) | 2 (13.3%) |
| $75,000 to $99,999 | 3 (12.0%) | 0 (0.0%) |
| $100,000 to $149,999 | 2 (8.0%) | 2 (13.3%) |
| $150,000 or more | 5 (20.0%) | 8 (53.3%) |
| Total | 25 (100.0%) | 15 (100.0%) |
Property Value to Household Income Ratio in Chest Springs borough
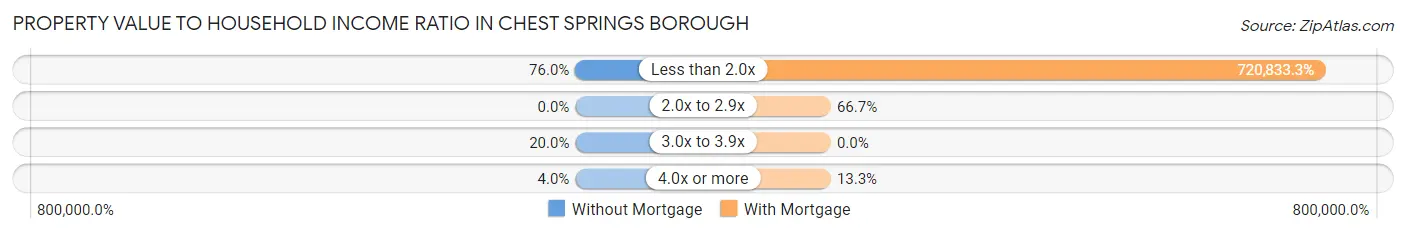
| Value-to-Income Ratio | Without Mortgage | With Mortgage |
| Less than 2.0x | 19 (76.0%) | 108,125 (720,833.3%) |
| 2.0x to 2.9x | 0 (0.0%) | 10 (66.7%) |
| 3.0x to 3.9x | 5 (20.0%) | 0 (0.0%) |
| 4.0x or more | 1 (4.0%) | 2 (13.3%) |
| Total | 25 (100.0%) | 15 (100.0%) |
Real Estate Taxes by Mortgage Status in Chest Springs borough
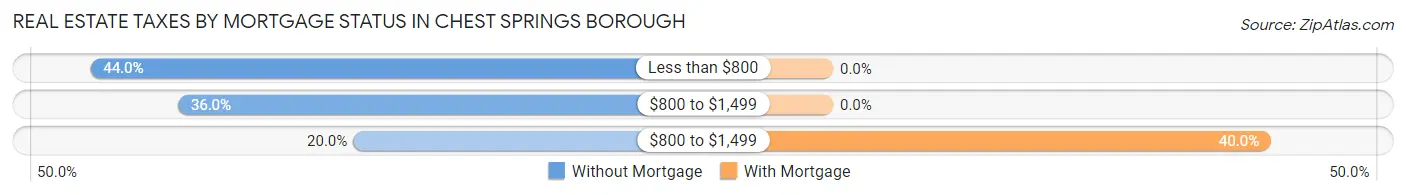
| Property Taxes | Without Mortgage | With Mortgage |
| Less than $800 | 11 (44.0%) | 0 (0.0%) |
| $800 to $1,499 | 9 (36.0%) | 0 (0.0%) |
| $800 to $1,499 | 5 (20.0%) | 6 (40.0%) |
| Total | 25 (100.0%) | 15 (100.0%) |
Health & Disability in Chest Springs borough
Health Insurance Coverage by Age in Chest Springs borough
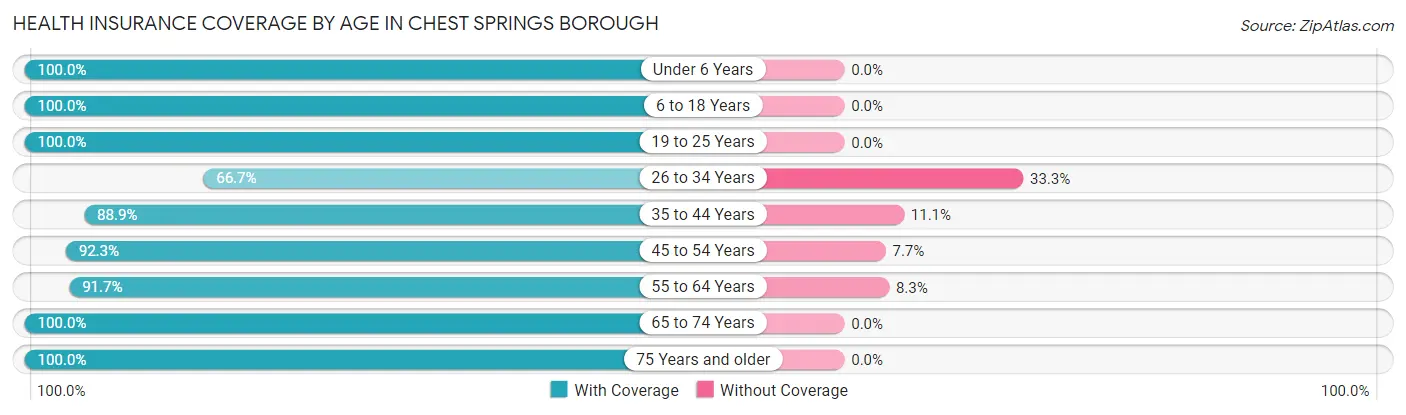
| Age Bracket | With Coverage | Without Coverage |
| Under 6 Years | 8 (100.0%) | 0 (0.0%) |
| 6 to 18 Years | 21 (100.0%) | 0 (0.0%) |
| 19 to 25 Years | 5 (100.0%) | 0 (0.0%) |
| 26 to 34 Years | 6 (66.7%) | 3 (33.3%) |
| 35 to 44 Years | 16 (88.9%) | 2 (11.1%) |
| 45 to 54 Years | 12 (92.3%) | 1 (7.7%) |
| 55 to 64 Years | 22 (91.7%) | 2 (8.3%) |
| 65 to 74 Years | 15 (100.0%) | 0 (0.0%) |
| 75 Years and older | 5 (100.0%) | 0 (0.0%) |
| Total | 110 (93.2%) | 8 (6.8%) |
Health Insurance Coverage by Citizenship Status in Chest Springs borough
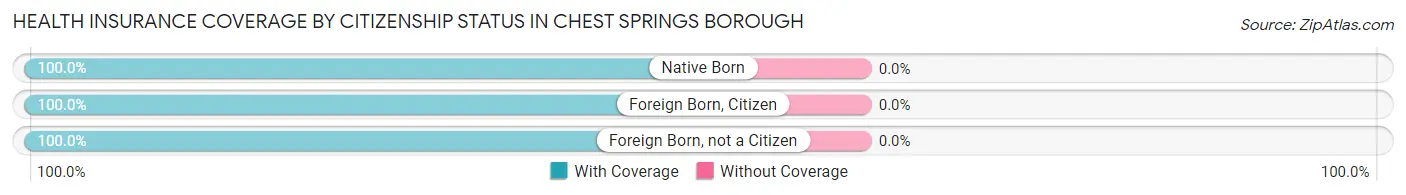
| Citizenship Status | With Coverage | Without Coverage |
| Native Born | 8 (100.0%) | 0 (0.0%) |
| Foreign Born, Citizen | 21 (100.0%) | 0 (0.0%) |
| Foreign Born, not a Citizen | 5 (100.0%) | 0 (0.0%) |
Health Insurance Coverage by Household Income in Chest Springs borough
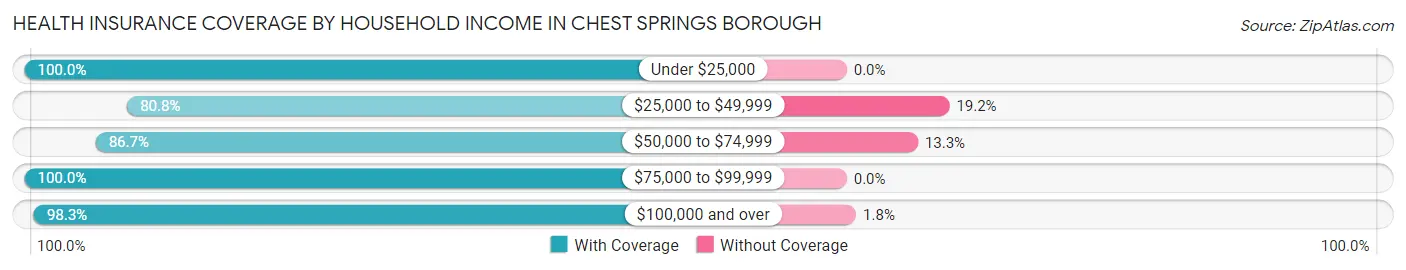
| Household Income | With Coverage | Without Coverage |
| Under $25,000 | 5 (100.0%) | 0 (0.0%) |
| $25,000 to $49,999 | 21 (80.8%) | 5 (19.2%) |
| $50,000 to $74,999 | 13 (86.7%) | 2 (13.3%) |
| $75,000 to $99,999 | 15 (100.0%) | 0 (0.0%) |
| $100,000 and over | 56 (98.3%) | 1 (1.8%) |
Public vs Private Health Insurance Coverage by Age in Chest Springs borough
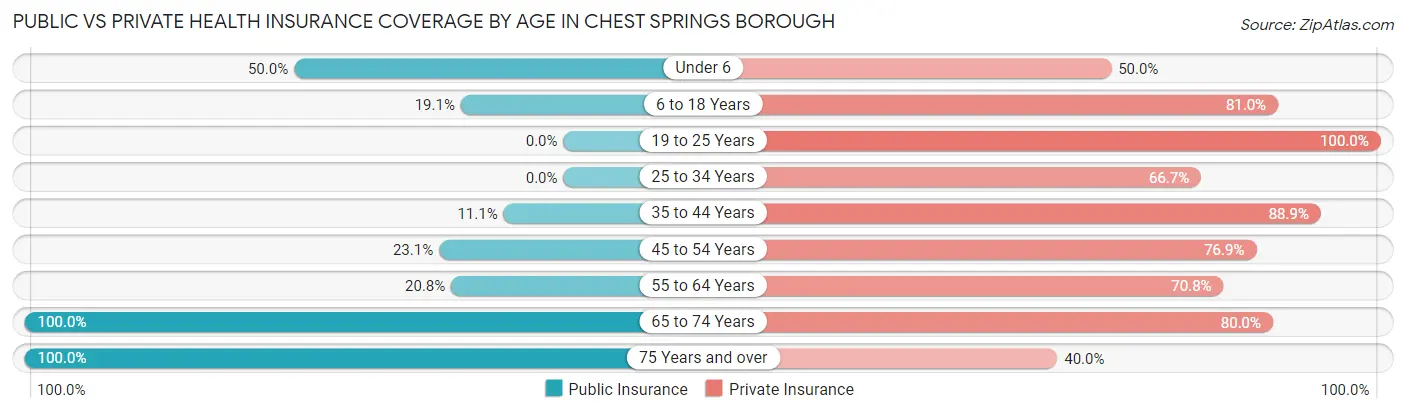
| Age Bracket | Public Insurance | Private Insurance |
| Under 6 | 4 (50.0%) | 4 (50.0%) |
| 6 to 18 Years | 4 (19.1%) | 17 (80.9%) |
| 19 to 25 Years | 0 (0.0%) | 5 (100.0%) |
| 25 to 34 Years | 0 (0.0%) | 6 (66.7%) |
| 35 to 44 Years | 2 (11.1%) | 16 (88.9%) |
| 45 to 54 Years | 3 (23.1%) | 10 (76.9%) |
| 55 to 64 Years | 5 (20.8%) | 17 (70.8%) |
| 65 to 74 Years | 15 (100.0%) | 12 (80.0%) |
| 75 Years and over | 5 (100.0%) | 2 (40.0%) |
| Total | 38 (32.2%) | 89 (75.4%) |
Disability Status by Sex by Age in Chest Springs borough
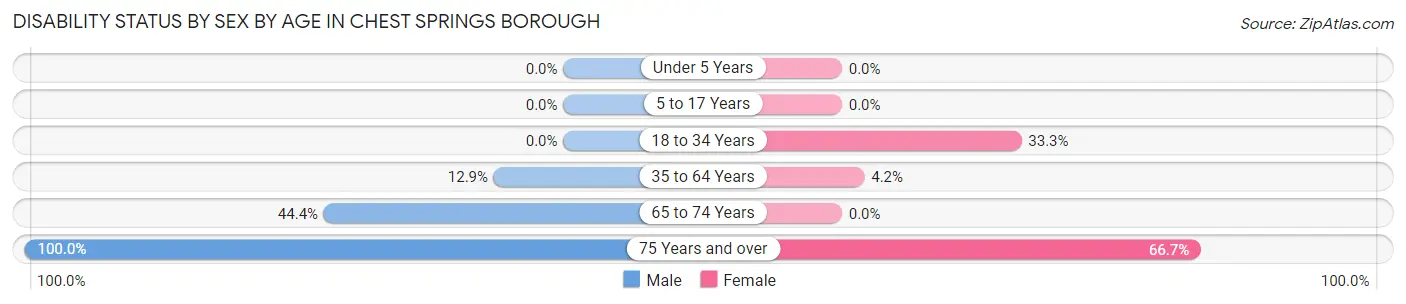
| Age Bracket | Male | Female |
| Under 5 Years | 0 (0.0%) | 0 (0.0%) |
| 5 to 17 Years | 0 (0.0%) | 0 (0.0%) |
| 18 to 34 Years | 0 (0.0%) | 2 (33.3%) |
| 35 to 64 Years | 4 (12.9%) | 1 (4.2%) |
| 65 to 74 Years | 4 (44.4%) | 0 (0.0%) |
| 75 Years and over | 2 (100.0%) | 2 (66.7%) |
Disability Class by Sex by Age in Chest Springs borough
Disability Class: Hearing Difficulty
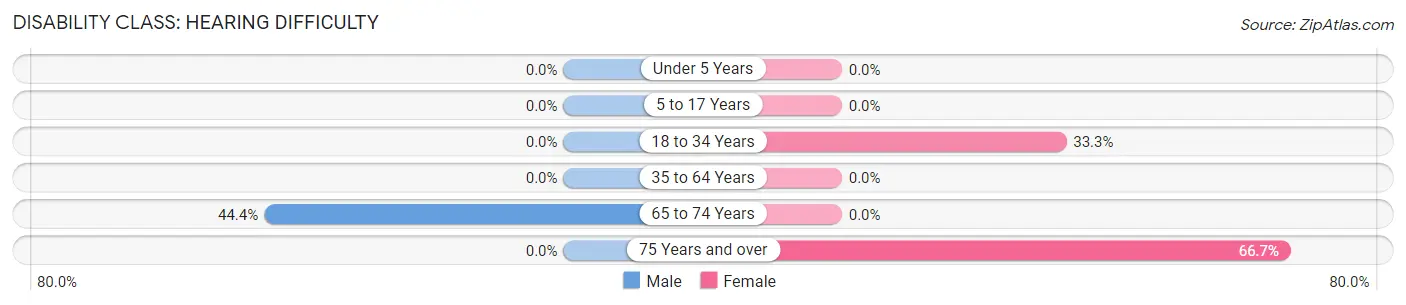
| Age Bracket | Male | Female |
| Under 5 Years | 0 (0.0%) | 0 (0.0%) |
| 5 to 17 Years | 0 (0.0%) | 0 (0.0%) |
| 18 to 34 Years | 0 (0.0%) | 2 (33.3%) |
| 35 to 64 Years | 0 (0.0%) | 0 (0.0%) |
| 65 to 74 Years | 4 (44.4%) | 0 (0.0%) |
| 75 Years and over | 0 (0.0%) | 2 (66.7%) |
Disability Class: Vision Difficulty
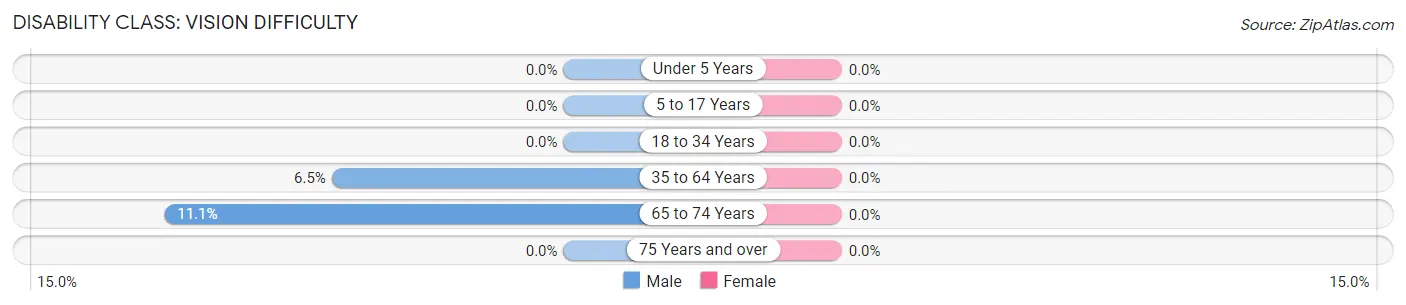
| Age Bracket | Male | Female |
| Under 5 Years | 0 (0.0%) | 0 (0.0%) |
| 5 to 17 Years | 0 (0.0%) | 0 (0.0%) |
| 18 to 34 Years | 0 (0.0%) | 0 (0.0%) |
| 35 to 64 Years | 2 (6.5%) | 0 (0.0%) |
| 65 to 74 Years | 1 (11.1%) | 0 (0.0%) |
| 75 Years and over | 0 (0.0%) | 0 (0.0%) |
Disability Class: Cognitive Difficulty
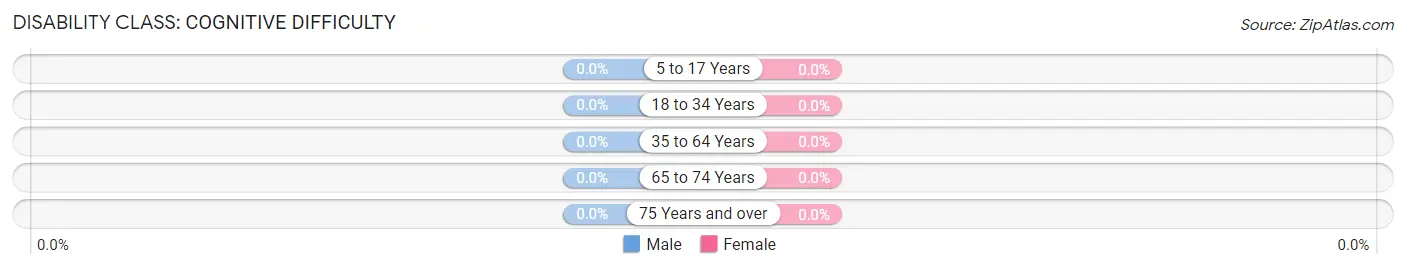
| Age Bracket | Male | Female |
| 5 to 17 Years | 0 (0.0%) | 0 (0.0%) |
| 18 to 34 Years | 0 (0.0%) | 0 (0.0%) |
| 35 to 64 Years | 0 (0.0%) | 0 (0.0%) |
| 65 to 74 Years | 0 (0.0%) | 0 (0.0%) |
| 75 Years and over | 0 (0.0%) | 0 (0.0%) |
Disability Class: Ambulatory Difficulty
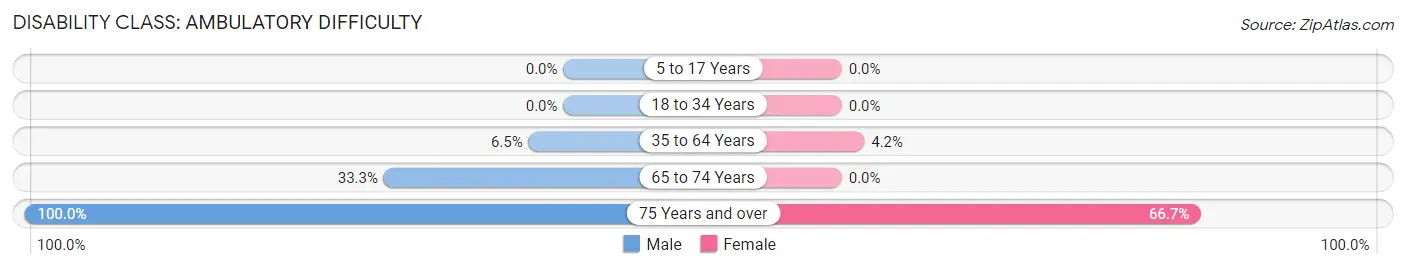
| Age Bracket | Male | Female |
| 5 to 17 Years | 0 (0.0%) | 0 (0.0%) |
| 18 to 34 Years | 0 (0.0%) | 0 (0.0%) |
| 35 to 64 Years | 2 (6.5%) | 1 (4.2%) |
| 65 to 74 Years | 3 (33.3%) | 0 (0.0%) |
| 75 Years and over | 2 (100.0%) | 2 (66.7%) |
Disability Class: Self-Care Difficulty
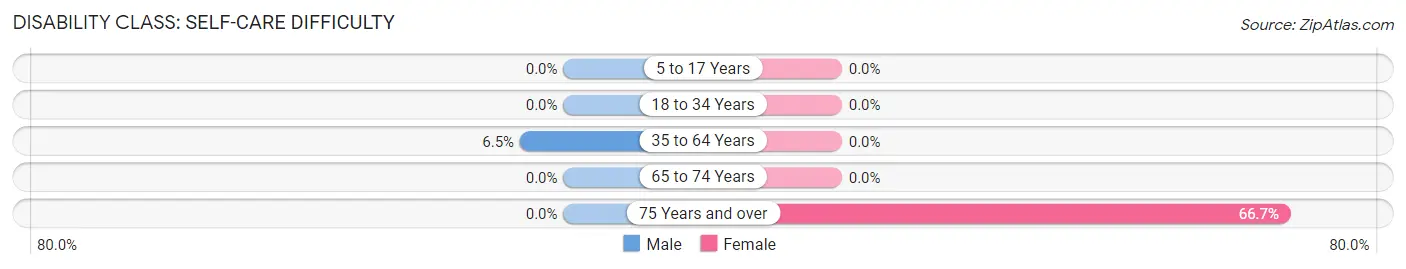
| Age Bracket | Male | Female |
| 5 to 17 Years | 0 (0.0%) | 0 (0.0%) |
| 18 to 34 Years | 0 (0.0%) | 0 (0.0%) |
| 35 to 64 Years | 2 (6.5%) | 0 (0.0%) |
| 65 to 74 Years | 0 (0.0%) | 0 (0.0%) |
| 75 Years and over | 0 (0.0%) | 2 (66.7%) |
Technology Access in Chest Springs borough
Computing Device Access in Chest Springs borough
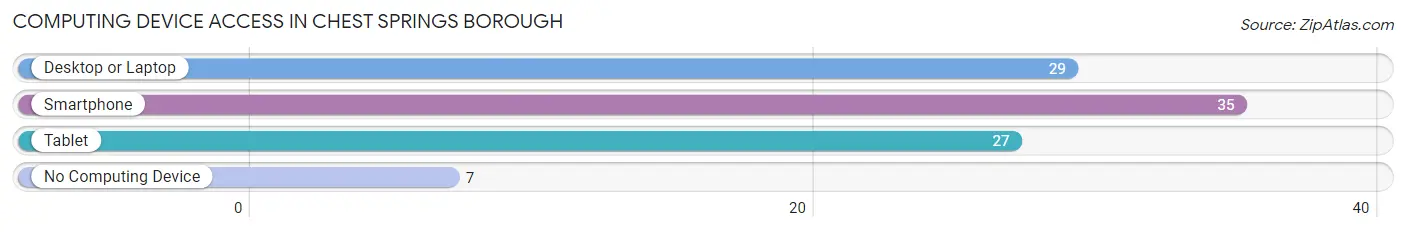
| Device Type | # Households | % Households |
| Desktop or Laptop | 29 | 64.4% |
| Smartphone | 35 | 77.8% |
| Tablet | 27 | 60.0% |
| No Computing Device | 7 | 15.6% |
| Total | 45 | 100.0% |
Internet Access in Chest Springs borough
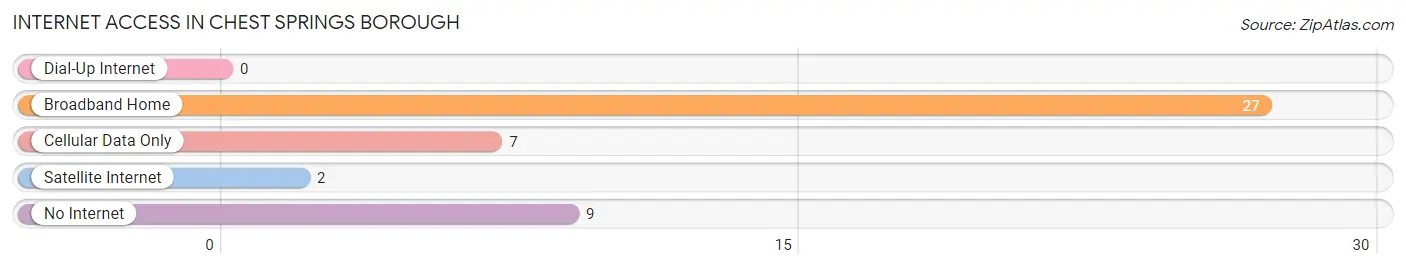
| Internet Type | # Households | % Households |
| Dial-Up Internet | 0 | 0.0% |
| Broadband Home | 27 | 60.0% |
| Cellular Data Only | 7 | 15.6% |
| Satellite Internet | 2 | 4.4% |
| No Internet | 9 | 20.0% |
| Total | 45 | 100.0% |
Chest Springs borough Summary
History
Chest Springs Borough is a small borough located in Cambria County, Pennsylvania. It is situated in the foothills of the Allegheny Mountains, approximately 10 miles east of Johnstown. The borough was founded in 1876 and was originally known as Chest Springs Station. The name was changed to Chest Springs Borough in 1887.
The area was first settled in the late 1700s by German and Irish immigrants. The first settlers were attracted to the area due to its abundance of natural resources, including coal, timber, and iron ore. The area was also known for its mineral springs, which were believed to have healing properties.
The first industry in the area was the Chest Springs Iron Works, which was established in 1845. The iron works produced a variety of products, including stoves, plows, and other agricultural implements. The iron works also provided employment for many of the local residents.
In the late 1800s, the Chest Springs Coal Company was established. The coal company mined coal from the surrounding hills and shipped it to Johnstown and other nearby towns. The coal industry provided employment for many of the local residents and helped to fuel the local economy.
The Chest Springs area was also home to several other industries, including a sawmill, a grist mill, and a tannery. These industries provided employment for many of the local residents and helped to fuel the local economy.
Geography
Chest Springs Borough is located in the foothills of the Allegheny Mountains in Cambria County, Pennsylvania. The borough is situated approximately 10 miles east of Johnstown. The borough is bordered by the townships of Chest Springs, East Taylor, and West Taylor.
The borough is located in a hilly region, with elevations ranging from 1,000 to 1,500 feet above sea level. The area is heavily forested, with a variety of trees, including oak, maple, and hickory. The borough is also home to several creeks, including Chest Springs Creek, which flows through the borough.
Economy
The economy of Chest Springs Borough is largely based on agriculture and tourism. The area is home to several farms, which produce a variety of crops, including corn, soybeans, and hay. The area is also home to several wineries, which produce a variety of wines.
The borough is also home to several tourist attractions, including the Chest Springs Iron Works Museum, which showcases the history of the area’s iron industry. The borough is also home to several parks, including Chest Springs Park, which features a variety of outdoor activities, such as hiking, fishing, and camping.
Demographics
As of the 2010 census, the population of Chest Springs Borough was 1,093. The population is largely white (97.2%), with a small percentage of African Americans (1.2%) and Hispanics (1.6%). The median household income is $41,250, and the median home value is $90,000. The unemployment rate is 5.2%.
Conclusion
Chest Springs Borough is a small borough located in Cambria County, Pennsylvania. The area was first settled in the late 1700s by German and Irish immigrants and was home to several industries, including the Chest Springs Iron Works and the Chest Springs Coal Company. The economy of the borough is largely based on agriculture and tourism. The population of the borough is largely white, with a median household income of $41,250 and a median home value of $90,000.
Common Questions
What is Per Capita Income in Chest Springs borough?
Per Capita income in Chest Springs borough is $33,731.
What is the Median Family Income in Chest Springs borough?
Median Family Income in Chest Springs borough is $103,750.
What is the Median Household income in Chest Springs borough?
Median Household Income in Chest Springs borough is $80,625.
What is Income or Wage Gap in Chest Springs borough?
Income or Wage Gap in Chest Springs borough is 24.8%.
Women in Chest Springs borough earn 75.2 cents for every dollar earned by a man.
What is Inequality or Gini Index in Chest Springs borough?
Inequality or Gini Index in Chest Springs borough is 0.32.
What is the Total Population of Chest Springs borough?
Total Population of Chest Springs borough is 118.
What is the Total Male Population of Chest Springs borough?
Total Male Population of Chest Springs borough is 65.
What is the Total Female Population of Chest Springs borough?
Total Female Population of Chest Springs borough is 53.
What is the Ratio of Males per 100 Females in Chest Springs borough?
There are 122.64 Males per 100 Females in Chest Springs borough.
What is the Ratio of Females per 100 Males in Chest Springs borough?
There are 81.54 Females per 100 Males in Chest Springs borough.
What is the Median Population Age in Chest Springs borough?
Median Population Age in Chest Springs borough is 43.5 Years.
What is the Average Family Size in Chest Springs borough
Average Family Size in Chest Springs borough is 3.4 People.
What is the Average Household Size in Chest Springs borough
Average Household Size in Chest Springs borough is 2.6 People.
How Large is the Labor Force in Chest Springs borough?
There are 58 People in the Labor Forcein in Chest Springs borough.
What is the Percentage of People in the Labor Force in Chest Springs borough?
64.4% of People are in the Labor Force in Chest Springs borough.
What is the Unemployment Rate in Chest Springs borough?
Unemployment Rate in Chest Springs borough is 1.7%.