Carrolltown borough, PA Map & Demographics
Carrolltown borough Overview
$34,479
PER CAPITA INCOME
$93,125
AVG FAMILY INCOME
$62,000
AVG HOUSEHOLD INCOME
5.4%
WAGE / INCOME GAP [ % ]
94.6¢/ $1
WAGE / INCOME GAP [ $ ]
0.39
INEQUALITY / GINI INDEX
822
TOTAL POPULATION
421
MALE POPULATION
401
FEMALE POPULATION
104.99
MALES / 100 FEMALES
95.25
FEMALES / 100 MALES
47.3
MEDIAN AGE
3.0
AVG FAMILY SIZE
2.2
AVG HOUSEHOLD SIZE
415
LABOR FORCE [ PEOPLE ]
58.1%
PERCENT IN LABOR FORCE
3.4%
UNEMPLOYMENT RATE
Income in Carrolltown borough
Income Overview in Carrolltown borough
Per Capita Income in Carrolltown borough is $34,479, while median incomes of families and households are $93,125 and $62,000 respectively.
| Characteristic | Number | Measure |
| Per Capita Income | 822 | $34,479 |
| Median Family Income | 195 | $93,125 |
| Mean Family Income | 195 | $98,234 |
| Median Household Income | 366 | $62,000 |
| Mean Household Income | 366 | $72,817 |
| Income Deficit | 195 | $0 |
| Wage / Income Gap (%) | 822 | 5.38% |
| Wage / Income Gap ($) | 822 | 94.62¢ per $1 |
| Gini / Inequality Index | 822 | 0.39 |
Earnings by Sex in Carrolltown borough
Average Earnings in Carrolltown borough are $41,771, $42,083 for men and $39,821 for women, a difference of 5.4%.
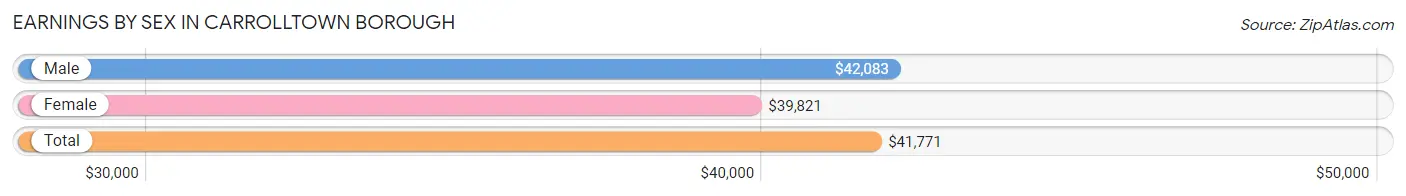
| Sex | Number | Average Earnings |
| Male | 243 (58.1%) | $42,083 |
| Female | 175 (41.9%) | $39,821 |
| Total | 418 (100.0%) | $41,771 |
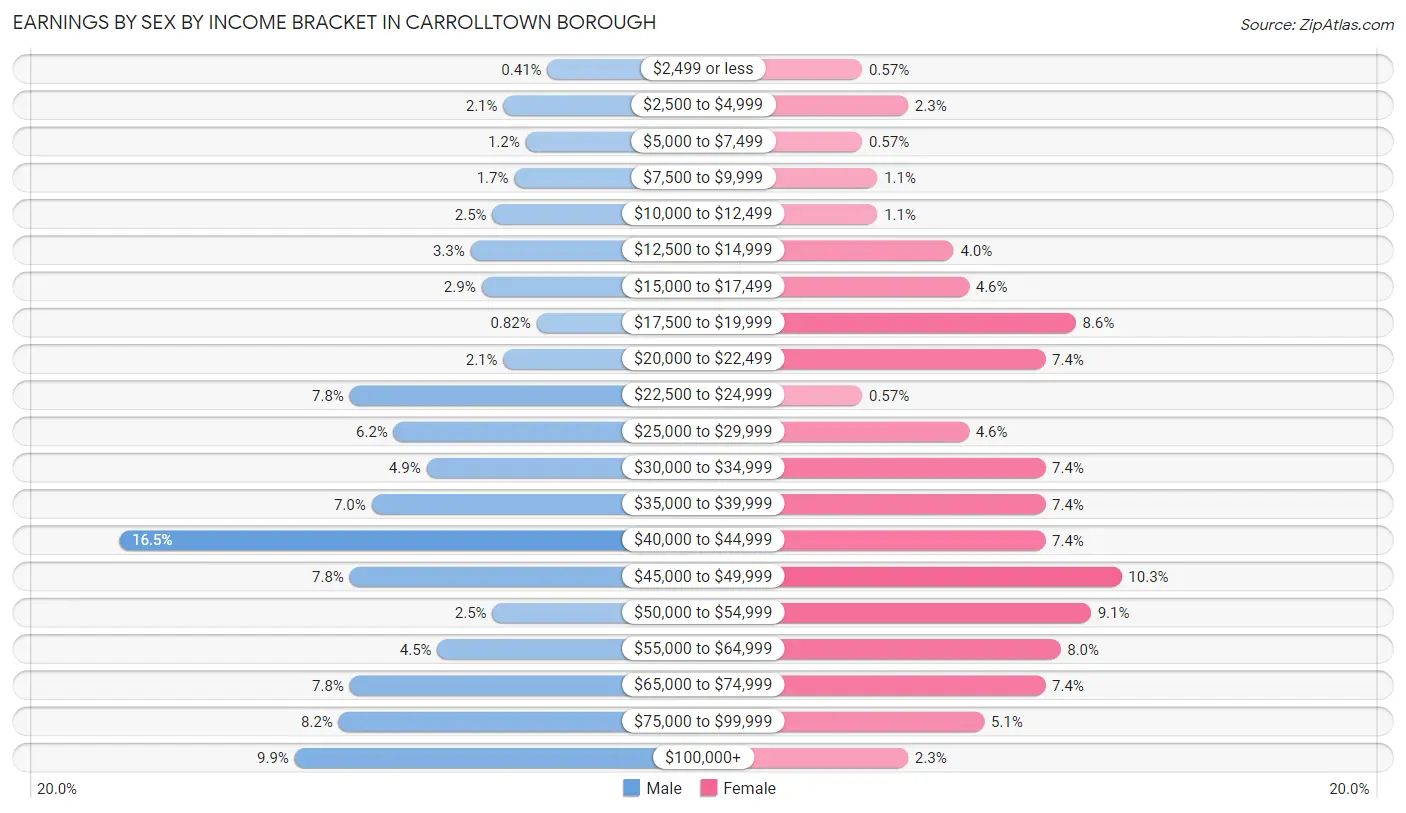
Earnings by Sex by Income Bracket in Carrolltown borough
The most common earnings brackets in Carrolltown borough are $40,000 to $44,999 for men (40 | 16.5%) and $45,000 to $49,999 for women (18 | 10.3%).
| Income | Male | Female |
| $2,499 or less | 1 (0.4%) | 1 (0.6%) |
| $2,500 to $4,999 | 5 (2.1%) | 4 (2.3%) |
| $5,000 to $7,499 | 3 (1.2%) | 1 (0.6%) |
| $7,500 to $9,999 | 4 (1.7%) | 2 (1.1%) |
| $10,000 to $12,499 | 6 (2.5%) | 2 (1.1%) |
| $12,500 to $14,999 | 8 (3.3%) | 7 (4.0%) |
| $15,000 to $17,499 | 7 (2.9%) | 8 (4.6%) |
| $17,500 to $19,999 | 2 (0.8%) | 15 (8.6%) |
| $20,000 to $22,499 | 5 (2.1%) | 13 (7.4%) |
| $22,500 to $24,999 | 19 (7.8%) | 1 (0.6%) |
| $25,000 to $29,999 | 15 (6.2%) | 8 (4.6%) |
| $30,000 to $34,999 | 12 (4.9%) | 13 (7.4%) |
| $35,000 to $39,999 | 17 (7.0%) | 13 (7.4%) |
| $40,000 to $44,999 | 40 (16.5%) | 13 (7.4%) |
| $45,000 to $49,999 | 19 (7.8%) | 18 (10.3%) |
| $50,000 to $54,999 | 6 (2.5%) | 16 (9.1%) |
| $55,000 to $64,999 | 11 (4.5%) | 14 (8.0%) |
| $65,000 to $74,999 | 19 (7.8%) | 13 (7.4%) |
| $75,000 to $99,999 | 20 (8.2%) | 9 (5.1%) |
| $100,000+ | 24 (9.9%) | 4 (2.3%) |
| Total | 243 (100.0%) | 175 (100.0%) |
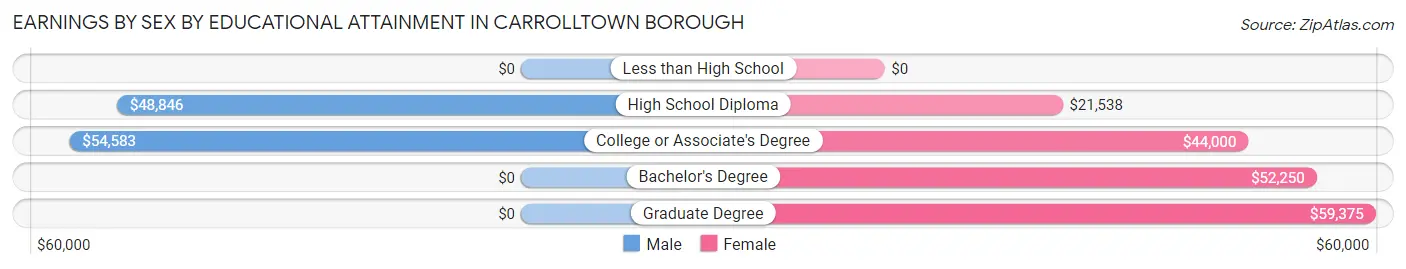
Earnings by Sex by Educational Attainment in Carrolltown borough
Average earnings in Carrolltown borough are $49,231 for men and $43,500 for women, a difference of 11.6%. Men with an educational attainment of college or associate's degree enjoy the highest average annual earnings of $54,583, while those with high school diploma education earn the least with $48,846. Women with an educational attainment of graduate degree earn the most with the average annual earnings of $59,375, while those with high school diploma education have the smallest earnings of $21,538.
| Educational Attainment | Male Income | Female Income |
| Less than High School | - | - |
| High School Diploma | $48,846 | $21,538 |
| College or Associate's Degree | $54,583 | $44,000 |
| Bachelor's Degree | - | - |
| Graduate Degree | - | - |
| Total | $49,231 | $43,500 |
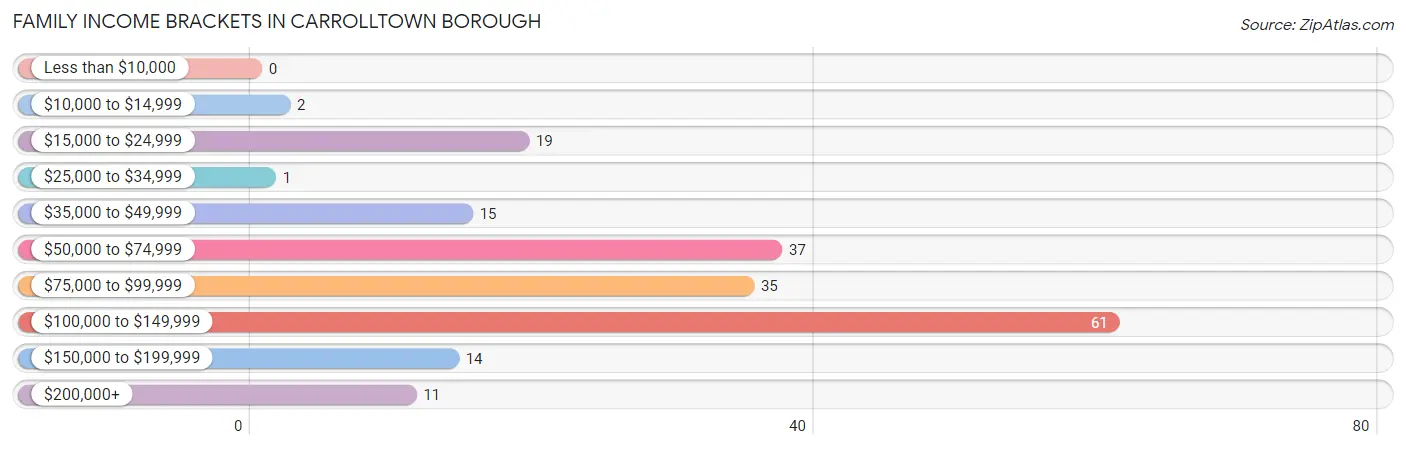
Family Income in Carrolltown borough
Family Income Brackets in Carrolltown borough
According to the Carrolltown borough family income data, there are 61 families falling into the $100,000 to $149,999 income range, which is the most common income bracket and makes up 31.3% of all families.
| Income Bracket | # Families | % Families |
| Less than $10,000 | 0 | 0.0% |
| $10,000 to $14,999 | 2 | 1.0% |
| $15,000 to $24,999 | 19 | 9.7% |
| $25,000 to $34,999 | 1 | 0.5% |
| $35,000 to $49,999 | 15 | 7.7% |
| $50,000 to $74,999 | 37 | 19.0% |
| $75,000 to $99,999 | 35 | 17.9% |
| $100,000 to $149,999 | 61 | 31.3% |
| $150,000 to $199,999 | 14 | 7.2% |
| $200,000+ | 11 | 5.6% |
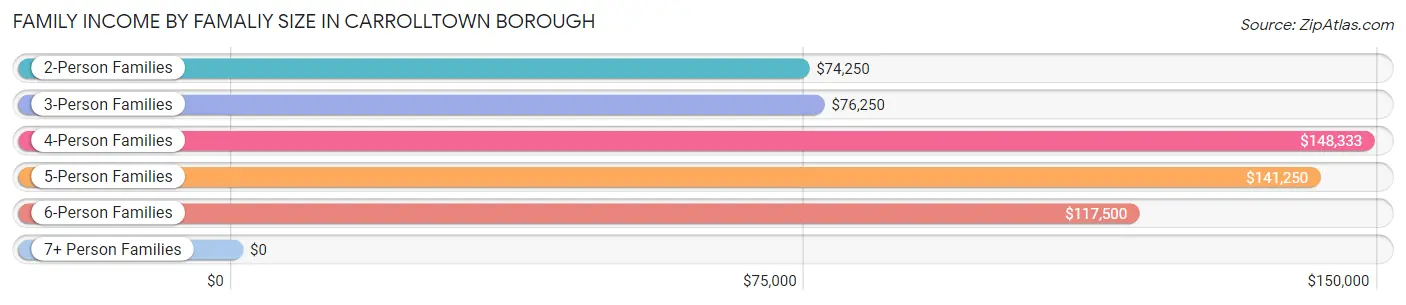
Family Income by Famaliy Size in Carrolltown borough
4-person families (22 | 11.3%) account for the highest median family income in Carrolltown borough with $148,333 per family, while 2-person families (109 | 55.9%) have the highest median income of $37,125 per family member.
| Income Bracket | # Families | Median Income |
| 2-Person Families | 109 (55.9%) | $74,250 |
| 3-Person Families | 36 (18.5%) | $76,250 |
| 4-Person Families | 22 (11.3%) | $148,333 |
| 5-Person Families | 16 (8.2%) | $141,250 |
| 6-Person Families | 12 (6.1%) | $117,500 |
| 7+ Person Families | 0 (0.0%) | $0 |
| Total | 195 (100.0%) | $93,125 |
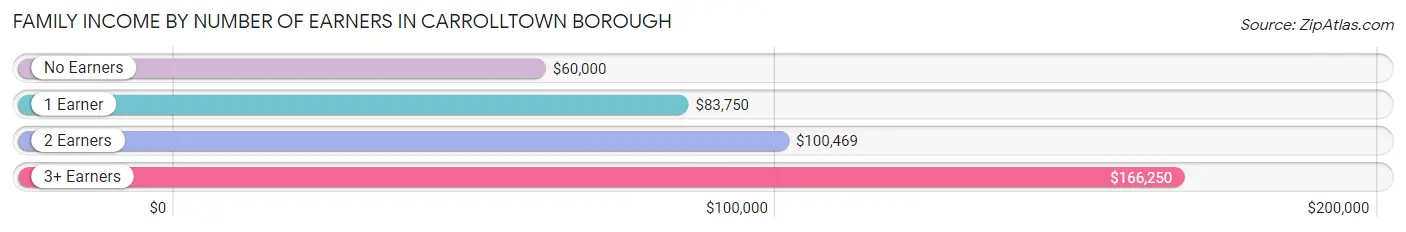
Family Income by Number of Earners in Carrolltown borough
The median family income in Carrolltown borough is $93,125, with families comprising 3+ earners (18) having the highest median family income of $166,250, while families with no earners (34) have the lowest median family income of $60,000, accounting for 9.2% and 17.4% of families, respectively.
| Number of Earners | # Families | Median Income |
| No Earners | 34 (17.4%) | $60,000 |
| 1 Earner | 58 (29.7%) | $83,750 |
| 2 Earners | 85 (43.6%) | $100,469 |
| 3+ Earners | 18 (9.2%) | $166,250 |
| Total | 195 (100.0%) | $93,125 |
Household Income in Carrolltown borough
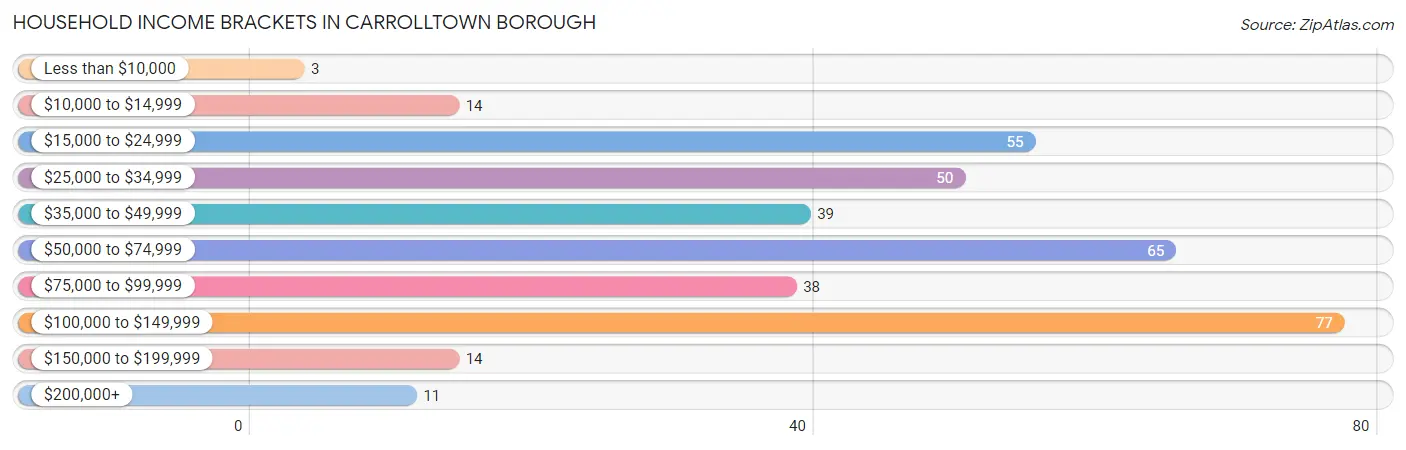
Household Income Brackets in Carrolltown borough
With 77 households falling in the category, the $100,000 to $149,999 income range is the most frequent in Carrolltown borough, accounting for 21.0% of all households. In contrast, only 3 households (0.8%) fall into the less than $10,000 income bracket, making it the least populous group.
| Income Bracket | # Households | % Households |
| Less than $10,000 | 3 | 0.8% |
| $10,000 to $14,999 | 14 | 3.8% |
| $15,000 to $24,999 | 55 | 15.0% |
| $25,000 to $34,999 | 50 | 13.7% |
| $35,000 to $49,999 | 39 | 10.7% |
| $50,000 to $74,999 | 65 | 17.8% |
| $75,000 to $99,999 | 38 | 10.4% |
| $100,000 to $149,999 | 77 | 21.0% |
| $150,000 to $199,999 | 14 | 3.8% |
| $200,000+ | 11 | 3.0% |
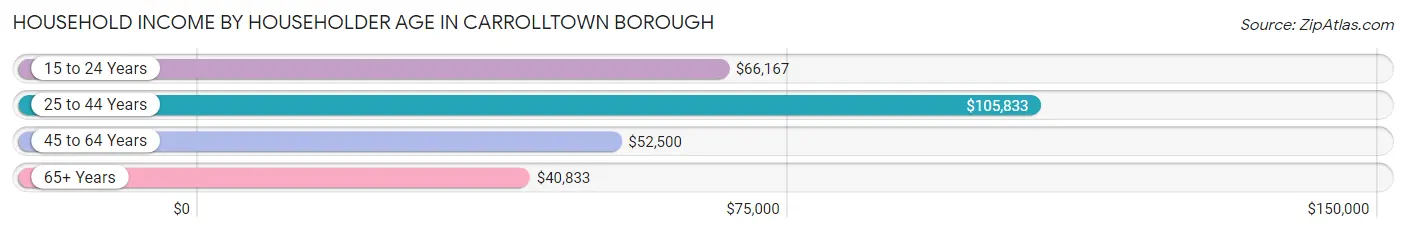
Household Income by Householder Age in Carrolltown borough
The median household income in Carrolltown borough is $62,000, with the highest median household income of $105,833 found in the 25 to 44 years age bracket for the primary householder. A total of 74 households (20.2%) fall into this category. Meanwhile, the 65+ years age bracket for the primary householder has the lowest median household income of $40,833, with 124 households (33.9%) in this group.
| Income Bracket | # Households | Median Income |
| 15 to 24 Years | 26 (7.1%) | $66,167 |
| 25 to 44 Years | 74 (20.2%) | $105,833 |
| 45 to 64 Years | 142 (38.8%) | $52,500 |
| 65+ Years | 124 (33.9%) | $40,833 |
| Total | 366 (100.0%) | $62,000 |
Poverty in Carrolltown borough
Income Below Poverty by Sex and Age in Carrolltown borough
With 3.2% poverty level for males and 7.2% for females among the residents of Carrolltown borough, 12 to 14 year old males and 75 year old and over females are the most vulnerable to poverty, with 2 males (40.0%) and 17 females (28.3%) in their respective age groups living below the poverty level.
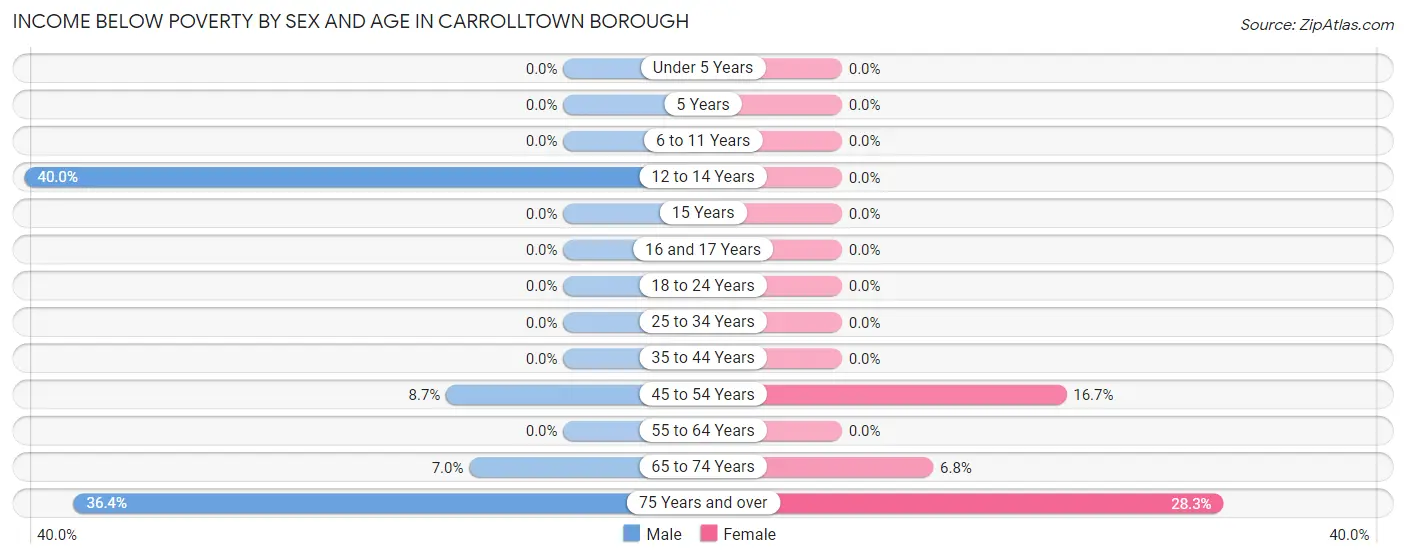
| Age Bracket | Male | Female |
| Under 5 Years | 0 (0.0%) | 0 (0.0%) |
| 5 Years | 0 (0.0%) | 0 (0.0%) |
| 6 to 11 Years | 0 (0.0%) | 0 (0.0%) |
| 12 to 14 Years | 2 (40.0%) | 0 (0.0%) |
| 15 Years | 0 (0.0%) | 0 (0.0%) |
| 16 and 17 Years | 0 (0.0%) | 0 (0.0%) |
| 18 to 24 Years | 0 (0.0%) | 0 (0.0%) |
| 25 to 34 Years | 0 (0.0%) | 0 (0.0%) |
| 35 to 44 Years | 0 (0.0%) | 0 (0.0%) |
| 45 to 54 Years | 4 (8.7%) | 7 (16.7%) |
| 55 to 64 Years | 0 (0.0%) | 0 (0.0%) |
| 65 to 74 Years | 3 (7.0%) | 4 (6.8%) |
| 75 Years and over | 4 (36.4%) | 17 (28.3%) |
| Total | 13 (3.2%) | 28 (7.2%) |
Income Above Poverty by Sex and Age in Carrolltown borough
According to the poverty statistics in Carrolltown borough, males aged under 5 years and females aged under 5 years are the age groups that are most secure financially, with 100.0% of males and 100.0% of females in these age groups living above the poverty line.
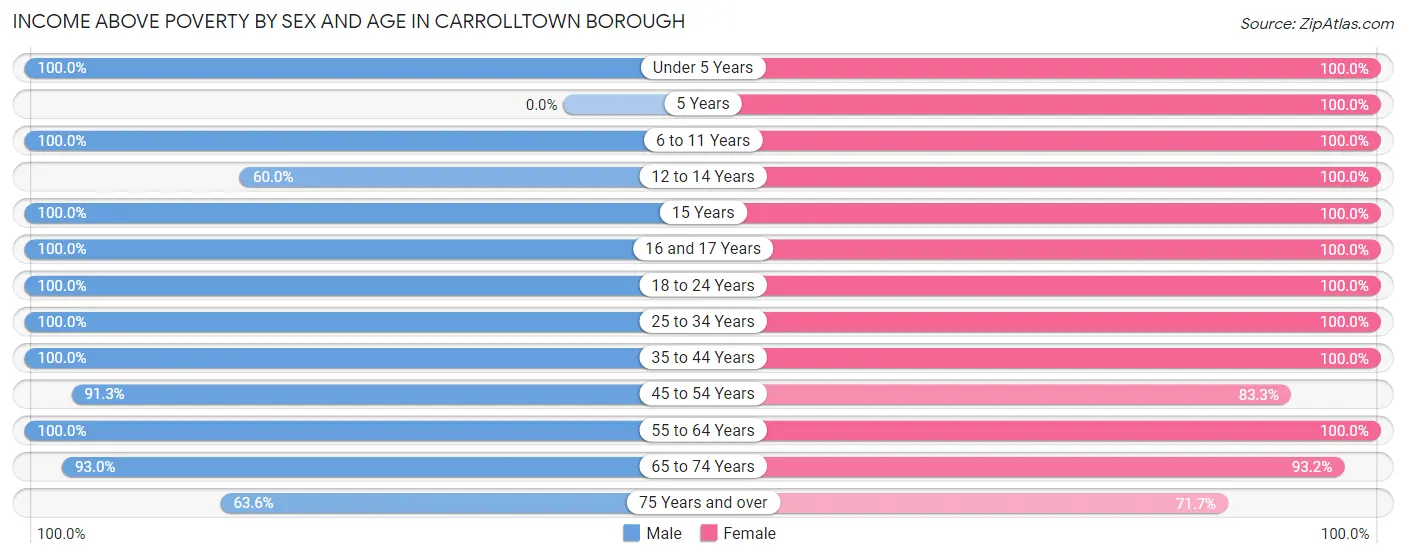
| Age Bracket | Male | Female |
| Under 5 Years | 14 (100.0%) | 7 (100.0%) |
| 5 Years | 0 (0.0%) | 1 (100.0%) |
| 6 to 11 Years | 24 (100.0%) | 36 (100.0%) |
| 12 to 14 Years | 3 (60.0%) | 11 (100.0%) |
| 15 Years | 2 (100.0%) | 6 (100.0%) |
| 16 and 17 Years | 3 (100.0%) | 9 (100.0%) |
| 18 to 24 Years | 83 (100.0%) | 28 (100.0%) |
| 25 to 34 Years | 48 (100.0%) | 45 (100.0%) |
| 35 to 44 Years | 38 (100.0%) | 27 (100.0%) |
| 45 to 54 Years | 42 (91.3%) | 35 (83.3%) |
| 55 to 64 Years | 93 (100.0%) | 57 (100.0%) |
| 65 to 74 Years | 40 (93.0%) | 55 (93.2%) |
| 75 Years and over | 7 (63.6%) | 43 (71.7%) |
| Total | 397 (96.8%) | 360 (92.8%) |
Income Below Poverty Among Married-Couple Families in Carrolltown borough
The poverty statistics for married-couple families in Carrolltown borough show that 2.7% or 4 of the total 146 families live below the poverty line. Families with no children have the highest poverty rate of 4.3%, comprising of 4 families. On the other hand, families with 1 or 2 children have the lowest poverty rate of 0.0%, which includes 0 families.
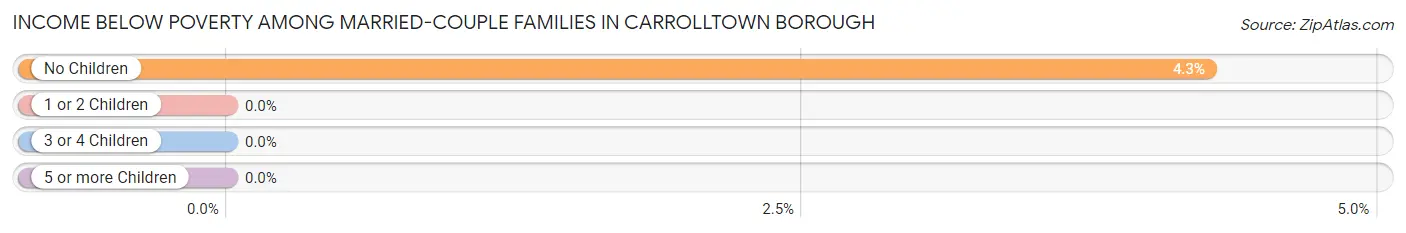
| Children | Above Poverty | Below Poverty |
| No Children | 90 (95.7%) | 4 (4.3%) |
| 1 or 2 Children | 37 (100.0%) | 0 (0.0%) |
| 3 or 4 Children | 15 (100.0%) | 0 (0.0%) |
| 5 or more Children | 0 (0.0%) | 0 (0.0%) |
| Total | 142 (97.3%) | 4 (2.7%) |
Income Below Poverty Among Single-Parent Households in Carrolltown borough
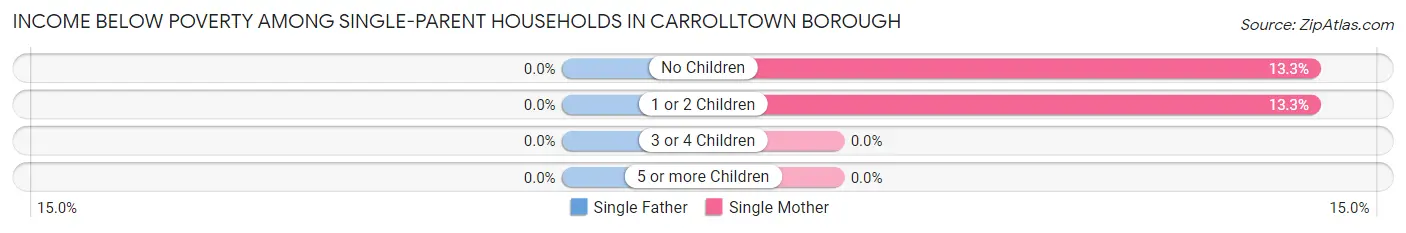
| Children | Single Father | Single Mother |
| No Children | 0 (0.0%) | 2 (13.3%) |
| 1 or 2 Children | 0 (0.0%) | 2 (13.3%) |
| 3 or 4 Children | 0 (0.0%) | 0 (0.0%) |
| 5 or more Children | 0 (0.0%) | 0 (0.0%) |
| Total | 0 (0.0%) | 4 (13.3%) |
Income Below Poverty Among Married-Couple vs Single-Parent Households in Carrolltown borough
The poverty data for Carrolltown borough shows that 4 of the married-couple family households (2.7%) and 4 of the single-parent households (8.2%) are living below the poverty level. Within the married-couple family households, those with no children have the highest poverty rate, with 4 households (4.3%) falling below the poverty line. Among the single-parent households, those with 1 or 2 children have the highest poverty rate, with 2 household (13.3%) living below poverty.
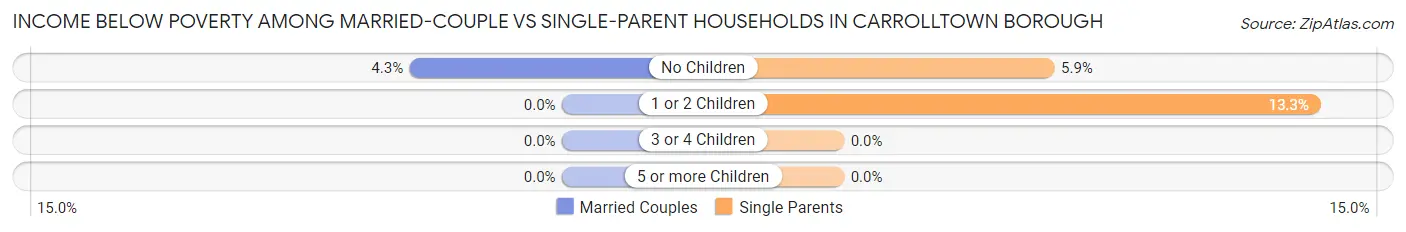
| Children | Married-Couple Families | Single-Parent Households |
| No Children | 4 (4.3%) | 2 (5.9%) |
| 1 or 2 Children | 0 (0.0%) | 2 (13.3%) |
| 3 or 4 Children | 0 (0.0%) | 0 (0.0%) |
| 5 or more Children | 0 (0.0%) | 0 (0.0%) |
| Total | 4 (2.7%) | 4 (8.2%) |
Race in Carrolltown borough
The most populous races in Carrolltown borough are White / Caucasian (816 | 99.3%), Hispanic or Latino (12 | 1.5%), and Native / Alaskan (3 | 0.4%).
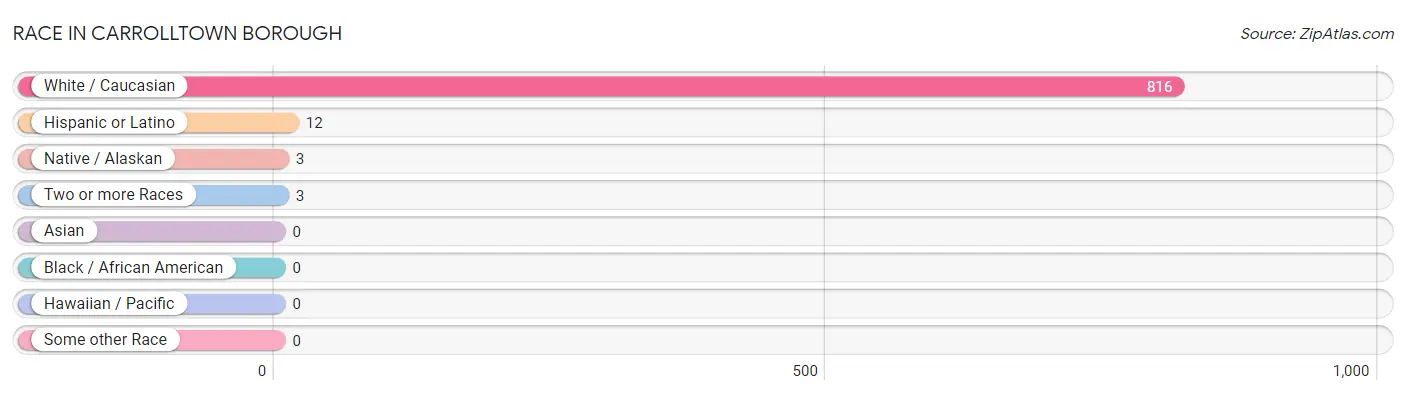
| Race | # Population | % Population |
| Asian | 0 | 0.0% |
| Black / African American | 0 | 0.0% |
| Hawaiian / Pacific | 0 | 0.0% |
| Hispanic or Latino | 12 | 1.5% |
| Native / Alaskan | 3 | 0.4% |
| White / Caucasian | 816 | 99.3% |
| Two or more Races | 3 | 0.4% |
| Some other Race | 0 | 0.0% |
| Total | 822 | 100.0% |
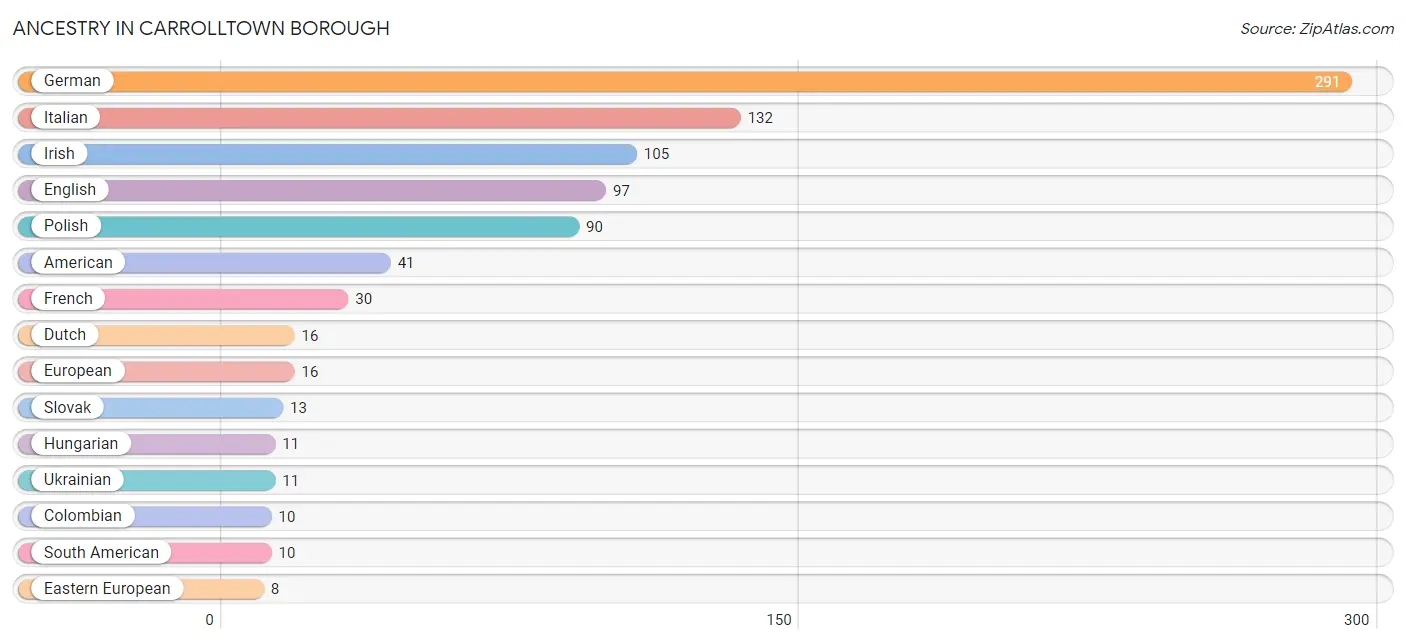
Ancestry in Carrolltown borough
The most populous ancestries reported in Carrolltown borough are German (291 | 35.4%), Italian (132 | 16.1%), Irish (105 | 12.8%), English (97 | 11.8%), and Polish (90 | 11.0%), together accounting for 87.0% of all Carrolltown borough residents.
| Ancestry | # Population | % Population |
| American | 41 | 5.0% |
| Arab | 2 | 0.2% |
| Colombian | 10 | 1.2% |
| Czechoslovakian | 4 | 0.5% |
| Dominican | 1 | 0.1% |
| Dutch | 16 | 1.9% |
| Eastern European | 8 | 1.0% |
| English | 97 | 11.8% |
| European | 16 | 1.9% |
| French | 30 | 3.6% |
| German | 291 | 35.4% |
| Hungarian | 11 | 1.3% |
| Irish | 105 | 12.8% |
| Italian | 132 | 16.1% |
| Lebanese | 2 | 0.2% |
| Lithuanian | 3 | 0.4% |
| Mexican | 1 | 0.1% |
| Polish | 90 | 11.0% |
| Scandinavian | 2 | 0.2% |
| Scotch-Irish | 6 | 0.7% |
| Sioux | 3 | 0.4% |
| Slovak | 13 | 1.6% |
| Slovene | 2 | 0.2% |
| South American | 10 | 1.2% |
| Ukrainian | 11 | 1.3% |
| Welsh | 4 | 0.5% | View All 26 Rows |
Immigrants in Carrolltown borough
The most numerous immigrant groups reported in Carrolltown borough came from Caribbean (1 | 0.1%), Dominican Republic (1 | 0.1%), and Latin America (1 | 0.1%), together accounting for 0.4% of all Carrolltown borough residents.
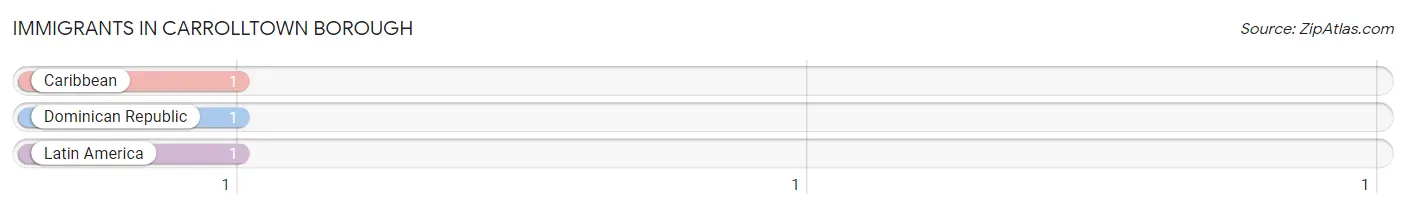
| Immigration Origin | # Population | % Population |
| Caribbean | 1 | 0.1% |
| Dominican Republic | 1 | 0.1% |
| Latin America | 1 | 0.1% | View All 3 Rows |
Sex and Age in Carrolltown borough
Sex and Age in Carrolltown borough
The most populous age groups in Carrolltown borough are 20 to 24 Years (78 | 18.5%) for men and 60 to 64 Years (34 | 8.5%) for women.
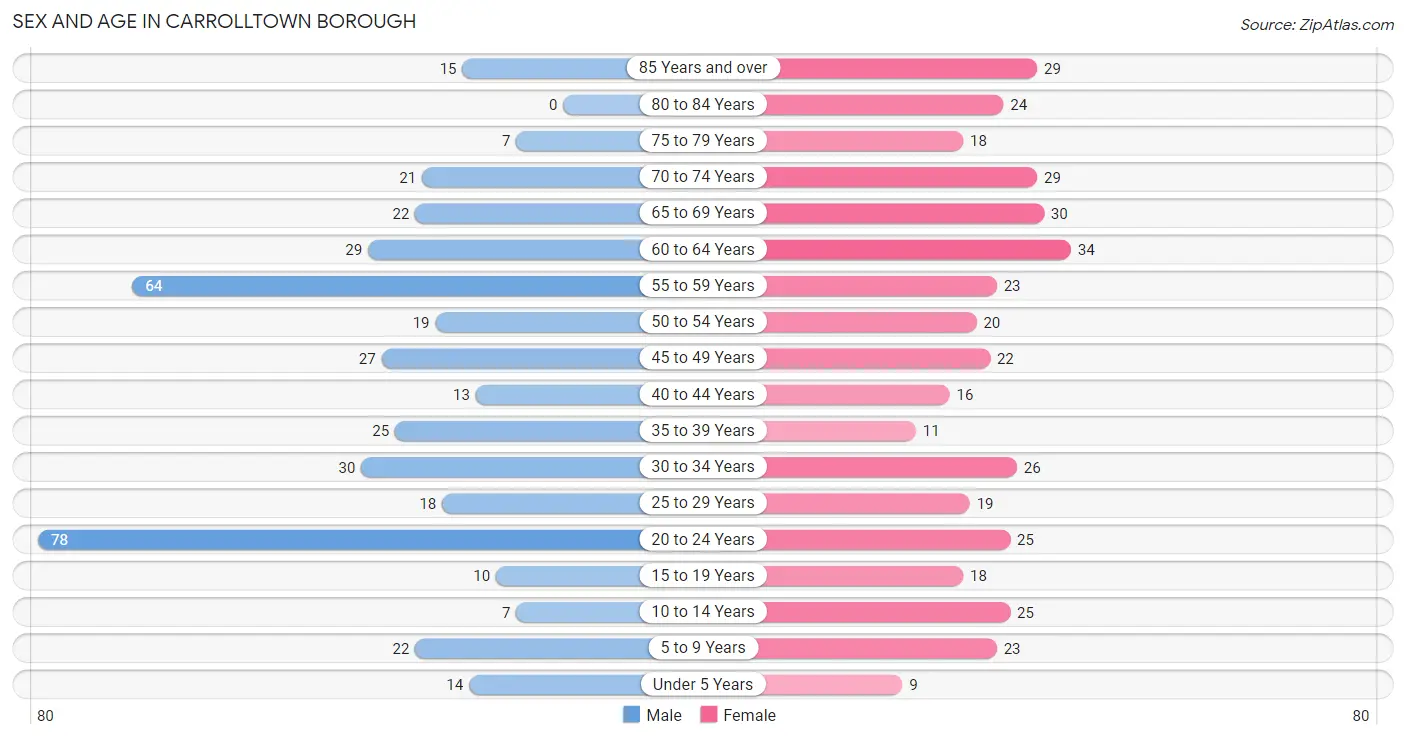
| Age Bracket | Male | Female |
| Under 5 Years | 14 (3.3%) | 9 (2.2%) |
| 5 to 9 Years | 22 (5.2%) | 23 (5.7%) |
| 10 to 14 Years | 7 (1.7%) | 25 (6.2%) |
| 15 to 19 Years | 10 (2.4%) | 18 (4.5%) |
| 20 to 24 Years | 78 (18.5%) | 25 (6.2%) |
| 25 to 29 Years | 18 (4.3%) | 19 (4.7%) |
| 30 to 34 Years | 30 (7.1%) | 26 (6.5%) |
| 35 to 39 Years | 25 (5.9%) | 11 (2.7%) |
| 40 to 44 Years | 13 (3.1%) | 16 (4.0%) |
| 45 to 49 Years | 27 (6.4%) | 22 (5.5%) |
| 50 to 54 Years | 19 (4.5%) | 20 (5.0%) |
| 55 to 59 Years | 64 (15.2%) | 23 (5.7%) |
| 60 to 64 Years | 29 (6.9%) | 34 (8.5%) |
| 65 to 69 Years | 22 (5.2%) | 30 (7.5%) |
| 70 to 74 Years | 21 (5.0%) | 29 (7.2%) |
| 75 to 79 Years | 7 (1.7%) | 18 (4.5%) |
| 80 to 84 Years | 0 (0.0%) | 24 (6.0%) |
| 85 Years and over | 15 (3.6%) | 29 (7.2%) |
| Total | 421 (100.0%) | 401 (100.0%) |
Families and Households in Carrolltown borough
Median Family Size in Carrolltown borough
The median family size in Carrolltown borough is 2.97 persons per family, with married-couple families (146 | 74.9%) accounting for the largest median family size of 3.18 persons per family. On the other hand, single male/father families (19 | 9.7%) represent the smallest median family size with 2.16 persons per family.
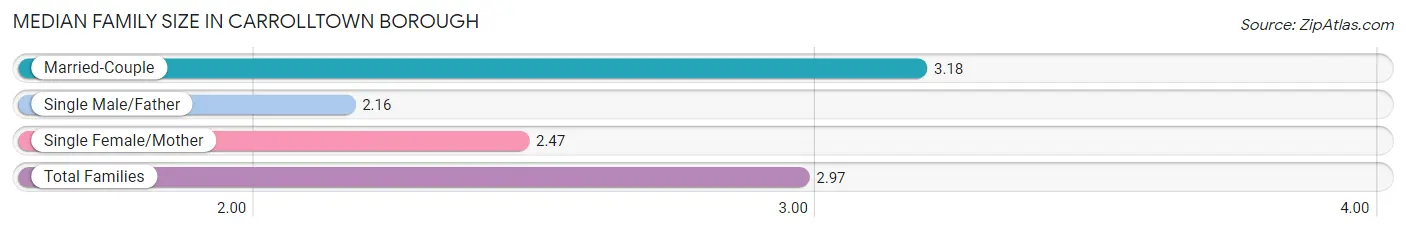
| Family Type | # Families | Family Size |
| Married-Couple | 146 (74.9%) | 3.18 |
| Single Male/Father | 19 (9.7%) | 2.16 |
| Single Female/Mother | 30 (15.4%) | 2.47 |
| Total Families | 195 (100.0%) | 2.97 |
Median Household Size in Carrolltown borough
The median household size in Carrolltown borough is 2.19 persons per household, with married-couple households (146 | 39.9%) accounting for the largest median household size of 3.19 persons per household. non-family households (171 | 46.7%) represent the smallest median household size with 1.18 persons per household.
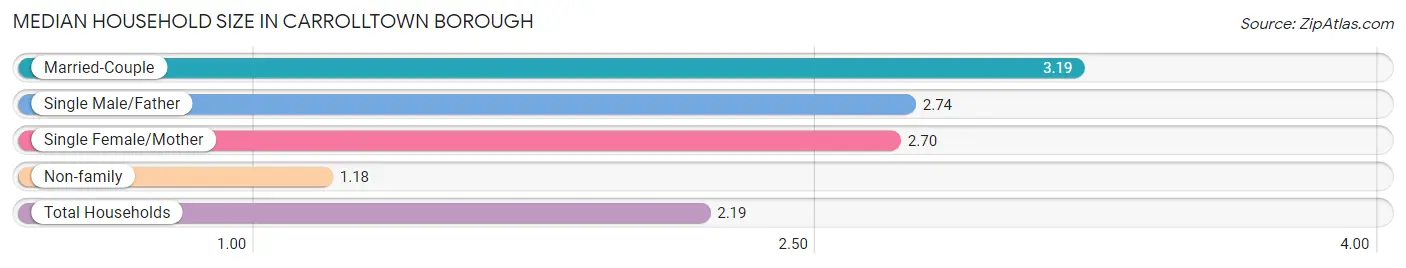
| Household Type | # Households | Household Size |
| Married-Couple | 146 (39.9%) | 3.19 |
| Single Male/Father | 19 (5.2%) | 2.74 |
| Single Female/Mother | 30 (8.2%) | 2.70 |
| Non-family | 171 (46.7%) | 1.18 |
| Total Households | 366 (100.0%) | 2.19 |
Household Size by Marriage Status in Carrolltown borough
Out of a total of 366 households in Carrolltown borough, 195 (53.3%) are family households, while 171 (46.7%) are nonfamily households. The most numerous type of family households are 2-person households, comprising 97, and the most common type of nonfamily households are 1-person households, comprising 136.
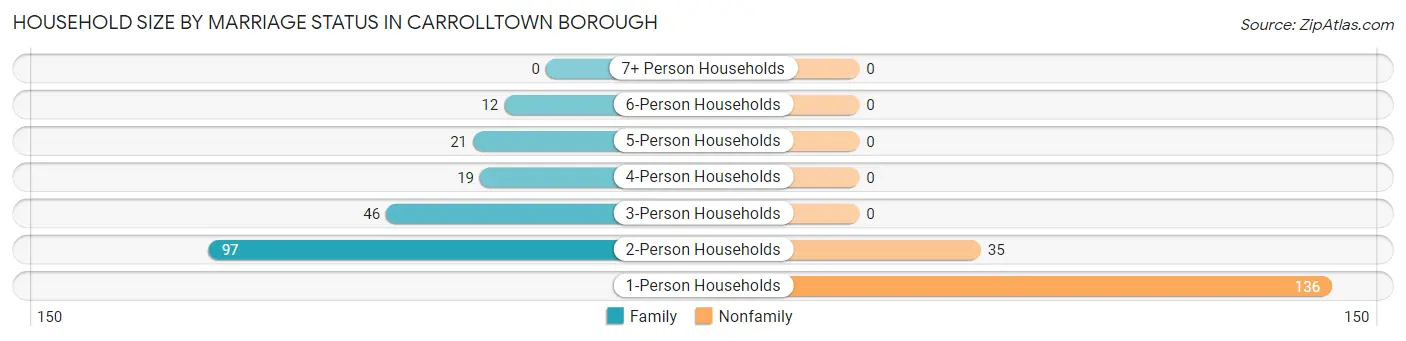
| Household Size | Family Households | Nonfamily Households |
| 1-Person Households | - | 136 (37.2%) |
| 2-Person Households | 97 (26.5%) | 35 (9.6%) |
| 3-Person Households | 46 (12.6%) | 0 (0.0%) |
| 4-Person Households | 19 (5.2%) | 0 (0.0%) |
| 5-Person Households | 21 (5.7%) | 0 (0.0%) |
| 6-Person Households | 12 (3.3%) | 0 (0.0%) |
| 7+ Person Households | 0 (0.0%) | 0 (0.0%) |
| Total | 195 (53.3%) | 171 (46.7%) |
Female Fertility in Carrolltown borough
Fertility by Age in Carrolltown borough
Average fertility rate in Carrolltown borough is 34.0 births per 1,000 women. Women in the age bracket of 20 to 34 years have the highest fertility rate with 71.0 births per 1,000 women. Women in the age bracket of 20 to 34 years acount for 100.0% of all women with births.
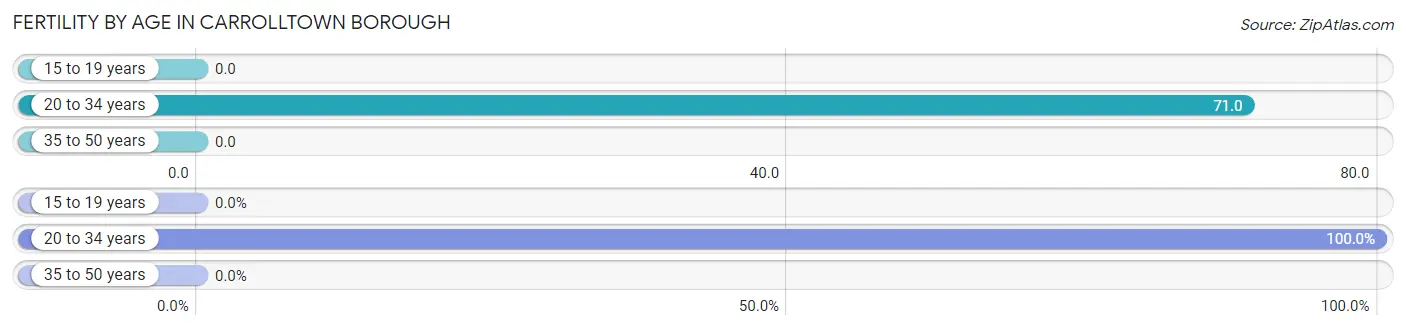
| Age Bracket | Women with Births | Births / 1,000 Women |
| 15 to 19 years | 0 (0.0%) | 0.0 |
| 20 to 34 years | 5 (100.0%) | 71.0 |
| 35 to 50 years | 0 (0.0%) | 0.0 |
| Total | 5 (100.0%) | 34.0 |
Fertility by Age by Marriage Status in Carrolltown borough
80.0% of women with births (5) in Carrolltown borough are married. The highest percentage of unmarried women with births falls into 20 to 34 years age bracket with 20.0% of them unmarried at the time of birth, while the lowest percentage of unmarried women with births belong to 20 to 34 years age bracket with 20.0% of them unmarried.
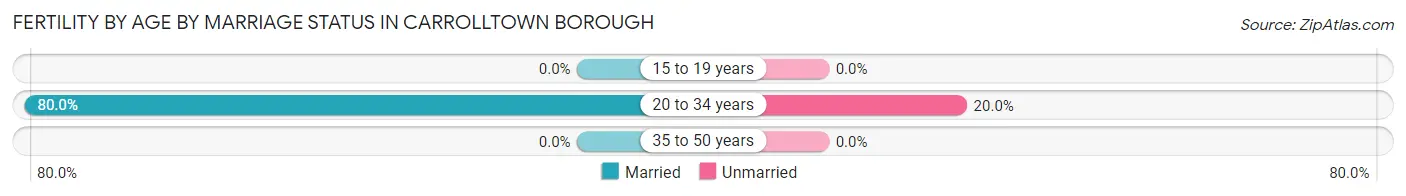
| Age Bracket | Married | Unmarried |
| 15 to 19 years | 0 (0.0%) | 0 (0.0%) |
| 20 to 34 years | 4 (80.0%) | 1 (20.0%) |
| 35 to 50 years | 0 (0.0%) | 0 (0.0%) |
| Total | 4 (80.0%) | 1 (20.0%) |
Fertility by Education in Carrolltown borough
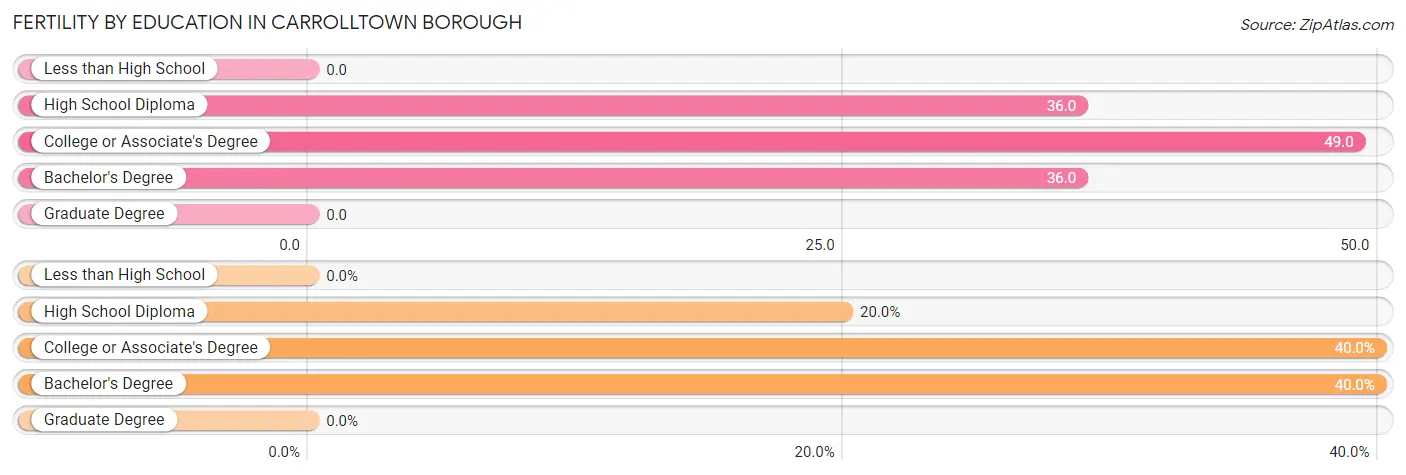
| Educational Attainment | Women with Births | Births / 1,000 Women |
| Less than High School | 0 (0.0%) | 0.0 |
| High School Diploma | 1 (20.0%) | 36.0 |
| College or Associate's Degree | 2 (40.0%) | 49.0 |
| Bachelor's Degree | 2 (40.0%) | 36.0 |
| Graduate Degree | 0 (0.0%) | 0.0 |
| Total | 5 (100.0%) | 34.0 |
Fertility by Education by Marriage Status in Carrolltown borough
20.0% of women with births in Carrolltown borough are unmarried. Women with the educational attainment of college or associate's degree are most likely to be married with 100.0% of them married at childbirth, while women with the educational attainment of high school diploma are least likely to be married with 100.0% of them unmarried at childbirth.
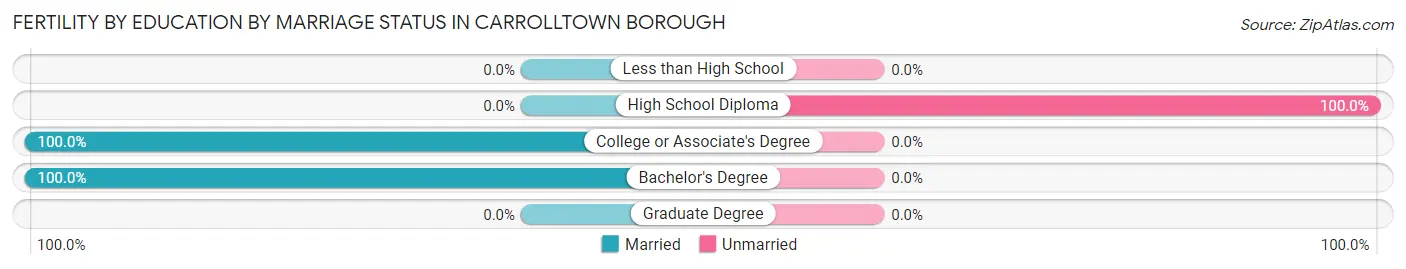
| Educational Attainment | Married | Unmarried |
| Less than High School | 0 (0.0%) | 0 (0.0%) |
| High School Diploma | 0 (0.0%) | 1 (100.0%) |
| College or Associate's Degree | 2 (100.0%) | 0 (0.0%) |
| Bachelor's Degree | 2 (100.0%) | 0 (0.0%) |
| Graduate Degree | 0 (0.0%) | 0 (0.0%) |
| Total | 4 (80.0%) | 1 (20.0%) |
Employment Characteristics in Carrolltown borough
Employment by Class of Employer in Carrolltown borough
Among the 391 employed individuals in Carrolltown borough, private company employees (272 | 69.6%), state government employees (65 | 16.6%), and not-for-profit organizations (16 | 4.1%) make up the most common classes of employment.
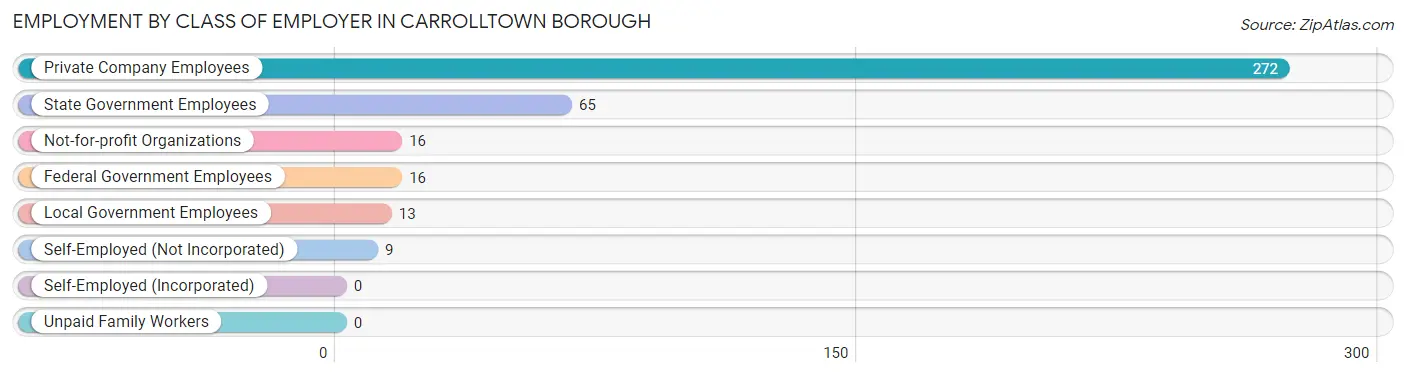
| Employer Class | # Employees | % Employees |
| Private Company Employees | 272 | 69.6% |
| Self-Employed (Incorporated) | 0 | 0.0% |
| Self-Employed (Not Incorporated) | 9 | 2.3% |
| Not-for-profit Organizations | 16 | 4.1% |
| Local Government Employees | 13 | 3.3% |
| State Government Employees | 65 | 16.6% |
| Federal Government Employees | 16 | 4.1% |
| Unpaid Family Workers | 0 | 0.0% |
| Total | 391 | 100.0% |
Employment Status by Age in Carrolltown borough
According to the labor force statistics for Carrolltown borough, out of the total population over 16 years of age (714), 58.1% or 415 individuals are in the labor force, with 3.4% or 14 of them unemployed. The age group with the highest labor force participation rate is 20 to 24 years, with 100.0% or 103 individuals in the labor force. Within the labor force, the 65 to 74 years age range has the highest percentage of unemployed individuals, with 28.6% or 4 of them being unemployed.
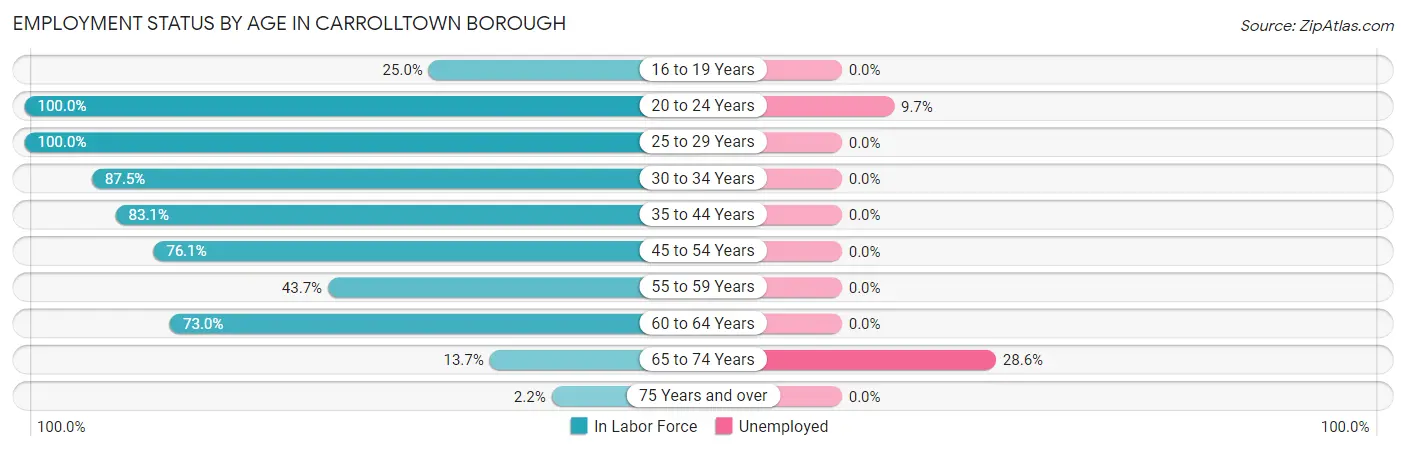
| Age Bracket | In Labor Force | Unemployed |
| 16 to 19 Years | 5 (25.0%) | 0 (0.0%) |
| 20 to 24 Years | 103 (100.0%) | 10 (9.7%) |
| 25 to 29 Years | 37 (100.0%) | 0 (0.0%) |
| 30 to 34 Years | 49 (87.5%) | 0 (0.0%) |
| 35 to 44 Years | 54 (83.1%) | 0 (0.0%) |
| 45 to 54 Years | 67 (76.1%) | 0 (0.0%) |
| 55 to 59 Years | 38 (43.7%) | 0 (0.0%) |
| 60 to 64 Years | 46 (73.0%) | 0 (0.0%) |
| 65 to 74 Years | 14 (13.7%) | 4 (28.6%) |
| 75 Years and over | 2 (2.2%) | 0 (0.0%) |
| Total | 415 (58.1%) | 14 (3.4%) |
Employment Status by Educational Attainment in Carrolltown borough
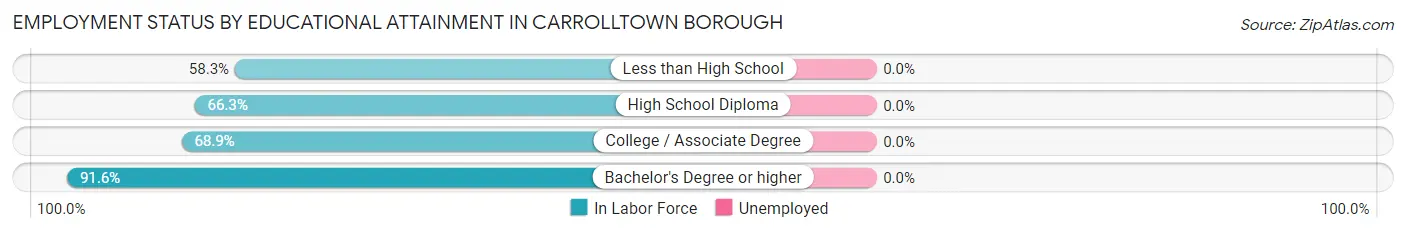
| Educational Attainment | In Labor Force | Unemployed |
| Less than High School | 7 (58.3%) | 0 (0.0%) |
| High School Diploma | 124 (66.3%) | 0 (0.0%) |
| College / Associate Degree | 62 (68.9%) | 0 (0.0%) |
| Bachelor's Degree or higher | 98 (91.6%) | 0 (0.0%) |
| Total | 291 (73.5%) | 0 (0.0%) |
Employment Occupations by Sex in Carrolltown borough
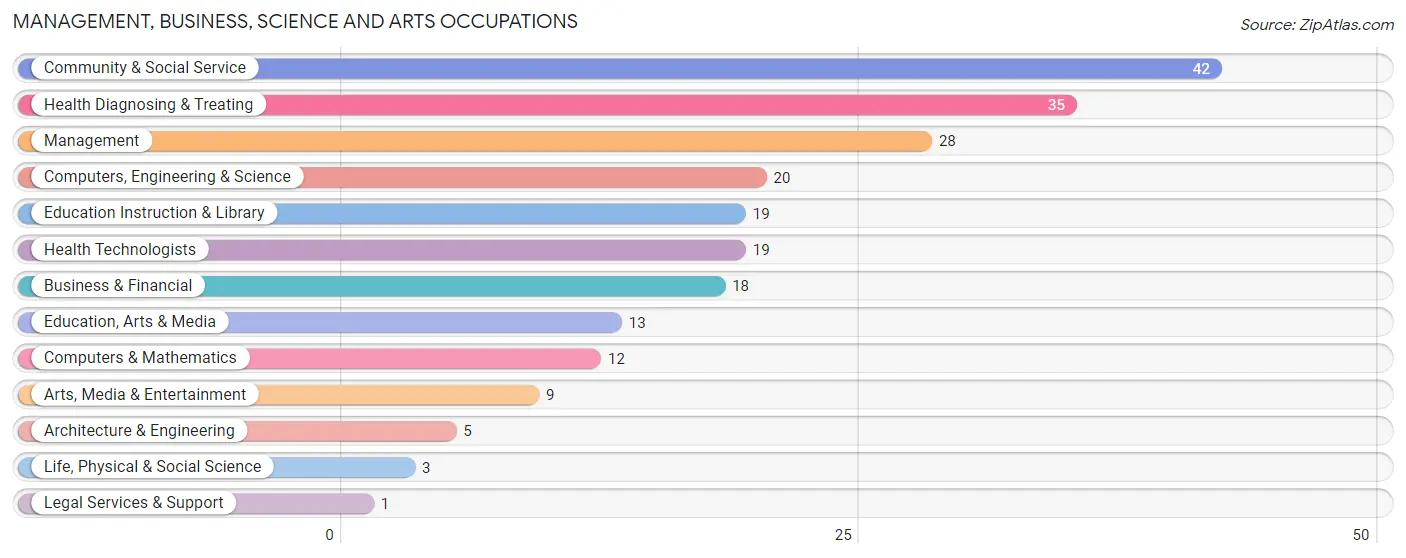
Management, Business, Science and Arts Occupations
The most common Management, Business, Science and Arts occupations in Carrolltown borough are Community & Social Service (42 | 10.5%), Health Diagnosing & Treating (35 | 8.7%), Management (28 | 7.0%), Computers, Engineering & Science (20 | 5.0%), and Education Instruction & Library (19 | 4.7%).
Management, Business, Science and Arts Occupations by Sex
Within the Management, Business, Science and Arts occupations in Carrolltown borough, the most male-oriented occupations are Computers & Mathematics (100.0%), Architecture & Engineering (100.0%), and Arts, Media & Entertainment (100.0%), while the most female-oriented occupations are Life, Physical & Social Science (100.0%), Legal Services & Support (100.0%), and Health Diagnosing & Treating (100.0%).
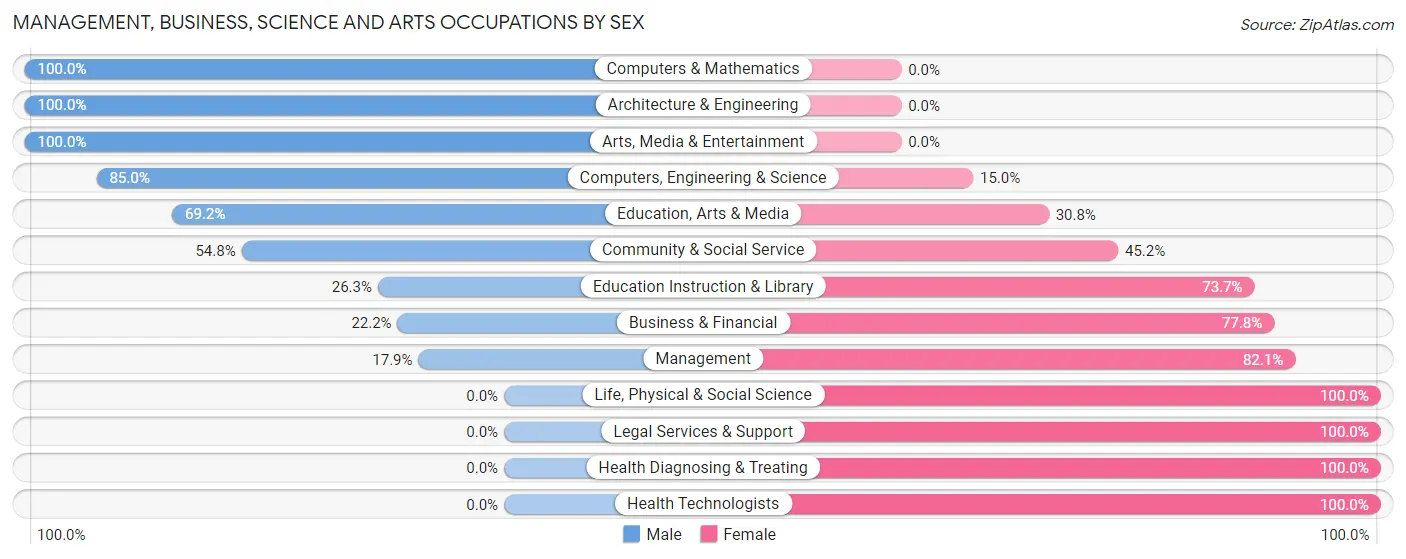
| Occupation | Male | Female |
| Management | 5 (17.9%) | 23 (82.1%) |
| Business & Financial | 4 (22.2%) | 14 (77.8%) |
| Computers, Engineering & Science | 17 (85.0%) | 3 (15.0%) |
| Computers & Mathematics | 12 (100.0%) | 0 (0.0%) |
| Architecture & Engineering | 5 (100.0%) | 0 (0.0%) |
| Life, Physical & Social Science | 0 (0.0%) | 3 (100.0%) |
| Community & Social Service | 23 (54.8%) | 19 (45.2%) |
| Education, Arts & Media | 9 (69.2%) | 4 (30.8%) |
| Legal Services & Support | 0 (0.0%) | 1 (100.0%) |
| Education Instruction & Library | 5 (26.3%) | 14 (73.7%) |
| Arts, Media & Entertainment | 9 (100.0%) | 0 (0.0%) |
| Health Diagnosing & Treating | 0 (0.0%) | 35 (100.0%) |
| Health Technologists | 0 (0.0%) | 19 (100.0%) |
| Total (Category) | 49 (34.3%) | 94 (65.7%) |
| Total (Overall) | 237 (59.1%) | 164 (40.9%) |
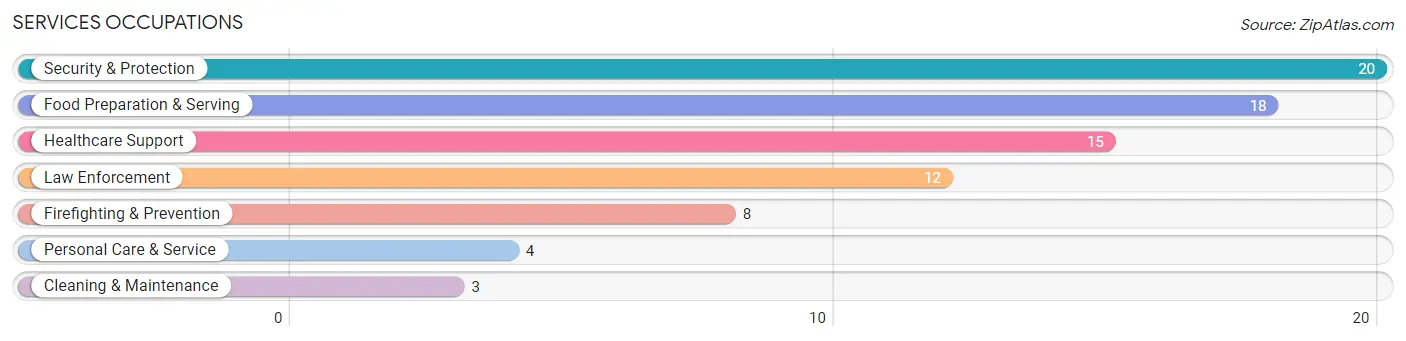
Services Occupations
The most common Services occupations in Carrolltown borough are Security & Protection (20 | 5.0%), Food Preparation & Serving (18 | 4.5%), Healthcare Support (15 | 3.7%), Law Enforcement (12 | 3.0%), and Firefighting & Prevention (8 | 2.0%).
Services Occupations by Sex
Within the Services occupations in Carrolltown borough, the most male-oriented occupations are Security & Protection (100.0%), Firefighting & Prevention (100.0%), and Law Enforcement (100.0%), while the most female-oriented occupations are Healthcare Support (66.7%), Food Preparation & Serving (55.6%), and Personal Care & Service (25.0%).
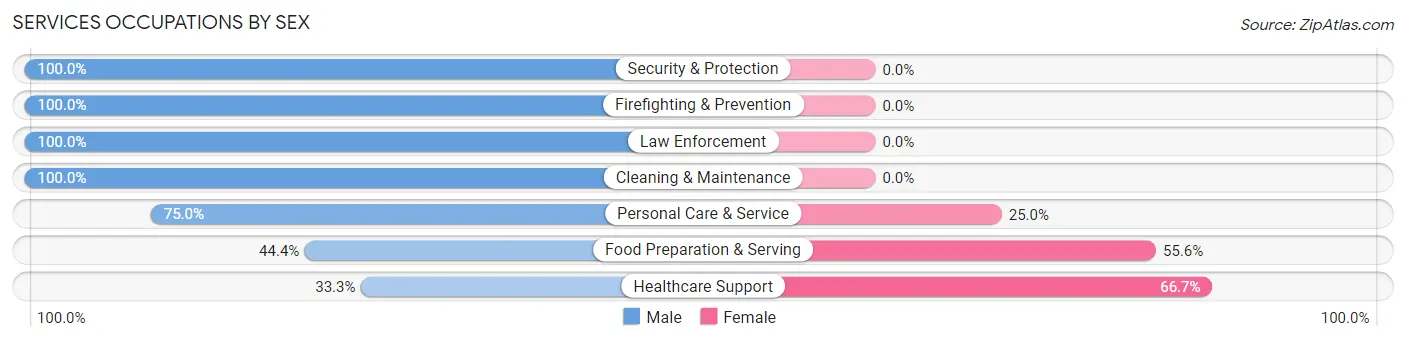
| Occupation | Male | Female |
| Healthcare Support | 5 (33.3%) | 10 (66.7%) |
| Security & Protection | 20 (100.0%) | 0 (0.0%) |
| Firefighting & Prevention | 8 (100.0%) | 0 (0.0%) |
| Law Enforcement | 12 (100.0%) | 0 (0.0%) |
| Food Preparation & Serving | 8 (44.4%) | 10 (55.6%) |
| Cleaning & Maintenance | 3 (100.0%) | 0 (0.0%) |
| Personal Care & Service | 3 (75.0%) | 1 (25.0%) |
| Total (Category) | 39 (65.0%) | 21 (35.0%) |
| Total (Overall) | 237 (59.1%) | 164 (40.9%) |
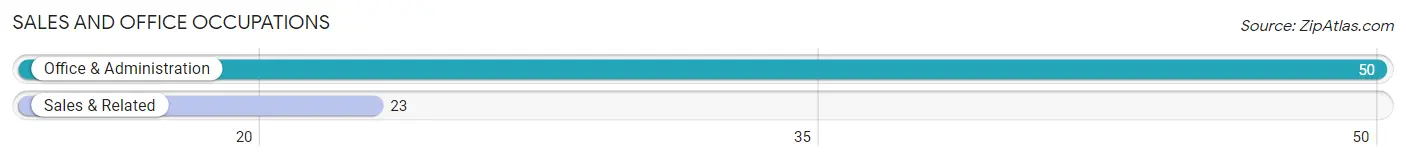
Sales and Office Occupations
The most common Sales and Office occupations in Carrolltown borough are Office & Administration (50 | 12.5%), and Sales & Related (23 | 5.7%).
Sales and Office Occupations by Sex
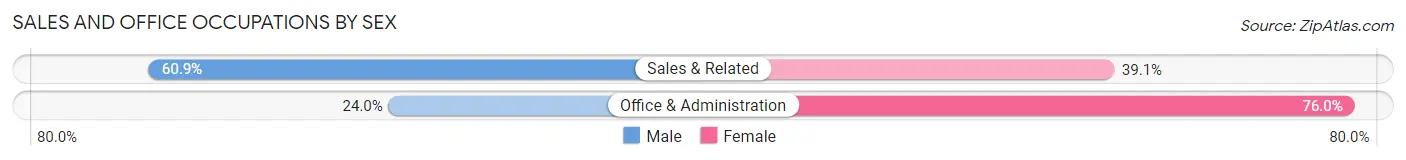
| Occupation | Male | Female |
| Sales & Related | 14 (60.9%) | 9 (39.1%) |
| Office & Administration | 12 (24.0%) | 38 (76.0%) |
| Total (Category) | 26 (35.6%) | 47 (64.4%) |
| Total (Overall) | 237 (59.1%) | 164 (40.9%) |
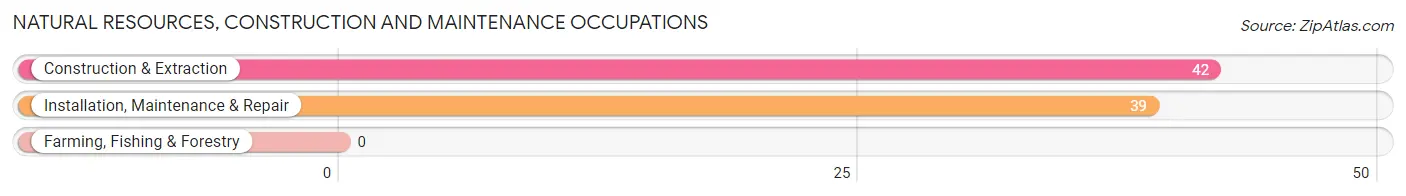
Natural Resources, Construction and Maintenance Occupations
The most common Natural Resources, Construction and Maintenance occupations in Carrolltown borough are Construction & Extraction (42 | 10.5%), and Installation, Maintenance & Repair (39 | 9.7%).
Natural Resources, Construction and Maintenance Occupations by Sex
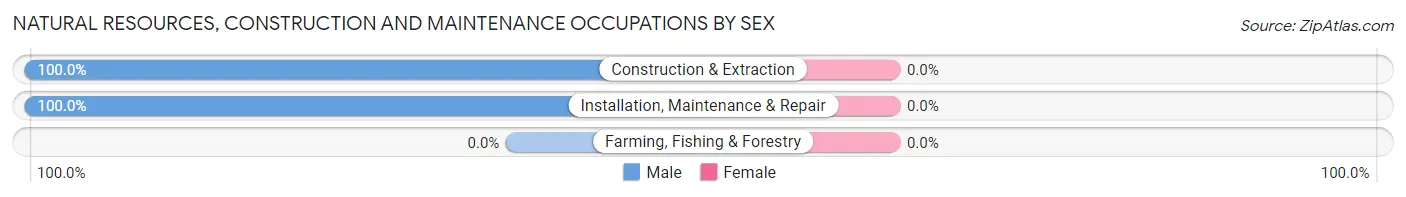
| Occupation | Male | Female |
| Farming, Fishing & Forestry | 0 (0.0%) | 0 (0.0%) |
| Construction & Extraction | 42 (100.0%) | 0 (0.0%) |
| Installation, Maintenance & Repair | 39 (100.0%) | 0 (0.0%) |
| Total (Category) | 81 (100.0%) | 0 (0.0%) |
| Total (Overall) | 237 (59.1%) | 164 (40.9%) |
Production, Transportation and Moving Occupations
The most common Production, Transportation and Moving occupations in Carrolltown borough are Material Moving (18 | 4.5%), Production (17 | 4.2%), and Transportation (9 | 2.2%).
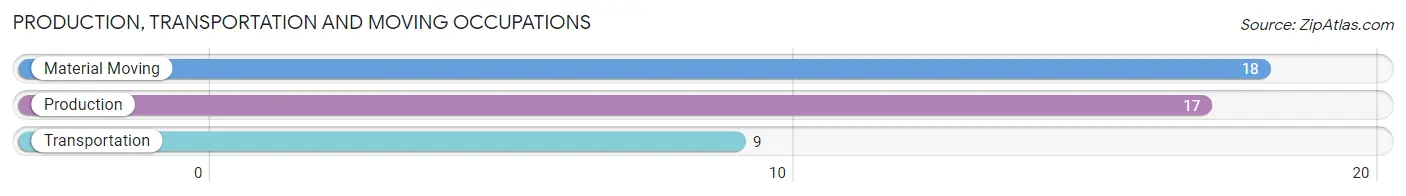
Production, Transportation and Moving Occupations by Sex
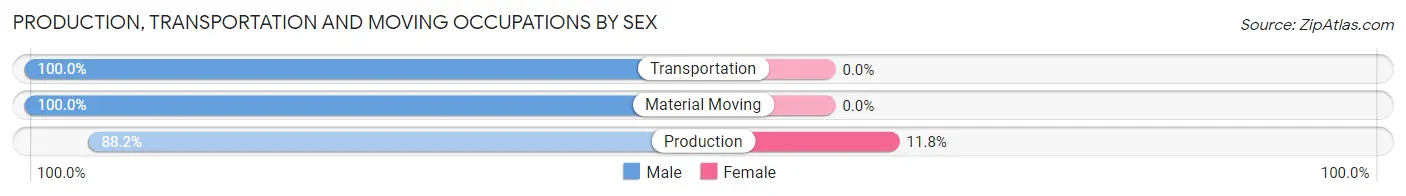
| Occupation | Male | Female |
| Production | 15 (88.2%) | 2 (11.8%) |
| Transportation | 9 (100.0%) | 0 (0.0%) |
| Material Moving | 18 (100.0%) | 0 (0.0%) |
| Total (Category) | 42 (95.5%) | 2 (4.5%) |
| Total (Overall) | 237 (59.1%) | 164 (40.9%) |
Employment Industries by Sex in Carrolltown borough
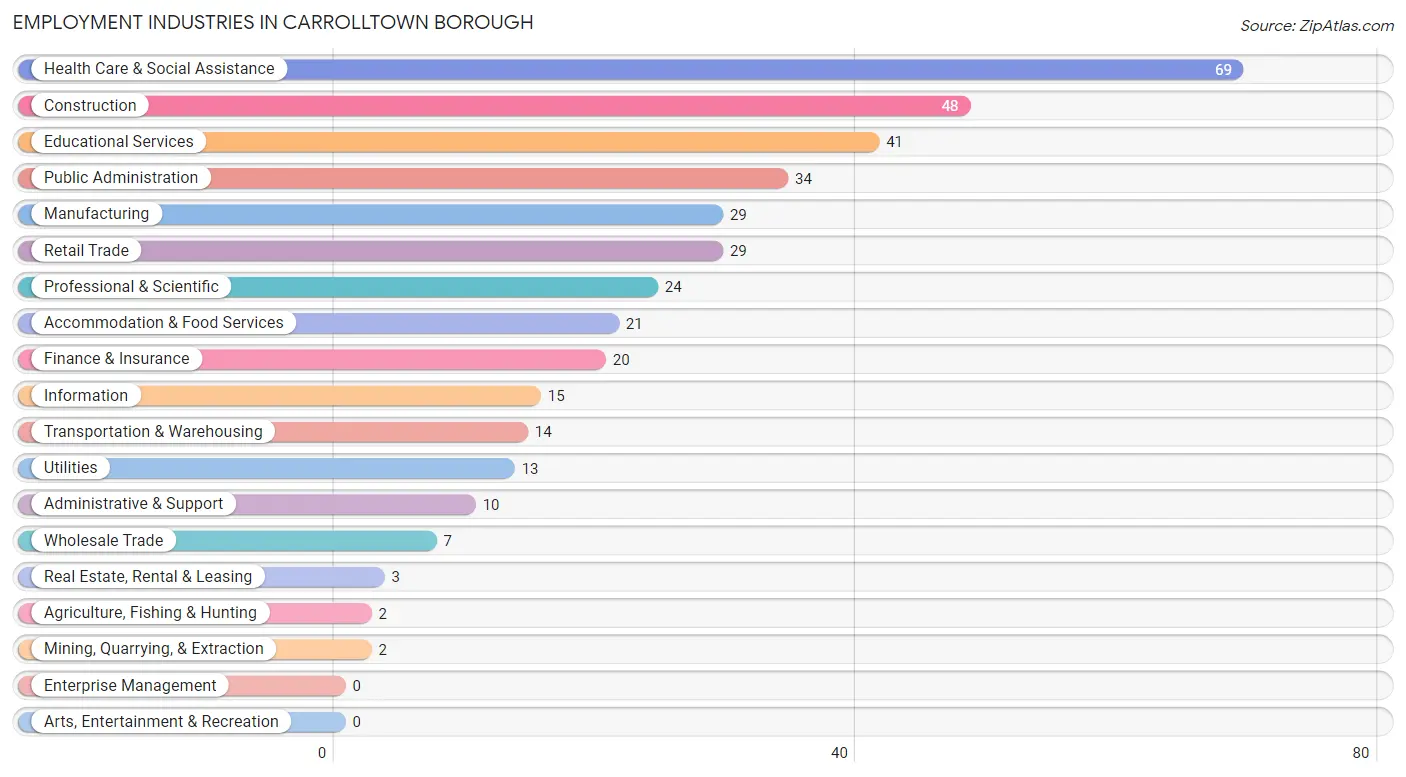
Employment Industries in Carrolltown borough
The major employment industries in Carrolltown borough include Health Care & Social Assistance (69 | 17.2%), Construction (48 | 12.0%), Educational Services (41 | 10.2%), Public Administration (34 | 8.5%), and Manufacturing (29 | 7.2%).
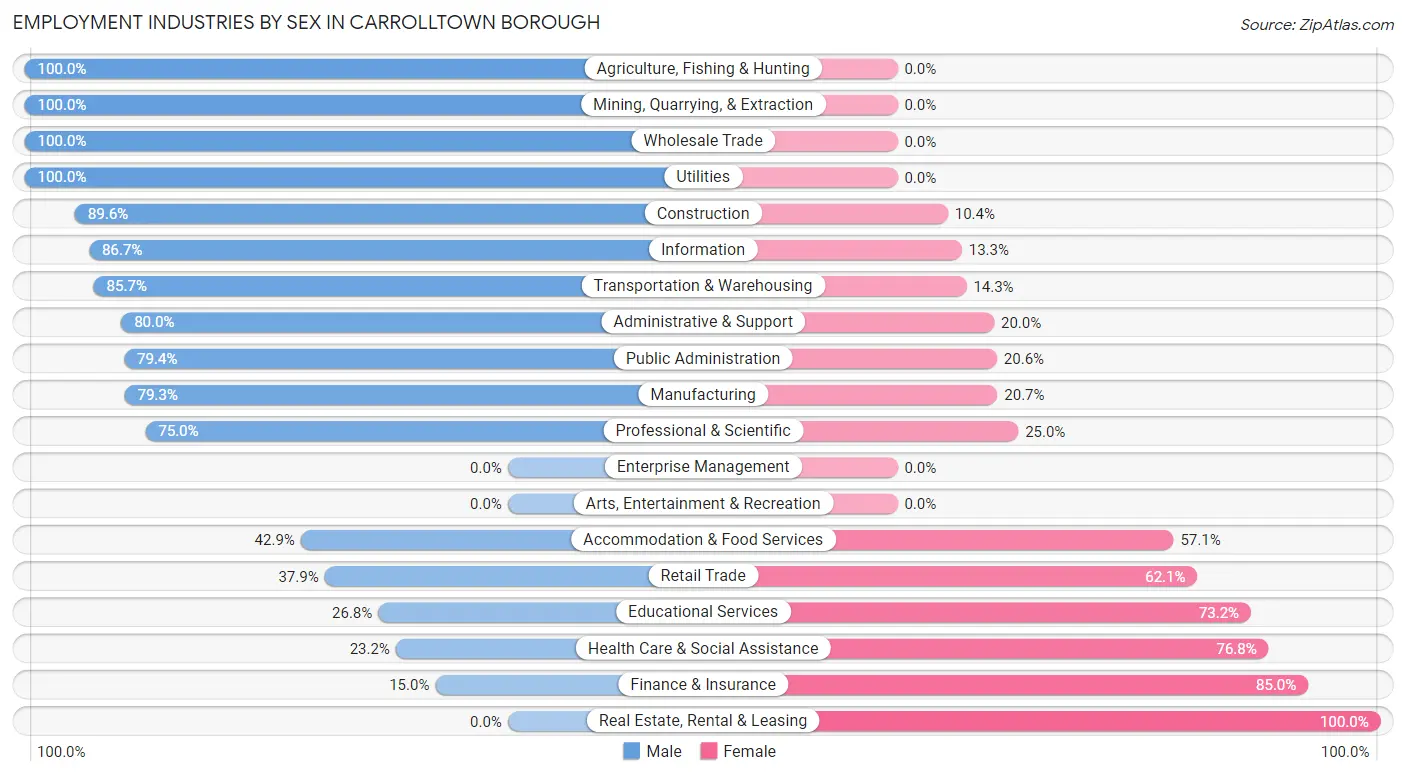
Employment Industries by Sex in Carrolltown borough
The Carrolltown borough industries that see more men than women are Agriculture, Fishing & Hunting (100.0%), Mining, Quarrying, & Extraction (100.0%), and Wholesale Trade (100.0%), whereas the industries that tend to have a higher number of women are Real Estate, Rental & Leasing (100.0%), Finance & Insurance (85.0%), and Health Care & Social Assistance (76.8%).
| Industry | Male | Female |
| Agriculture, Fishing & Hunting | 2 (100.0%) | 0 (0.0%) |
| Mining, Quarrying, & Extraction | 2 (100.0%) | 0 (0.0%) |
| Construction | 43 (89.6%) | 5 (10.4%) |
| Manufacturing | 23 (79.3%) | 6 (20.7%) |
| Wholesale Trade | 7 (100.0%) | 0 (0.0%) |
| Retail Trade | 11 (37.9%) | 18 (62.1%) |
| Transportation & Warehousing | 12 (85.7%) | 2 (14.3%) |
| Utilities | 13 (100.0%) | 0 (0.0%) |
| Information | 13 (86.7%) | 2 (13.3%) |
| Finance & Insurance | 3 (15.0%) | 17 (85.0%) |
| Real Estate, Rental & Leasing | 0 (0.0%) | 3 (100.0%) |
| Professional & Scientific | 18 (75.0%) | 6 (25.0%) |
| Enterprise Management | 0 (0.0%) | 0 (0.0%) |
| Administrative & Support | 8 (80.0%) | 2 (20.0%) |
| Educational Services | 11 (26.8%) | 30 (73.2%) |
| Health Care & Social Assistance | 16 (23.2%) | 53 (76.8%) |
| Arts, Entertainment & Recreation | 0 (0.0%) | 0 (0.0%) |
| Accommodation & Food Services | 9 (42.9%) | 12 (57.1%) |
| Public Administration | 27 (79.4%) | 7 (20.6%) |
| Total | 237 (59.1%) | 164 (40.9%) |
Education in Carrolltown borough
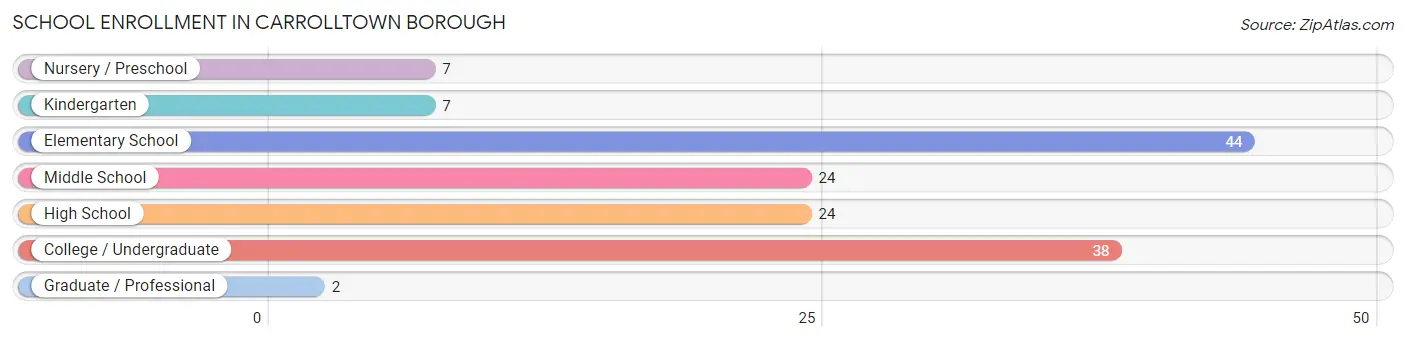
School Enrollment in Carrolltown borough
The most common levels of schooling among the 146 students in Carrolltown borough are elementary school (44 | 30.1%), college / undergraduate (38 | 26.0%), and middle school (24 | 16.4%).
| School Level | # Students | % Students |
| Nursery / Preschool | 7 | 4.8% |
| Kindergarten | 7 | 4.8% |
| Elementary School | 44 | 30.1% |
| Middle School | 24 | 16.4% |
| High School | 24 | 16.4% |
| College / Undergraduate | 38 | 26.0% |
| Graduate / Professional | 2 | 1.4% |
| Total | 146 | 100.0% |
School Enrollment by Age by Funding Source in Carrolltown borough
Out of a total of 146 students who are enrolled in schools in Carrolltown borough, 25 (17.1%) attend a private institution, while the remaining 121 (82.9%) are enrolled in public schools. The age group of 3 to 4 year olds has the highest likelihood of being enrolled in private schools, with 5 (71.4% in the age bracket) enrolled. Conversely, the age group of 15 to 17 year olds has the lowest likelihood of being enrolled in a private school, with 20 (100.0% in the age bracket) attending a public institution.
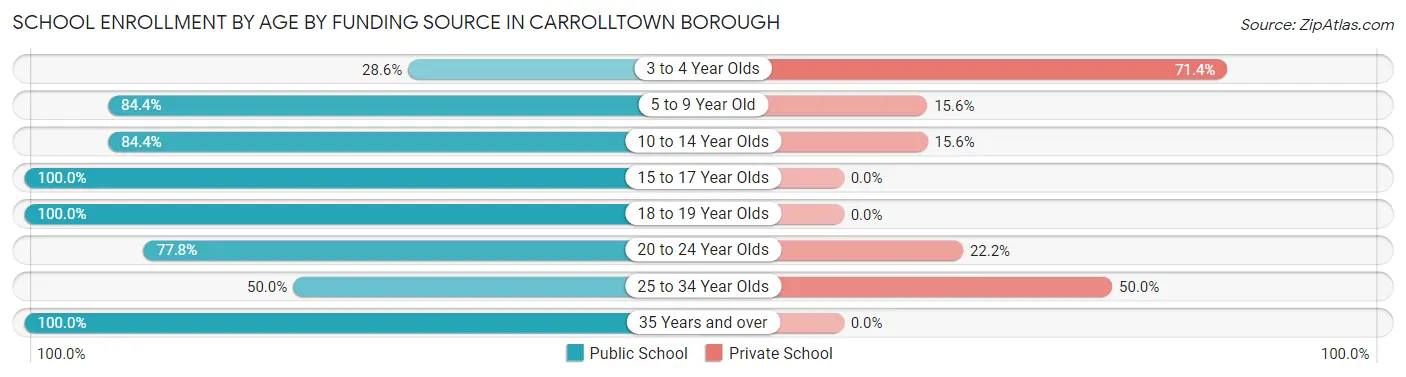
| Age Bracket | Public School | Private School |
| 3 to 4 Year Olds | 2 (28.6%) | 5 (71.4%) |
| 5 to 9 Year Old | 38 (84.4%) | 7 (15.6%) |
| 10 to 14 Year Olds | 27 (84.4%) | 5 (15.6%) |
| 15 to 17 Year Olds | 20 (100.0%) | 0 (0.0%) |
| 18 to 19 Year Olds | 5 (100.0%) | 0 (0.0%) |
| 20 to 24 Year Olds | 21 (77.8%) | 6 (22.2%) |
| 25 to 34 Year Olds | 2 (50.0%) | 2 (50.0%) |
| 35 Years and over | 6 (100.0%) | 0 (0.0%) |
| Total | 121 (82.9%) | 25 (17.1%) |
Educational Attainment by Field of Study in Carrolltown borough
Business (32 | 23.9%), science & technology (30 | 22.4%), education (23 | 17.2%), literature & languages (13 | 9.7%), and visual & performing arts (11 | 8.2%) are the most common fields of study among 134 individuals in Carrolltown borough who have obtained a bachelor's degree or higher.
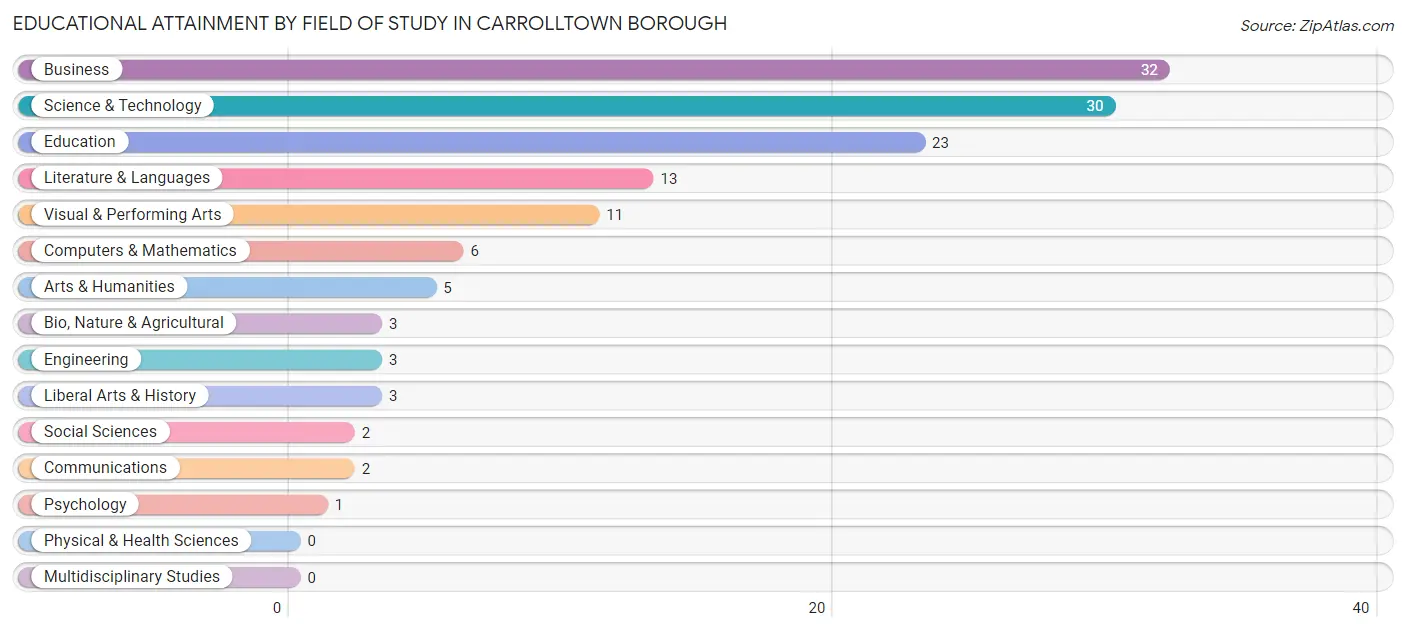
| Field of Study | # Graduates | % Graduates |
| Computers & Mathematics | 6 | 4.5% |
| Bio, Nature & Agricultural | 3 | 2.2% |
| Physical & Health Sciences | 0 | 0.0% |
| Psychology | 1 | 0.7% |
| Social Sciences | 2 | 1.5% |
| Engineering | 3 | 2.2% |
| Multidisciplinary Studies | 0 | 0.0% |
| Science & Technology | 30 | 22.4% |
| Business | 32 | 23.9% |
| Education | 23 | 17.2% |
| Literature & Languages | 13 | 9.7% |
| Liberal Arts & History | 3 | 2.2% |
| Visual & Performing Arts | 11 | 8.2% |
| Communications | 2 | 1.5% |
| Arts & Humanities | 5 | 3.7% |
| Total | 134 | 100.0% |
Transportation & Commute in Carrolltown borough
Vehicle Availability by Sex in Carrolltown borough
The most prevalent vehicle ownership categories in Carrolltown borough are males with 2 vehicles (79, accounting for 34.8%) and females with 2 vehicles (61, making up 48.2%).
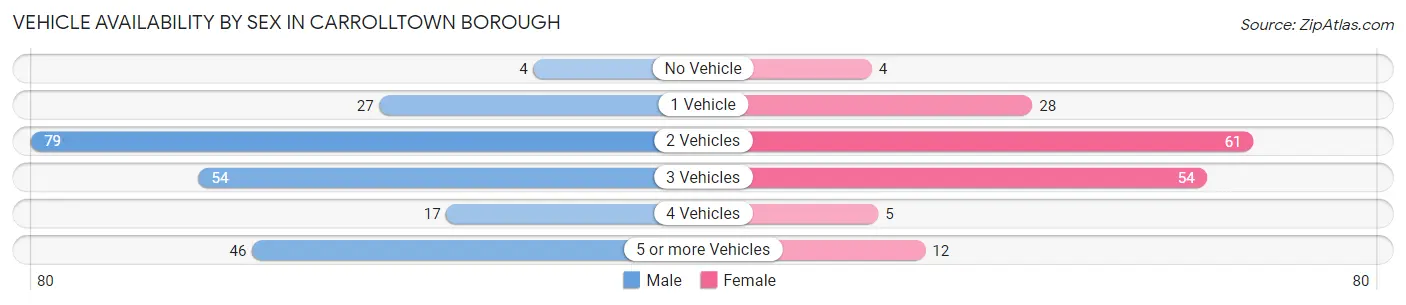
| Vehicles Available | Male | Female |
| No Vehicle | 4 (1.8%) | 4 (2.4%) |
| 1 Vehicle | 27 (11.9%) | 28 (17.1%) |
| 2 Vehicles | 79 (34.8%) | 61 (37.2%) |
| 3 Vehicles | 54 (23.8%) | 54 (32.9%) |
| 4 Vehicles | 17 (7.5%) | 5 (3.0%) |
| 5 or more Vehicles | 46 (20.3%) | 12 (7.3%) |
| Total | 227 (100.0%) | 164 (100.0%) |
Commute Time in Carrolltown borough
The most frequently occuring commute durations in Carrolltown borough are 15 to 19 minutes (63 commuters, 17.1%), 10 to 14 minutes (52 commuters, 14.1%), and 30 to 34 minutes (48 commuters, 13.0%).
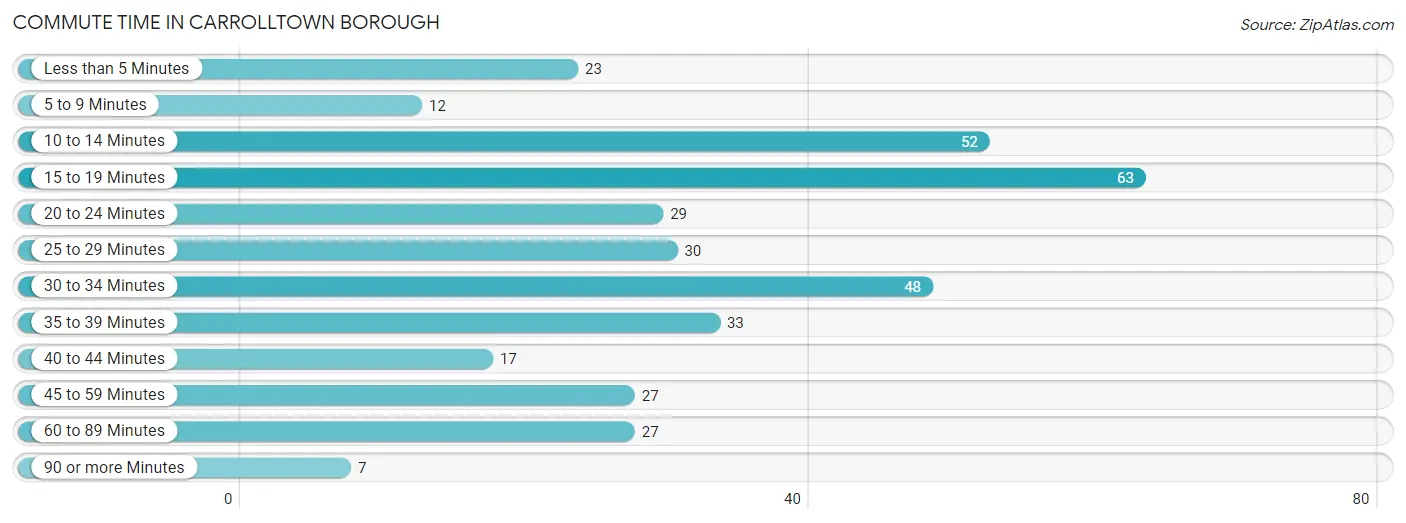
| Commute Time | # Commuters | % Commuters |
| Less than 5 Minutes | 23 | 6.2% |
| 5 to 9 Minutes | 12 | 3.3% |
| 10 to 14 Minutes | 52 | 14.1% |
| 15 to 19 Minutes | 63 | 17.1% |
| 20 to 24 Minutes | 29 | 7.9% |
| 25 to 29 Minutes | 30 | 8.2% |
| 30 to 34 Minutes | 48 | 13.0% |
| 35 to 39 Minutes | 33 | 9.0% |
| 40 to 44 Minutes | 17 | 4.6% |
| 45 to 59 Minutes | 27 | 7.3% |
| 60 to 89 Minutes | 27 | 7.3% |
| 90 or more Minutes | 7 | 1.9% |
Commute Time by Sex in Carrolltown borough
The most common commute times in Carrolltown borough are 15 to 19 minutes (40 commuters, 18.8%) for males and 30 to 34 minutes (31 commuters, 20.0%) for females.
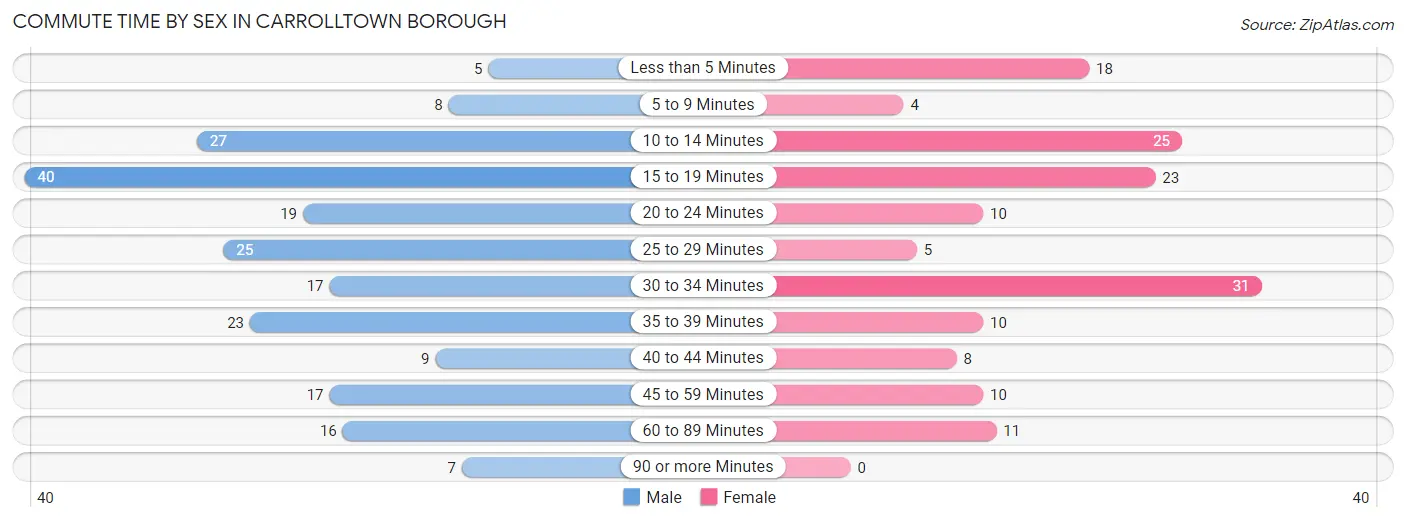
| Commute Time | Male | Female |
| Less than 5 Minutes | 5 (2.4%) | 18 (11.6%) |
| 5 to 9 Minutes | 8 (3.8%) | 4 (2.6%) |
| 10 to 14 Minutes | 27 (12.7%) | 25 (16.1%) |
| 15 to 19 Minutes | 40 (18.8%) | 23 (14.8%) |
| 20 to 24 Minutes | 19 (8.9%) | 10 (6.5%) |
| 25 to 29 Minutes | 25 (11.7%) | 5 (3.2%) |
| 30 to 34 Minutes | 17 (8.0%) | 31 (20.0%) |
| 35 to 39 Minutes | 23 (10.8%) | 10 (6.5%) |
| 40 to 44 Minutes | 9 (4.2%) | 8 (5.2%) |
| 45 to 59 Minutes | 17 (8.0%) | 10 (6.5%) |
| 60 to 89 Minutes | 16 (7.5%) | 11 (7.1%) |
| 90 or more Minutes | 7 (3.3%) | 0 (0.0%) |
Time of Departure to Work by Sex in Carrolltown borough
The most frequent times of departure to work in Carrolltown borough are 7:00 AM to 7:29 AM (54, 25.4%) for males and 6:00 AM to 6:29 AM (31, 20.0%) for females.
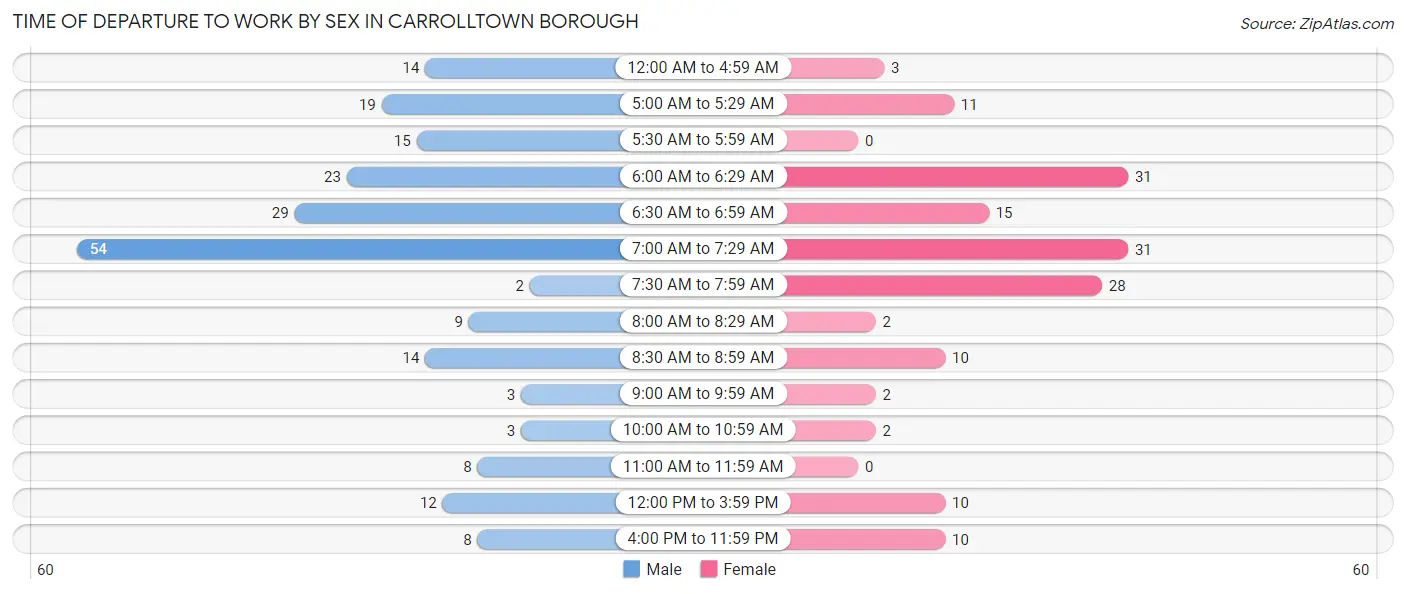
| Time of Departure | Male | Female |
| 12:00 AM to 4:59 AM | 14 (6.6%) | 3 (1.9%) |
| 5:00 AM to 5:29 AM | 19 (8.9%) | 11 (7.1%) |
| 5:30 AM to 5:59 AM | 15 (7.0%) | 0 (0.0%) |
| 6:00 AM to 6:29 AM | 23 (10.8%) | 31 (20.0%) |
| 6:30 AM to 6:59 AM | 29 (13.6%) | 15 (9.7%) |
| 7:00 AM to 7:29 AM | 54 (25.4%) | 31 (20.0%) |
| 7:30 AM to 7:59 AM | 2 (0.9%) | 28 (18.1%) |
| 8:00 AM to 8:29 AM | 9 (4.2%) | 2 (1.3%) |
| 8:30 AM to 8:59 AM | 14 (6.6%) | 10 (6.5%) |
| 9:00 AM to 9:59 AM | 3 (1.4%) | 2 (1.3%) |
| 10:00 AM to 10:59 AM | 3 (1.4%) | 2 (1.3%) |
| 11:00 AM to 11:59 AM | 8 (3.8%) | 0 (0.0%) |
| 12:00 PM to 3:59 PM | 12 (5.6%) | 10 (6.5%) |
| 4:00 PM to 11:59 PM | 8 (3.8%) | 10 (6.5%) |
| Total | 213 (100.0%) | 155 (100.0%) |
Housing Occupancy in Carrolltown borough
Occupancy by Ownership in Carrolltown borough
Of the total 366 dwellings in Carrolltown borough, owner-occupied units account for 326 (89.1%), while renter-occupied units make up 40 (10.9%).
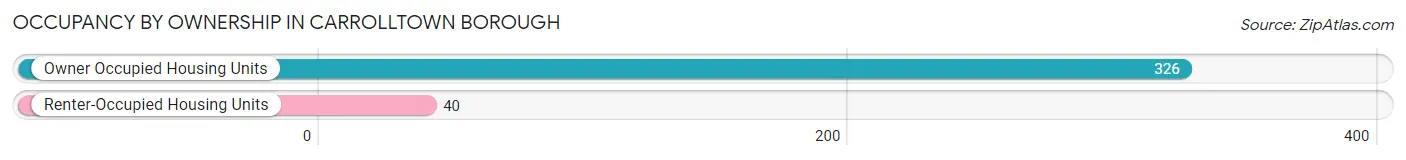
| Occupancy | # Housing Units | % Housing Units |
| Owner Occupied Housing Units | 326 | 89.1% |
| Renter-Occupied Housing Units | 40 | 10.9% |
| Total Occupied Housing Units | 366 | 100.0% |
Occupancy by Household Size in Carrolltown borough
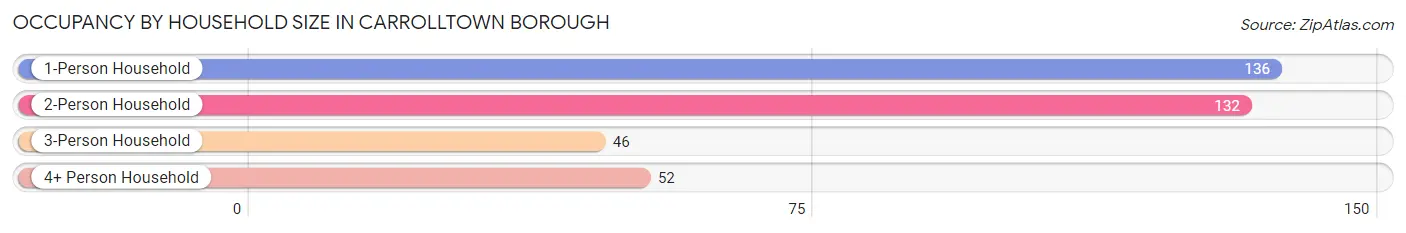
| Household Size | # Housing Units | % Housing Units |
| 1-Person Household | 136 | 37.2% |
| 2-Person Household | 132 | 36.1% |
| 3-Person Household | 46 | 12.6% |
| 4+ Person Household | 52 | 14.2% |
| Total Housing Units | 366 | 100.0% |
Occupancy by Ownership by Household Size in Carrolltown borough
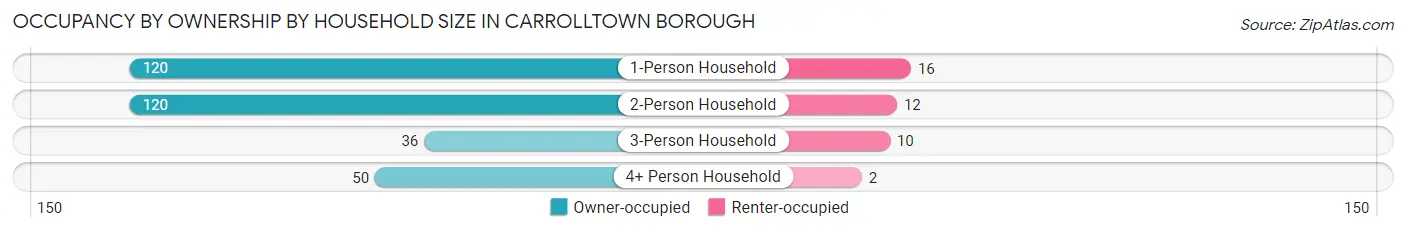
| Household Size | Owner-occupied | Renter-occupied |
| 1-Person Household | 120 (88.2%) | 16 (11.8%) |
| 2-Person Household | 120 (90.9%) | 12 (9.1%) |
| 3-Person Household | 36 (78.3%) | 10 (21.7%) |
| 4+ Person Household | 50 (96.2%) | 2 (3.8%) |
| Total Housing Units | 326 (89.1%) | 40 (10.9%) |
Occupancy by Educational Attainment in Carrolltown borough
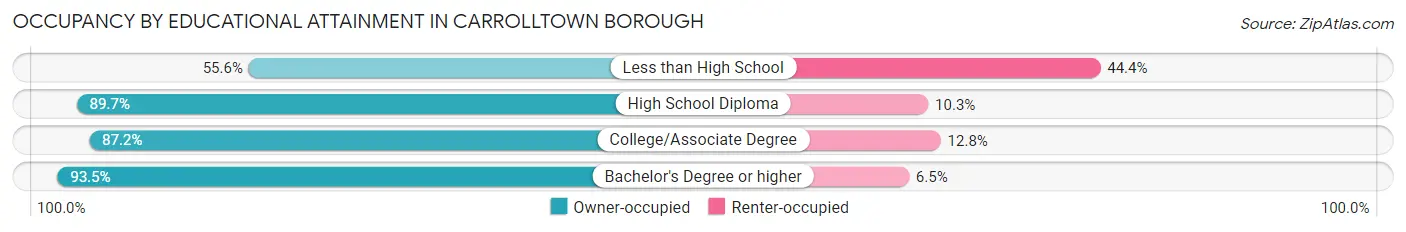
| Household Size | Owner-occupied | Renter-occupied |
| Less than High School | 5 (55.6%) | 4 (44.4%) |
| High School Diploma | 174 (89.7%) | 20 (10.3%) |
| College/Associate Degree | 75 (87.2%) | 11 (12.8%) |
| Bachelor's Degree or higher | 72 (93.5%) | 5 (6.5%) |
Occupancy by Age of Householder in Carrolltown borough
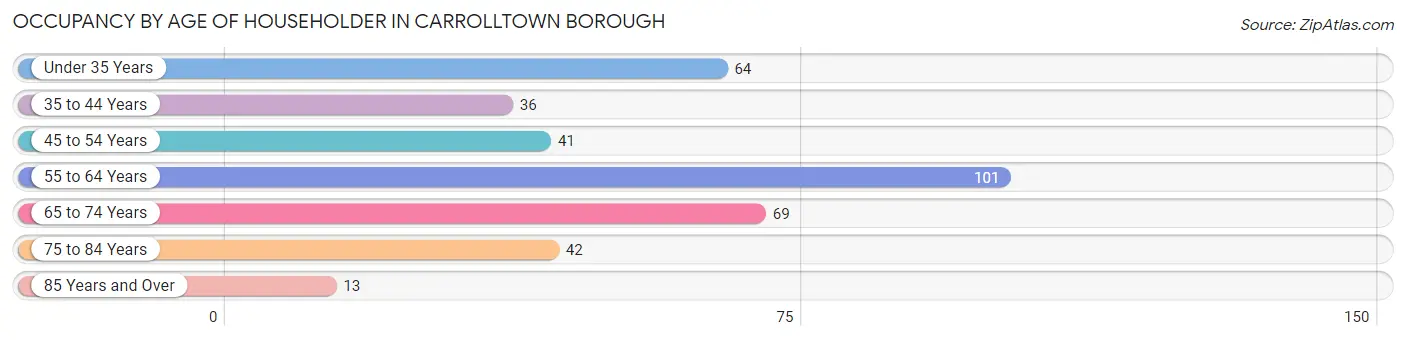
| Age Bracket | # Households | % Households |
| Under 35 Years | 64 | 17.5% |
| 35 to 44 Years | 36 | 9.8% |
| 45 to 54 Years | 41 | 11.2% |
| 55 to 64 Years | 101 | 27.6% |
| 65 to 74 Years | 69 | 18.9% |
| 75 to 84 Years | 42 | 11.5% |
| 85 Years and Over | 13 | 3.5% |
| Total | 366 | 100.0% |
Housing Finances in Carrolltown borough
Median Income by Occupancy in Carrolltown borough
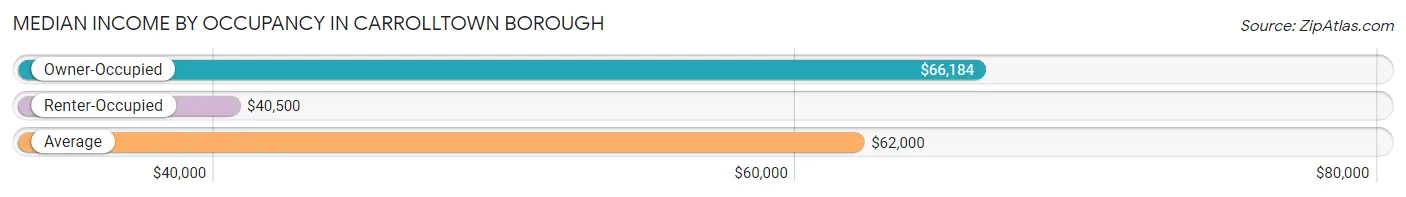
| Occupancy Type | # Households | Median Income |
| Owner-Occupied | 326 (89.1%) | $66,184 |
| Renter-Occupied | 40 (10.9%) | $40,500 |
| Average | 366 (100.0%) | $62,000 |
Occupancy by Householder Income Bracket in Carrolltown borough
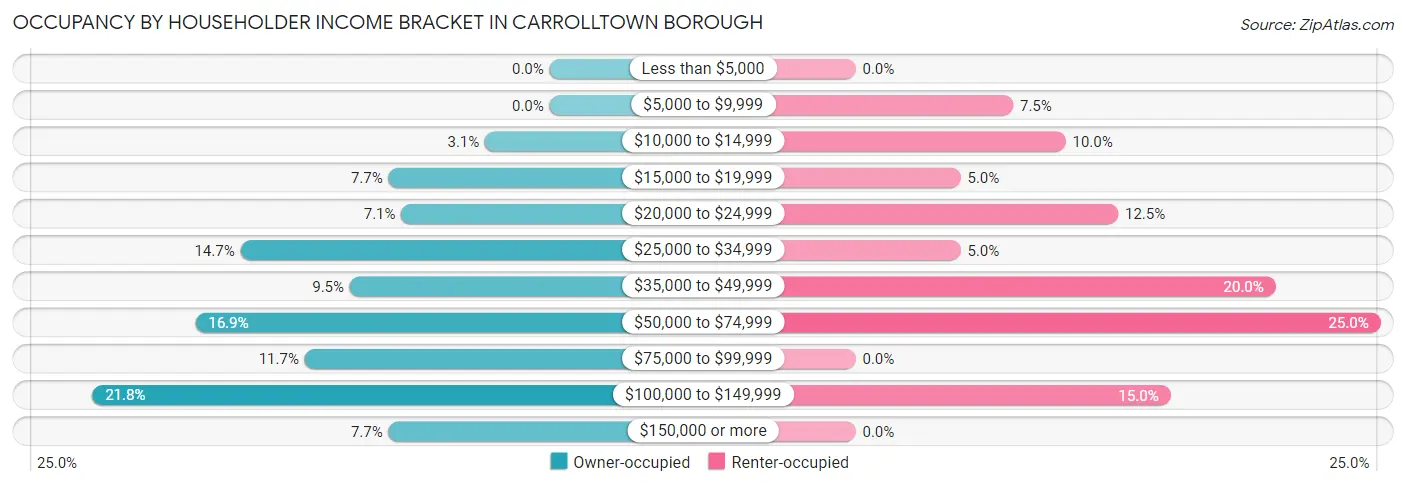
| Income Bracket | Owner-occupied | Renter-occupied |
| Less than $5,000 | 0 (0.0%) | 0 (0.0%) |
| $5,000 to $9,999 | 0 (0.0%) | 3 (7.5%) |
| $10,000 to $14,999 | 10 (3.1%) | 4 (10.0%) |
| $15,000 to $19,999 | 25 (7.7%) | 2 (5.0%) |
| $20,000 to $24,999 | 23 (7.1%) | 5 (12.5%) |
| $25,000 to $34,999 | 48 (14.7%) | 2 (5.0%) |
| $35,000 to $49,999 | 31 (9.5%) | 8 (20.0%) |
| $50,000 to $74,999 | 55 (16.9%) | 10 (25.0%) |
| $75,000 to $99,999 | 38 (11.7%) | 0 (0.0%) |
| $100,000 to $149,999 | 71 (21.8%) | 6 (15.0%) |
| $150,000 or more | 25 (7.7%) | 0 (0.0%) |
| Total | 326 (100.0%) | 40 (100.0%) |
Monthly Housing Cost Tiers in Carrolltown borough
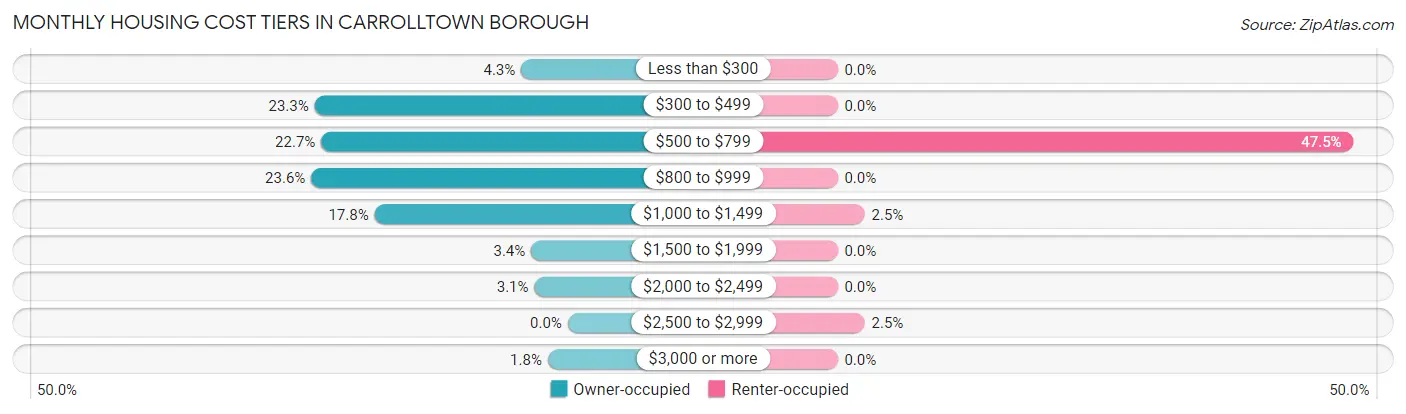
| Monthly Cost | Owner-occupied | Renter-occupied |
| Less than $300 | 14 (4.3%) | 0 (0.0%) |
| $300 to $499 | 76 (23.3%) | 0 (0.0%) |
| $500 to $799 | 74 (22.7%) | 19 (47.5%) |
| $800 to $999 | 77 (23.6%) | 0 (0.0%) |
| $1,000 to $1,499 | 58 (17.8%) | 1 (2.5%) |
| $1,500 to $1,999 | 11 (3.4%) | 0 (0.0%) |
| $2,000 to $2,499 | 10 (3.1%) | 0 (0.0%) |
| $2,500 to $2,999 | 0 (0.0%) | 1 (2.5%) |
| $3,000 or more | 6 (1.8%) | 0 (0.0%) |
| Total | 326 (100.0%) | 40 (100.0%) |
Physical Housing Characteristics in Carrolltown borough
Housing Structures in Carrolltown borough
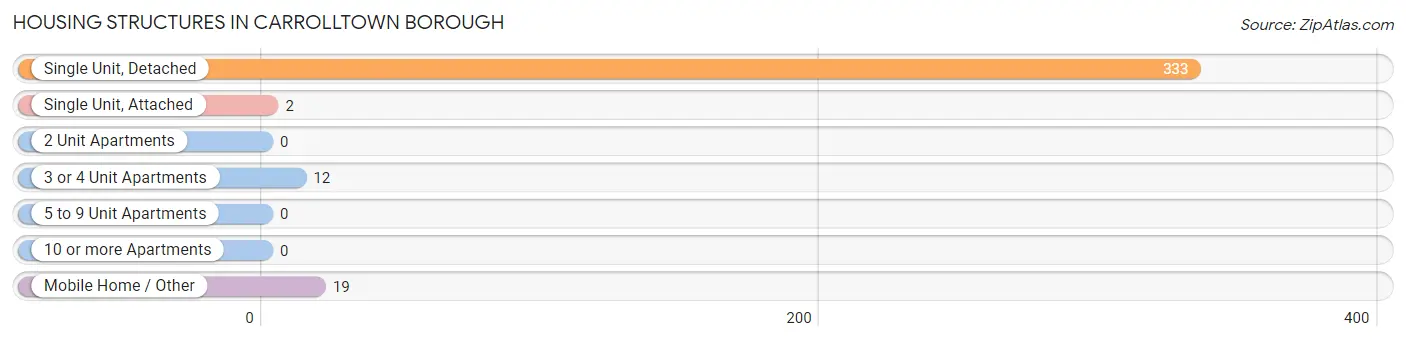
| Structure Type | # Housing Units | % Housing Units |
| Single Unit, Detached | 333 | 91.0% |
| Single Unit, Attached | 2 | 0.5% |
| 2 Unit Apartments | 0 | 0.0% |
| 3 or 4 Unit Apartments | 12 | 3.3% |
| 5 to 9 Unit Apartments | 0 | 0.0% |
| 10 or more Apartments | 0 | 0.0% |
| Mobile Home / Other | 19 | 5.2% |
| Total | 366 | 100.0% |
Housing Structures by Occupancy in Carrolltown borough
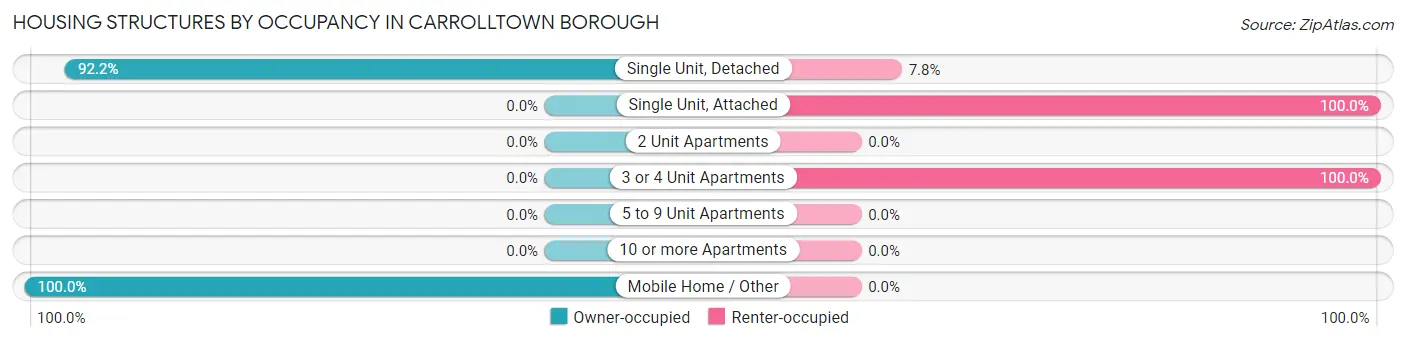
| Structure Type | Owner-occupied | Renter-occupied |
| Single Unit, Detached | 307 (92.2%) | 26 (7.8%) |
| Single Unit, Attached | 0 (0.0%) | 2 (100.0%) |
| 2 Unit Apartments | 0 (0.0%) | 0 (0.0%) |
| 3 or 4 Unit Apartments | 0 (0.0%) | 12 (100.0%) |
| 5 to 9 Unit Apartments | 0 (0.0%) | 0 (0.0%) |
| 10 or more Apartments | 0 (0.0%) | 0 (0.0%) |
| Mobile Home / Other | 19 (100.0%) | 0 (0.0%) |
| Total | 326 (89.1%) | 40 (10.9%) |
Housing Structures by Number of Rooms in Carrolltown borough
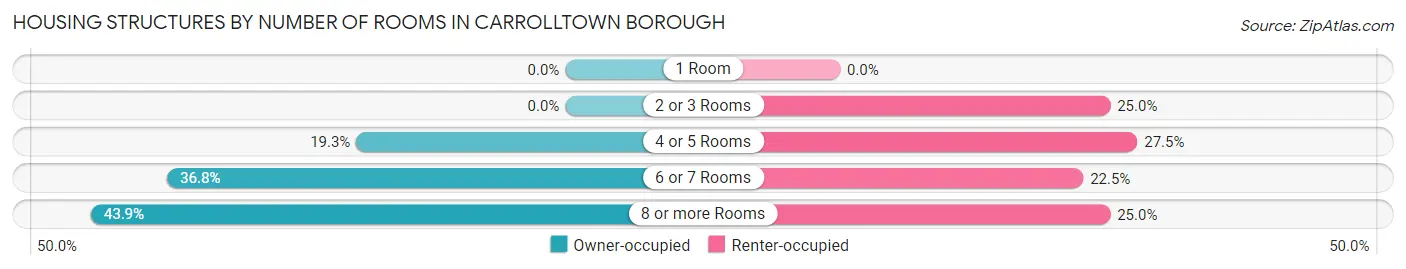
| Number of Rooms | Owner-occupied | Renter-occupied |
| 1 Room | 0 (0.0%) | 0 (0.0%) |
| 2 or 3 Rooms | 0 (0.0%) | 10 (25.0%) |
| 4 or 5 Rooms | 63 (19.3%) | 11 (27.5%) |
| 6 or 7 Rooms | 120 (36.8%) | 9 (22.5%) |
| 8 or more Rooms | 143 (43.9%) | 10 (25.0%) |
| Total | 326 (100.0%) | 40 (100.0%) |
Housing Structure by Heating Type in Carrolltown borough
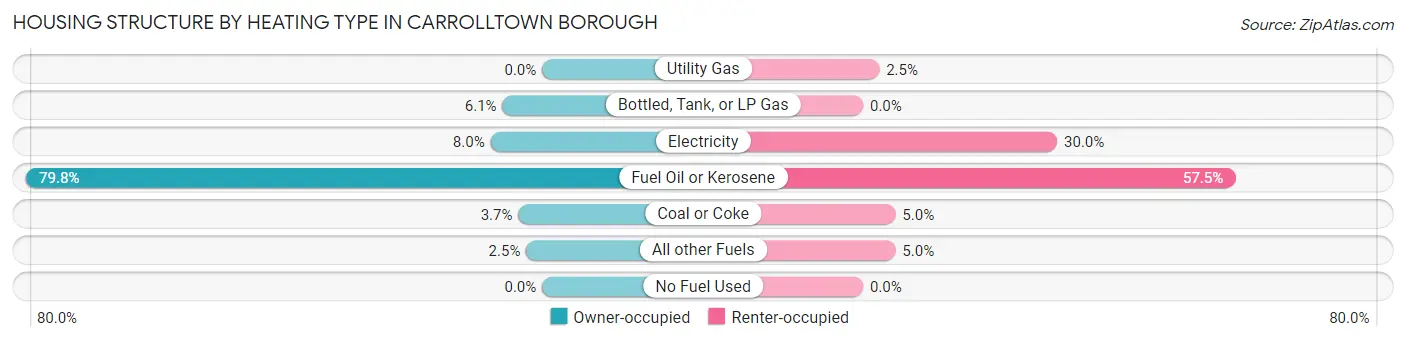
| Heating Type | Owner-occupied | Renter-occupied |
| Utility Gas | 0 (0.0%) | 1 (2.5%) |
| Bottled, Tank, or LP Gas | 20 (6.1%) | 0 (0.0%) |
| Electricity | 26 (8.0%) | 12 (30.0%) |
| Fuel Oil or Kerosene | 260 (79.7%) | 23 (57.5%) |
| Coal or Coke | 12 (3.7%) | 2 (5.0%) |
| All other Fuels | 8 (2.5%) | 2 (5.0%) |
| No Fuel Used | 0 (0.0%) | 0 (0.0%) |
| Total | 326 (100.0%) | 40 (100.0%) |
Household Vehicle Usage in Carrolltown borough
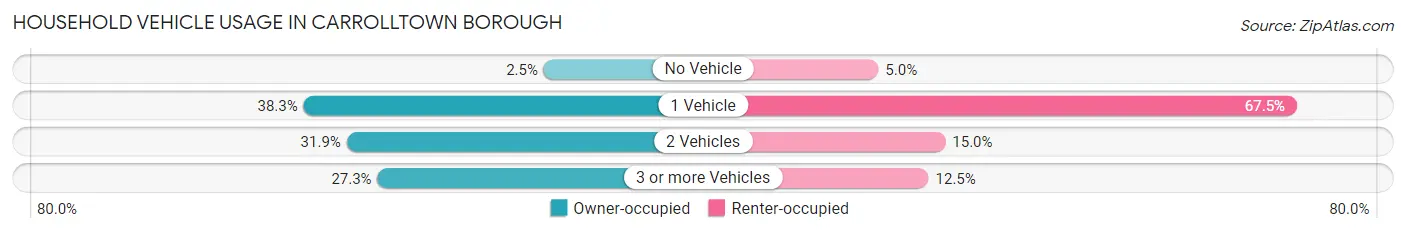
| Vehicles per Household | Owner-occupied | Renter-occupied |
| No Vehicle | 8 (2.5%) | 2 (5.0%) |
| 1 Vehicle | 125 (38.3%) | 27 (67.5%) |
| 2 Vehicles | 104 (31.9%) | 6 (15.0%) |
| 3 or more Vehicles | 89 (27.3%) | 5 (12.5%) |
| Total | 326 (100.0%) | 40 (100.0%) |
Real Estate & Mortgages in Carrolltown borough
Real Estate and Mortgage Overview in Carrolltown borough
| Characteristic | Without Mortgage | With Mortgage |
| Housing Units | 150 | 176 |
| Median Property Value | $107,400 | $112,700 |
| Median Household Income | $39,545 | $21 |
| Monthly Housing Costs | $458 | $6 |
| Real Estate Taxes | $1,250 | $0 |
Property Value by Mortgage Status in Carrolltown borough
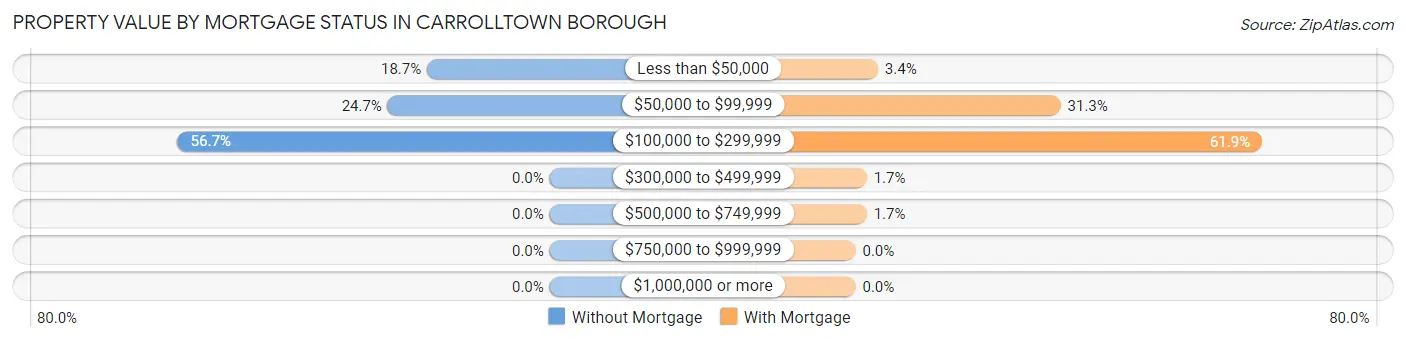
| Property Value | Without Mortgage | With Mortgage |
| Less than $50,000 | 28 (18.7%) | 6 (3.4%) |
| $50,000 to $99,999 | 37 (24.7%) | 55 (31.2%) |
| $100,000 to $299,999 | 85 (56.7%) | 109 (61.9%) |
| $300,000 to $499,999 | 0 (0.0%) | 3 (1.7%) |
| $500,000 to $749,999 | 0 (0.0%) | 3 (1.7%) |
| $750,000 to $999,999 | 0 (0.0%) | 0 (0.0%) |
| $1,000,000 or more | 0 (0.0%) | 0 (0.0%) |
| Total | 150 (100.0%) | 176 (100.0%) |
Household Income by Mortgage Status in Carrolltown borough
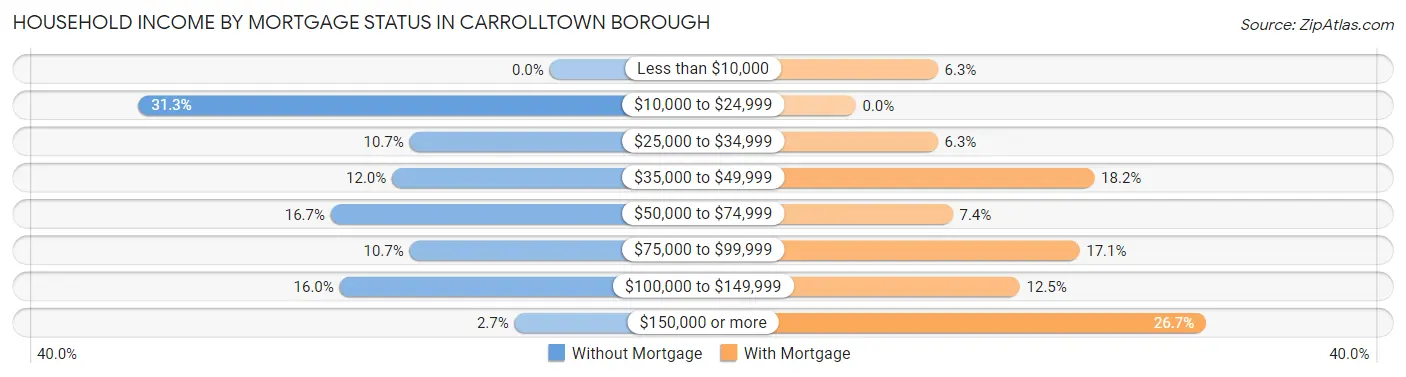
| Household Income | Without Mortgage | With Mortgage |
| Less than $10,000 | 0 (0.0%) | 11 (6.2%) |
| $10,000 to $24,999 | 47 (31.3%) | 0 (0.0%) |
| $25,000 to $34,999 | 16 (10.7%) | 11 (6.2%) |
| $35,000 to $49,999 | 18 (12.0%) | 32 (18.2%) |
| $50,000 to $74,999 | 25 (16.7%) | 13 (7.4%) |
| $75,000 to $99,999 | 16 (10.7%) | 30 (17.1%) |
| $100,000 to $149,999 | 24 (16.0%) | 22 (12.5%) |
| $150,000 or more | 4 (2.7%) | 47 (26.7%) |
| Total | 150 (100.0%) | 176 (100.0%) |
Property Value to Household Income Ratio in Carrolltown borough
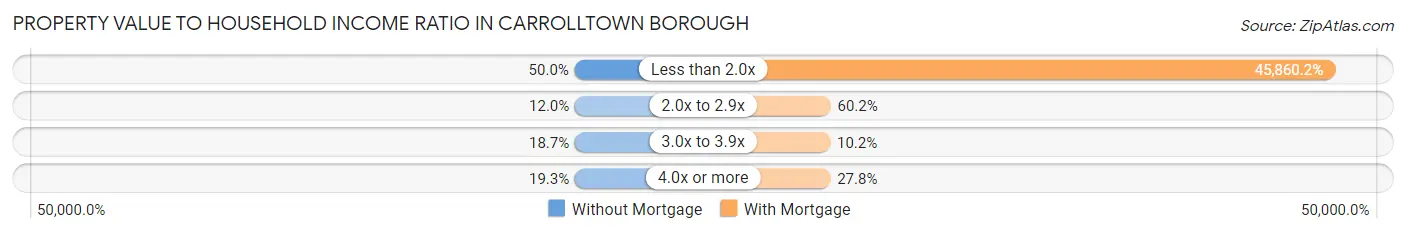
| Value-to-Income Ratio | Without Mortgage | With Mortgage |
| Less than 2.0x | 75 (50.0%) | 80,714 (45,860.2%) |
| 2.0x to 2.9x | 18 (12.0%) | 106 (60.2%) |
| 3.0x to 3.9x | 28 (18.7%) | 18 (10.2%) |
| 4.0x or more | 29 (19.3%) | 49 (27.8%) |
| Total | 150 (100.0%) | 176 (100.0%) |
Real Estate Taxes by Mortgage Status in Carrolltown borough
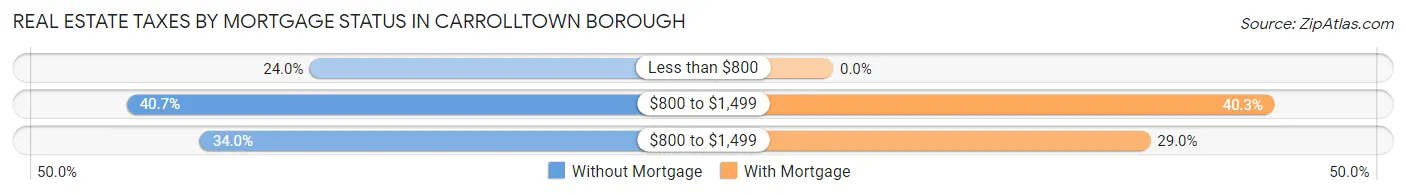
| Property Taxes | Without Mortgage | With Mortgage |
| Less than $800 | 36 (24.0%) | 0 (0.0%) |
| $800 to $1,499 | 61 (40.7%) | 71 (40.3%) |
| $800 to $1,499 | 51 (34.0%) | 51 (29.0%) |
| Total | 150 (100.0%) | 176 (100.0%) |
Health & Disability in Carrolltown borough
Health Insurance Coverage by Age in Carrolltown borough
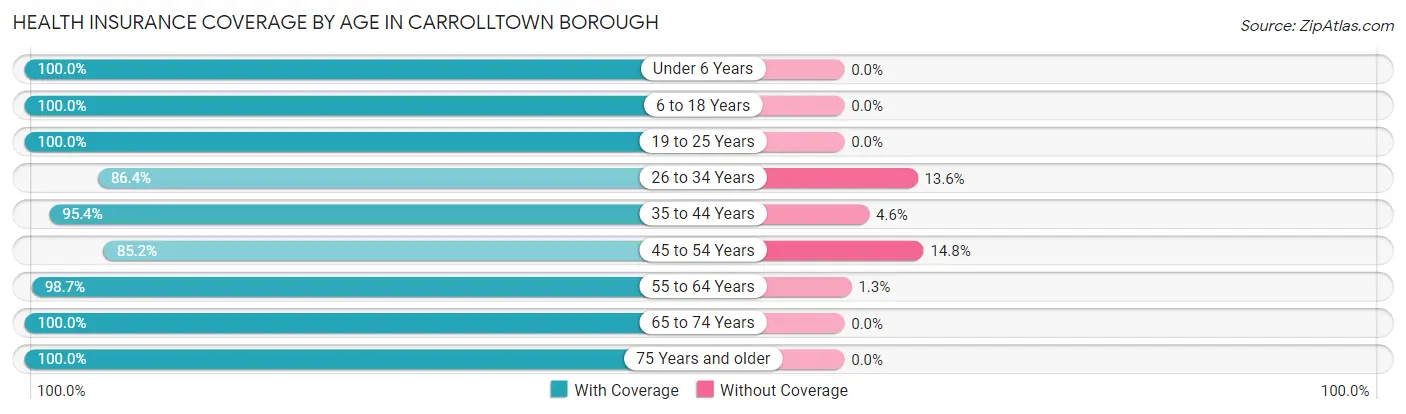
| Age Bracket | With Coverage | Without Coverage |
| Under 6 Years | 24 (100.0%) | 0 (0.0%) |
| 6 to 18 Years | 98 (100.0%) | 0 (0.0%) |
| 19 to 25 Years | 114 (100.0%) | 0 (0.0%) |
| 26 to 34 Years | 76 (86.4%) | 12 (13.6%) |
| 35 to 44 Years | 62 (95.4%) | 3 (4.6%) |
| 45 to 54 Years | 75 (85.2%) | 13 (14.8%) |
| 55 to 64 Years | 148 (98.7%) | 2 (1.3%) |
| 65 to 74 Years | 102 (100.0%) | 0 (0.0%) |
| 75 Years and older | 71 (100.0%) | 0 (0.0%) |
| Total | 770 (96.3%) | 30 (3.7%) |
Health Insurance Coverage by Citizenship Status in Carrolltown borough
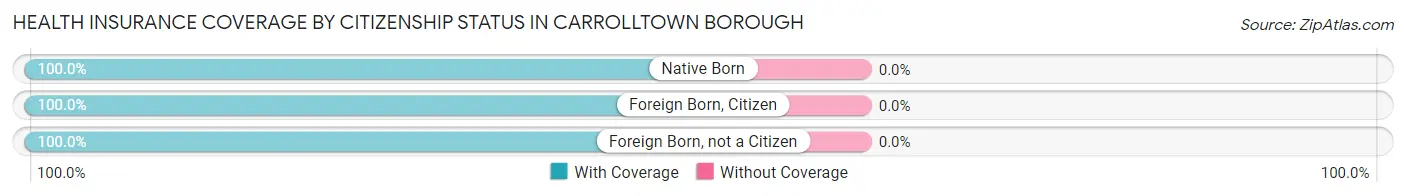
| Citizenship Status | With Coverage | Without Coverage |
| Native Born | 24 (100.0%) | 0 (0.0%) |
| Foreign Born, Citizen | 98 (100.0%) | 0 (0.0%) |
| Foreign Born, not a Citizen | 114 (100.0%) | 0 (0.0%) |
Health Insurance Coverage by Household Income in Carrolltown borough
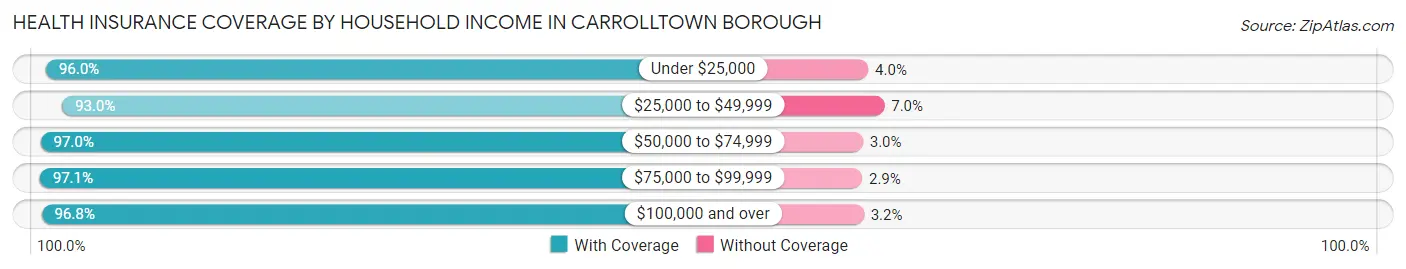
| Household Income | With Coverage | Without Coverage |
| Under $25,000 | 96 (96.0%) | 4 (4.0%) |
| $25,000 to $49,999 | 106 (93.0%) | 8 (7.0%) |
| $50,000 to $74,999 | 130 (97.0%) | 4 (3.0%) |
| $75,000 to $99,999 | 102 (97.1%) | 3 (2.9%) |
| $100,000 and over | 336 (96.8%) | 11 (3.2%) |
Public vs Private Health Insurance Coverage by Age in Carrolltown borough
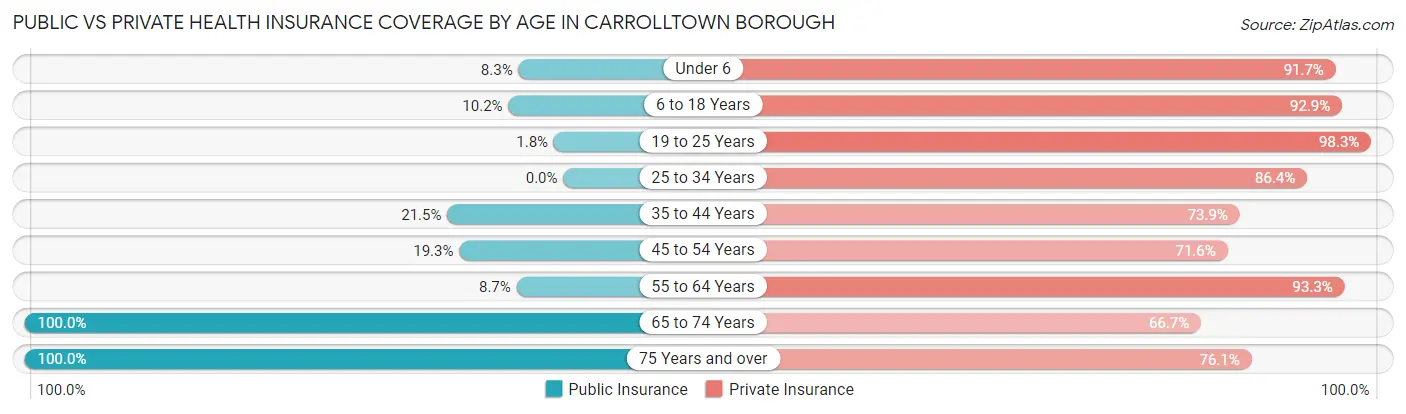
| Age Bracket | Public Insurance | Private Insurance |
| Under 6 | 2 (8.3%) | 22 (91.7%) |
| 6 to 18 Years | 10 (10.2%) | 91 (92.9%) |
| 19 to 25 Years | 2 (1.8%) | 112 (98.3%) |
| 25 to 34 Years | 0 (0.0%) | 76 (86.4%) |
| 35 to 44 Years | 14 (21.5%) | 48 (73.9%) |
| 45 to 54 Years | 17 (19.3%) | 63 (71.6%) |
| 55 to 64 Years | 13 (8.7%) | 140 (93.3%) |
| 65 to 74 Years | 102 (100.0%) | 68 (66.7%) |
| 75 Years and over | 71 (100.0%) | 54 (76.1%) |
| Total | 231 (28.9%) | 674 (84.3%) |
Disability Status by Sex by Age in Carrolltown borough
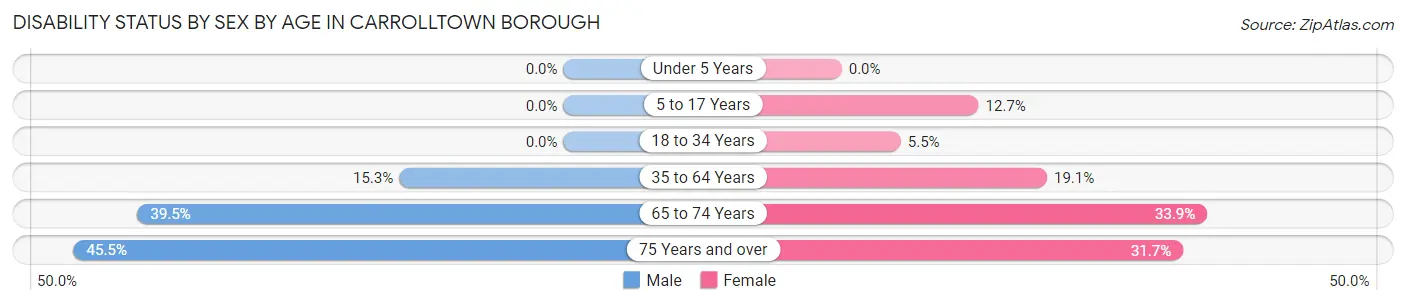
| Age Bracket | Male | Female |
| Under 5 Years | 0 (0.0%) | 0 (0.0%) |
| 5 to 17 Years | 0 (0.0%) | 8 (12.7%) |
| 18 to 34 Years | 0 (0.0%) | 4 (5.5%) |
| 35 to 64 Years | 27 (15.2%) | 24 (19.1%) |
| 65 to 74 Years | 17 (39.5%) | 20 (33.9%) |
| 75 Years and over | 5 (45.5%) | 19 (31.7%) |
Disability Class by Sex by Age in Carrolltown borough
Disability Class: Hearing Difficulty
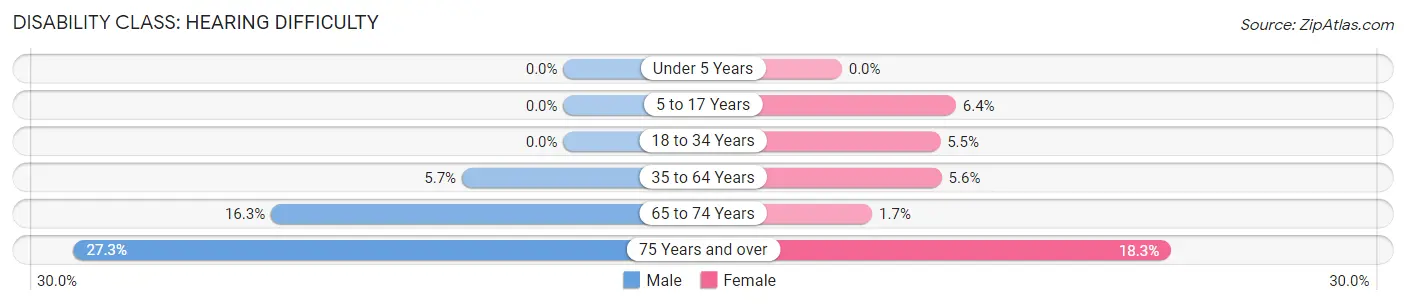
| Age Bracket | Male | Female |
| Under 5 Years | 0 (0.0%) | 0 (0.0%) |
| 5 to 17 Years | 0 (0.0%) | 4 (6.4%) |
| 18 to 34 Years | 0 (0.0%) | 4 (5.5%) |
| 35 to 64 Years | 10 (5.7%) | 7 (5.6%) |
| 65 to 74 Years | 7 (16.3%) | 1 (1.7%) |
| 75 Years and over | 3 (27.3%) | 11 (18.3%) |
Disability Class: Vision Difficulty
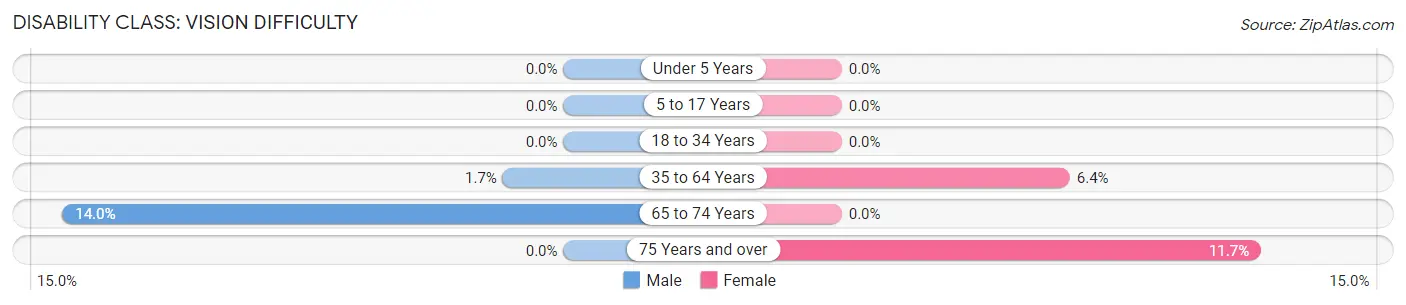
| Age Bracket | Male | Female |
| Under 5 Years | 0 (0.0%) | 0 (0.0%) |
| 5 to 17 Years | 0 (0.0%) | 0 (0.0%) |
| 18 to 34 Years | 0 (0.0%) | 0 (0.0%) |
| 35 to 64 Years | 3 (1.7%) | 8 (6.4%) |
| 65 to 74 Years | 6 (14.0%) | 0 (0.0%) |
| 75 Years and over | 0 (0.0%) | 7 (11.7%) |
Disability Class: Cognitive Difficulty
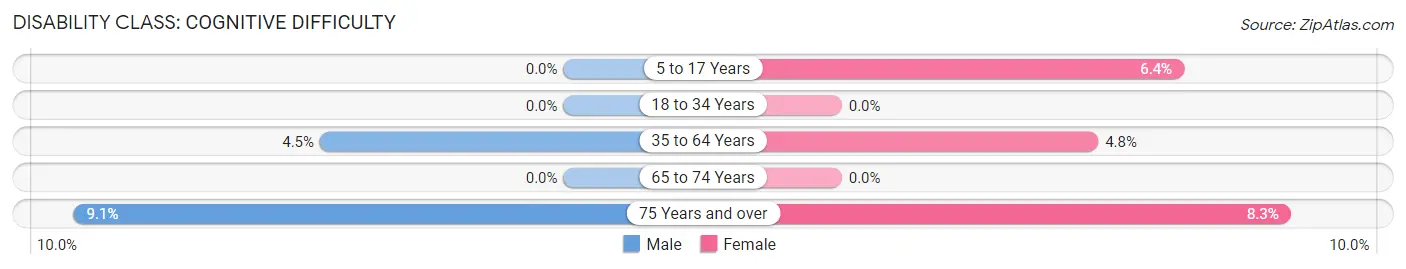
| Age Bracket | Male | Female |
| 5 to 17 Years | 0 (0.0%) | 4 (6.4%) |
| 18 to 34 Years | 0 (0.0%) | 0 (0.0%) |
| 35 to 64 Years | 8 (4.5%) | 6 (4.8%) |
| 65 to 74 Years | 0 (0.0%) | 0 (0.0%) |
| 75 Years and over | 1 (9.1%) | 5 (8.3%) |
Disability Class: Ambulatory Difficulty
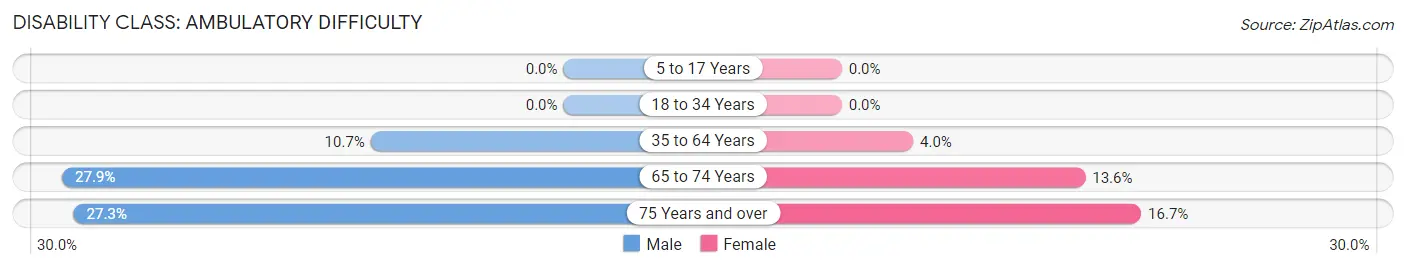
| Age Bracket | Male | Female |
| 5 to 17 Years | 0 (0.0%) | 0 (0.0%) |
| 18 to 34 Years | 0 (0.0%) | 0 (0.0%) |
| 35 to 64 Years | 19 (10.7%) | 5 (4.0%) |
| 65 to 74 Years | 12 (27.9%) | 8 (13.6%) |
| 75 Years and over | 3 (27.3%) | 10 (16.7%) |
Disability Class: Self-Care Difficulty
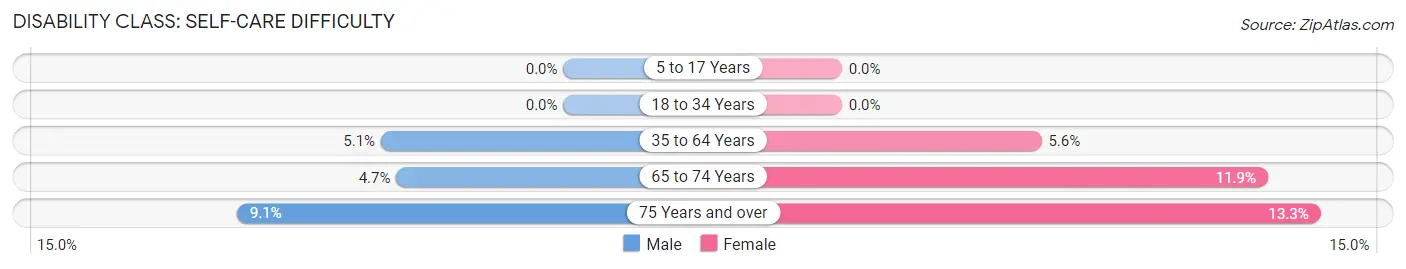
| Age Bracket | Male | Female |
| 5 to 17 Years | 0 (0.0%) | 0 (0.0%) |
| 18 to 34 Years | 0 (0.0%) | 0 (0.0%) |
| 35 to 64 Years | 9 (5.1%) | 7 (5.6%) |
| 65 to 74 Years | 2 (4.6%) | 7 (11.9%) |
| 75 Years and over | 1 (9.1%) | 8 (13.3%) |
Technology Access in Carrolltown borough
Computing Device Access in Carrolltown borough
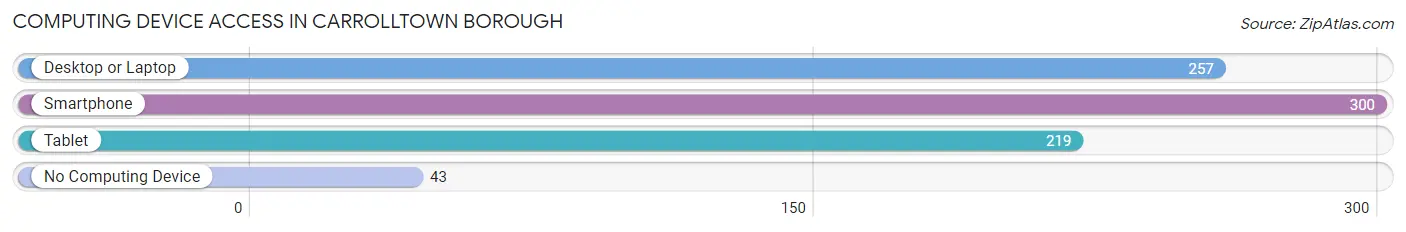
| Device Type | # Households | % Households |
| Desktop or Laptop | 257 | 70.2% |
| Smartphone | 300 | 82.0% |
| Tablet | 219 | 59.8% |
| No Computing Device | 43 | 11.7% |
| Total | 366 | 100.0% |
Internet Access in Carrolltown borough
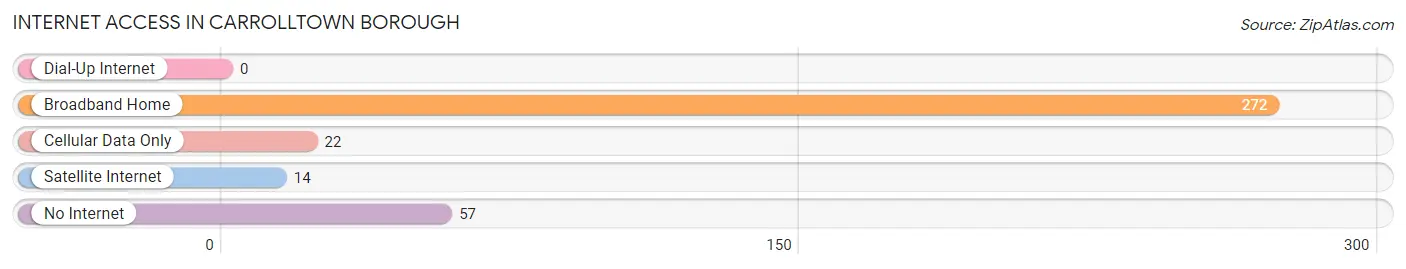
| Internet Type | # Households | % Households |
| Dial-Up Internet | 0 | 0.0% |
| Broadband Home | 272 | 74.3% |
| Cellular Data Only | 22 | 6.0% |
| Satellite Internet | 14 | 3.8% |
| No Internet | 57 | 15.6% |
| Total | 366 | 100.0% |
Carrolltown borough Summary
Carrolltown Borough is a small borough located in Cambria County, Pennsylvania. It is situated in the foothills of the Allegheny Mountains, approximately 30 miles east of Johnstown. The borough was founded in 1876 and is home to a population of approximately 1,000 people.
History
Carrolltown Borough was founded in 1876 by a group of settlers from the nearby town of Carrolltown. The settlers were looking for a place to call home and found the area to be ideal for their needs. The town was named after the original settlers, who were of Irish descent. The town was officially incorporated in 1877 and has remained a small, rural community ever since.
The town was originally a farming community, with many of the original settlers being farmers. The town was also home to a number of small businesses, including a general store, a blacksmith, and a sawmill. The town also had a post office, which was established in 1877.
In the early 1900s, the town began to experience a period of growth. The population increased from around 500 in 1900 to over 1,000 by the mid-1920s. This growth was largely due to the influx of immigrants from Europe, particularly from Italy and Poland. The immigrants brought with them a variety of skills and trades, which helped to diversify the town’s economy.
The town experienced a period of decline in the mid-20th century, as many of the town’s businesses closed and the population began to decline. However, the town has experienced a resurgence in recent years, with the population increasing to over 1,000 in 2020.
Geography
Carrolltown Borough is located in the foothills of the Allegheny Mountains in Cambria County, Pennsylvania. The borough is situated approximately 30 miles east of Johnstown and is bordered by the towns of Carrolltown, Ebensburg, and Portage. The borough is located in a rural area and is surrounded by rolling hills and farmland.
The borough is home to a number of small creeks and streams, including the Little Conemaugh River, which flows through the town. The borough is also home to a number of parks and recreational areas, including the Carrolltown Borough Park and the Carrolltown Borough Recreation Area.
Economy
The economy of Carrolltown Borough is largely based on agriculture and tourism. The town is home to a number of small farms, which produce a variety of crops, including corn, soybeans, and hay. The town is also home to a number of small businesses, including restaurants, retail stores, and service providers.
The town is also home to a number of tourist attractions, including the Carrolltown Borough Park and the Carrolltown Borough Recreation Area. The town is also home to a number of historic sites, including the Carrolltown Borough Historic District, which is listed on the National Register of Historic Places.
Demographics
As of the 2020 census, the population of Carrolltown Borough was 1,000. The racial makeup of the borough was 97.2% White, 0.7% African American, 0.3% Native American, 0.3% Asian, and 1.5% from two or more races. The median household income was $41,250 and the median home value was $90,000.
The town is home to a number of churches, including the First United Methodist Church, the St. Mary’s Catholic Church, and the Carrolltown Presbyterian Church. The town is also home to a number of schools, including the Carrolltown Elementary School and the Carrolltown High School.
Conclusion
Carrolltown Borough is a small borough located in Cambria County, Pennsylvania. The town was founded in 1876 and is home to a population of approximately 1,000 people. The town is largely based on agriculture and tourism and is home to a number of small businesses, churches, and schools. The town is also home to a number of historic sites and recreational areas, making it an ideal place to live and visit.
Common Questions
What is Per Capita Income in Carrolltown borough?
Per Capita income in Carrolltown borough is $34,479.
What is the Median Family Income in Carrolltown borough?
Median Family Income in Carrolltown borough is $93,125.
What is the Median Household income in Carrolltown borough?
Median Household Income in Carrolltown borough is $62,000.
What is Income or Wage Gap in Carrolltown borough?
Income or Wage Gap in Carrolltown borough is 5.4%.
Women in Carrolltown borough earn 94.6 cents for every dollar earned by a man.
What is Inequality or Gini Index in Carrolltown borough?
Inequality or Gini Index in Carrolltown borough is 0.39.
What is the Total Population of Carrolltown borough?
Total Population of Carrolltown borough is 822.
What is the Total Male Population of Carrolltown borough?
Total Male Population of Carrolltown borough is 421.
What is the Total Female Population of Carrolltown borough?
Total Female Population of Carrolltown borough is 401.
What is the Ratio of Males per 100 Females in Carrolltown borough?
There are 104.99 Males per 100 Females in Carrolltown borough.
What is the Ratio of Females per 100 Males in Carrolltown borough?
There are 95.25 Females per 100 Males in Carrolltown borough.
What is the Median Population Age in Carrolltown borough?
Median Population Age in Carrolltown borough is 47.3 Years.
What is the Average Family Size in Carrolltown borough
Average Family Size in Carrolltown borough is 3.0 People.
What is the Average Household Size in Carrolltown borough
Average Household Size in Carrolltown borough is 2.2 People.
How Large is the Labor Force in Carrolltown borough?
There are 415 People in the Labor Forcein in Carrolltown borough.
What is the Percentage of People in the Labor Force in Carrolltown borough?
58.1% of People are in the Labor Force in Carrolltown borough.
What is the Unemployment Rate in Carrolltown borough?
Unemployment Rate in Carrolltown borough is 3.4%.