Carnegie borough, PA Map & Demographics
Carnegie borough Overview
$40,258
PER CAPITA INCOME
$94,261
AVG FAMILY INCOME
$61,875
AVG HOUSEHOLD INCOME
8.8%
WAGE / INCOME GAP [ % ]
91.2¢/ $1
WAGE / INCOME GAP [ $ ]
0.42
INEQUALITY / GINI INDEX
8,067
TOTAL POPULATION
4,087
MALE POPULATION
3,980
FEMALE POPULATION
102.69
MALES / 100 FEMALES
97.38
FEMALES / 100 MALES
40.4
MEDIAN AGE
2.9
AVG FAMILY SIZE
2.0
AVG HOUSEHOLD SIZE
4,981
LABOR FORCE [ PEOPLE ]
73.0%
PERCENT IN LABOR FORCE
3.1%
UNEMPLOYMENT RATE
Income in Carnegie borough
Income Overview in Carnegie borough
Per Capita Income in Carnegie borough is $40,258, while median incomes of families and households are $94,261 and $61,875 respectively.
| Characteristic | Number | Measure |
| Per Capita Income | 8,067 | $40,258 |
| Median Family Income | 1,861 | $94,261 |
| Mean Family Income | 1,861 | $106,137 |
| Median Household Income | 4,074 | $61,875 |
| Mean Household Income | 4,074 | $77,156 |
| Income Deficit | 1,861 | $0 |
| Wage / Income Gap (%) | 8,067 | 8.79% |
| Wage / Income Gap ($) | 8,067 | 91.21¢ per $1 |
| Gini / Inequality Index | 8,067 | 0.42 |
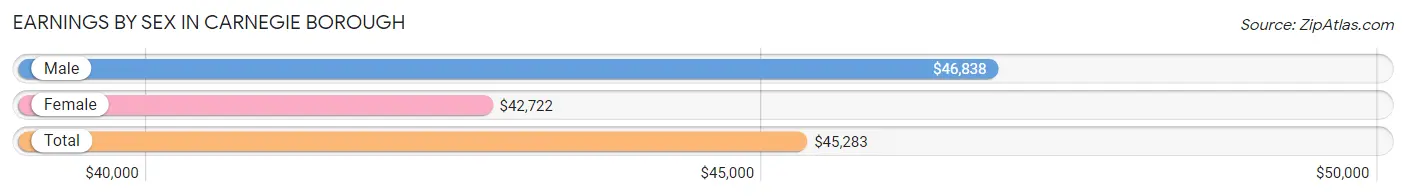
Earnings by Sex in Carnegie borough
Average Earnings in Carnegie borough are $45,283, $46,838 for men and $42,722 for women, a difference of 8.8%.
| Sex | Number | Average Earnings |
| Male | 2,588 (50.7%) | $46,838 |
| Female | 2,520 (49.3%) | $42,722 |
| Total | 5,108 (100.0%) | $45,283 |
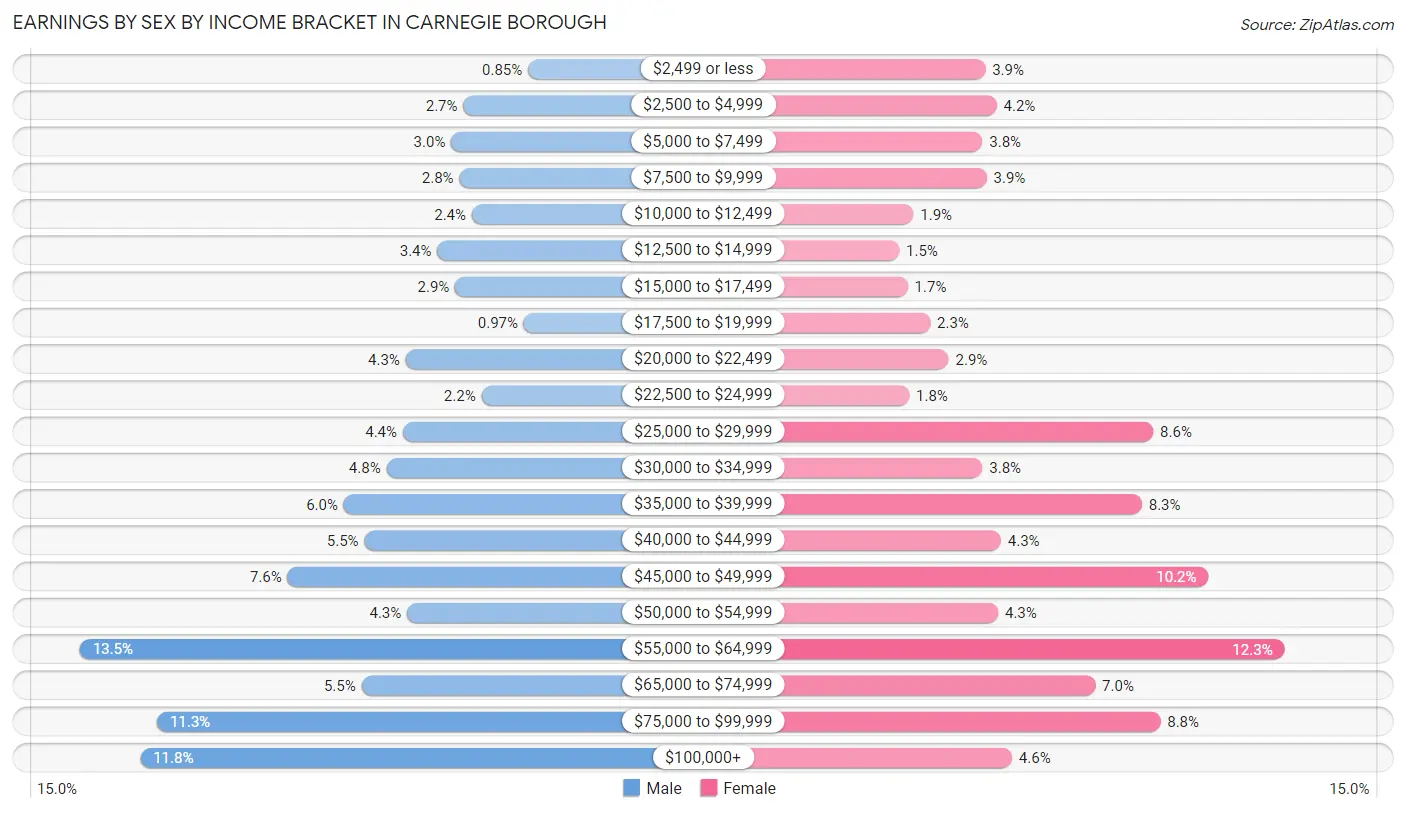
Earnings by Sex by Income Bracket in Carnegie borough
The most common earnings brackets in Carnegie borough are $55,000 to $64,999 for men (348 | 13.5%) and $55,000 to $64,999 for women (310 | 12.3%).
| Income | Male | Female |
| $2,499 or less | 22 (0.9%) | 98 (3.9%) |
| $2,500 to $4,999 | 69 (2.7%) | 106 (4.2%) |
| $5,000 to $7,499 | 78 (3.0%) | 96 (3.8%) |
| $7,500 to $9,999 | 72 (2.8%) | 99 (3.9%) |
| $10,000 to $12,499 | 63 (2.4%) | 47 (1.9%) |
| $12,500 to $14,999 | 88 (3.4%) | 37 (1.5%) |
| $15,000 to $17,499 | 75 (2.9%) | 43 (1.7%) |
| $17,500 to $19,999 | 25 (1.0%) | 59 (2.3%) |
| $20,000 to $22,499 | 111 (4.3%) | 72 (2.9%) |
| $22,500 to $24,999 | 56 (2.2%) | 44 (1.8%) |
| $25,000 to $29,999 | 113 (4.4%) | 217 (8.6%) |
| $30,000 to $34,999 | 125 (4.8%) | 96 (3.8%) |
| $35,000 to $39,999 | 156 (6.0%) | 209 (8.3%) |
| $40,000 to $44,999 | 141 (5.4%) | 109 (4.3%) |
| $45,000 to $49,999 | 197 (7.6%) | 256 (10.2%) |
| $50,000 to $54,999 | 110 (4.3%) | 107 (4.3%) |
| $55,000 to $64,999 | 348 (13.5%) | 310 (12.3%) |
| $65,000 to $74,999 | 143 (5.5%) | 176 (7.0%) |
| $75,000 to $99,999 | 292 (11.3%) | 222 (8.8%) |
| $100,000+ | 304 (11.7%) | 117 (4.6%) |
| Total | 2,588 (100.0%) | 2,520 (100.0%) |
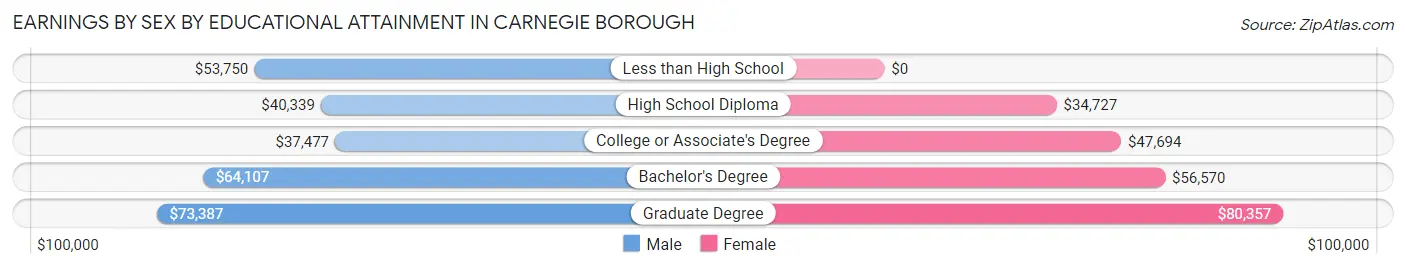
Earnings by Sex by Educational Attainment in Carnegie borough
Average earnings in Carnegie borough are $49,549 for men and $45,248 for women, a difference of 8.7%. Men with an educational attainment of graduate degree enjoy the highest average annual earnings of $73,387, while those with college or associate's degree education earn the least with $37,477. Women with an educational attainment of graduate degree earn the most with the average annual earnings of $80,357, while those with high school diploma education have the smallest earnings of $34,727.
| Educational Attainment | Male Income | Female Income |
| Less than High School | $53,750 | $0 |
| High School Diploma | $40,339 | $34,727 |
| College or Associate's Degree | $37,477 | $47,694 |
| Bachelor's Degree | $64,107 | $56,570 |
| Graduate Degree | $73,387 | $80,357 |
| Total | $49,549 | $45,248 |
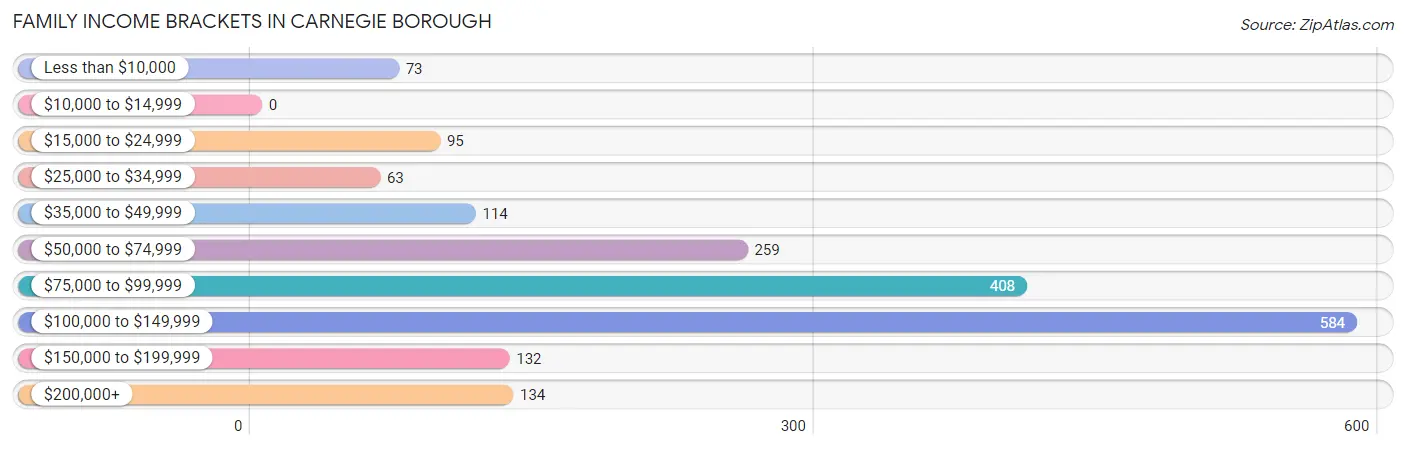
Family Income in Carnegie borough
Family Income Brackets in Carnegie borough
According to the Carnegie borough family income data, there are 584 families falling into the $100,000 to $149,999 income range, which is the most common income bracket and makes up 31.4% of all families.
| Income Bracket | # Families | % Families |
| Less than $10,000 | 73 | 3.9% |
| $10,000 to $14,999 | 0 | 0.0% |
| $15,000 to $24,999 | 95 | 5.1% |
| $25,000 to $34,999 | 63 | 3.4% |
| $35,000 to $49,999 | 114 | 6.1% |
| $50,000 to $74,999 | 259 | 13.9% |
| $75,000 to $99,999 | 408 | 21.9% |
| $100,000 to $149,999 | 584 | 31.4% |
| $150,000 to $199,999 | 132 | 7.1% |
| $200,000+ | 134 | 7.2% |
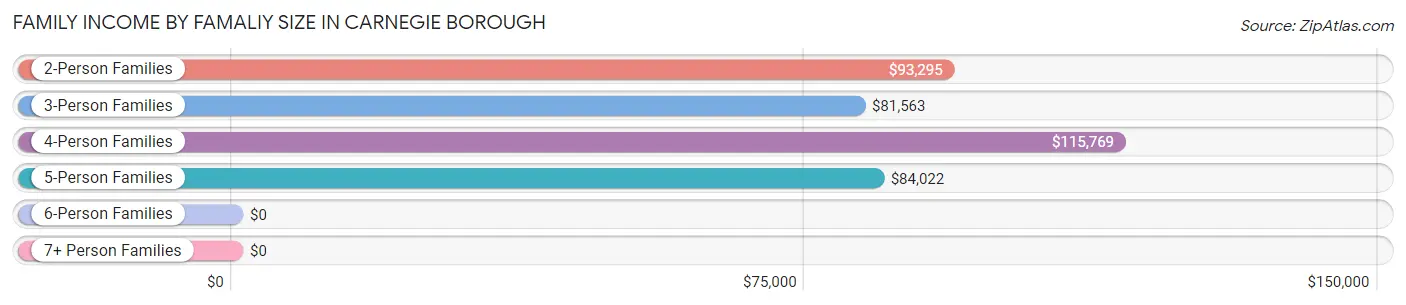
Family Income by Famaliy Size in Carnegie borough
4-person families (266 | 14.3%) account for the highest median family income in Carnegie borough with $115,769 per family, while 2-person families (1,118 | 60.1%) have the highest median income of $46,648 per family member.
| Income Bracket | # Families | Median Income |
| 2-Person Families | 1,118 (60.1%) | $93,295 |
| 3-Person Families | 340 (18.3%) | $81,563 |
| 4-Person Families | 266 (14.3%) | $115,769 |
| 5-Person Families | 104 (5.6%) | $84,022 |
| 6-Person Families | 33 (1.8%) | $0 |
| 7+ Person Families | 0 (0.0%) | $0 |
| Total | 1,861 (100.0%) | $94,261 |
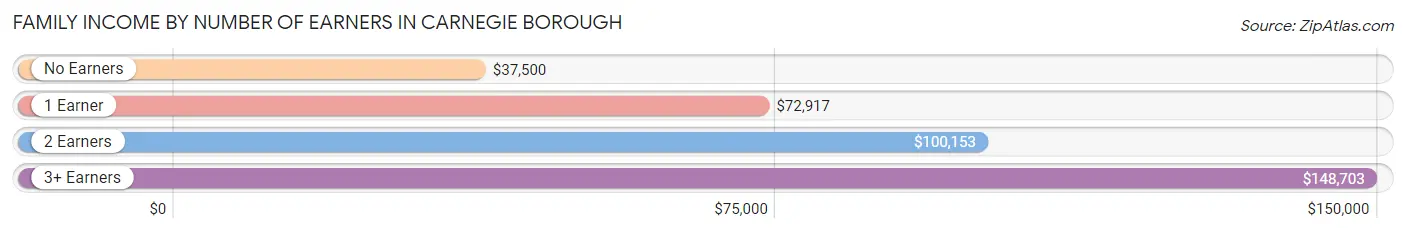
Family Income by Number of Earners in Carnegie borough
The median family income in Carnegie borough is $94,261, with families comprising 3+ earners (175) having the highest median family income of $148,703, while families with no earners (160) have the lowest median family income of $37,500, accounting for 9.4% and 8.6% of families, respectively.
| Number of Earners | # Families | Median Income |
| No Earners | 160 (8.6%) | $37,500 |
| 1 Earner | 491 (26.4%) | $72,917 |
| 2 Earners | 1,035 (55.6%) | $100,153 |
| 3+ Earners | 175 (9.4%) | $148,703 |
| Total | 1,861 (100.0%) | $94,261 |
Household Income in Carnegie borough
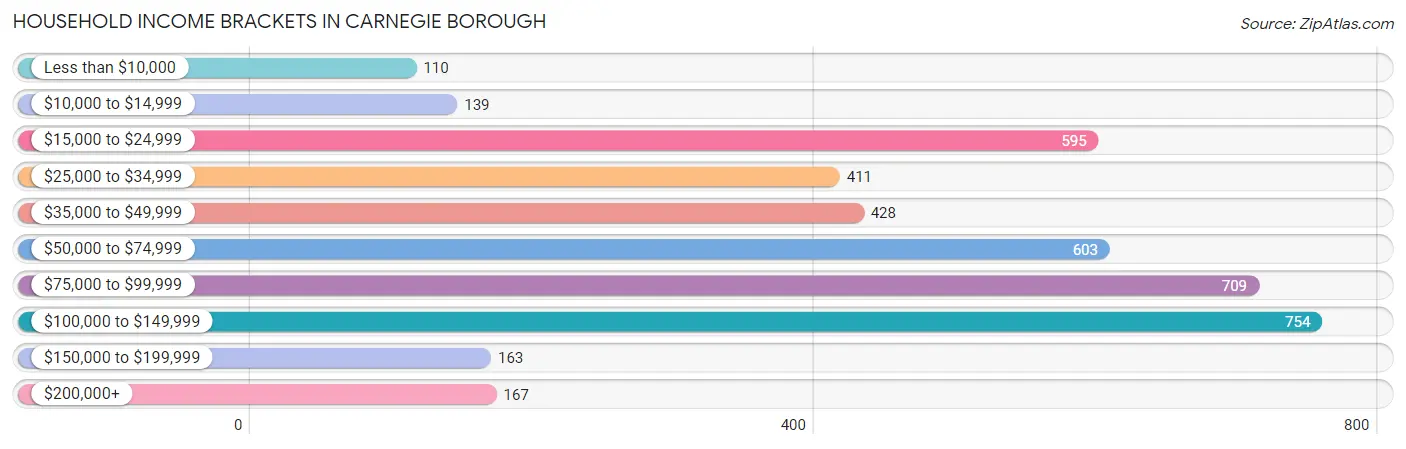
Household Income Brackets in Carnegie borough
With 754 households falling in the category, the $100,000 to $149,999 income range is the most frequent in Carnegie borough, accounting for 18.5% of all households. In contrast, only 110 households (2.7%) fall into the less than $10,000 income bracket, making it the least populous group.
| Income Bracket | # Households | % Households |
| Less than $10,000 | 110 | 2.7% |
| $10,000 to $14,999 | 139 | 3.4% |
| $15,000 to $24,999 | 595 | 14.6% |
| $25,000 to $34,999 | 411 | 10.1% |
| $35,000 to $49,999 | 428 | 10.5% |
| $50,000 to $74,999 | 603 | 14.8% |
| $75,000 to $99,999 | 709 | 17.4% |
| $100,000 to $149,999 | 754 | 18.5% |
| $150,000 to $199,999 | 163 | 4.0% |
| $200,000+ | 167 | 4.1% |
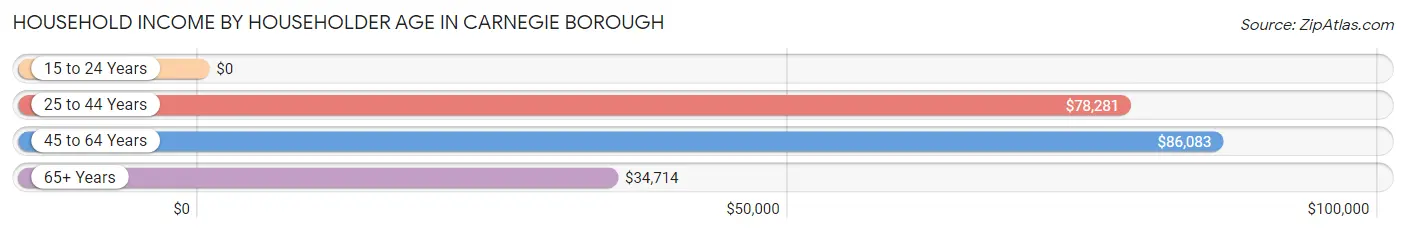
Household Income by Householder Age in Carnegie borough
The median household income in Carnegie borough is $61,875, with the highest median household income of $86,083 found in the 45 to 64 years age bracket for the primary householder. A total of 1,205 households (29.6%) fall into this category. Meanwhile, the 15 to 24 years age bracket for the primary householder has the lowest median household income of $0, with 121 households (3.0%) in this group.
| Income Bracket | # Households | Median Income |
| 15 to 24 Years | 121 (3.0%) | $0 |
| 25 to 44 Years | 1,360 (33.4%) | $78,281 |
| 45 to 64 Years | 1,205 (29.6%) | $86,083 |
| 65+ Years | 1,388 (34.1%) | $34,714 |
| Total | 4,074 (100.0%) | $61,875 |
Poverty in Carnegie borough
Income Below Poverty by Sex and Age in Carnegie borough
With 11.3% poverty level for males and 9.8% for females among the residents of Carnegie borough, under 5 year old males and 12 to 14 year old females are the most vulnerable to poverty, with 190 males (48.1%) and 24 females (33.3%) in their respective age groups living below the poverty level.
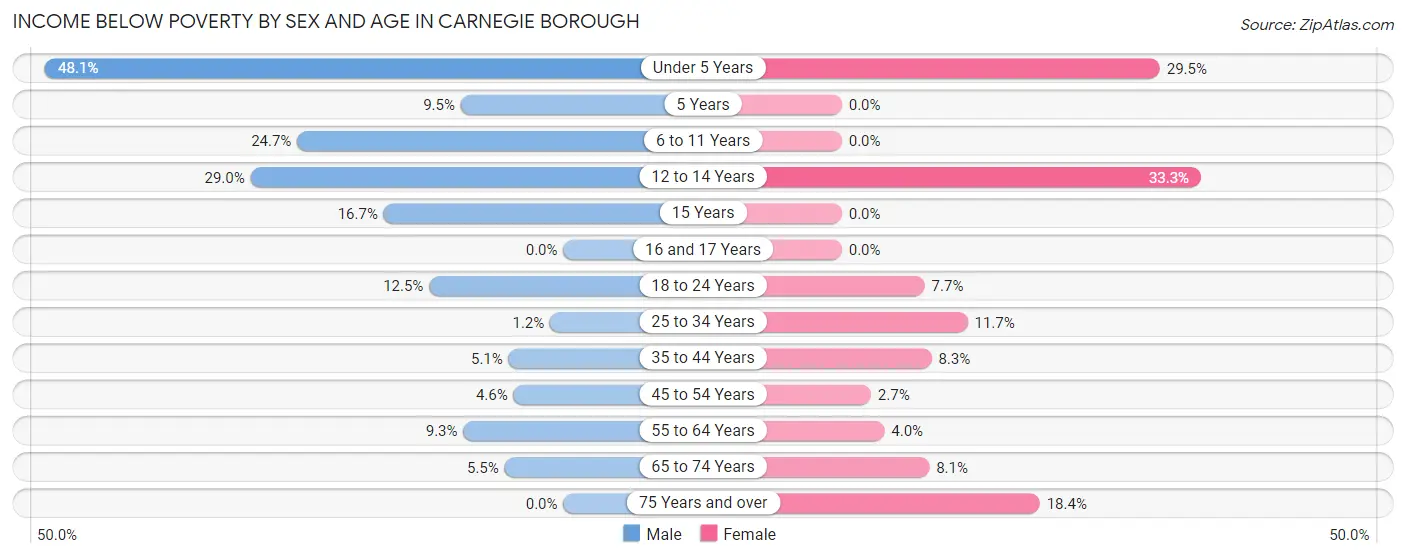
| Age Bracket | Male | Female |
| Under 5 Years | 190 (48.1%) | 54 (29.5%) |
| 5 Years | 6 (9.5%) | 0 (0.0%) |
| 6 to 11 Years | 62 (24.7%) | 0 (0.0%) |
| 12 to 14 Years | 36 (29.0%) | 24 (33.3%) |
| 15 Years | 7 (16.7%) | 0 (0.0%) |
| 16 and 17 Years | 0 (0.0%) | 0 (0.0%) |
| 18 to 24 Years | 30 (12.4%) | 14 (7.7%) |
| 25 to 34 Years | 10 (1.2%) | 84 (11.7%) |
| 35 to 44 Years | 28 (5.1%) | 40 (8.3%) |
| 45 to 54 Years | 18 (4.6%) | 11 (2.7%) |
| 55 to 64 Years | 61 (9.3%) | 26 (4.0%) |
| 65 to 74 Years | 15 (5.4%) | 57 (8.1%) |
| 75 Years and over | 0 (0.0%) | 81 (18.4%) |
| Total | 463 (11.3%) | 391 (9.8%) |
Income Above Poverty by Sex and Age in Carnegie borough
According to the poverty statistics in Carnegie borough, males aged 16 and 17 years and females aged 5 years are the age groups that are most secure financially, with 100.0% of males and 100.0% of females in these age groups living above the poverty line.
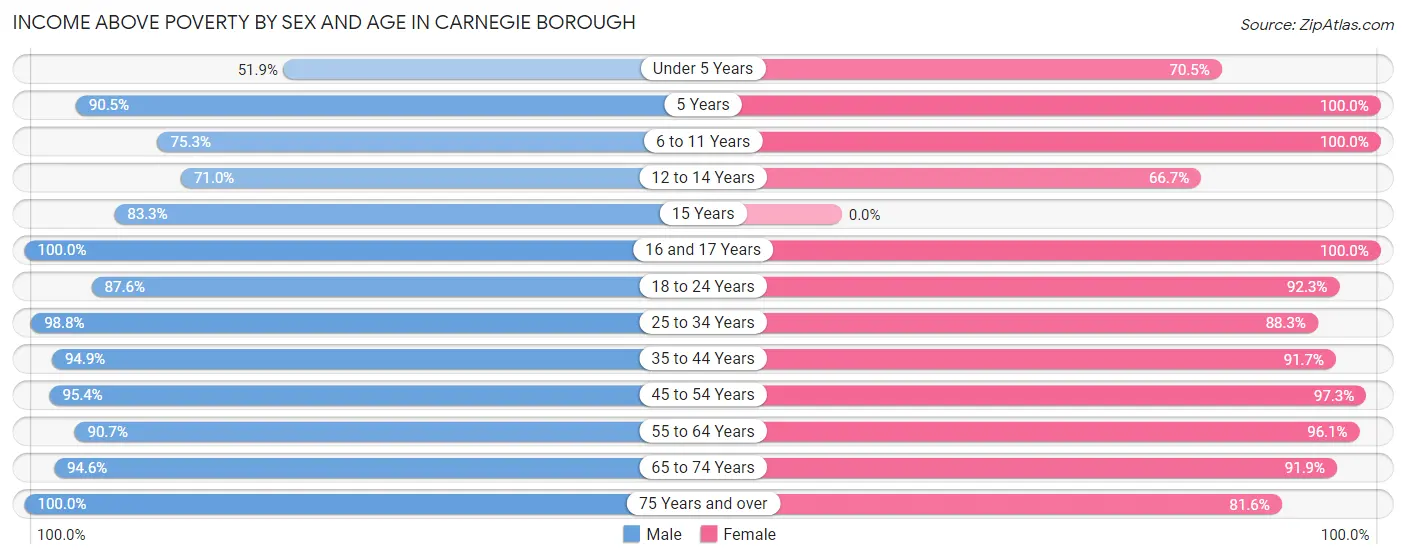
| Age Bracket | Male | Female |
| Under 5 Years | 205 (51.9%) | 129 (70.5%) |
| 5 Years | 57 (90.5%) | 32 (100.0%) |
| 6 to 11 Years | 189 (75.3%) | 81 (100.0%) |
| 12 to 14 Years | 88 (71.0%) | 48 (66.7%) |
| 15 Years | 35 (83.3%) | 0 (0.0%) |
| 16 and 17 Years | 47 (100.0%) | 20 (100.0%) |
| 18 to 24 Years | 211 (87.5%) | 168 (92.3%) |
| 25 to 34 Years | 802 (98.8%) | 636 (88.3%) |
| 35 to 44 Years | 523 (94.9%) | 441 (91.7%) |
| 45 to 54 Years | 372 (95.4%) | 396 (97.3%) |
| 55 to 64 Years | 596 (90.7%) | 632 (96.1%) |
| 65 to 74 Years | 260 (94.6%) | 646 (91.9%) |
| 75 Years and over | 238 (100.0%) | 360 (81.6%) |
| Total | 3,623 (88.7%) | 3,589 (90.2%) |
Income Below Poverty Among Married-Couple Families in Carnegie borough
The poverty statistics for married-couple families in Carnegie borough show that 2.6% or 33 of the total 1,259 families live below the poverty line. Families with 1 or 2 children have the highest poverty rate of 3.9%, comprising of 13 families. On the other hand, families with 3 or 4 children have the lowest poverty rate of 0.0%, which includes 0 families.
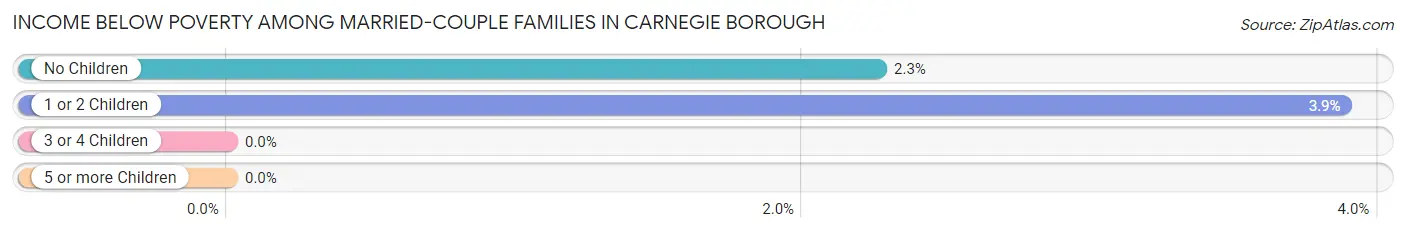
| Children | Above Poverty | Below Poverty |
| No Children | 866 (97.7%) | 20 (2.3%) |
| 1 or 2 Children | 322 (96.1%) | 13 (3.9%) |
| 3 or 4 Children | 38 (100.0%) | 0 (0.0%) |
| 5 or more Children | 0 (0.0%) | 0 (0.0%) |
| Total | 1,226 (97.4%) | 33 (2.6%) |
Income Below Poverty Among Single-Parent Households in Carnegie borough
According to the poverty data in Carnegie borough, 6.1% or 6 single-father households and 20.2% or 102 single-mother households are living below the poverty line. Among single-father households, those with no children have the highest poverty rate, with 6 households (11.1%) experiencing poverty. Likewise, among single-mother households, those with 3 or 4 children have the highest poverty rate, with 32 households (86.5%) falling below the poverty line.
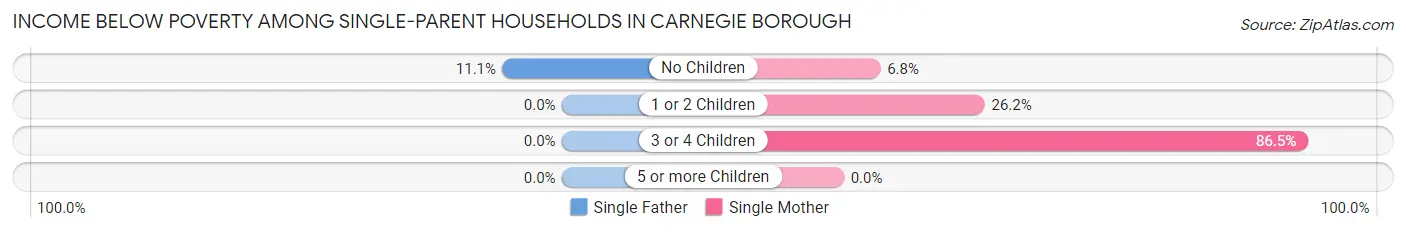
| Children | Single Father | Single Mother |
| No Children | 6 (11.1%) | 17 (6.8%) |
| 1 or 2 Children | 0 (0.0%) | 53 (26.2%) |
| 3 or 4 Children | 0 (0.0%) | 32 (86.5%) |
| 5 or more Children | 0 (0.0%) | 0 (0.0%) |
| Total | 6 (6.1%) | 102 (20.2%) |
Income Below Poverty Among Married-Couple vs Single-Parent Households in Carnegie borough
The poverty data for Carnegie borough shows that 33 of the married-couple family households (2.6%) and 108 of the single-parent households (17.9%) are living below the poverty level. Within the married-couple family households, those with 1 or 2 children have the highest poverty rate, with 13 households (3.9%) falling below the poverty line. Among the single-parent households, those with 3 or 4 children have the highest poverty rate, with 32 household (86.5%) living below poverty.
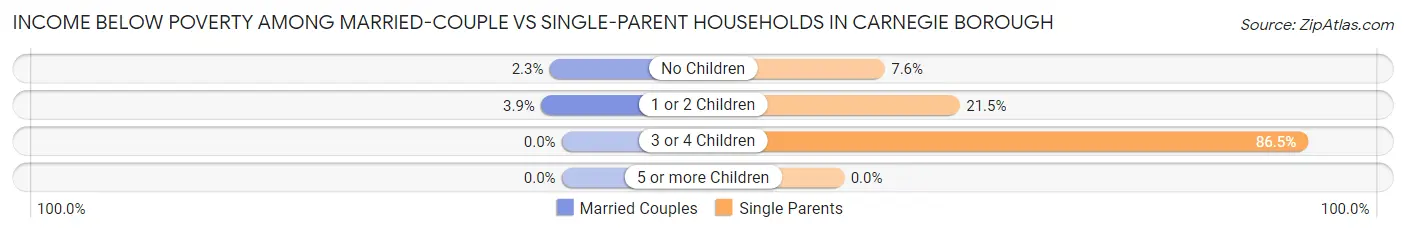
| Children | Married-Couple Families | Single-Parent Households |
| No Children | 20 (2.3%) | 23 (7.6%) |
| 1 or 2 Children | 13 (3.9%) | 53 (21.5%) |
| 3 or 4 Children | 0 (0.0%) | 32 (86.5%) |
| 5 or more Children | 0 (0.0%) | 0 (0.0%) |
| Total | 33 (2.6%) | 108 (17.9%) |
Race in Carnegie borough
The most populous races in Carnegie borough are White / Caucasian (6,398 | 79.3%), Black / African American (874 | 10.8%), and Two or more Races (545 | 6.8%).
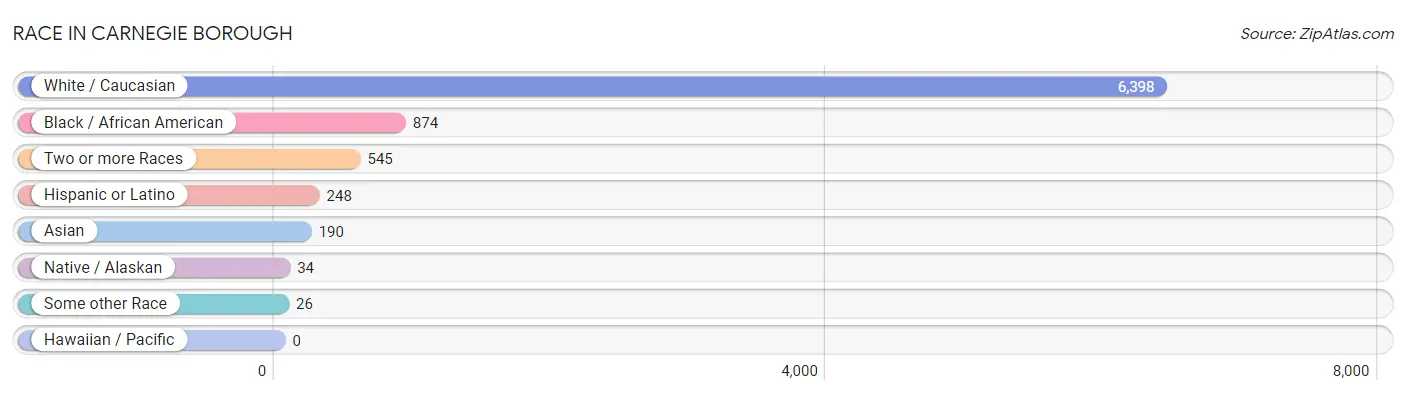
| Race | # Population | % Population |
| Asian | 190 | 2.4% |
| Black / African American | 874 | 10.8% |
| Hawaiian / Pacific | 0 | 0.0% |
| Hispanic or Latino | 248 | 3.1% |
| Native / Alaskan | 34 | 0.4% |
| White / Caucasian | 6,398 | 79.3% |
| Two or more Races | 545 | 6.8% |
| Some other Race | 26 | 0.3% |
| Total | 8,067 | 100.0% |
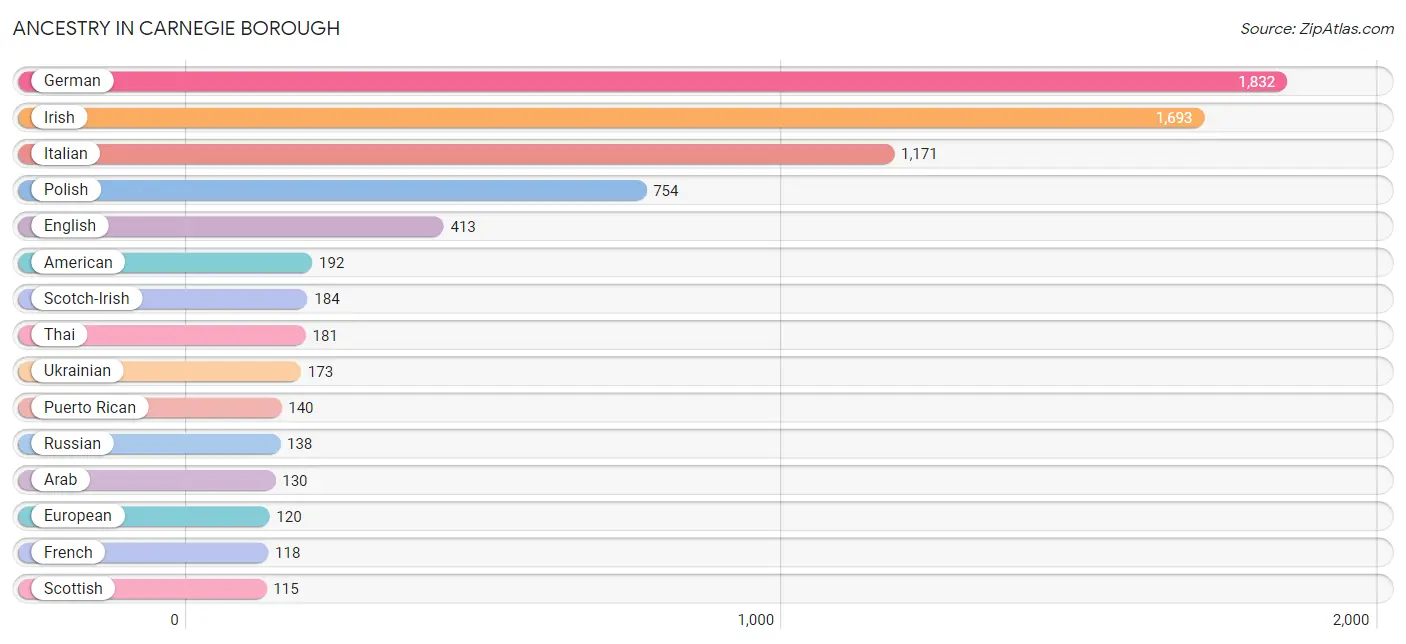
Ancestry in Carnegie borough
The most populous ancestries reported in Carnegie borough are German (1,832 | 22.7%), Irish (1,693 | 21.0%), Italian (1,171 | 14.5%), Polish (754 | 9.3%), and English (413 | 5.1%), together accounting for 72.7% of all Carnegie borough residents.
| Ancestry | # Population | % Population |
| African | 37 | 0.5% |
| American | 192 | 2.4% |
| Arab | 130 | 1.6% |
| Austrian | 24 | 0.3% |
| Blackfeet | 15 | 0.2% |
| British | 83 | 1.0% |
| Central American | 17 | 0.2% |
| Central American Indian | 105 | 1.3% |
| Cherokee | 27 | 0.3% |
| Cheyenne | 15 | 0.2% |
| Chilean | 13 | 0.2% |
| Croatian | 76 | 0.9% |
| Cuban | 8 | 0.1% |
| Czech | 56 | 0.7% |
| Czechoslovakian | 26 | 0.3% |
| Dominican | 11 | 0.1% |
| Dutch | 42 | 0.5% |
| Eastern European | 48 | 0.6% |
| English | 413 | 5.1% |
| European | 120 | 1.5% |
| Finnish | 4 | 0.1% |
| French | 118 | 1.5% |
| French Canadian | 5 | 0.1% |
| German | 1,832 | 22.7% |
| Greek | 14 | 0.2% |
| Guatemalan | 17 | 0.2% |
| Hungarian | 70 | 0.9% |
| Irish | 1,693 | 21.0% |
| Iroquois | 2 | 0.0% |
| Italian | 1,171 | 14.5% |
| Jamaican | 85 | 1.1% |
| Lebanese | 11 | 0.1% |
| Lithuanian | 32 | 0.4% |
| Mexican | 59 | 0.7% |
| Norwegian | 29 | 0.4% |
| Pakistani | 9 | 0.1% |
| Polish | 754 | 9.3% |
| Puerto Rican | 140 | 1.7% |
| Russian | 138 | 1.7% |
| Scandinavian | 14 | 0.2% |
| Scotch-Irish | 184 | 2.3% |
| Scottish | 115 | 1.4% |
| Serbian | 44 | 0.5% |
| Slovak | 51 | 0.6% |
| Slovene | 66 | 0.8% |
| South American | 13 | 0.2% |
| Subsaharan African | 62 | 0.8% |
| Swedish | 66 | 0.8% |
| Syrian | 73 | 0.9% |
| Thai | 181 | 2.2% |
| Turkish | 14 | 0.2% |
| Ukrainian | 173 | 2.1% |
| Welsh | 21 | 0.3% | View All 53 Rows |
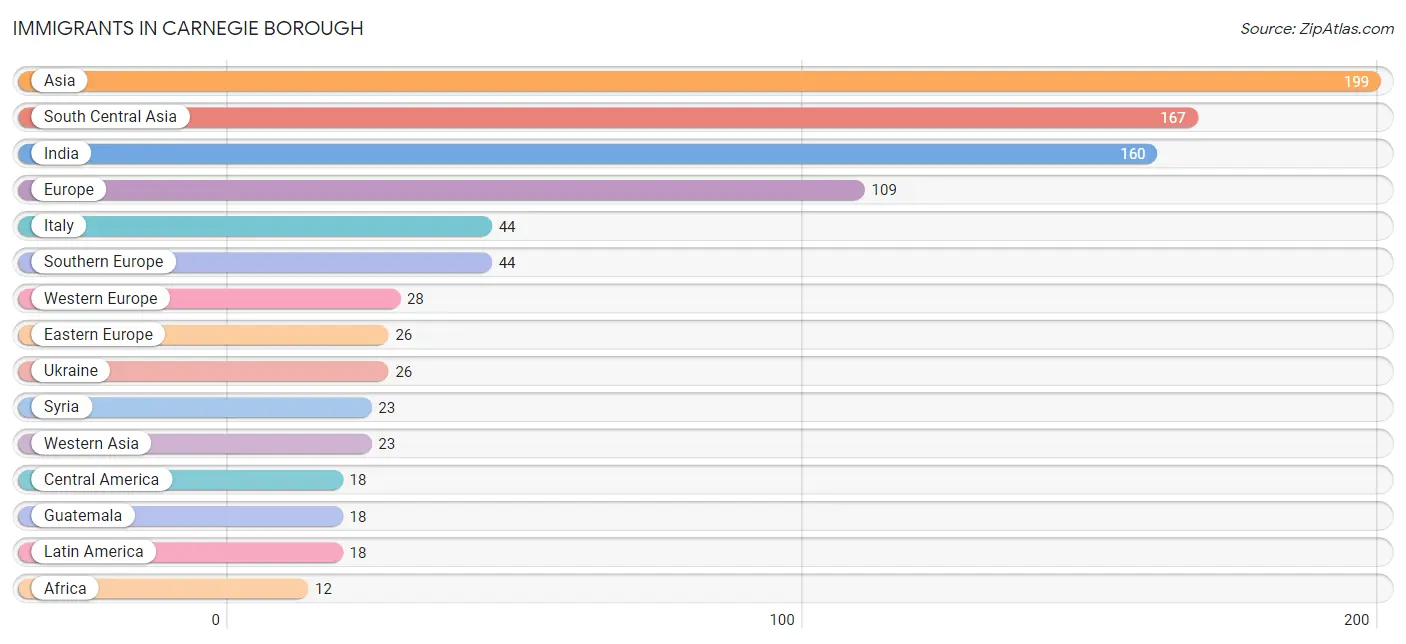
Immigrants in Carnegie borough
The most numerous immigrant groups reported in Carnegie borough came from Asia (199 | 2.5%), South Central Asia (167 | 2.1%), India (160 | 2.0%), Europe (109 | 1.3%), and Italy (44 | 0.5%), together accounting for 8.4% of all Carnegie borough residents.
| Immigration Origin | # Population | % Population |
| Africa | 12 | 0.2% |
| Asia | 199 | 2.5% |
| Central America | 18 | 0.2% |
| Eastern Africa | 1 | 0.0% |
| Eastern Europe | 26 | 0.3% |
| England | 11 | 0.1% |
| Europe | 109 | 1.3% |
| France | 11 | 0.1% |
| Germany | 10 | 0.1% |
| Guatemala | 18 | 0.2% |
| India | 160 | 2.0% |
| Italy | 44 | 0.5% |
| Latin America | 18 | 0.2% |
| Northern Europe | 11 | 0.1% |
| Pakistan | 7 | 0.1% |
| South Central Asia | 167 | 2.1% |
| South Eastern Asia | 9 | 0.1% |
| Southern Europe | 44 | 0.5% |
| Switzerland | 7 | 0.1% |
| Syria | 23 | 0.3% |
| Thailand | 9 | 0.1% |
| Ukraine | 26 | 0.3% |
| Western Asia | 23 | 0.3% |
| Western Europe | 28 | 0.4% | View All 24 Rows |
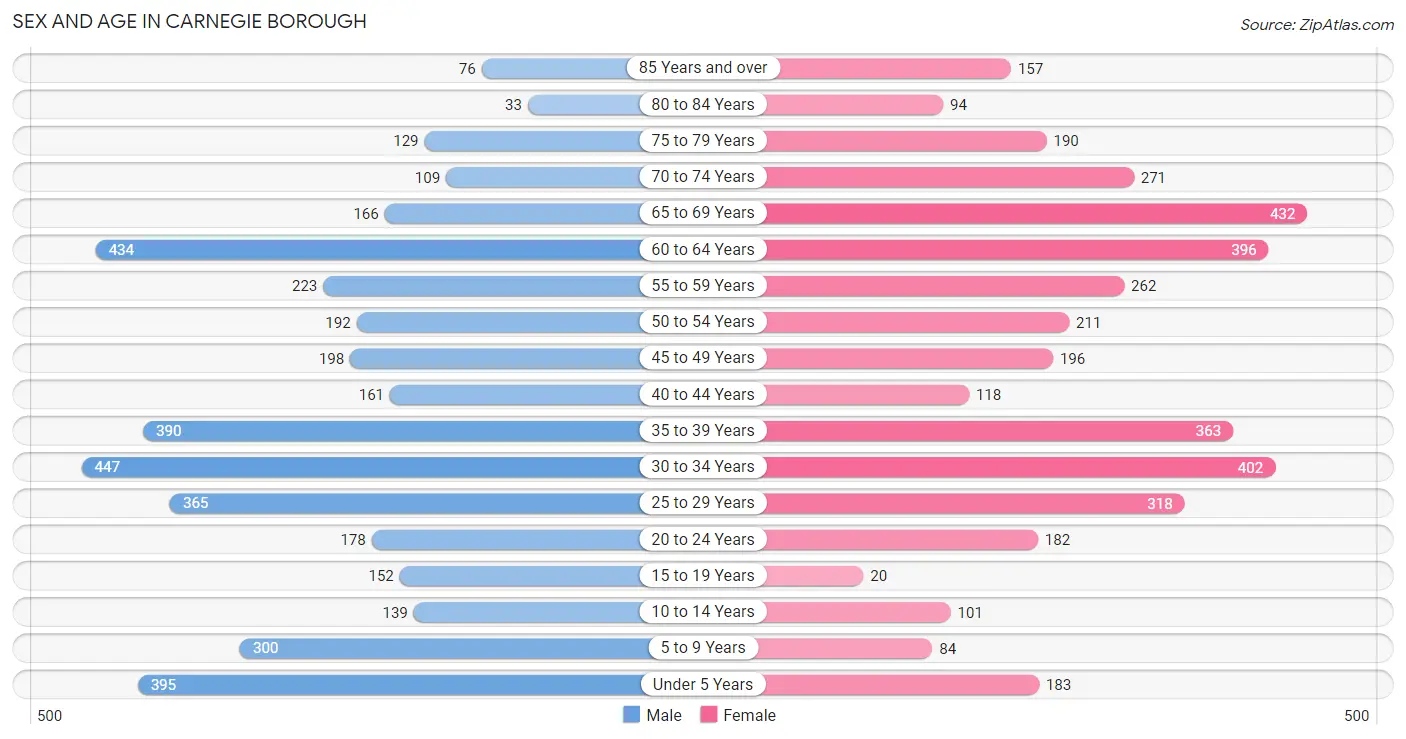
Sex and Age in Carnegie borough
Sex and Age in Carnegie borough
The most populous age groups in Carnegie borough are 30 to 34 Years (447 | 10.9%) for men and 65 to 69 Years (432 | 10.8%) for women.
| Age Bracket | Male | Female |
| Under 5 Years | 395 (9.7%) | 183 (4.6%) |
| 5 to 9 Years | 300 (7.3%) | 84 (2.1%) |
| 10 to 14 Years | 139 (3.4%) | 101 (2.5%) |
| 15 to 19 Years | 152 (3.7%) | 20 (0.5%) |
| 20 to 24 Years | 178 (4.4%) | 182 (4.6%) |
| 25 to 29 Years | 365 (8.9%) | 318 (8.0%) |
| 30 to 34 Years | 447 (10.9%) | 402 (10.1%) |
| 35 to 39 Years | 390 (9.5%) | 363 (9.1%) |
| 40 to 44 Years | 161 (3.9%) | 118 (3.0%) |
| 45 to 49 Years | 198 (4.8%) | 196 (4.9%) |
| 50 to 54 Years | 192 (4.7%) | 211 (5.3%) |
| 55 to 59 Years | 223 (5.5%) | 262 (6.6%) |
| 60 to 64 Years | 434 (10.6%) | 396 (10.0%) |
| 65 to 69 Years | 166 (4.1%) | 432 (10.8%) |
| 70 to 74 Years | 109 (2.7%) | 271 (6.8%) |
| 75 to 79 Years | 129 (3.2%) | 190 (4.8%) |
| 80 to 84 Years | 33 (0.8%) | 94 (2.4%) |
| 85 Years and over | 76 (1.9%) | 157 (3.9%) |
| Total | 4,087 (100.0%) | 3,980 (100.0%) |
Families and Households in Carnegie borough
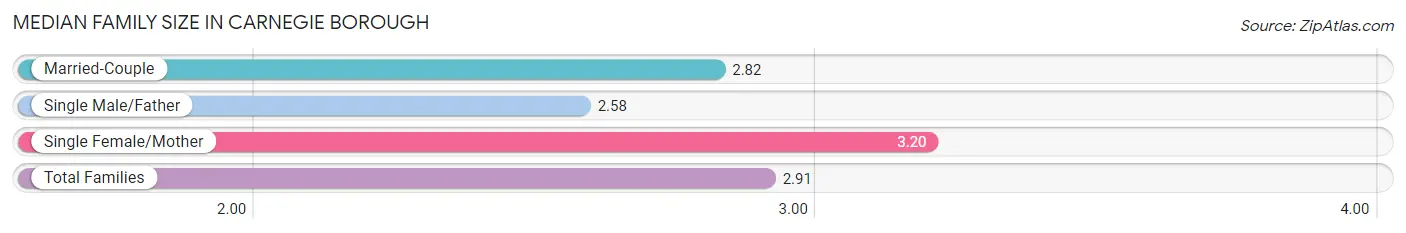
Median Family Size in Carnegie borough
The median family size in Carnegie borough is 2.91 persons per family, with single female/mother families (504 | 27.1%) accounting for the largest median family size of 3.2 persons per family. On the other hand, single male/father families (98 | 5.3%) represent the smallest median family size with 2.58 persons per family.
| Family Type | # Families | Family Size |
| Married-Couple | 1,259 (67.6%) | 2.82 |
| Single Male/Father | 98 (5.3%) | 2.58 |
| Single Female/Mother | 504 (27.1%) | 3.20 |
| Total Families | 1,861 (100.0%) | 2.91 |
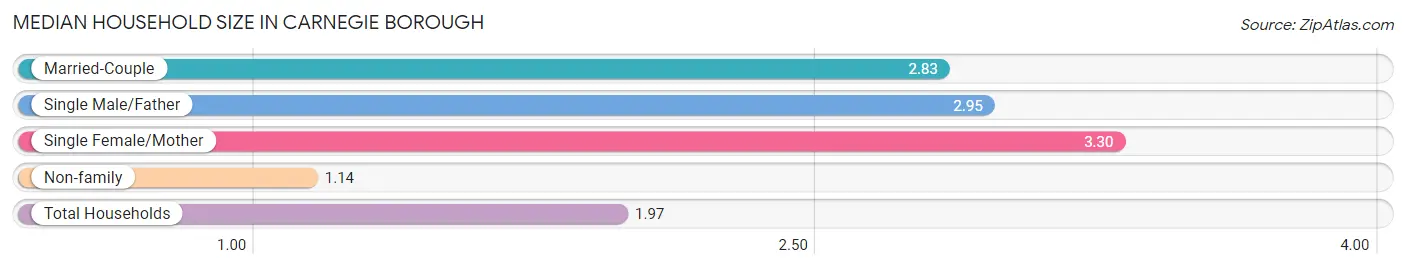
Median Household Size in Carnegie borough
The median household size in Carnegie borough is 1.97 persons per household, with single female/mother households (504 | 12.4%) accounting for the largest median household size of 3.3 persons per household. non-family households (2,213 | 54.3%) represent the smallest median household size with 1.14 persons per household.
| Household Type | # Households | Household Size |
| Married-Couple | 1,259 (30.9%) | 2.83 |
| Single Male/Father | 98 (2.4%) | 2.95 |
| Single Female/Mother | 504 (12.4%) | 3.30 |
| Non-family | 2,213 (54.3%) | 1.14 |
| Total Households | 4,074 (100.0%) | 1.97 |
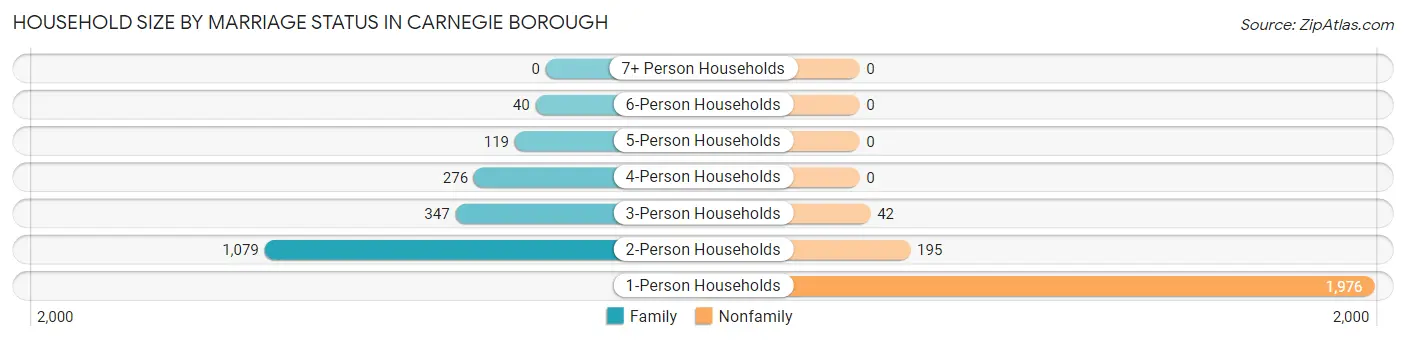
Household Size by Marriage Status in Carnegie borough
Out of a total of 4,074 households in Carnegie borough, 1,861 (45.7%) are family households, while 2,213 (54.3%) are nonfamily households. The most numerous type of family households are 2-person households, comprising 1,079, and the most common type of nonfamily households are 1-person households, comprising 1,976.
| Household Size | Family Households | Nonfamily Households |
| 1-Person Households | - | 1,976 (48.5%) |
| 2-Person Households | 1,079 (26.5%) | 195 (4.8%) |
| 3-Person Households | 347 (8.5%) | 42 (1.0%) |
| 4-Person Households | 276 (6.8%) | 0 (0.0%) |
| 5-Person Households | 119 (2.9%) | 0 (0.0%) |
| 6-Person Households | 40 (1.0%) | 0 (0.0%) |
| 7+ Person Households | 0 (0.0%) | 0 (0.0%) |
| Total | 1,861 (45.7%) | 2,213 (54.3%) |
Female Fertility in Carnegie borough
Fertility by Age in Carnegie borough
Average fertility rate in Carnegie borough is 31.0 births per 1,000 women. Women in the age bracket of 20 to 34 years have the highest fertility rate with 42.0 births per 1,000 women. Women in the age bracket of 20 to 34 years acount for 76.0% of all women with births.
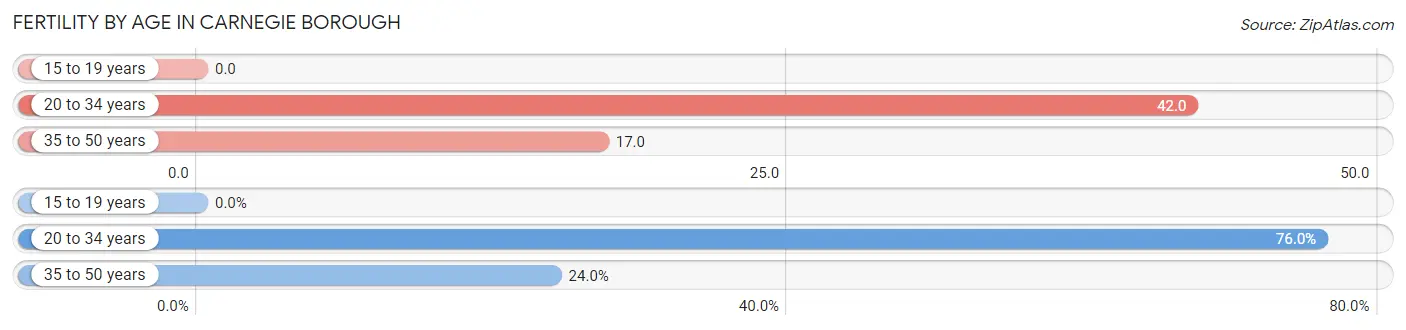
| Age Bracket | Women with Births | Births / 1,000 Women |
| 15 to 19 years | 0 (0.0%) | 0.0 |
| 20 to 34 years | 38 (76.0%) | 42.0 |
| 35 to 50 years | 12 (24.0%) | 17.0 |
| Total | 50 (100.0%) | 31.0 |
Fertility by Age by Marriage Status in Carnegie borough
92.0% of women with births (50) in Carnegie borough are married. The highest percentage of unmarried women with births falls into 20 to 34 years age bracket with 10.5% of them unmarried at the time of birth, while the lowest percentage of unmarried women with births belong to 35 to 50 years age bracket with 0.0% of them unmarried.
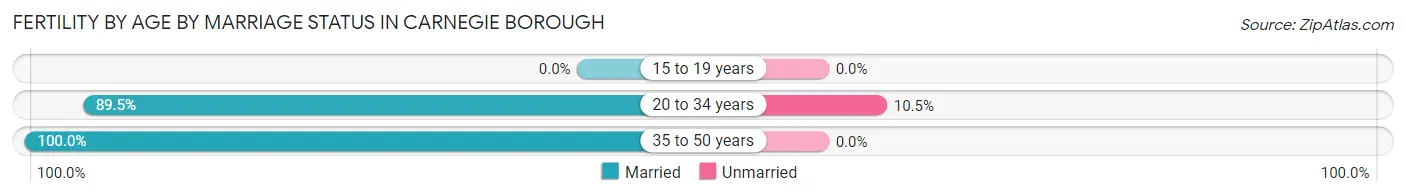
| Age Bracket | Married | Unmarried |
| 15 to 19 years | 0 (0.0%) | 0 (0.0%) |
| 20 to 34 years | 34 (89.5%) | 4 (10.5%) |
| 35 to 50 years | 12 (100.0%) | 0 (0.0%) |
| Total | 46 (92.0%) | 4 (8.0%) |
Fertility by Education in Carnegie borough
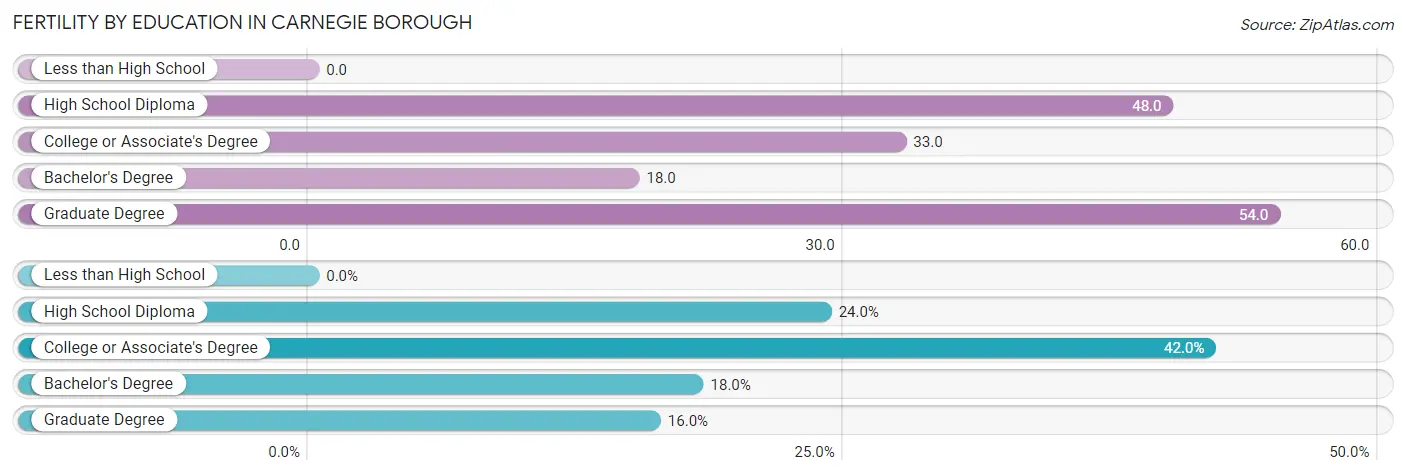
| Educational Attainment | Women with Births | Births / 1,000 Women |
| Less than High School | 0 (0.0%) | 0.0 |
| High School Diploma | 12 (24.0%) | 48.0 |
| College or Associate's Degree | 21 (42.0%) | 33.0 |
| Bachelor's Degree | 9 (18.0%) | 18.0 |
| Graduate Degree | 8 (16.0%) | 54.0 |
| Total | 50 (100.0%) | 31.0 |
Fertility by Education by Marriage Status in Carnegie borough
8.0% of women with births in Carnegie borough are unmarried. Women with the educational attainment of high school diploma are most likely to be married with 100.0% of them married at childbirth, while women with the educational attainment of college or associate's degree are least likely to be married with 19.1% of them unmarried at childbirth.
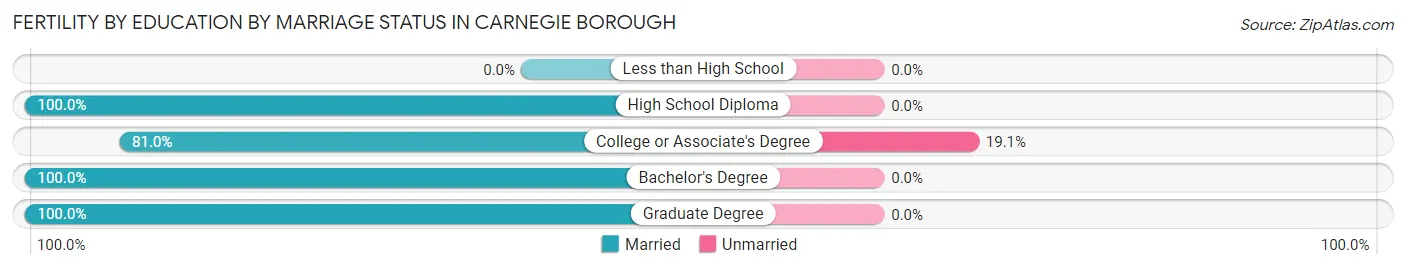
| Educational Attainment | Married | Unmarried |
| Less than High School | 0 (0.0%) | 0 (0.0%) |
| High School Diploma | 12 (100.0%) | 0 (0.0%) |
| College or Associate's Degree | 17 (80.9%) | 4 (19.1%) |
| Bachelor's Degree | 9 (100.0%) | 0 (0.0%) |
| Graduate Degree | 8 (100.0%) | 0 (0.0%) |
| Total | 46 (92.0%) | 4 (8.0%) |
Employment Characteristics in Carnegie borough
Employment by Class of Employer in Carnegie borough
Among the 4,724 employed individuals in Carnegie borough, private company employees (3,407 | 72.1%), not-for-profit organizations (734 | 15.5%), and local government employees (177 | 3.7%) make up the most common classes of employment.
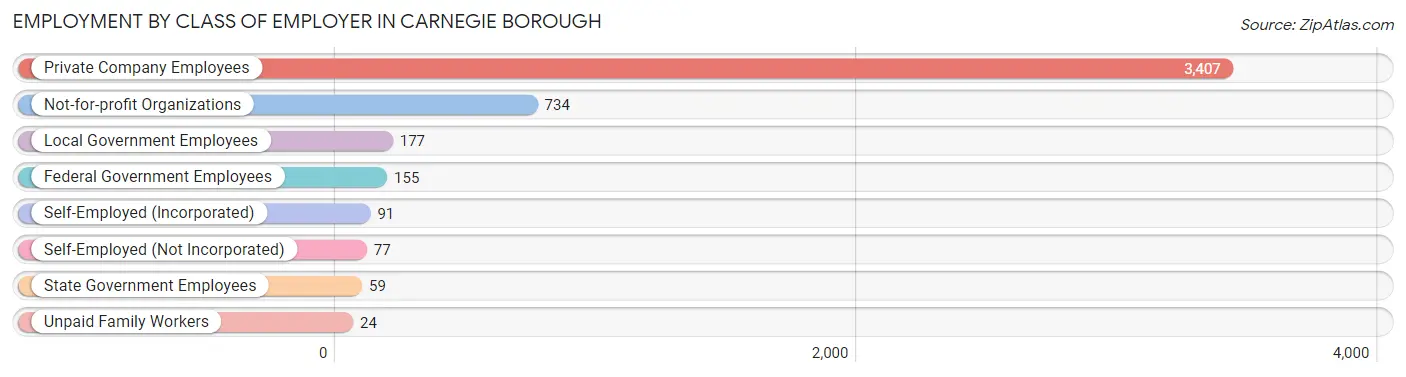
| Employer Class | # Employees | % Employees |
| Private Company Employees | 3,407 | 72.1% |
| Self-Employed (Incorporated) | 91 | 1.9% |
| Self-Employed (Not Incorporated) | 77 | 1.6% |
| Not-for-profit Organizations | 734 | 15.5% |
| Local Government Employees | 177 | 3.7% |
| State Government Employees | 59 | 1.3% |
| Federal Government Employees | 155 | 3.3% |
| Unpaid Family Workers | 24 | 0.5% |
| Total | 4,724 | 100.0% |
Employment Status by Age in Carnegie borough
According to the labor force statistics for Carnegie borough, out of the total population over 16 years of age (6,823), 73.0% or 4,981 individuals are in the labor force, with 3.1% or 154 of them unemployed. The age group with the highest labor force participation rate is 30 to 34 years, with 95.9% or 814 individuals in the labor force. Within the labor force, the 60 to 64 years age range has the highest percentage of unemployed individuals, with 7.0% or 42 of them being unemployed.
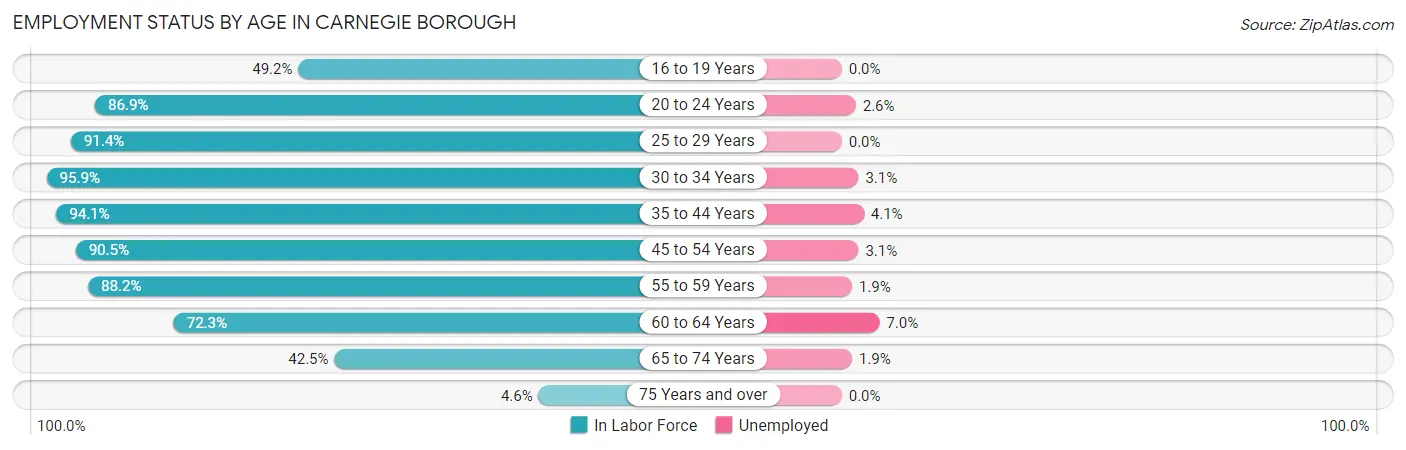
| Age Bracket | In Labor Force | Unemployed |
| 16 to 19 Years | 64 (49.2%) | 0 (0.0%) |
| 20 to 24 Years | 313 (86.9%) | 8 (2.6%) |
| 25 to 29 Years | 624 (91.4%) | 0 (0.0%) |
| 30 to 34 Years | 814 (95.9%) | 25 (3.1%) |
| 35 to 44 Years | 971 (94.1%) | 40 (4.1%) |
| 45 to 54 Years | 721 (90.5%) | 22 (3.1%) |
| 55 to 59 Years | 428 (88.2%) | 8 (1.9%) |
| 60 to 64 Years | 600 (72.3%) | 42 (7.0%) |
| 65 to 74 Years | 416 (42.5%) | 8 (1.9%) |
| 75 Years and over | 31 (4.6%) | 0 (0.0%) |
| Total | 4,981 (73.0%) | 154 (3.1%) |
Employment Status by Educational Attainment in Carnegie borough
According to labor force statistics for Carnegie borough, 88.9% of individuals (4,157) out of the total population between 25 and 64 years of age (4,676) are in the labor force, with 3.3% or 137 of them being unemployed. The group with the highest labor force participation rate are those with the educational attainment of bachelor's degree or higher, with 93.3% or 1,769 individuals in the labor force. Within the labor force, individuals with less than high school education have the highest percentage of unemployment, with 13.1% or 25 of them being unemployed.
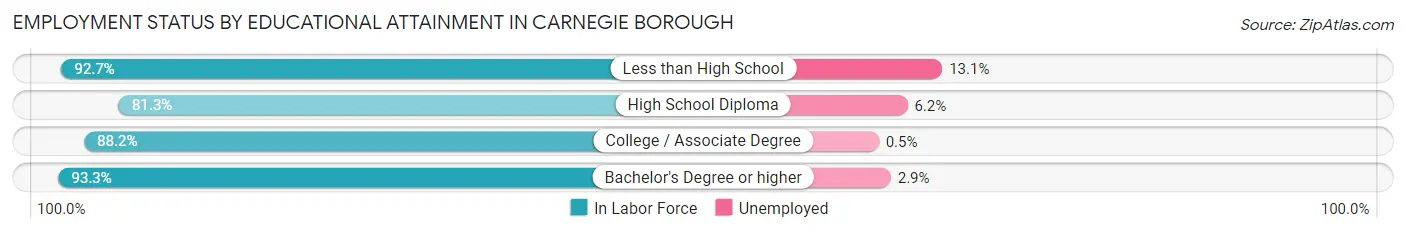
| Educational Attainment | In Labor Force | Unemployed |
| Less than High School | 191 (92.7%) | 27 (13.1%) |
| High School Diploma | 856 (81.3%) | 65 (6.2%) |
| College / Associate Degree | 1,342 (88.2%) | 8 (0.5%) |
| Bachelor's Degree or higher | 1,769 (93.3%) | 55 (2.9%) |
| Total | 4,157 (88.9%) | 154 (3.3%) |
Employment Occupations by Sex in Carnegie borough
Management, Business, Science and Arts Occupations
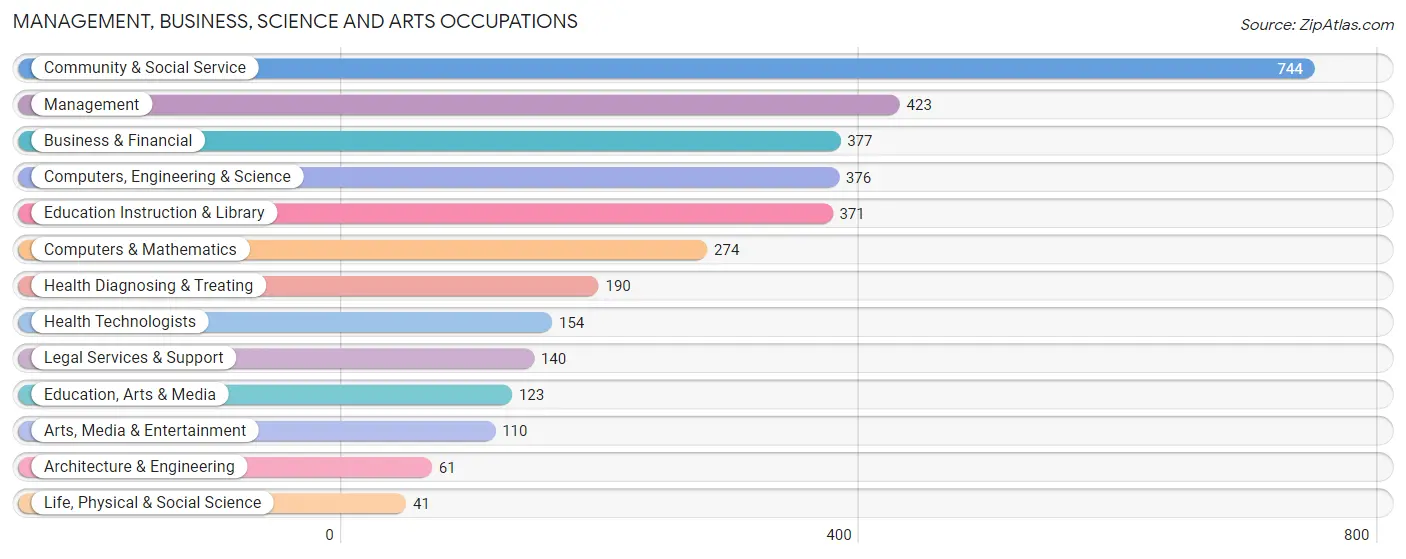
The most common Management, Business, Science and Arts occupations in Carnegie borough are Community & Social Service (744 | 15.4%), Management (423 | 8.8%), Business & Financial (377 | 7.8%), Computers, Engineering & Science (376 | 7.8%), and Education Instruction & Library (371 | 7.7%).
Management, Business, Science and Arts Occupations by Sex
Within the Management, Business, Science and Arts occupations in Carnegie borough, the most male-oriented occupations are Computers & Mathematics (98.5%), Computers, Engineering & Science (86.4%), and Arts, Media & Entertainment (72.7%), while the most female-oriented occupations are Health Diagnosing & Treating (90.0%), Health Technologists (87.7%), and Education, Arts & Media (84.6%).
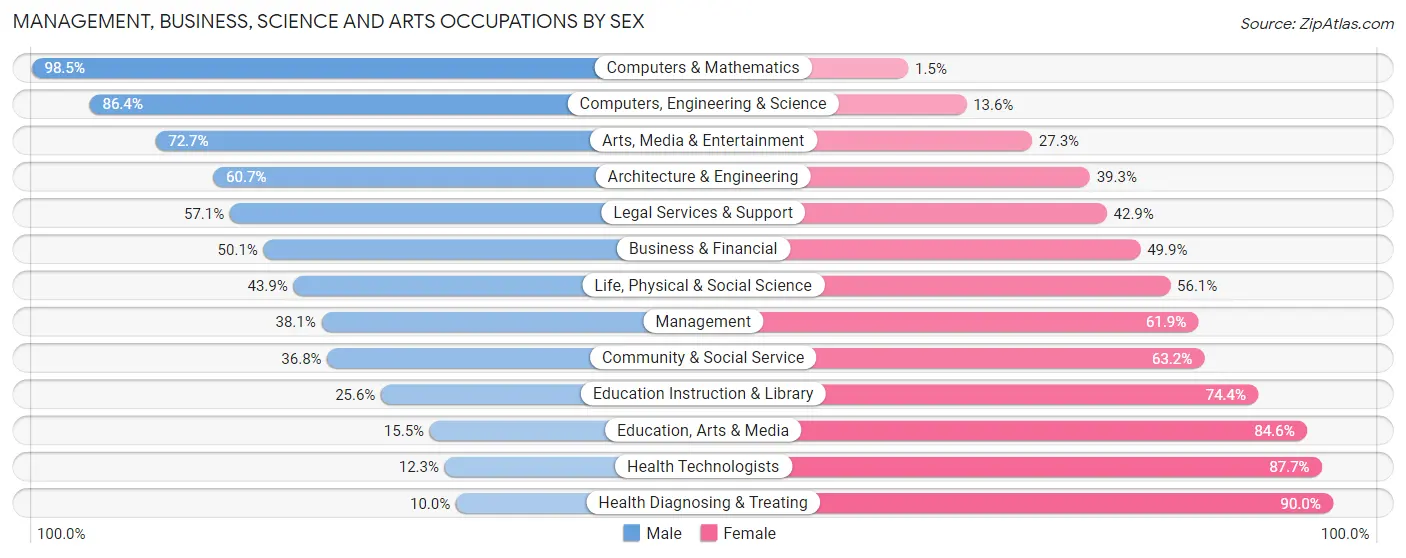
| Occupation | Male | Female |
| Management | 161 (38.1%) | 262 (61.9%) |
| Business & Financial | 189 (50.1%) | 188 (49.9%) |
| Computers, Engineering & Science | 325 (86.4%) | 51 (13.6%) |
| Computers & Mathematics | 270 (98.5%) | 4 (1.5%) |
| Architecture & Engineering | 37 (60.7%) | 24 (39.3%) |
| Life, Physical & Social Science | 18 (43.9%) | 23 (56.1%) |
| Community & Social Service | 274 (36.8%) | 470 (63.2%) |
| Education, Arts & Media | 19 (15.4%) | 104 (84.6%) |
| Legal Services & Support | 80 (57.1%) | 60 (42.9%) |
| Education Instruction & Library | 95 (25.6%) | 276 (74.4%) |
| Arts, Media & Entertainment | 80 (72.7%) | 30 (27.3%) |
| Health Diagnosing & Treating | 19 (10.0%) | 171 (90.0%) |
| Health Technologists | 19 (12.3%) | 135 (87.7%) |
| Total (Category) | 968 (45.9%) | 1,142 (54.1%) |
| Total (Overall) | 2,407 (49.8%) | 2,422 (50.2%) |
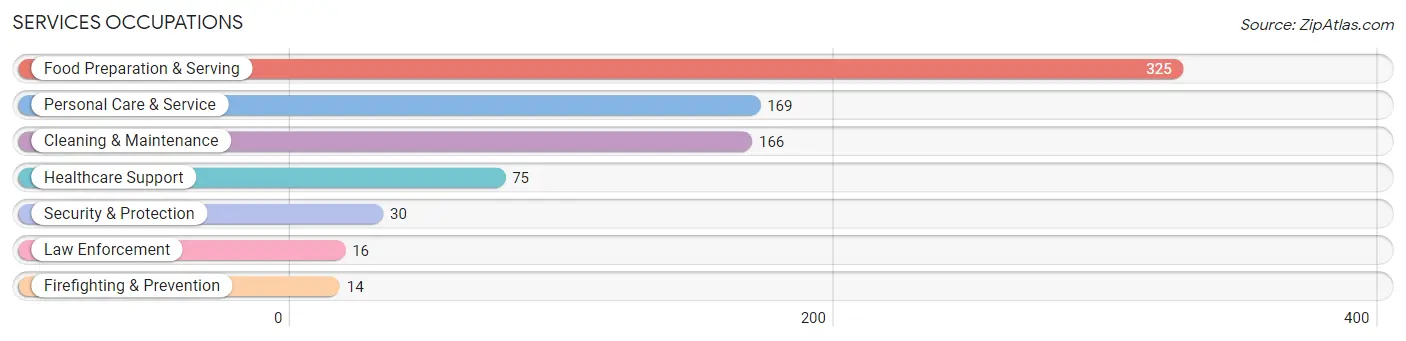
Services Occupations
The most common Services occupations in Carnegie borough are Food Preparation & Serving (325 | 6.7%), Personal Care & Service (169 | 3.5%), Cleaning & Maintenance (166 | 3.4%), Healthcare Support (75 | 1.5%), and Security & Protection (30 | 0.6%).
Services Occupations by Sex
Within the Services occupations in Carnegie borough, the most male-oriented occupations are Firefighting & Prevention (100.0%), Cleaning & Maintenance (90.4%), and Food Preparation & Serving (52.3%), while the most female-oriented occupations are Law Enforcement (100.0%), Healthcare Support (77.3%), and Personal Care & Service (76.9%).
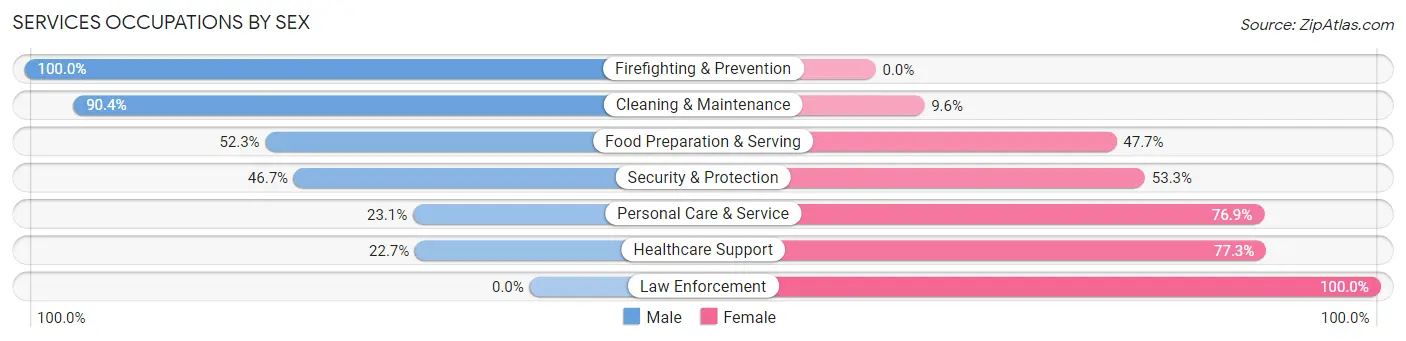
| Occupation | Male | Female |
| Healthcare Support | 17 (22.7%) | 58 (77.3%) |
| Security & Protection | 14 (46.7%) | 16 (53.3%) |
| Firefighting & Prevention | 14 (100.0%) | 0 (0.0%) |
| Law Enforcement | 0 (0.0%) | 16 (100.0%) |
| Food Preparation & Serving | 170 (52.3%) | 155 (47.7%) |
| Cleaning & Maintenance | 150 (90.4%) | 16 (9.6%) |
| Personal Care & Service | 39 (23.1%) | 130 (76.9%) |
| Total (Category) | 390 (51.0%) | 375 (49.0%) |
| Total (Overall) | 2,407 (49.8%) | 2,422 (50.2%) |
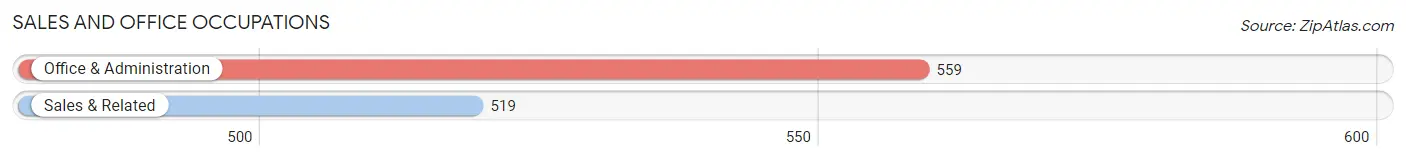
Sales and Office Occupations
The most common Sales and Office occupations in Carnegie borough are Office & Administration (559 | 11.6%), and Sales & Related (519 | 10.7%).
Sales and Office Occupations by Sex
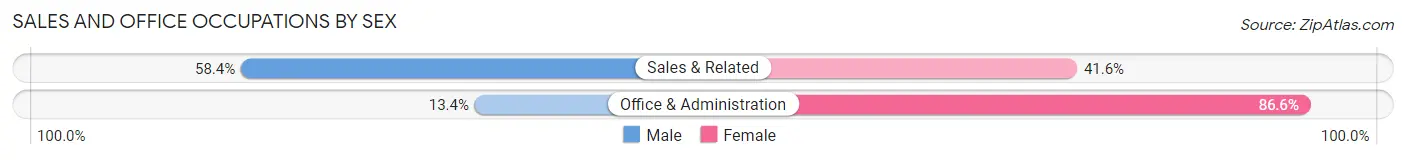
| Occupation | Male | Female |
| Sales & Related | 303 (58.4%) | 216 (41.6%) |
| Office & Administration | 75 (13.4%) | 484 (86.6%) |
| Total (Category) | 378 (35.1%) | 700 (64.9%) |
| Total (Overall) | 2,407 (49.8%) | 2,422 (50.2%) |
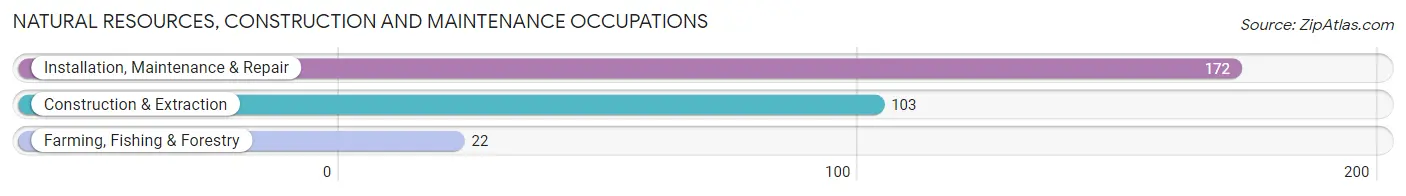
Natural Resources, Construction and Maintenance Occupations
The most common Natural Resources, Construction and Maintenance occupations in Carnegie borough are Installation, Maintenance & Repair (172 | 3.6%), Construction & Extraction (103 | 2.1%), and Farming, Fishing & Forestry (22 | 0.5%).
Natural Resources, Construction and Maintenance Occupations by Sex
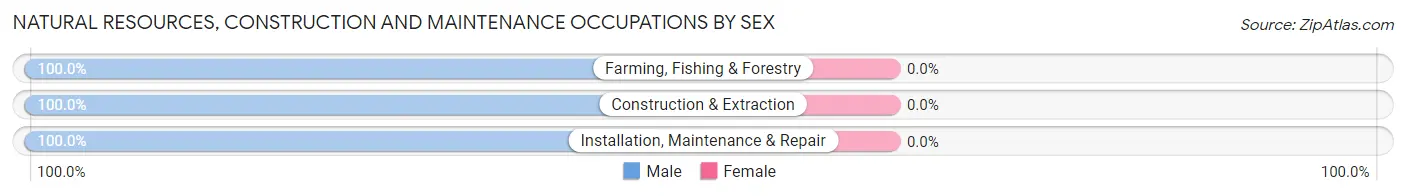
| Occupation | Male | Female |
| Farming, Fishing & Forestry | 22 (100.0%) | 0 (0.0%) |
| Construction & Extraction | 103 (100.0%) | 0 (0.0%) |
| Installation, Maintenance & Repair | 172 (100.0%) | 0 (0.0%) |
| Total (Category) | 297 (100.0%) | 0 (0.0%) |
| Total (Overall) | 2,407 (49.8%) | 2,422 (50.2%) |
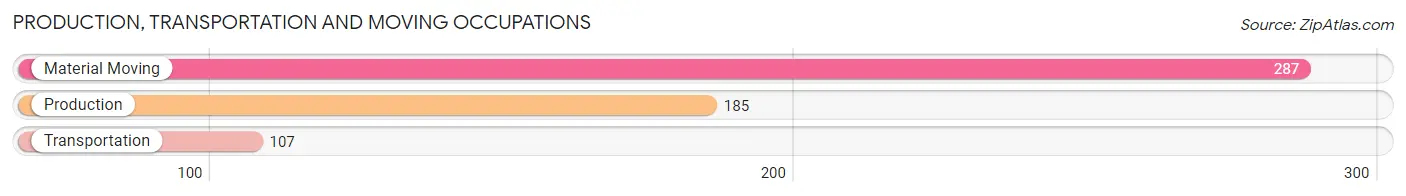
Production, Transportation and Moving Occupations
The most common Production, Transportation and Moving occupations in Carnegie borough are Material Moving (287 | 5.9%), Production (185 | 3.8%), and Transportation (107 | 2.2%).
Production, Transportation and Moving Occupations by Sex
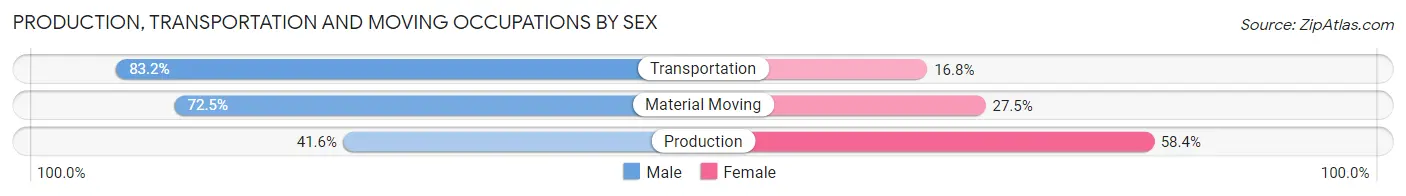
| Occupation | Male | Female |
| Production | 77 (41.6%) | 108 (58.4%) |
| Transportation | 89 (83.2%) | 18 (16.8%) |
| Material Moving | 208 (72.5%) | 79 (27.5%) |
| Total (Category) | 374 (64.6%) | 205 (35.4%) |
| Total (Overall) | 2,407 (49.8%) | 2,422 (50.2%) |
Employment Industries by Sex in Carnegie borough
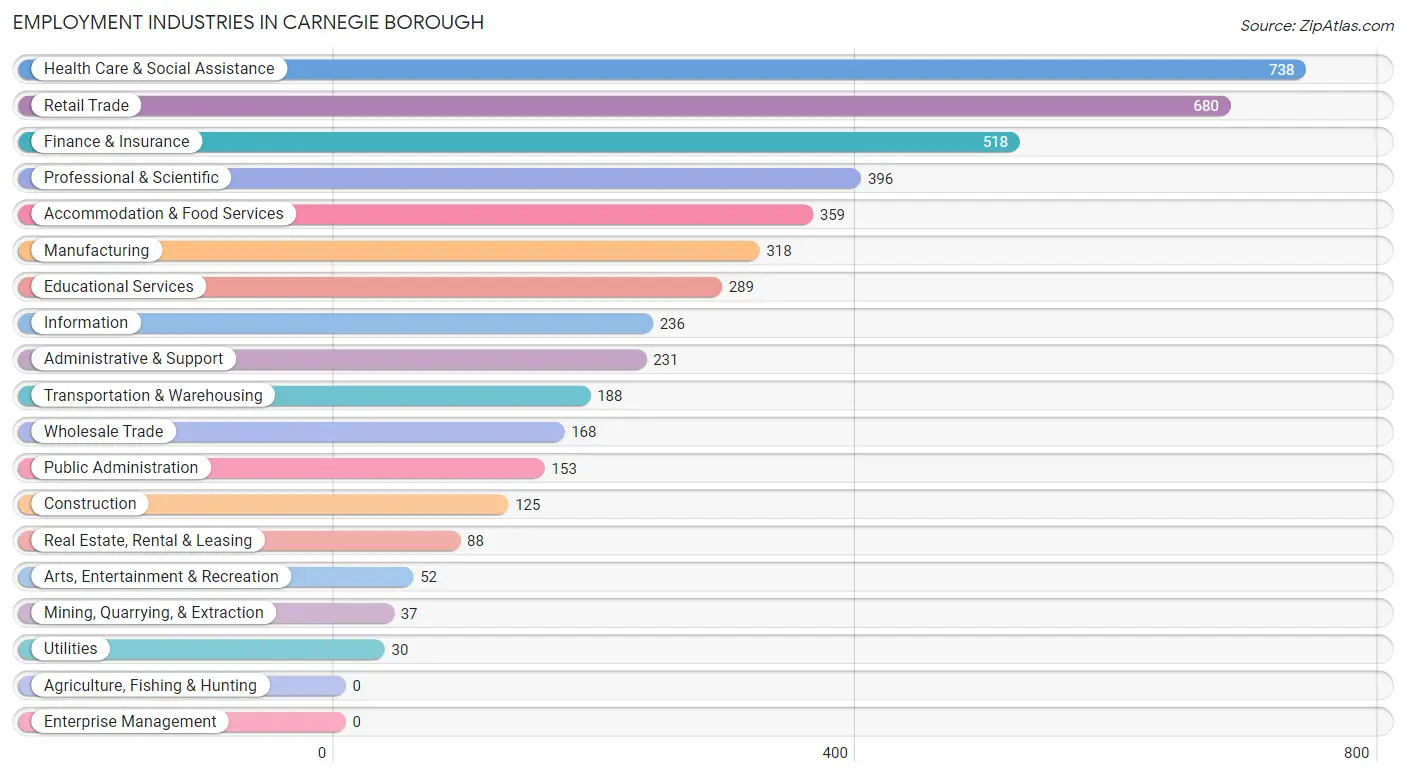
Employment Industries in Carnegie borough
The major employment industries in Carnegie borough include Health Care & Social Assistance (738 | 15.3%), Retail Trade (680 | 14.1%), Finance & Insurance (518 | 10.7%), Professional & Scientific (396 | 8.2%), and Accommodation & Food Services (359 | 7.4%).
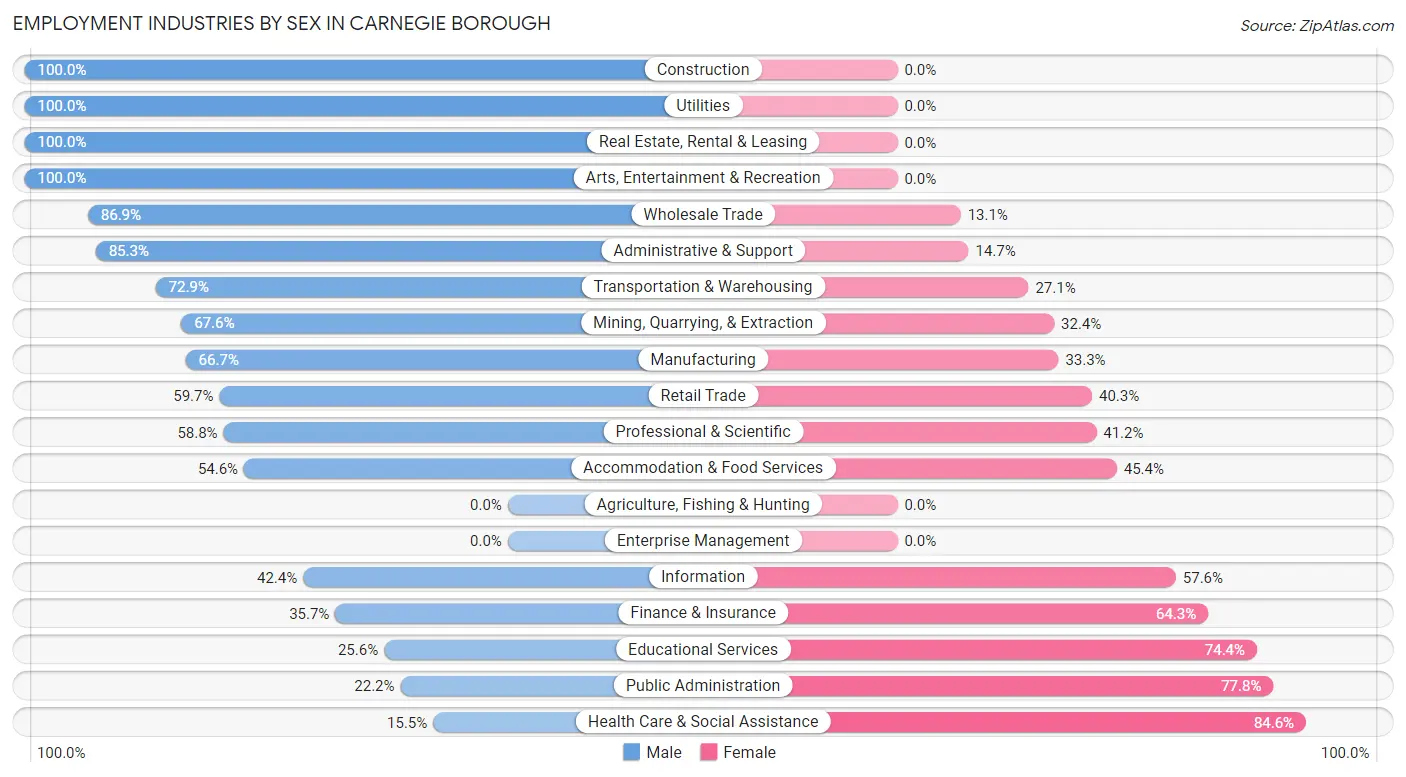
Employment Industries by Sex in Carnegie borough
The Carnegie borough industries that see more men than women are Construction (100.0%), Utilities (100.0%), and Real Estate, Rental & Leasing (100.0%), whereas the industries that tend to have a higher number of women are Health Care & Social Assistance (84.6%), Public Administration (77.8%), and Educational Services (74.4%).
| Industry | Male | Female |
| Agriculture, Fishing & Hunting | 0 (0.0%) | 0 (0.0%) |
| Mining, Quarrying, & Extraction | 25 (67.6%) | 12 (32.4%) |
| Construction | 125 (100.0%) | 0 (0.0%) |
| Manufacturing | 212 (66.7%) | 106 (33.3%) |
| Wholesale Trade | 146 (86.9%) | 22 (13.1%) |
| Retail Trade | 406 (59.7%) | 274 (40.3%) |
| Transportation & Warehousing | 137 (72.9%) | 51 (27.1%) |
| Utilities | 30 (100.0%) | 0 (0.0%) |
| Information | 100 (42.4%) | 136 (57.6%) |
| Finance & Insurance | 185 (35.7%) | 333 (64.3%) |
| Real Estate, Rental & Leasing | 88 (100.0%) | 0 (0.0%) |
| Professional & Scientific | 233 (58.8%) | 163 (41.2%) |
| Enterprise Management | 0 (0.0%) | 0 (0.0%) |
| Administrative & Support | 197 (85.3%) | 34 (14.7%) |
| Educational Services | 74 (25.6%) | 215 (74.4%) |
| Health Care & Social Assistance | 114 (15.4%) | 624 (84.6%) |
| Arts, Entertainment & Recreation | 52 (100.0%) | 0 (0.0%) |
| Accommodation & Food Services | 196 (54.6%) | 163 (45.4%) |
| Public Administration | 34 (22.2%) | 119 (77.8%) |
| Total | 2,407 (49.8%) | 2,422 (50.2%) |
Education in Carnegie borough
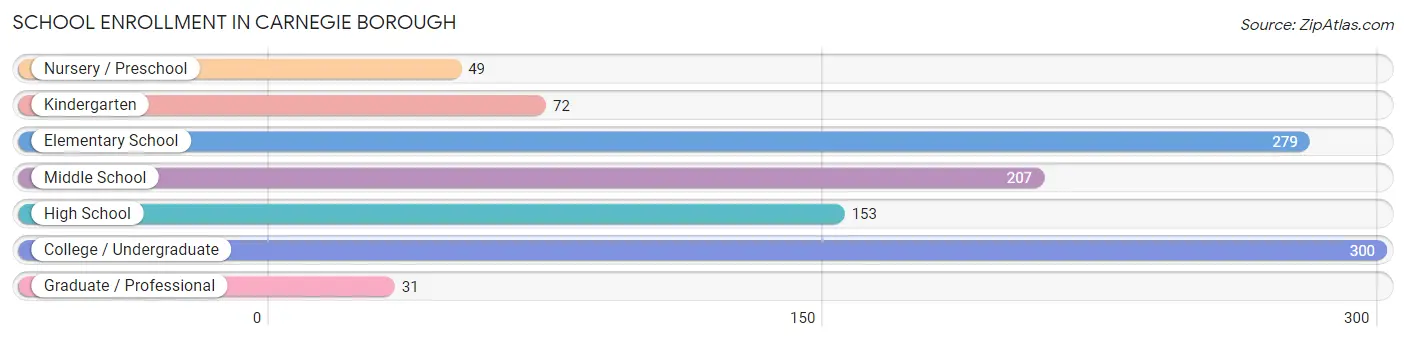
School Enrollment in Carnegie borough
The most common levels of schooling among the 1,091 students in Carnegie borough are college / undergraduate (300 | 27.5%), elementary school (279 | 25.6%), and middle school (207 | 19.0%).
| School Level | # Students | % Students |
| Nursery / Preschool | 49 | 4.5% |
| Kindergarten | 72 | 6.6% |
| Elementary School | 279 | 25.6% |
| Middle School | 207 | 19.0% |
| High School | 153 | 14.0% |
| College / Undergraduate | 300 | 27.5% |
| Graduate / Professional | 31 | 2.8% |
| Total | 1,091 | 100.0% |
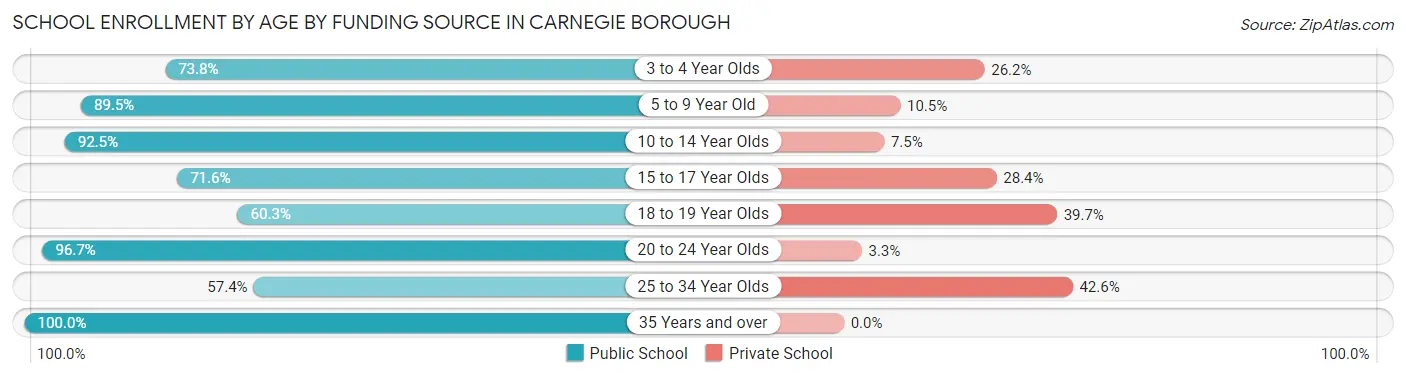
School Enrollment by Age by Funding Source in Carnegie borough
Out of a total of 1,091 students who are enrolled in schools in Carnegie borough, 149 (13.7%) attend a private institution, while the remaining 942 (86.3%) are enrolled in public schools. The age group of 25 to 34 year olds has the highest likelihood of being enrolled in private schools, with 26 (42.6% in the age bracket) enrolled. Conversely, the age group of 35 years and over has the lowest likelihood of being enrolled in a private school, with 143 (100.0% in the age bracket) attending a public institution.
| Age Bracket | Public School | Private School |
| 3 to 4 Year Olds | 31 (73.8%) | 11 (26.2%) |
| 5 to 9 Year Old | 307 (89.5%) | 36 (10.5%) |
| 10 to 14 Year Olds | 222 (92.5%) | 18 (7.5%) |
| 15 to 17 Year Olds | 78 (71.6%) | 31 (28.4%) |
| 18 to 19 Year Olds | 38 (60.3%) | 25 (39.7%) |
| 20 to 24 Year Olds | 87 (96.7%) | 3 (3.3%) |
| 25 to 34 Year Olds | 35 (57.4%) | 26 (42.6%) |
| 35 Years and over | 143 (100.0%) | 0 (0.0%) |
| Total | 942 (86.3%) | 149 (13.7%) |
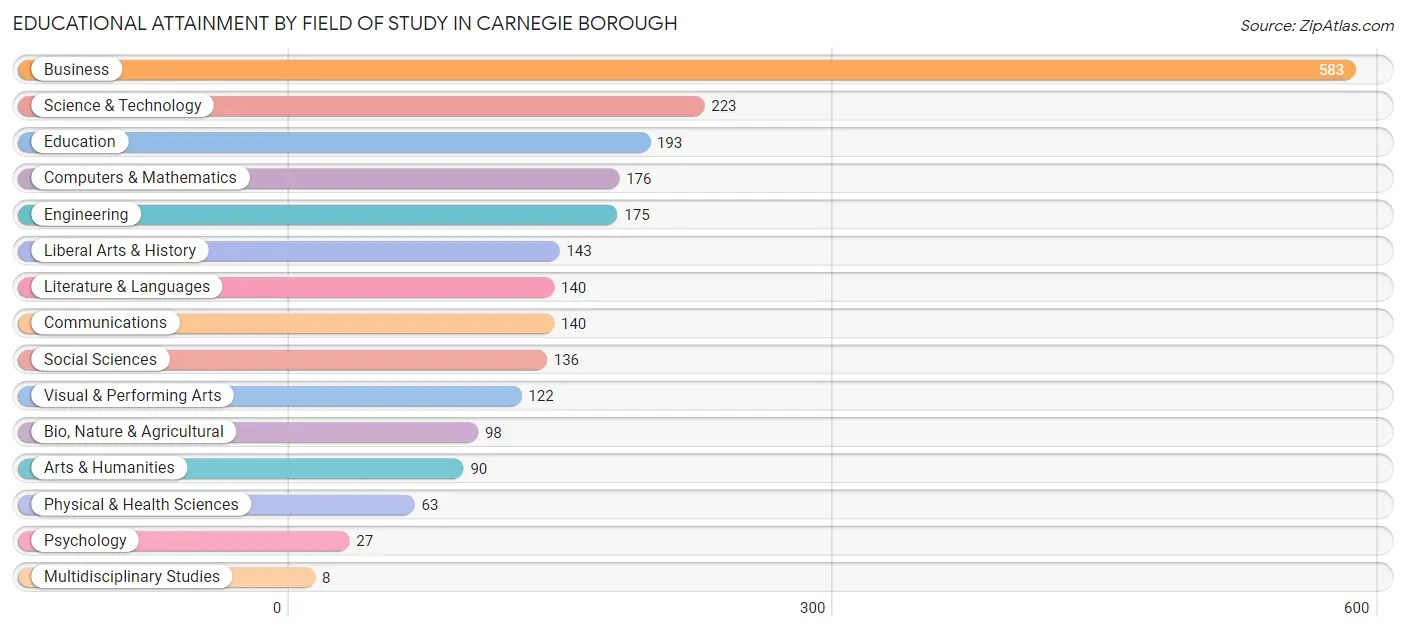
Educational Attainment by Field of Study in Carnegie borough
Business (583 | 25.2%), science & technology (223 | 9.6%), education (193 | 8.3%), computers & mathematics (176 | 7.6%), and engineering (175 | 7.5%) are the most common fields of study among 2,317 individuals in Carnegie borough who have obtained a bachelor's degree or higher.
| Field of Study | # Graduates | % Graduates |
| Computers & Mathematics | 176 | 7.6% |
| Bio, Nature & Agricultural | 98 | 4.2% |
| Physical & Health Sciences | 63 | 2.7% |
| Psychology | 27 | 1.2% |
| Social Sciences | 136 | 5.9% |
| Engineering | 175 | 7.5% |
| Multidisciplinary Studies | 8 | 0.4% |
| Science & Technology | 223 | 9.6% |
| Business | 583 | 25.2% |
| Education | 193 | 8.3% |
| Literature & Languages | 140 | 6.0% |
| Liberal Arts & History | 143 | 6.2% |
| Visual & Performing Arts | 122 | 5.3% |
| Communications | 140 | 6.0% |
| Arts & Humanities | 90 | 3.9% |
| Total | 2,317 | 100.0% |
Transportation & Commute in Carnegie borough
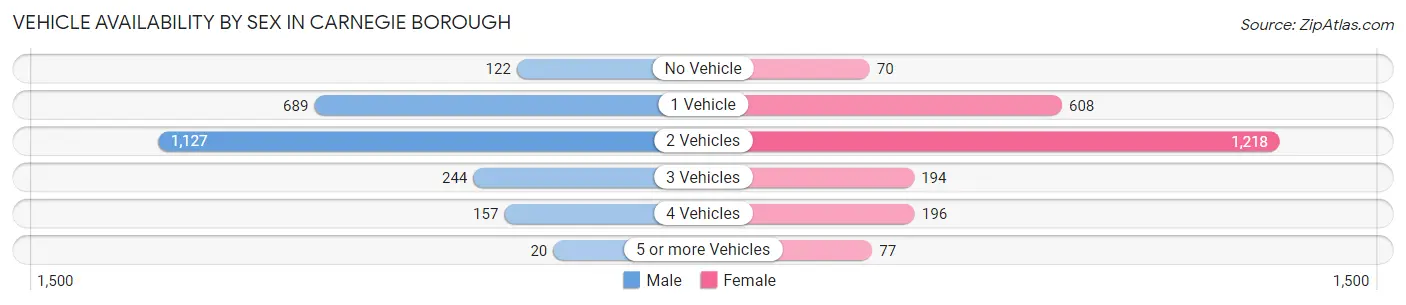
Vehicle Availability by Sex in Carnegie borough
The most prevalent vehicle ownership categories in Carnegie borough are males with 2 vehicles (1,127, accounting for 47.8%) and females with 2 vehicles (1,218, making up 47.7%).
| Vehicles Available | Male | Female |
| No Vehicle | 122 (5.2%) | 70 (3.0%) |
| 1 Vehicle | 689 (29.2%) | 608 (25.7%) |
| 2 Vehicles | 1,127 (47.8%) | 1,218 (51.5%) |
| 3 Vehicles | 244 (10.3%) | 194 (8.2%) |
| 4 Vehicles | 157 (6.7%) | 196 (8.3%) |
| 5 or more Vehicles | 20 (0.9%) | 77 (3.3%) |
| Total | 2,359 (100.0%) | 2,363 (100.0%) |
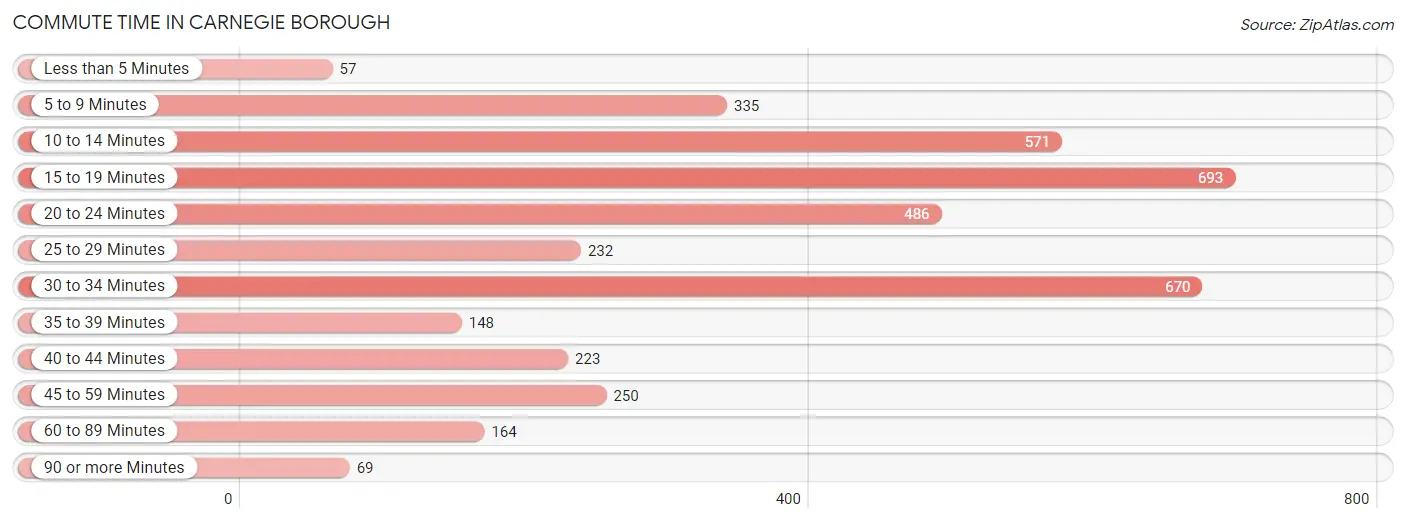
Commute Time in Carnegie borough
The most frequently occuring commute durations in Carnegie borough are 15 to 19 minutes (693 commuters, 17.8%), 30 to 34 minutes (670 commuters, 17.2%), and 10 to 14 minutes (571 commuters, 14.6%).
| Commute Time | # Commuters | % Commuters |
| Less than 5 Minutes | 57 | 1.5% |
| 5 to 9 Minutes | 335 | 8.6% |
| 10 to 14 Minutes | 571 | 14.6% |
| 15 to 19 Minutes | 693 | 17.8% |
| 20 to 24 Minutes | 486 | 12.5% |
| 25 to 29 Minutes | 232 | 5.9% |
| 30 to 34 Minutes | 670 | 17.2% |
| 35 to 39 Minutes | 148 | 3.8% |
| 40 to 44 Minutes | 223 | 5.7% |
| 45 to 59 Minutes | 250 | 6.4% |
| 60 to 89 Minutes | 164 | 4.2% |
| 90 or more Minutes | 69 | 1.8% |
Commute Time by Sex in Carnegie borough
The most common commute times in Carnegie borough are 15 to 19 minutes (376 commuters, 17.7%) for males and 15 to 19 minutes (317 commuters, 17.9%) for females.
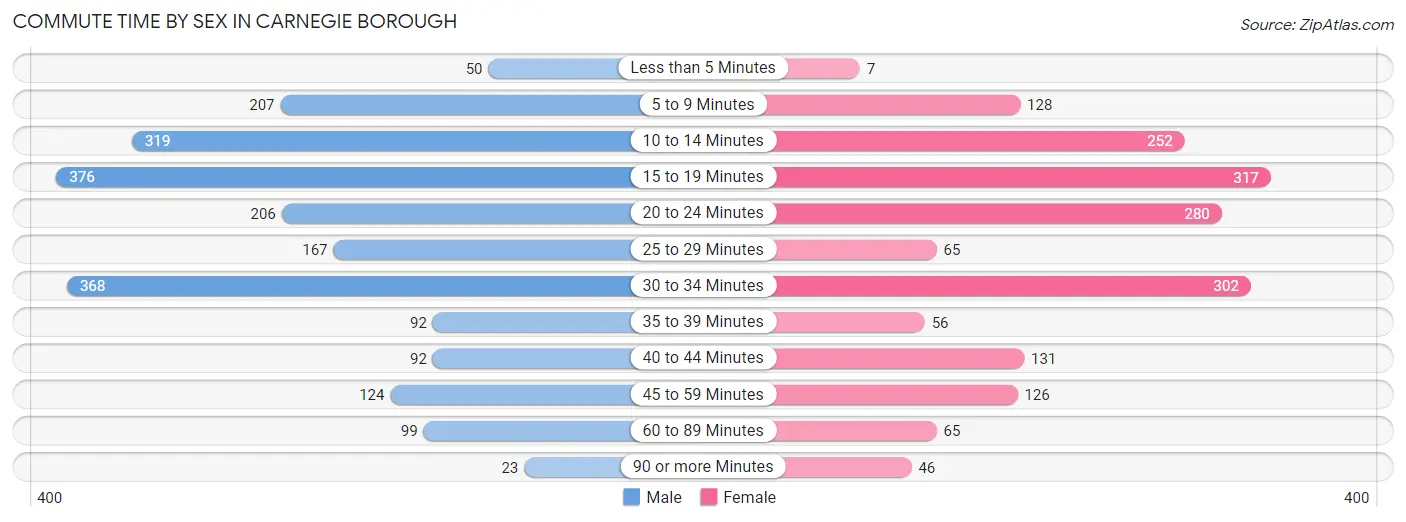
| Commute Time | Male | Female |
| Less than 5 Minutes | 50 (2.4%) | 7 (0.4%) |
| 5 to 9 Minutes | 207 (9.8%) | 128 (7.2%) |
| 10 to 14 Minutes | 319 (15.0%) | 252 (14.2%) |
| 15 to 19 Minutes | 376 (17.7%) | 317 (17.9%) |
| 20 to 24 Minutes | 206 (9.7%) | 280 (15.8%) |
| 25 to 29 Minutes | 167 (7.9%) | 65 (3.7%) |
| 30 to 34 Minutes | 368 (17.3%) | 302 (17.0%) |
| 35 to 39 Minutes | 92 (4.3%) | 56 (3.2%) |
| 40 to 44 Minutes | 92 (4.3%) | 131 (7.4%) |
| 45 to 59 Minutes | 124 (5.8%) | 126 (7.1%) |
| 60 to 89 Minutes | 99 (4.7%) | 65 (3.7%) |
| 90 or more Minutes | 23 (1.1%) | 46 (2.6%) |
Time of Departure to Work by Sex in Carnegie borough
The most frequent times of departure to work in Carnegie borough are 6:30 AM to 6:59 AM (298, 14.0%) for males and 8:00 AM to 8:29 AM (295, 16.6%) for females.
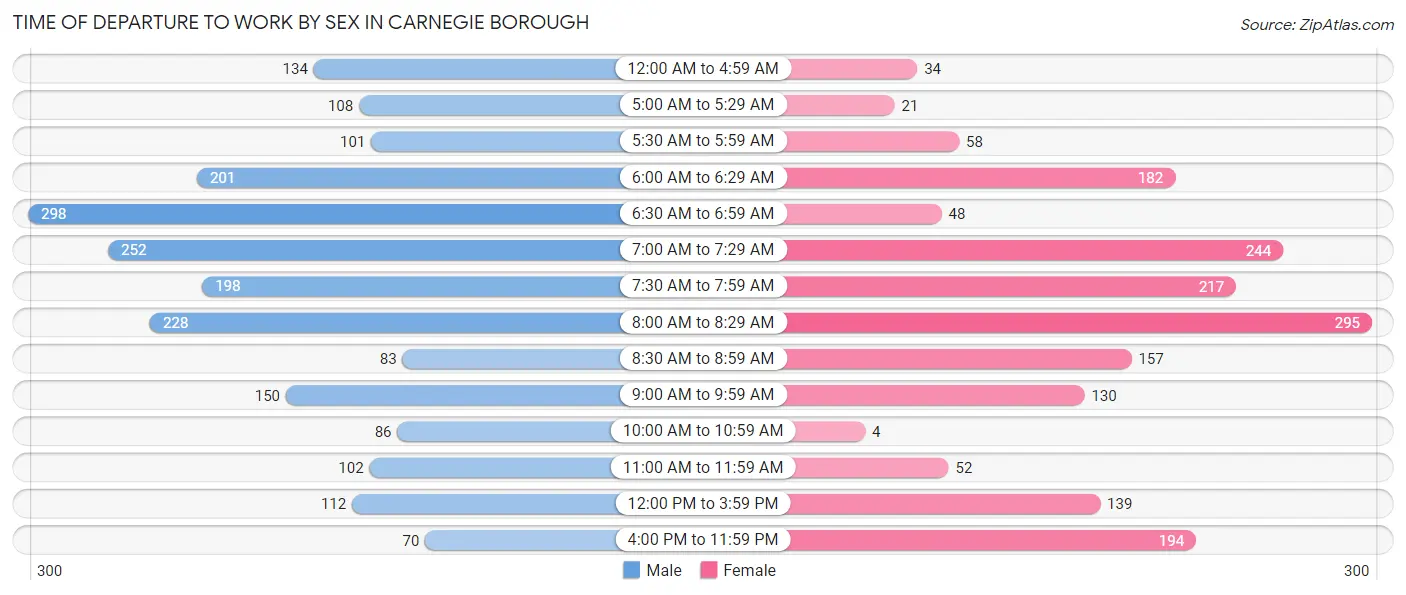
| Time of Departure | Male | Female |
| 12:00 AM to 4:59 AM | 134 (6.3%) | 34 (1.9%) |
| 5:00 AM to 5:29 AM | 108 (5.1%) | 21 (1.2%) |
| 5:30 AM to 5:59 AM | 101 (4.8%) | 58 (3.3%) |
| 6:00 AM to 6:29 AM | 201 (9.5%) | 182 (10.2%) |
| 6:30 AM to 6:59 AM | 298 (14.0%) | 48 (2.7%) |
| 7:00 AM to 7:29 AM | 252 (11.9%) | 244 (13.8%) |
| 7:30 AM to 7:59 AM | 198 (9.3%) | 217 (12.2%) |
| 8:00 AM to 8:29 AM | 228 (10.7%) | 295 (16.6%) |
| 8:30 AM to 8:59 AM | 83 (3.9%) | 157 (8.8%) |
| 9:00 AM to 9:59 AM | 150 (7.1%) | 130 (7.3%) |
| 10:00 AM to 10:59 AM | 86 (4.1%) | 4 (0.2%) |
| 11:00 AM to 11:59 AM | 102 (4.8%) | 52 (2.9%) |
| 12:00 PM to 3:59 PM | 112 (5.3%) | 139 (7.8%) |
| 4:00 PM to 11:59 PM | 70 (3.3%) | 194 (10.9%) |
| Total | 2,123 (100.0%) | 1,775 (100.0%) |
Housing Occupancy in Carnegie borough
Occupancy by Ownership in Carnegie borough
Of the total 4,074 dwellings in Carnegie borough, owner-occupied units account for 2,293 (56.3%), while renter-occupied units make up 1,781 (43.7%).
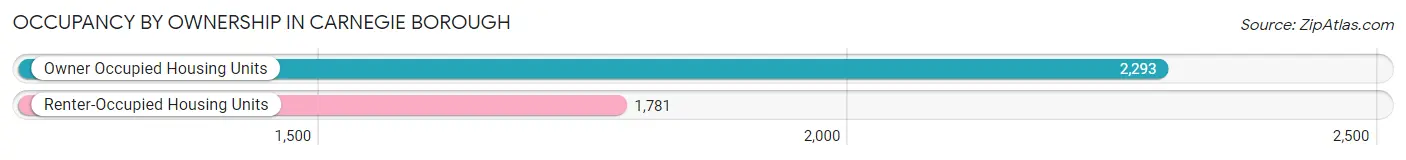
| Occupancy | # Housing Units | % Housing Units |
| Owner Occupied Housing Units | 2,293 | 56.3% |
| Renter-Occupied Housing Units | 1,781 | 43.7% |
| Total Occupied Housing Units | 4,074 | 100.0% |
Occupancy by Household Size in Carnegie borough
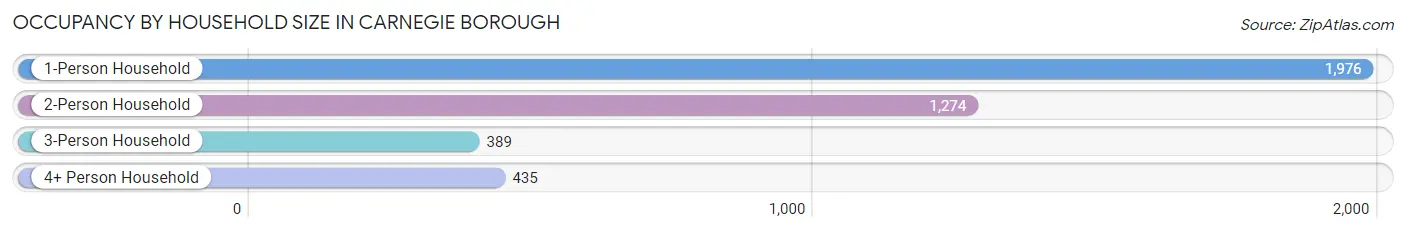
| Household Size | # Housing Units | % Housing Units |
| 1-Person Household | 1,976 | 48.5% |
| 2-Person Household | 1,274 | 31.3% |
| 3-Person Household | 389 | 9.6% |
| 4+ Person Household | 435 | 10.7% |
| Total Housing Units | 4,074 | 100.0% |
Occupancy by Ownership by Household Size in Carnegie borough
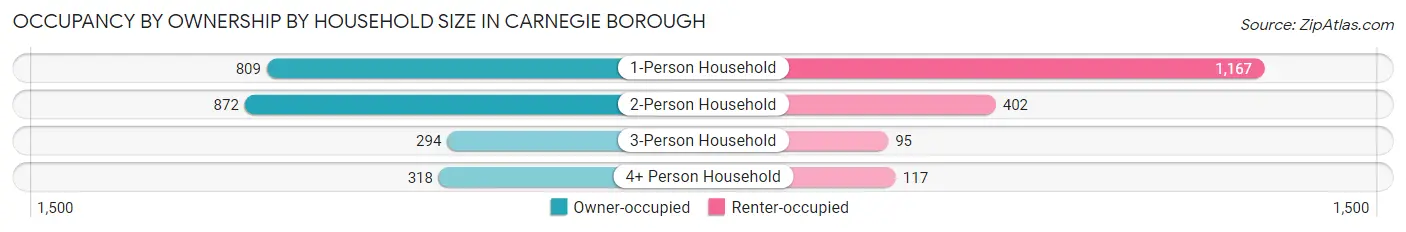
| Household Size | Owner-occupied | Renter-occupied |
| 1-Person Household | 809 (40.9%) | 1,167 (59.1%) |
| 2-Person Household | 872 (68.4%) | 402 (31.6%) |
| 3-Person Household | 294 (75.6%) | 95 (24.4%) |
| 4+ Person Household | 318 (73.1%) | 117 (26.9%) |
| Total Housing Units | 2,293 (56.3%) | 1,781 (43.7%) |
Occupancy by Educational Attainment in Carnegie borough
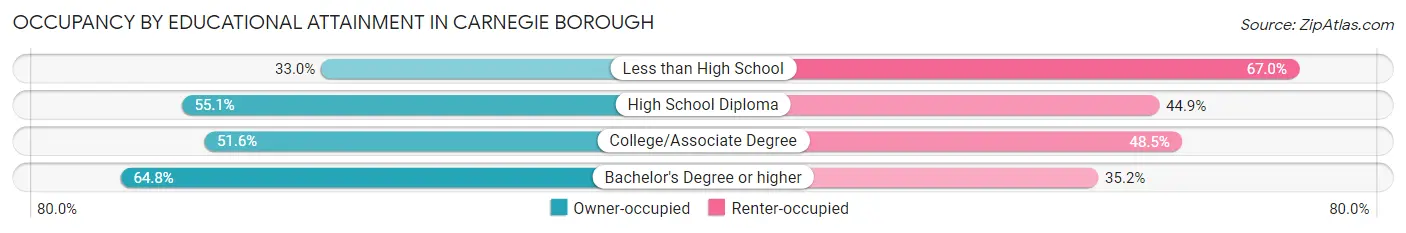
| Household Size | Owner-occupied | Renter-occupied |
| Less than High School | 60 (33.0%) | 122 (67.0%) |
| High School Diploma | 673 (55.1%) | 548 (44.9%) |
| College/Associate Degree | 664 (51.5%) | 624 (48.4%) |
| Bachelor's Degree or higher | 896 (64.8%) | 487 (35.2%) |
Occupancy by Age of Householder in Carnegie borough
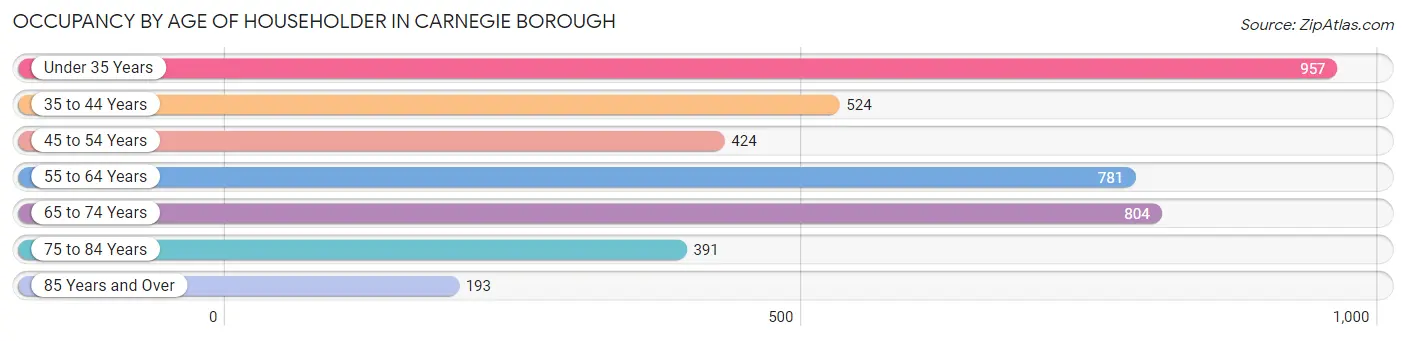
| Age Bracket | # Households | % Households |
| Under 35 Years | 957 | 23.5% |
| 35 to 44 Years | 524 | 12.9% |
| 45 to 54 Years | 424 | 10.4% |
| 55 to 64 Years | 781 | 19.2% |
| 65 to 74 Years | 804 | 19.7% |
| 75 to 84 Years | 391 | 9.6% |
| 85 Years and Over | 193 | 4.7% |
| Total | 4,074 | 100.0% |
Housing Finances in Carnegie borough
Median Income by Occupancy in Carnegie borough
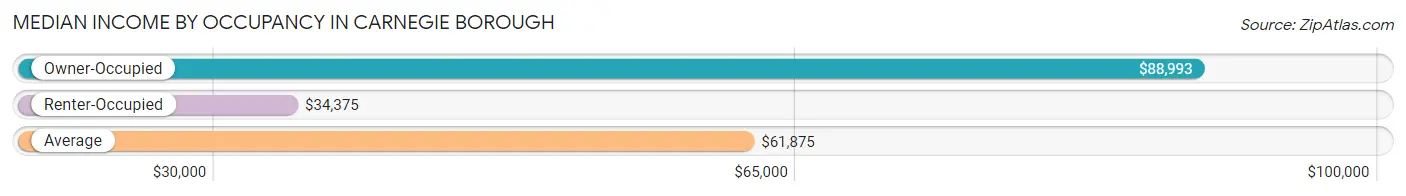
| Occupancy Type | # Households | Median Income |
| Owner-Occupied | 2,293 (56.3%) | $88,993 |
| Renter-Occupied | 1,781 (43.7%) | $34,375 |
| Average | 4,074 (100.0%) | $61,875 |
Occupancy by Householder Income Bracket in Carnegie borough
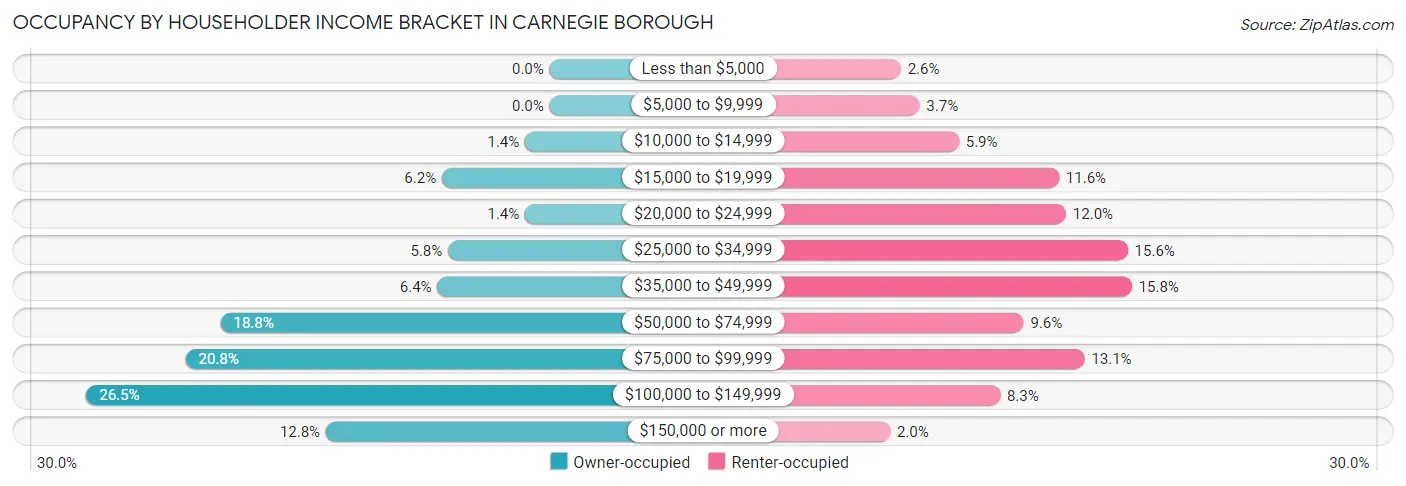
| Income Bracket | Owner-occupied | Renter-occupied |
| Less than $5,000 | 0 (0.0%) | 46 (2.6%) |
| $5,000 to $9,999 | 0 (0.0%) | 65 (3.6%) |
| $10,000 to $14,999 | 32 (1.4%) | 105 (5.9%) |
| $15,000 to $19,999 | 141 (6.1%) | 207 (11.6%) |
| $20,000 to $24,999 | 32 (1.4%) | 214 (12.0%) |
| $25,000 to $34,999 | 133 (5.8%) | 277 (15.5%) |
| $35,000 to $49,999 | 147 (6.4%) | 281 (15.8%) |
| $50,000 to $74,999 | 431 (18.8%) | 171 (9.6%) |
| $75,000 to $99,999 | 477 (20.8%) | 233 (13.1%) |
| $100,000 to $149,999 | 607 (26.5%) | 147 (8.3%) |
| $150,000 or more | 293 (12.8%) | 35 (2.0%) |
| Total | 2,293 (100.0%) | 1,781 (100.0%) |
Monthly Housing Cost Tiers in Carnegie borough
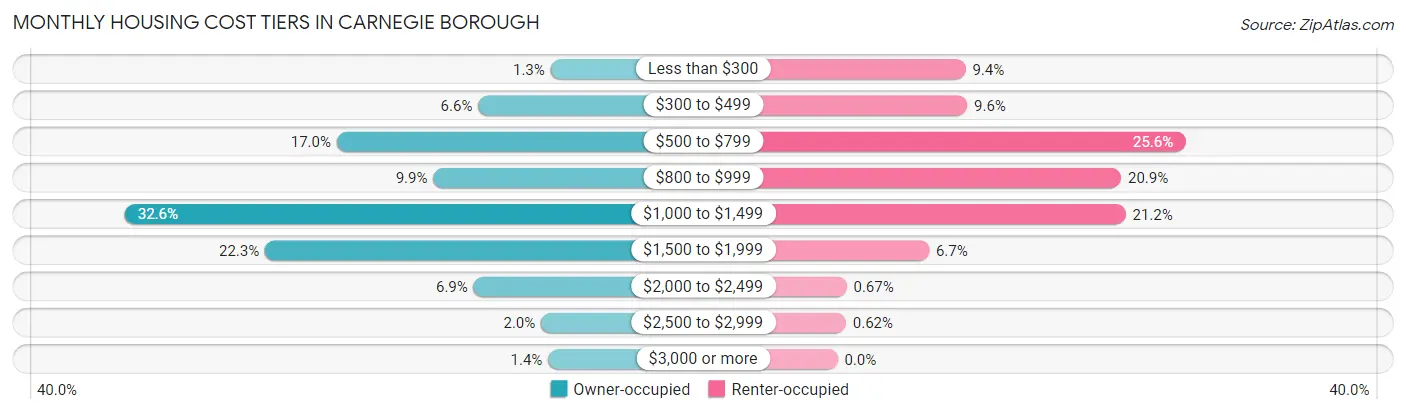
| Monthly Cost | Owner-occupied | Renter-occupied |
| Less than $300 | 29 (1.3%) | 168 (9.4%) |
| $300 to $499 | 151 (6.6%) | 170 (9.6%) |
| $500 to $799 | 390 (17.0%) | 456 (25.6%) |
| $800 to $999 | 227 (9.9%) | 372 (20.9%) |
| $1,000 to $1,499 | 748 (32.6%) | 378 (21.2%) |
| $1,500 to $1,999 | 511 (22.3%) | 120 (6.7%) |
| $2,000 to $2,499 | 159 (6.9%) | 12 (0.7%) |
| $2,500 to $2,999 | 45 (2.0%) | 11 (0.6%) |
| $3,000 or more | 33 (1.4%) | 0 (0.0%) |
| Total | 2,293 (100.0%) | 1,781 (100.0%) |
Physical Housing Characteristics in Carnegie borough
Housing Structures in Carnegie borough
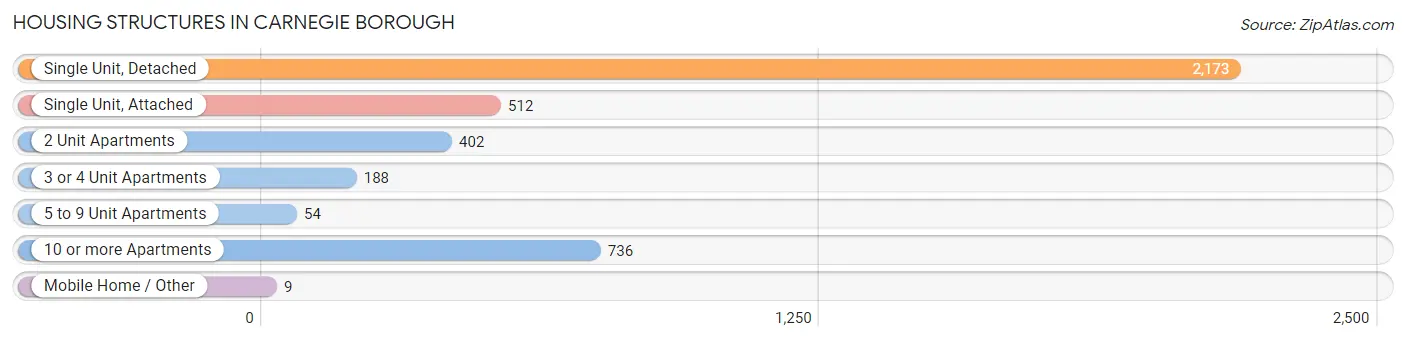
| Structure Type | # Housing Units | % Housing Units |
| Single Unit, Detached | 2,173 | 53.3% |
| Single Unit, Attached | 512 | 12.6% |
| 2 Unit Apartments | 402 | 9.9% |
| 3 or 4 Unit Apartments | 188 | 4.6% |
| 5 to 9 Unit Apartments | 54 | 1.3% |
| 10 or more Apartments | 736 | 18.1% |
| Mobile Home / Other | 9 | 0.2% |
| Total | 4,074 | 100.0% |
Housing Structures by Occupancy in Carnegie borough
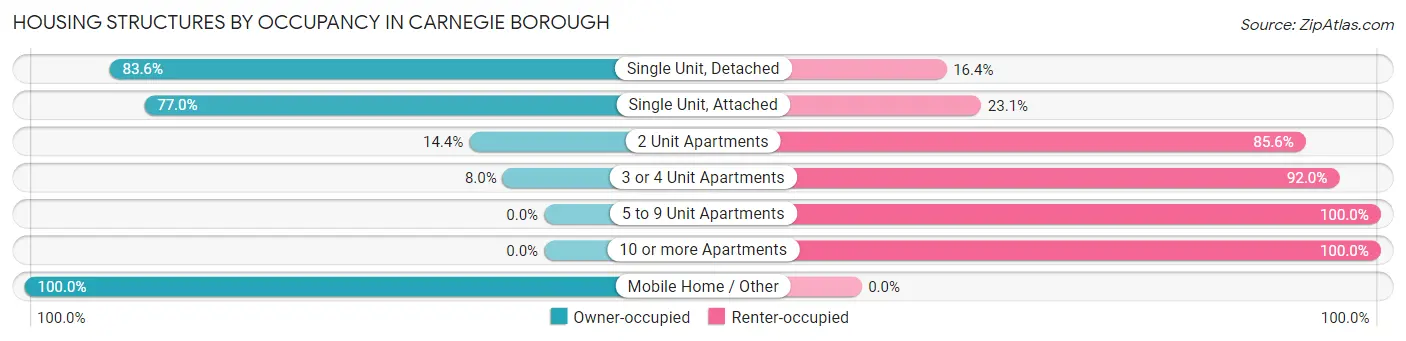
| Structure Type | Owner-occupied | Renter-occupied |
| Single Unit, Detached | 1,817 (83.6%) | 356 (16.4%) |
| Single Unit, Attached | 394 (76.9%) | 118 (23.1%) |
| 2 Unit Apartments | 58 (14.4%) | 344 (85.6%) |
| 3 or 4 Unit Apartments | 15 (8.0%) | 173 (92.0%) |
| 5 to 9 Unit Apartments | 0 (0.0%) | 54 (100.0%) |
| 10 or more Apartments | 0 (0.0%) | 736 (100.0%) |
| Mobile Home / Other | 9 (100.0%) | 0 (0.0%) |
| Total | 2,293 (56.3%) | 1,781 (43.7%) |
Housing Structures by Number of Rooms in Carnegie borough
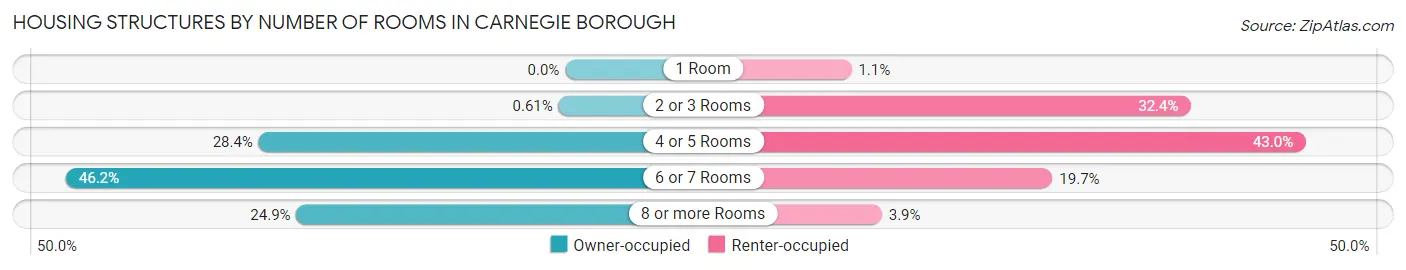
| Number of Rooms | Owner-occupied | Renter-occupied |
| 1 Room | 0 (0.0%) | 19 (1.1%) |
| 2 or 3 Rooms | 14 (0.6%) | 577 (32.4%) |
| 4 or 5 Rooms | 650 (28.3%) | 766 (43.0%) |
| 6 or 7 Rooms | 1,059 (46.2%) | 350 (19.7%) |
| 8 or more Rooms | 570 (24.9%) | 69 (3.9%) |
| Total | 2,293 (100.0%) | 1,781 (100.0%) |
Housing Structure by Heating Type in Carnegie borough
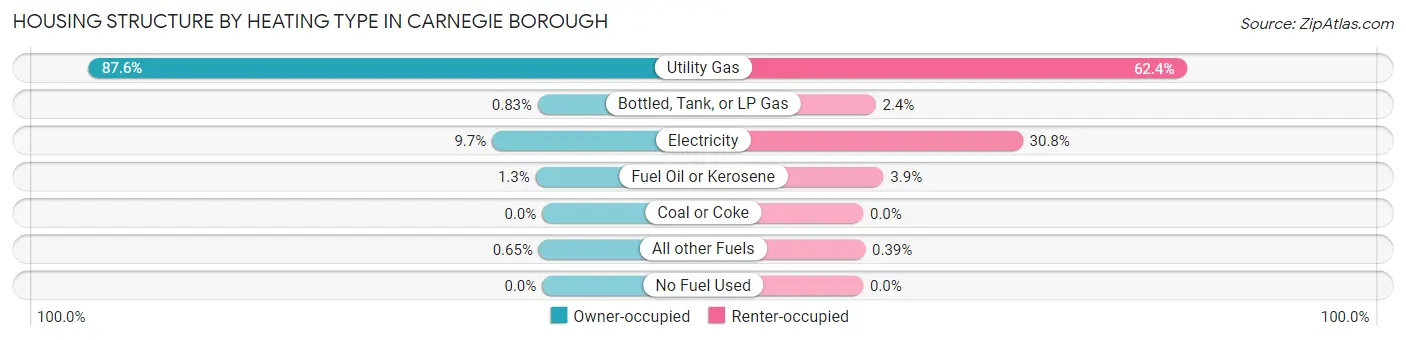
| Heating Type | Owner-occupied | Renter-occupied |
| Utility Gas | 2,008 (87.6%) | 1,112 (62.4%) |
| Bottled, Tank, or LP Gas | 19 (0.8%) | 43 (2.4%) |
| Electricity | 222 (9.7%) | 549 (30.8%) |
| Fuel Oil or Kerosene | 29 (1.3%) | 70 (3.9%) |
| Coal or Coke | 0 (0.0%) | 0 (0.0%) |
| All other Fuels | 15 (0.6%) | 7 (0.4%) |
| No Fuel Used | 0 (0.0%) | 0 (0.0%) |
| Total | 2,293 (100.0%) | 1,781 (100.0%) |
Household Vehicle Usage in Carnegie borough
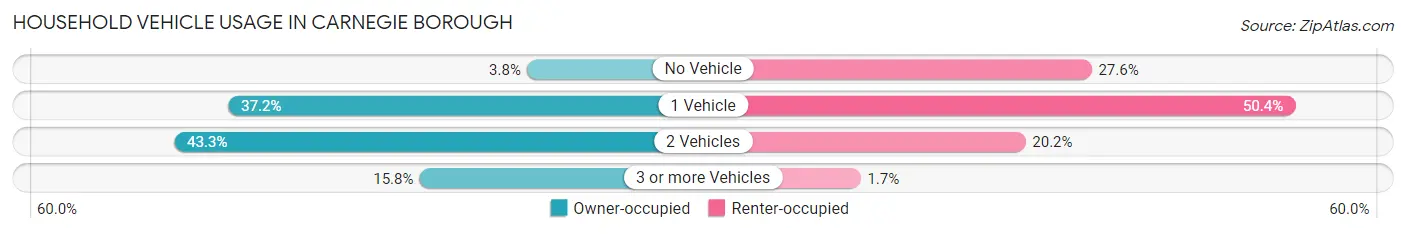
| Vehicles per Household | Owner-occupied | Renter-occupied |
| No Vehicle | 86 (3.7%) | 492 (27.6%) |
| 1 Vehicle | 853 (37.2%) | 898 (50.4%) |
| 2 Vehicles | 992 (43.3%) | 360 (20.2%) |
| 3 or more Vehicles | 362 (15.8%) | 31 (1.7%) |
| Total | 2,293 (100.0%) | 1,781 (100.0%) |
Real Estate & Mortgages in Carnegie borough
Real Estate and Mortgage Overview in Carnegie borough
| Characteristic | Without Mortgage | With Mortgage |
| Housing Units | 739 | 1,554 |
| Median Property Value | $123,900 | $164,400 |
| Median Household Income | $60,160 | $237 |
| Monthly Housing Costs | $647 | $33 |
| Real Estate Taxes | $3,144 | $13 |
Property Value by Mortgage Status in Carnegie borough
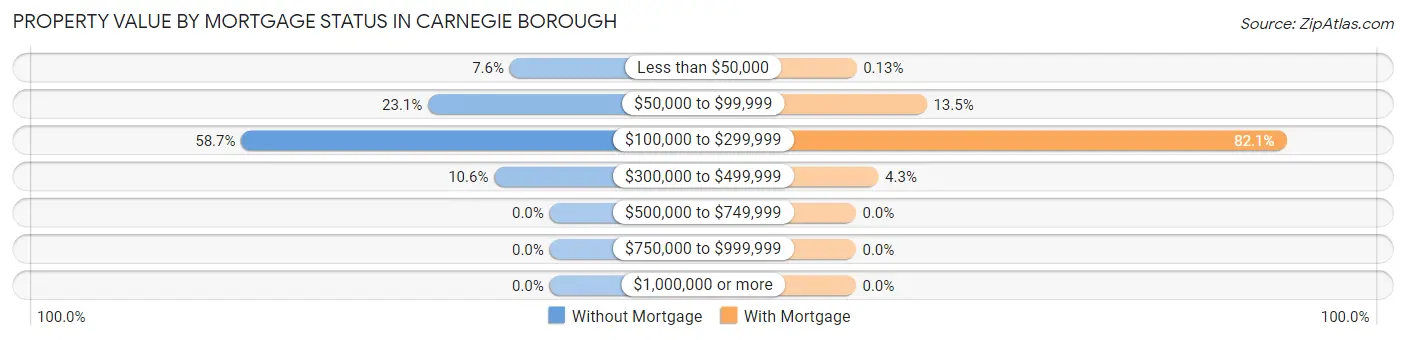
| Property Value | Without Mortgage | With Mortgage |
| Less than $50,000 | 56 (7.6%) | 2 (0.1%) |
| $50,000 to $99,999 | 171 (23.1%) | 210 (13.5%) |
| $100,000 to $299,999 | 434 (58.7%) | 1,275 (82.1%) |
| $300,000 to $499,999 | 78 (10.5%) | 67 (4.3%) |
| $500,000 to $749,999 | 0 (0.0%) | 0 (0.0%) |
| $750,000 to $999,999 | 0 (0.0%) | 0 (0.0%) |
| $1,000,000 or more | 0 (0.0%) | 0 (0.0%) |
| Total | 739 (100.0%) | 1,554 (100.0%) |
Household Income by Mortgage Status in Carnegie borough
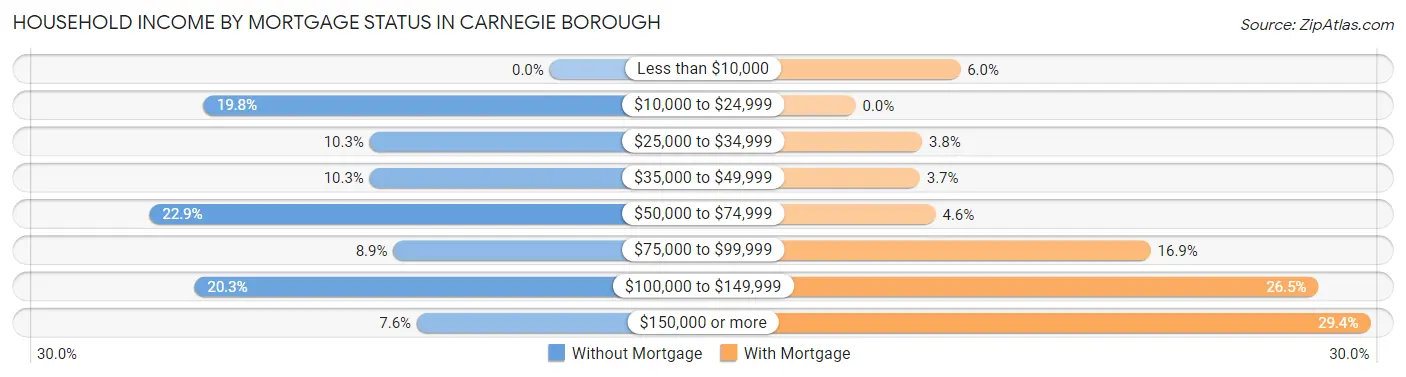
| Household Income | Without Mortgage | With Mortgage |
| Less than $10,000 | 0 (0.0%) | 93 (6.0%) |
| $10,000 to $24,999 | 146 (19.8%) | 0 (0.0%) |
| $25,000 to $34,999 | 76 (10.3%) | 59 (3.8%) |
| $35,000 to $49,999 | 76 (10.3%) | 57 (3.7%) |
| $50,000 to $74,999 | 169 (22.9%) | 71 (4.6%) |
| $75,000 to $99,999 | 66 (8.9%) | 262 (16.9%) |
| $100,000 to $149,999 | 150 (20.3%) | 411 (26.5%) |
| $150,000 or more | 56 (7.6%) | 457 (29.4%) |
| Total | 739 (100.0%) | 1,554 (100.0%) |
Property Value to Household Income Ratio in Carnegie borough
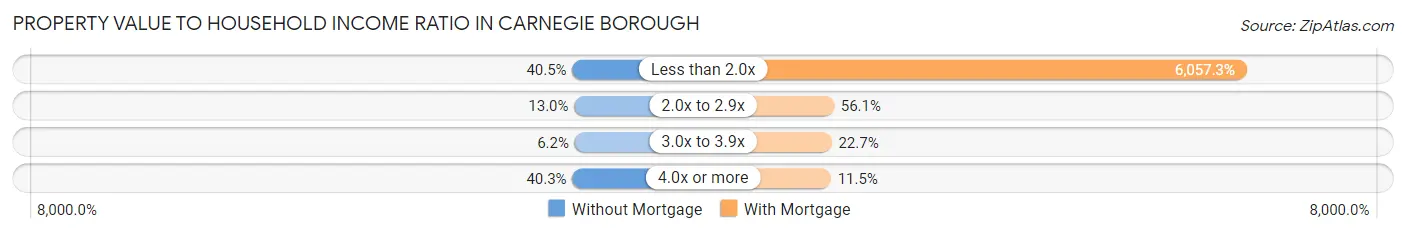
| Value-to-Income Ratio | Without Mortgage | With Mortgage |
| Less than 2.0x | 299 (40.5%) | 94,130 (6,057.3%) |
| 2.0x to 2.9x | 96 (13.0%) | 872 (56.1%) |
| 3.0x to 3.9x | 46 (6.2%) | 352 (22.7%) |
| 4.0x or more | 298 (40.3%) | 179 (11.5%) |
| Total | 739 (100.0%) | 1,554 (100.0%) |
Real Estate Taxes by Mortgage Status in Carnegie borough
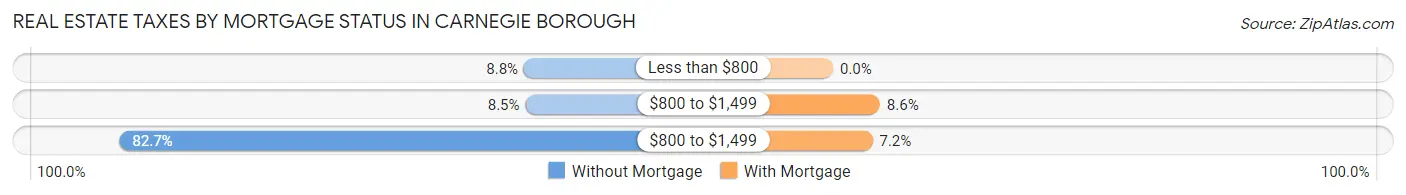
| Property Taxes | Without Mortgage | With Mortgage |
| Less than $800 | 65 (8.8%) | 0 (0.0%) |
| $800 to $1,499 | 63 (8.5%) | 133 (8.6%) |
| $800 to $1,499 | 611 (82.7%) | 112 (7.2%) |
| Total | 739 (100.0%) | 1,554 (100.0%) |
Health & Disability in Carnegie borough
Health Insurance Coverage by Age in Carnegie borough
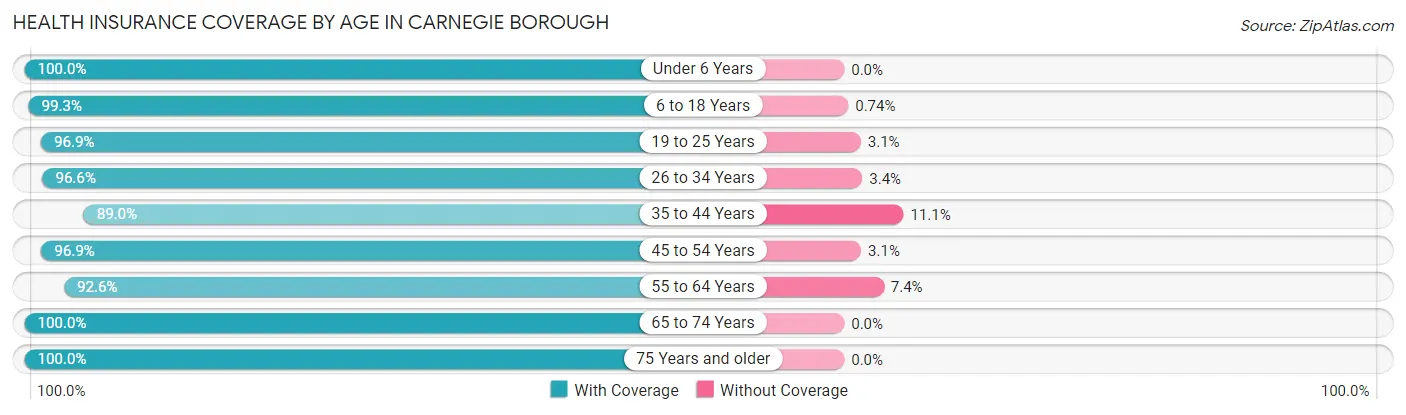
| Age Bracket | With Coverage | Without Coverage |
| Under 6 Years | 674 (100.0%) | 0 (0.0%) |
| 6 to 18 Years | 672 (99.3%) | 5 (0.7%) |
| 19 to 25 Years | 470 (96.9%) | 15 (3.1%) |
| 26 to 34 Years | 1,382 (96.6%) | 48 (3.4%) |
| 35 to 44 Years | 918 (88.9%) | 114 (11.1%) |
| 45 to 54 Years | 772 (96.9%) | 25 (3.1%) |
| 55 to 64 Years | 1,218 (92.6%) | 97 (7.4%) |
| 65 to 74 Years | 978 (100.0%) | 0 (0.0%) |
| 75 Years and older | 679 (100.0%) | 0 (0.0%) |
| Total | 7,763 (96.2%) | 304 (3.8%) |
Health Insurance Coverage by Citizenship Status in Carnegie borough
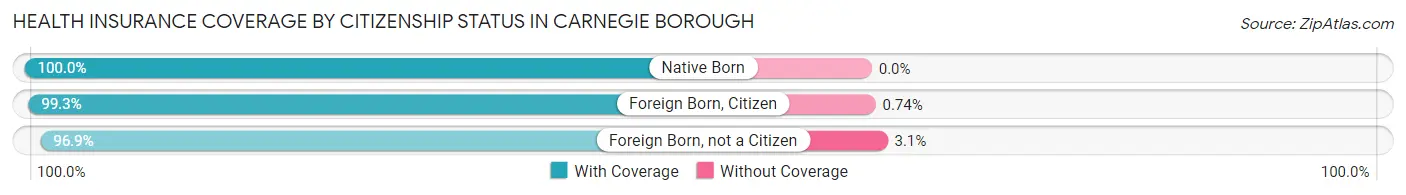
| Citizenship Status | With Coverage | Without Coverage |
| Native Born | 674 (100.0%) | 0 (0.0%) |
| Foreign Born, Citizen | 672 (99.3%) | 5 (0.7%) |
| Foreign Born, not a Citizen | 470 (96.9%) | 15 (3.1%) |
Health Insurance Coverage by Household Income in Carnegie borough
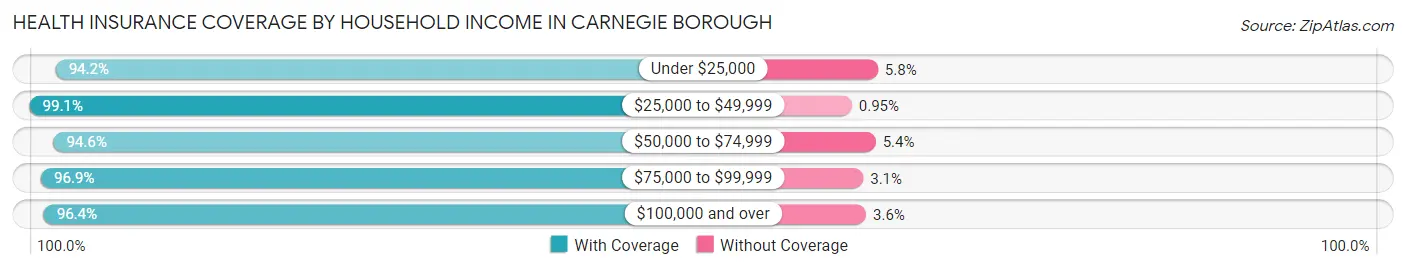
| Household Income | With Coverage | Without Coverage |
| Under $25,000 | 1,243 (94.2%) | 77 (5.8%) |
| $25,000 to $49,999 | 1,142 (99.1%) | 11 (0.9%) |
| $50,000 to $74,999 | 1,134 (94.6%) | 65 (5.4%) |
| $75,000 to $99,999 | 1,443 (96.9%) | 46 (3.1%) |
| $100,000 and over | 2,780 (96.4%) | 104 (3.6%) |
Public vs Private Health Insurance Coverage by Age in Carnegie borough
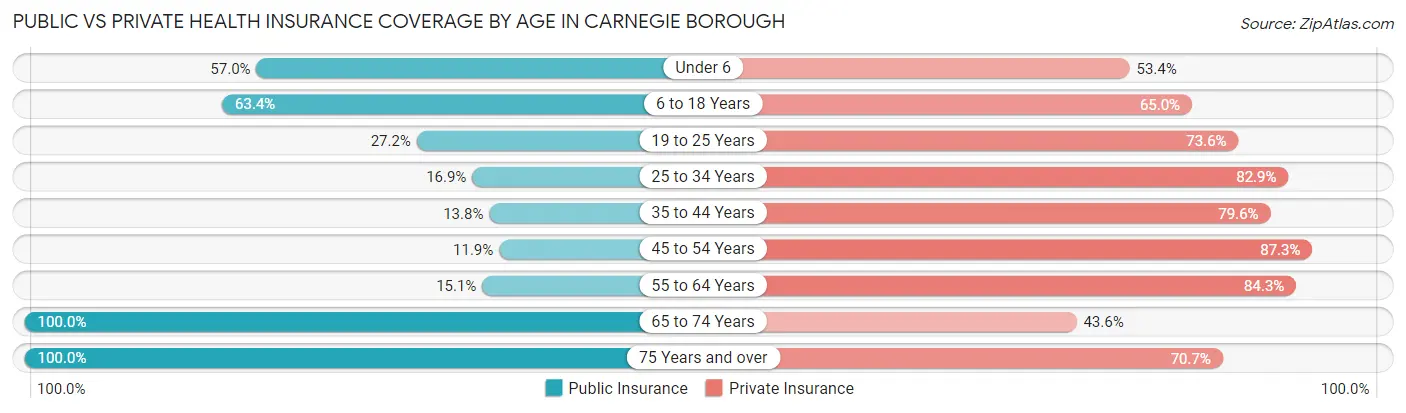
| Age Bracket | Public Insurance | Private Insurance |
| Under 6 | 384 (57.0%) | 360 (53.4%) |
| 6 to 18 Years | 429 (63.4%) | 440 (65.0%) |
| 19 to 25 Years | 132 (27.2%) | 357 (73.6%) |
| 25 to 34 Years | 242 (16.9%) | 1,185 (82.9%) |
| 35 to 44 Years | 142 (13.8%) | 821 (79.5%) |
| 45 to 54 Years | 95 (11.9%) | 696 (87.3%) |
| 55 to 64 Years | 198 (15.1%) | 1,109 (84.3%) |
| 65 to 74 Years | 978 (100.0%) | 426 (43.6%) |
| 75 Years and over | 679 (100.0%) | 480 (70.7%) |
| Total | 3,279 (40.6%) | 5,874 (72.8%) |
Disability Status by Sex by Age in Carnegie borough
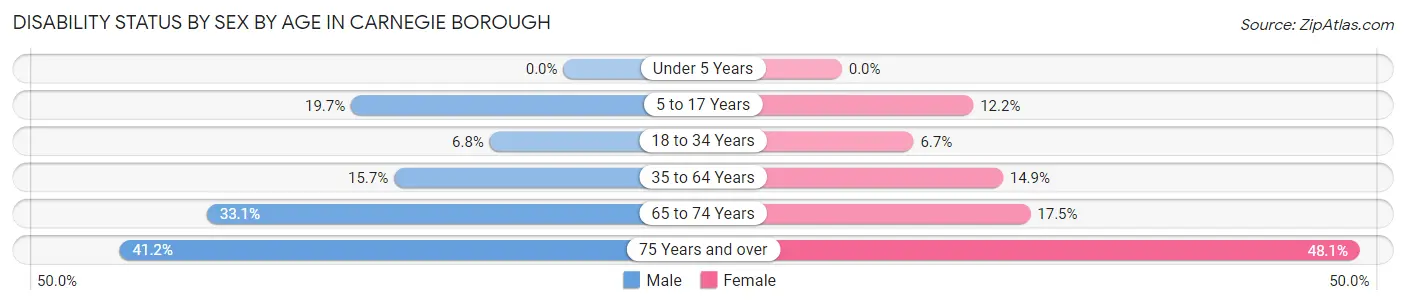
| Age Bracket | Male | Female |
| Under 5 Years | 0 (0.0%) | 0 (0.0%) |
| 5 to 17 Years | 104 (19.7%) | 25 (12.2%) |
| 18 to 34 Years | 72 (6.8%) | 60 (6.7%) |
| 35 to 64 Years | 251 (15.7%) | 231 (14.9%) |
| 65 to 74 Years | 91 (33.1%) | 123 (17.5%) |
| 75 Years and over | 98 (41.2%) | 212 (48.1%) |
Disability Class by Sex by Age in Carnegie borough
Disability Class: Hearing Difficulty
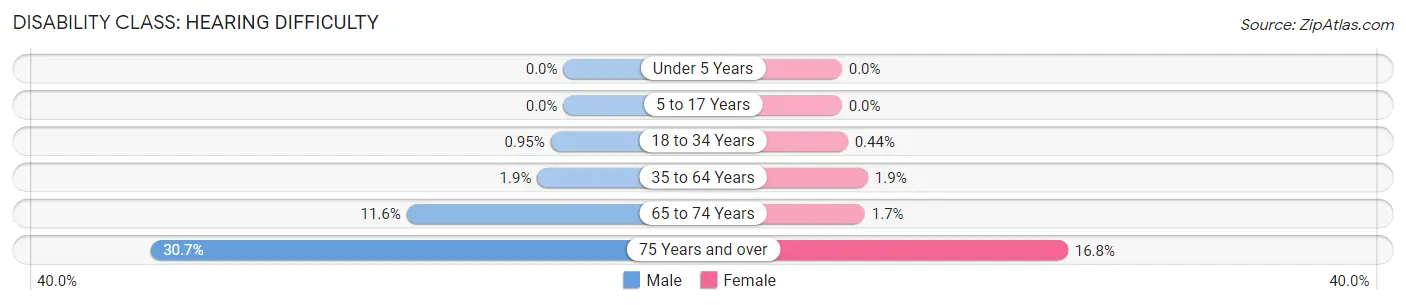
| Age Bracket | Male | Female |
| Under 5 Years | 0 (0.0%) | 0 (0.0%) |
| 5 to 17 Years | 0 (0.0%) | 0 (0.0%) |
| 18 to 34 Years | 10 (0.9%) | 4 (0.4%) |
| 35 to 64 Years | 31 (1.9%) | 30 (1.9%) |
| 65 to 74 Years | 32 (11.6%) | 12 (1.7%) |
| 75 Years and over | 73 (30.7%) | 74 (16.8%) |
Disability Class: Vision Difficulty
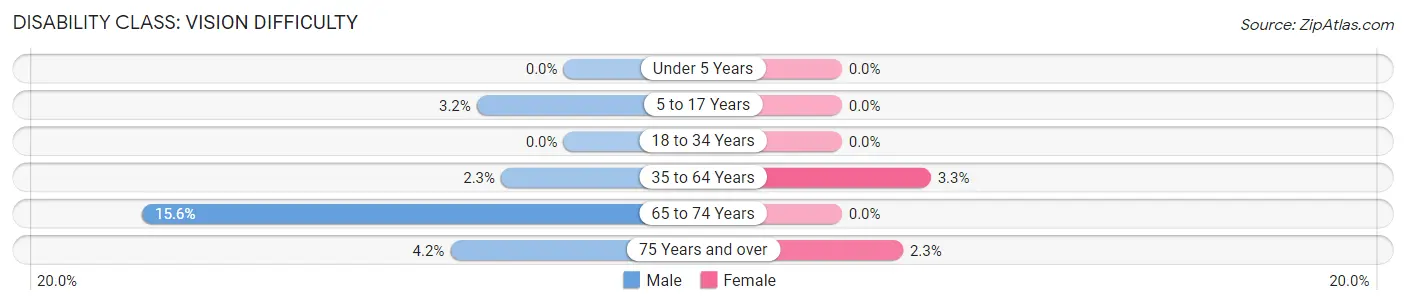
| Age Bracket | Male | Female |
| Under 5 Years | 0 (0.0%) | 0 (0.0%) |
| 5 to 17 Years | 17 (3.2%) | 0 (0.0%) |
| 18 to 34 Years | 0 (0.0%) | 0 (0.0%) |
| 35 to 64 Years | 37 (2.3%) | 51 (3.3%) |
| 65 to 74 Years | 43 (15.6%) | 0 (0.0%) |
| 75 Years and over | 10 (4.2%) | 10 (2.3%) |
Disability Class: Cognitive Difficulty
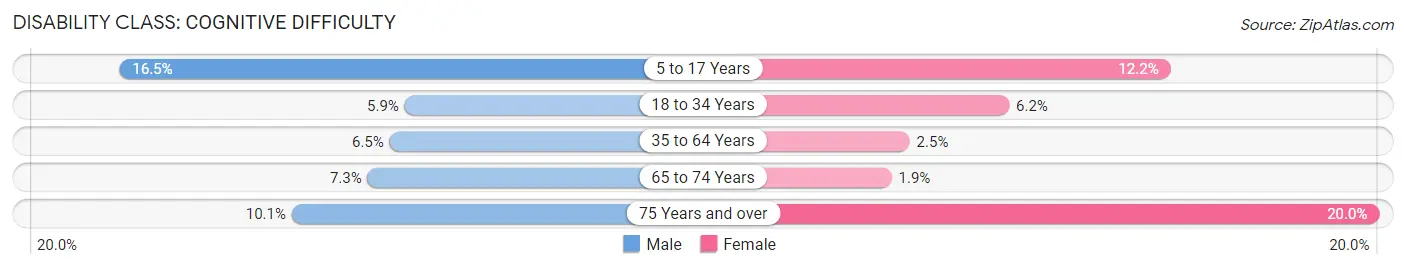
| Age Bracket | Male | Female |
| 5 to 17 Years | 87 (16.5%) | 25 (12.2%) |
| 18 to 34 Years | 62 (5.9%) | 56 (6.2%) |
| 35 to 64 Years | 103 (6.5%) | 39 (2.5%) |
| 65 to 74 Years | 20 (7.3%) | 13 (1.8%) |
| 75 Years and over | 24 (10.1%) | 88 (20.0%) |
Disability Class: Ambulatory Difficulty
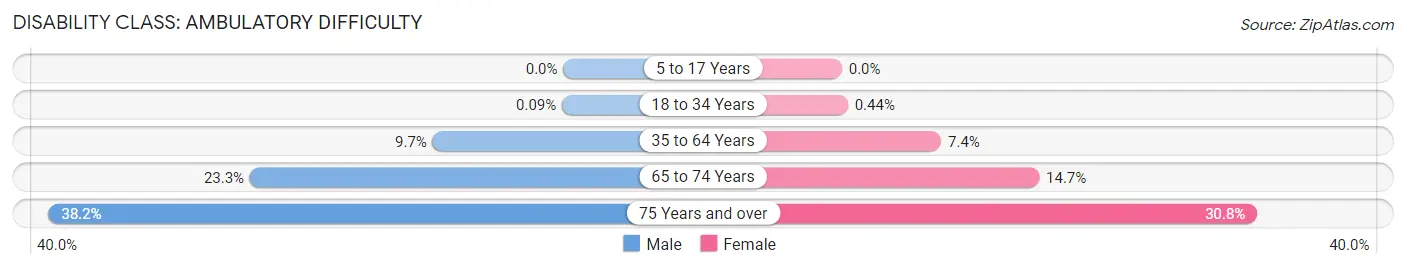
| Age Bracket | Male | Female |
| 5 to 17 Years | 0 (0.0%) | 0 (0.0%) |
| 18 to 34 Years | 1 (0.1%) | 4 (0.4%) |
| 35 to 64 Years | 155 (9.7%) | 114 (7.4%) |
| 65 to 74 Years | 64 (23.3%) | 103 (14.6%) |
| 75 Years and over | 91 (38.2%) | 136 (30.8%) |
Disability Class: Self-Care Difficulty
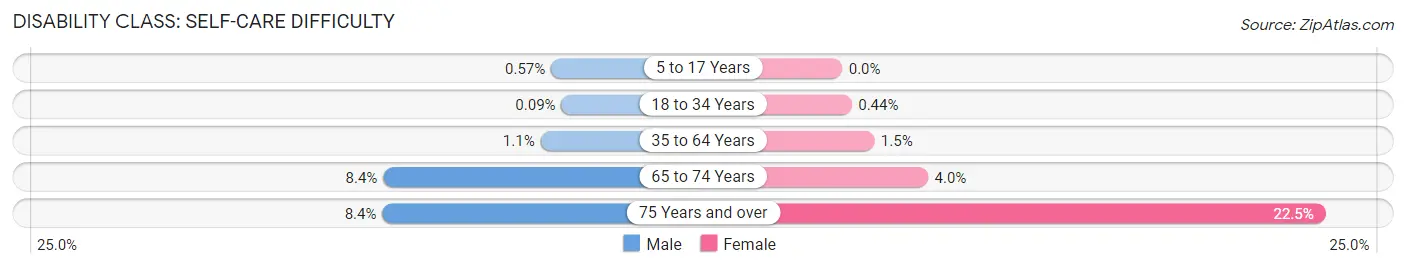
| Age Bracket | Male | Female |
| 5 to 17 Years | 3 (0.6%) | 0 (0.0%) |
| 18 to 34 Years | 1 (0.1%) | 4 (0.4%) |
| 35 to 64 Years | 17 (1.1%) | 23 (1.5%) |
| 65 to 74 Years | 23 (8.4%) | 28 (4.0%) |
| 75 Years and over | 20 (8.4%) | 99 (22.5%) |
Technology Access in Carnegie borough
Computing Device Access in Carnegie borough
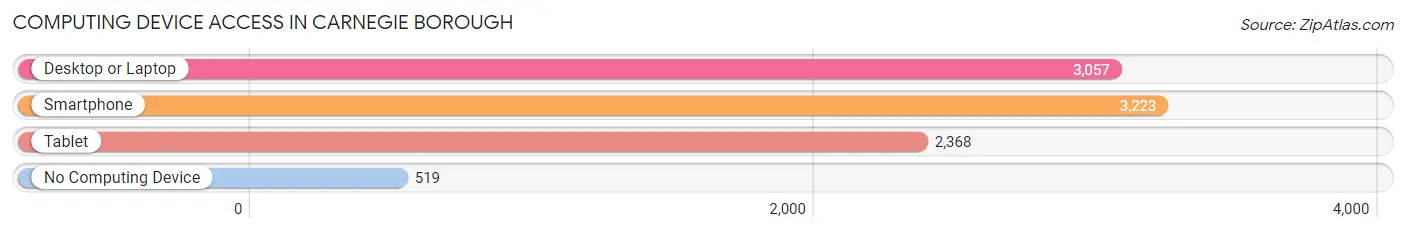
| Device Type | # Households | % Households |
| Desktop or Laptop | 3,057 | 75.0% |
| Smartphone | 3,223 | 79.1% |
| Tablet | 2,368 | 58.1% |
| No Computing Device | 519 | 12.7% |
| Total | 4,074 | 100.0% |
Internet Access in Carnegie borough
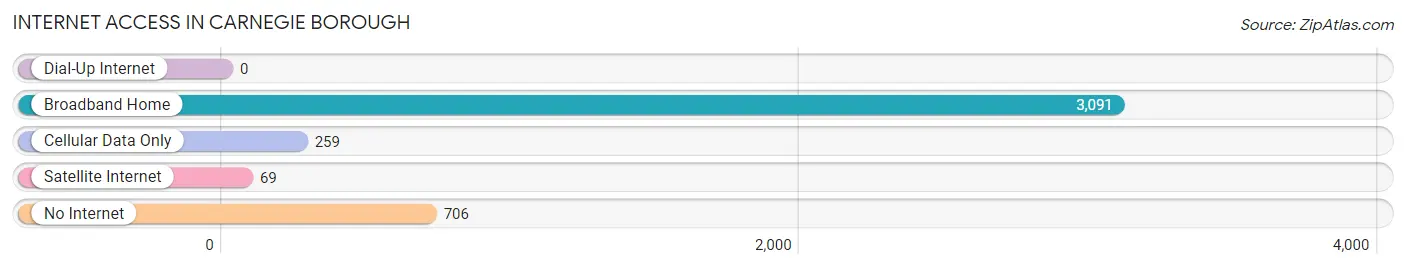
| Internet Type | # Households | % Households |
| Dial-Up Internet | 0 | 0.0% |
| Broadband Home | 3,091 | 75.9% |
| Cellular Data Only | 259 | 6.4% |
| Satellite Internet | 69 | 1.7% |
| No Internet | 706 | 17.3% |
| Total | 4,074 | 100.0% |
Carnegie borough Summary
Carnegie Borough is a small borough located in Allegheny County, Pennsylvania. It is situated approximately 10 miles southwest of Pittsburgh and is part of the Pittsburgh Metropolitan Statistical Area. The borough has a population of approximately 8,000 people and covers an area of 1.2 square miles.
History
Carnegie Borough was founded in 1894 by Andrew Carnegie, a Scottish-American industrialist and philanthropist. Carnegie had purchased the land from the estate of William Thaw, a prominent Pittsburgh businessman. Carnegie named the borough after himself and it was incorporated in 1895.
The borough was originally a rural farming community, but it quickly developed into an industrial center. Carnegie Steel Company, which was founded by Andrew Carnegie in 1892, was located in the borough and employed many of its residents. The steel mill was the largest employer in the borough and was the main source of income for many of its residents.
In the early 20th century, Carnegie Borough experienced a period of rapid growth. The population increased from 1,000 in 1900 to 8,000 in 1930. This growth was largely due to the influx of immigrants from Eastern Europe who were attracted to the borough by the promise of employment in the steel mill.
Geography
Carnegie Borough is located in Allegheny County, Pennsylvania. It is situated approximately 10 miles southwest of Pittsburgh and is part of the Pittsburgh Metropolitan Statistical Area. The borough has a total area of 1.2 square miles, all of which is land.
The borough is located in the Allegheny Plateau region of Pennsylvania. The terrain is mostly flat with some rolling hills. The borough is located on the banks of the Allegheny River and is surrounded by the boroughs of Rosslyn Farms, Crafton, and Bridgeville.
Economy
Carnegie Borough’s economy is largely based on the steel industry. The borough is home to the Carnegie Steel Company, which was founded by Andrew Carnegie in 1892. The steel mill is the largest employer in the borough and is the main source of income for many of its residents.
In addition to the steel mill, the borough is home to several other businesses. These include a variety of retail stores, restaurants, and other service-based businesses. The borough also has a number of small manufacturing companies that produce a variety of products.
Demographics
As of the 2010 census, the population of Carnegie Borough was 8,389. The racial makeup of the borough was 94.3% White, 2.3% African American, 0.3% Native American, 0.7% Asian, 0.1% Pacific Islander, and 2.3% from two or more races. Hispanic or Latino of any race were 1.3% of the population.
The median household income in Carnegie Borough was $45,945 in 2010. The per capita income was $22,945. About 8.3% of the population was below the poverty line.
Carnegie Borough is a small borough with a rich history and a diverse population. It is home to the Carnegie Steel Company, which is the largest employer in the borough and is the main source of income for many of its residents. The borough also has a variety of other businesses and is home to a diverse population.
Common Questions
What is Per Capita Income in Carnegie borough?
Per Capita income in Carnegie borough is $40,258.
What is the Median Family Income in Carnegie borough?
Median Family Income in Carnegie borough is $94,261.
What is the Median Household income in Carnegie borough?
Median Household Income in Carnegie borough is $61,875.
What is Income or Wage Gap in Carnegie borough?
Income or Wage Gap in Carnegie borough is 8.8%.
Women in Carnegie borough earn 91.2 cents for every dollar earned by a man.
What is Inequality or Gini Index in Carnegie borough?
Inequality or Gini Index in Carnegie borough is 0.42.
What is the Total Population of Carnegie borough?
Total Population of Carnegie borough is 8,067.
What is the Total Male Population of Carnegie borough?
Total Male Population of Carnegie borough is 4,087.
What is the Total Female Population of Carnegie borough?
Total Female Population of Carnegie borough is 3,980.
What is the Ratio of Males per 100 Females in Carnegie borough?
There are 102.69 Males per 100 Females in Carnegie borough.
What is the Ratio of Females per 100 Males in Carnegie borough?
There are 97.38 Females per 100 Males in Carnegie borough.
What is the Median Population Age in Carnegie borough?
Median Population Age in Carnegie borough is 40.4 Years.
What is the Average Family Size in Carnegie borough
Average Family Size in Carnegie borough is 2.9 People.
What is the Average Household Size in Carnegie borough
Average Household Size in Carnegie borough is 2.0 People.
How Large is the Labor Force in Carnegie borough?
There are 4,981 People in the Labor Forcein in Carnegie borough.
What is the Percentage of People in the Labor Force in Carnegie borough?
73.0% of People are in the Labor Force in Carnegie borough.
What is the Unemployment Rate in Carnegie borough?
Unemployment Rate in Carnegie borough is 3.1%.