Canton borough, PA Map & Demographics
Canton borough Overview
$23,316
PER CAPITA INCOME
$56,635
AVG FAMILY INCOME
$41,000
AVG HOUSEHOLD INCOME
55.4%
WAGE / INCOME GAP [ % ]
44.6¢/ $1
WAGE / INCOME GAP [ $ ]
0.43
INEQUALITY / GINI INDEX
1,791
TOTAL POPULATION
821
MALE POPULATION
970
FEMALE POPULATION
84.64
MALES / 100 FEMALES
118.15
FEMALES / 100 MALES
34.2
MEDIAN AGE
3.1
AVG FAMILY SIZE
2.4
AVG HOUSEHOLD SIZE
749
LABOR FORCE [ PEOPLE ]
55.6%
PERCENT IN LABOR FORCE
6.0%
UNEMPLOYMENT RATE
Income in Canton borough
Income Overview in Canton borough
Per Capita Income in Canton borough is $23,316, while median incomes of families and households are $56,635 and $41,000 respectively.
| Characteristic | Number | Measure |
| Per Capita Income | 1,791 | $23,316 |
| Median Family Income | 465 | $56,635 |
| Mean Family Income | 465 | $70,897 |
| Median Household Income | 756 | $41,000 |
| Mean Household Income | 756 | $55,451 |
| Income Deficit | 465 | $0 |
| Wage / Income Gap (%) | 1,791 | 55.44% |
| Wage / Income Gap ($) | 1,791 | 44.56¢ per $1 |
| Gini / Inequality Index | 1,791 | 0.43 |
Earnings by Sex in Canton borough
Average Earnings in Canton borough are $30,567, $39,274 for men and $17,500 for women, a difference of 55.4%.
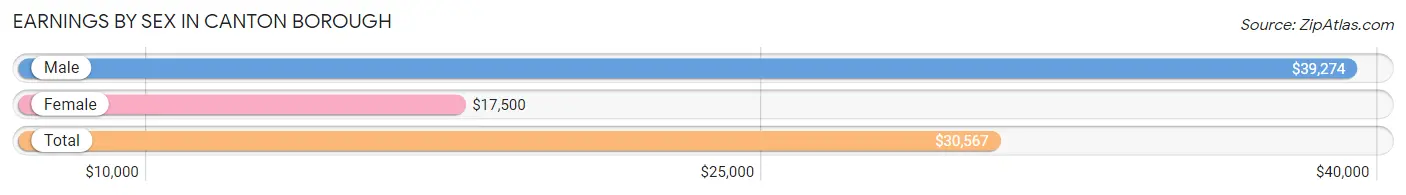
| Sex | Number | Average Earnings |
| Male | 406 (50.0%) | $39,274 |
| Female | 406 (50.0%) | $17,500 |
| Total | 812 (100.0%) | $30,567 |
Earnings by Sex by Income Bracket in Canton borough
The most common earnings brackets in Canton borough are $10,000 to $12,499 for men (51 | 12.6%) and $30,000 to $34,999 for women (74 | 18.2%).
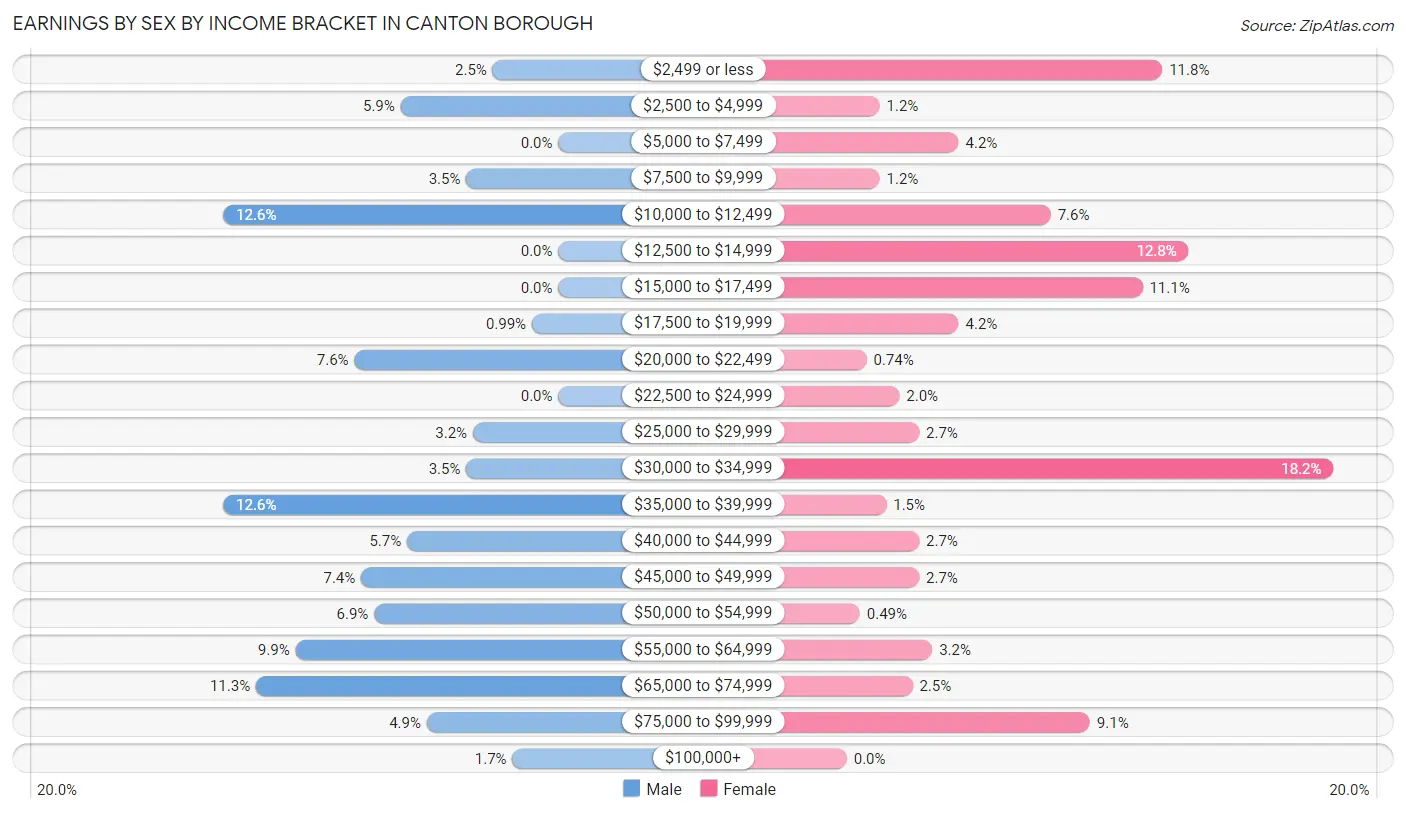
| Income | Male | Female |
| $2,499 or less | 10 (2.5%) | 48 (11.8%) |
| $2,500 to $4,999 | 24 (5.9%) | 5 (1.2%) |
| $5,000 to $7,499 | 0 (0.0%) | 17 (4.2%) |
| $7,500 to $9,999 | 14 (3.5%) | 5 (1.2%) |
| $10,000 to $12,499 | 51 (12.6%) | 31 (7.6%) |
| $12,500 to $14,999 | 0 (0.0%) | 52 (12.8%) |
| $15,000 to $17,499 | 0 (0.0%) | 45 (11.1%) |
| $17,500 to $19,999 | 4 (1.0%) | 17 (4.2%) |
| $20,000 to $22,499 | 31 (7.6%) | 3 (0.7%) |
| $22,500 to $24,999 | 0 (0.0%) | 8 (2.0%) |
| $25,000 to $29,999 | 13 (3.2%) | 11 (2.7%) |
| $30,000 to $34,999 | 14 (3.5%) | 74 (18.2%) |
| $35,000 to $39,999 | 51 (12.6%) | 6 (1.5%) |
| $40,000 to $44,999 | 23 (5.7%) | 11 (2.7%) |
| $45,000 to $49,999 | 30 (7.4%) | 11 (2.7%) |
| $50,000 to $54,999 | 28 (6.9%) | 2 (0.5%) |
| $55,000 to $64,999 | 40 (9.9%) | 13 (3.2%) |
| $65,000 to $74,999 | 46 (11.3%) | 10 (2.5%) |
| $75,000 to $99,999 | 20 (4.9%) | 37 (9.1%) |
| $100,000+ | 7 (1.7%) | 0 (0.0%) |
| Total | 406 (100.0%) | 406 (100.0%) |
Earnings by Sex by Educational Attainment in Canton borough
Average earnings in Canton borough are $47,750 for men and $28,958 for women, a difference of 39.4%. Men with an educational attainment of graduate degree enjoy the highest average annual earnings of $58,667, while those with less than high school education earn the least with $36,058. Women with an educational attainment of graduate degree earn the most with the average annual earnings of $78,194, while those with less than high school education have the smallest earnings of $12,333.
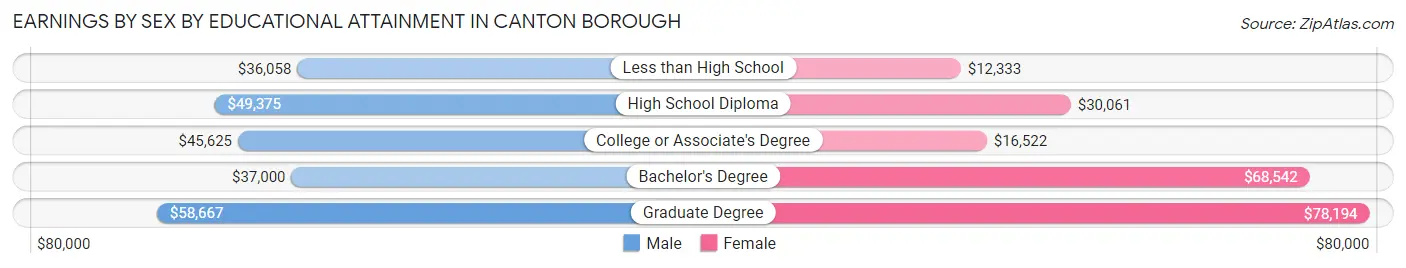
| Educational Attainment | Male Income | Female Income |
| Less than High School | $36,058 | $12,333 |
| High School Diploma | $49,375 | $30,061 |
| College or Associate's Degree | $45,625 | $16,522 |
| Bachelor's Degree | $37,000 | $68,542 |
| Graduate Degree | $58,667 | $78,194 |
| Total | $47,750 | $28,958 |
Family Income in Canton borough
Family Income Brackets in Canton borough
According to the Canton borough family income data, there are 101 families falling into the $50,000 to $74,999 income range, which is the most common income bracket and makes up 21.7% of all families. Conversely, the $150,000 to $199,999 income bracket is the least frequent group with only 15 families (3.2%) belonging to this category.
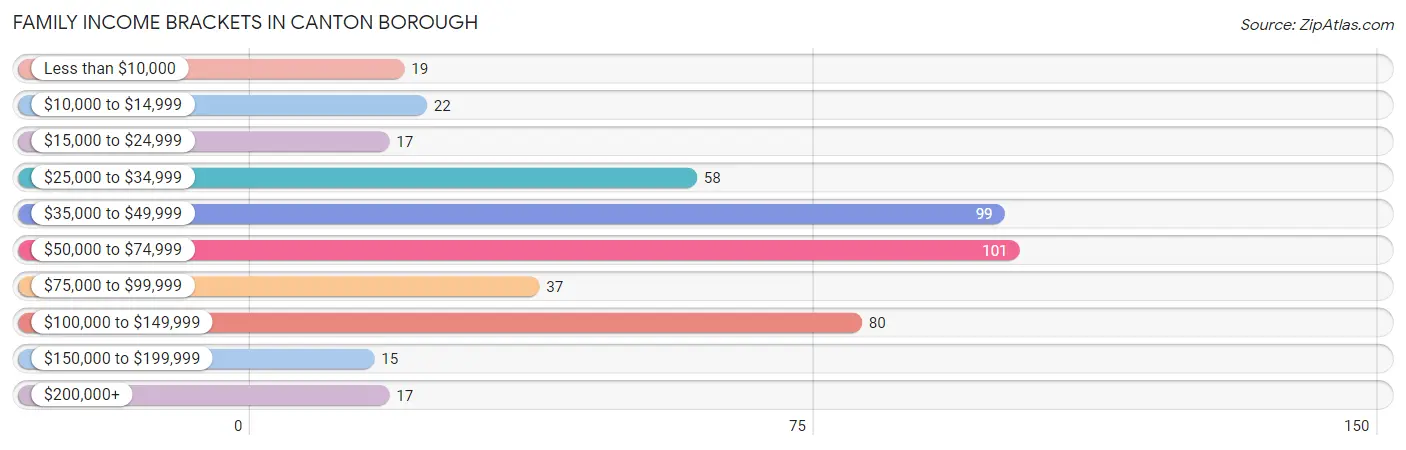
| Income Bracket | # Families | % Families |
| Less than $10,000 | 19 | 4.1% |
| $10,000 to $14,999 | 22 | 4.7% |
| $15,000 to $24,999 | 17 | 3.7% |
| $25,000 to $34,999 | 58 | 12.5% |
| $35,000 to $49,999 | 99 | 21.3% |
| $50,000 to $74,999 | 101 | 21.7% |
| $75,000 to $99,999 | 37 | 8.0% |
| $100,000 to $149,999 | 80 | 17.2% |
| $150,000 to $199,999 | 15 | 3.2% |
| $200,000+ | 17 | 3.7% |
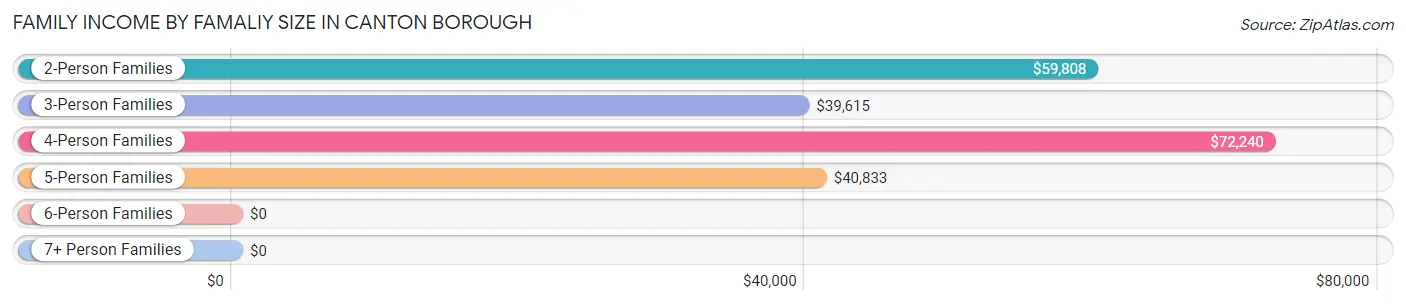
Family Income by Famaliy Size in Canton borough
4-person families (93 | 20.0%) account for the highest median family income in Canton borough with $72,240 per family, while 2-person families (222 | 47.7%) have the highest median income of $29,904 per family member.
| Income Bracket | # Families | Median Income |
| 2-Person Families | 222 (47.7%) | $59,808 |
| 3-Person Families | 66 (14.2%) | $39,615 |
| 4-Person Families | 93 (20.0%) | $72,240 |
| 5-Person Families | 68 (14.6%) | $40,833 |
| 6-Person Families | 7 (1.5%) | $0 |
| 7+ Person Families | 9 (1.9%) | $0 |
| Total | 465 (100.0%) | $56,635 |
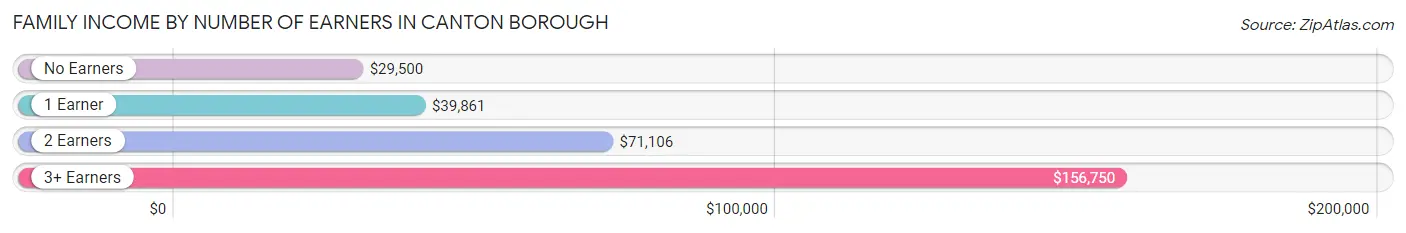
Family Income by Number of Earners in Canton borough
The median family income in Canton borough is $56,635, with families comprising 3+ earners (29) having the highest median family income of $156,750, while families with no earners (64) have the lowest median family income of $29,500, accounting for 6.2% and 13.8% of families, respectively.
| Number of Earners | # Families | Median Income |
| No Earners | 64 (13.8%) | $29,500 |
| 1 Earner | 173 (37.2%) | $39,861 |
| 2 Earners | 199 (42.8%) | $71,106 |
| 3+ Earners | 29 (6.2%) | $156,750 |
| Total | 465 (100.0%) | $56,635 |
Household Income in Canton borough
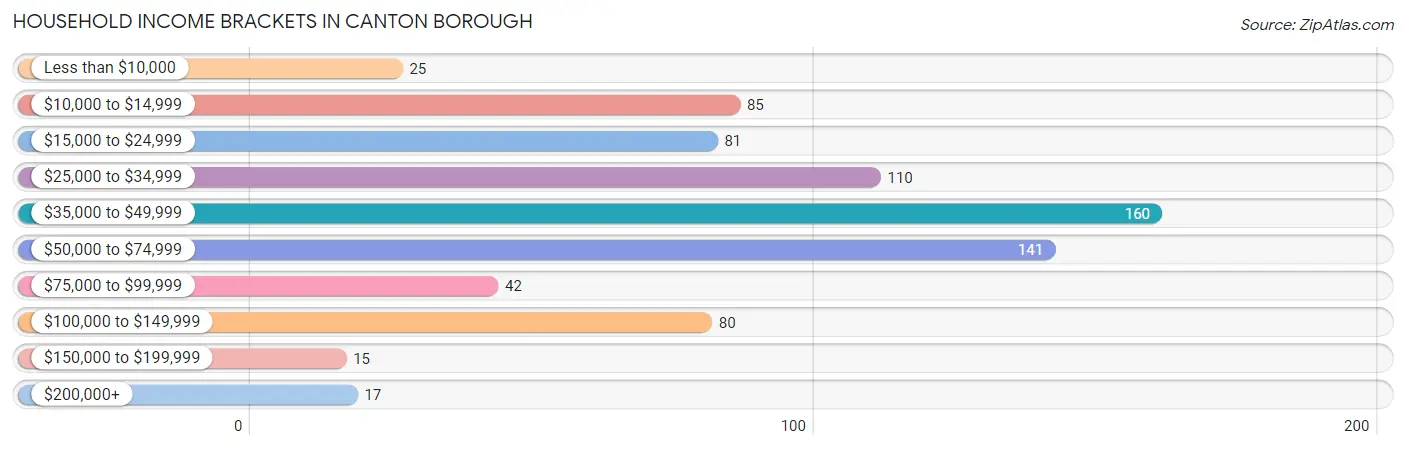
Household Income Brackets in Canton borough
With 160 households falling in the category, the $35,000 to $49,999 income range is the most frequent in Canton borough, accounting for 21.2% of all households. In contrast, only 15 households (2.0%) fall into the $150,000 to $199,999 income bracket, making it the least populous group.
| Income Bracket | # Households | % Households |
| Less than $10,000 | 25 | 3.3% |
| $10,000 to $14,999 | 85 | 11.2% |
| $15,000 to $24,999 | 81 | 10.7% |
| $25,000 to $34,999 | 110 | 14.6% |
| $35,000 to $49,999 | 160 | 21.2% |
| $50,000 to $74,999 | 141 | 18.7% |
| $75,000 to $99,999 | 42 | 5.6% |
| $100,000 to $149,999 | 80 | 10.6% |
| $150,000 to $199,999 | 15 | 2.0% |
| $200,000+ | 17 | 2.2% |
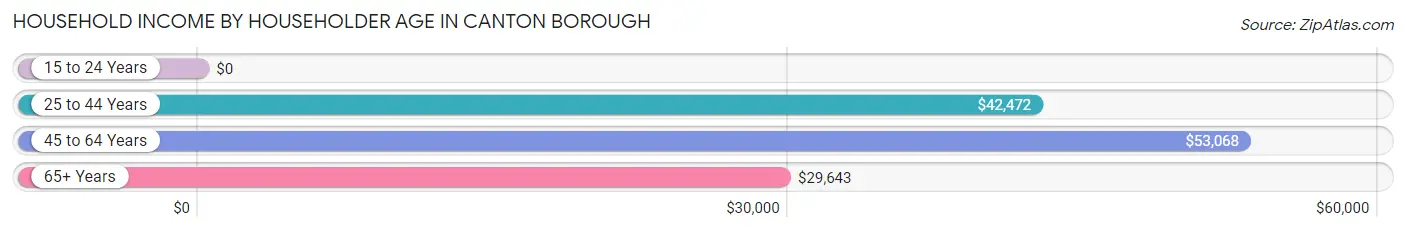
Household Income by Householder Age in Canton borough
The median household income in Canton borough is $41,000, with the highest median household income of $53,068 found in the 45 to 64 years age bracket for the primary householder. A total of 203 households (26.9%) fall into this category. Meanwhile, the 15 to 24 years age bracket for the primary householder has the lowest median household income of $0, with 42 households (5.6%) in this group.
| Income Bracket | # Households | Median Income |
| 15 to 24 Years | 42 (5.6%) | $0 |
| 25 to 44 Years | 253 (33.5%) | $42,472 |
| 45 to 64 Years | 203 (26.9%) | $53,068 |
| 65+ Years | 258 (34.1%) | $29,643 |
| Total | 756 (100.0%) | $41,000 |
Poverty in Canton borough
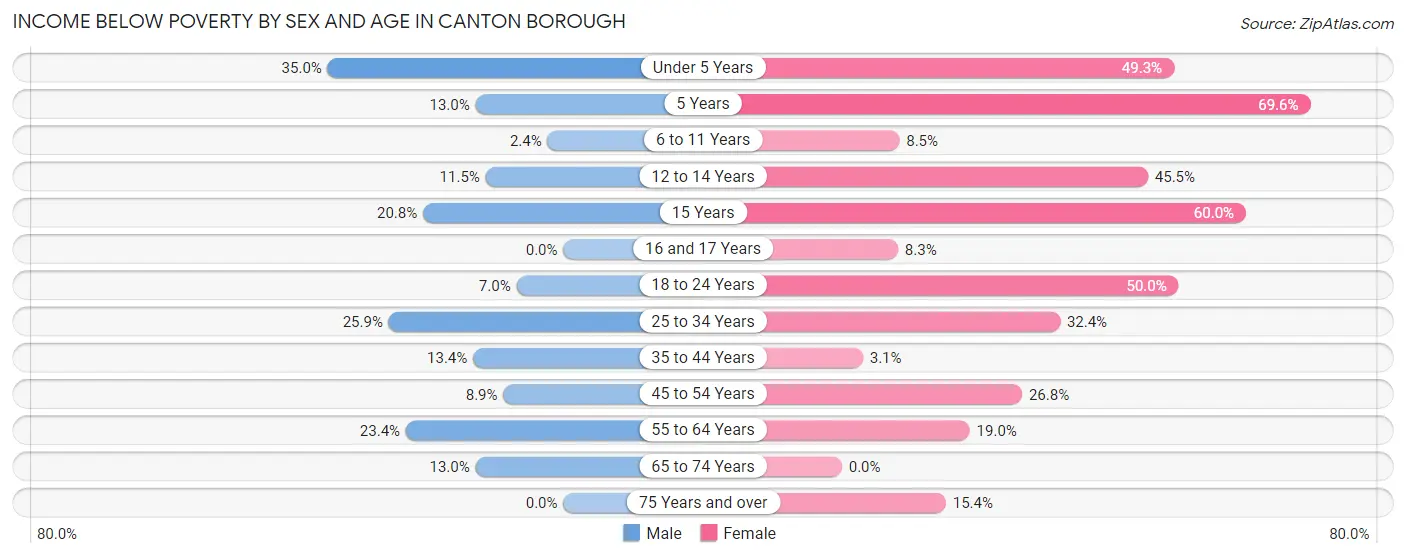
Income Below Poverty by Sex and Age in Canton borough
With 11.9% poverty level for males and 25.1% for females among the residents of Canton borough, under 5 year old males and 5 year old females are the most vulnerable to poverty, with 7 males (35.0%) and 16 females (69.6%) in their respective age groups living below the poverty level.
| Age Bracket | Male | Female |
| Under 5 Years | 7 (35.0%) | 71 (49.3%) |
| 5 Years | 3 (13.0%) | 16 (69.6%) |
| 6 to 11 Years | 2 (2.4%) | 7 (8.5%) |
| 12 to 14 Years | 3 (11.5%) | 5 (45.5%) |
| 15 Years | 5 (20.8%) | 3 (60.0%) |
| 16 and 17 Years | 0 (0.0%) | 2 (8.3%) |
| 18 to 24 Years | 8 (7.0%) | 35 (50.0%) |
| 25 to 34 Years | 21 (25.9%) | 46 (32.4%) |
| 35 to 44 Years | 13 (13.4%) | 3 (3.1%) |
| 45 to 54 Years | 9 (8.9%) | 19 (26.8%) |
| 55 to 64 Years | 18 (23.4%) | 15 (19.0%) |
| 65 to 74 Years | 9 (13.0%) | 0 (0.0%) |
| 75 Years and over | 0 (0.0%) | 21 (15.4%) |
| Total | 98 (11.9%) | 243 (25.1%) |
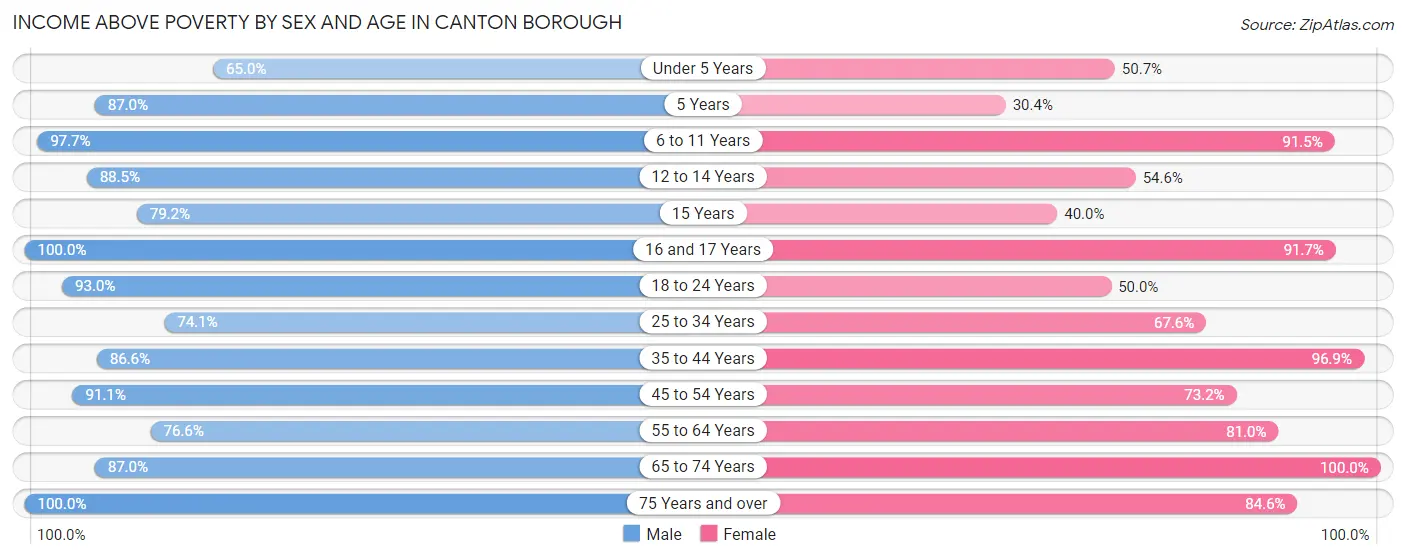
Income Above Poverty by Sex and Age in Canton borough
According to the poverty statistics in Canton borough, males aged 16 and 17 years and females aged 65 to 74 years are the age groups that are most secure financially, with 100.0% of males and 100.0% of females in these age groups living above the poverty line.
| Age Bracket | Male | Female |
| Under 5 Years | 13 (65.0%) | 73 (50.7%) |
| 5 Years | 20 (87.0%) | 7 (30.4%) |
| 6 to 11 Years | 83 (97.7%) | 75 (91.5%) |
| 12 to 14 Years | 23 (88.5%) | 6 (54.5%) |
| 15 Years | 19 (79.2%) | 2 (40.0%) |
| 16 and 17 Years | 35 (100.0%) | 22 (91.7%) |
| 18 to 24 Years | 107 (93.0%) | 35 (50.0%) |
| 25 to 34 Years | 60 (74.1%) | 96 (67.6%) |
| 35 to 44 Years | 84 (86.6%) | 93 (96.9%) |
| 45 to 54 Years | 92 (91.1%) | 52 (73.2%) |
| 55 to 64 Years | 59 (76.6%) | 64 (81.0%) |
| 65 to 74 Years | 60 (87.0%) | 87 (100.0%) |
| 75 Years and over | 68 (100.0%) | 115 (84.6%) |
| Total | 723 (88.1%) | 727 (75.0%) |
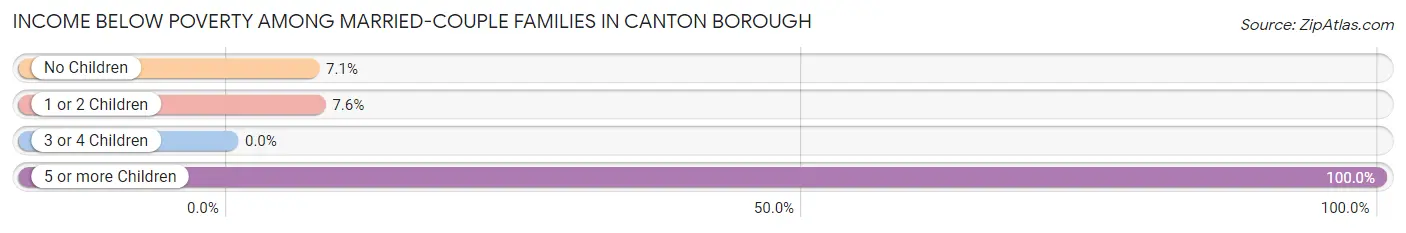
Income Below Poverty Among Married-Couple Families in Canton borough
The poverty statistics for married-couple families in Canton borough show that 7.0% or 22 of the total 312 families live below the poverty line. Families with 5 or more children have the highest poverty rate of 100.0%, comprising of 3 families. On the other hand, families with 3 or 4 children have the lowest poverty rate of 0.0%, which includes 0 families.
| Children | Above Poverty | Below Poverty |
| No Children | 158 (92.9%) | 12 (7.1%) |
| 1 or 2 Children | 85 (92.4%) | 7 (7.6%) |
| 3 or 4 Children | 47 (100.0%) | 0 (0.0%) |
| 5 or more Children | 0 (0.0%) | 3 (100.0%) |
| Total | 290 (92.9%) | 22 (7.0%) |
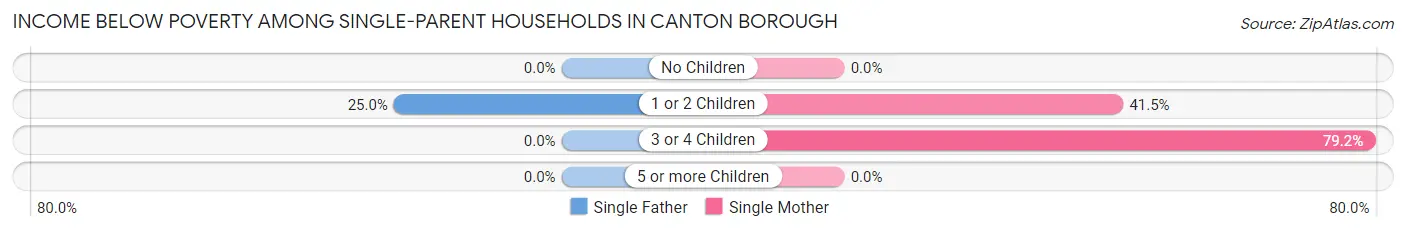
Income Below Poverty Among Single-Parent Households in Canton borough
According to the poverty data in Canton borough, 11.1% or 4 single-father households and 39.3% or 46 single-mother households are living below the poverty line. Among single-father households, those with 1 or 2 children have the highest poverty rate, with 4 households (25.0%) experiencing poverty. Likewise, among single-mother households, those with 3 or 4 children have the highest poverty rate, with 19 households (79.2%) falling below the poverty line.
| Children | Single Father | Single Mother |
| No Children | 0 (0.0%) | 0 (0.0%) |
| 1 or 2 Children | 4 (25.0%) | 27 (41.5%) |
| 3 or 4 Children | 0 (0.0%) | 19 (79.2%) |
| 5 or more Children | 0 (0.0%) | 0 (0.0%) |
| Total | 4 (11.1%) | 46 (39.3%) |
Income Below Poverty Among Married-Couple vs Single-Parent Households in Canton borough
The poverty data for Canton borough shows that 22 of the married-couple family households (7.0%) and 50 of the single-parent households (32.7%) are living below the poverty level. Within the married-couple family households, those with 5 or more children have the highest poverty rate, with 3 households (100.0%) falling below the poverty line. Among the single-parent households, those with 3 or 4 children have the highest poverty rate, with 19 household (79.2%) living below poverty.
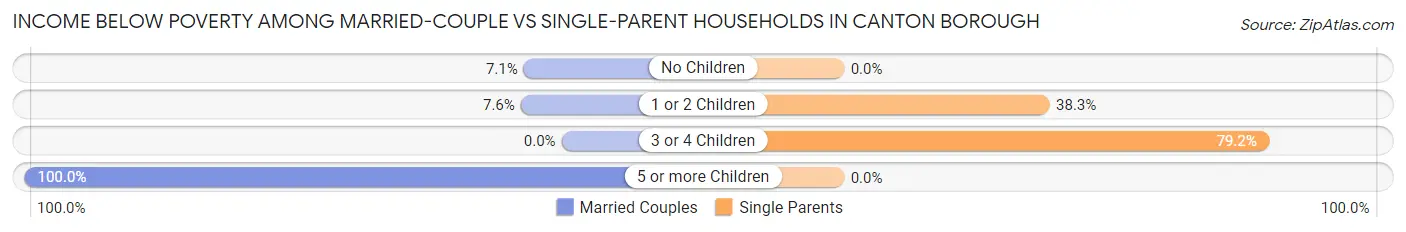
| Children | Married-Couple Families | Single-Parent Households |
| No Children | 12 (7.1%) | 0 (0.0%) |
| 1 or 2 Children | 7 (7.6%) | 31 (38.3%) |
| 3 or 4 Children | 0 (0.0%) | 19 (79.2%) |
| 5 or more Children | 3 (100.0%) | 0 (0.0%) |
| Total | 22 (7.0%) | 50 (32.7%) |
Race in Canton borough
The most populous races in Canton borough are White / Caucasian (1,784 | 99.6%), Hispanic or Latino (7 | 0.4%), and Two or more Races (6 | 0.3%).
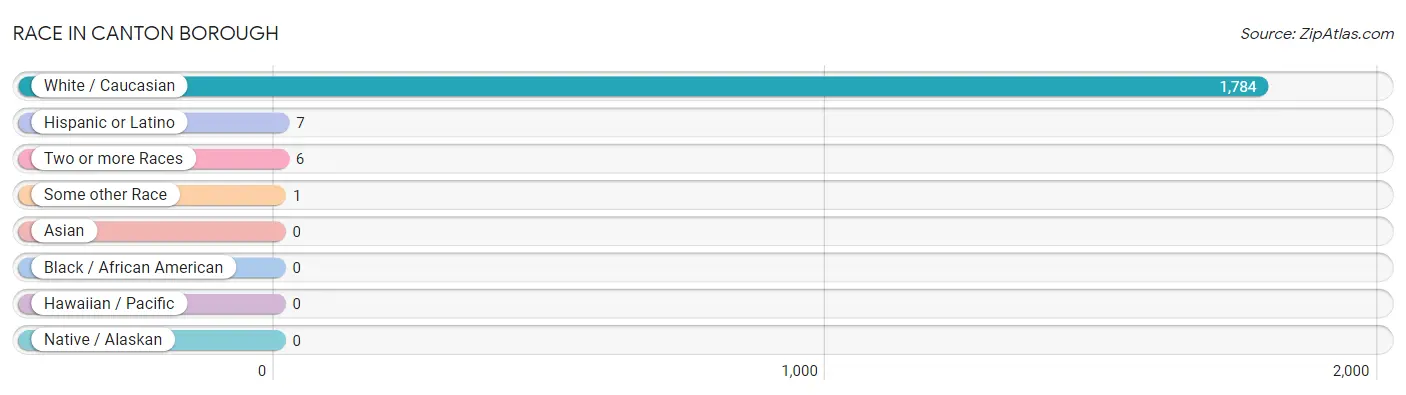
| Race | # Population | % Population |
| Asian | 0 | 0.0% |
| Black / African American | 0 | 0.0% |
| Hawaiian / Pacific | 0 | 0.0% |
| Hispanic or Latino | 7 | 0.4% |
| Native / Alaskan | 0 | 0.0% |
| White / Caucasian | 1,784 | 99.6% |
| Two or more Races | 6 | 0.3% |
| Some other Race | 1 | 0.1% |
| Total | 1,791 | 100.0% |
Ancestry in Canton borough
The most populous ancestries reported in Canton borough are German (436 | 24.3%), Irish (289 | 16.1%), English (176 | 9.8%), American (81 | 4.5%), and Scottish (79 | 4.4%), together accounting for 59.2% of all Canton borough residents.
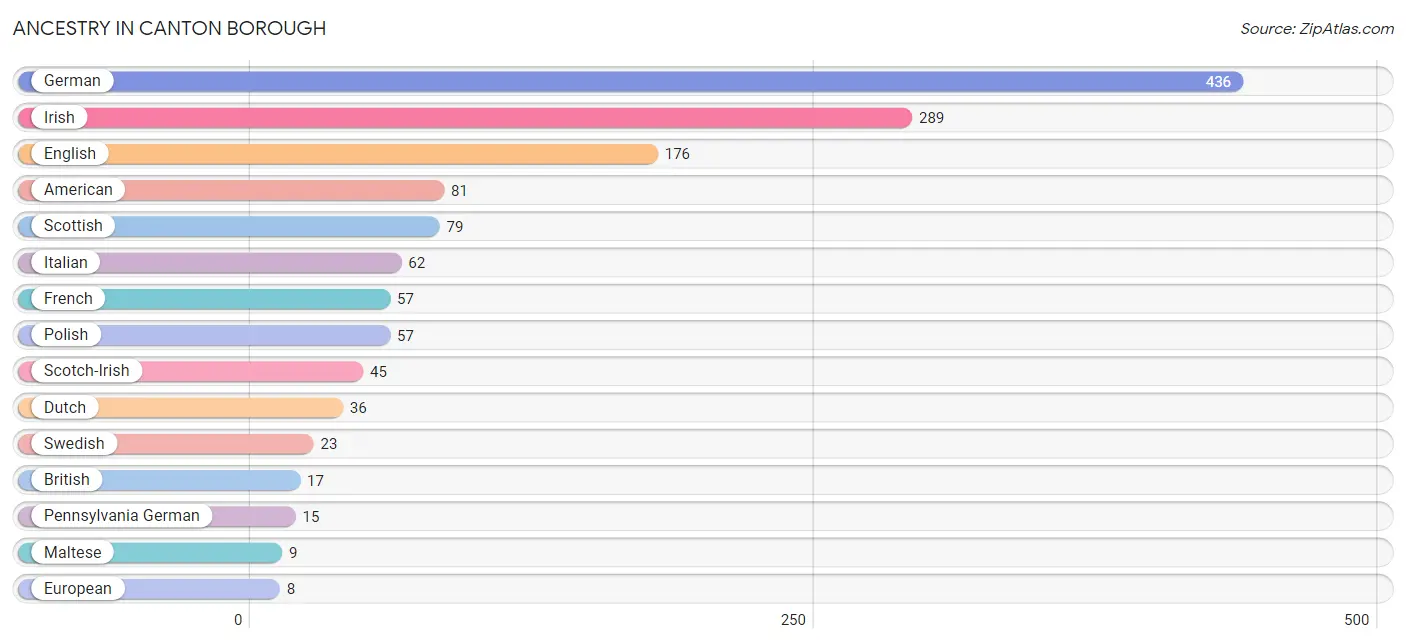
| Ancestry | # Population | % Population |
| American | 81 | 4.5% |
| British | 17 | 0.9% |
| Cherokee | 3 | 0.2% |
| Colombian | 6 | 0.3% |
| Dutch | 36 | 2.0% |
| English | 176 | 9.8% |
| European | 8 | 0.4% |
| French | 57 | 3.2% |
| French Canadian | 6 | 0.3% |
| German | 436 | 24.3% |
| Irish | 289 | 16.1% |
| Italian | 62 | 3.5% |
| Maltese | 9 | 0.5% |
| Norwegian | 5 | 0.3% |
| Pennsylvania German | 15 | 0.8% |
| Polish | 57 | 3.2% |
| Puerto Rican | 1 | 0.1% |
| Russian | 4 | 0.2% |
| Scotch-Irish | 45 | 2.5% |
| Scottish | 79 | 4.4% |
| South American | 6 | 0.3% |
| Swedish | 23 | 1.3% | View All 22 Rows |
Immigrants in Canton borough
The most numerous immigrant groups reported in Canton borough came from Europe (19 | 1.1%), Western Europe (19 | 1.1%), Germany (9 | 0.5%), France (5 | 0.3%), and Netherlands (5 | 0.3%), together accounting for 3.2% of all Canton borough residents.
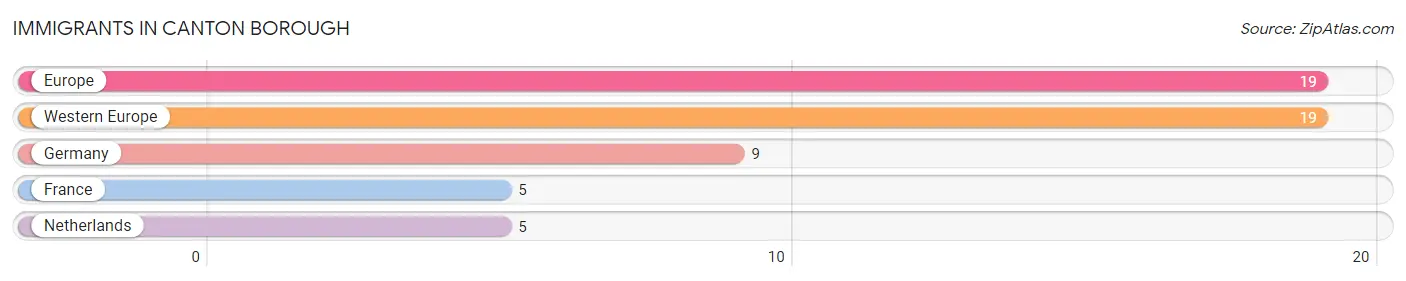
| Immigration Origin | # Population | % Population |
| Europe | 19 | 1.1% |
| France | 5 | 0.3% |
| Germany | 9 | 0.5% |
| Netherlands | 5 | 0.3% |
| Western Europe | 19 | 1.1% | View All 5 Rows |
Sex and Age in Canton borough
Sex and Age in Canton borough
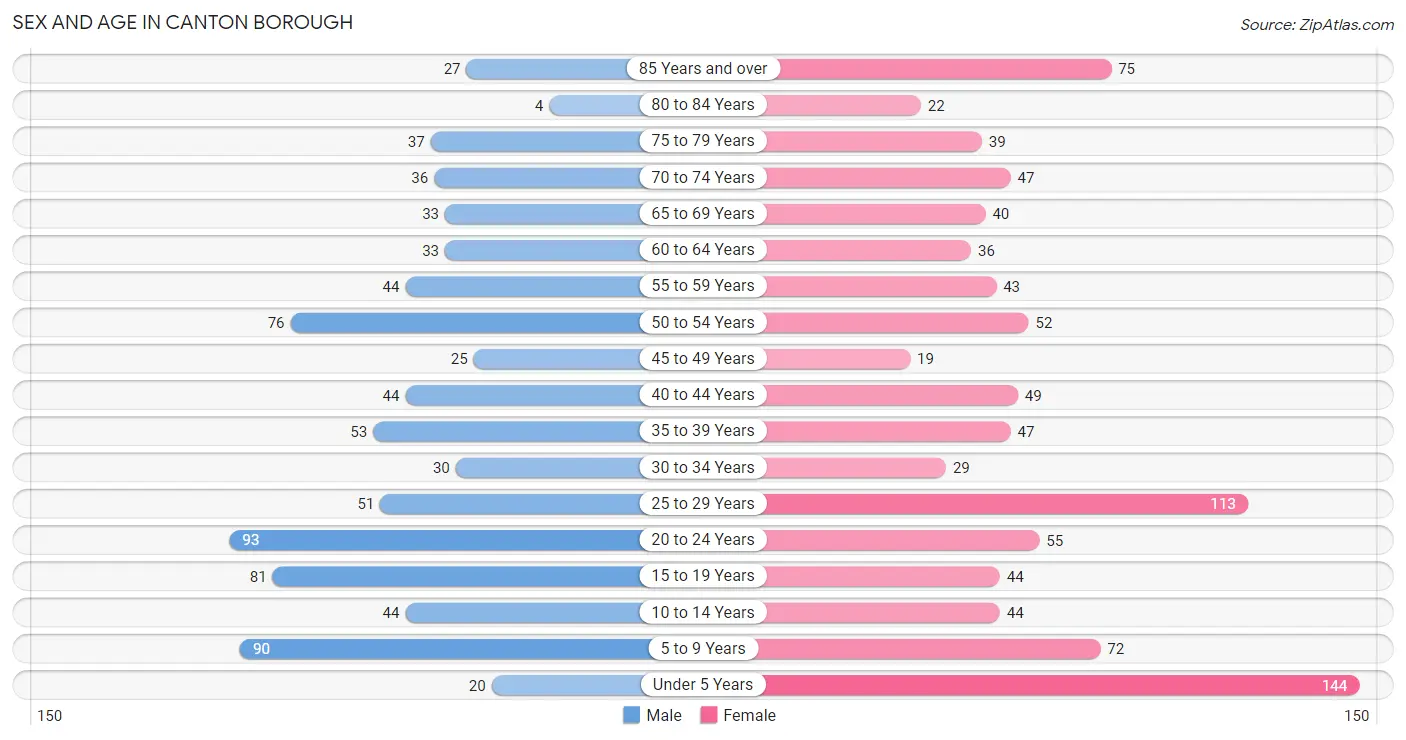
The most populous age groups in Canton borough are 20 to 24 Years (93 | 11.3%) for men and Under 5 Years (144 | 14.8%) for women.
| Age Bracket | Male | Female |
| Under 5 Years | 20 (2.4%) | 144 (14.8%) |
| 5 to 9 Years | 90 (11.0%) | 72 (7.4%) |
| 10 to 14 Years | 44 (5.4%) | 44 (4.5%) |
| 15 to 19 Years | 81 (9.9%) | 44 (4.5%) |
| 20 to 24 Years | 93 (11.3%) | 55 (5.7%) |
| 25 to 29 Years | 51 (6.2%) | 113 (11.7%) |
| 30 to 34 Years | 30 (3.6%) | 29 (3.0%) |
| 35 to 39 Years | 53 (6.5%) | 47 (4.9%) |
| 40 to 44 Years | 44 (5.4%) | 49 (5.1%) |
| 45 to 49 Years | 25 (3.0%) | 19 (2.0%) |
| 50 to 54 Years | 76 (9.3%) | 52 (5.4%) |
| 55 to 59 Years | 44 (5.4%) | 43 (4.4%) |
| 60 to 64 Years | 33 (4.0%) | 36 (3.7%) |
| 65 to 69 Years | 33 (4.0%) | 40 (4.1%) |
| 70 to 74 Years | 36 (4.4%) | 47 (4.9%) |
| 75 to 79 Years | 37 (4.5%) | 39 (4.0%) |
| 80 to 84 Years | 4 (0.5%) | 22 (2.3%) |
| 85 Years and over | 27 (3.3%) | 75 (7.7%) |
| Total | 821 (100.0%) | 970 (100.0%) |
Families and Households in Canton borough
Median Family Size in Canton borough
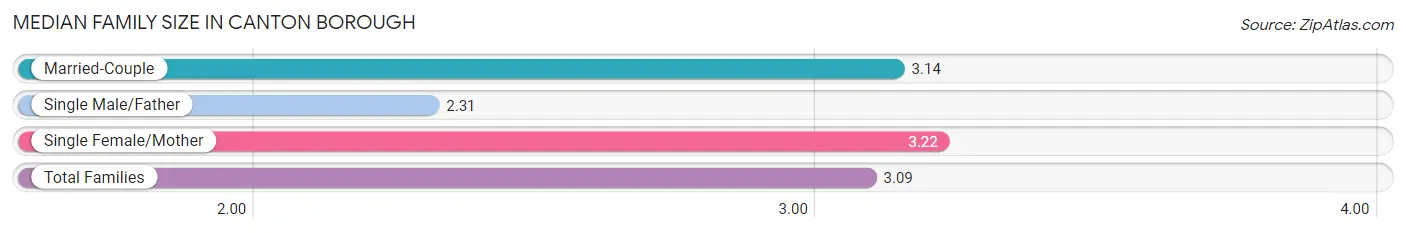
The median family size in Canton borough is 3.09 persons per family, with single female/mother families (117 | 25.2%) accounting for the largest median family size of 3.22 persons per family. On the other hand, single male/father families (36 | 7.7%) represent the smallest median family size with 2.31 persons per family.
| Family Type | # Families | Family Size |
| Married-Couple | 312 (67.1%) | 3.14 |
| Single Male/Father | 36 (7.7%) | 2.31 |
| Single Female/Mother | 117 (25.2%) | 3.22 |
| Total Families | 465 (100.0%) | 3.09 |
Median Household Size in Canton borough
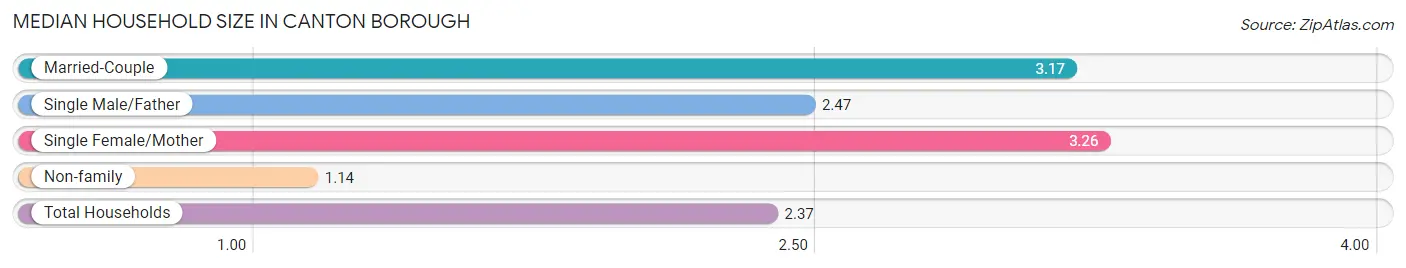
The median household size in Canton borough is 2.37 persons per household, with single female/mother households (117 | 15.5%) accounting for the largest median household size of 3.26 persons per household. non-family households (291 | 38.5%) represent the smallest median household size with 1.14 persons per household.
| Household Type | # Households | Household Size |
| Married-Couple | 312 (41.3%) | 3.17 |
| Single Male/Father | 36 (4.8%) | 2.47 |
| Single Female/Mother | 117 (15.5%) | 3.26 |
| Non-family | 291 (38.5%) | 1.14 |
| Total Households | 756 (100.0%) | 2.37 |
Household Size by Marriage Status in Canton borough
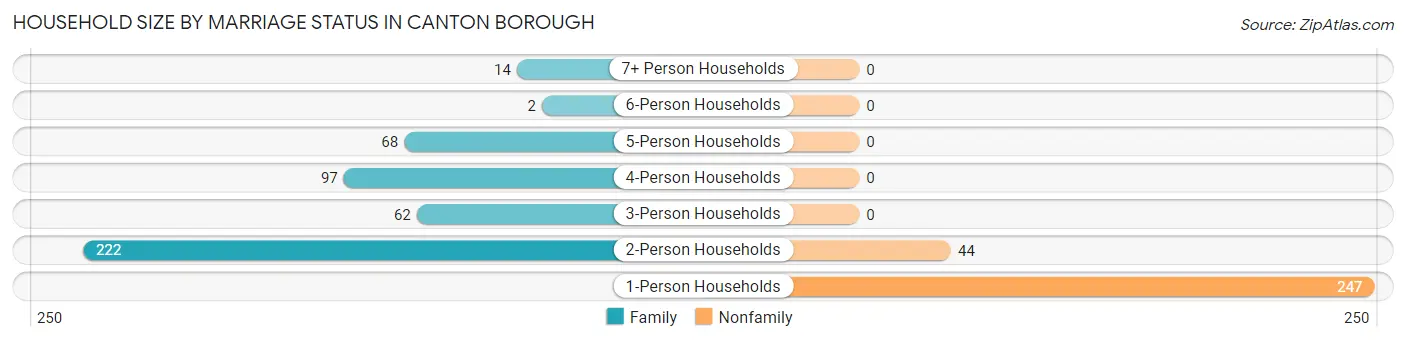
Out of a total of 756 households in Canton borough, 465 (61.5%) are family households, while 291 (38.5%) are nonfamily households. The most numerous type of family households are 2-person households, comprising 222, and the most common type of nonfamily households are 1-person households, comprising 247.
| Household Size | Family Households | Nonfamily Households |
| 1-Person Households | - | 247 (32.7%) |
| 2-Person Households | 222 (29.4%) | 44 (5.8%) |
| 3-Person Households | 62 (8.2%) | 0 (0.0%) |
| 4-Person Households | 97 (12.8%) | 0 (0.0%) |
| 5-Person Households | 68 (9.0%) | 0 (0.0%) |
| 6-Person Households | 2 (0.3%) | 0 (0.0%) |
| 7+ Person Households | 14 (1.8%) | 0 (0.0%) |
| Total | 465 (61.5%) | 291 (38.5%) |
Female Fertility in Canton borough
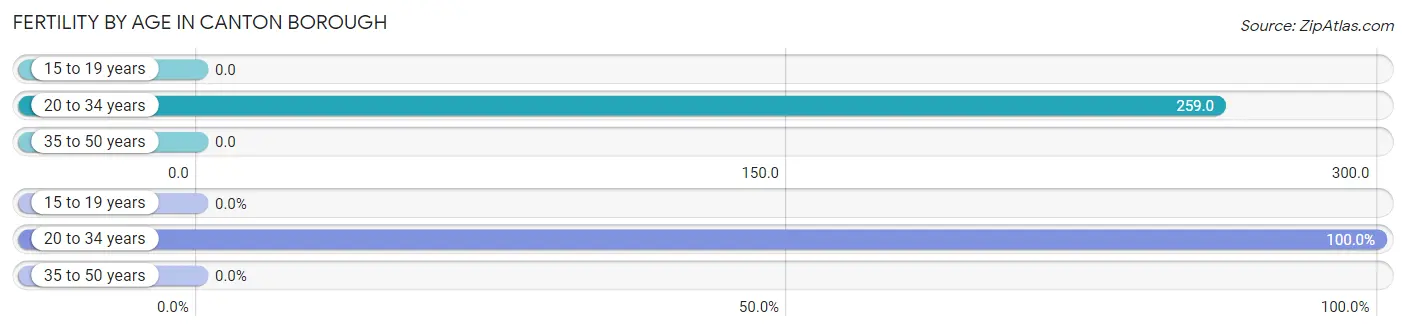
Fertility by Age in Canton borough
Average fertility rate in Canton borough is 140.0 births per 1,000 women. Women in the age bracket of 20 to 34 years have the highest fertility rate with 259.0 births per 1,000 women. Women in the age bracket of 20 to 34 years acount for 100.0% of all women with births.
| Age Bracket | Women with Births | Births / 1,000 Women |
| 15 to 19 years | 0 (0.0%) | 0.0 |
| 20 to 34 years | 51 (100.0%) | 259.0 |
| 35 to 50 years | 0 (0.0%) | 0.0 |
| Total | 51 (100.0%) | 140.0 |
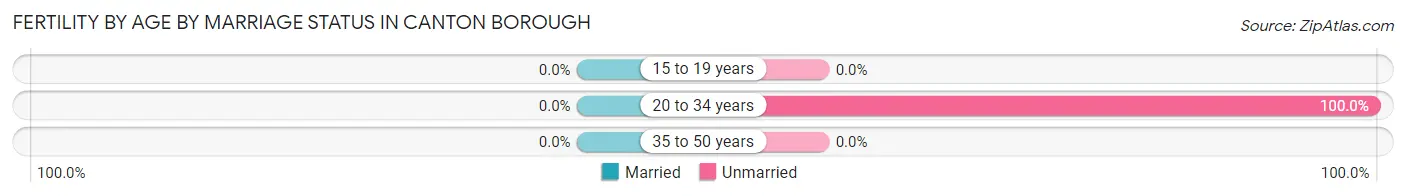
Fertility by Age by Marriage Status in Canton borough
| Age Bracket | Married | Unmarried |
| 15 to 19 years | 0 (0.0%) | 0 (0.0%) |
| 20 to 34 years | 0 (0.0%) | 51 (100.0%) |
| 35 to 50 years | 0 (0.0%) | 0 (0.0%) |
| Total | 0 (0.0%) | 51 (100.0%) |
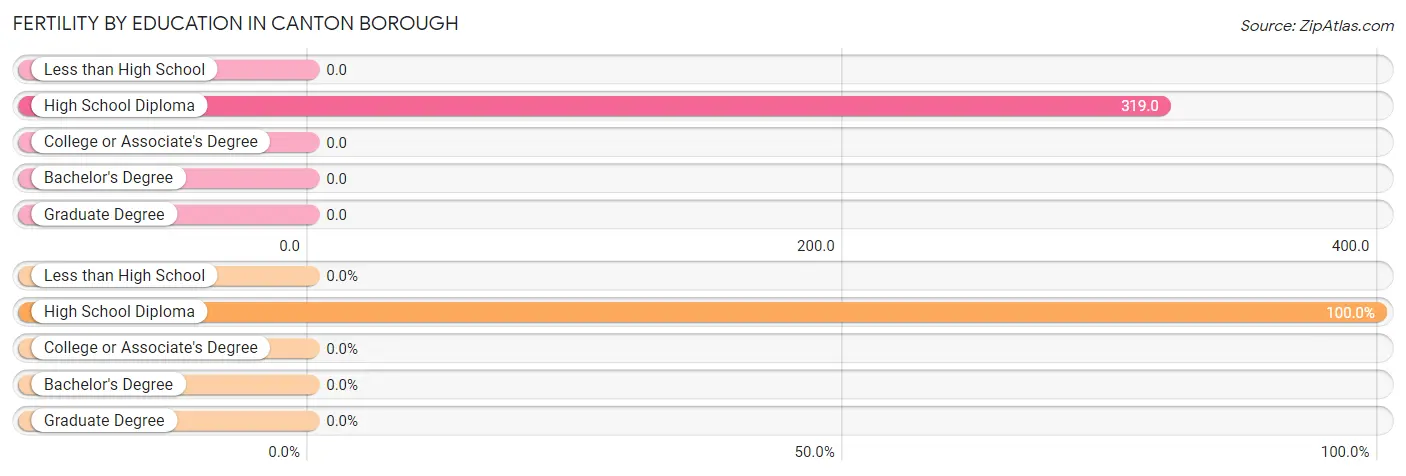
Fertility by Education in Canton borough
| Educational Attainment | Women with Births | Births / 1,000 Women |
| Less than High School | 0 (0.0%) | 0.0 |
| High School Diploma | 51 (100.0%) | 319.0 |
| College or Associate's Degree | 0 (0.0%) | 0.0 |
| Bachelor's Degree | 0 (0.0%) | 0.0 |
| Graduate Degree | 0 (0.0%) | 0.0 |
| Total | 51 (100.0%) | 140.0 |
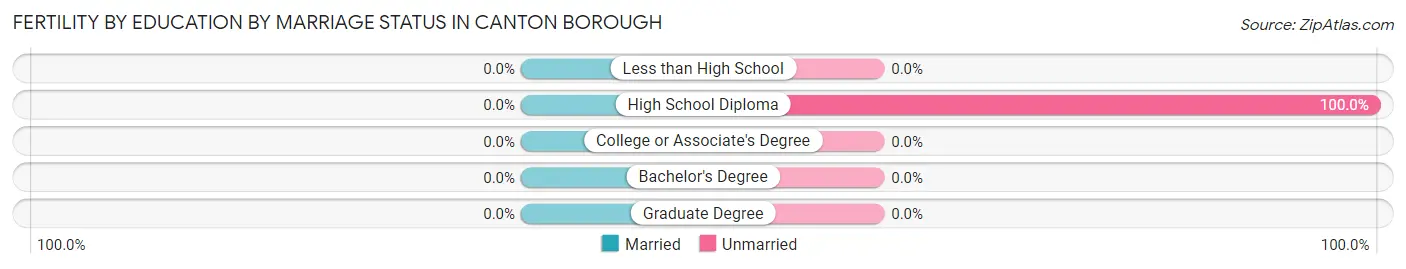
Fertility by Education by Marriage Status in Canton borough
| Educational Attainment | Married | Unmarried |
| Less than High School | 0 (0.0%) | 0 (0.0%) |
| High School Diploma | 0 (0.0%) | 51 (100.0%) |
| College or Associate's Degree | 0 (0.0%) | 0 (0.0%) |
| Bachelor's Degree | 0 (0.0%) | 0 (0.0%) |
| Graduate Degree | 0 (0.0%) | 0 (0.0%) |
| Total | 0 (0.0%) | 51 (100.0%) |
Employment Characteristics in Canton borough
Employment by Class of Employer in Canton borough
Among the 633 employed individuals in Canton borough, private company employees (434 | 68.6%), not-for-profit organizations (80 | 12.6%), and local government employees (47 | 7.4%) make up the most common classes of employment.
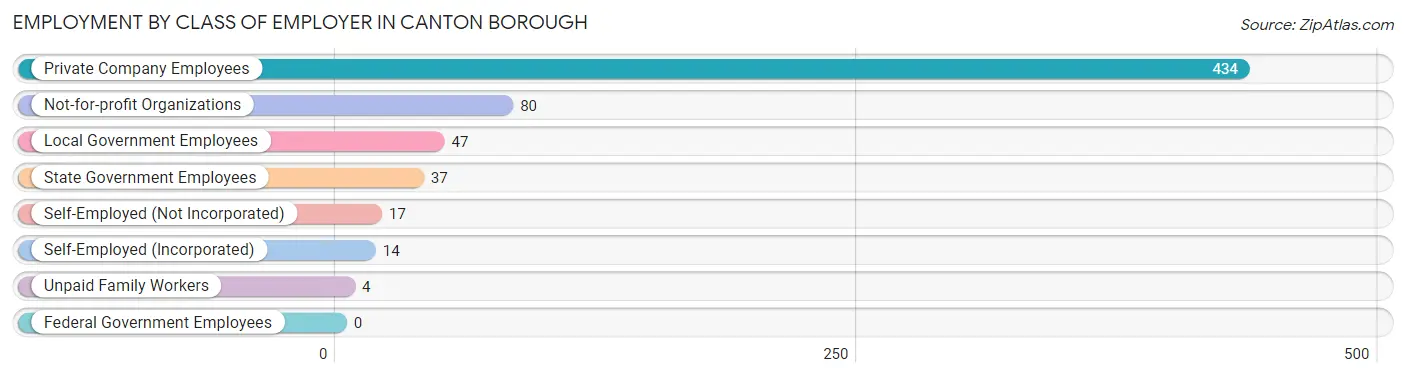
| Employer Class | # Employees | % Employees |
| Private Company Employees | 434 | 68.6% |
| Self-Employed (Incorporated) | 14 | 2.2% |
| Self-Employed (Not Incorporated) | 17 | 2.7% |
| Not-for-profit Organizations | 80 | 12.6% |
| Local Government Employees | 47 | 7.4% |
| State Government Employees | 37 | 5.9% |
| Federal Government Employees | 0 | 0.0% |
| Unpaid Family Workers | 4 | 0.6% |
| Total | 633 | 100.0% |
Employment Status by Age in Canton borough
According to the labor force statistics for Canton borough, out of the total population over 16 years of age (1,348), 55.6% or 749 individuals are in the labor force, with 6.0% or 45 of them unemployed. The age group with the highest labor force participation rate is 25 to 29 years, with 86.0% or 141 individuals in the labor force. Within the labor force, the 60 to 64 years age range has the highest percentage of unemployed individuals, with 16.7% or 7 of them being unemployed.
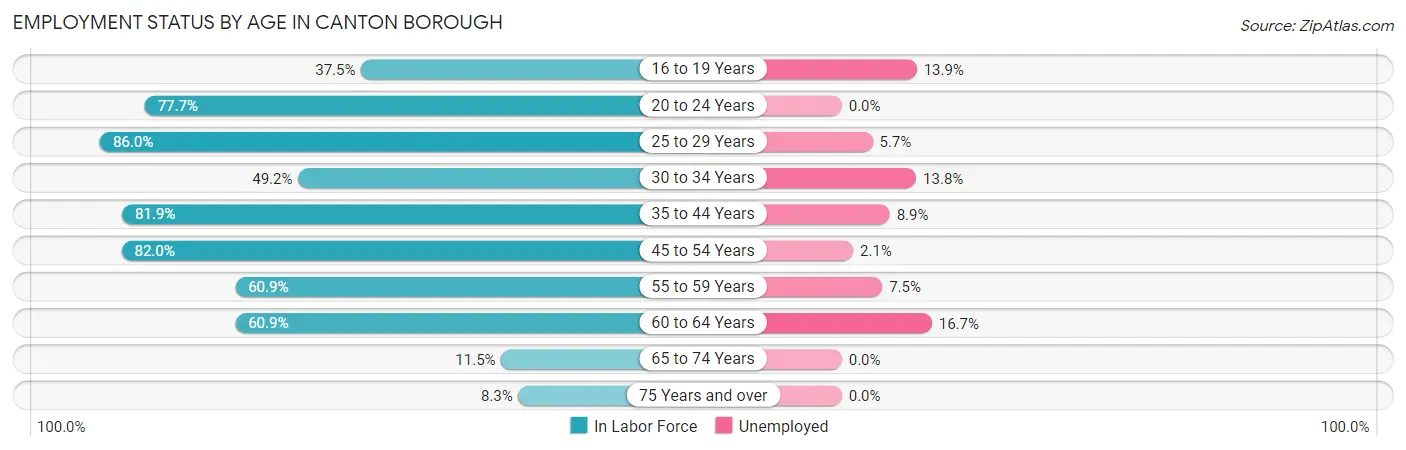
| Age Bracket | In Labor Force | Unemployed |
| 16 to 19 Years | 36 (37.5%) | 5 (13.9%) |
| 20 to 24 Years | 115 (77.7%) | 0 (0.0%) |
| 25 to 29 Years | 141 (86.0%) | 8 (5.7%) |
| 30 to 34 Years | 29 (49.2%) | 4 (13.8%) |
| 35 to 44 Years | 158 (81.9%) | 14 (8.9%) |
| 45 to 54 Years | 141 (82.0%) | 3 (2.1%) |
| 55 to 59 Years | 53 (60.9%) | 4 (7.5%) |
| 60 to 64 Years | 42 (60.9%) | 7 (16.7%) |
| 65 to 74 Years | 18 (11.5%) | 0 (0.0%) |
| 75 Years and over | 17 (8.3%) | 0 (0.0%) |
| Total | 749 (55.6%) | 45 (6.0%) |
Employment Status by Educational Attainment in Canton borough
According to labor force statistics for Canton borough, 75.8% of individuals (564) out of the total population between 25 and 64 years of age (744) are in the labor force, with 7.1% or 40 of them being unemployed. The group with the highest labor force participation rate are those with the educational attainment of less than high school, with 90.5% or 38 individuals in the labor force. Within the labor force, individuals with bachelor's degree or higher education have the highest percentage of unemployment, with 12.5% or 15 of them being unemployed.
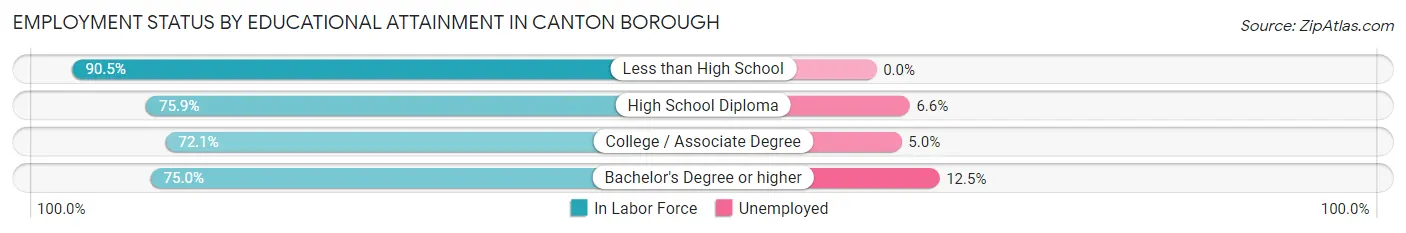
| Educational Attainment | In Labor Force | Unemployed |
| Less than High School | 38 (90.5%) | 0 (0.0%) |
| High School Diploma | 305 (75.9%) | 27 (6.6%) |
| College / Associate Degree | 101 (72.1%) | 7 (5.0%) |
| Bachelor's Degree or higher | 120 (75.0%) | 20 (12.5%) |
| Total | 564 (75.8%) | 53 (7.1%) |
Employment Occupations by Sex in Canton borough
Management, Business, Science and Arts Occupations
The most common Management, Business, Science and Arts occupations in Canton borough are Community & Social Service (83 | 11.8%), Health Diagnosing & Treating (45 | 6.4%), Education Instruction & Library (43 | 6.1%), Management (37 | 5.2%), and Education, Arts & Media (25 | 3.5%).
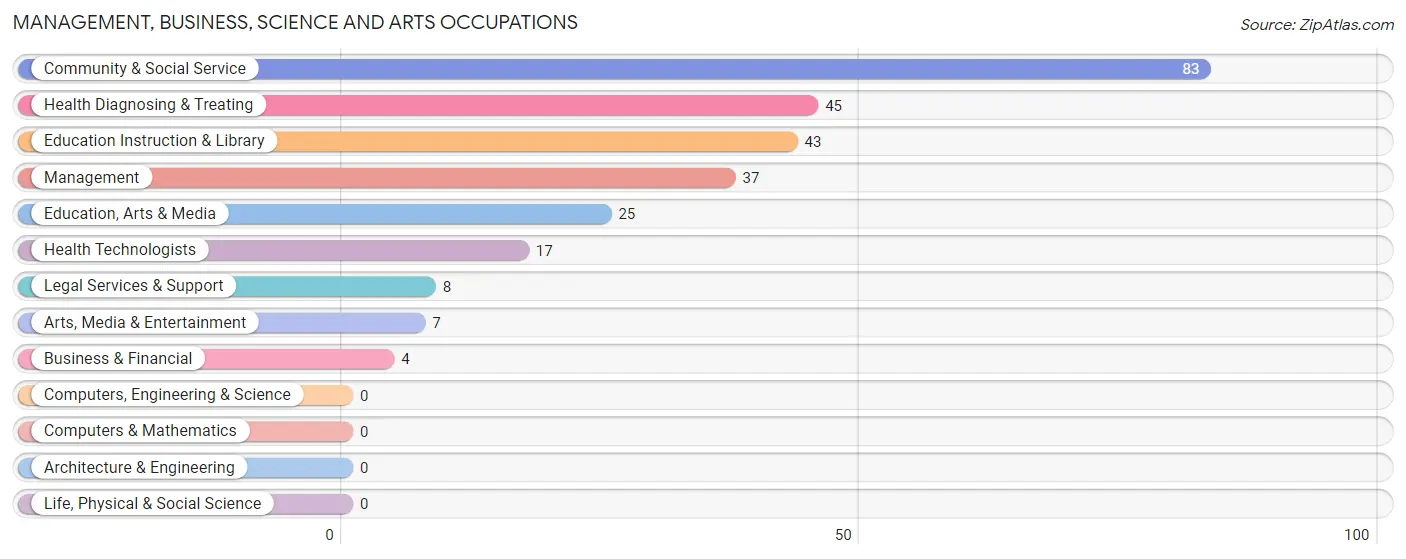
Management, Business, Science and Arts Occupations by Sex
Within the Management, Business, Science and Arts occupations in Canton borough, the most male-oriented occupations are Business & Financial (100.0%), Education, Arts & Media (72.0%), and Arts, Media & Entertainment (71.4%), while the most female-oriented occupations are Health Technologists (100.0%), Health Diagnosing & Treating (88.9%), and Education Instruction & Library (65.1%).
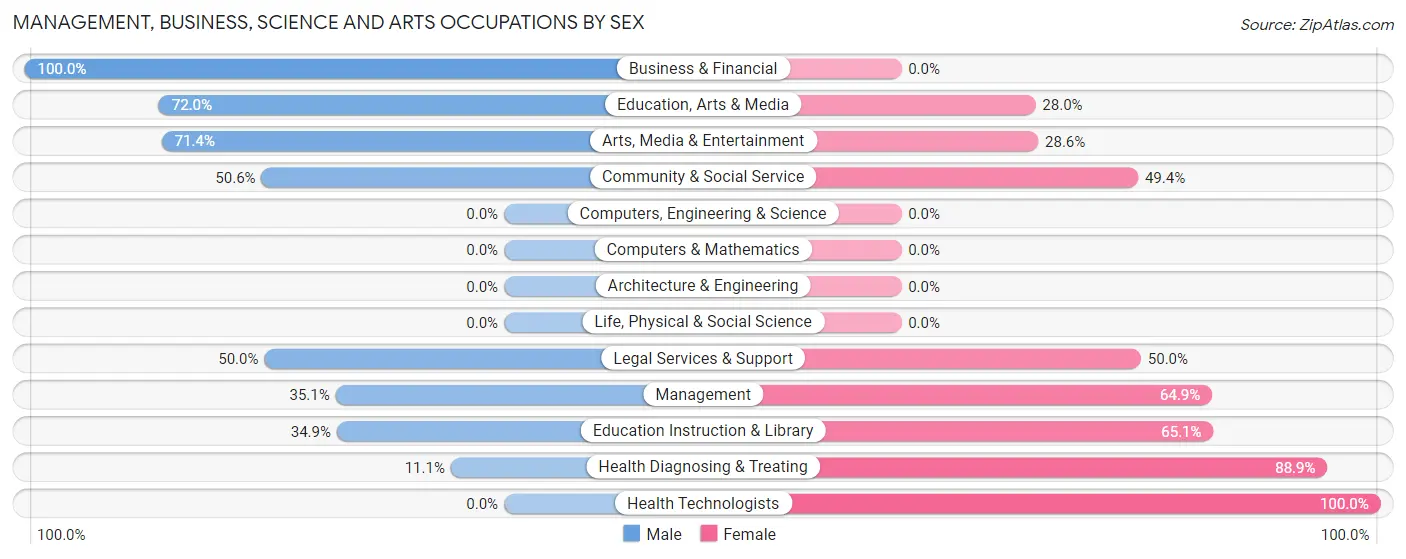
| Occupation | Male | Female |
| Management | 13 (35.1%) | 24 (64.9%) |
| Business & Financial | 4 (100.0%) | 0 (0.0%) |
| Computers, Engineering & Science | 0 (0.0%) | 0 (0.0%) |
| Computers & Mathematics | 0 (0.0%) | 0 (0.0%) |
| Architecture & Engineering | 0 (0.0%) | 0 (0.0%) |
| Life, Physical & Social Science | 0 (0.0%) | 0 (0.0%) |
| Community & Social Service | 42 (50.6%) | 41 (49.4%) |
| Education, Arts & Media | 18 (72.0%) | 7 (28.0%) |
| Legal Services & Support | 4 (50.0%) | 4 (50.0%) |
| Education Instruction & Library | 15 (34.9%) | 28 (65.1%) |
| Arts, Media & Entertainment | 5 (71.4%) | 2 (28.6%) |
| Health Diagnosing & Treating | 5 (11.1%) | 40 (88.9%) |
| Health Technologists | 0 (0.0%) | 17 (100.0%) |
| Total (Category) | 64 (37.9%) | 105 (62.1%) |
| Total (Overall) | 353 (50.1%) | 352 (49.9%) |
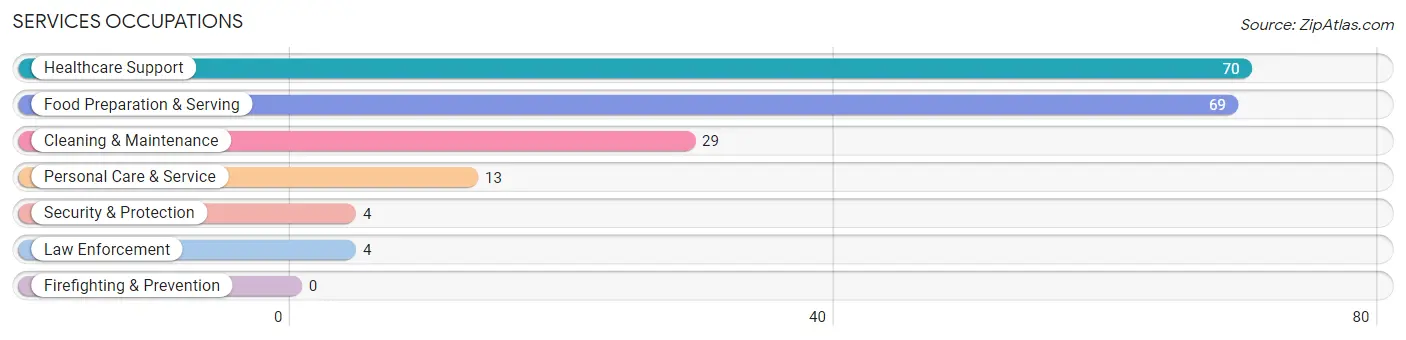
Services Occupations
The most common Services occupations in Canton borough are Healthcare Support (70 | 9.9%), Food Preparation & Serving (69 | 9.8%), Cleaning & Maintenance (29 | 4.1%), Personal Care & Service (13 | 1.8%), and Security & Protection (4 | 0.6%).
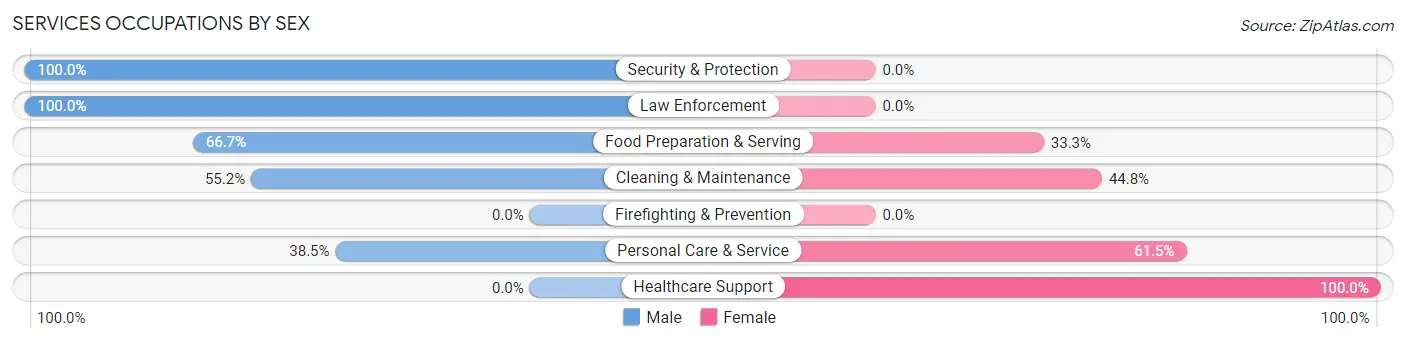
Services Occupations by Sex
Within the Services occupations in Canton borough, the most male-oriented occupations are Security & Protection (100.0%), Law Enforcement (100.0%), and Food Preparation & Serving (66.7%), while the most female-oriented occupations are Healthcare Support (100.0%), Personal Care & Service (61.5%), and Cleaning & Maintenance (44.8%).
| Occupation | Male | Female |
| Healthcare Support | 0 (0.0%) | 70 (100.0%) |
| Security & Protection | 4 (100.0%) | 0 (0.0%) |
| Firefighting & Prevention | 0 (0.0%) | 0 (0.0%) |
| Law Enforcement | 4 (100.0%) | 0 (0.0%) |
| Food Preparation & Serving | 46 (66.7%) | 23 (33.3%) |
| Cleaning & Maintenance | 16 (55.2%) | 13 (44.8%) |
| Personal Care & Service | 5 (38.5%) | 8 (61.5%) |
| Total (Category) | 71 (38.4%) | 114 (61.6%) |
| Total (Overall) | 353 (50.1%) | 352 (49.9%) |
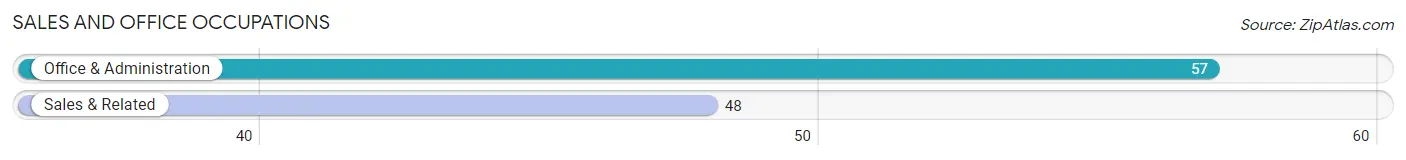
Sales and Office Occupations
The most common Sales and Office occupations in Canton borough are Office & Administration (57 | 8.1%), and Sales & Related (48 | 6.8%).
Sales and Office Occupations by Sex
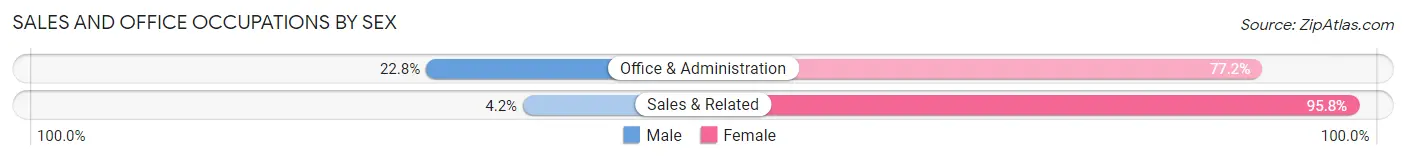
| Occupation | Male | Female |
| Sales & Related | 2 (4.2%) | 46 (95.8%) |
| Office & Administration | 13 (22.8%) | 44 (77.2%) |
| Total (Category) | 15 (14.3%) | 90 (85.7%) |
| Total (Overall) | 353 (50.1%) | 352 (49.9%) |
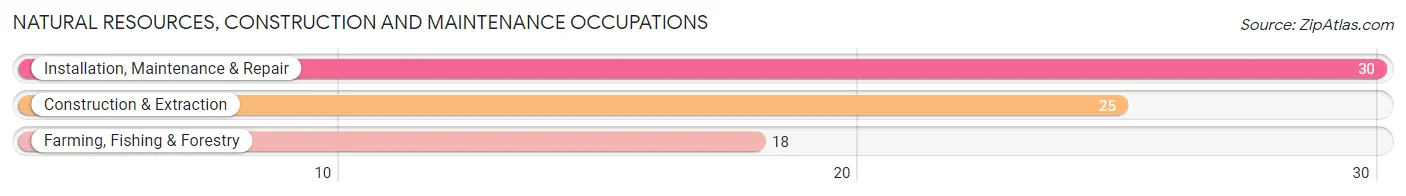
Natural Resources, Construction and Maintenance Occupations
The most common Natural Resources, Construction and Maintenance occupations in Canton borough are Installation, Maintenance & Repair (30 | 4.3%), Construction & Extraction (25 | 3.5%), and Farming, Fishing & Forestry (18 | 2.5%).
Natural Resources, Construction and Maintenance Occupations by Sex
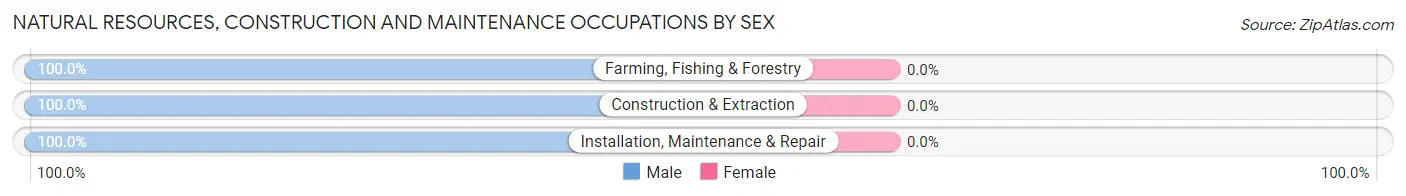
| Occupation | Male | Female |
| Farming, Fishing & Forestry | 18 (100.0%) | 0 (0.0%) |
| Construction & Extraction | 25 (100.0%) | 0 (0.0%) |
| Installation, Maintenance & Repair | 30 (100.0%) | 0 (0.0%) |
| Total (Category) | 73 (100.0%) | 0 (0.0%) |
| Total (Overall) | 353 (50.1%) | 352 (49.9%) |
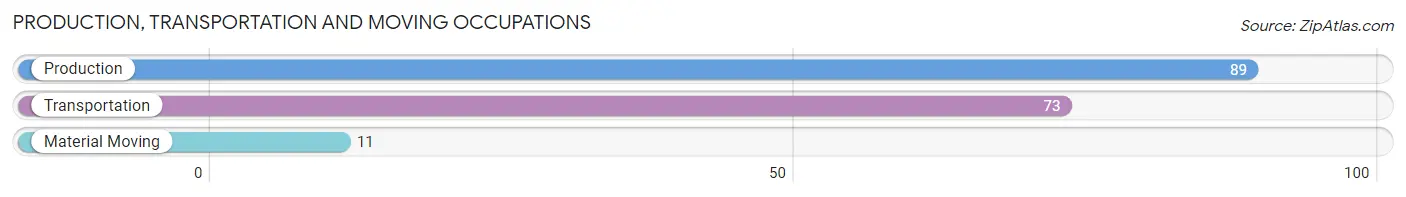
Production, Transportation and Moving Occupations
The most common Production, Transportation and Moving occupations in Canton borough are Production (89 | 12.6%), Transportation (73 | 10.3%), and Material Moving (11 | 1.6%).
Production, Transportation and Moving Occupations by Sex
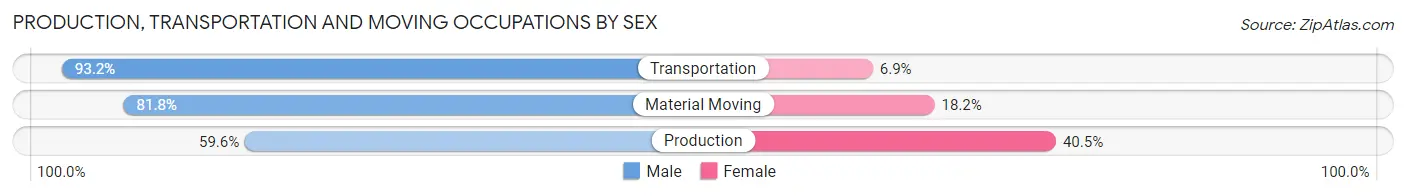
| Occupation | Male | Female |
| Production | 53 (59.6%) | 36 (40.5%) |
| Transportation | 68 (93.1%) | 5 (6.9%) |
| Material Moving | 9 (81.8%) | 2 (18.2%) |
| Total (Category) | 130 (75.1%) | 43 (24.9%) |
| Total (Overall) | 353 (50.1%) | 352 (49.9%) |
Employment Industries by Sex in Canton borough
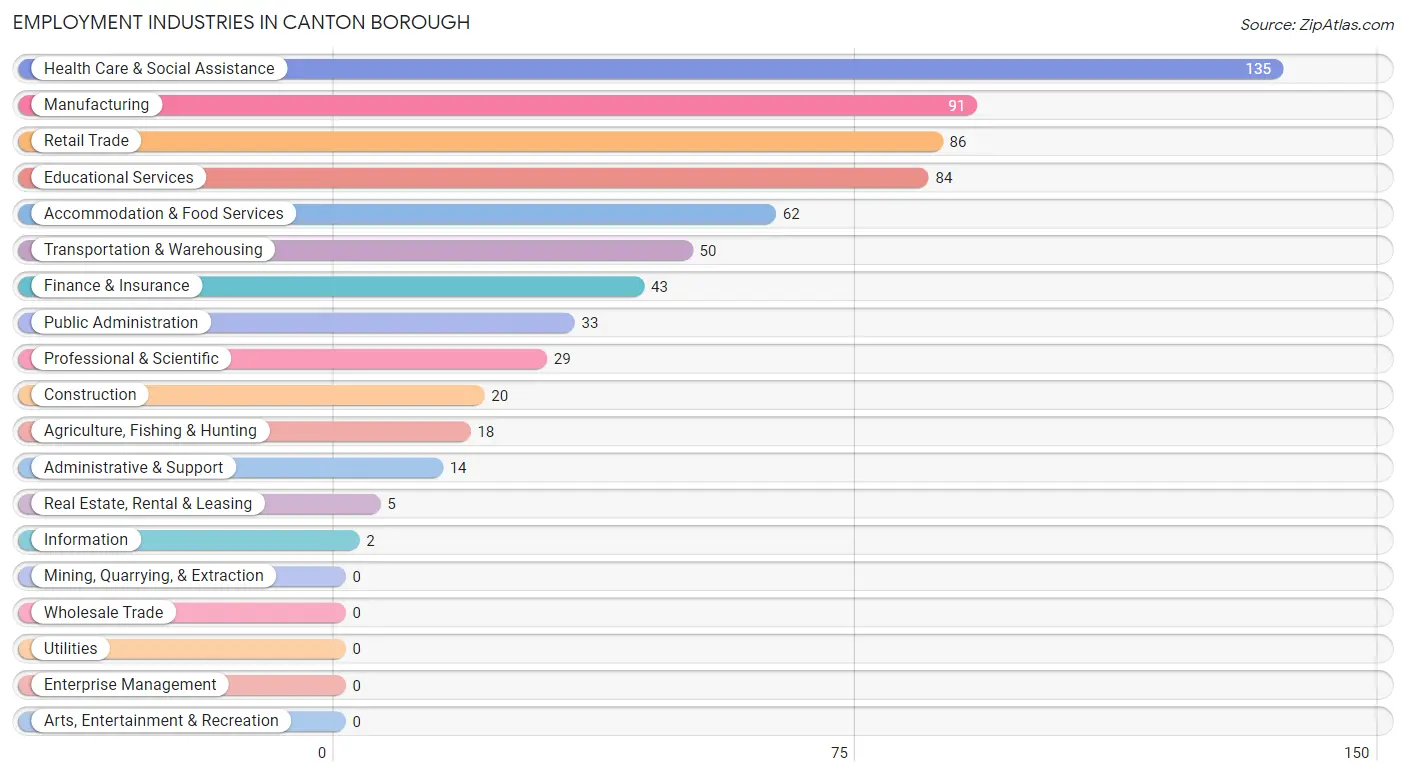
Employment Industries in Canton borough
The major employment industries in Canton borough include Health Care & Social Assistance (135 | 19.2%), Manufacturing (91 | 12.9%), Retail Trade (86 | 12.2%), Educational Services (84 | 11.9%), and Accommodation & Food Services (62 | 8.8%).
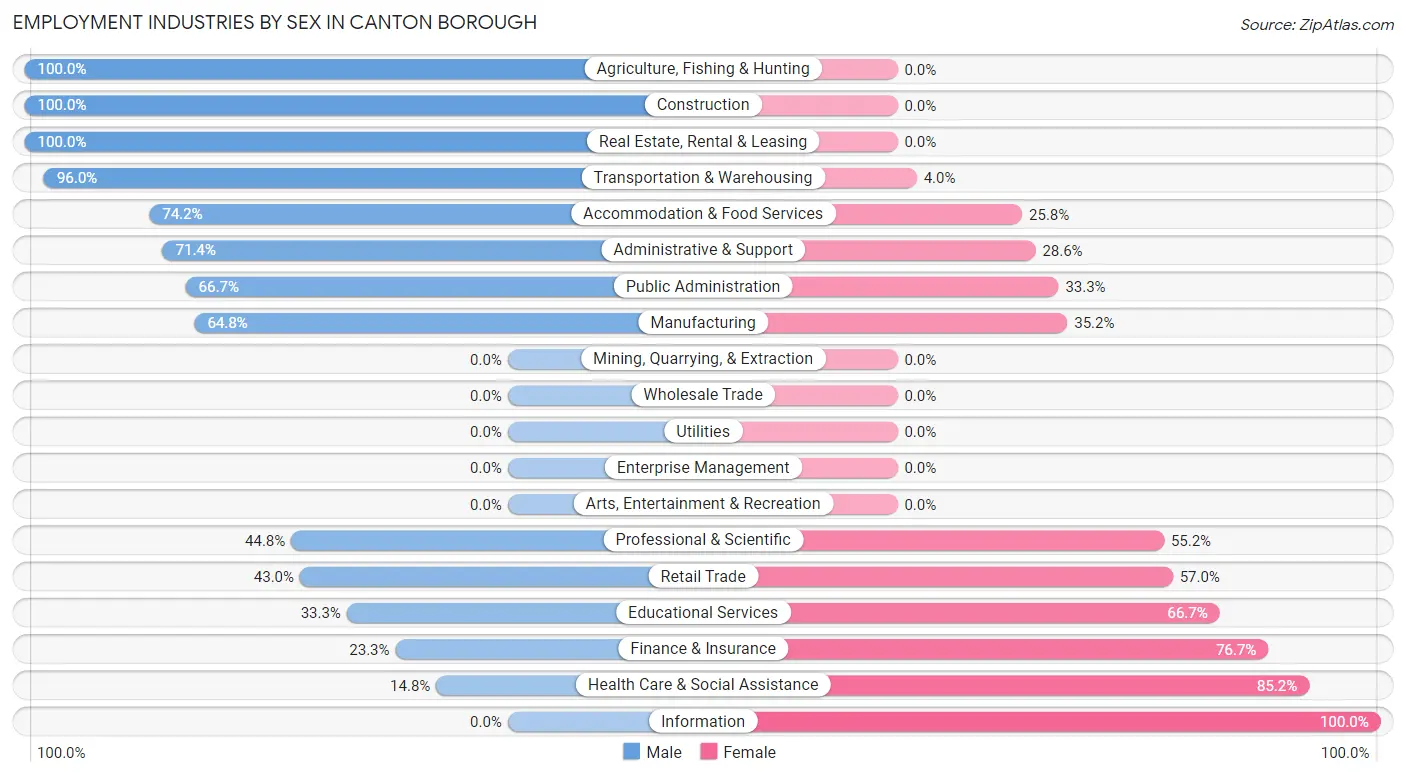
Employment Industries by Sex in Canton borough
The Canton borough industries that see more men than women are Agriculture, Fishing & Hunting (100.0%), Construction (100.0%), and Real Estate, Rental & Leasing (100.0%), whereas the industries that tend to have a higher number of women are Information (100.0%), Health Care & Social Assistance (85.2%), and Finance & Insurance (76.7%).
| Industry | Male | Female |
| Agriculture, Fishing & Hunting | 18 (100.0%) | 0 (0.0%) |
| Mining, Quarrying, & Extraction | 0 (0.0%) | 0 (0.0%) |
| Construction | 20 (100.0%) | 0 (0.0%) |
| Manufacturing | 59 (64.8%) | 32 (35.2%) |
| Wholesale Trade | 0 (0.0%) | 0 (0.0%) |
| Retail Trade | 37 (43.0%) | 49 (57.0%) |
| Transportation & Warehousing | 48 (96.0%) | 2 (4.0%) |
| Utilities | 0 (0.0%) | 0 (0.0%) |
| Information | 0 (0.0%) | 2 (100.0%) |
| Finance & Insurance | 10 (23.3%) | 33 (76.7%) |
| Real Estate, Rental & Leasing | 5 (100.0%) | 0 (0.0%) |
| Professional & Scientific | 13 (44.8%) | 16 (55.2%) |
| Enterprise Management | 0 (0.0%) | 0 (0.0%) |
| Administrative & Support | 10 (71.4%) | 4 (28.6%) |
| Educational Services | 28 (33.3%) | 56 (66.7%) |
| Health Care & Social Assistance | 20 (14.8%) | 115 (85.2%) |
| Arts, Entertainment & Recreation | 0 (0.0%) | 0 (0.0%) |
| Accommodation & Food Services | 46 (74.2%) | 16 (25.8%) |
| Public Administration | 22 (66.7%) | 11 (33.3%) |
| Total | 353 (50.1%) | 352 (49.9%) |
Education in Canton borough
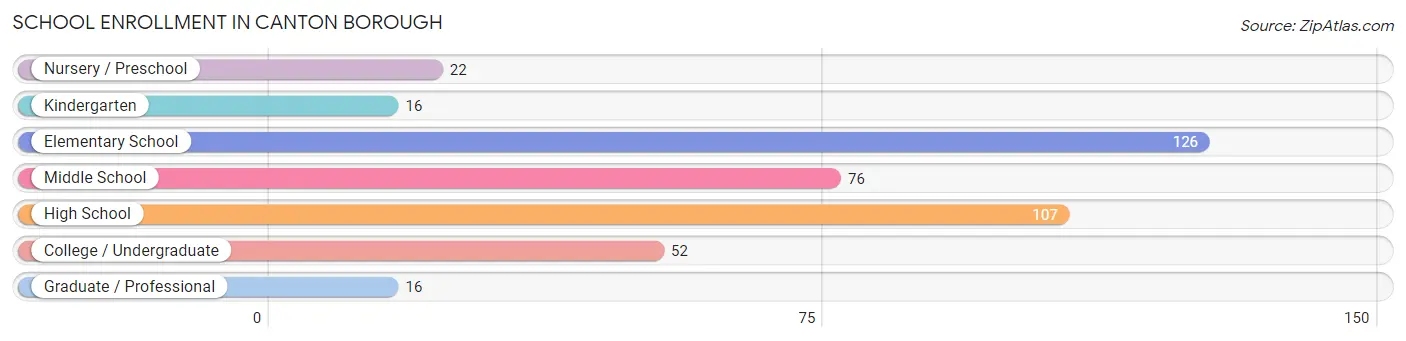
School Enrollment in Canton borough
The most common levels of schooling among the 415 students in Canton borough are elementary school (126 | 30.4%), high school (107 | 25.8%), and middle school (76 | 18.3%).
| School Level | # Students | % Students |
| Nursery / Preschool | 22 | 5.3% |
| Kindergarten | 16 | 3.9% |
| Elementary School | 126 | 30.4% |
| Middle School | 76 | 18.3% |
| High School | 107 | 25.8% |
| College / Undergraduate | 52 | 12.5% |
| Graduate / Professional | 16 | 3.9% |
| Total | 415 | 100.0% |
School Enrollment by Age by Funding Source in Canton borough
Out of a total of 415 students who are enrolled in schools in Canton borough, 37 (8.9%) attend a private institution, while the remaining 378 (91.1%) are enrolled in public schools. The age group of 25 to 34 year olds has the highest likelihood of being enrolled in private schools, with 6 (33.3% in the age bracket) enrolled. Conversely, the age group of 20 to 24 year olds has the lowest likelihood of being enrolled in a private school, with 28 (100.0% in the age bracket) attending a public institution.
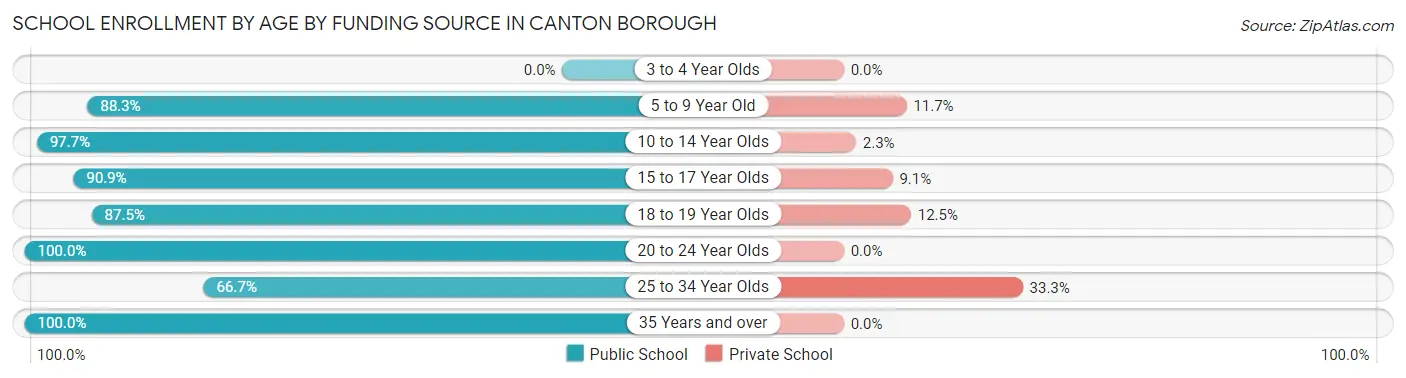
| Age Bracket | Public School | Private School |
| 3 to 4 Year Olds | 0 (0.0%) | 0 (0.0%) |
| 5 to 9 Year Old | 136 (88.3%) | 18 (11.7%) |
| 10 to 14 Year Olds | 86 (97.7%) | 2 (2.3%) |
| 15 to 17 Year Olds | 80 (90.9%) | 8 (9.1%) |
| 18 to 19 Year Olds | 21 (87.5%) | 3 (12.5%) |
| 20 to 24 Year Olds | 28 (100.0%) | 0 (0.0%) |
| 25 to 34 Year Olds | 12 (66.7%) | 6 (33.3%) |
| 35 Years and over | 15 (100.0%) | 0 (0.0%) |
| Total | 378 (91.1%) | 37 (8.9%) |
Educational Attainment by Field of Study in Canton borough
Education (71 | 29.5%), science & technology (40 | 16.6%), visual & performing arts (29 | 12.0%), computers & mathematics (19 | 7.9%), and psychology (19 | 7.9%) are the most common fields of study among 241 individuals in Canton borough who have obtained a bachelor's degree or higher.
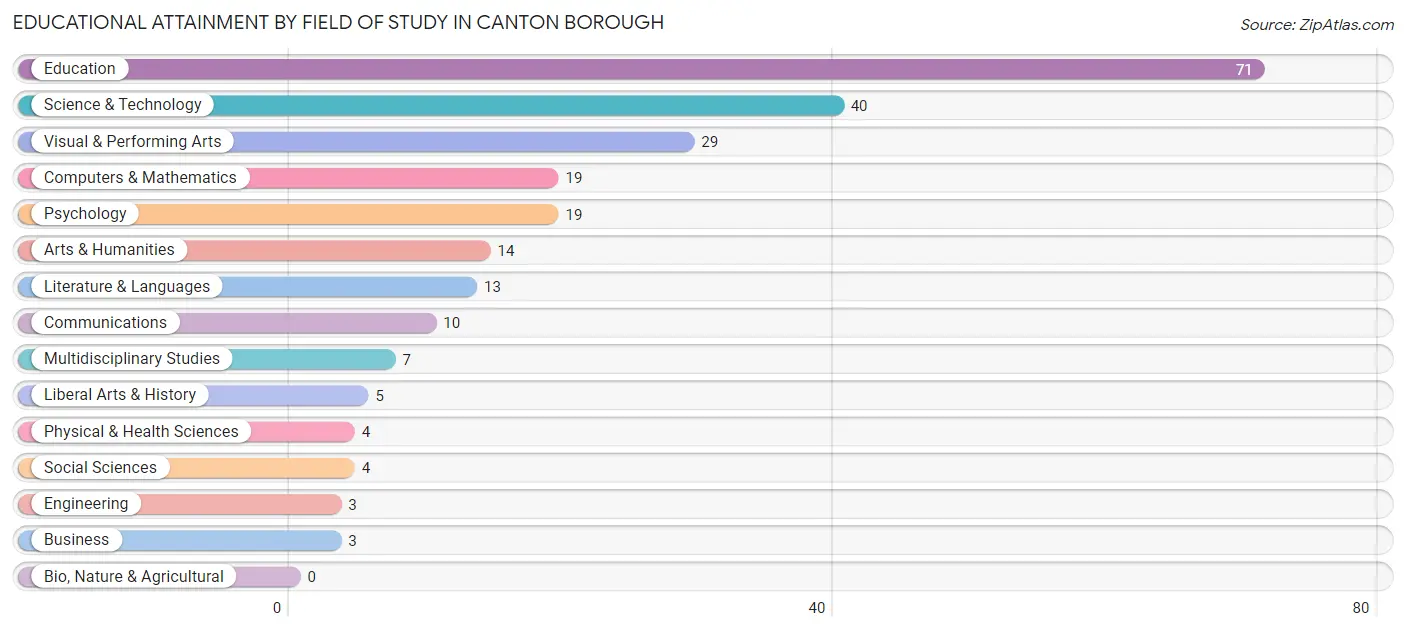
| Field of Study | # Graduates | % Graduates |
| Computers & Mathematics | 19 | 7.9% |
| Bio, Nature & Agricultural | 0 | 0.0% |
| Physical & Health Sciences | 4 | 1.7% |
| Psychology | 19 | 7.9% |
| Social Sciences | 4 | 1.7% |
| Engineering | 3 | 1.2% |
| Multidisciplinary Studies | 7 | 2.9% |
| Science & Technology | 40 | 16.6% |
| Business | 3 | 1.2% |
| Education | 71 | 29.5% |
| Literature & Languages | 13 | 5.4% |
| Liberal Arts & History | 5 | 2.1% |
| Visual & Performing Arts | 29 | 12.0% |
| Communications | 10 | 4.2% |
| Arts & Humanities | 14 | 5.8% |
| Total | 241 | 100.0% |
Transportation & Commute in Canton borough
Vehicle Availability by Sex in Canton borough
The most prevalent vehicle ownership categories in Canton borough are males with 2 vehicles (107, accounting for 35.8%) and females with 2 vehicles (111, making up 32.0%).
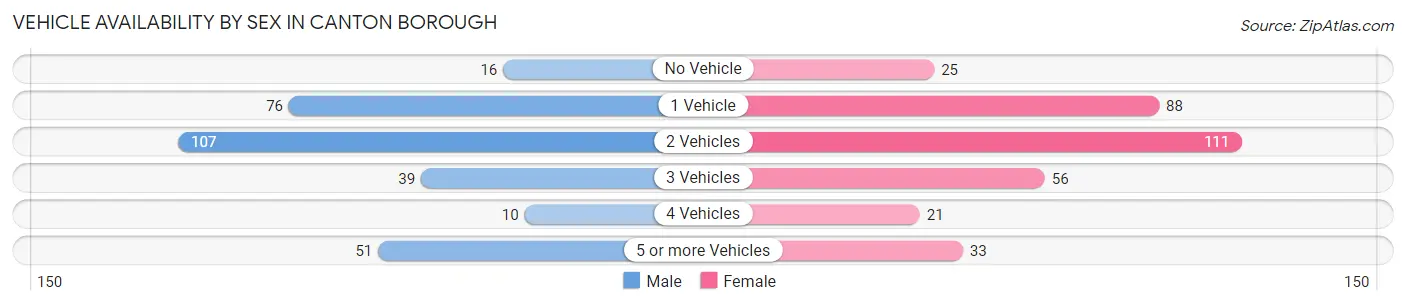
| Vehicles Available | Male | Female |
| No Vehicle | 16 (5.3%) | 25 (7.5%) |
| 1 Vehicle | 76 (25.4%) | 88 (26.4%) |
| 2 Vehicles | 107 (35.8%) | 111 (33.2%) |
| 3 Vehicles | 39 (13.0%) | 56 (16.8%) |
| 4 Vehicles | 10 (3.3%) | 21 (6.3%) |
| 5 or more Vehicles | 51 (17.1%) | 33 (9.9%) |
| Total | 299 (100.0%) | 334 (100.0%) |
Commute Time in Canton borough
The most frequently occuring commute durations in Canton borough are 5 to 9 minutes (175 commuters, 30.5%), 45 to 59 minutes (86 commuters, 15.0%), and 35 to 39 minutes (59 commuters, 10.3%).
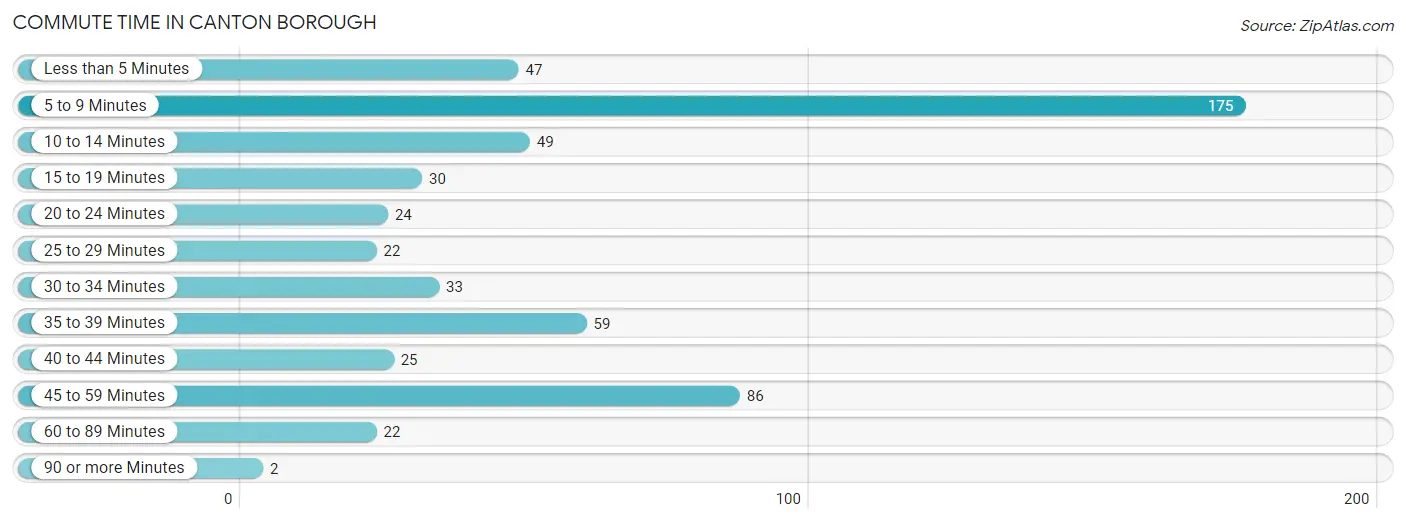
| Commute Time | # Commuters | % Commuters |
| Less than 5 Minutes | 47 | 8.2% |
| 5 to 9 Minutes | 175 | 30.5% |
| 10 to 14 Minutes | 49 | 8.5% |
| 15 to 19 Minutes | 30 | 5.2% |
| 20 to 24 Minutes | 24 | 4.2% |
| 25 to 29 Minutes | 22 | 3.8% |
| 30 to 34 Minutes | 33 | 5.8% |
| 35 to 39 Minutes | 59 | 10.3% |
| 40 to 44 Minutes | 25 | 4.4% |
| 45 to 59 Minutes | 86 | 15.0% |
| 60 to 89 Minutes | 22 | 3.8% |
| 90 or more Minutes | 2 | 0.4% |
Commute Time by Sex in Canton borough
The most common commute times in Canton borough are 5 to 9 minutes (51 commuters, 19.5%) for males and 5 to 9 minutes (124 commuters, 39.6%) for females.
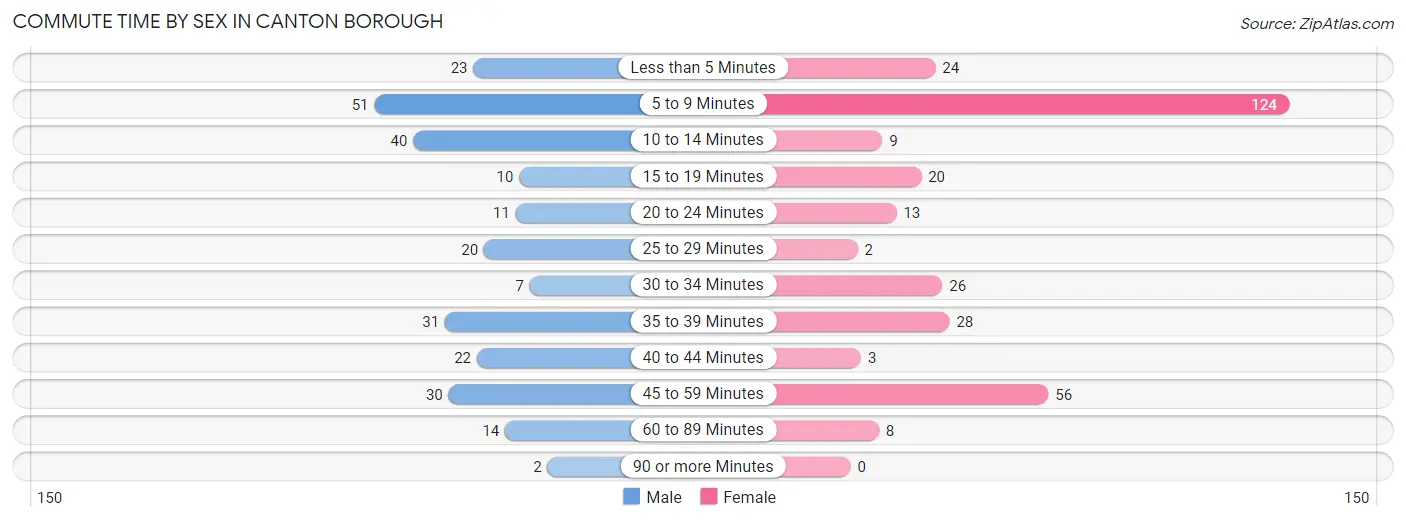
| Commute Time | Male | Female |
| Less than 5 Minutes | 23 (8.8%) | 24 (7.7%) |
| 5 to 9 Minutes | 51 (19.5%) | 124 (39.6%) |
| 10 to 14 Minutes | 40 (15.3%) | 9 (2.9%) |
| 15 to 19 Minutes | 10 (3.8%) | 20 (6.4%) |
| 20 to 24 Minutes | 11 (4.2%) | 13 (4.2%) |
| 25 to 29 Minutes | 20 (7.7%) | 2 (0.6%) |
| 30 to 34 Minutes | 7 (2.7%) | 26 (8.3%) |
| 35 to 39 Minutes | 31 (11.9%) | 28 (8.9%) |
| 40 to 44 Minutes | 22 (8.4%) | 3 (1.0%) |
| 45 to 59 Minutes | 30 (11.5%) | 56 (17.9%) |
| 60 to 89 Minutes | 14 (5.4%) | 8 (2.6%) |
| 90 or more Minutes | 2 (0.8%) | 0 (0.0%) |
Time of Departure to Work by Sex in Canton borough
The most frequent times of departure to work in Canton borough are 12:00 AM to 4:59 AM (48, 18.4%) for males and 6:00 AM to 6:29 AM (46, 14.7%) for females.
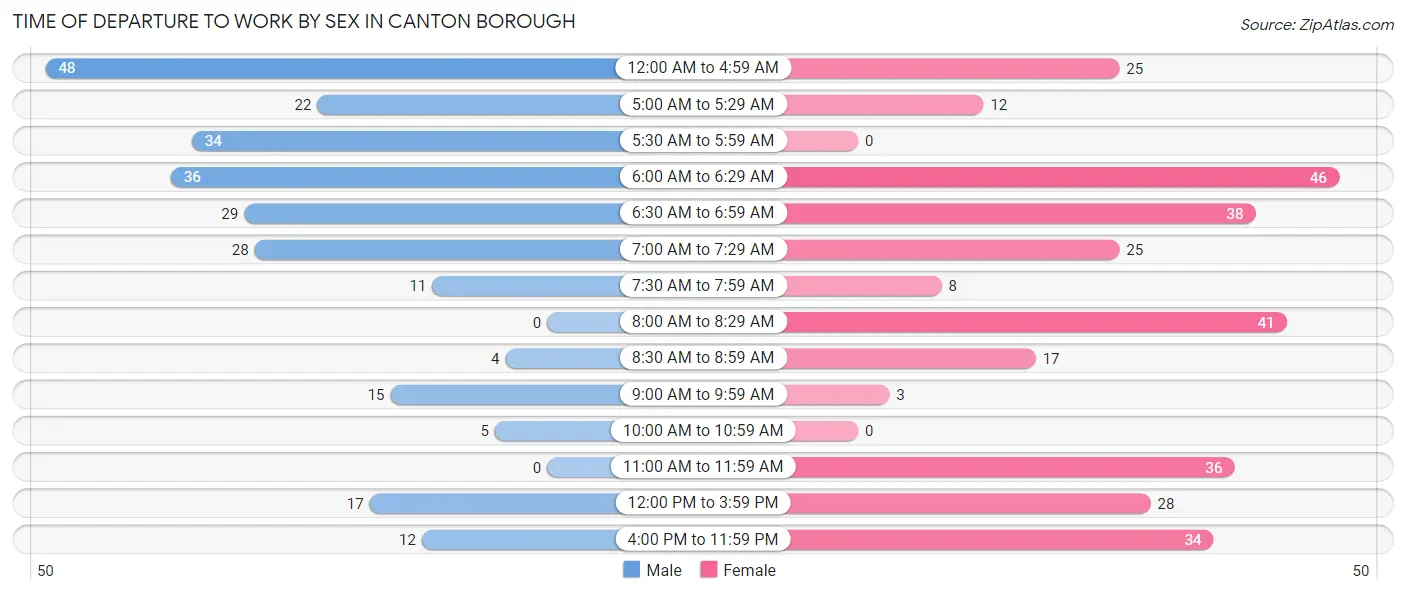
| Time of Departure | Male | Female |
| 12:00 AM to 4:59 AM | 48 (18.4%) | 25 (8.0%) |
| 5:00 AM to 5:29 AM | 22 (8.4%) | 12 (3.8%) |
| 5:30 AM to 5:59 AM | 34 (13.0%) | 0 (0.0%) |
| 6:00 AM to 6:29 AM | 36 (13.8%) | 46 (14.7%) |
| 6:30 AM to 6:59 AM | 29 (11.1%) | 38 (12.1%) |
| 7:00 AM to 7:29 AM | 28 (10.7%) | 25 (8.0%) |
| 7:30 AM to 7:59 AM | 11 (4.2%) | 8 (2.6%) |
| 8:00 AM to 8:29 AM | 0 (0.0%) | 41 (13.1%) |
| 8:30 AM to 8:59 AM | 4 (1.5%) | 17 (5.4%) |
| 9:00 AM to 9:59 AM | 15 (5.8%) | 3 (1.0%) |
| 10:00 AM to 10:59 AM | 5 (1.9%) | 0 (0.0%) |
| 11:00 AM to 11:59 AM | 0 (0.0%) | 36 (11.5%) |
| 12:00 PM to 3:59 PM | 17 (6.5%) | 28 (8.9%) |
| 4:00 PM to 11:59 PM | 12 (4.6%) | 34 (10.9%) |
| Total | 261 (100.0%) | 313 (100.0%) |
Housing Occupancy in Canton borough
Occupancy by Ownership in Canton borough
Of the total 756 dwellings in Canton borough, owner-occupied units account for 367 (48.5%), while renter-occupied units make up 389 (51.5%).
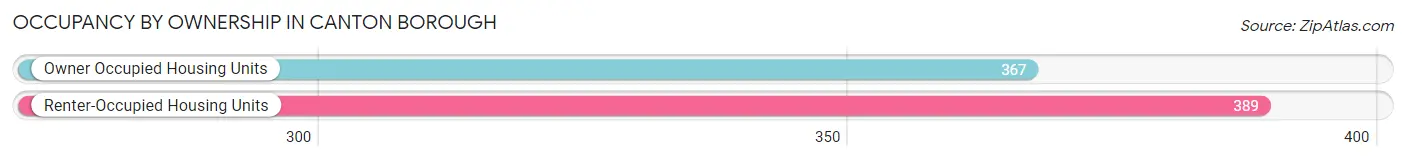
| Occupancy | # Housing Units | % Housing Units |
| Owner Occupied Housing Units | 367 | 48.5% |
| Renter-Occupied Housing Units | 389 | 51.5% |
| Total Occupied Housing Units | 756 | 100.0% |
Occupancy by Household Size in Canton borough
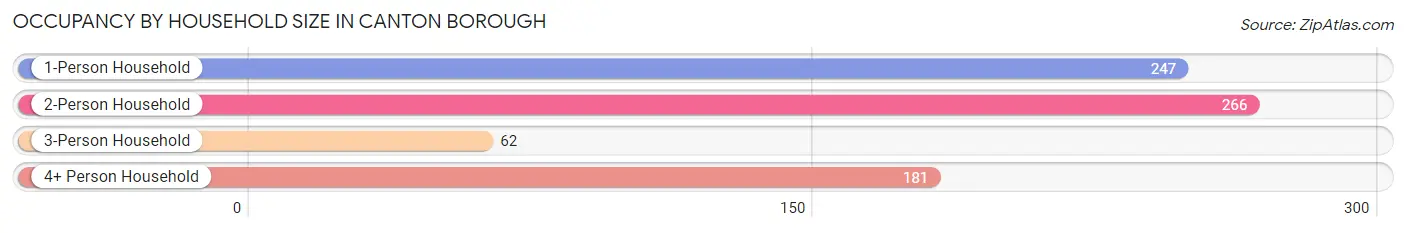
| Household Size | # Housing Units | % Housing Units |
| 1-Person Household | 247 | 32.7% |
| 2-Person Household | 266 | 35.2% |
| 3-Person Household | 62 | 8.2% |
| 4+ Person Household | 181 | 23.9% |
| Total Housing Units | 756 | 100.0% |
Occupancy by Ownership by Household Size in Canton borough
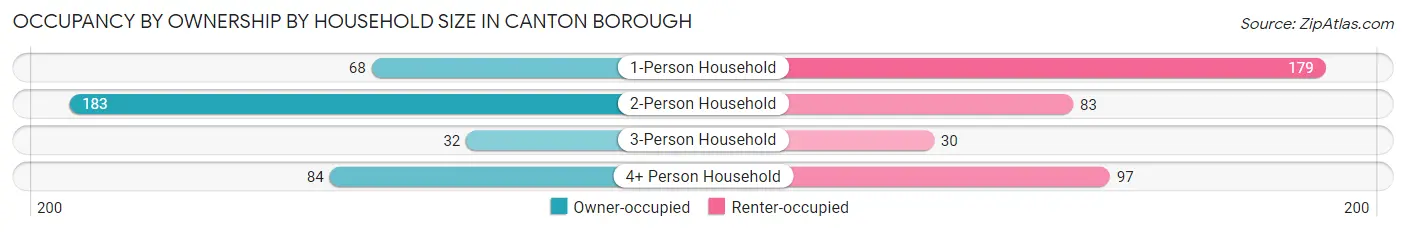
| Household Size | Owner-occupied | Renter-occupied |
| 1-Person Household | 68 (27.5%) | 179 (72.5%) |
| 2-Person Household | 183 (68.8%) | 83 (31.2%) |
| 3-Person Household | 32 (51.6%) | 30 (48.4%) |
| 4+ Person Household | 84 (46.4%) | 97 (53.6%) |
| Total Housing Units | 367 (48.5%) | 389 (51.5%) |
Occupancy by Educational Attainment in Canton borough
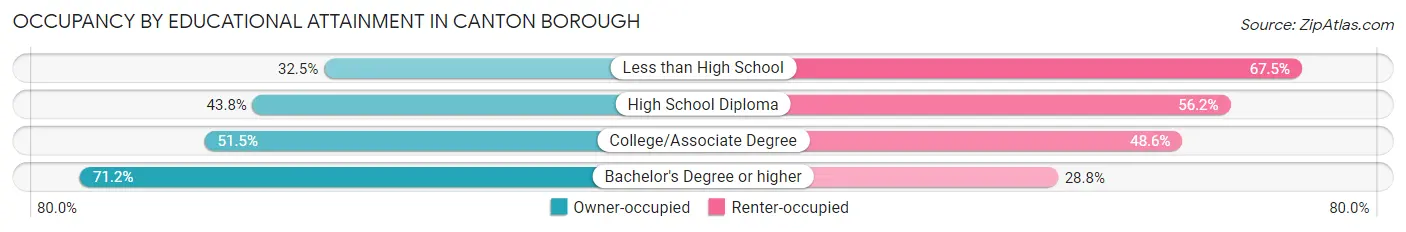
| Household Size | Owner-occupied | Renter-occupied |
| Less than High School | 26 (32.5%) | 54 (67.5%) |
| High School Diploma | 181 (43.8%) | 232 (56.2%) |
| College/Associate Degree | 71 (51.4%) | 67 (48.5%) |
| Bachelor's Degree or higher | 89 (71.2%) | 36 (28.8%) |
Occupancy by Age of Householder in Canton borough
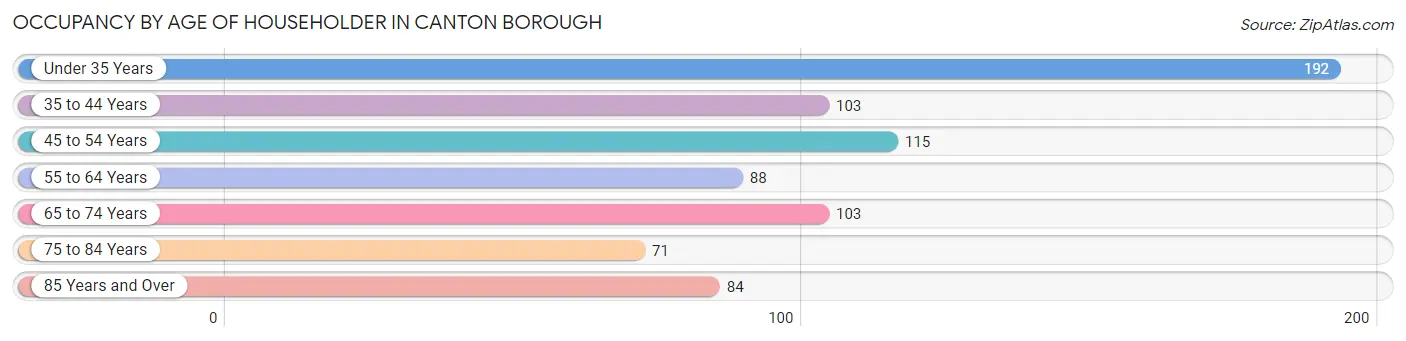
| Age Bracket | # Households | % Households |
| Under 35 Years | 192 | 25.4% |
| 35 to 44 Years | 103 | 13.6% |
| 45 to 54 Years | 115 | 15.2% |
| 55 to 64 Years | 88 | 11.6% |
| 65 to 74 Years | 103 | 13.6% |
| 75 to 84 Years | 71 | 9.4% |
| 85 Years and Over | 84 | 11.1% |
| Total | 756 | 100.0% |
Housing Finances in Canton borough
Median Income by Occupancy in Canton borough
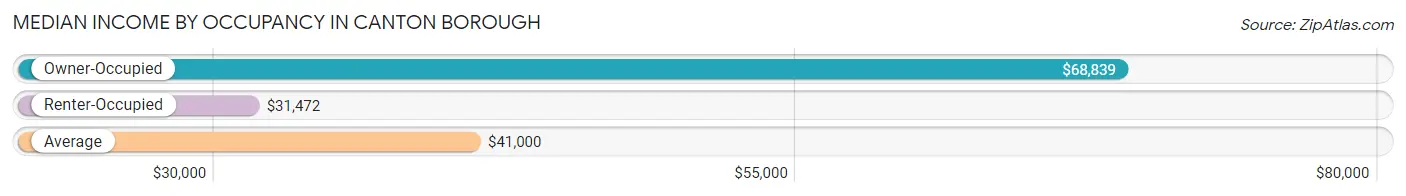
| Occupancy Type | # Households | Median Income |
| Owner-Occupied | 367 (48.5%) | $68,839 |
| Renter-Occupied | 389 (51.5%) | $31,472 |
| Average | 756 (100.0%) | $41,000 |
Occupancy by Householder Income Bracket in Canton borough
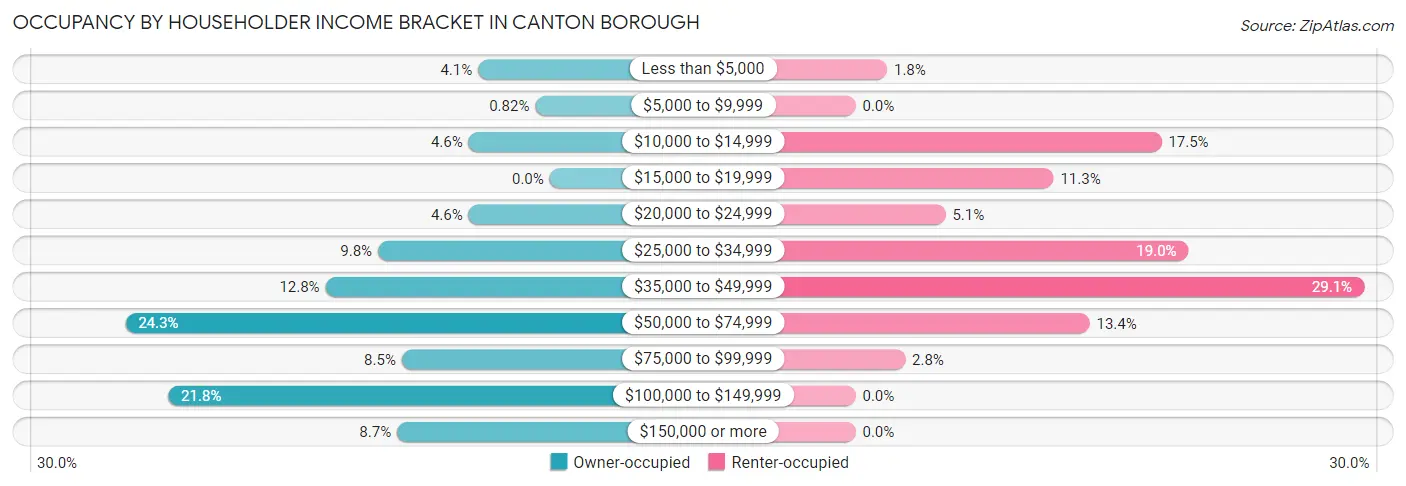
| Income Bracket | Owner-occupied | Renter-occupied |
| Less than $5,000 | 15 (4.1%) | 7 (1.8%) |
| $5,000 to $9,999 | 3 (0.8%) | 0 (0.0%) |
| $10,000 to $14,999 | 17 (4.6%) | 68 (17.5%) |
| $15,000 to $19,999 | 0 (0.0%) | 44 (11.3%) |
| $20,000 to $24,999 | 17 (4.6%) | 20 (5.1%) |
| $25,000 to $34,999 | 36 (9.8%) | 74 (19.0%) |
| $35,000 to $49,999 | 47 (12.8%) | 113 (29.0%) |
| $50,000 to $74,999 | 89 (24.2%) | 52 (13.4%) |
| $75,000 to $99,999 | 31 (8.5%) | 11 (2.8%) |
| $100,000 to $149,999 | 80 (21.8%) | 0 (0.0%) |
| $150,000 or more | 32 (8.7%) | 0 (0.0%) |
| Total | 367 (100.0%) | 389 (100.0%) |
Monthly Housing Cost Tiers in Canton borough
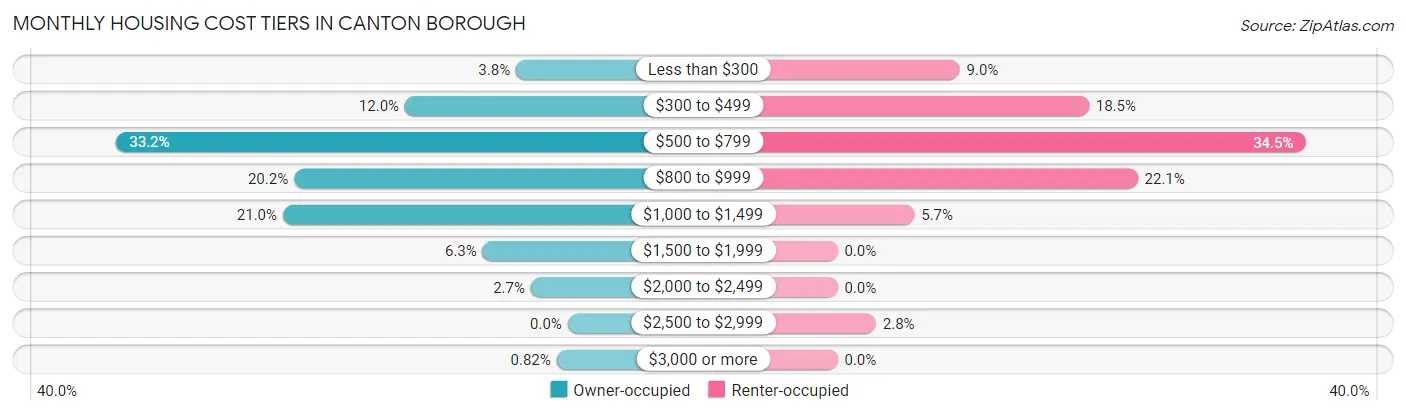
| Monthly Cost | Owner-occupied | Renter-occupied |
| Less than $300 | 14 (3.8%) | 35 (9.0%) |
| $300 to $499 | 44 (12.0%) | 72 (18.5%) |
| $500 to $799 | 122 (33.2%) | 134 (34.4%) |
| $800 to $999 | 74 (20.2%) | 86 (22.1%) |
| $1,000 to $1,499 | 77 (21.0%) | 22 (5.7%) |
| $1,500 to $1,999 | 23 (6.3%) | 0 (0.0%) |
| $2,000 to $2,499 | 10 (2.7%) | 0 (0.0%) |
| $2,500 to $2,999 | 0 (0.0%) | 11 (2.8%) |
| $3,000 or more | 3 (0.8%) | 0 (0.0%) |
| Total | 367 (100.0%) | 389 (100.0%) |
Physical Housing Characteristics in Canton borough
Housing Structures in Canton borough
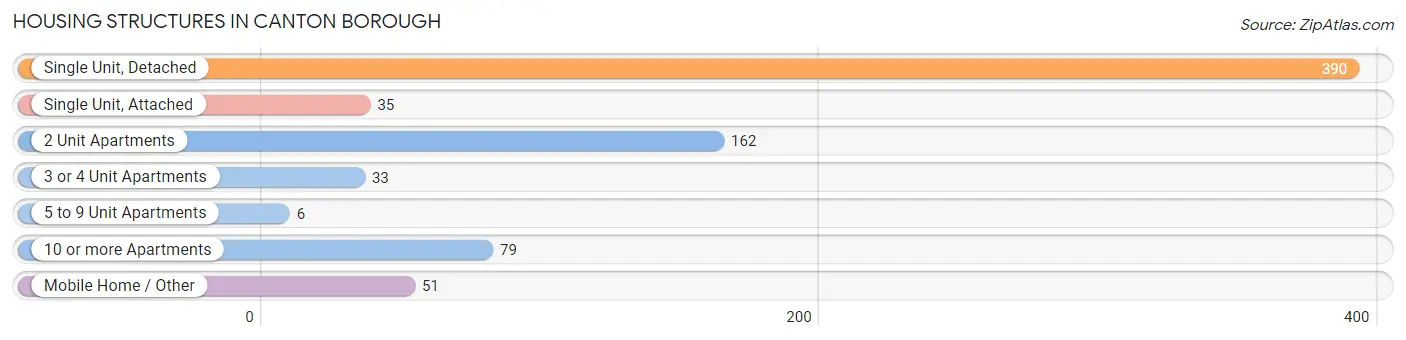
| Structure Type | # Housing Units | % Housing Units |
| Single Unit, Detached | 390 | 51.6% |
| Single Unit, Attached | 35 | 4.6% |
| 2 Unit Apartments | 162 | 21.4% |
| 3 or 4 Unit Apartments | 33 | 4.4% |
| 5 to 9 Unit Apartments | 6 | 0.8% |
| 10 or more Apartments | 79 | 10.4% |
| Mobile Home / Other | 51 | 6.8% |
| Total | 756 | 100.0% |
Housing Structures by Occupancy in Canton borough
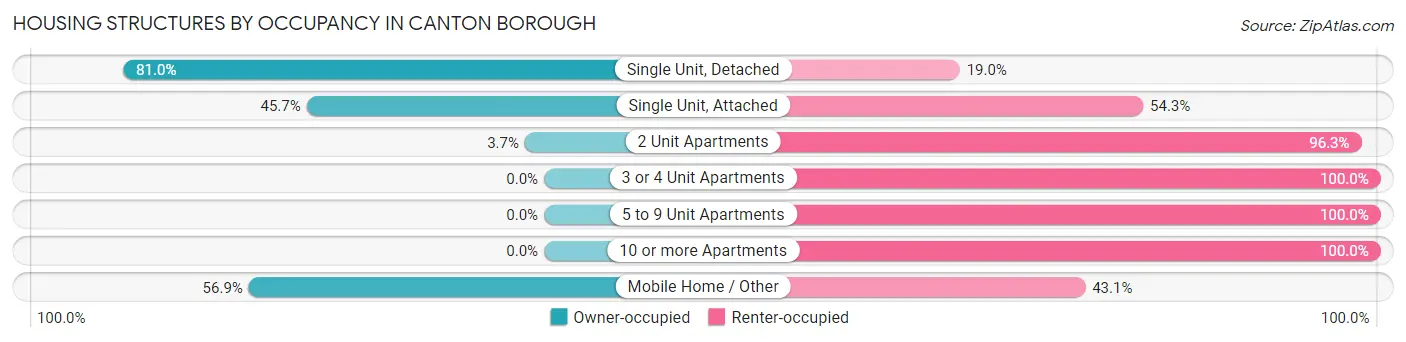
| Structure Type | Owner-occupied | Renter-occupied |
| Single Unit, Detached | 316 (81.0%) | 74 (19.0%) |
| Single Unit, Attached | 16 (45.7%) | 19 (54.3%) |
| 2 Unit Apartments | 6 (3.7%) | 156 (96.3%) |
| 3 or 4 Unit Apartments | 0 (0.0%) | 33 (100.0%) |
| 5 to 9 Unit Apartments | 0 (0.0%) | 6 (100.0%) |
| 10 or more Apartments | 0 (0.0%) | 79 (100.0%) |
| Mobile Home / Other | 29 (56.9%) | 22 (43.1%) |
| Total | 367 (48.5%) | 389 (51.5%) |
Housing Structures by Number of Rooms in Canton borough
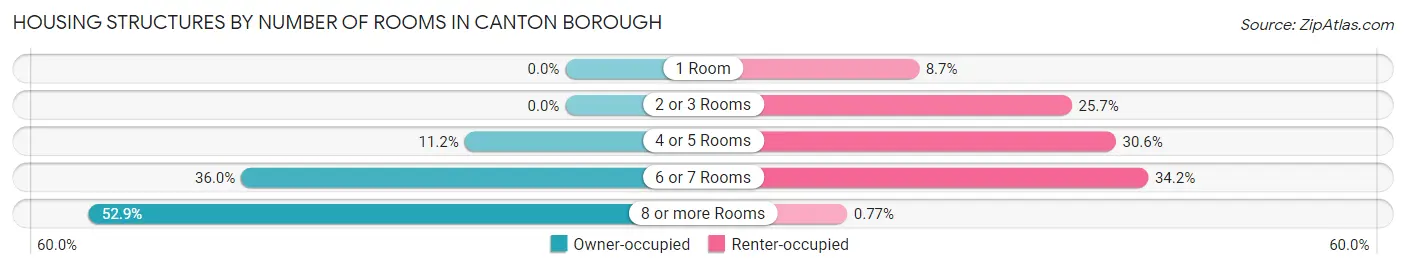
| Number of Rooms | Owner-occupied | Renter-occupied |
| 1 Room | 0 (0.0%) | 34 (8.7%) |
| 2 or 3 Rooms | 0 (0.0%) | 100 (25.7%) |
| 4 or 5 Rooms | 41 (11.2%) | 119 (30.6%) |
| 6 or 7 Rooms | 132 (36.0%) | 133 (34.2%) |
| 8 or more Rooms | 194 (52.9%) | 3 (0.8%) |
| Total | 367 (100.0%) | 389 (100.0%) |
Housing Structure by Heating Type in Canton borough
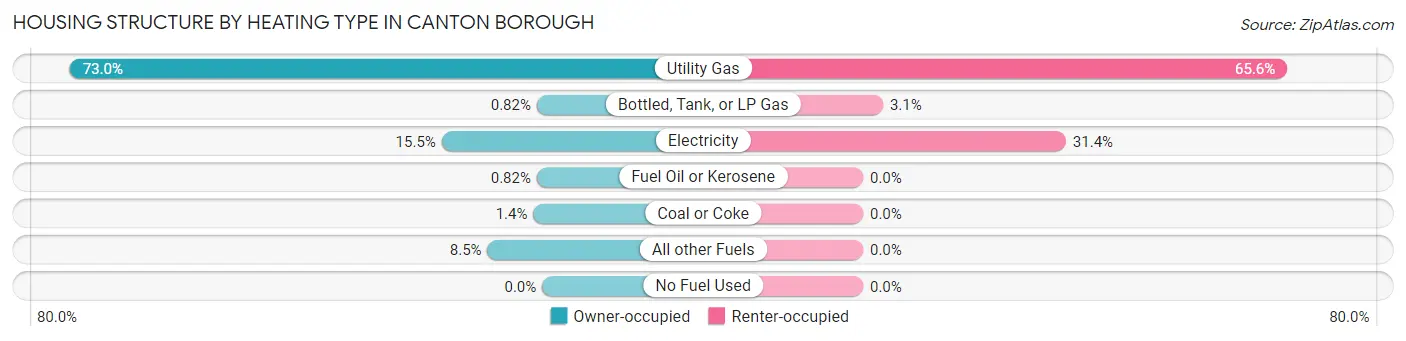
| Heating Type | Owner-occupied | Renter-occupied |
| Utility Gas | 268 (73.0%) | 255 (65.5%) |
| Bottled, Tank, or LP Gas | 3 (0.8%) | 12 (3.1%) |
| Electricity | 57 (15.5%) | 122 (31.4%) |
| Fuel Oil or Kerosene | 3 (0.8%) | 0 (0.0%) |
| Coal or Coke | 5 (1.4%) | 0 (0.0%) |
| All other Fuels | 31 (8.5%) | 0 (0.0%) |
| No Fuel Used | 0 (0.0%) | 0 (0.0%) |
| Total | 367 (100.0%) | 389 (100.0%) |
Household Vehicle Usage in Canton borough

| Vehicles per Household | Owner-occupied | Renter-occupied |
| No Vehicle | 5 (1.4%) | 157 (40.4%) |
| 1 Vehicle | 108 (29.4%) | 160 (41.1%) |
| 2 Vehicles | 125 (34.1%) | 57 (14.6%) |
| 3 or more Vehicles | 129 (35.1%) | 15 (3.9%) |
| Total | 367 (100.0%) | 389 (100.0%) |
Real Estate & Mortgages in Canton borough
Real Estate and Mortgage Overview in Canton borough
| Characteristic | Without Mortgage | With Mortgage |
| Housing Units | 176 | 191 |
| Median Property Value | $121,300 | $123,400 |
| Median Household Income | $58,462 | $18 |
| Monthly Housing Costs | $536 | $3 |
| Real Estate Taxes | $1,359 | $13 |
Property Value by Mortgage Status in Canton borough
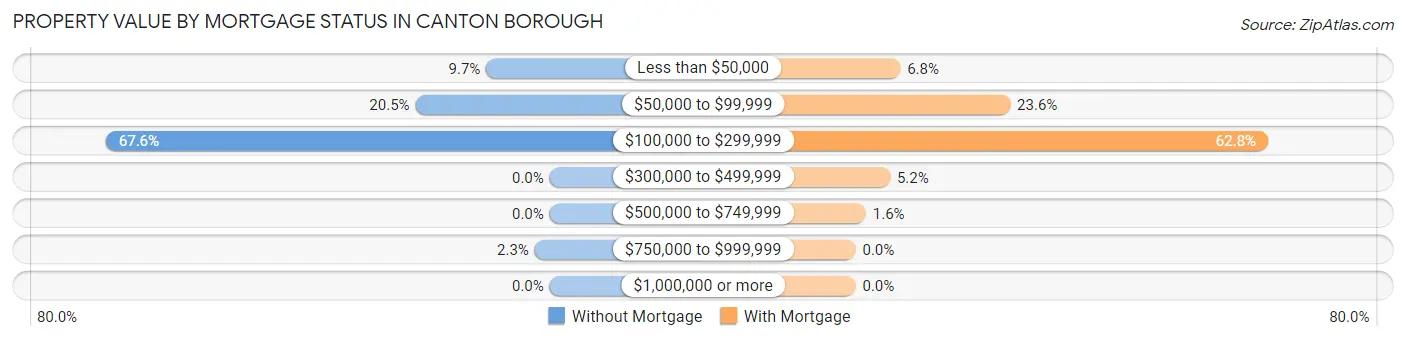
| Property Value | Without Mortgage | With Mortgage |
| Less than $50,000 | 17 (9.7%) | 13 (6.8%) |
| $50,000 to $99,999 | 36 (20.4%) | 45 (23.6%) |
| $100,000 to $299,999 | 119 (67.6%) | 120 (62.8%) |
| $300,000 to $499,999 | 0 (0.0%) | 10 (5.2%) |
| $500,000 to $749,999 | 0 (0.0%) | 3 (1.6%) |
| $750,000 to $999,999 | 4 (2.3%) | 0 (0.0%) |
| $1,000,000 or more | 0 (0.0%) | 0 (0.0%) |
| Total | 176 (100.0%) | 191 (100.0%) |
Household Income by Mortgage Status in Canton borough
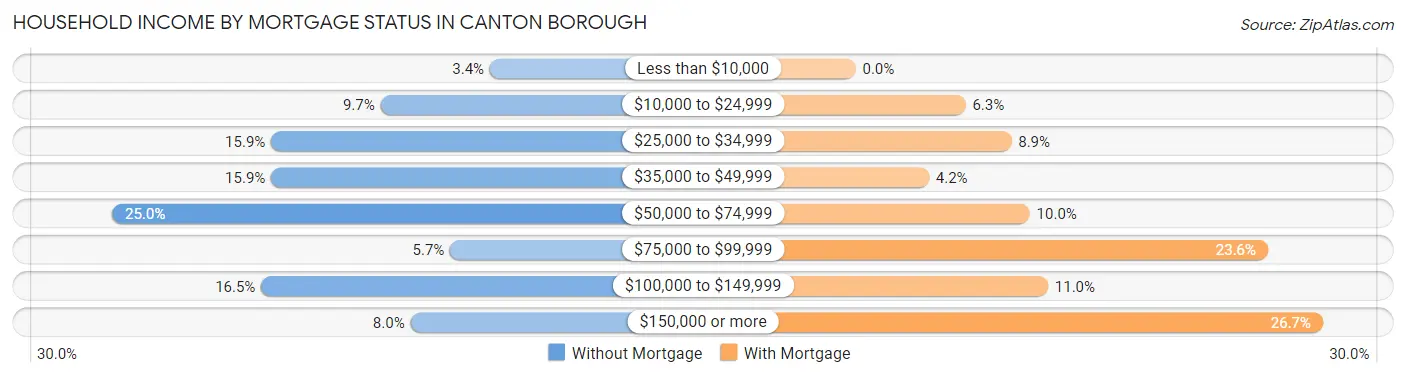
| Household Income | Without Mortgage | With Mortgage |
| Less than $10,000 | 6 (3.4%) | 0 (0.0%) |
| $10,000 to $24,999 | 17 (9.7%) | 12 (6.3%) |
| $25,000 to $34,999 | 28 (15.9%) | 17 (8.9%) |
| $35,000 to $49,999 | 28 (15.9%) | 8 (4.2%) |
| $50,000 to $74,999 | 44 (25.0%) | 19 (10.0%) |
| $75,000 to $99,999 | 10 (5.7%) | 45 (23.6%) |
| $100,000 to $149,999 | 29 (16.5%) | 21 (11.0%) |
| $150,000 or more | 14 (8.0%) | 51 (26.7%) |
| Total | 176 (100.0%) | 191 (100.0%) |
Property Value to Household Income Ratio in Canton borough
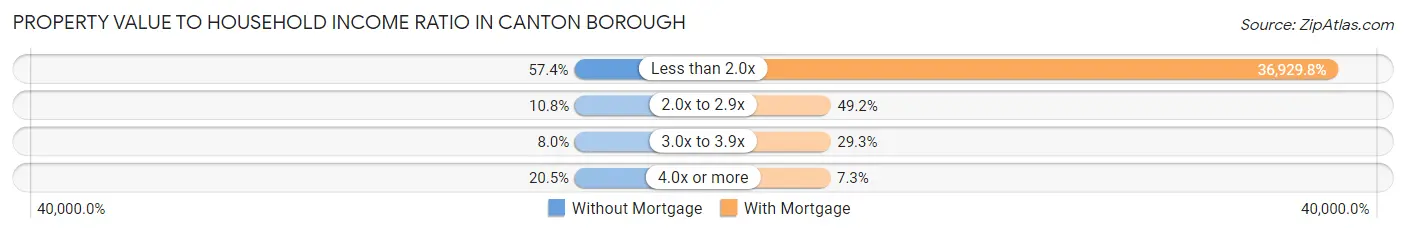
| Value-to-Income Ratio | Without Mortgage | With Mortgage |
| Less than 2.0x | 101 (57.4%) | 70,536 (36,929.8%) |
| 2.0x to 2.9x | 19 (10.8%) | 94 (49.2%) |
| 3.0x to 3.9x | 14 (8.0%) | 56 (29.3%) |
| 4.0x or more | 36 (20.4%) | 14 (7.3%) |
| Total | 176 (100.0%) | 191 (100.0%) |
Real Estate Taxes by Mortgage Status in Canton borough
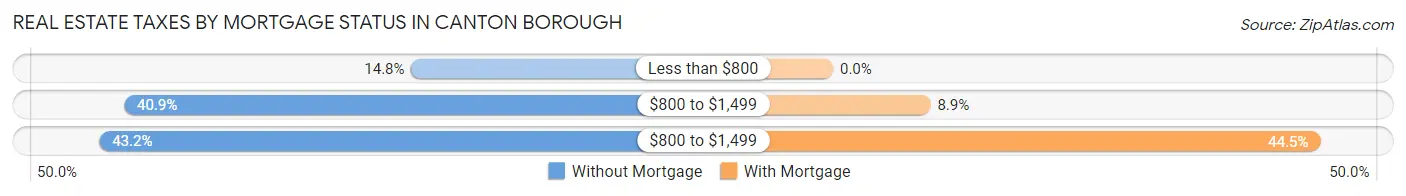
| Property Taxes | Without Mortgage | With Mortgage |
| Less than $800 | 26 (14.8%) | 0 (0.0%) |
| $800 to $1,499 | 72 (40.9%) | 17 (8.9%) |
| $800 to $1,499 | 76 (43.2%) | 85 (44.5%) |
| Total | 176 (100.0%) | 191 (100.0%) |
Health & Disability in Canton borough
Health Insurance Coverage by Age in Canton borough
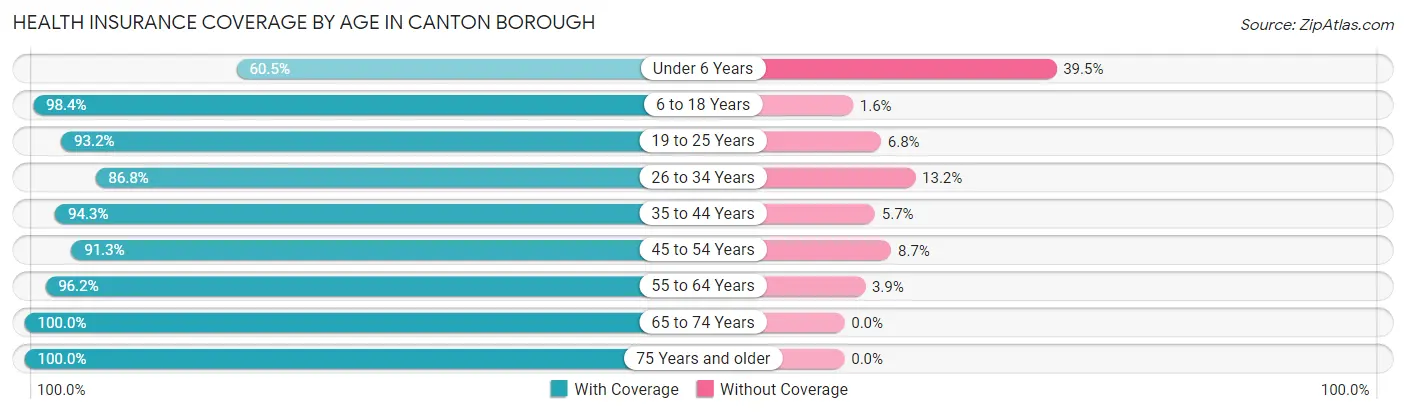
| Age Bracket | With Coverage | Without Coverage |
| Under 6 Years | 127 (60.5%) | 83 (39.5%) |
| 6 to 18 Years | 307 (98.4%) | 5 (1.6%) |
| 19 to 25 Years | 164 (93.2%) | 12 (6.8%) |
| 26 to 34 Years | 184 (86.8%) | 28 (13.2%) |
| 35 to 44 Years | 182 (94.3%) | 11 (5.7%) |
| 45 to 54 Years | 157 (91.3%) | 15 (8.7%) |
| 55 to 64 Years | 150 (96.2%) | 6 (3.8%) |
| 65 to 74 Years | 156 (100.0%) | 0 (0.0%) |
| 75 Years and older | 204 (100.0%) | 0 (0.0%) |
| Total | 1,631 (91.1%) | 160 (8.9%) |
Health Insurance Coverage by Citizenship Status in Canton borough
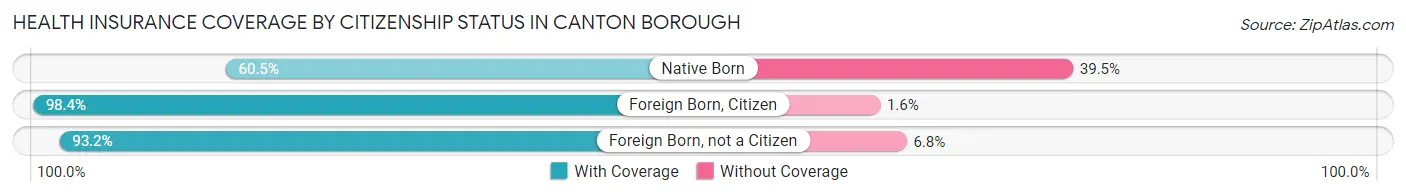
| Citizenship Status | With Coverage | Without Coverage |
| Native Born | 127 (60.5%) | 83 (39.5%) |
| Foreign Born, Citizen | 307 (98.4%) | 5 (1.6%) |
| Foreign Born, not a Citizen | 164 (93.2%) | 12 (6.8%) |
Health Insurance Coverage by Household Income in Canton borough
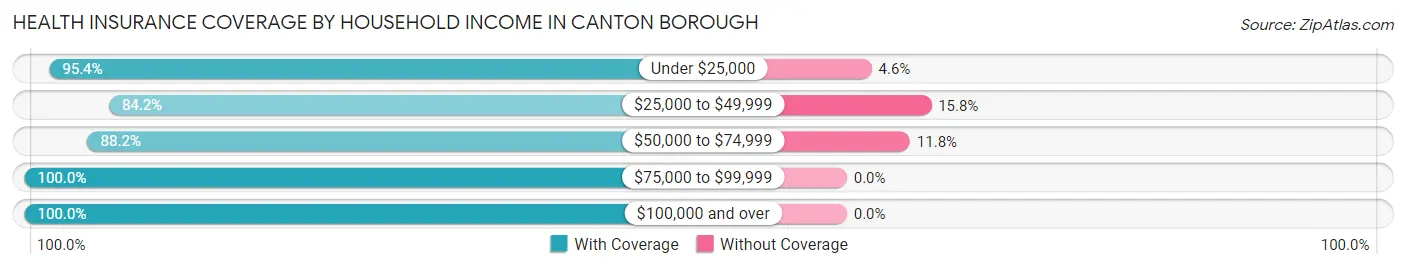
| Household Income | With Coverage | Without Coverage |
| Under $25,000 | 267 (95.4%) | 13 (4.6%) |
| $25,000 to $49,999 | 575 (84.2%) | 108 (15.8%) |
| $50,000 to $74,999 | 291 (88.2%) | 39 (11.8%) |
| $75,000 to $99,999 | 133 (100.0%) | 0 (0.0%) |
| $100,000 and over | 365 (100.0%) | 0 (0.0%) |
Public vs Private Health Insurance Coverage by Age in Canton borough
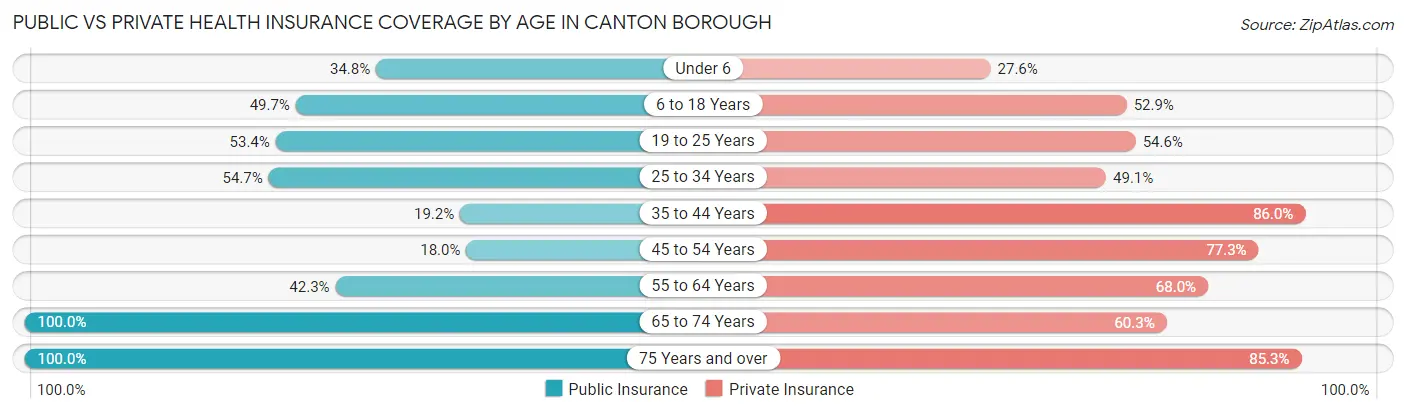
| Age Bracket | Public Insurance | Private Insurance |
| Under 6 | 73 (34.8%) | 58 (27.6%) |
| 6 to 18 Years | 155 (49.7%) | 165 (52.9%) |
| 19 to 25 Years | 94 (53.4%) | 96 (54.5%) |
| 25 to 34 Years | 116 (54.7%) | 104 (49.1%) |
| 35 to 44 Years | 37 (19.2%) | 166 (86.0%) |
| 45 to 54 Years | 31 (18.0%) | 133 (77.3%) |
| 55 to 64 Years | 66 (42.3%) | 106 (67.9%) |
| 65 to 74 Years | 156 (100.0%) | 94 (60.3%) |
| 75 Years and over | 204 (100.0%) | 174 (85.3%) |
| Total | 932 (52.0%) | 1,096 (61.2%) |
Disability Status by Sex by Age in Canton borough
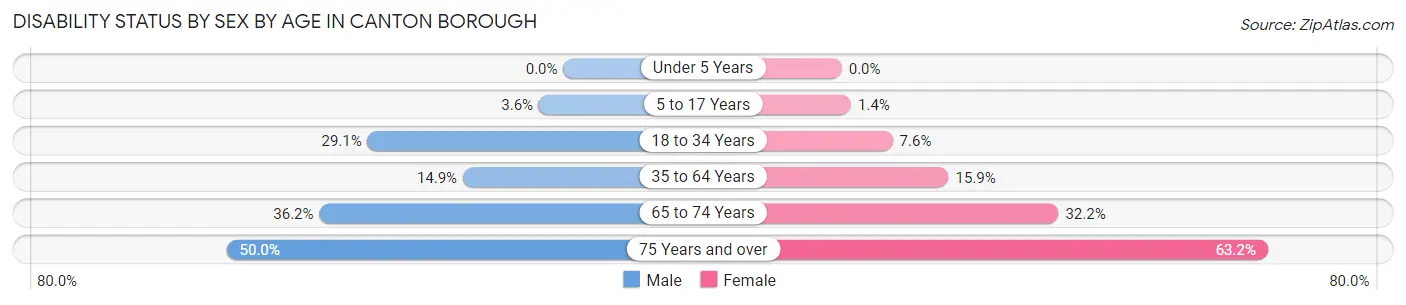
| Age Bracket | Male | Female |
| Under 5 Years | 0 (0.0%) | 0 (0.0%) |
| 5 to 17 Years | 7 (3.6%) | 2 (1.4%) |
| 18 to 34 Years | 57 (29.1%) | 16 (7.5%) |
| 35 to 64 Years | 41 (14.9%) | 39 (15.9%) |
| 65 to 74 Years | 25 (36.2%) | 28 (32.2%) |
| 75 Years and over | 34 (50.0%) | 86 (63.2%) |
Disability Class by Sex by Age in Canton borough
Disability Class: Hearing Difficulty
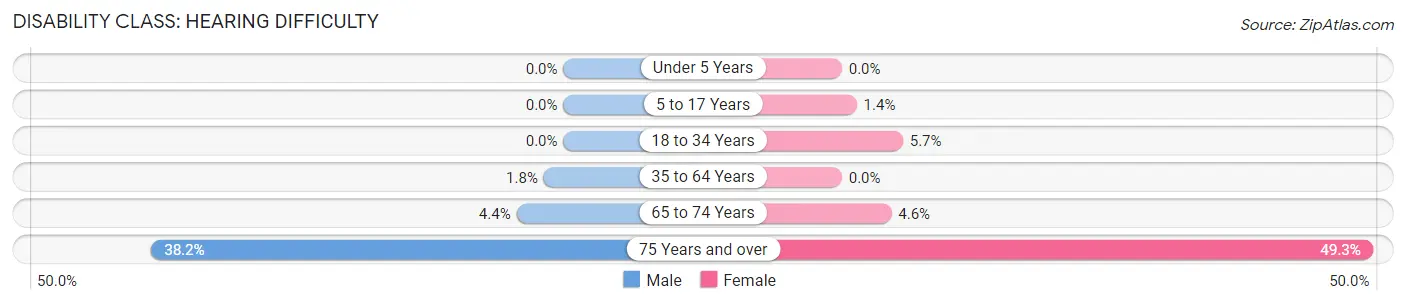
| Age Bracket | Male | Female |
| Under 5 Years | 0 (0.0%) | 0 (0.0%) |
| 5 to 17 Years | 0 (0.0%) | 2 (1.4%) |
| 18 to 34 Years | 0 (0.0%) | 12 (5.7%) |
| 35 to 64 Years | 5 (1.8%) | 0 (0.0%) |
| 65 to 74 Years | 3 (4.3%) | 4 (4.6%) |
| 75 Years and over | 26 (38.2%) | 67 (49.3%) |
Disability Class: Vision Difficulty
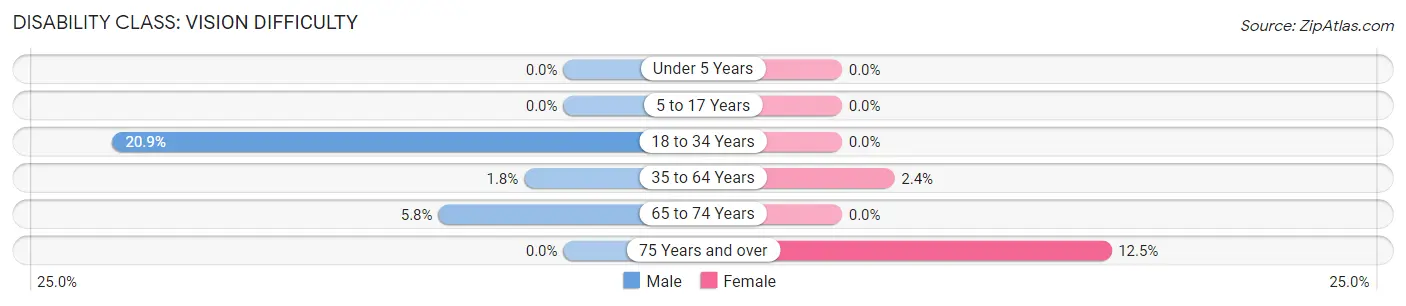
| Age Bracket | Male | Female |
| Under 5 Years | 0 (0.0%) | 0 (0.0%) |
| 5 to 17 Years | 0 (0.0%) | 0 (0.0%) |
| 18 to 34 Years | 41 (20.9%) | 0 (0.0%) |
| 35 to 64 Years | 5 (1.8%) | 6 (2.4%) |
| 65 to 74 Years | 4 (5.8%) | 0 (0.0%) |
| 75 Years and over | 0 (0.0%) | 17 (12.5%) |
Disability Class: Cognitive Difficulty
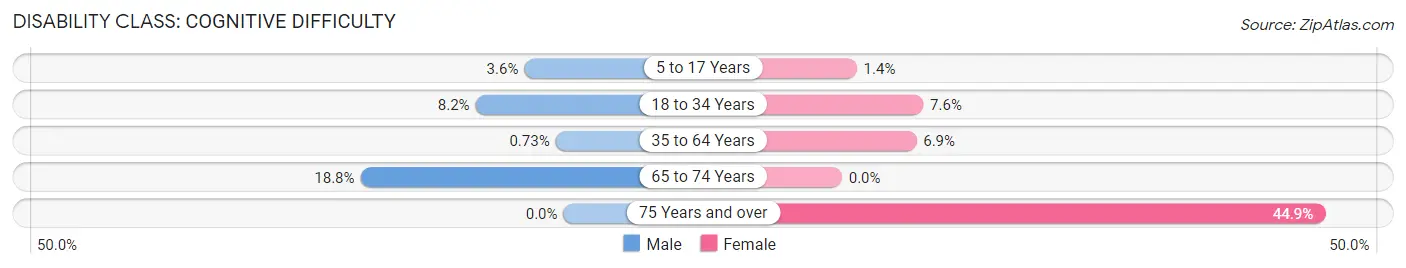
| Age Bracket | Male | Female |
| 5 to 17 Years | 7 (3.6%) | 2 (1.4%) |
| 18 to 34 Years | 16 (8.2%) | 16 (7.5%) |
| 35 to 64 Years | 2 (0.7%) | 17 (6.9%) |
| 65 to 74 Years | 13 (18.8%) | 0 (0.0%) |
| 75 Years and over | 0 (0.0%) | 61 (44.9%) |
Disability Class: Ambulatory Difficulty
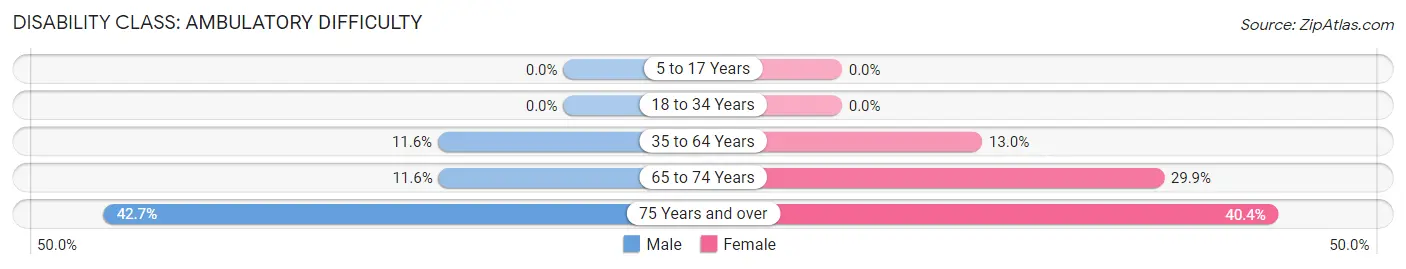
| Age Bracket | Male | Female |
| 5 to 17 Years | 0 (0.0%) | 0 (0.0%) |
| 18 to 34 Years | 0 (0.0%) | 0 (0.0%) |
| 35 to 64 Years | 32 (11.6%) | 32 (13.0%) |
| 65 to 74 Years | 8 (11.6%) | 26 (29.9%) |
| 75 Years and over | 29 (42.6%) | 55 (40.4%) |
Disability Class: Self-Care Difficulty
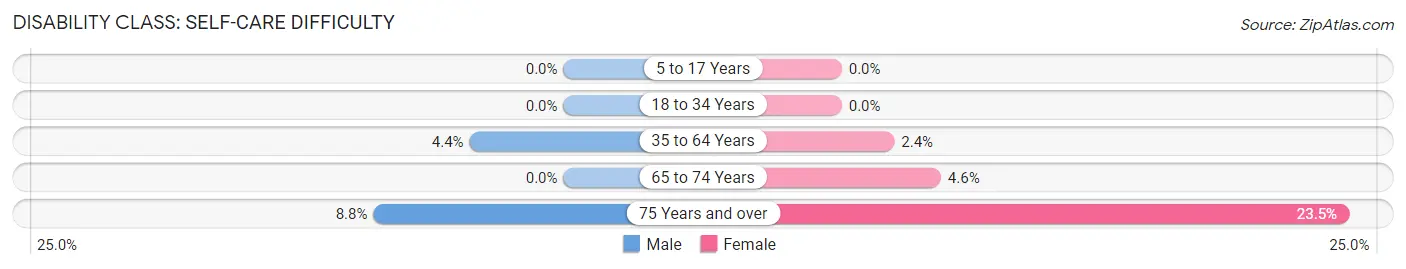
| Age Bracket | Male | Female |
| 5 to 17 Years | 0 (0.0%) | 0 (0.0%) |
| 18 to 34 Years | 0 (0.0%) | 0 (0.0%) |
| 35 to 64 Years | 12 (4.4%) | 6 (2.4%) |
| 65 to 74 Years | 0 (0.0%) | 4 (4.6%) |
| 75 Years and over | 6 (8.8%) | 32 (23.5%) |
Technology Access in Canton borough
Computing Device Access in Canton borough
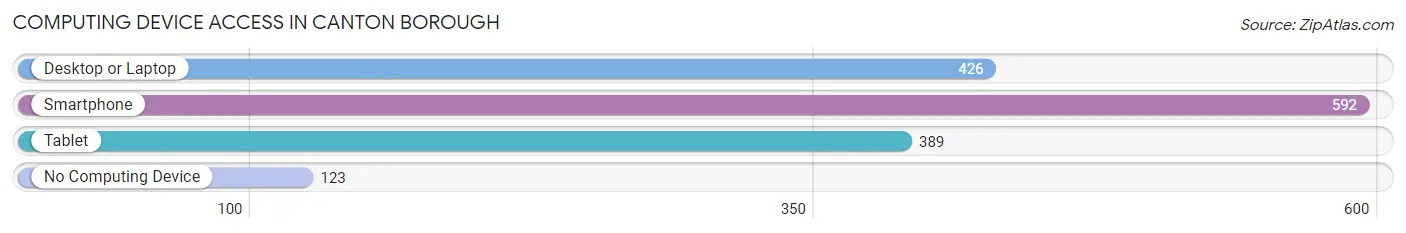
| Device Type | # Households | % Households |
| Desktop or Laptop | 426 | 56.4% |
| Smartphone | 592 | 78.3% |
| Tablet | 389 | 51.5% |
| No Computing Device | 123 | 16.3% |
| Total | 756 | 100.0% |
Internet Access in Canton borough
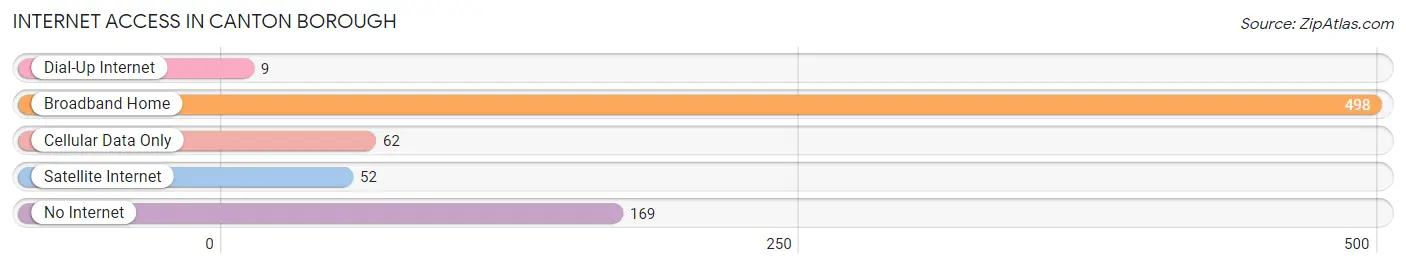
| Internet Type | # Households | % Households |
| Dial-Up Internet | 9 | 1.2% |
| Broadband Home | 498 | 65.9% |
| Cellular Data Only | 62 | 8.2% |
| Satellite Internet | 52 | 6.9% |
| No Internet | 169 | 22.4% |
| Total | 756 | 100.0% |
Canton borough Summary
Canton Borough is a small borough located in the state of Pennsylvania, in the United States. It is situated in the northern part of the state, in the county of Bradford. The borough is located in the Endless Mountains region of the state, and is surrounded by the townships of Canton, Leroy, and Burlington. The population of the borough was 1,845 at the 2010 census.
History
The area that is now Canton Borough was first settled in the late 1700s by settlers from Connecticut. The first settler was a man named John Brown, who arrived in 1790. He was followed by other settlers from Connecticut, including the families of John and William Smith, who arrived in 1795. The area was originally known as Smithfield, and the first post office was established in 1808.
In 1812, the area was officially incorporated as the Borough of Canton. The name was chosen in honor of the Chinese city of Canton, which was a major trading port at the time. The borough was an important stop on the stagecoach route between Philadelphia and Buffalo, and the town grew rapidly in the early 19th century.
The borough was home to several industries, including a tannery, a sawmill, a gristmill, and a woolen mill. The town also had several stores, a hotel, and a school. The railroad arrived in 1872, and the town continued to grow.
Geography
Canton Borough is located in the northern part of the state of Pennsylvania, in the county of Bradford. It is situated in the Endless Mountains region of the state, and is surrounded by the townships of Canton, Leroy, and Burlington. The borough is located at an elevation of 1,845 feet (562 m).
The borough covers an area of 1.2 square miles (3.2 km2), all of which is land. The borough is located in the Susquehanna River watershed, and is drained by the Towanda Creek. The borough is located in the humid continental climate zone, and has cold, snowy winters and warm, humid summers.
Economy
The economy of Canton Borough is largely based on agriculture and tourism. The borough is home to several farms, which produce a variety of crops, including corn, soybeans, hay, and wheat. The borough is also home to several tourist attractions, including the Bradford County Historical Society, the Bradford County Fairgrounds, and the Canton Area Historical Society.
The borough is also home to several small businesses, including restaurants, retail stores, and service providers. The borough is served by the Canton Area School District, which provides educational services to the borough and the surrounding townships.
Demographics
As of the 2010 census, the population of Canton Borough was 1,845. The racial makeup of the borough was 97.3% White, 0.7% African American, 0.2% Native American, 0.2% Asian, 0.2% from other races, and 1.4% from two or more races. Hispanic or Latino of any race were 0.9% of the population.
The median household income in the borough was $37,917, and the median family income was $45,000. The per capita income in the borough was $18,945. About 11.3% of families and 14.2% of the population were below the poverty line, including 19.2% of those under age 18 and 8.3% of those age 65 or over.
Common Questions
What is Per Capita Income in Canton borough?
Per Capita income in Canton borough is $23,316.
What is the Median Family Income in Canton borough?
Median Family Income in Canton borough is $56,635.
What is the Median Household income in Canton borough?
Median Household Income in Canton borough is $41,000.
What is Income or Wage Gap in Canton borough?
Income or Wage Gap in Canton borough is 55.4%.
Women in Canton borough earn 44.6 cents for every dollar earned by a man.
What is Inequality or Gini Index in Canton borough?
Inequality or Gini Index in Canton borough is 0.43.
What is the Total Population of Canton borough?
Total Population of Canton borough is 1,791.
What is the Total Male Population of Canton borough?
Total Male Population of Canton borough is 821.
What is the Total Female Population of Canton borough?
Total Female Population of Canton borough is 970.
What is the Ratio of Males per 100 Females in Canton borough?
There are 84.64 Males per 100 Females in Canton borough.
What is the Ratio of Females per 100 Males in Canton borough?
There are 118.15 Females per 100 Males in Canton borough.
What is the Median Population Age in Canton borough?
Median Population Age in Canton borough is 34.2 Years.
What is the Average Family Size in Canton borough
Average Family Size in Canton borough is 3.1 People.
What is the Average Household Size in Canton borough
Average Household Size in Canton borough is 2.4 People.
How Large is the Labor Force in Canton borough?
There are 749 People in the Labor Forcein in Canton borough.
What is the Percentage of People in the Labor Force in Canton borough?
55.6% of People are in the Labor Force in Canton borough.
What is the Unemployment Rate in Canton borough?
Unemployment Rate in Canton borough is 6.0%.