Brownstown, PA Map & Demographics
Brownstown Map
Brownstown Overview
$40,986
PER CAPITA INCOME
$120,630
AVG FAMILY INCOME
$111,164
AVG HOUSEHOLD INCOME
64.9%
WAGE / INCOME GAP [ % ]
35.1¢/ $1
WAGE / INCOME GAP [ $ ]
0.34
INEQUALITY / GINI INDEX
3,582
TOTAL POPULATION
1,697
MALE POPULATION
1,885
FEMALE POPULATION
90.03
MALES / 100 FEMALES
111.08
FEMALES / 100 MALES
29.9
MEDIAN AGE
3.4
AVG FAMILY SIZE
3.0
AVG HOUSEHOLD SIZE
2,032
LABOR FORCE [ PEOPLE ]
74.1%
PERCENT IN LABOR FORCE
6.7%
UNEMPLOYMENT RATE
Brownstown Zip Codes
Brownstown Area Codes
Income in Brownstown
Income Overview in Brownstown
Per Capita Income in Brownstown is $40,986, while median incomes of families and households are $120,630 and $111,164 respectively.
| Characteristic | Number | Measure |
| Per Capita Income | 3,582 | $40,986 |
| Median Family Income | 986 | $120,630 |
| Mean Family Income | 986 | $132,000 |
| Median Household Income | 1,207 | $111,164 |
| Mean Household Income | 1,207 | $117,301 |
| Income Deficit | 986 | $0 |
| Wage / Income Gap (%) | 3,582 | 64.86% |
| Wage / Income Gap ($) | 3,582 | 35.14¢ per $1 |
| Gini / Inequality Index | 3,582 | 0.34 |
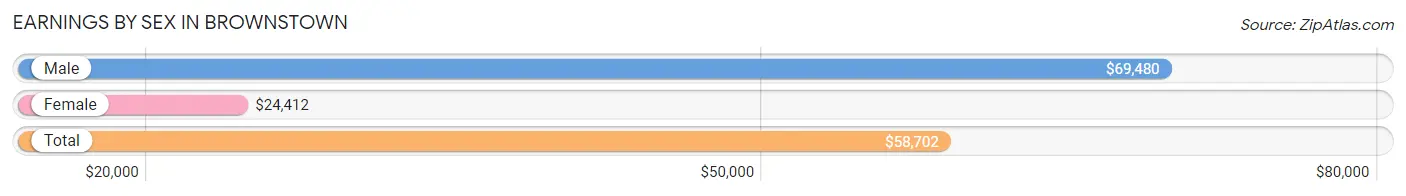
Earnings by Sex in Brownstown
Average Earnings in Brownstown are $58,702, $69,480 for men and $24,412 for women, a difference of 64.9%.
| Sex | Number | Average Earnings |
| Male | 1,108 (51.8%) | $69,480 |
| Female | 1,030 (48.2%) | $24,412 |
| Total | 2,138 (100.0%) | $58,702 |
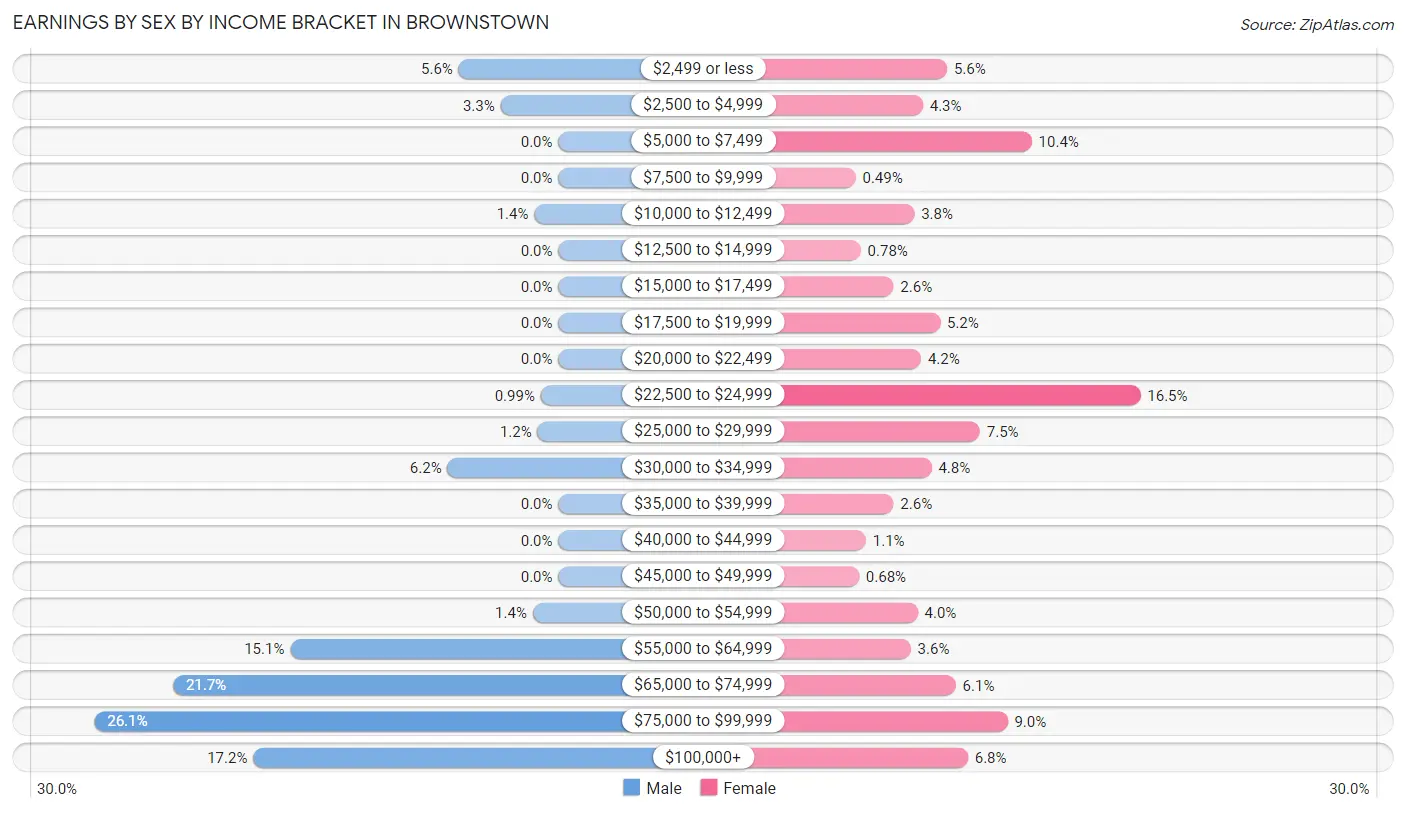
Earnings by Sex by Income Bracket in Brownstown
The most common earnings brackets in Brownstown are $75,000 to $99,999 for men (289 | 26.1%) and $22,500 to $24,999 for women (170 | 16.5%).
| Income | Male | Female |
| $2,499 or less | 62 (5.6%) | 58 (5.6%) |
| $2,500 to $4,999 | 36 (3.3%) | 44 (4.3%) |
| $5,000 to $7,499 | 0 (0.0%) | 107 (10.4%) |
| $7,500 to $9,999 | 0 (0.0%) | 5 (0.5%) |
| $10,000 to $12,499 | 15 (1.3%) | 39 (3.8%) |
| $12,500 to $14,999 | 0 (0.0%) | 8 (0.8%) |
| $15,000 to $17,499 | 0 (0.0%) | 27 (2.6%) |
| $17,500 to $19,999 | 0 (0.0%) | 54 (5.2%) |
| $20,000 to $22,499 | 0 (0.0%) | 43 (4.2%) |
| $22,500 to $24,999 | 11 (1.0%) | 170 (16.5%) |
| $25,000 to $29,999 | 13 (1.2%) | 77 (7.5%) |
| $30,000 to $34,999 | 69 (6.2%) | 49 (4.8%) |
| $35,000 to $39,999 | 0 (0.0%) | 27 (2.6%) |
| $40,000 to $44,999 | 0 (0.0%) | 11 (1.1%) |
| $45,000 to $49,999 | 0 (0.0%) | 7 (0.7%) |
| $50,000 to $54,999 | 16 (1.4%) | 41 (4.0%) |
| $55,000 to $64,999 | 167 (15.1%) | 37 (3.6%) |
| $65,000 to $74,999 | 240 (21.7%) | 63 (6.1%) |
| $75,000 to $99,999 | 289 (26.1%) | 93 (9.0%) |
| $100,000+ | 190 (17.2%) | 70 (6.8%) |
| Total | 1,108 (100.0%) | 1,030 (100.0%) |
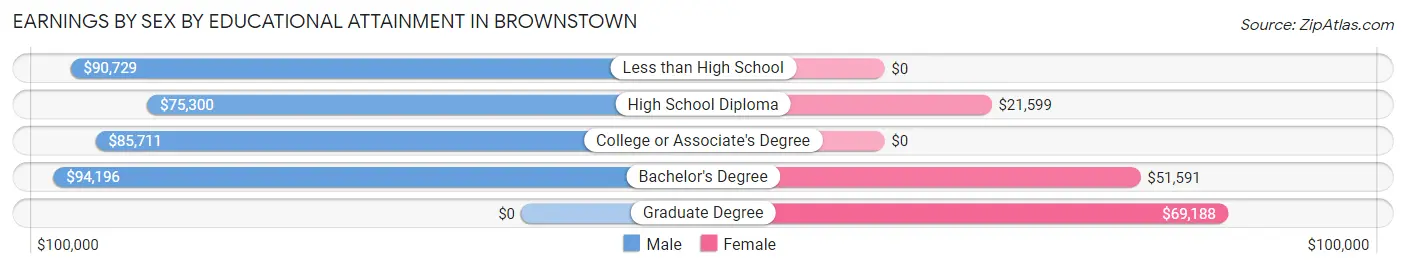
Earnings by Sex by Educational Attainment in Brownstown
Average earnings in Brownstown are $77,419 for men and $34,079 for women, a difference of 56.0%. Men with an educational attainment of bachelor's degree enjoy the highest average annual earnings of $94,196, while those with high school diploma education earn the least with $75,300. Women with an educational attainment of graduate degree earn the most with the average annual earnings of $69,188, while those with high school diploma education have the smallest earnings of $21,599.
| Educational Attainment | Male Income | Female Income |
| Less than High School | $90,729 | $0 |
| High School Diploma | $75,300 | $21,599 |
| College or Associate's Degree | $85,711 | $0 |
| Bachelor's Degree | $94,196 | $51,591 |
| Graduate Degree | - | - |
| Total | $77,419 | $34,079 |
Family Income in Brownstown
Family Income Brackets in Brownstown
According to the Brownstown family income data, there are 419 families falling into the $100,000 to $149,999 income range, which is the most common income bracket and makes up 42.5% of all families.
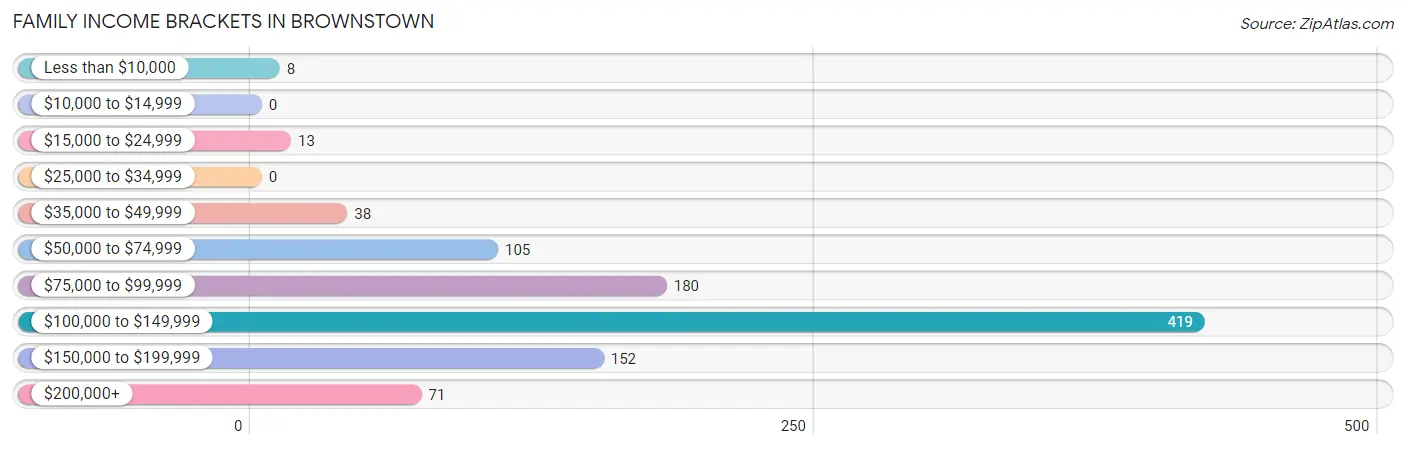
| Income Bracket | # Families | % Families |
| Less than $10,000 | 8 | 0.8% |
| $10,000 to $14,999 | 0 | 0.0% |
| $15,000 to $24,999 | 13 | 1.3% |
| $25,000 to $34,999 | 0 | 0.0% |
| $35,000 to $49,999 | 38 | 3.9% |
| $50,000 to $74,999 | 105 | 10.6% |
| $75,000 to $99,999 | 180 | 18.3% |
| $100,000 to $149,999 | 419 | 42.5% |
| $150,000 to $199,999 | 152 | 15.4% |
| $200,000+ | 71 | 7.2% |
Family Income by Famaliy Size in Brownstown
5-person families (103 | 10.4%) account for the highest median family income in Brownstown with $153,315 per family, while 2-person families (484 | 49.1%) have the highest median income of $46,016 per family member.
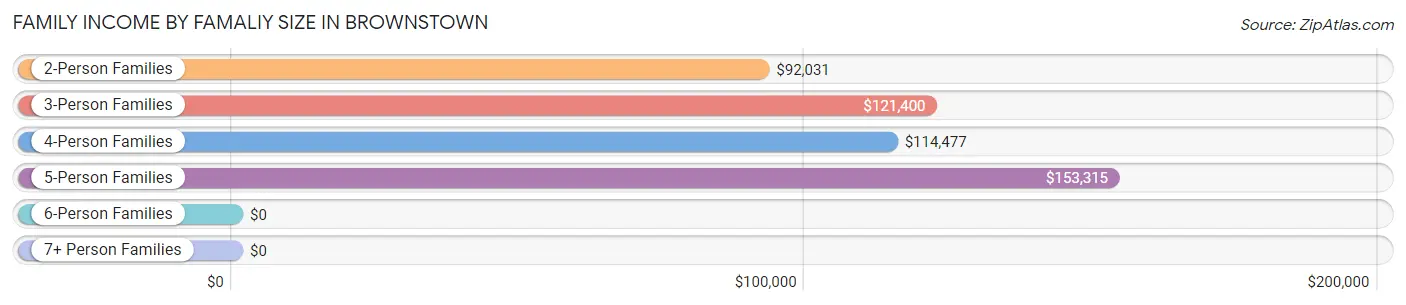
| Income Bracket | # Families | Median Income |
| 2-Person Families | 484 (49.1%) | $92,031 |
| 3-Person Families | 140 (14.2%) | $121,400 |
| 4-Person Families | 204 (20.7%) | $114,477 |
| 5-Person Families | 103 (10.4%) | $153,315 |
| 6-Person Families | 5 (0.5%) | $0 |
| 7+ Person Families | 50 (5.1%) | $0 |
| Total | 986 (100.0%) | $120,630 |
Family Income by Number of Earners in Brownstown
The median family income in Brownstown is $120,630, with families comprising 2 earners (636) having the highest median family income of $122,105, while families with no earners (56) have the lowest median family income of $39,091, accounting for 64.5% and 5.7% of families, respectively.
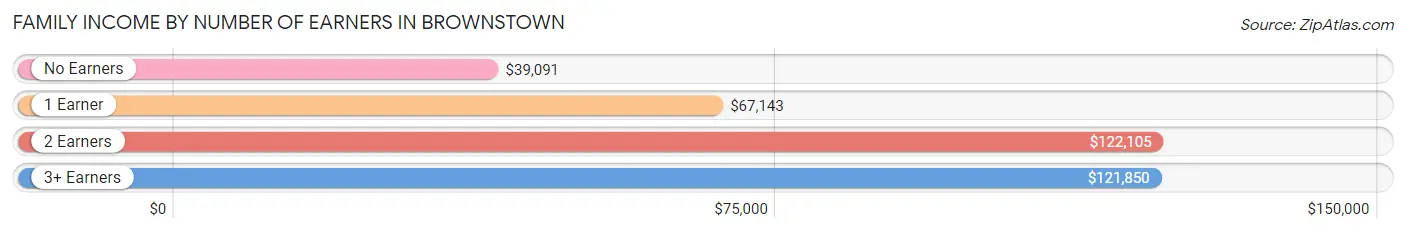
| Number of Earners | # Families | Median Income |
| No Earners | 56 (5.7%) | $39,091 |
| 1 Earner | 116 (11.8%) | $67,143 |
| 2 Earners | 636 (64.5%) | $122,105 |
| 3+ Earners | 178 (18.0%) | $121,850 |
| Total | 986 (100.0%) | $120,630 |
Household Income in Brownstown
Household Income Brackets in Brownstown
With 427 households falling in the category, the $100,000 to $149,999 income range is the most frequent in Brownstown, accounting for 35.4% of all households.
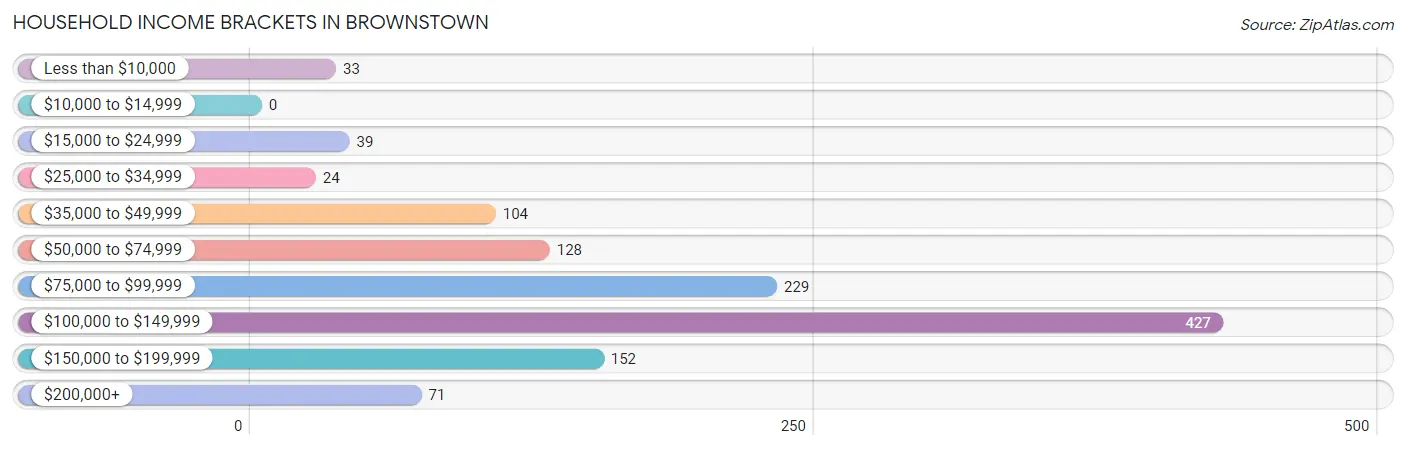
| Income Bracket | # Households | % Households |
| Less than $10,000 | 33 | 2.7% |
| $10,000 to $14,999 | 0 | 0.0% |
| $15,000 to $24,999 | 39 | 3.2% |
| $25,000 to $34,999 | 24 | 2.0% |
| $35,000 to $49,999 | 104 | 8.6% |
| $50,000 to $74,999 | 128 | 10.6% |
| $75,000 to $99,999 | 229 | 19.0% |
| $100,000 to $149,999 | 427 | 35.4% |
| $150,000 to $199,999 | 152 | 12.6% |
| $200,000+ | 71 | 5.9% |
Household Income by Householder Age in Brownstown
The median household income in Brownstown is $111,164, with the highest median household income of $123,068 found in the 45 to 64 years age bracket for the primary householder. A total of 413 households (34.2%) fall into this category. Meanwhile, the 65+ years age bracket for the primary householder has the lowest median household income of $49,525, with 339 households (28.1%) in this group.
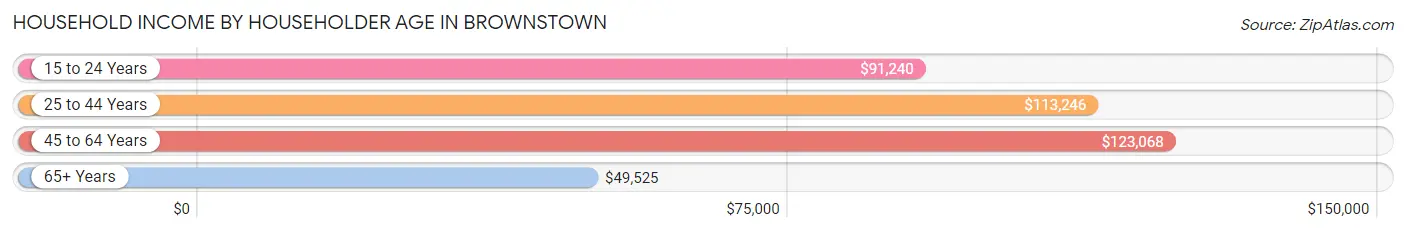
| Income Bracket | # Households | Median Income |
| 15 to 24 Years | 157 (13.0%) | $91,240 |
| 25 to 44 Years | 298 (24.7%) | $113,246 |
| 45 to 64 Years | 413 (34.2%) | $123,068 |
| 65+ Years | 339 (28.1%) | $49,525 |
| Total | 1,207 (100.0%) | $111,164 |
Poverty in Brownstown
Income Below Poverty by Sex and Age in Brownstown
With 3.2% poverty level for males and 1.2% for females among the residents of Brownstown, 75 year old and over males and 65 to 74 year old females are the most vulnerable to poverty, with 13 males (18.8%) and 12 females (7.3%) in their respective age groups living below the poverty level.
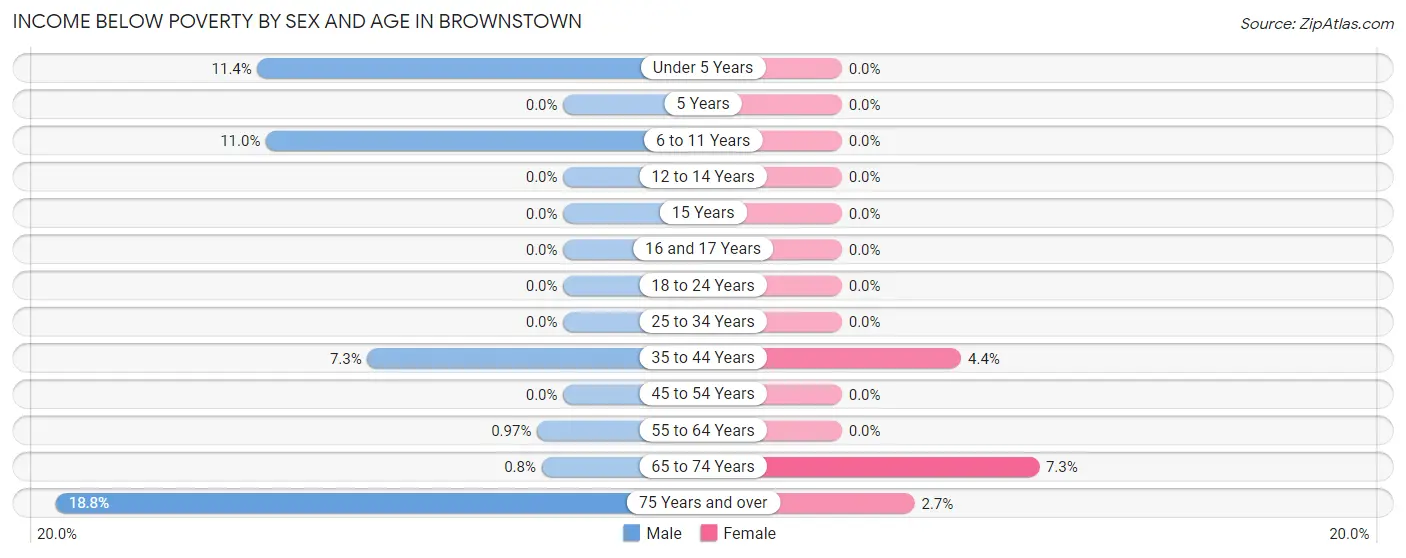
| Age Bracket | Male | Female |
| Under 5 Years | 16 (11.4%) | 0 (0.0%) |
| 5 Years | 0 (0.0%) | 0 (0.0%) |
| 6 to 11 Years | 15 (11.0%) | 0 (0.0%) |
| 12 to 14 Years | 0 (0.0%) | 0 (0.0%) |
| 15 Years | 0 (0.0%) | 0 (0.0%) |
| 16 and 17 Years | 0 (0.0%) | 0 (0.0%) |
| 18 to 24 Years | 0 (0.0%) | 0 (0.0%) |
| 25 to 34 Years | 0 (0.0%) | 0 (0.0%) |
| 35 to 44 Years | 8 (7.3%) | 7 (4.4%) |
| 45 to 54 Years | 0 (0.0%) | 0 (0.0%) |
| 55 to 64 Years | 2 (1.0%) | 0 (0.0%) |
| 65 to 74 Years | 1 (0.8%) | 12 (7.3%) |
| 75 Years and over | 13 (18.8%) | 4 (2.7%) |
| Total | 55 (3.2%) | 23 (1.2%) |
Income Above Poverty by Sex and Age in Brownstown
According to the poverty statistics in Brownstown, males aged 5 years and females aged under 5 years are the age groups that are most secure financially, with 100.0% of males and 100.0% of females in these age groups living above the poverty line.
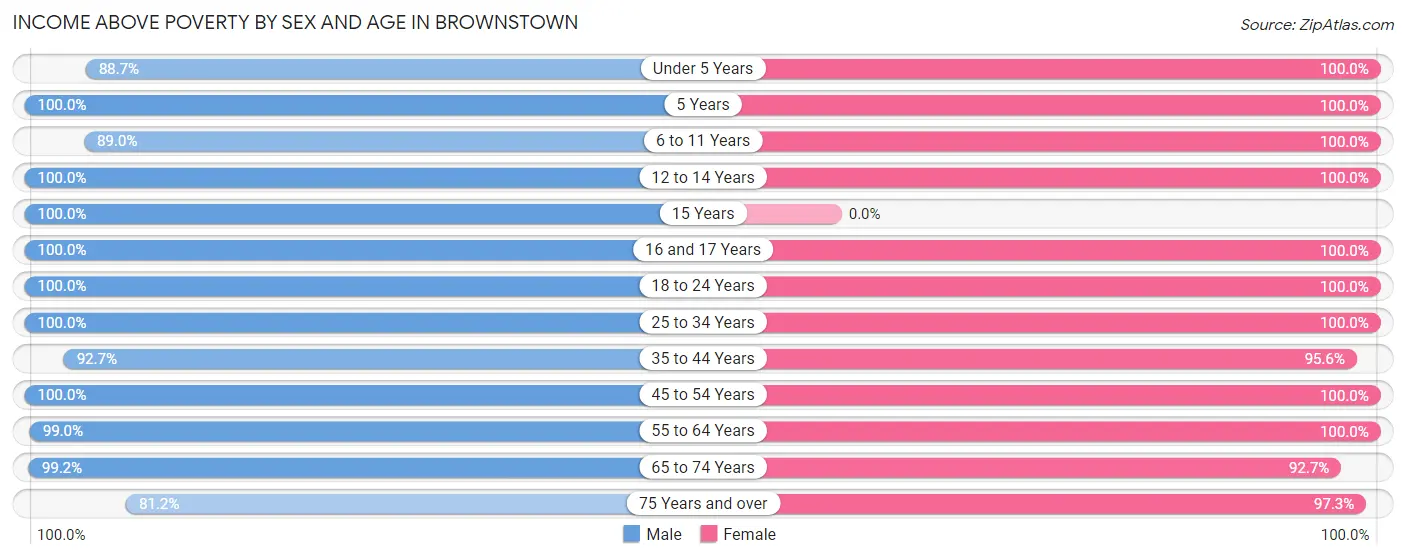
| Age Bracket | Male | Female |
| Under 5 Years | 125 (88.6%) | 107 (100.0%) |
| 5 Years | 44 (100.0%) | 28 (100.0%) |
| 6 to 11 Years | 121 (89.0%) | 223 (100.0%) |
| 12 to 14 Years | 25 (100.0%) | 73 (100.0%) |
| 15 Years | 63 (100.0%) | 0 (0.0%) |
| 16 and 17 Years | 107 (100.0%) | 103 (100.0%) |
| 18 to 24 Years | 273 (100.0%) | 268 (100.0%) |
| 25 to 34 Years | 181 (100.0%) | 200 (100.0%) |
| 35 to 44 Years | 102 (92.7%) | 151 (95.6%) |
| 45 to 54 Years | 217 (100.0%) | 185 (100.0%) |
| 55 to 64 Years | 204 (99.0%) | 228 (100.0%) |
| 65 to 74 Years | 124 (99.2%) | 152 (92.7%) |
| 75 Years and over | 56 (81.2%) | 144 (97.3%) |
| Total | 1,642 (96.8%) | 1,862 (98.8%) |
Income Below Poverty Among Married-Couple Families in Brownstown
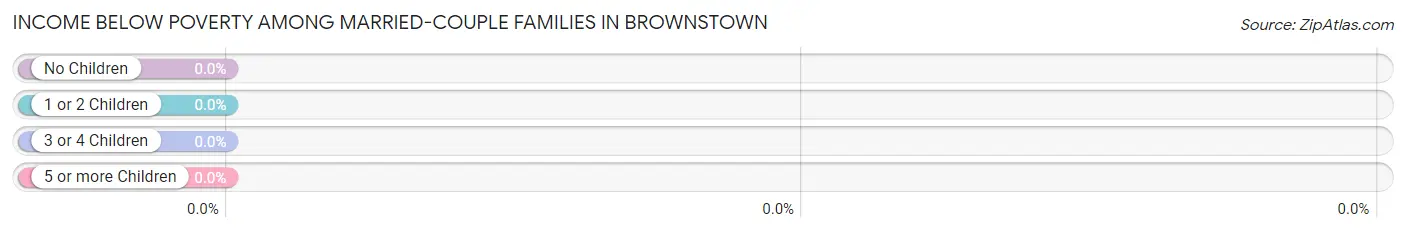
| Children | Above Poverty | Below Poverty |
| No Children | 538 (100.0%) | 0 (0.0%) |
| 1 or 2 Children | 290 (100.0%) | 0 (0.0%) |
| 3 or 4 Children | 64 (100.0%) | 0 (0.0%) |
| 5 or more Children | 50 (100.0%) | 0 (0.0%) |
| Total | 942 (100.0%) | 0 (0.0%) |
Income Below Poverty Among Single-Parent Households in Brownstown
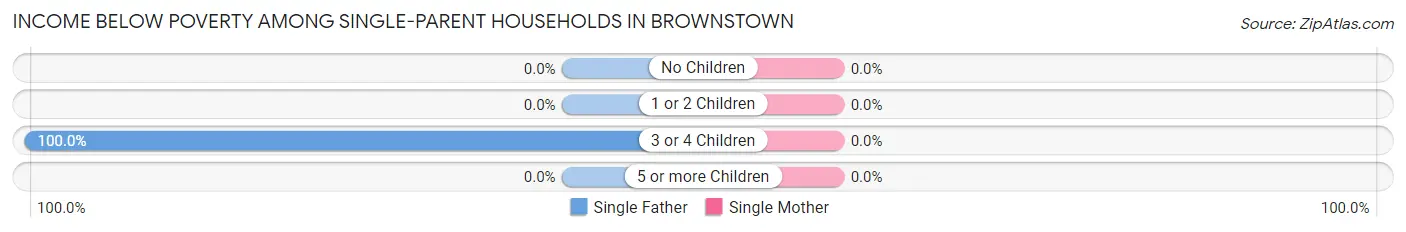
| Children | Single Father | Single Mother |
| No Children | 0 (0.0%) | 0 (0.0%) |
| 1 or 2 Children | 0 (0.0%) | 0 (0.0%) |
| 3 or 4 Children | 8 (100.0%) | 0 (0.0%) |
| 5 or more Children | 0 (0.0%) | 0 (0.0%) |
| Total | 8 (100.0%) | 0 (0.0%) |
Income Below Poverty Among Married-Couple vs Single-Parent Households in Brownstown
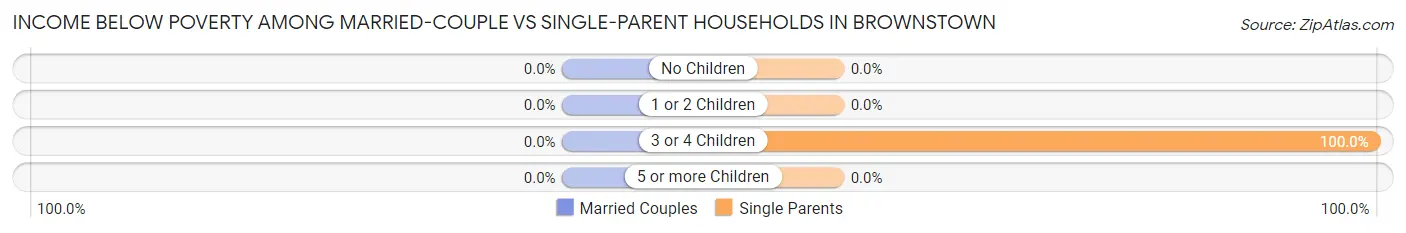
| Children | Married-Couple Families | Single-Parent Households |
| No Children | 0 (0.0%) | 0 (0.0%) |
| 1 or 2 Children | 0 (0.0%) | 0 (0.0%) |
| 3 or 4 Children | 0 (0.0%) | 8 (100.0%) |
| 5 or more Children | 0 (0.0%) | 0 (0.0%) |
| Total | 0 (0.0%) | 8 (18.2%) |
Race in Brownstown
The most populous races in Brownstown are White / Caucasian (2,829 | 79.0%), Asian (363 | 10.1%), and Hispanic or Latino (240 | 6.7%).
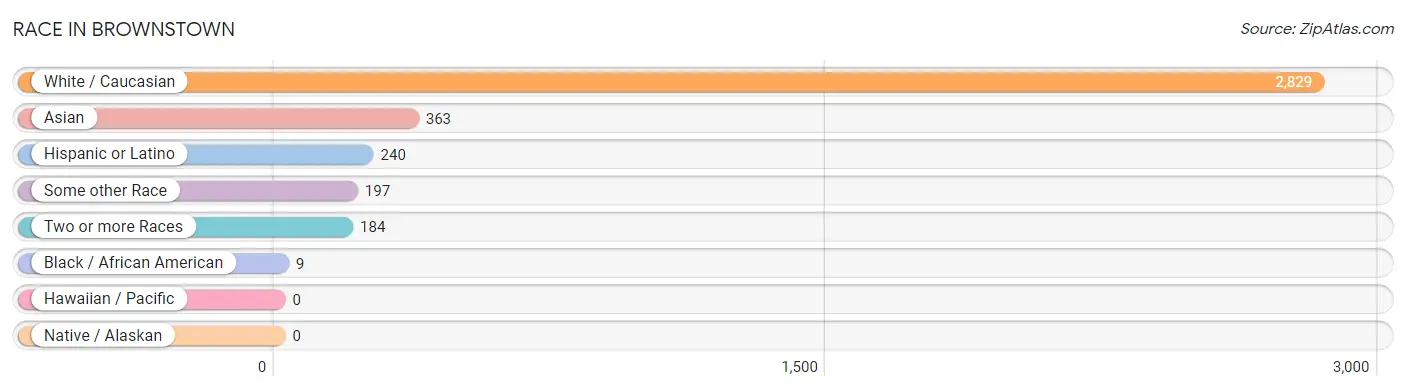
| Race | # Population | % Population |
| Asian | 363 | 10.1% |
| Black / African American | 9 | 0.3% |
| Hawaiian / Pacific | 0 | 0.0% |
| Hispanic or Latino | 240 | 6.7% |
| Native / Alaskan | 0 | 0.0% |
| White / Caucasian | 2,829 | 79.0% |
| Two or more Races | 184 | 5.1% |
| Some other Race | 197 | 5.5% |
| Total | 3,582 | 100.0% |
Ancestry in Brownstown
The most populous ancestries reported in Brownstown are German (946 | 26.4%), Swedish (461 | 12.9%), Italian (281 | 7.8%), Irish (232 | 6.5%), and Swiss (212 | 5.9%), together accounting for 59.5% of all Brownstown residents.
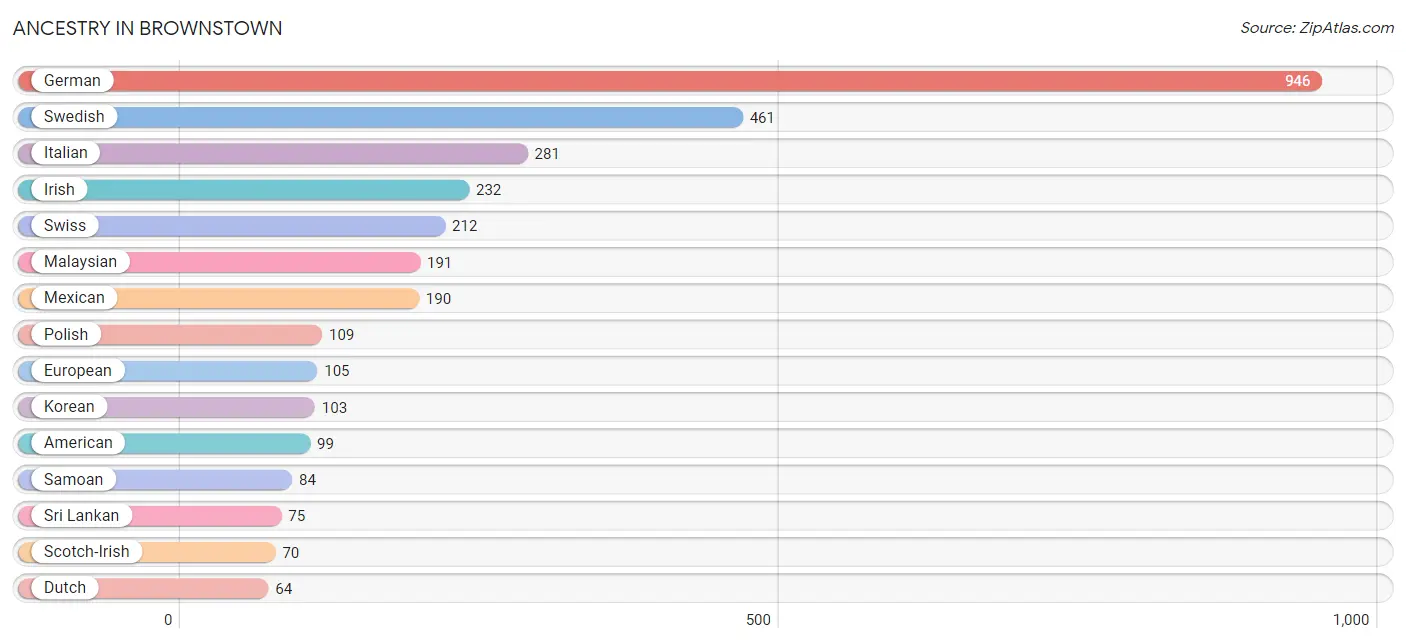
| Ancestry | # Population | % Population |
| American | 99 | 2.8% |
| British | 32 | 0.9% |
| Dutch | 64 | 1.8% |
| English | 24 | 0.7% |
| European | 105 | 2.9% |
| French | 14 | 0.4% |
| German | 946 | 26.4% |
| Greek | 13 | 0.4% |
| Haitian | 31 | 0.9% |
| Indian (Asian) | 32 | 0.9% |
| Irish | 232 | 6.5% |
| Italian | 281 | 7.8% |
| Korean | 103 | 2.9% |
| Lithuanian | 23 | 0.6% |
| Malaysian | 191 | 5.3% |
| Mexican | 190 | 5.3% |
| Norwegian | 15 | 0.4% |
| Pennsylvania German | 12 | 0.3% |
| Polish | 109 | 3.0% |
| Puerto Rican | 50 | 1.4% |
| Samoan | 84 | 2.4% |
| Scotch-Irish | 70 | 1.9% |
| Sri Lankan | 75 | 2.1% |
| Swedish | 461 | 12.9% |
| Swiss | 212 | 5.9% |
| Welsh | 52 | 1.5% | View All 26 Rows |
Immigrants in Brownstown
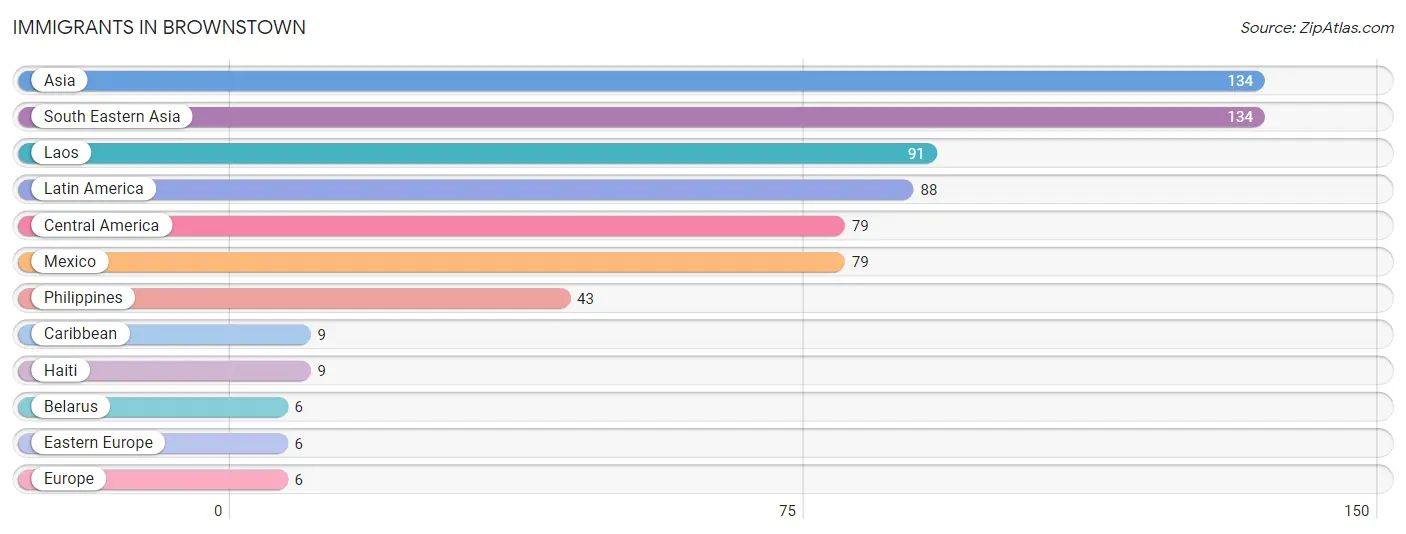
The most numerous immigrant groups reported in Brownstown came from Asia (134 | 3.7%), South Eastern Asia (134 | 3.7%), Laos (91 | 2.5%), Latin America (88 | 2.5%), and Central America (79 | 2.2%), together accounting for 14.7% of all Brownstown residents.
| Immigration Origin | # Population | % Population |
| Asia | 134 | 3.7% |
| Belarus | 6 | 0.2% |
| Caribbean | 9 | 0.3% |
| Central America | 79 | 2.2% |
| Eastern Europe | 6 | 0.2% |
| Europe | 6 | 0.2% |
| Haiti | 9 | 0.3% |
| Laos | 91 | 2.5% |
| Latin America | 88 | 2.5% |
| Mexico | 79 | 2.2% |
| Philippines | 43 | 1.2% |
| South Eastern Asia | 134 | 3.7% | View All 12 Rows |
Sex and Age in Brownstown
Sex and Age in Brownstown
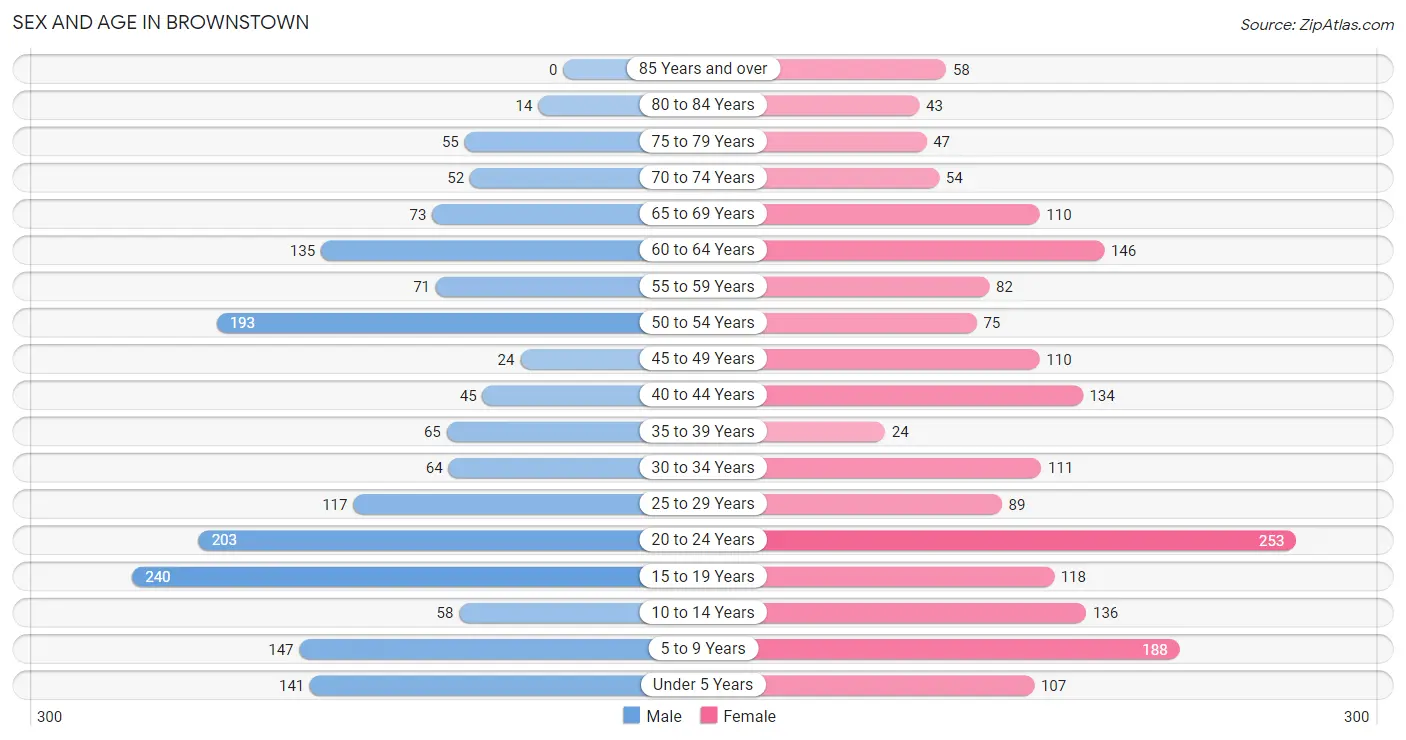
The most populous age groups in Brownstown are 15 to 19 Years (240 | 14.1%) for men and 20 to 24 Years (253 | 13.4%) for women.
| Age Bracket | Male | Female |
| Under 5 Years | 141 (8.3%) | 107 (5.7%) |
| 5 to 9 Years | 147 (8.7%) | 188 (10.0%) |
| 10 to 14 Years | 58 (3.4%) | 136 (7.2%) |
| 15 to 19 Years | 240 (14.1%) | 118 (6.3%) |
| 20 to 24 Years | 203 (12.0%) | 253 (13.4%) |
| 25 to 29 Years | 117 (6.9%) | 89 (4.7%) |
| 30 to 34 Years | 64 (3.8%) | 111 (5.9%) |
| 35 to 39 Years | 65 (3.8%) | 24 (1.3%) |
| 40 to 44 Years | 45 (2.6%) | 134 (7.1%) |
| 45 to 49 Years | 24 (1.4%) | 110 (5.8%) |
| 50 to 54 Years | 193 (11.4%) | 75 (4.0%) |
| 55 to 59 Years | 71 (4.2%) | 82 (4.3%) |
| 60 to 64 Years | 135 (8.0%) | 146 (7.7%) |
| 65 to 69 Years | 73 (4.3%) | 110 (5.8%) |
| 70 to 74 Years | 52 (3.1%) | 54 (2.9%) |
| 75 to 79 Years | 55 (3.2%) | 47 (2.5%) |
| 80 to 84 Years | 14 (0.8%) | 43 (2.3%) |
| 85 Years and over | 0 (0.0%) | 58 (3.1%) |
| Total | 1,697 (100.0%) | 1,885 (100.0%) |
Families and Households in Brownstown
Median Family Size in Brownstown
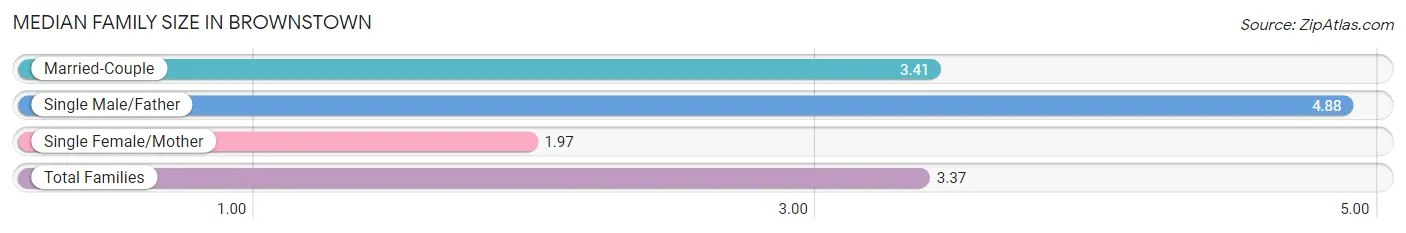
The median family size in Brownstown is 3.37 persons per family, with single male/father families (8 | 0.8%) accounting for the largest median family size of 4.88 persons per family. On the other hand, single female/mother families (36 | 3.6%) represent the smallest median family size with 1.97 persons per family.
| Family Type | # Families | Family Size |
| Married-Couple | 942 (95.5%) | 3.41 |
| Single Male/Father | 8 (0.8%) | 4.88 |
| Single Female/Mother | 36 (3.6%) | 1.97 |
| Total Families | 986 (100.0%) | 3.37 |
Median Household Size in Brownstown
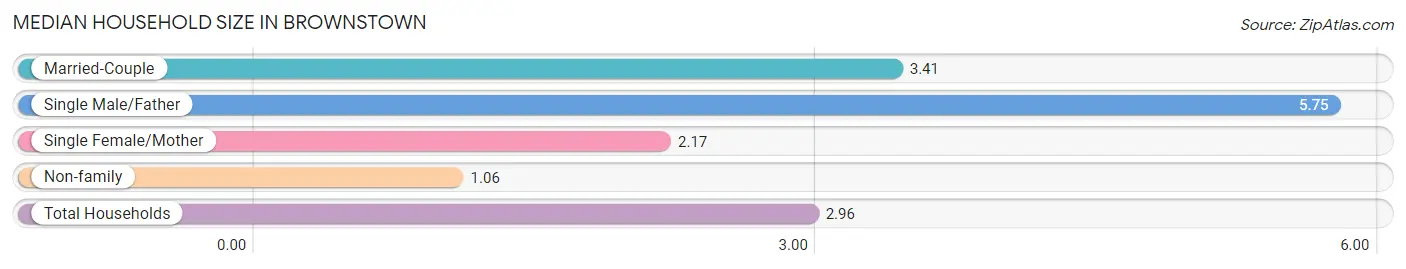
The median household size in Brownstown is 2.96 persons per household, with single male/father households (8 | 0.7%) accounting for the largest median household size of 5.75 persons per household. non-family households (221 | 18.3%) represent the smallest median household size with 1.06 persons per household.
| Household Type | # Households | Household Size |
| Married-Couple | 942 (78.0%) | 3.41 |
| Single Male/Father | 8 (0.7%) | 5.75 |
| Single Female/Mother | 36 (3.0%) | 2.17 |
| Non-family | 221 (18.3%) | 1.06 |
| Total Households | 1,207 (100.0%) | 2.96 |
Household Size by Marriage Status in Brownstown
Out of a total of 1,207 households in Brownstown, 986 (81.7%) are family households, while 221 (18.3%) are nonfamily households. The most numerous type of family households are 2-person households, comprising 477, and the most common type of nonfamily households are 1-person households, comprising 210.
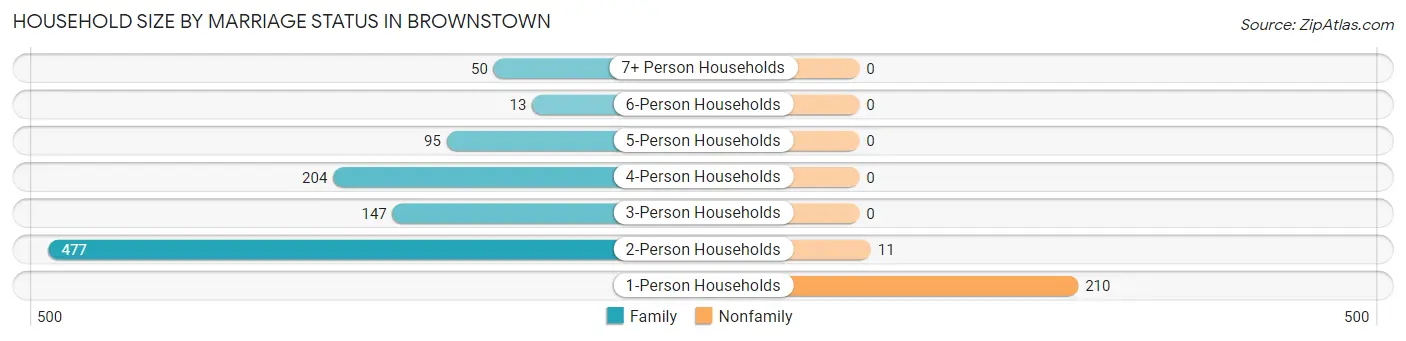
| Household Size | Family Households | Nonfamily Households |
| 1-Person Households | - | 210 (17.4%) |
| 2-Person Households | 477 (39.5%) | 11 (0.9%) |
| 3-Person Households | 147 (12.2%) | 0 (0.0%) |
| 4-Person Households | 204 (16.9%) | 0 (0.0%) |
| 5-Person Households | 95 (7.9%) | 0 (0.0%) |
| 6-Person Households | 13 (1.1%) | 0 (0.0%) |
| 7+ Person Households | 50 (4.1%) | 0 (0.0%) |
| Total | 986 (81.7%) | 221 (18.3%) |
Female Fertility in Brownstown
Fertility by Age in Brownstown
Average fertility rate in Brownstown is 53.0 births per 1,000 women. Women in the age bracket of 20 to 34 years have the highest fertility rate with 99.0 births per 1,000 women. Women in the age bracket of 20 to 34 years acount for 100.0% of all women with births.
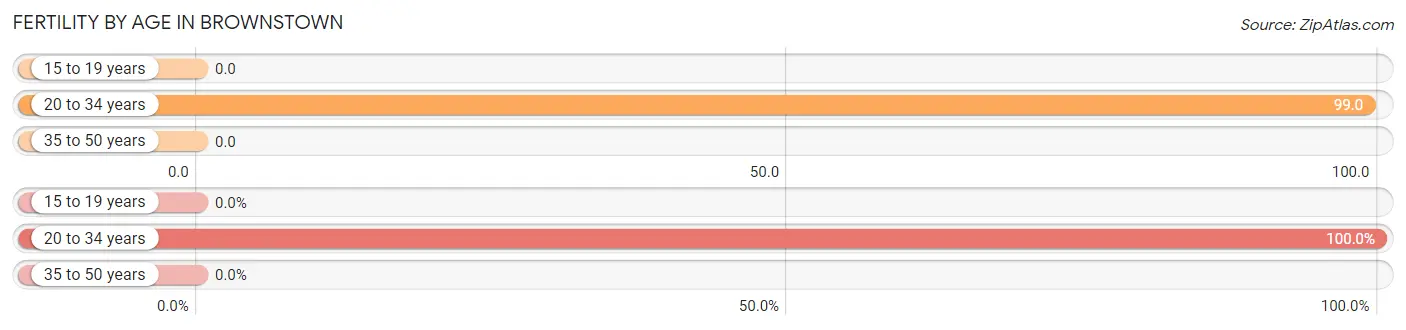
| Age Bracket | Women with Births | Births / 1,000 Women |
| 15 to 19 years | 0 (0.0%) | 0.0 |
| 20 to 34 years | 45 (100.0%) | 99.0 |
| 35 to 50 years | 0 (0.0%) | 0.0 |
| Total | 45 (100.0%) | 53.0 |
Fertility by Age by Marriage Status in Brownstown
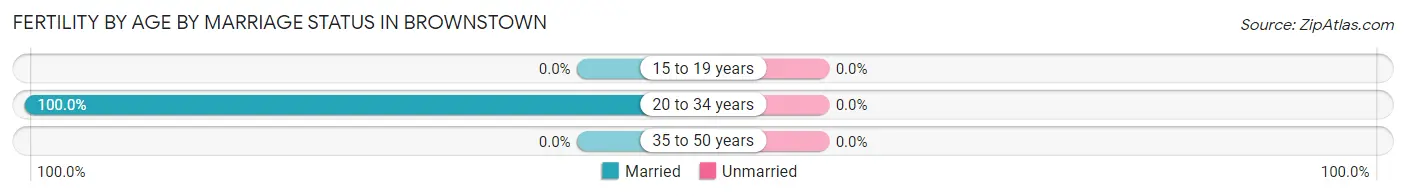
| Age Bracket | Married | Unmarried |
| 15 to 19 years | 0 (0.0%) | 0 (0.0%) |
| 20 to 34 years | 45 (100.0%) | 0 (0.0%) |
| 35 to 50 years | 0 (0.0%) | 0 (0.0%) |
| Total | 45 (100.0%) | 0 (0.0%) |
Fertility by Education in Brownstown
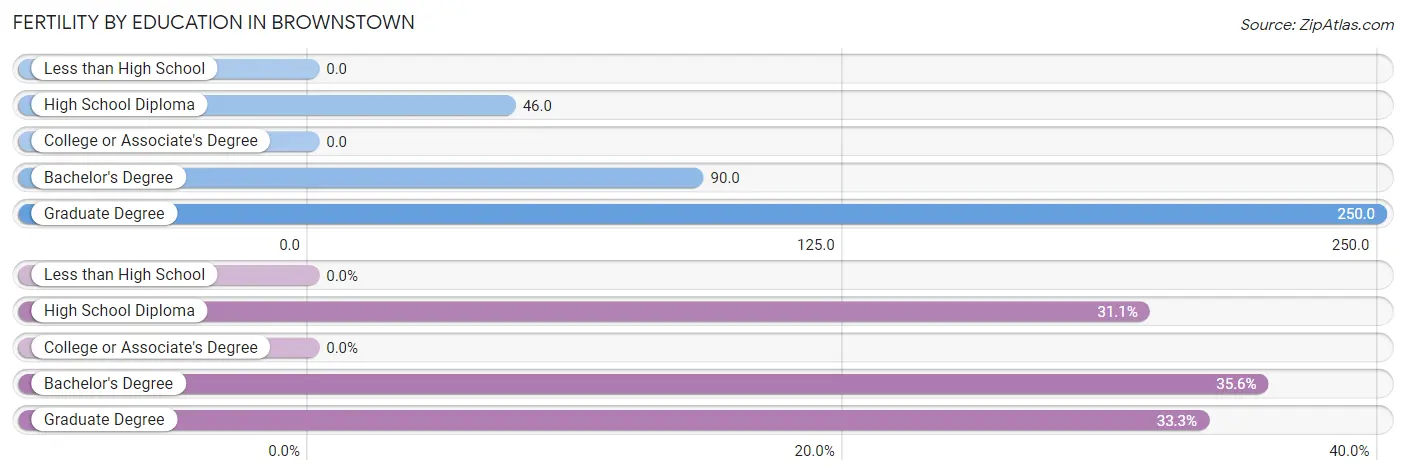
| Educational Attainment | Women with Births | Births / 1,000 Women |
| Less than High School | 0 (0.0%) | 0.0 |
| High School Diploma | 14 (31.1%) | 46.0 |
| College or Associate's Degree | 0 (0.0%) | 0.0 |
| Bachelor's Degree | 16 (35.6%) | 90.0 |
| Graduate Degree | 15 (33.3%) | 250.0 |
| Total | 45 (100.0%) | 53.0 |
Fertility by Education by Marriage Status in Brownstown
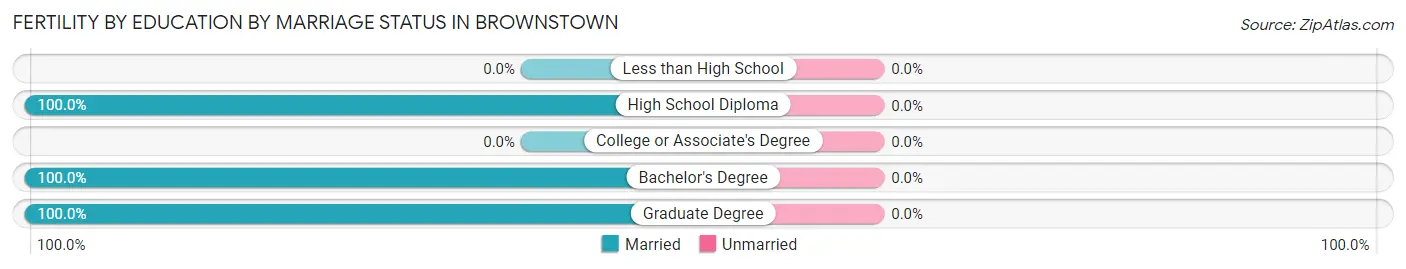
| Educational Attainment | Married | Unmarried |
| Less than High School | 0 (0.0%) | 0 (0.0%) |
| High School Diploma | 14 (100.0%) | 0 (0.0%) |
| College or Associate's Degree | 0 (0.0%) | 0 (0.0%) |
| Bachelor's Degree | 16 (100.0%) | 0 (0.0%) |
| Graduate Degree | 15 (100.0%) | 0 (0.0%) |
| Total | 45 (100.0%) | 0 (0.0%) |
Employment Characteristics in Brownstown
Employment by Class of Employer in Brownstown
Among the 1,805 employed individuals in Brownstown, private company employees (1,488 | 82.4%), not-for-profit organizations (114 | 6.3%), and self-employed (not incorporated) (96 | 5.3%) make up the most common classes of employment.
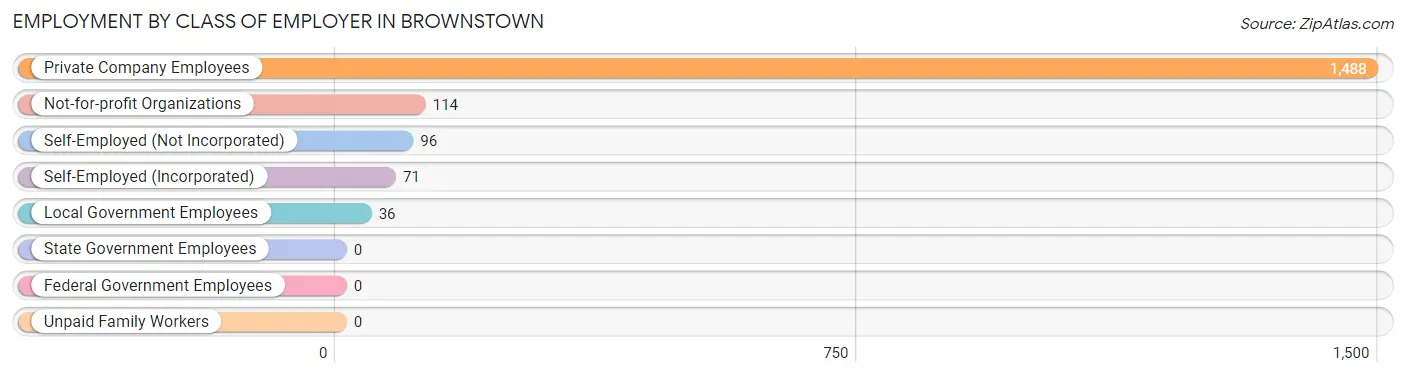
| Employer Class | # Employees | % Employees |
| Private Company Employees | 1,488 | 82.4% |
| Self-Employed (Incorporated) | 71 | 3.9% |
| Self-Employed (Not Incorporated) | 96 | 5.3% |
| Not-for-profit Organizations | 114 | 6.3% |
| Local Government Employees | 36 | 2.0% |
| State Government Employees | 0 | 0.0% |
| Federal Government Employees | 0 | 0.0% |
| Unpaid Family Workers | 0 | 0.0% |
| Total | 1,805 | 100.0% |
Employment Status by Age in Brownstown
According to the labor force statistics for Brownstown, out of the total population over 16 years of age (2,742), 74.1% or 2,032 individuals are in the labor force, with 6.7% or 136 of them unemployed. The age group with the highest labor force participation rate is 35 to 44 years, with 97.4% or 261 individuals in the labor force. Within the labor force, the 20 to 24 years age range has the highest percentage of unemployed individuals, with 31.8% or 128 of them being unemployed.
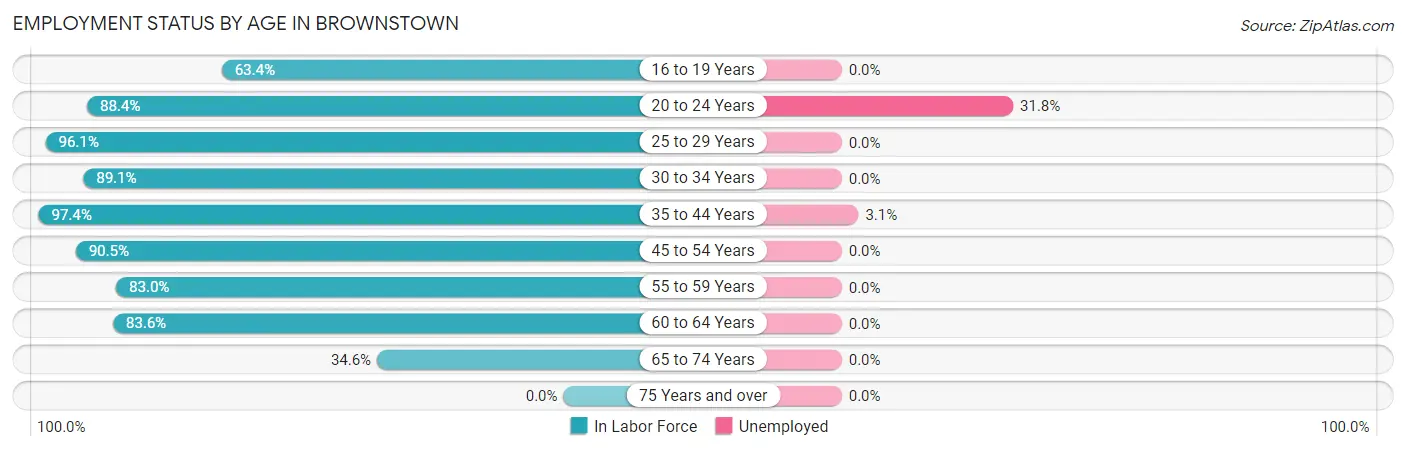
| Age Bracket | In Labor Force | Unemployed |
| 16 to 19 Years | 187 (63.4%) | 0 (0.0%) |
| 20 to 24 Years | 403 (88.4%) | 128 (31.8%) |
| 25 to 29 Years | 198 (96.1%) | 0 (0.0%) |
| 30 to 34 Years | 156 (89.1%) | 0 (0.0%) |
| 35 to 44 Years | 261 (97.4%) | 8 (3.1%) |
| 45 to 54 Years | 364 (90.5%) | 0 (0.0%) |
| 55 to 59 Years | 127 (83.0%) | 0 (0.0%) |
| 60 to 64 Years | 235 (83.6%) | 0 (0.0%) |
| 65 to 74 Years | 100 (34.6%) | 0 (0.0%) |
| 75 Years and over | 0 (0.0%) | 0 (0.0%) |
| Total | 2,032 (74.1%) | 136 (6.7%) |
Employment Status by Educational Attainment in Brownstown
According to labor force statistics for Brownstown, 90.3% of individuals (1,341) out of the total population between 25 and 64 years of age (1,485) are in the labor force, with 0.6% or 8 of them being unemployed. The group with the highest labor force participation rate are those with the educational attainment of less than high school, with 95.8% or 115 individuals in the labor force. Within the labor force, individuals with less than high school education have the highest percentage of unemployment, with 7.0% or 8 of them being unemployed.
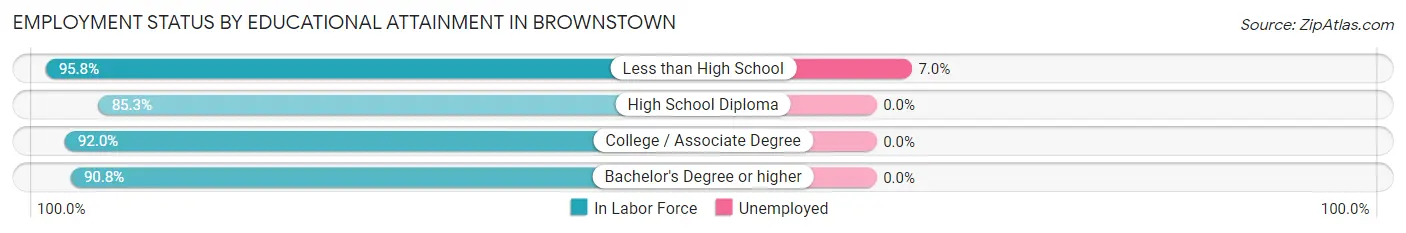
| Educational Attainment | In Labor Force | Unemployed |
| Less than High School | 115 (95.8%) | 8 (7.0%) |
| High School Diploma | 307 (85.3%) | 0 (0.0%) |
| College / Associate Degree | 463 (92.0%) | 0 (0.0%) |
| Bachelor's Degree or higher | 456 (90.8%) | 0 (0.0%) |
| Total | 1,341 (90.3%) | 9 (0.6%) |
Employment Occupations by Sex in Brownstown
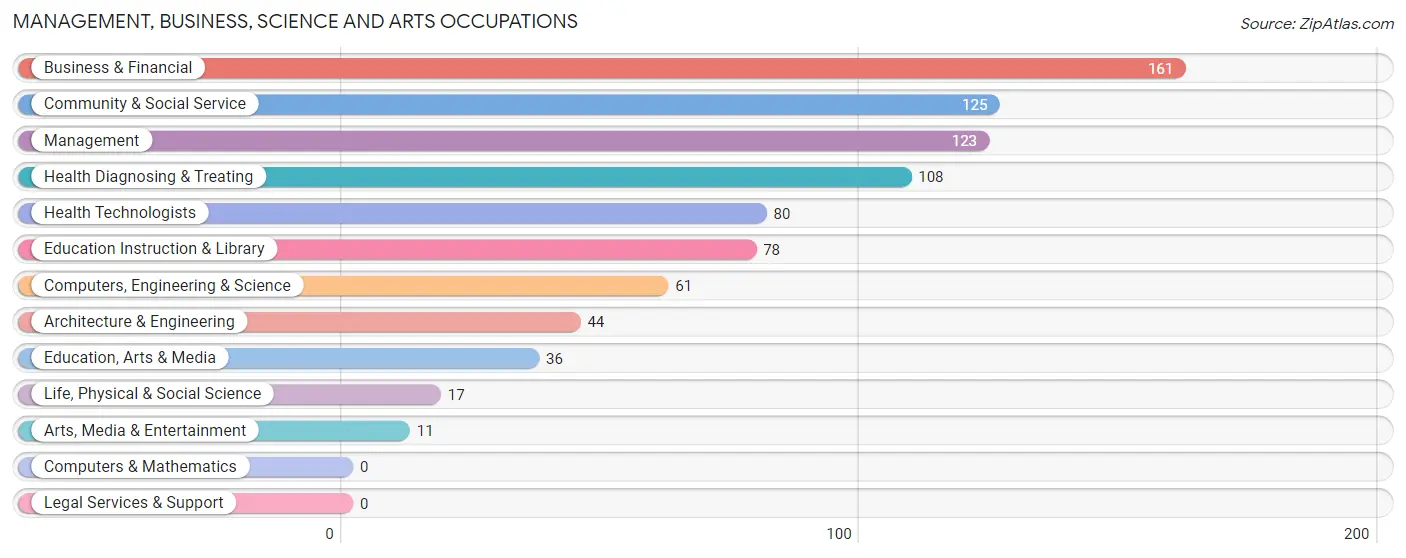
Management, Business, Science and Arts Occupations
The most common Management, Business, Science and Arts occupations in Brownstown are Business & Financial (161 | 8.5%), Community & Social Service (125 | 6.6%), Management (123 | 6.5%), Health Diagnosing & Treating (108 | 5.7%), and Health Technologists (80 | 4.2%).
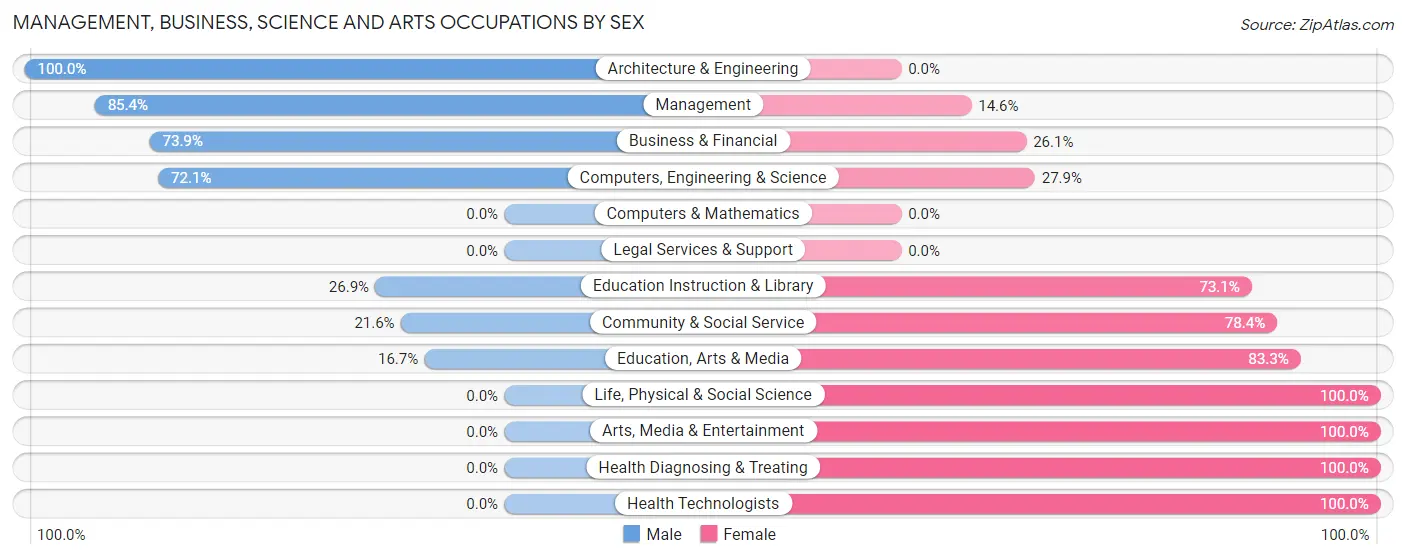
Management, Business, Science and Arts Occupations by Sex
Within the Management, Business, Science and Arts occupations in Brownstown, the most male-oriented occupations are Architecture & Engineering (100.0%), Management (85.4%), and Business & Financial (73.9%), while the most female-oriented occupations are Life, Physical & Social Science (100.0%), Arts, Media & Entertainment (100.0%), and Health Diagnosing & Treating (100.0%).
| Occupation | Male | Female |
| Management | 105 (85.4%) | 18 (14.6%) |
| Business & Financial | 119 (73.9%) | 42 (26.1%) |
| Computers, Engineering & Science | 44 (72.1%) | 17 (27.9%) |
| Computers & Mathematics | 0 (0.0%) | 0 (0.0%) |
| Architecture & Engineering | 44 (100.0%) | 0 (0.0%) |
| Life, Physical & Social Science | 0 (0.0%) | 17 (100.0%) |
| Community & Social Service | 27 (21.6%) | 98 (78.4%) |
| Education, Arts & Media | 6 (16.7%) | 30 (83.3%) |
| Legal Services & Support | 0 (0.0%) | 0 (0.0%) |
| Education Instruction & Library | 21 (26.9%) | 57 (73.1%) |
| Arts, Media & Entertainment | 0 (0.0%) | 11 (100.0%) |
| Health Diagnosing & Treating | 0 (0.0%) | 108 (100.0%) |
| Health Technologists | 0 (0.0%) | 80 (100.0%) |
| Total (Category) | 295 (51.0%) | 283 (49.0%) |
| Total (Overall) | 1,069 (56.4%) | 826 (43.6%) |
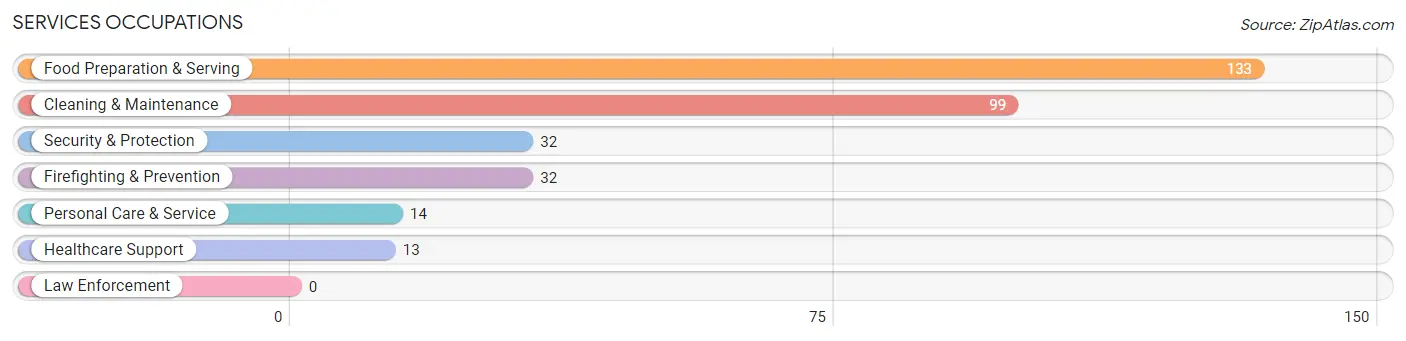
Services Occupations
The most common Services occupations in Brownstown are Food Preparation & Serving (133 | 7.0%), Cleaning & Maintenance (99 | 5.2%), Security & Protection (32 | 1.7%), Firefighting & Prevention (32 | 1.7%), and Personal Care & Service (14 | 0.7%).
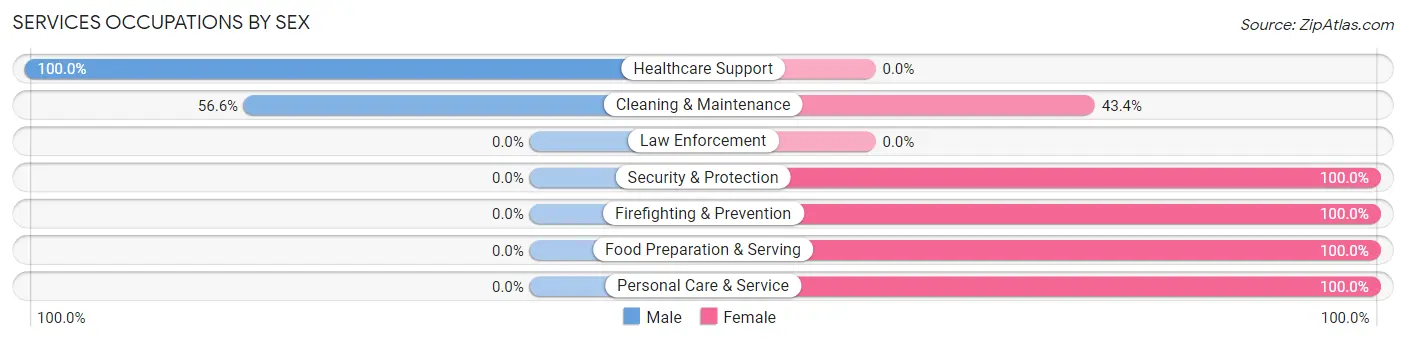
Services Occupations by Sex
Within the Services occupations in Brownstown, the most male-oriented occupations are Healthcare Support (100.0%), and Cleaning & Maintenance (56.6%), while the most female-oriented occupations are Security & Protection (100.0%), Firefighting & Prevention (100.0%), and Food Preparation & Serving (100.0%).
| Occupation | Male | Female |
| Healthcare Support | 13 (100.0%) | 0 (0.0%) |
| Security & Protection | 0 (0.0%) | 32 (100.0%) |
| Firefighting & Prevention | 0 (0.0%) | 32 (100.0%) |
| Law Enforcement | 0 (0.0%) | 0 (0.0%) |
| Food Preparation & Serving | 0 (0.0%) | 133 (100.0%) |
| Cleaning & Maintenance | 56 (56.6%) | 43 (43.4%) |
| Personal Care & Service | 0 (0.0%) | 14 (100.0%) |
| Total (Category) | 69 (23.7%) | 222 (76.3%) |
| Total (Overall) | 1,069 (56.4%) | 826 (43.6%) |
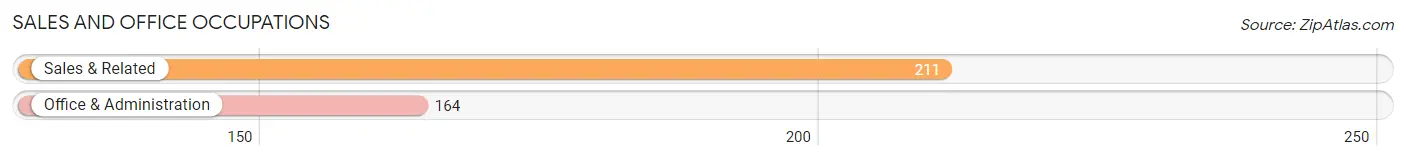
Sales and Office Occupations
The most common Sales and Office occupations in Brownstown are Sales & Related (211 | 11.1%), and Office & Administration (164 | 8.6%).
Sales and Office Occupations by Sex
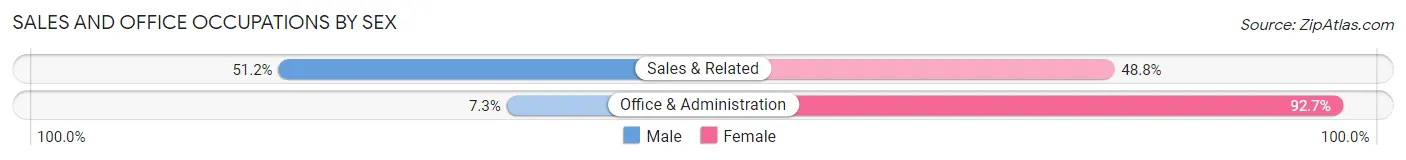
| Occupation | Male | Female |
| Sales & Related | 108 (51.2%) | 103 (48.8%) |
| Office & Administration | 12 (7.3%) | 152 (92.7%) |
| Total (Category) | 120 (32.0%) | 255 (68.0%) |
| Total (Overall) | 1,069 (56.4%) | 826 (43.6%) |
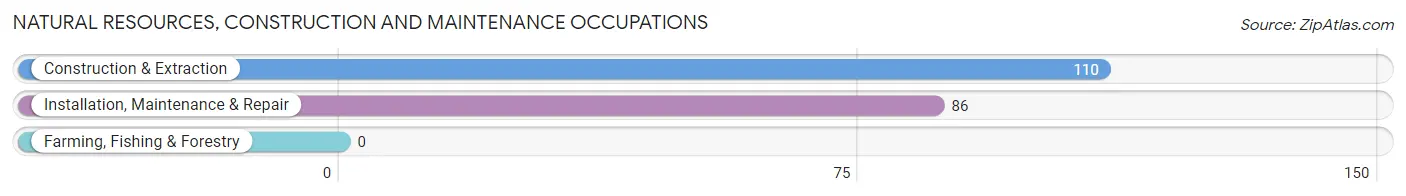
Natural Resources, Construction and Maintenance Occupations
The most common Natural Resources, Construction and Maintenance occupations in Brownstown are Construction & Extraction (110 | 5.8%), and Installation, Maintenance & Repair (86 | 4.5%).
Natural Resources, Construction and Maintenance Occupations by Sex
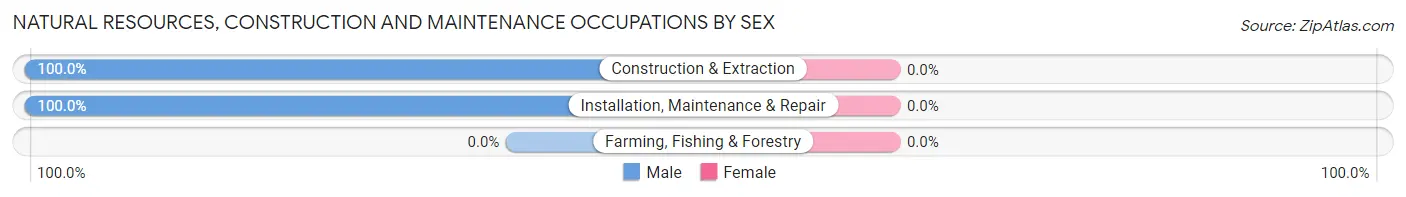
| Occupation | Male | Female |
| Farming, Fishing & Forestry | 0 (0.0%) | 0 (0.0%) |
| Construction & Extraction | 110 (100.0%) | 0 (0.0%) |
| Installation, Maintenance & Repair | 86 (100.0%) | 0 (0.0%) |
| Total (Category) | 196 (100.0%) | 0 (0.0%) |
| Total (Overall) | 1,069 (56.4%) | 826 (43.6%) |
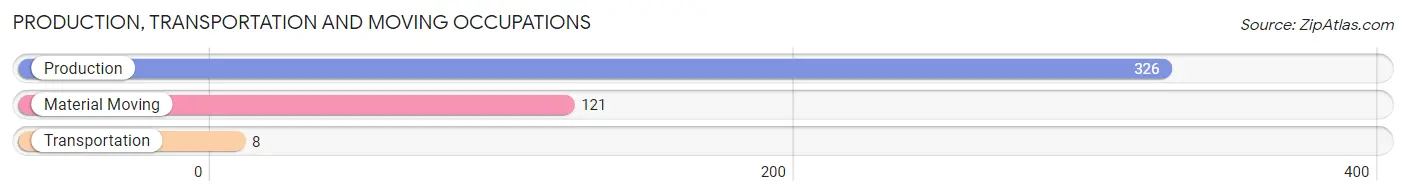
Production, Transportation and Moving Occupations
The most common Production, Transportation and Moving occupations in Brownstown are Production (326 | 17.2%), Material Moving (121 | 6.4%), and Transportation (8 | 0.4%).
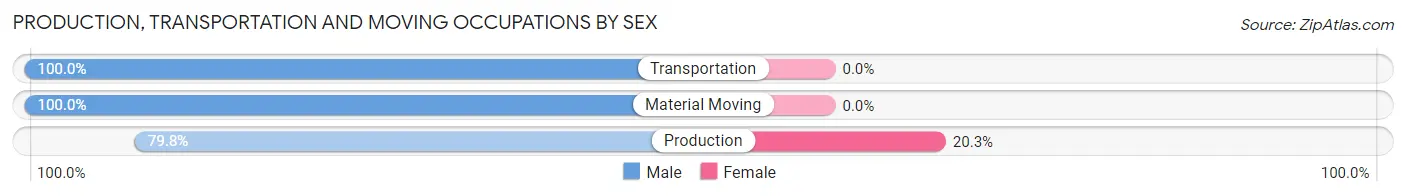
Production, Transportation and Moving Occupations by Sex
| Occupation | Male | Female |
| Production | 260 (79.7%) | 66 (20.3%) |
| Transportation | 8 (100.0%) | 0 (0.0%) |
| Material Moving | 121 (100.0%) | 0 (0.0%) |
| Total (Category) | 389 (85.5%) | 66 (14.5%) |
| Total (Overall) | 1,069 (56.4%) | 826 (43.6%) |
Employment Industries by Sex in Brownstown
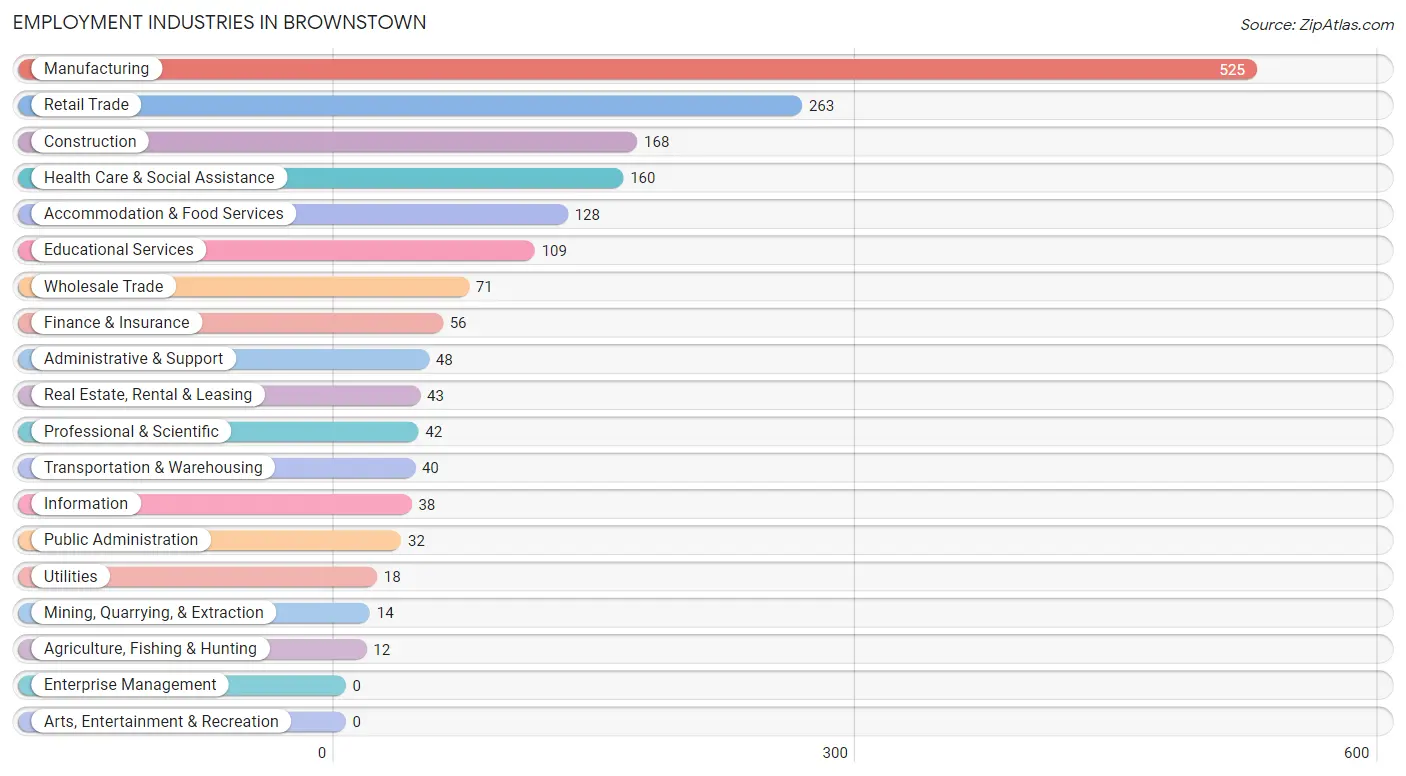
Employment Industries in Brownstown
The major employment industries in Brownstown include Manufacturing (525 | 27.7%), Retail Trade (263 | 13.9%), Construction (168 | 8.9%), Health Care & Social Assistance (160 | 8.4%), and Accommodation & Food Services (128 | 6.8%).
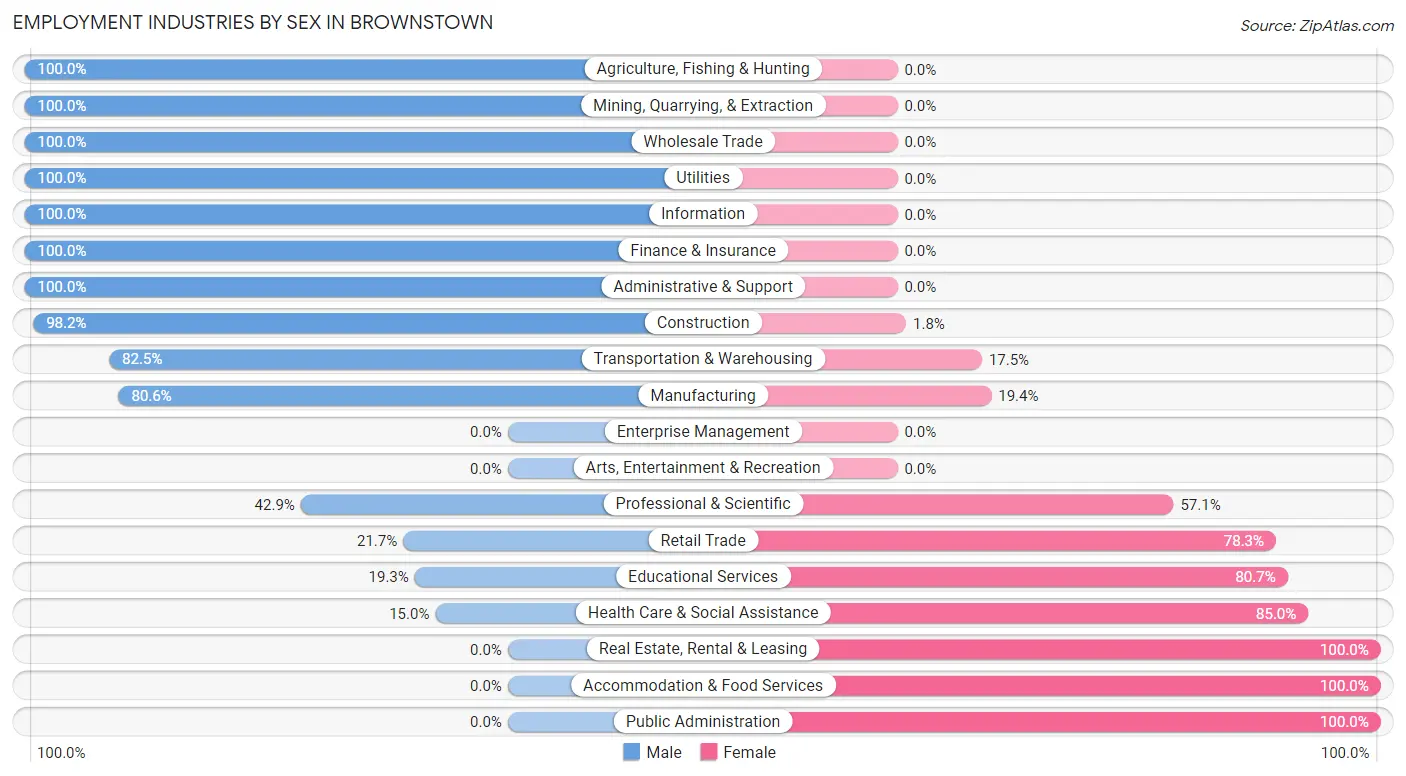
Employment Industries by Sex in Brownstown
The Brownstown industries that see more men than women are Agriculture, Fishing & Hunting (100.0%), Mining, Quarrying, & Extraction (100.0%), and Wholesale Trade (100.0%), whereas the industries that tend to have a higher number of women are Real Estate, Rental & Leasing (100.0%), Accommodation & Food Services (100.0%), and Public Administration (100.0%).
| Industry | Male | Female |
| Agriculture, Fishing & Hunting | 12 (100.0%) | 0 (0.0%) |
| Mining, Quarrying, & Extraction | 14 (100.0%) | 0 (0.0%) |
| Construction | 165 (98.2%) | 3 (1.8%) |
| Manufacturing | 423 (80.6%) | 102 (19.4%) |
| Wholesale Trade | 71 (100.0%) | 0 (0.0%) |
| Retail Trade | 57 (21.7%) | 206 (78.3%) |
| Transportation & Warehousing | 33 (82.5%) | 7 (17.5%) |
| Utilities | 18 (100.0%) | 0 (0.0%) |
| Information | 38 (100.0%) | 0 (0.0%) |
| Finance & Insurance | 56 (100.0%) | 0 (0.0%) |
| Real Estate, Rental & Leasing | 0 (0.0%) | 43 (100.0%) |
| Professional & Scientific | 18 (42.9%) | 24 (57.1%) |
| Enterprise Management | 0 (0.0%) | 0 (0.0%) |
| Administrative & Support | 48 (100.0%) | 0 (0.0%) |
| Educational Services | 21 (19.3%) | 88 (80.7%) |
| Health Care & Social Assistance | 24 (15.0%) | 136 (85.0%) |
| Arts, Entertainment & Recreation | 0 (0.0%) | 0 (0.0%) |
| Accommodation & Food Services | 0 (0.0%) | 128 (100.0%) |
| Public Administration | 0 (0.0%) | 32 (100.0%) |
| Total | 1,069 (56.4%) | 826 (43.6%) |
Education in Brownstown
School Enrollment in Brownstown
The most common levels of schooling among the 955 students in Brownstown are high school (328 | 34.4%), elementary school (284 | 29.7%), and middle school (133 | 13.9%).
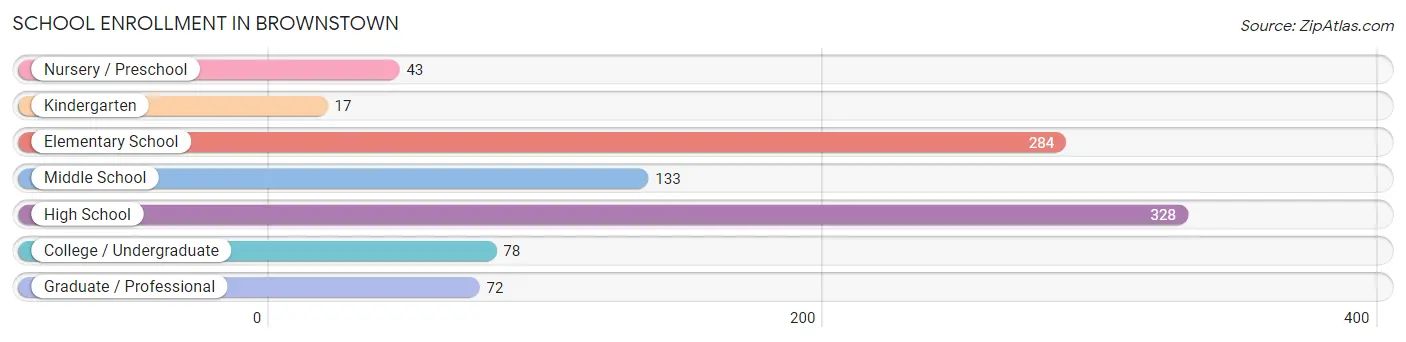
| School Level | # Students | % Students |
| Nursery / Preschool | 43 | 4.5% |
| Kindergarten | 17 | 1.8% |
| Elementary School | 284 | 29.7% |
| Middle School | 133 | 13.9% |
| High School | 328 | 34.4% |
| College / Undergraduate | 78 | 8.2% |
| Graduate / Professional | 72 | 7.5% |
| Total | 955 | 100.0% |
School Enrollment by Age by Funding Source in Brownstown
Out of a total of 955 students who are enrolled in schools in Brownstown, 222 (23.2%) attend a private institution, while the remaining 733 (76.8%) are enrolled in public schools. The age group of 3 to 4 year olds has the highest likelihood of being enrolled in private schools, with 24 (75.0% in the age bracket) enrolled. Conversely, the age group of 18 to 19 year olds has the lowest likelihood of being enrolled in a private school, with 15 (100.0% in the age bracket) attending a public institution.
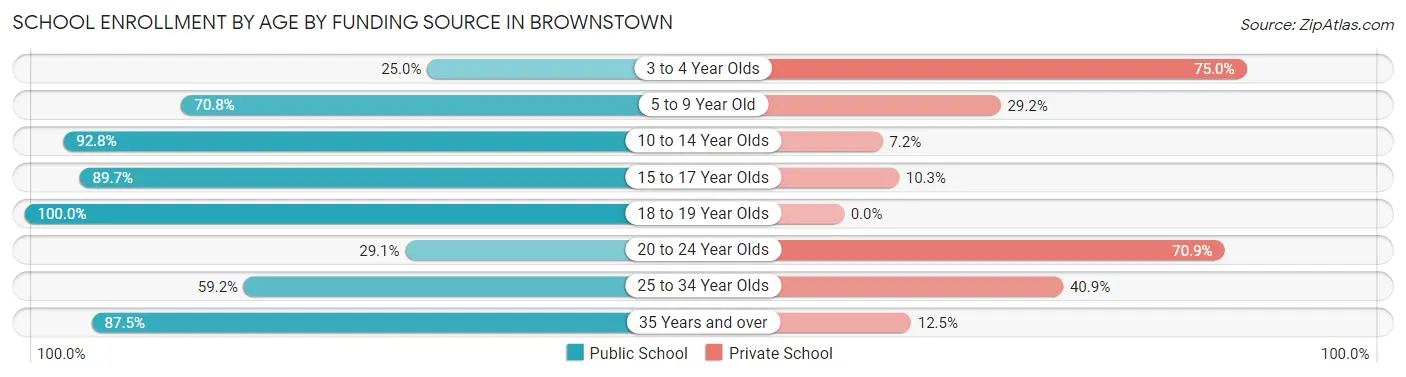
| Age Bracket | Public School | Private School |
| 3 to 4 Year Olds | 8 (25.0%) | 24 (75.0%) |
| 5 to 9 Year Old | 206 (70.8%) | 85 (29.2%) |
| 10 to 14 Year Olds | 180 (92.8%) | 14 (7.2%) |
| 15 to 17 Year Olds | 245 (89.7%) | 28 (10.3%) |
| 18 to 19 Year Olds | 15 (100.0%) | 0 (0.0%) |
| 20 to 24 Year Olds | 16 (29.1%) | 39 (70.9%) |
| 25 to 34 Year Olds | 42 (59.2%) | 29 (40.8%) |
| 35 Years and over | 21 (87.5%) | 3 (12.5%) |
| Total | 733 (76.8%) | 222 (23.2%) |
Educational Attainment by Field of Study in Brownstown
Business (119 | 18.3%), science & technology (109 | 16.8%), education (89 | 13.7%), psychology (51 | 7.9%), and engineering (44 | 6.8%) are the most common fields of study among 649 individuals in Brownstown who have obtained a bachelor's degree or higher.
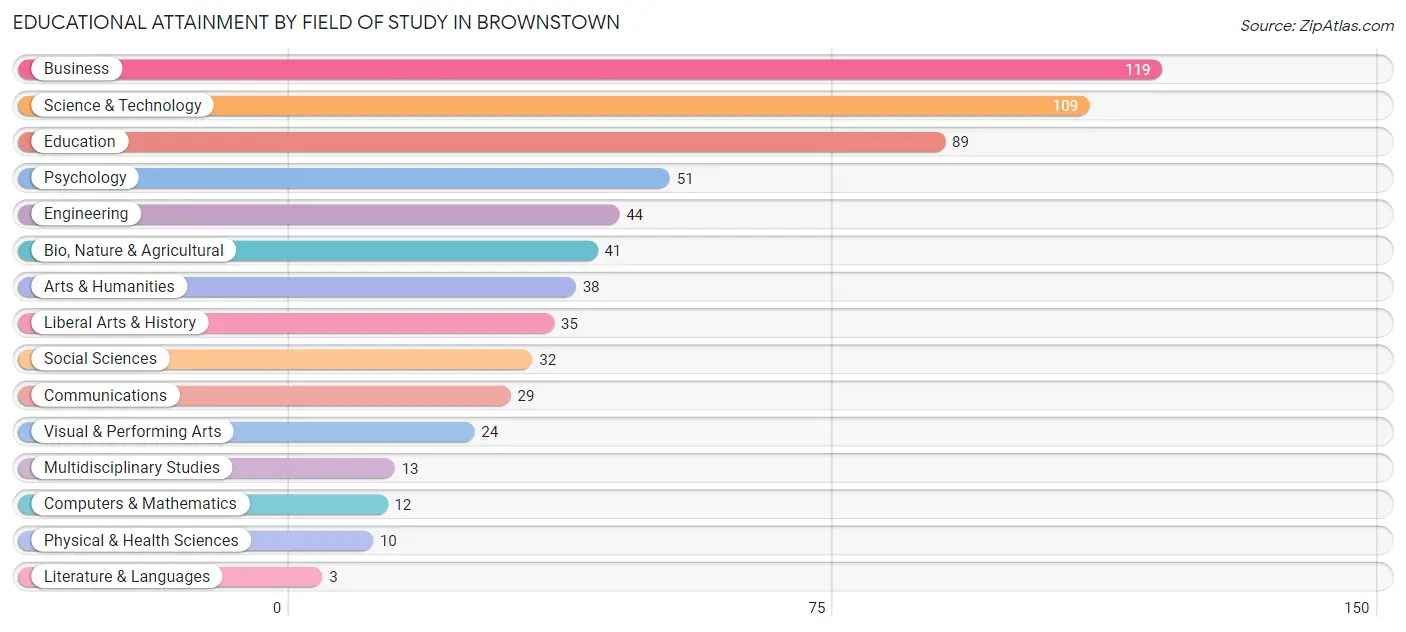
| Field of Study | # Graduates | % Graduates |
| Computers & Mathematics | 12 | 1.8% |
| Bio, Nature & Agricultural | 41 | 6.3% |
| Physical & Health Sciences | 10 | 1.5% |
| Psychology | 51 | 7.9% |
| Social Sciences | 32 | 4.9% |
| Engineering | 44 | 6.8% |
| Multidisciplinary Studies | 13 | 2.0% |
| Science & Technology | 109 | 16.8% |
| Business | 119 | 18.3% |
| Education | 89 | 13.7% |
| Literature & Languages | 3 | 0.5% |
| Liberal Arts & History | 35 | 5.4% |
| Visual & Performing Arts | 24 | 3.7% |
| Communications | 29 | 4.5% |
| Arts & Humanities | 38 | 5.9% |
| Total | 649 | 100.0% |
Transportation & Commute in Brownstown
Vehicle Availability by Sex in Brownstown
The most prevalent vehicle ownership categories in Brownstown are males with 2 vehicles (523, accounting for 50.4%) and females with 2 vehicles (225, making up 68.1%).
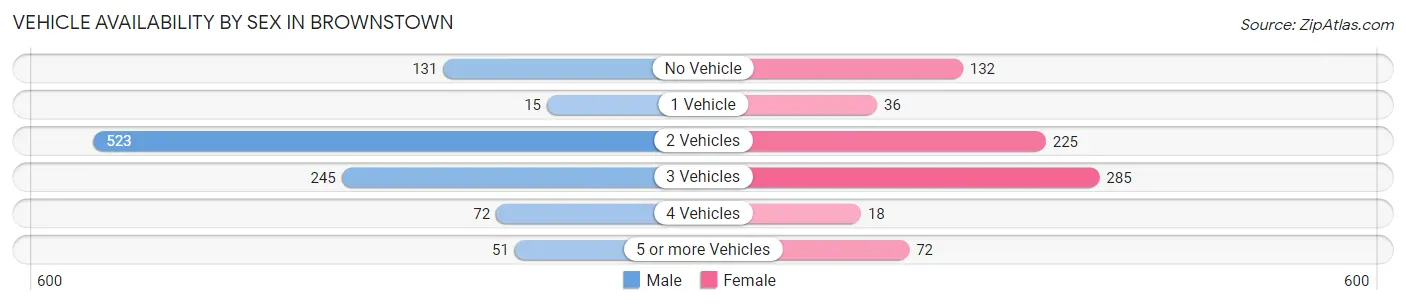
| Vehicles Available | Male | Female |
| No Vehicle | 131 (12.6%) | 132 (17.2%) |
| 1 Vehicle | 15 (1.5%) | 36 (4.7%) |
| 2 Vehicles | 523 (50.4%) | 225 (29.3%) |
| 3 Vehicles | 245 (23.6%) | 285 (37.1%) |
| 4 Vehicles | 72 (6.9%) | 18 (2.3%) |
| 5 or more Vehicles | 51 (4.9%) | 72 (9.4%) |
| Total | 1,037 (100.0%) | 768 (100.0%) |
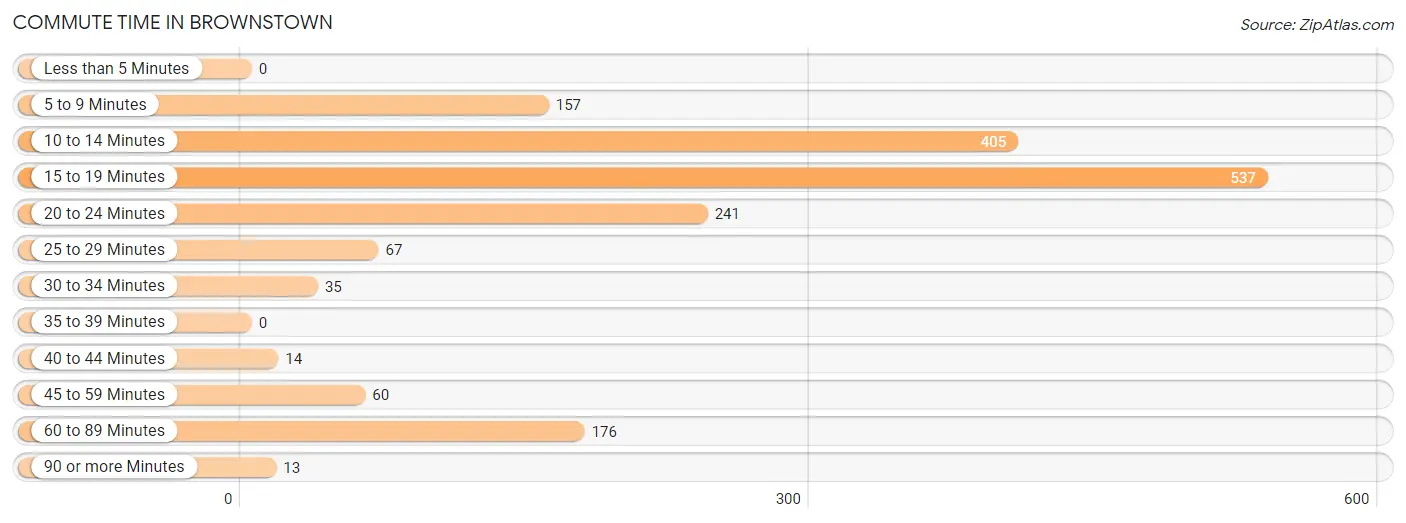
Commute Time in Brownstown
The most frequently occuring commute durations in Brownstown are 15 to 19 minutes (537 commuters, 31.5%), 10 to 14 minutes (405 commuters, 23.7%), and 20 to 24 minutes (241 commuters, 14.1%).
| Commute Time | # Commuters | % Commuters |
| Less than 5 Minutes | 0 | 0.0% |
| 5 to 9 Minutes | 157 | 9.2% |
| 10 to 14 Minutes | 405 | 23.7% |
| 15 to 19 Minutes | 537 | 31.5% |
| 20 to 24 Minutes | 241 | 14.1% |
| 25 to 29 Minutes | 67 | 3.9% |
| 30 to 34 Minutes | 35 | 2.1% |
| 35 to 39 Minutes | 0 | 0.0% |
| 40 to 44 Minutes | 14 | 0.8% |
| 45 to 59 Minutes | 60 | 3.5% |
| 60 to 89 Minutes | 176 | 10.3% |
| 90 or more Minutes | 13 | 0.8% |
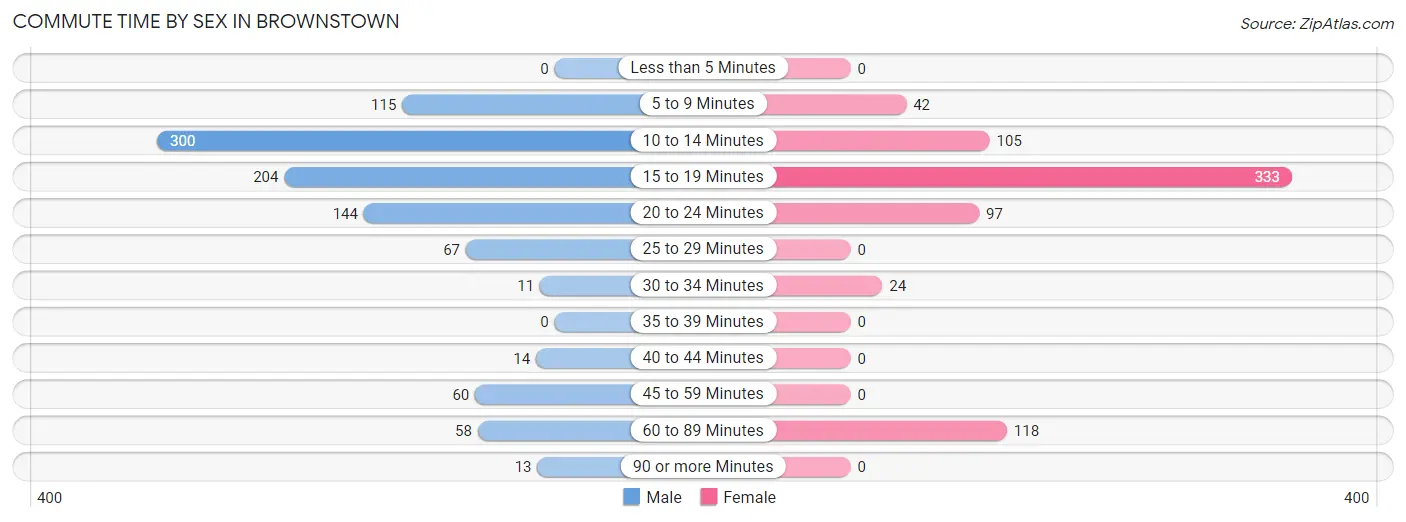
Commute Time by Sex in Brownstown
The most common commute times in Brownstown are 10 to 14 minutes (300 commuters, 30.4%) for males and 15 to 19 minutes (333 commuters, 46.3%) for females.
| Commute Time | Male | Female |
| Less than 5 Minutes | 0 (0.0%) | 0 (0.0%) |
| 5 to 9 Minutes | 115 (11.7%) | 42 (5.8%) |
| 10 to 14 Minutes | 300 (30.4%) | 105 (14.6%) |
| 15 to 19 Minutes | 204 (20.7%) | 333 (46.3%) |
| 20 to 24 Minutes | 144 (14.6%) | 97 (13.5%) |
| 25 to 29 Minutes | 67 (6.8%) | 0 (0.0%) |
| 30 to 34 Minutes | 11 (1.1%) | 24 (3.3%) |
| 35 to 39 Minutes | 0 (0.0%) | 0 (0.0%) |
| 40 to 44 Minutes | 14 (1.4%) | 0 (0.0%) |
| 45 to 59 Minutes | 60 (6.1%) | 0 (0.0%) |
| 60 to 89 Minutes | 58 (5.9%) | 118 (16.4%) |
| 90 or more Minutes | 13 (1.3%) | 0 (0.0%) |
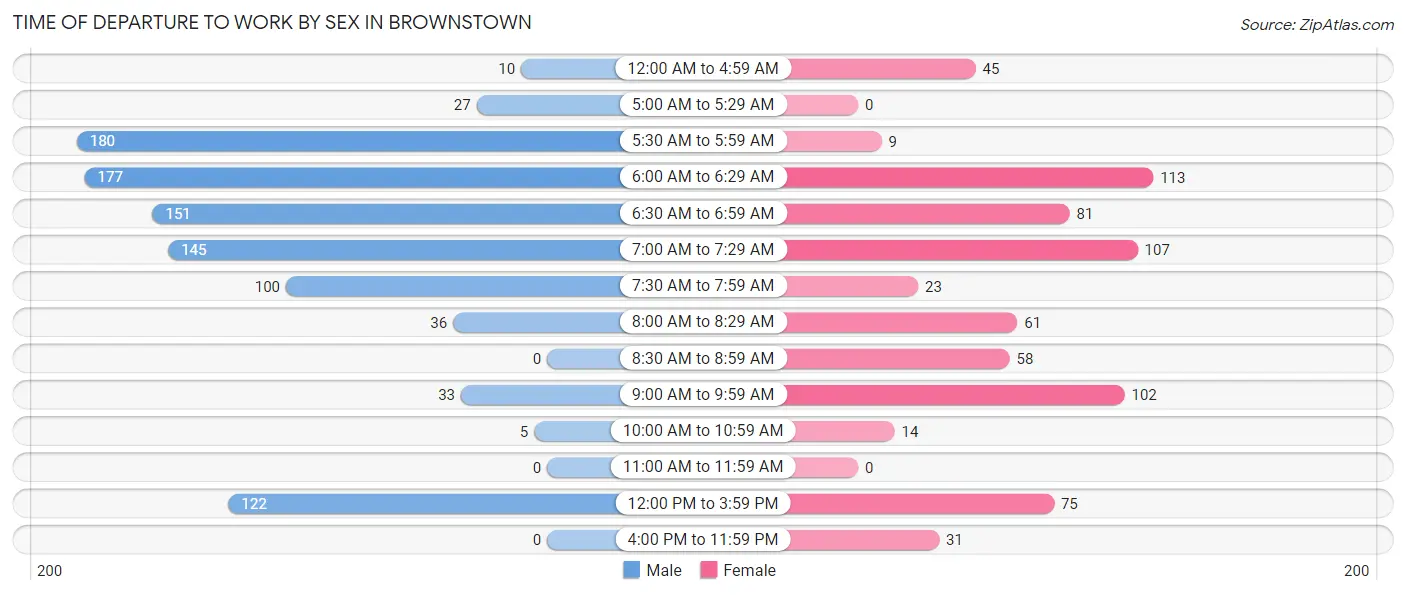
Time of Departure to Work by Sex in Brownstown
The most frequent times of departure to work in Brownstown are 5:30 AM to 5:59 AM (180, 18.3%) for males and 6:00 AM to 6:29 AM (113, 15.7%) for females.
| Time of Departure | Male | Female |
| 12:00 AM to 4:59 AM | 10 (1.0%) | 45 (6.3%) |
| 5:00 AM to 5:29 AM | 27 (2.7%) | 0 (0.0%) |
| 5:30 AM to 5:59 AM | 180 (18.3%) | 9 (1.3%) |
| 6:00 AM to 6:29 AM | 177 (17.9%) | 113 (15.7%) |
| 6:30 AM to 6:59 AM | 151 (15.3%) | 81 (11.3%) |
| 7:00 AM to 7:29 AM | 145 (14.7%) | 107 (14.9%) |
| 7:30 AM to 7:59 AM | 100 (10.1%) | 23 (3.2%) |
| 8:00 AM to 8:29 AM | 36 (3.6%) | 61 (8.5%) |
| 8:30 AM to 8:59 AM | 0 (0.0%) | 58 (8.1%) |
| 9:00 AM to 9:59 AM | 33 (3.4%) | 102 (14.2%) |
| 10:00 AM to 10:59 AM | 5 (0.5%) | 14 (1.9%) |
| 11:00 AM to 11:59 AM | 0 (0.0%) | 0 (0.0%) |
| 12:00 PM to 3:59 PM | 122 (12.4%) | 75 (10.4%) |
| 4:00 PM to 11:59 PM | 0 (0.0%) | 31 (4.3%) |
| Total | 986 (100.0%) | 719 (100.0%) |
Housing Occupancy in Brownstown
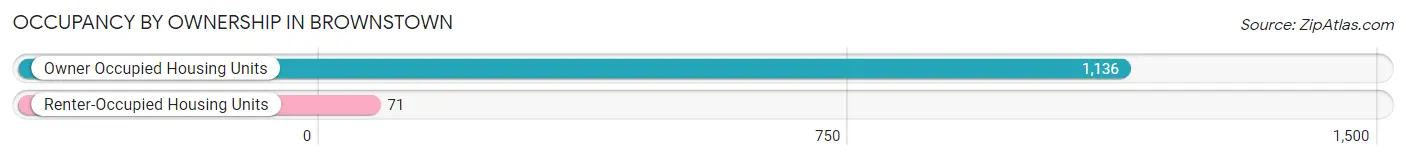
Occupancy by Ownership in Brownstown
Of the total 1,207 dwellings in Brownstown, owner-occupied units account for 1,136 (94.1%), while renter-occupied units make up 71 (5.9%).
| Occupancy | # Housing Units | % Housing Units |
| Owner Occupied Housing Units | 1,136 | 94.1% |
| Renter-Occupied Housing Units | 71 | 5.9% |
| Total Occupied Housing Units | 1,207 | 100.0% |
Occupancy by Household Size in Brownstown
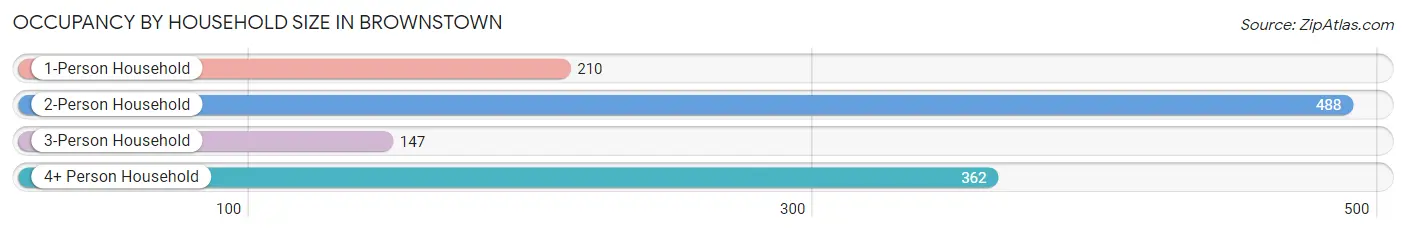
| Household Size | # Housing Units | % Housing Units |
| 1-Person Household | 210 | 17.4% |
| 2-Person Household | 488 | 40.4% |
| 3-Person Household | 147 | 12.2% |
| 4+ Person Household | 362 | 30.0% |
| Total Housing Units | 1,207 | 100.0% |
Occupancy by Ownership by Household Size in Brownstown
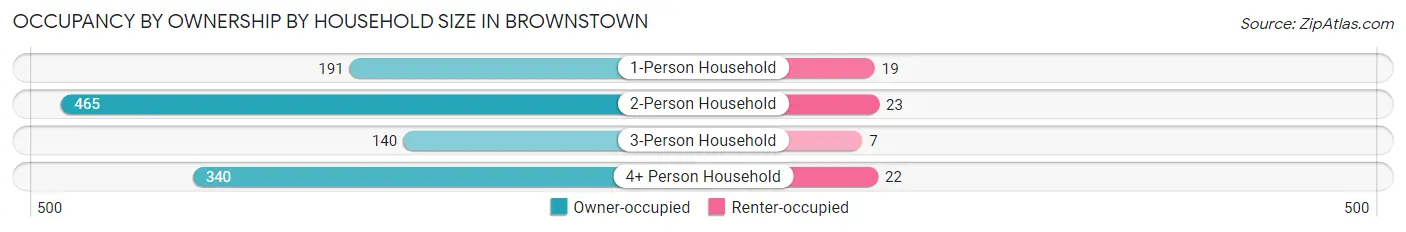
| Household Size | Owner-occupied | Renter-occupied |
| 1-Person Household | 191 (90.9%) | 19 (9.0%) |
| 2-Person Household | 465 (95.3%) | 23 (4.7%) |
| 3-Person Household | 140 (95.2%) | 7 (4.8%) |
| 4+ Person Household | 340 (93.9%) | 22 (6.1%) |
| Total Housing Units | 1,136 (94.1%) | 71 (5.9%) |
Occupancy by Educational Attainment in Brownstown
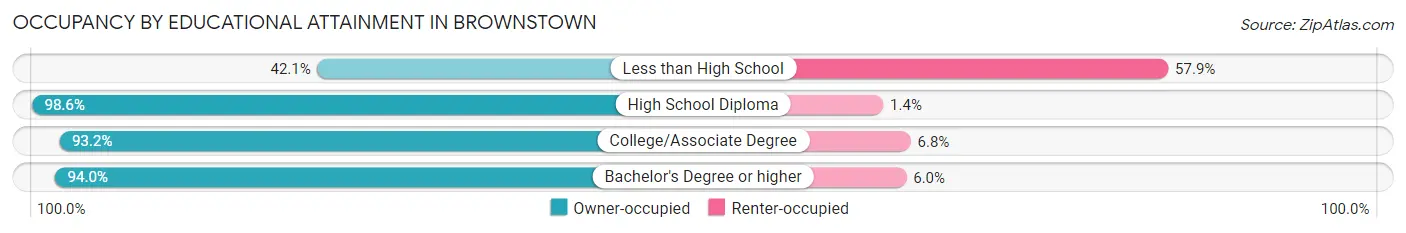
| Household Size | Owner-occupied | Renter-occupied |
| Less than High School | 16 (42.1%) | 22 (57.9%) |
| High School Diploma | 496 (98.6%) | 7 (1.4%) |
| College/Associate Degree | 246 (93.2%) | 18 (6.8%) |
| Bachelor's Degree or higher | 378 (94.0%) | 24 (6.0%) |
Occupancy by Age of Householder in Brownstown
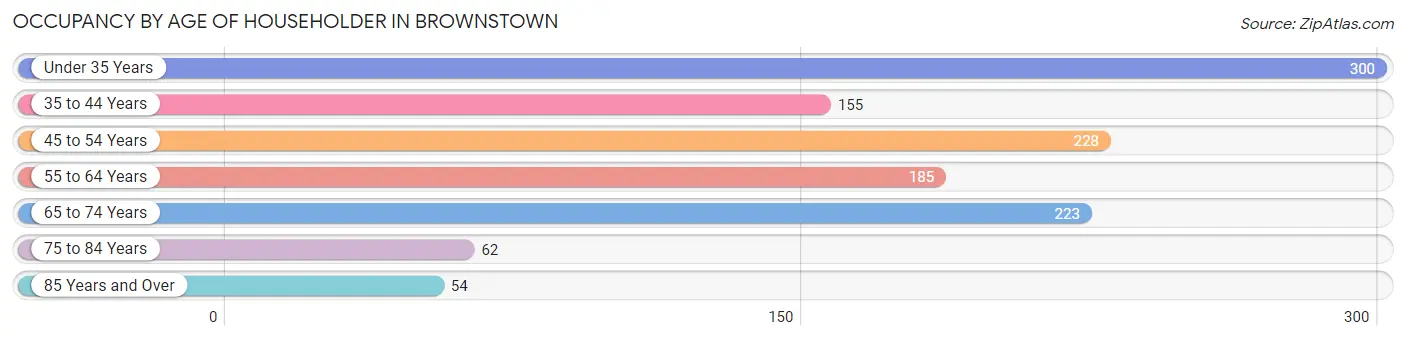
| Age Bracket | # Households | % Households |
| Under 35 Years | 300 | 24.9% |
| 35 to 44 Years | 155 | 12.8% |
| 45 to 54 Years | 228 | 18.9% |
| 55 to 64 Years | 185 | 15.3% |
| 65 to 74 Years | 223 | 18.5% |
| 75 to 84 Years | 62 | 5.1% |
| 85 Years and Over | 54 | 4.5% |
| Total | 1,207 | 100.0% |
Housing Finances in Brownstown
Median Income by Occupancy in Brownstown
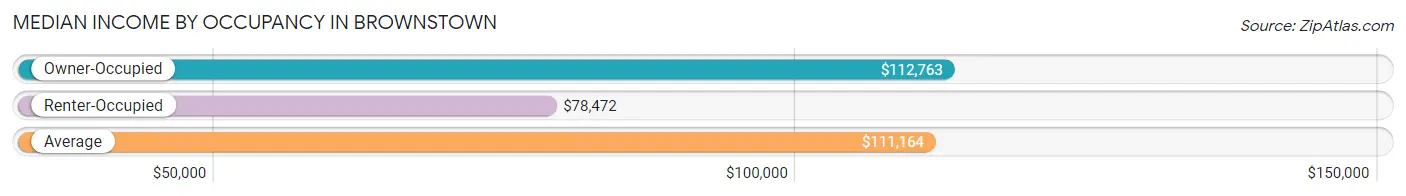
| Occupancy Type | # Households | Median Income |
| Owner-Occupied | 1,136 (94.1%) | $112,763 |
| Renter-Occupied | 71 (5.9%) | $78,472 |
| Average | 1,207 (100.0%) | $111,164 |
Occupancy by Householder Income Bracket in Brownstown
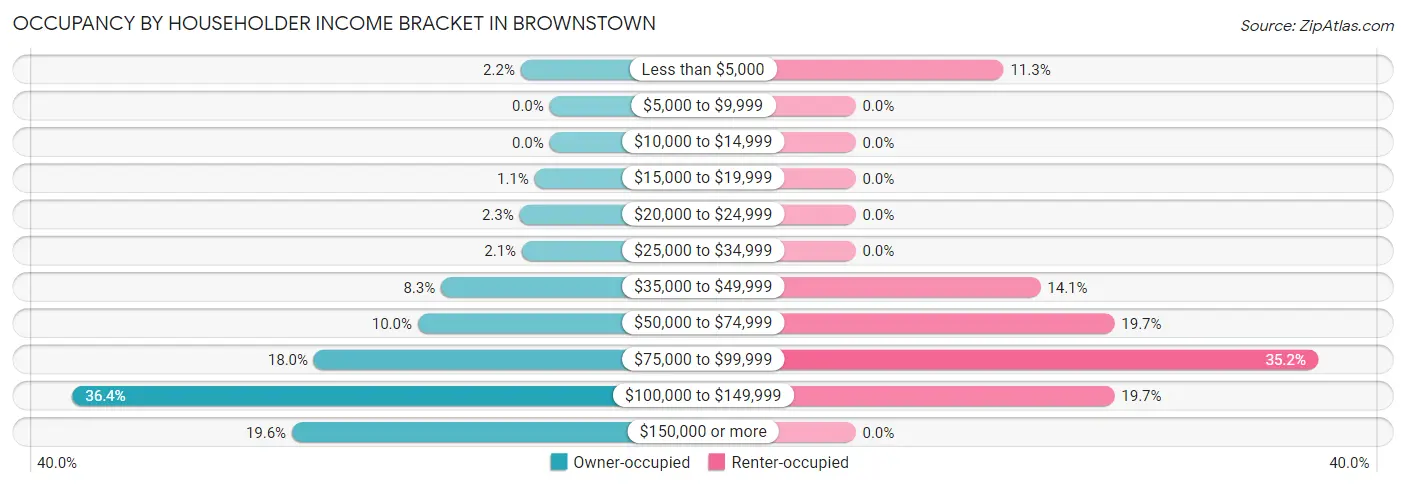
| Income Bracket | Owner-occupied | Renter-occupied |
| Less than $5,000 | 25 (2.2%) | 8 (11.3%) |
| $5,000 to $9,999 | 0 (0.0%) | 0 (0.0%) |
| $10,000 to $14,999 | 0 (0.0%) | 0 (0.0%) |
| $15,000 to $19,999 | 13 (1.1%) | 0 (0.0%) |
| $20,000 to $24,999 | 26 (2.3%) | 0 (0.0%) |
| $25,000 to $34,999 | 24 (2.1%) | 0 (0.0%) |
| $35,000 to $49,999 | 94 (8.3%) | 10 (14.1%) |
| $50,000 to $74,999 | 114 (10.0%) | 14 (19.7%) |
| $75,000 to $99,999 | 204 (18.0%) | 25 (35.2%) |
| $100,000 to $149,999 | 413 (36.4%) | 14 (19.7%) |
| $150,000 or more | 223 (19.6%) | 0 (0.0%) |
| Total | 1,136 (100.0%) | 71 (100.0%) |
Monthly Housing Cost Tiers in Brownstown
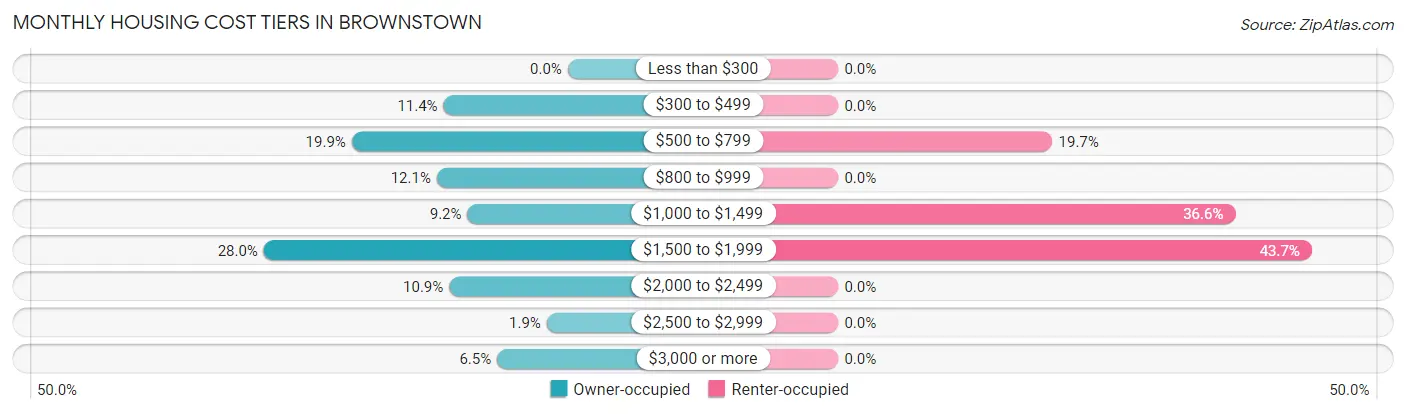
| Monthly Cost | Owner-occupied | Renter-occupied |
| Less than $300 | 0 (0.0%) | 0 (0.0%) |
| $300 to $499 | 130 (11.4%) | 0 (0.0%) |
| $500 to $799 | 226 (19.9%) | 14 (19.7%) |
| $800 to $999 | 137 (12.1%) | 0 (0.0%) |
| $1,000 to $1,499 | 105 (9.2%) | 26 (36.6%) |
| $1,500 to $1,999 | 318 (28.0%) | 31 (43.7%) |
| $2,000 to $2,499 | 124 (10.9%) | 0 (0.0%) |
| $2,500 to $2,999 | 22 (1.9%) | 0 (0.0%) |
| $3,000 or more | 74 (6.5%) | 0 (0.0%) |
| Total | 1,136 (100.0%) | 71 (100.0%) |
Physical Housing Characteristics in Brownstown
Housing Structures in Brownstown
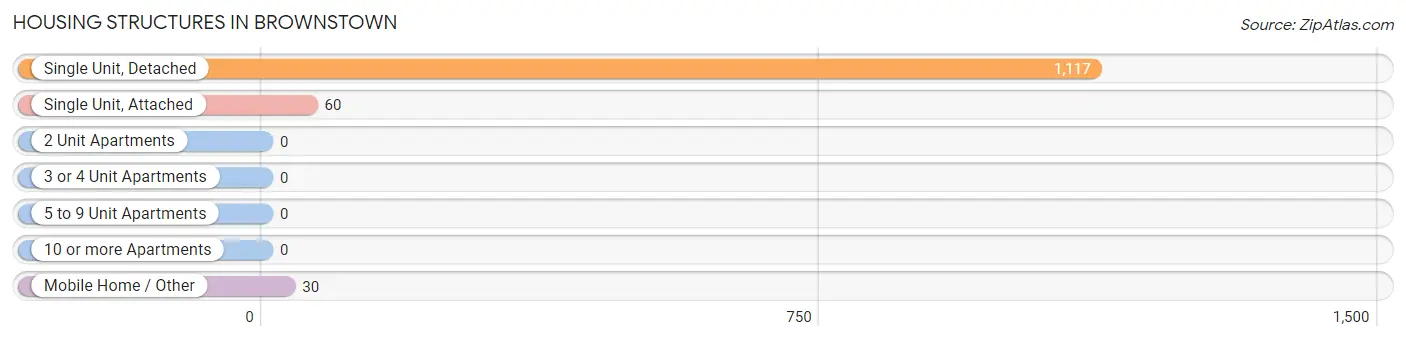
| Structure Type | # Housing Units | % Housing Units |
| Single Unit, Detached | 1,117 | 92.5% |
| Single Unit, Attached | 60 | 5.0% |
| 2 Unit Apartments | 0 | 0.0% |
| 3 or 4 Unit Apartments | 0 | 0.0% |
| 5 to 9 Unit Apartments | 0 | 0.0% |
| 10 or more Apartments | 0 | 0.0% |
| Mobile Home / Other | 30 | 2.5% |
| Total | 1,207 | 100.0% |
Housing Structures by Occupancy in Brownstown
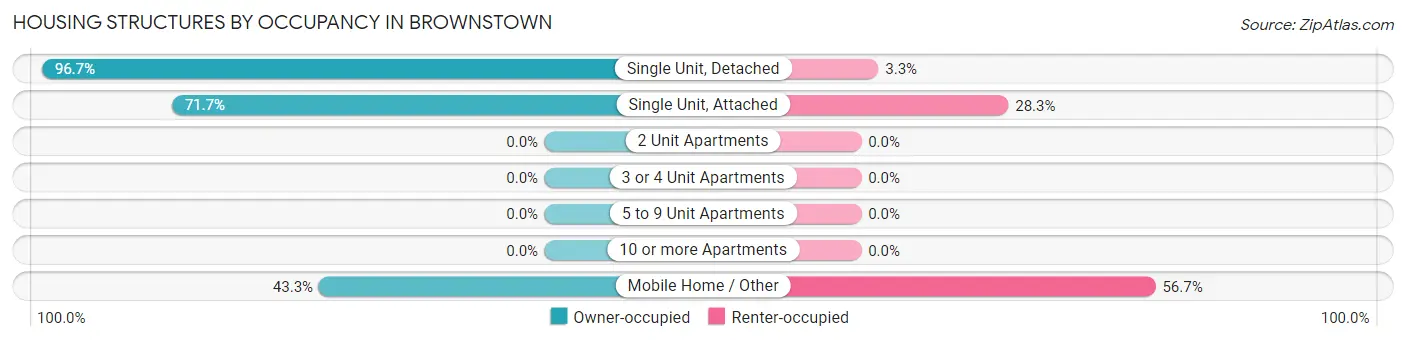
| Structure Type | Owner-occupied | Renter-occupied |
| Single Unit, Detached | 1,080 (96.7%) | 37 (3.3%) |
| Single Unit, Attached | 43 (71.7%) | 17 (28.3%) |
| 2 Unit Apartments | 0 (0.0%) | 0 (0.0%) |
| 3 or 4 Unit Apartments | 0 (0.0%) | 0 (0.0%) |
| 5 to 9 Unit Apartments | 0 (0.0%) | 0 (0.0%) |
| 10 or more Apartments | 0 (0.0%) | 0 (0.0%) |
| Mobile Home / Other | 13 (43.3%) | 17 (56.7%) |
| Total | 1,136 (94.1%) | 71 (5.9%) |
Housing Structures by Number of Rooms in Brownstown
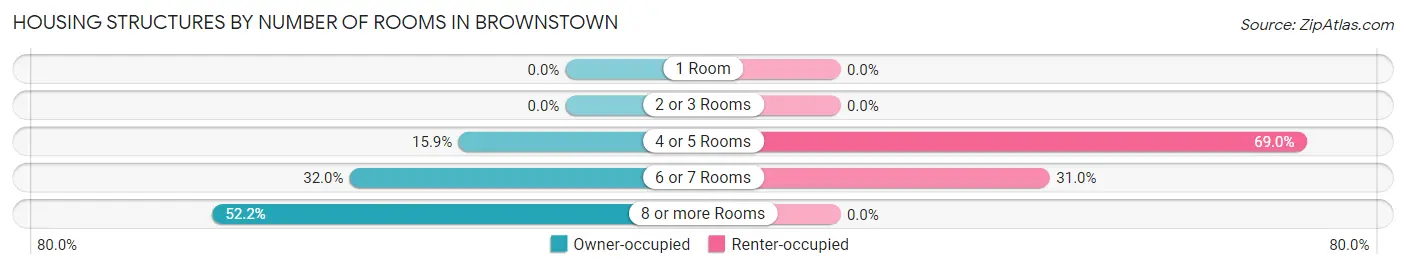
| Number of Rooms | Owner-occupied | Renter-occupied |
| 1 Room | 0 (0.0%) | 0 (0.0%) |
| 2 or 3 Rooms | 0 (0.0%) | 0 (0.0%) |
| 4 or 5 Rooms | 180 (15.9%) | 49 (69.0%) |
| 6 or 7 Rooms | 363 (32.0%) | 22 (31.0%) |
| 8 or more Rooms | 593 (52.2%) | 0 (0.0%) |
| Total | 1,136 (100.0%) | 71 (100.0%) |
Housing Structure by Heating Type in Brownstown
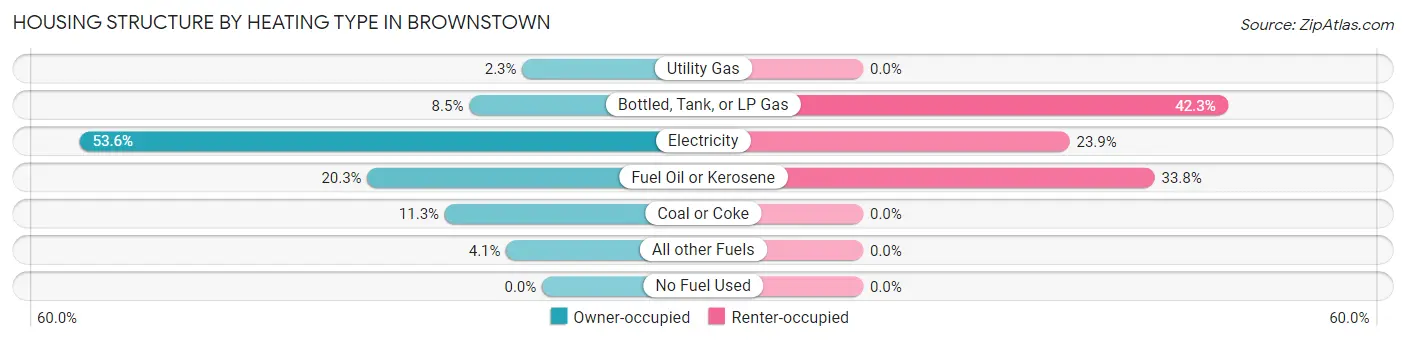
| Heating Type | Owner-occupied | Renter-occupied |
| Utility Gas | 26 (2.3%) | 0 (0.0%) |
| Bottled, Tank, or LP Gas | 96 (8.5%) | 30 (42.2%) |
| Electricity | 609 (53.6%) | 17 (23.9%) |
| Fuel Oil or Kerosene | 230 (20.3%) | 24 (33.8%) |
| Coal or Coke | 128 (11.3%) | 0 (0.0%) |
| All other Fuels | 47 (4.1%) | 0 (0.0%) |
| No Fuel Used | 0 (0.0%) | 0 (0.0%) |
| Total | 1,136 (100.0%) | 71 (100.0%) |
Household Vehicle Usage in Brownstown
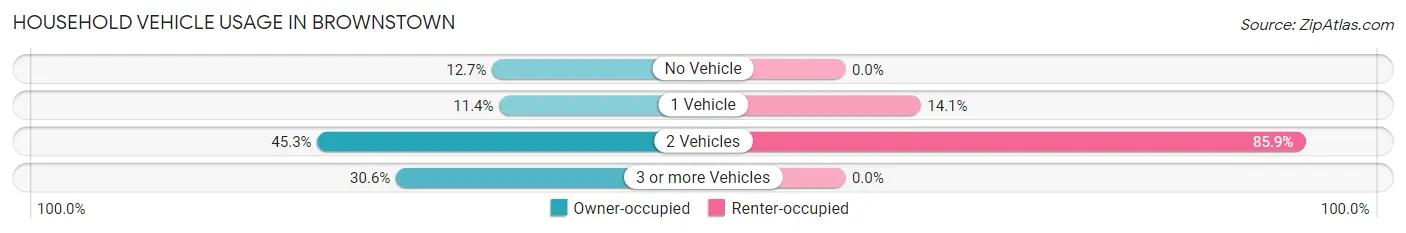
| Vehicles per Household | Owner-occupied | Renter-occupied |
| No Vehicle | 144 (12.7%) | 0 (0.0%) |
| 1 Vehicle | 129 (11.4%) | 10 (14.1%) |
| 2 Vehicles | 515 (45.3%) | 61 (85.9%) |
| 3 or more Vehicles | 348 (30.6%) | 0 (0.0%) |
| Total | 1,136 (100.0%) | 71 (100.0%) |
Real Estate & Mortgages in Brownstown
Real Estate and Mortgage Overview in Brownstown
| Characteristic | Without Mortgage | With Mortgage |
| Housing Units | 490 | 646 |
| Median Property Value | $282,300 | $259,000 |
| Median Household Income | $113,605 | $129 |
| Monthly Housing Costs | $661 | $74 |
| Real Estate Taxes | $3,452 | $3 |
Property Value by Mortgage Status in Brownstown
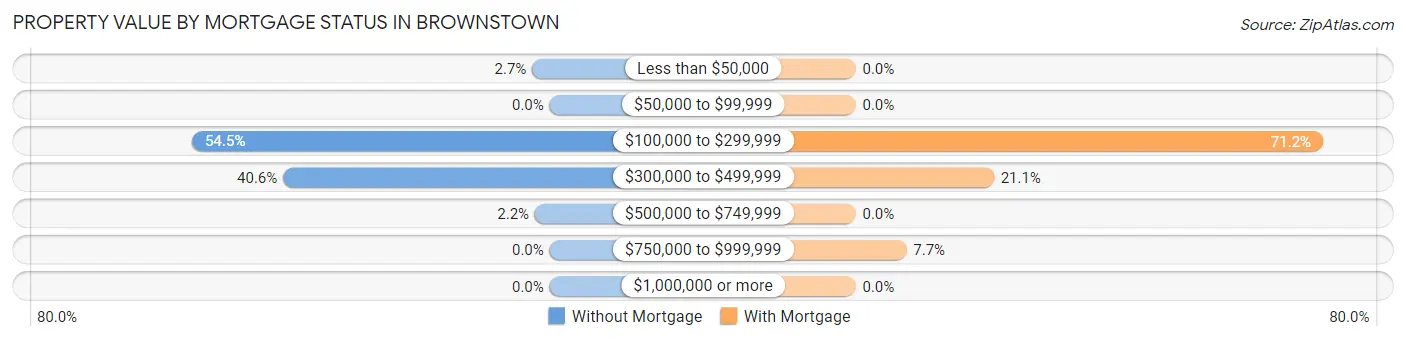
| Property Value | Without Mortgage | With Mortgage |
| Less than $50,000 | 13 (2.6%) | 0 (0.0%) |
| $50,000 to $99,999 | 0 (0.0%) | 0 (0.0%) |
| $100,000 to $299,999 | 267 (54.5%) | 460 (71.2%) |
| $300,000 to $499,999 | 199 (40.6%) | 136 (21.0%) |
| $500,000 to $749,999 | 11 (2.2%) | 0 (0.0%) |
| $750,000 to $999,999 | 0 (0.0%) | 50 (7.7%) |
| $1,000,000 or more | 0 (0.0%) | 0 (0.0%) |
| Total | 490 (100.0%) | 646 (100.0%) |
Household Income by Mortgage Status in Brownstown
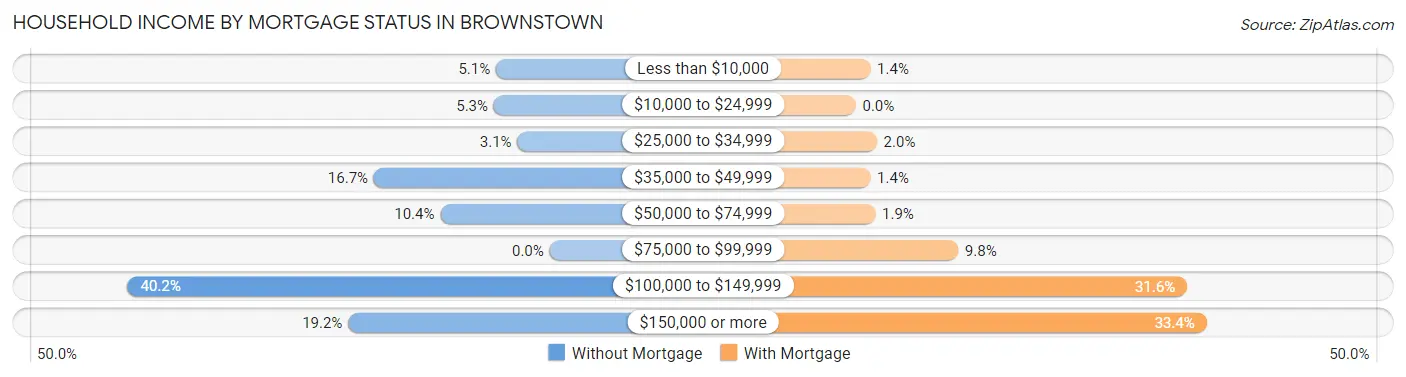
| Household Income | Without Mortgage | With Mortgage |
| Less than $10,000 | 25 (5.1%) | 9 (1.4%) |
| $10,000 to $24,999 | 26 (5.3%) | 0 (0.0%) |
| $25,000 to $34,999 | 15 (3.1%) | 13 (2.0%) |
| $35,000 to $49,999 | 82 (16.7%) | 9 (1.4%) |
| $50,000 to $74,999 | 51 (10.4%) | 12 (1.9%) |
| $75,000 to $99,999 | 0 (0.0%) | 63 (9.8%) |
| $100,000 to $149,999 | 197 (40.2%) | 204 (31.6%) |
| $150,000 or more | 94 (19.2%) | 216 (33.4%) |
| Total | 490 (100.0%) | 646 (100.0%) |
Property Value to Household Income Ratio in Brownstown
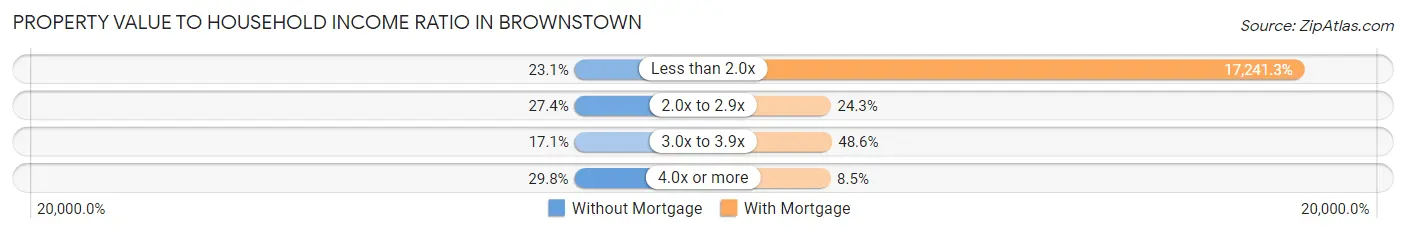
| Value-to-Income Ratio | Without Mortgage | With Mortgage |
| Less than 2.0x | 113 (23.1%) | 111,379 (17,241.3%) |
| 2.0x to 2.9x | 134 (27.4%) | 157 (24.3%) |
| 3.0x to 3.9x | 84 (17.1%) | 314 (48.6%) |
| 4.0x or more | 146 (29.8%) | 55 (8.5%) |
| Total | 490 (100.0%) | 646 (100.0%) |
Real Estate Taxes by Mortgage Status in Brownstown
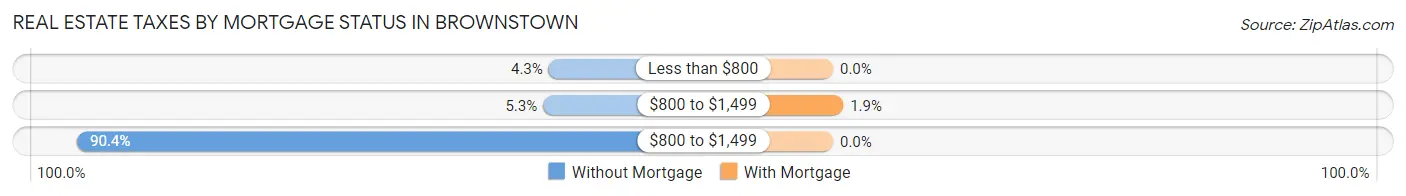
| Property Taxes | Without Mortgage | With Mortgage |
| Less than $800 | 21 (4.3%) | 0 (0.0%) |
| $800 to $1,499 | 26 (5.3%) | 12 (1.9%) |
| $800 to $1,499 | 443 (90.4%) | 0 (0.0%) |
| Total | 490 (100.0%) | 646 (100.0%) |
Health & Disability in Brownstown
Health Insurance Coverage by Age in Brownstown
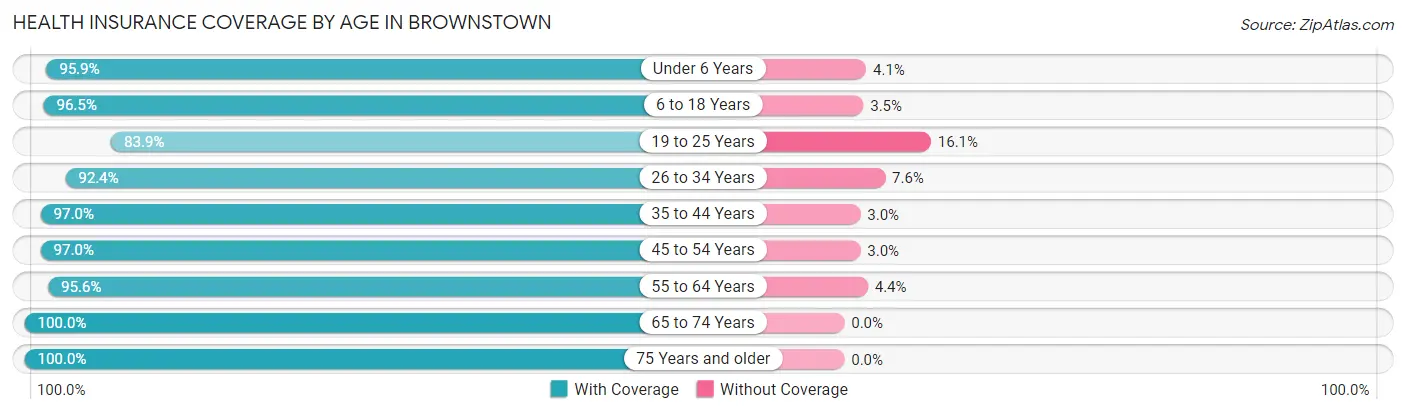
| Age Bracket | With Coverage | Without Coverage |
| Under 6 Years | 307 (95.9%) | 13 (4.1%) |
| 6 to 18 Years | 736 (96.5%) | 27 (3.5%) |
| 19 to 25 Years | 426 (83.9%) | 82 (16.1%) |
| 26 to 34 Years | 352 (92.4%) | 29 (7.6%) |
| 35 to 44 Years | 260 (97.0%) | 8 (3.0%) |
| 45 to 54 Years | 390 (97.0%) | 12 (3.0%) |
| 55 to 64 Years | 415 (95.6%) | 19 (4.4%) |
| 65 to 74 Years | 289 (100.0%) | 0 (0.0%) |
| 75 Years and older | 217 (100.0%) | 0 (0.0%) |
| Total | 3,392 (94.7%) | 190 (5.3%) |
Health Insurance Coverage by Citizenship Status in Brownstown
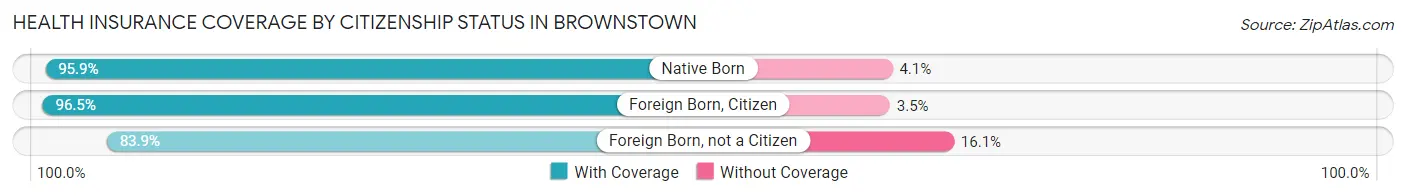
| Citizenship Status | With Coverage | Without Coverage |
| Native Born | 307 (95.9%) | 13 (4.1%) |
| Foreign Born, Citizen | 736 (96.5%) | 27 (3.5%) |
| Foreign Born, not a Citizen | 426 (83.9%) | 82 (16.1%) |
Health Insurance Coverage by Household Income in Brownstown
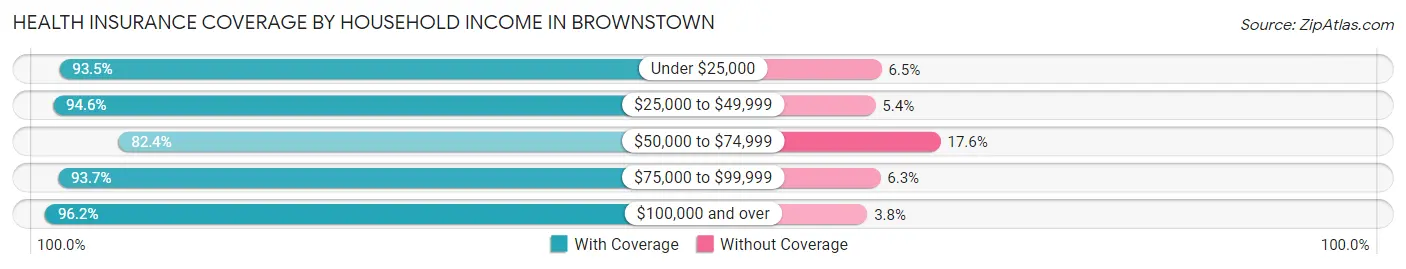
| Household Income | With Coverage | Without Coverage |
| Under $25,000 | 115 (93.5%) | 8 (6.5%) |
| $25,000 to $49,999 | 212 (94.6%) | 12 (5.4%) |
| $50,000 to $74,999 | 197 (82.4%) | 42 (17.6%) |
| $75,000 to $99,999 | 522 (93.7%) | 35 (6.3%) |
| $100,000 and over | 2,335 (96.2%) | 93 (3.8%) |
Public vs Private Health Insurance Coverage by Age in Brownstown
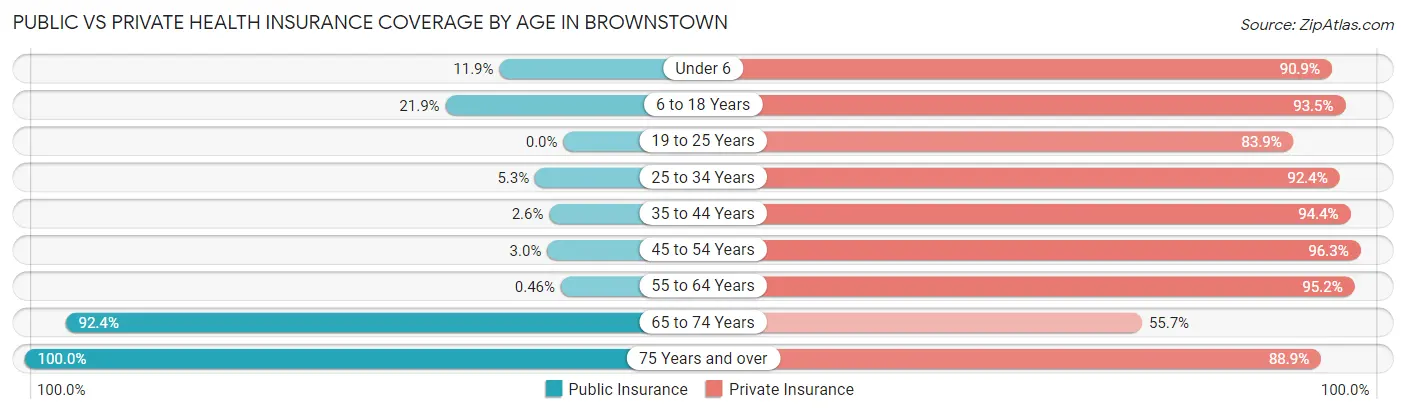
| Age Bracket | Public Insurance | Private Insurance |
| Under 6 | 38 (11.9%) | 291 (90.9%) |
| 6 to 18 Years | 167 (21.9%) | 713 (93.4%) |
| 19 to 25 Years | 0 (0.0%) | 426 (83.9%) |
| 25 to 34 Years | 20 (5.2%) | 352 (92.4%) |
| 35 to 44 Years | 7 (2.6%) | 253 (94.4%) |
| 45 to 54 Years | 12 (3.0%) | 387 (96.3%) |
| 55 to 64 Years | 2 (0.5%) | 413 (95.2%) |
| 65 to 74 Years | 267 (92.4%) | 161 (55.7%) |
| 75 Years and over | 217 (100.0%) | 193 (88.9%) |
| Total | 730 (20.4%) | 3,189 (89.0%) |
Disability Status by Sex by Age in Brownstown
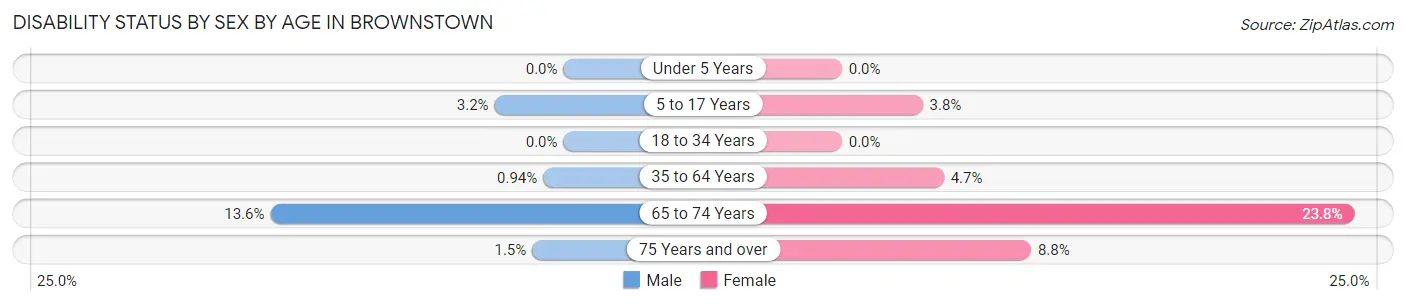
| Age Bracket | Male | Female |
| Under 5 Years | 0 (0.0%) | 0 (0.0%) |
| 5 to 17 Years | 12 (3.2%) | 16 (3.7%) |
| 18 to 34 Years | 0 (0.0%) | 0 (0.0%) |
| 35 to 64 Years | 5 (0.9%) | 27 (4.7%) |
| 65 to 74 Years | 17 (13.6%) | 39 (23.8%) |
| 75 Years and over | 1 (1.5%) | 13 (8.8%) |
Disability Class by Sex by Age in Brownstown
Disability Class: Hearing Difficulty
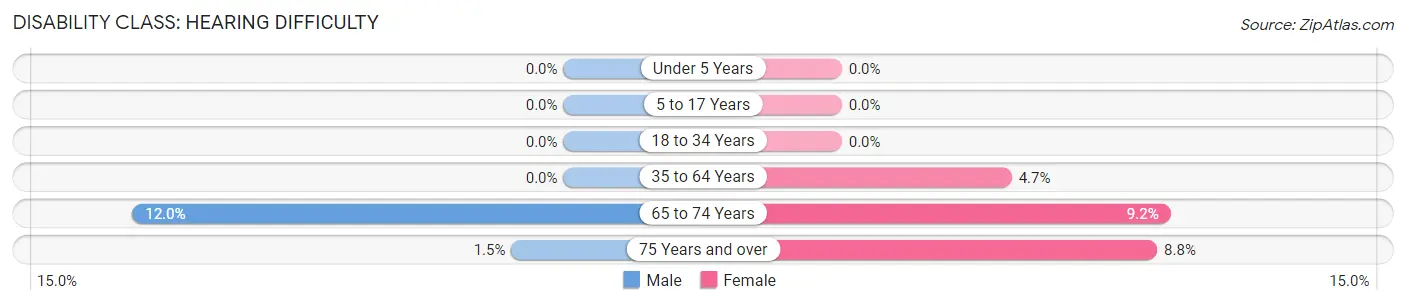
| Age Bracket | Male | Female |
| Under 5 Years | 0 (0.0%) | 0 (0.0%) |
| 5 to 17 Years | 0 (0.0%) | 0 (0.0%) |
| 18 to 34 Years | 0 (0.0%) | 0 (0.0%) |
| 35 to 64 Years | 0 (0.0%) | 27 (4.7%) |
| 65 to 74 Years | 15 (12.0%) | 15 (9.1%) |
| 75 Years and over | 1 (1.5%) | 13 (8.8%) |
Disability Class: Vision Difficulty
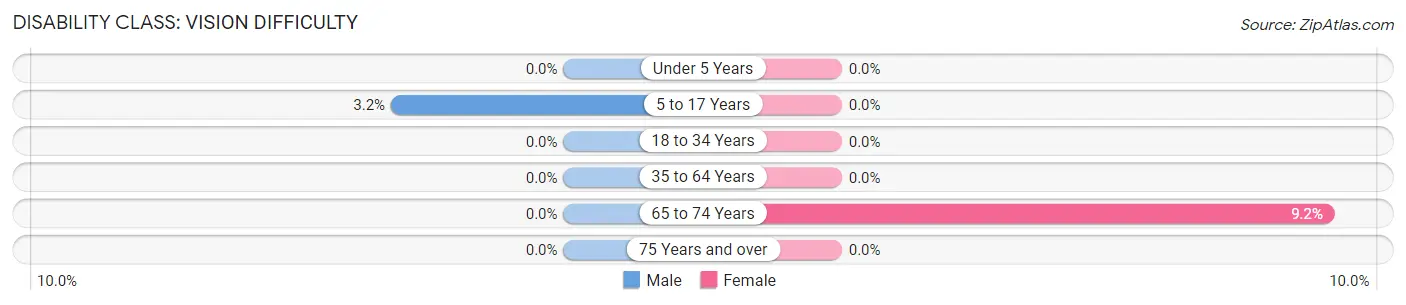
| Age Bracket | Male | Female |
| Under 5 Years | 0 (0.0%) | 0 (0.0%) |
| 5 to 17 Years | 12 (3.2%) | 0 (0.0%) |
| 18 to 34 Years | 0 (0.0%) | 0 (0.0%) |
| 35 to 64 Years | 0 (0.0%) | 0 (0.0%) |
| 65 to 74 Years | 0 (0.0%) | 15 (9.1%) |
| 75 Years and over | 0 (0.0%) | 0 (0.0%) |
Disability Class: Cognitive Difficulty
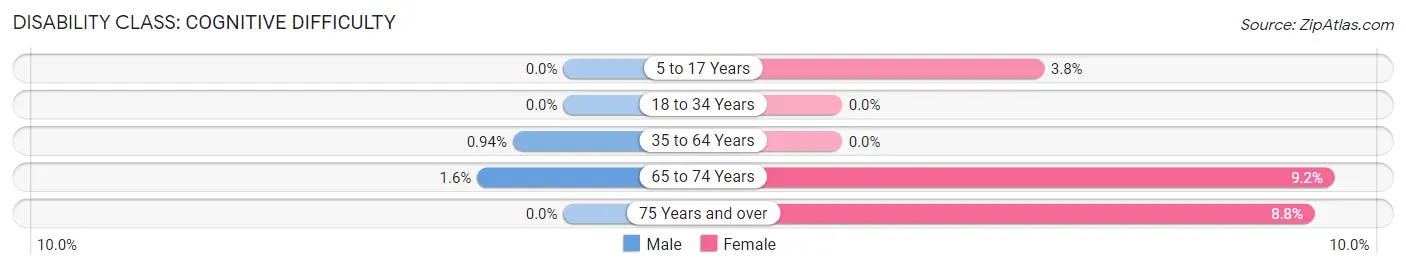
| Age Bracket | Male | Female |
| 5 to 17 Years | 0 (0.0%) | 16 (3.7%) |
| 18 to 34 Years | 0 (0.0%) | 0 (0.0%) |
| 35 to 64 Years | 5 (0.9%) | 0 (0.0%) |
| 65 to 74 Years | 2 (1.6%) | 15 (9.1%) |
| 75 Years and over | 0 (0.0%) | 13 (8.8%) |
Disability Class: Ambulatory Difficulty
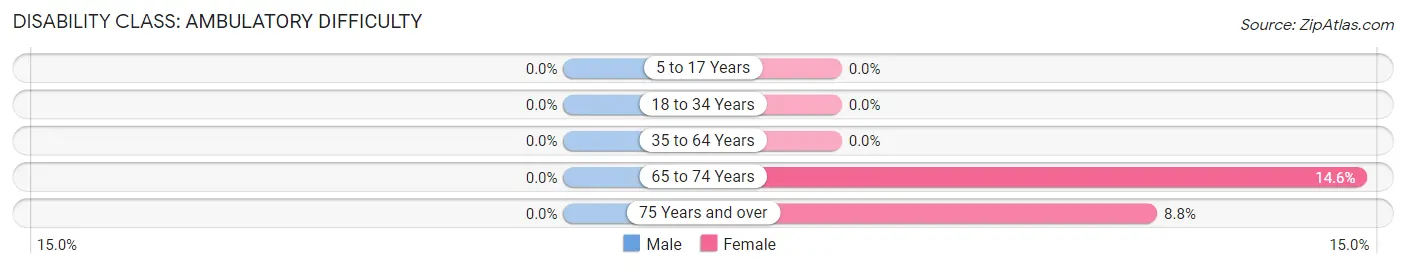
| Age Bracket | Male | Female |
| 5 to 17 Years | 0 (0.0%) | 0 (0.0%) |
| 18 to 34 Years | 0 (0.0%) | 0 (0.0%) |
| 35 to 64 Years | 0 (0.0%) | 0 (0.0%) |
| 65 to 74 Years | 0 (0.0%) | 24 (14.6%) |
| 75 Years and over | 0 (0.0%) | 13 (8.8%) |
Disability Class: Self-Care Difficulty
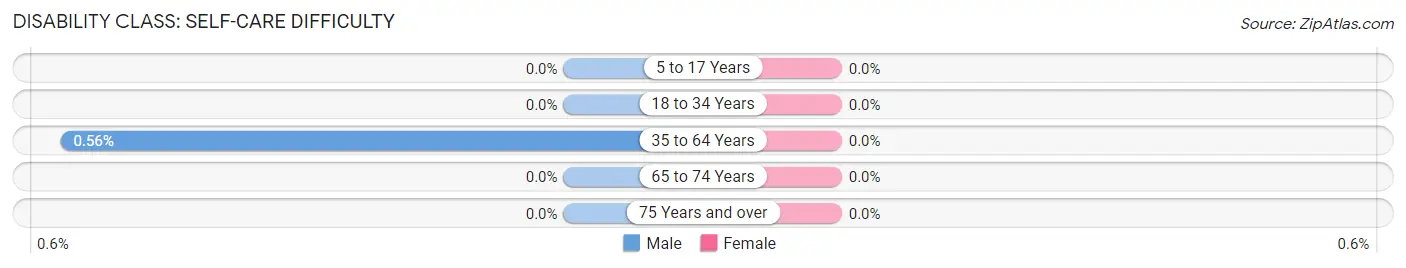
| Age Bracket | Male | Female |
| 5 to 17 Years | 0 (0.0%) | 0 (0.0%) |
| 18 to 34 Years | 0 (0.0%) | 0 (0.0%) |
| 35 to 64 Years | 3 (0.6%) | 0 (0.0%) |
| 65 to 74 Years | 0 (0.0%) | 0 (0.0%) |
| 75 Years and over | 0 (0.0%) | 0 (0.0%) |
Technology Access in Brownstown
Computing Device Access in Brownstown
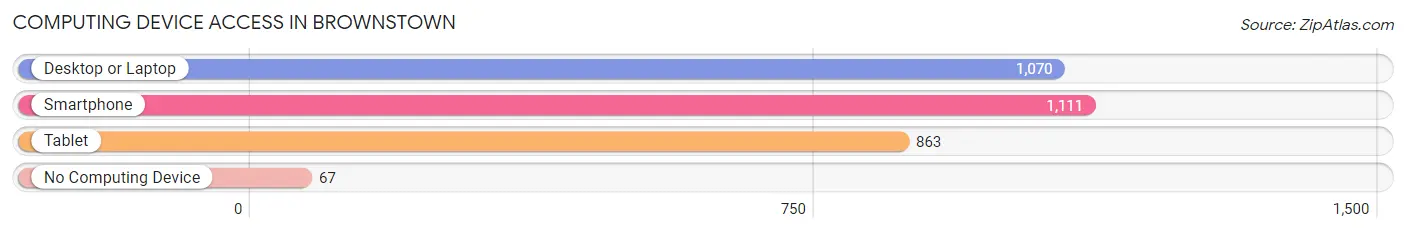
| Device Type | # Households | % Households |
| Desktop or Laptop | 1,070 | 88.6% |
| Smartphone | 1,111 | 92.0% |
| Tablet | 863 | 71.5% |
| No Computing Device | 67 | 5.6% |
| Total | 1,207 | 100.0% |
Internet Access in Brownstown
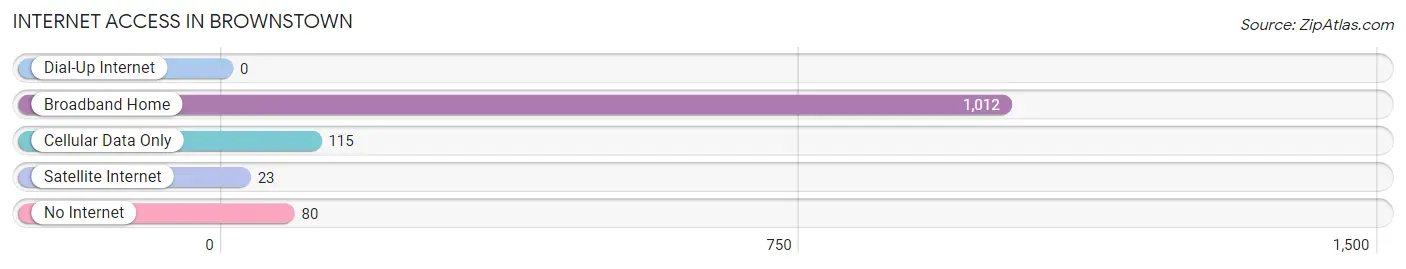
| Internet Type | # Households | % Households |
| Dial-Up Internet | 0 | 0.0% |
| Broadband Home | 1,012 | 83.8% |
| Cellular Data Only | 115 | 9.5% |
| Satellite Internet | 23 | 1.9% |
| No Internet | 80 | 6.6% |
| Total | 1,207 | 100.0% |
Brownstown Summary
Brownstown, Pennsylvania is a small borough located in Lancaster County. It is situated in the southeastern corner of the county, approximately 10 miles from the city of Lancaster. The borough is bordered by East Cocalico Township to the north, West Cocalico Township to the east, and Adamstown Borough to the south. The population of Brownstown was 1,845 as of the 2010 census.
History
Brownstown was founded in 1737 by John Brown, a Quaker from England. He purchased a tract of land from the local Native Americans and established a small settlement. The settlement was originally known as Brown's Town, but the name was eventually shortened to Brownstown.
In 1762, the first schoolhouse was built in Brownstown. The schoolhouse was located on the corner of Main and Market Streets and served as the town's only school until 1845.
In 1845, the first post office was established in Brownstown. The post office was located in the home of John Brown, the founder of the town.
In 1854, the first church was built in Brownstown. The church was a Methodist Episcopal church and was located on the corner of Main and Market Streets.
In 1871, the first railroad line was built in Brownstown. The railroad line connected Brownstown to the nearby towns of Adamstown and Ephrata.
In 1873, the first newspaper was established in Brownstown. The newspaper was called the Brownstown Gazette and was published weekly.
In 1876, the first bank was established in Brownstown. The bank was called the Brownstown National Bank and was located on the corner of Main and Market Streets.
In 1883, the first telephone line was established in Brownstown. The telephone line connected Brownstown to the nearby towns of Adamstown and Ephrata.
In 1885, the first fire company was established in Brownstown. The fire company was called the Brownstown Fire Company and was located on the corner of Main and Market Streets.
In 1887, the first electric lights were installed in Brownstown. The electric lights were powered by a generator located on the corner of Main and Market Streets.
In 1895, the first water system was established in Brownstown. The water system was powered by a steam engine located on the corner of Main and Market Streets.
Geography
Brownstown is located in southeastern Lancaster County, approximately 10 miles from the city of Lancaster. The borough is bordered by East Cocalico Township to the north, West Cocalico Township to the east, and Adamstown Borough to the south.
The borough is situated in the rolling hills of the Pennsylvania Dutch Country. The terrain is mostly flat, with some small hills and valleys. The borough is located in the Conestoga River watershed.
Economy
The economy of Brownstown is largely based on agriculture. The borough is home to several farms, which produce a variety of crops, including corn, soybeans, wheat, and hay.
The borough is also home to several small businesses, including restaurants, retail stores, and service providers. The borough is also home to several manufacturing companies, which produce a variety of products, including furniture, clothing, and food products.
Demographics
As of the 2010 census, the population of Brownstown was 1,845. The racial makeup of the borough was 95.3% White, 0.9% African American, 0.2% Native American, 0.7% Asian, 0.1% Pacific Islander, 1.2% from other races, and 1.6% from two or more races. Hispanic or Latino of any race were 3.2% of the population.
The median household income in Brownstown was $50,938, and the median family income was $60,938. The per capita income in Brownstown was $25,938. About 5.2% of families and 6.7% of the population were below the poverty line, including 8.2% of those under age 18 and 4.2% of those age 65 or over.
Common Questions
What is Per Capita Income in Brownstown?
Per Capita income in Brownstown is $40,986.
What is the Median Family Income in Brownstown?
Median Family Income in Brownstown is $120,630.
What is the Median Household income in Brownstown?
Median Household Income in Brownstown is $111,164.
What is Income or Wage Gap in Brownstown?
Income or Wage Gap in Brownstown is 64.9%.
Women in Brownstown earn 35.1 cents for every dollar earned by a man.
What is Inequality or Gini Index in Brownstown?
Inequality or Gini Index in Brownstown is 0.34.
What is the Total Population of Brownstown?
Total Population of Brownstown is 3,582.
What is the Total Male Population of Brownstown?
Total Male Population of Brownstown is 1,697.
What is the Total Female Population of Brownstown?
Total Female Population of Brownstown is 1,885.
What is the Ratio of Males per 100 Females in Brownstown?
There are 90.03 Males per 100 Females in Brownstown.
What is the Ratio of Females per 100 Males in Brownstown?
There are 111.08 Females per 100 Males in Brownstown.
What is the Median Population Age in Brownstown?
Median Population Age in Brownstown is 29.9 Years.
What is the Average Family Size in Brownstown
Average Family Size in Brownstown is 3.4 People.
What is the Average Household Size in Brownstown
Average Household Size in Brownstown is 3.0 People.
How Large is the Labor Force in Brownstown?
There are 2,032 People in the Labor Forcein in Brownstown.
What is the Percentage of People in the Labor Force in Brownstown?
74.1% of People are in the Labor Force in Brownstown.
What is the Unemployment Rate in Brownstown?
Unemployment Rate in Brownstown is 6.7%.