Brookville borough, PA Map & Demographics
Brookville borough Overview
$28,787
PER CAPITA INCOME
$64,459
AVG FAMILY INCOME
$57,807
AVG HOUSEHOLD INCOME
26.7%
WAGE / INCOME GAP [ % ]
73.3¢/ $1
WAGE / INCOME GAP [ $ ]
0.42
INEQUALITY / GINI INDEX
3,974
TOTAL POPULATION
2,025
MALE POPULATION
1,949
FEMALE POPULATION
103.90
MALES / 100 FEMALES
96.25
FEMALES / 100 MALES
37.1
MEDIAN AGE
3.1
AVG FAMILY SIZE
2.2
AVG HOUSEHOLD SIZE
2,038
LABOR FORCE [ PEOPLE ]
65.5%
PERCENT IN LABOR FORCE
8.1%
UNEMPLOYMENT RATE
Income in Brookville borough
Income Overview in Brookville borough
Per Capita Income in Brookville borough is $28,787, while median incomes of families and households are $64,459 and $57,807 respectively.
| Characteristic | Number | Measure |
| Per Capita Income | 3,974 | $28,787 |
| Median Family Income | 964 | $64,459 |
| Mean Family Income | 964 | $78,136 |
| Median Household Income | 1,719 | $57,807 |
| Mean Household Income | 1,719 | $63,605 |
| Income Deficit | 964 | $0 |
| Wage / Income Gap (%) | 3,974 | 26.72% |
| Wage / Income Gap ($) | 3,974 | 73.28¢ per $1 |
| Gini / Inequality Index | 3,974 | 0.42 |
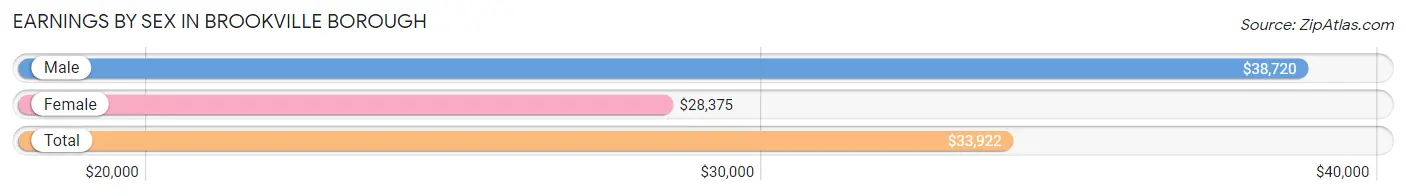
Earnings by Sex in Brookville borough
Average Earnings in Brookville borough are $33,922, $38,720 for men and $28,375 for women, a difference of 26.7%.
| Sex | Number | Average Earnings |
| Male | 1,116 (54.8%) | $38,720 |
| Female | 921 (45.2%) | $28,375 |
| Total | 2,037 (100.0%) | $33,922 |
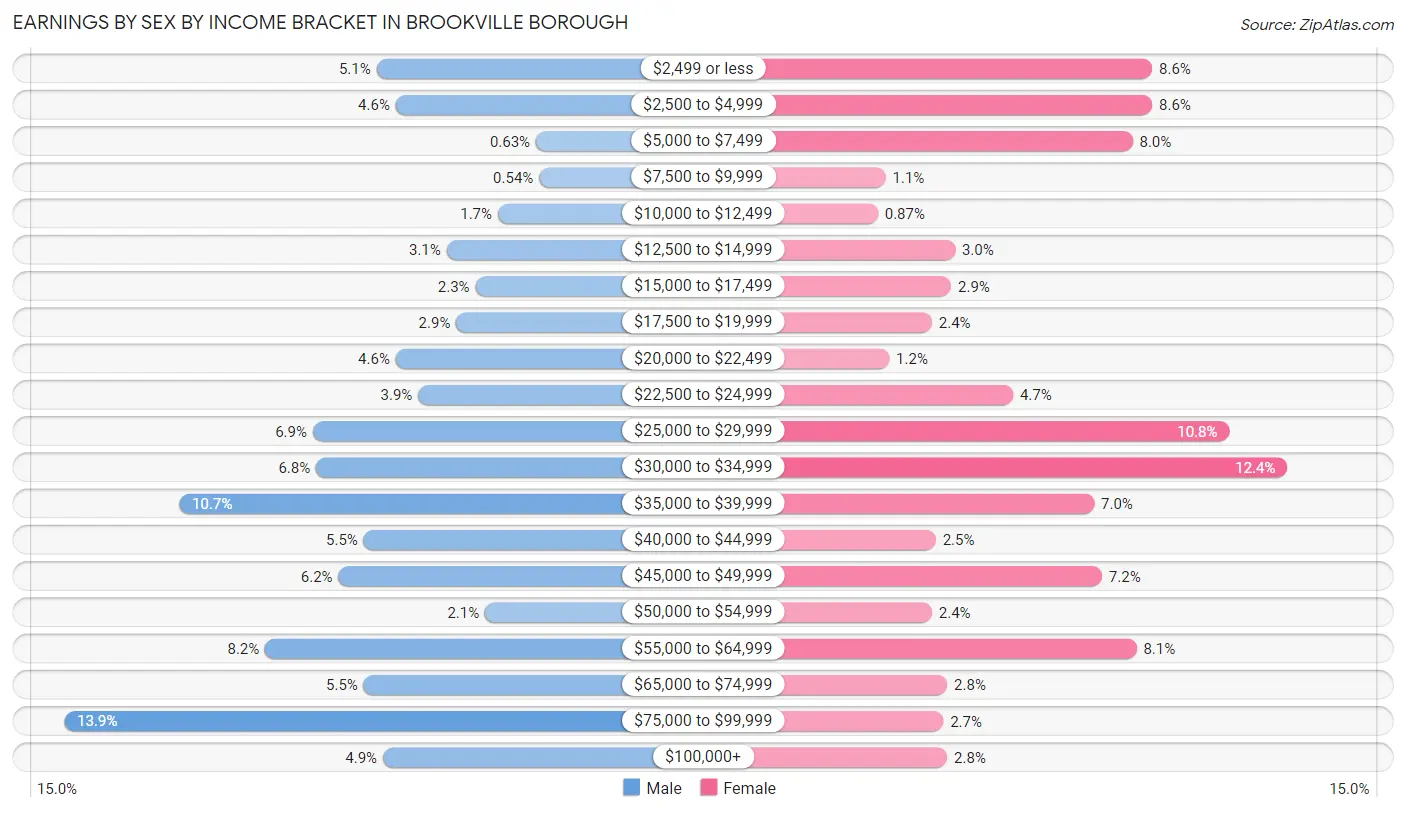
Earnings by Sex by Income Bracket in Brookville borough
The most common earnings brackets in Brookville borough are $75,000 to $99,999 for men (155 | 13.9%) and $30,000 to $34,999 for women (114 | 12.4%).
| Income | Male | Female |
| $2,499 or less | 57 (5.1%) | 79 (8.6%) |
| $2,500 to $4,999 | 51 (4.6%) | 79 (8.6%) |
| $5,000 to $7,499 | 7 (0.6%) | 74 (8.0%) |
| $7,500 to $9,999 | 6 (0.5%) | 10 (1.1%) |
| $10,000 to $12,499 | 19 (1.7%) | 8 (0.9%) |
| $12,500 to $14,999 | 35 (3.1%) | 28 (3.0%) |
| $15,000 to $17,499 | 26 (2.3%) | 27 (2.9%) |
| $17,500 to $19,999 | 32 (2.9%) | 22 (2.4%) |
| $20,000 to $22,499 | 51 (4.6%) | 11 (1.2%) |
| $22,500 to $24,999 | 44 (3.9%) | 43 (4.7%) |
| $25,000 to $29,999 | 77 (6.9%) | 99 (10.7%) |
| $30,000 to $34,999 | 76 (6.8%) | 114 (12.4%) |
| $35,000 to $39,999 | 119 (10.7%) | 64 (7.0%) |
| $40,000 to $44,999 | 61 (5.5%) | 23 (2.5%) |
| $45,000 to $49,999 | 69 (6.2%) | 66 (7.2%) |
| $50,000 to $54,999 | 23 (2.1%) | 22 (2.4%) |
| $55,000 to $64,999 | 92 (8.2%) | 75 (8.1%) |
| $65,000 to $74,999 | 61 (5.5%) | 26 (2.8%) |
| $75,000 to $99,999 | 155 (13.9%) | 25 (2.7%) |
| $100,000+ | 55 (4.9%) | 26 (2.8%) |
| Total | 1,116 (100.0%) | 921 (100.0%) |
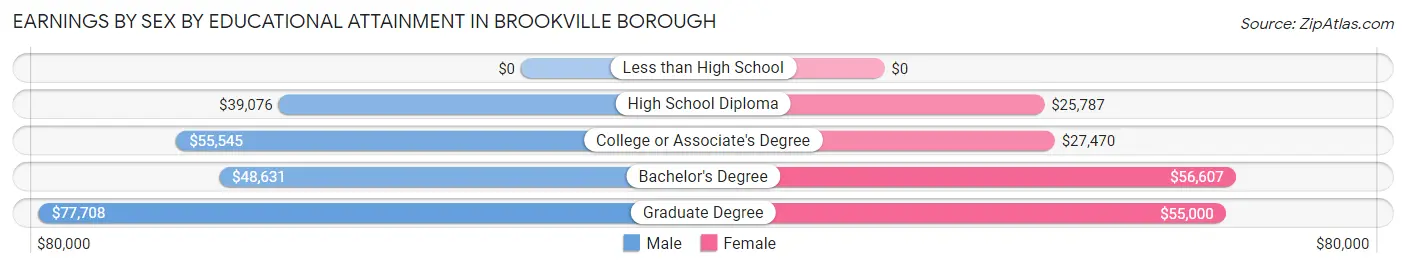
Earnings by Sex by Educational Attainment in Brookville borough
Average earnings in Brookville borough are $43,100 for men and $32,159 for women, a difference of 25.4%. Men with an educational attainment of graduate degree enjoy the highest average annual earnings of $77,708, while those with high school diploma education earn the least with $39,076. Women with an educational attainment of bachelor's degree earn the most with the average annual earnings of $56,607, while those with high school diploma education have the smallest earnings of $25,787.
| Educational Attainment | Male Income | Female Income |
| Less than High School | - | - |
| High School Diploma | $39,076 | $25,787 |
| College or Associate's Degree | $55,545 | $27,470 |
| Bachelor's Degree | $48,631 | $56,607 |
| Graduate Degree | $77,708 | $55,000 |
| Total | $43,100 | $32,159 |
Family Income in Brookville borough
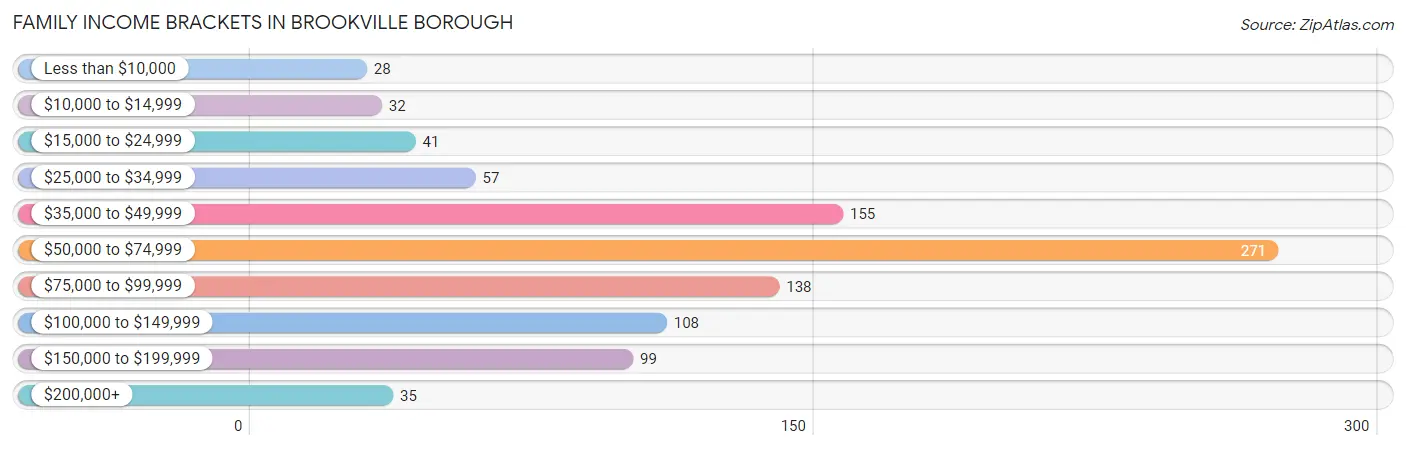
Family Income Brackets in Brookville borough
According to the Brookville borough family income data, there are 271 families falling into the $50,000 to $74,999 income range, which is the most common income bracket and makes up 28.1% of all families. Conversely, the less than $10,000 income bracket is the least frequent group with only 28 families (2.9%) belonging to this category.
| Income Bracket | # Families | % Families |
| Less than $10,000 | 28 | 2.9% |
| $10,000 to $14,999 | 32 | 3.3% |
| $15,000 to $24,999 | 41 | 4.3% |
| $25,000 to $34,999 | 57 | 5.9% |
| $35,000 to $49,999 | 155 | 16.1% |
| $50,000 to $74,999 | 271 | 28.1% |
| $75,000 to $99,999 | 138 | 14.3% |
| $100,000 to $149,999 | 108 | 11.2% |
| $150,000 to $199,999 | 99 | 10.3% |
| $200,000+ | 35 | 3.6% |
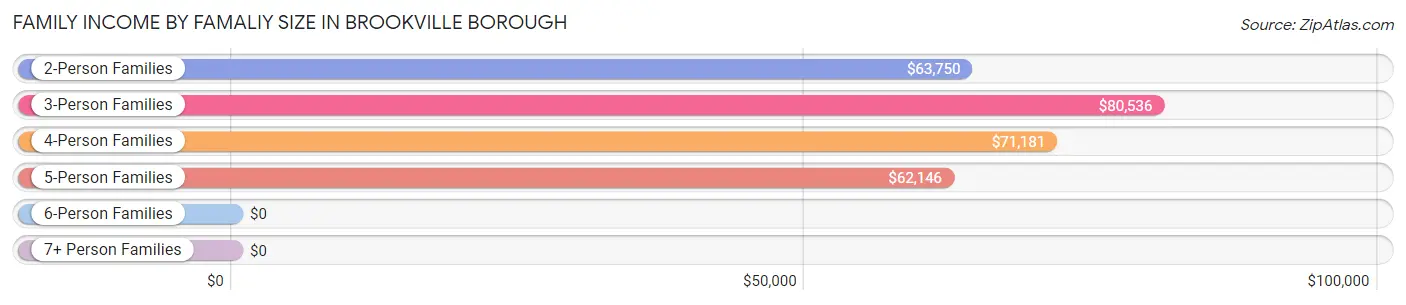
Family Income by Famaliy Size in Brookville borough
3-person families (263 | 27.3%) account for the highest median family income in Brookville borough with $80,536 per family, while 2-person families (435 | 45.1%) have the highest median income of $31,875 per family member.
| Income Bracket | # Families | Median Income |
| 2-Person Families | 435 (45.1%) | $63,750 |
| 3-Person Families | 263 (27.3%) | $80,536 |
| 4-Person Families | 92 (9.5%) | $71,181 |
| 5-Person Families | 161 (16.7%) | $62,146 |
| 6-Person Families | 13 (1.3%) | $0 |
| 7+ Person Families | 0 (0.0%) | $0 |
| Total | 964 (100.0%) | $64,459 |
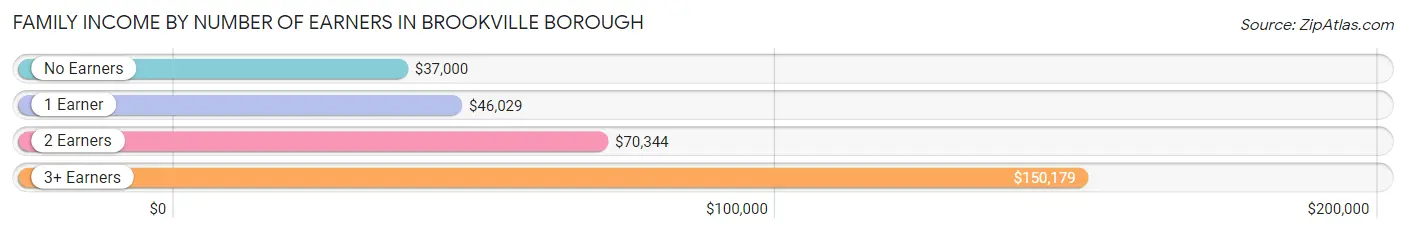
Family Income by Number of Earners in Brookville borough
The median family income in Brookville borough is $64,459, with families comprising 3+ earners (115) having the highest median family income of $150,179, while families with no earners (128) have the lowest median family income of $37,000, accounting for 11.9% and 13.3% of families, respectively.
| Number of Earners | # Families | Median Income |
| No Earners | 128 (13.3%) | $37,000 |
| 1 Earner | 284 (29.5%) | $46,029 |
| 2 Earners | 437 (45.3%) | $70,344 |
| 3+ Earners | 115 (11.9%) | $150,179 |
| Total | 964 (100.0%) | $64,459 |
Household Income in Brookville borough
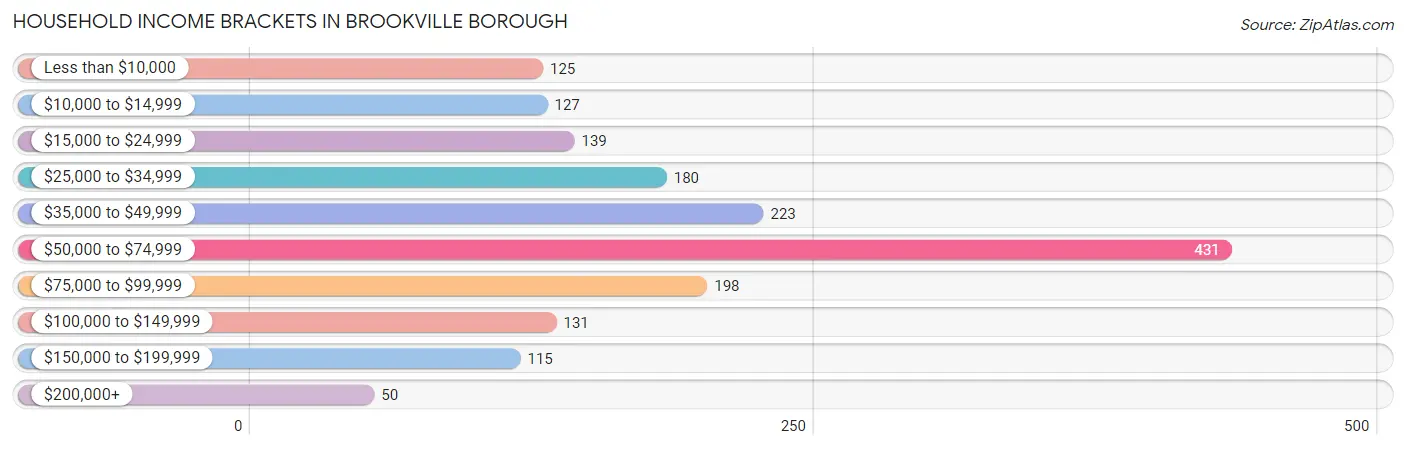
Household Income Brackets in Brookville borough
With 431 households falling in the category, the $50,000 to $74,999 income range is the most frequent in Brookville borough, accounting for 25.1% of all households. In contrast, only 50 households (2.9%) fall into the $200,000+ income bracket, making it the least populous group.
| Income Bracket | # Households | % Households |
| Less than $10,000 | 125 | 7.3% |
| $10,000 to $14,999 | 127 | 7.4% |
| $15,000 to $24,999 | 139 | 8.1% |
| $25,000 to $34,999 | 180 | 10.5% |
| $35,000 to $49,999 | 223 | 13.0% |
| $50,000 to $74,999 | 431 | 25.1% |
| $75,000 to $99,999 | 198 | 11.5% |
| $100,000 to $149,999 | 131 | 7.6% |
| $150,000 to $199,999 | 115 | 6.7% |
| $200,000+ | 50 | 2.9% |
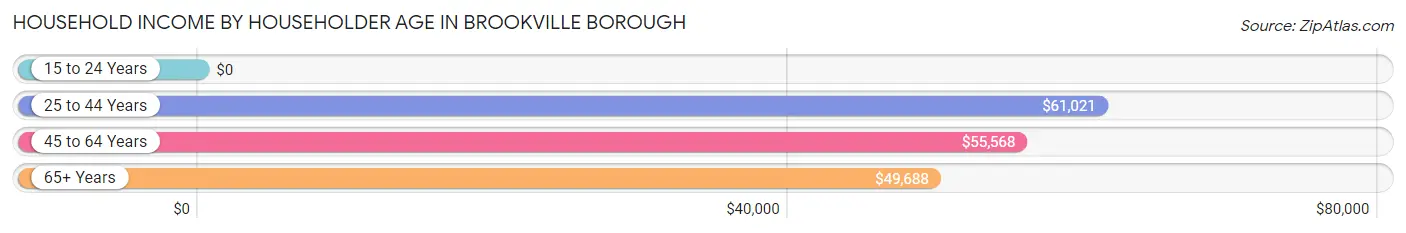
Household Income by Householder Age in Brookville borough
The median household income in Brookville borough is $57,807, with the highest median household income of $61,021 found in the 25 to 44 years age bracket for the primary householder. A total of 623 households (36.2%) fall into this category. Meanwhile, the 15 to 24 years age bracket for the primary householder has the lowest median household income of $0, with 64 households (3.7%) in this group.
| Income Bracket | # Households | Median Income |
| 15 to 24 Years | 64 (3.7%) | $0 |
| 25 to 44 Years | 623 (36.2%) | $61,021 |
| 45 to 64 Years | 491 (28.6%) | $55,568 |
| 65+ Years | 541 (31.5%) | $49,688 |
| Total | 1,719 (100.0%) | $57,807 |
Poverty in Brookville borough
Income Below Poverty by Sex and Age in Brookville borough
With 9.1% poverty level for males and 17.0% for females among the residents of Brookville borough, 15 year old males and 12 to 14 year old females are the most vulnerable to poverty, with 3 males (23.1%) and 11 females (64.7%) in their respective age groups living below the poverty level.
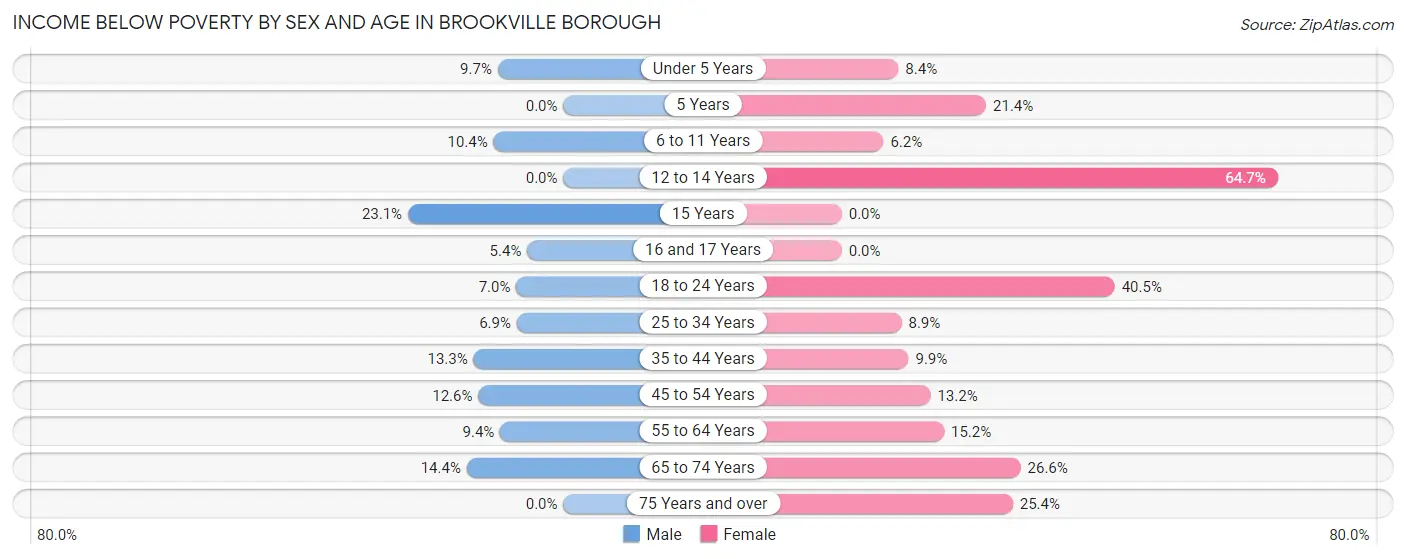
| Age Bracket | Male | Female |
| Under 5 Years | 15 (9.7%) | 9 (8.4%) |
| 5 Years | 0 (0.0%) | 6 (21.4%) |
| 6 to 11 Years | 17 (10.4%) | 12 (6.2%) |
| 12 to 14 Years | 0 (0.0%) | 11 (64.7%) |
| 15 Years | 3 (23.1%) | 0 (0.0%) |
| 16 and 17 Years | 3 (5.4%) | 0 (0.0%) |
| 18 to 24 Years | 10 (7.0%) | 77 (40.5%) |
| 25 to 34 Years | 21 (6.9%) | 25 (8.9%) |
| 35 to 44 Years | 36 (13.3%) | 21 (9.9%) |
| 45 to 54 Years | 25 (12.6%) | 22 (13.2%) |
| 55 to 64 Years | 18 (9.4%) | 39 (15.2%) |
| 65 to 74 Years | 34 (14.3%) | 47 (26.6%) |
| 75 Years and over | 0 (0.0%) | 49 (25.4%) |
| Total | 182 (9.1%) | 318 (17.0%) |
Income Above Poverty by Sex and Age in Brookville borough
According to the poverty statistics in Brookville borough, males aged 5 years and females aged 15 years are the age groups that are most secure financially, with 100.0% of males and 100.0% of females in these age groups living above the poverty line.
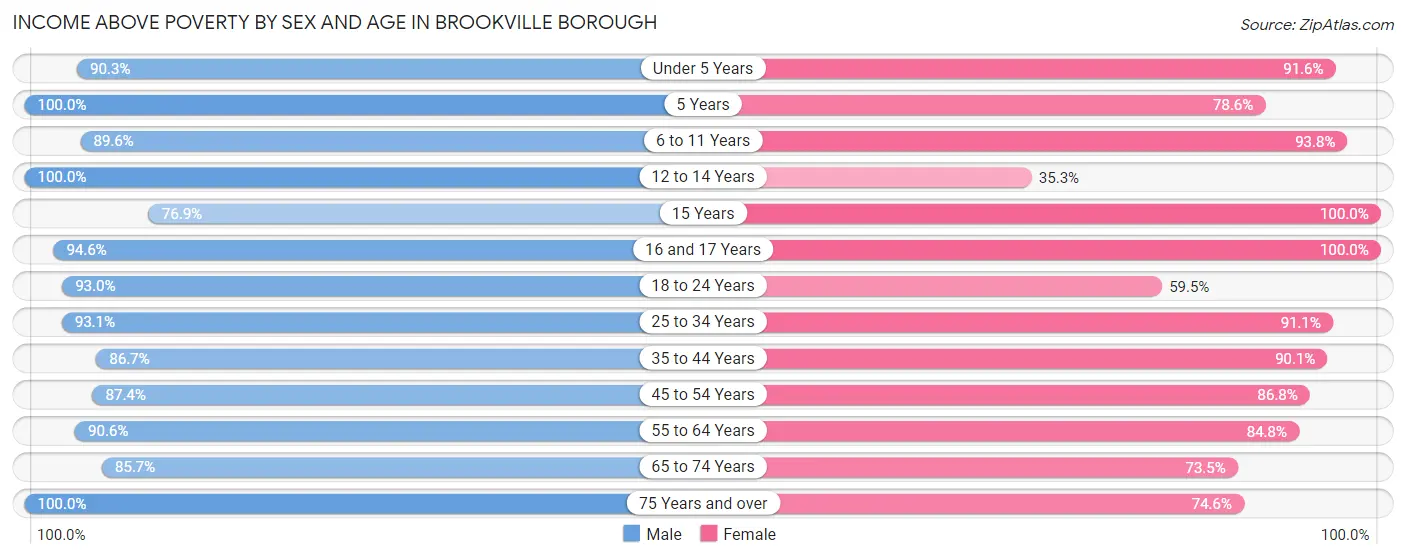
| Age Bracket | Male | Female |
| Under 5 Years | 139 (90.3%) | 98 (91.6%) |
| 5 Years | 82 (100.0%) | 22 (78.6%) |
| 6 to 11 Years | 147 (89.6%) | 182 (93.8%) |
| 12 to 14 Years | 71 (100.0%) | 6 (35.3%) |
| 15 Years | 10 (76.9%) | 33 (100.0%) |
| 16 and 17 Years | 53 (94.6%) | 13 (100.0%) |
| 18 to 24 Years | 133 (93.0%) | 113 (59.5%) |
| 25 to 34 Years | 283 (93.1%) | 257 (91.1%) |
| 35 to 44 Years | 234 (86.7%) | 191 (90.1%) |
| 45 to 54 Years | 173 (87.4%) | 145 (86.8%) |
| 55 to 64 Years | 174 (90.6%) | 218 (84.8%) |
| 65 to 74 Years | 203 (85.7%) | 130 (73.5%) |
| 75 Years and over | 110 (100.0%) | 144 (74.6%) |
| Total | 1,812 (90.9%) | 1,552 (83.0%) |
Income Below Poverty Among Married-Couple Families in Brookville borough
The poverty statistics for married-couple families in Brookville borough show that 4.2% or 30 of the total 722 families live below the poverty line. Families with no children have the highest poverty rate of 6.6%, comprising of 27 families. On the other hand, families with 3 or 4 children have the lowest poverty rate of 0.0%, which includes 0 families.
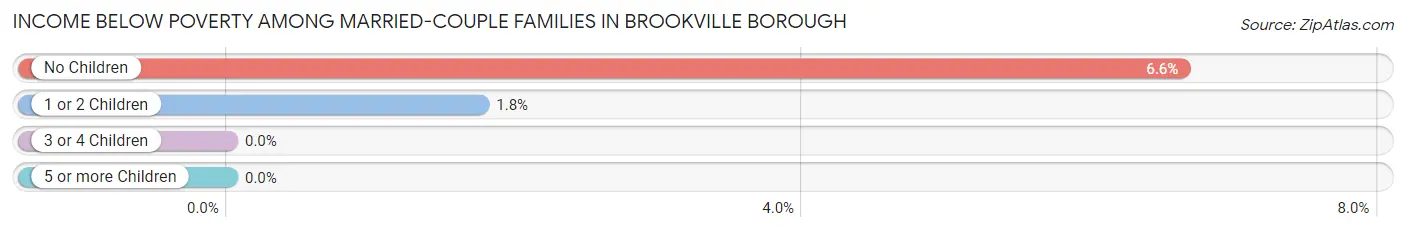
| Children | Above Poverty | Below Poverty |
| No Children | 380 (93.4%) | 27 (6.6%) |
| 1 or 2 Children | 168 (98.3%) | 3 (1.8%) |
| 3 or 4 Children | 144 (100.0%) | 0 (0.0%) |
| 5 or more Children | 0 (0.0%) | 0 (0.0%) |
| Total | 692 (95.8%) | 30 (4.2%) |
Income Below Poverty Among Single-Parent Households in Brookville borough
According to the poverty data in Brookville borough, 6.7% or 5 single-father households and 30.5% or 51 single-mother households are living below the poverty line. Among single-father households, those with 1 or 2 children have the highest poverty rate, with 5 households (8.5%) experiencing poverty. Likewise, among single-mother households, those with 3 or 4 children have the highest poverty rate, with 5 households (50.0%) falling below the poverty line.
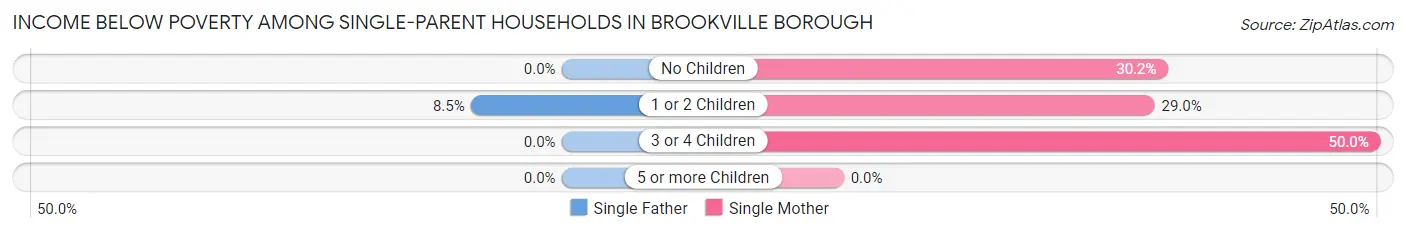
| Children | Single Father | Single Mother |
| No Children | 0 (0.0%) | 13 (30.2%) |
| 1 or 2 Children | 5 (8.5%) | 33 (28.9%) |
| 3 or 4 Children | 0 (0.0%) | 5 (50.0%) |
| 5 or more Children | 0 (0.0%) | 0 (0.0%) |
| Total | 5 (6.7%) | 51 (30.5%) |
Income Below Poverty Among Married-Couple vs Single-Parent Households in Brookville borough
The poverty data for Brookville borough shows that 30 of the married-couple family households (4.2%) and 56 of the single-parent households (23.1%) are living below the poverty level. Within the married-couple family households, those with no children have the highest poverty rate, with 27 households (6.6%) falling below the poverty line. Among the single-parent households, those with 3 or 4 children have the highest poverty rate, with 5 household (31.2%) living below poverty.
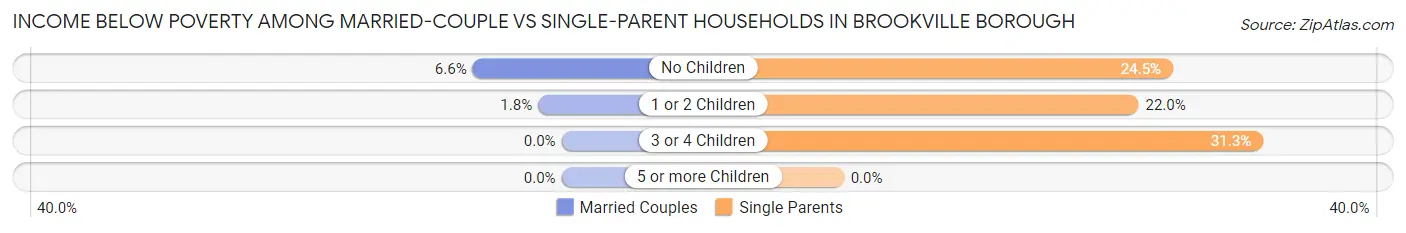
| Children | Married-Couple Families | Single-Parent Households |
| No Children | 27 (6.6%) | 13 (24.5%) |
| 1 or 2 Children | 3 (1.8%) | 38 (22.0%) |
| 3 or 4 Children | 0 (0.0%) | 5 (31.2%) |
| 5 or more Children | 0 (0.0%) | 0 (0.0%) |
| Total | 30 (4.2%) | 56 (23.1%) |
Race in Brookville borough
The most populous races in Brookville borough are White / Caucasian (3,743 | 94.2%), Hispanic or Latino (168 | 4.2%), and Two or more Races (167 | 4.2%).
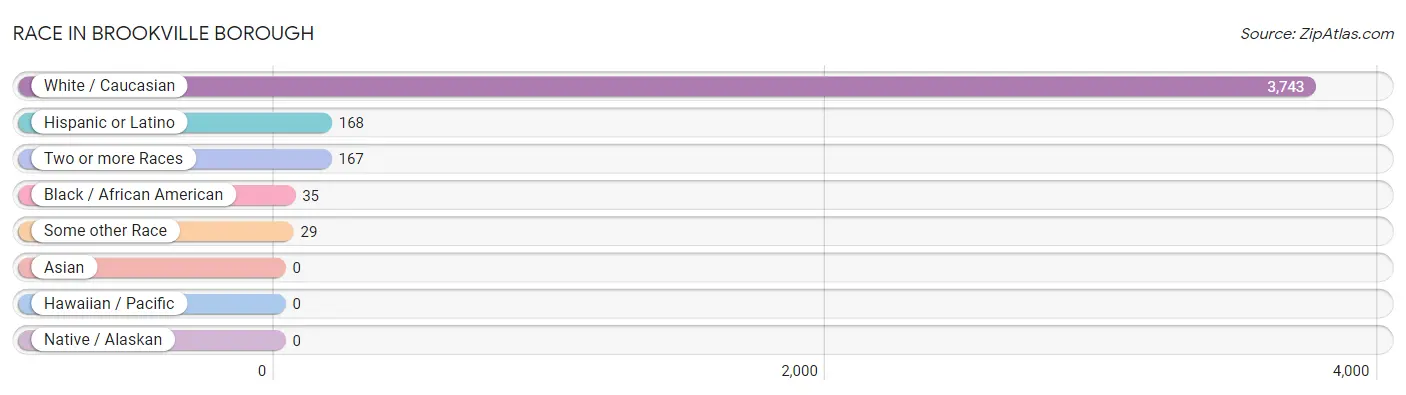
| Race | # Population | % Population |
| Asian | 0 | 0.0% |
| Black / African American | 35 | 0.9% |
| Hawaiian / Pacific | 0 | 0.0% |
| Hispanic or Latino | 168 | 4.2% |
| Native / Alaskan | 0 | 0.0% |
| White / Caucasian | 3,743 | 94.2% |
| Two or more Races | 167 | 4.2% |
| Some other Race | 29 | 0.7% |
| Total | 3,974 | 100.0% |
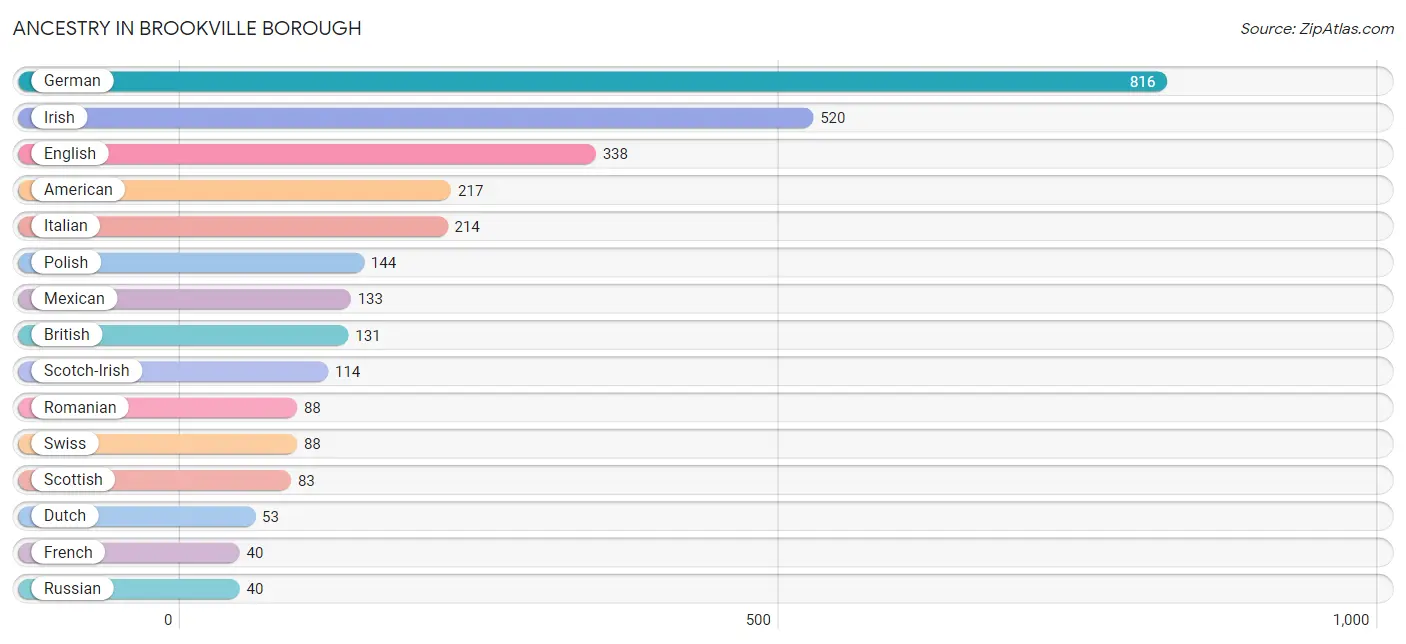
Ancestry in Brookville borough
The most populous ancestries reported in Brookville borough are German (816 | 20.5%), Irish (520 | 13.1%), English (338 | 8.5%), American (217 | 5.5%), and Italian (214 | 5.4%), together accounting for 53.0% of all Brookville borough residents.
| Ancestry | # Population | % Population |
| American | 217 | 5.5% |
| Austrian | 6 | 0.2% |
| Bhutanese | 20 | 0.5% |
| Brazilian | 4 | 0.1% |
| British | 131 | 3.3% |
| Canadian | 26 | 0.6% |
| Cherokee | 20 | 0.5% |
| Czechoslovakian | 8 | 0.2% |
| Danish | 6 | 0.2% |
| Delaware | 2 | 0.1% |
| Dutch | 53 | 1.3% |
| English | 338 | 8.5% |
| European | 35 | 0.9% |
| French | 40 | 1.0% |
| French Canadian | 18 | 0.4% |
| German | 816 | 20.5% |
| Hungarian | 22 | 0.5% |
| Irish | 520 | 13.1% |
| Italian | 214 | 5.4% |
| Lithuanian | 22 | 0.5% |
| Mexican | 133 | 3.4% |
| Norwegian | 7 | 0.2% |
| Pennsylvania German | 4 | 0.1% |
| Polish | 144 | 3.6% |
| Puerto Rican | 30 | 0.7% |
| Romanian | 88 | 2.2% |
| Russian | 40 | 1.0% |
| Scandinavian | 22 | 0.5% |
| Scotch-Irish | 114 | 2.9% |
| Scottish | 83 | 2.1% |
| Slavic | 31 | 0.8% |
| Slovak | 6 | 0.2% |
| Swedish | 9 | 0.2% |
| Swiss | 88 | 2.2% |
| Welsh | 28 | 0.7% | View All 35 Rows |
Immigrants in Brookville borough

| Immigration Origin | # Population | % Population | View All 0 Rows |
Sex and Age in Brookville borough
Sex and Age in Brookville borough
The most populous age groups in Brookville borough are 5 to 9 Years (214 | 10.6%) for men and 5 to 9 Years (173 | 8.9%) for women.

| Age Bracket | Male | Female |
| Under 5 Years | 154 (7.6%) | 107 (5.5%) |
| 5 to 9 Years | 214 (10.6%) | 173 (8.9%) |
| 10 to 14 Years | 103 (5.1%) | 66 (3.4%) |
| 15 to 19 Years | 110 (5.4%) | 77 (4.0%) |
| 20 to 24 Years | 102 (5.0%) | 159 (8.2%) |
| 25 to 29 Years | 120 (5.9%) | 155 (8.0%) |
| 30 to 34 Years | 184 (9.1%) | 127 (6.5%) |
| 35 to 39 Years | 187 (9.2%) | 127 (6.5%) |
| 40 to 44 Years | 83 (4.1%) | 85 (4.4%) |
| 45 to 49 Years | 145 (7.2%) | 73 (3.7%) |
| 50 to 54 Years | 53 (2.6%) | 94 (4.8%) |
| 55 to 59 Years | 143 (7.1%) | 154 (7.9%) |
| 60 to 64 Years | 49 (2.4%) | 105 (5.4%) |
| 65 to 69 Years | 131 (6.5%) | 111 (5.7%) |
| 70 to 74 Years | 113 (5.6%) | 73 (3.7%) |
| 75 to 79 Years | 63 (3.1%) | 91 (4.7%) |
| 80 to 84 Years | 30 (1.5%) | 56 (2.9%) |
| 85 Years and over | 41 (2.0%) | 116 (5.9%) |
| Total | 2,025 (100.0%) | 1,949 (100.0%) |
Families and Households in Brookville borough
Median Family Size in Brookville borough
The median family size in Brookville borough is 3.06 persons per family, with married-couple families (722 | 74.9%) accounting for the largest median family size of 3.12 persons per family. On the other hand, single male/father families (75 | 7.8%) represent the smallest median family size with 2.61 persons per family.
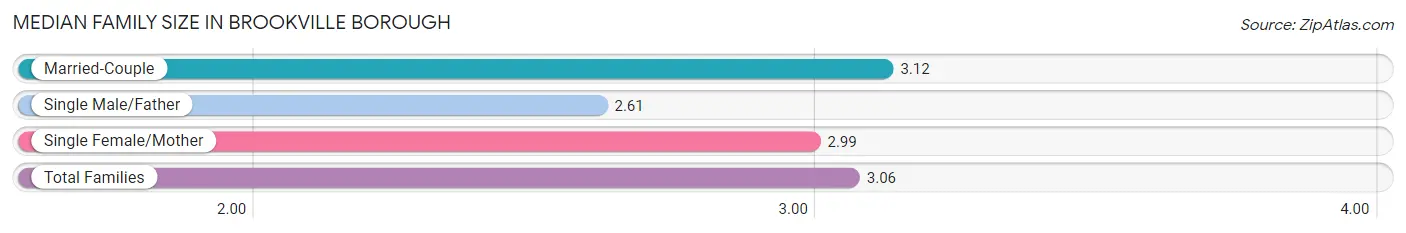
| Family Type | # Families | Family Size |
| Married-Couple | 722 (74.9%) | 3.12 |
| Single Male/Father | 75 (7.8%) | 2.61 |
| Single Female/Mother | 167 (17.3%) | 2.99 |
| Total Families | 964 (100.0%) | 3.06 |
Median Household Size in Brookville borough
The median household size in Brookville borough is 2.25 persons per household, with single female/mother households (167 | 9.7%) accounting for the largest median household size of 3.24 persons per household. non-family households (755 | 43.9%) represent the smallest median household size with 1.12 persons per household.
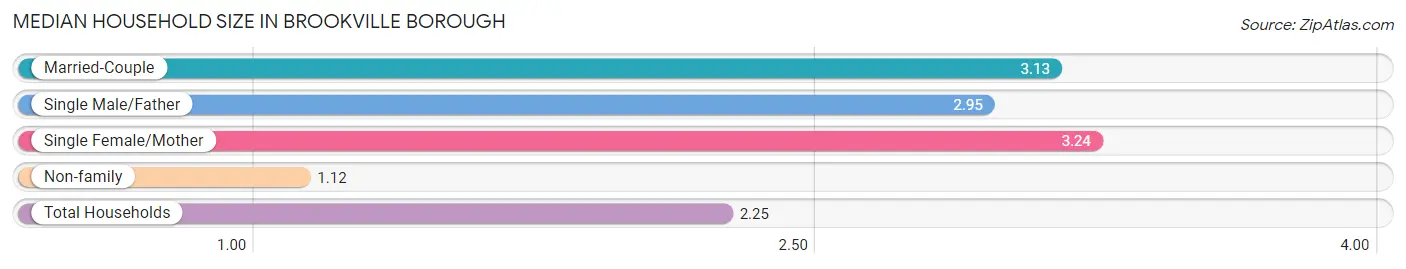
| Household Type | # Households | Household Size |
| Married-Couple | 722 (42.0%) | 3.13 |
| Single Male/Father | 75 (4.4%) | 2.95 |
| Single Female/Mother | 167 (9.7%) | 3.24 |
| Non-family | 755 (43.9%) | 1.12 |
| Total Households | 1,719 (100.0%) | 2.25 |
Household Size by Marriage Status in Brookville borough
Out of a total of 1,719 households in Brookville borough, 964 (56.1%) are family households, while 755 (43.9%) are nonfamily households. The most numerous type of family households are 2-person households, comprising 395, and the most common type of nonfamily households are 1-person households, comprising 668.
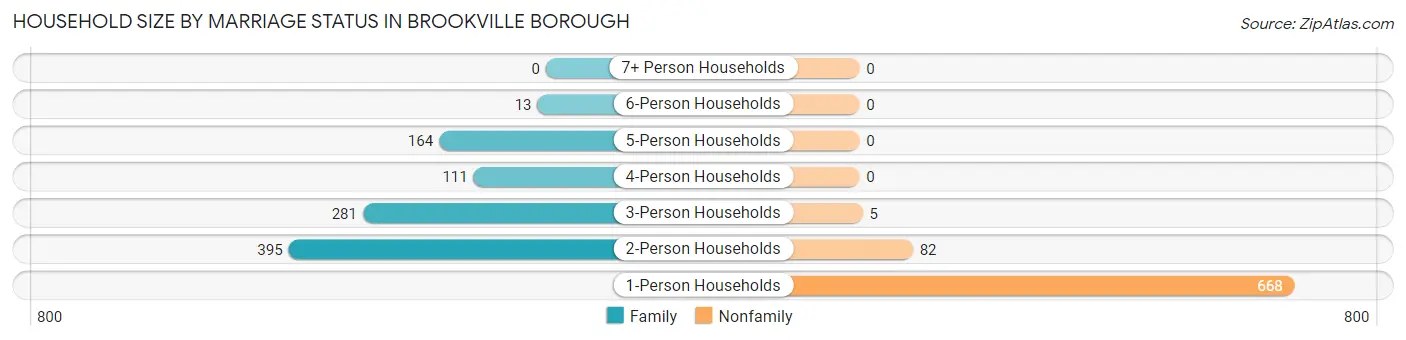
| Household Size | Family Households | Nonfamily Households |
| 1-Person Households | - | 668 (38.9%) |
| 2-Person Households | 395 (23.0%) | 82 (4.8%) |
| 3-Person Households | 281 (16.4%) | 5 (0.3%) |
| 4-Person Households | 111 (6.5%) | 0 (0.0%) |
| 5-Person Households | 164 (9.5%) | 0 (0.0%) |
| 6-Person Households | 13 (0.8%) | 0 (0.0%) |
| 7+ Person Households | 0 (0.0%) | 0 (0.0%) |
| Total | 964 (56.1%) | 755 (43.9%) |
Female Fertility in Brookville borough
Fertility by Age in Brookville borough
Average fertility rate in Brookville borough is 137.0 births per 1,000 women. Women in the age bracket of 35 to 50 years have the highest fertility rate with 197.0 births per 1,000 women. Women in the age bracket of 35 to 50 years acount for 53.1% of all women with births.
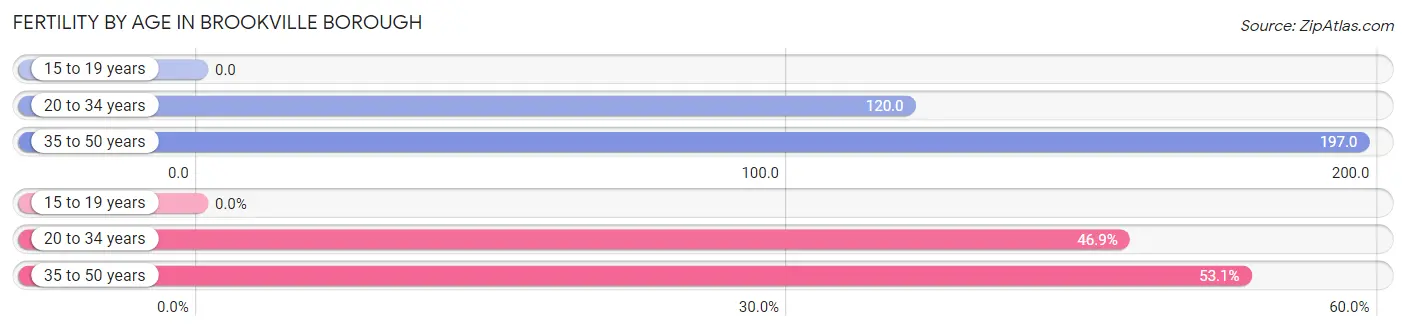
| Age Bracket | Women with Births | Births / 1,000 Women |
| 15 to 19 years | 0 (0.0%) | 0.0 |
| 20 to 34 years | 53 (46.9%) | 120.0 |
| 35 to 50 years | 60 (53.1%) | 197.0 |
| Total | 113 (100.0%) | 137.0 |
Fertility by Age by Marriage Status in Brookville borough
62.8% of women with births (113) in Brookville borough are married. The highest percentage of unmarried women with births falls into 20 to 34 years age bracket with 79.2% of them unmarried at the time of birth, while the lowest percentage of unmarried women with births belong to 35 to 50 years age bracket with 0.0% of them unmarried.
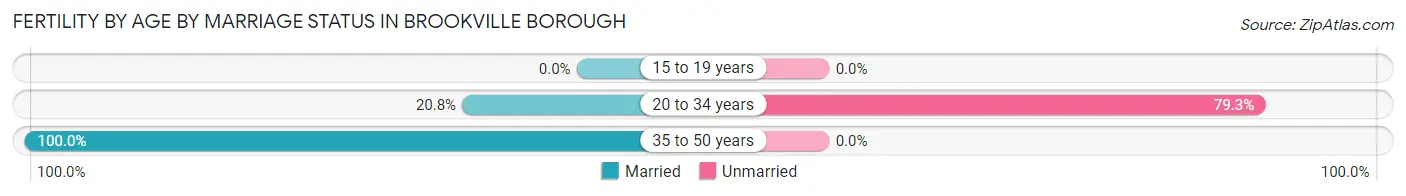
| Age Bracket | Married | Unmarried |
| 15 to 19 years | 0 (0.0%) | 0 (0.0%) |
| 20 to 34 years | 11 (20.7%) | 42 (79.2%) |
| 35 to 50 years | 60 (100.0%) | 0 (0.0%) |
| Total | 71 (62.8%) | 42 (37.2%) |
Fertility by Education in Brookville borough
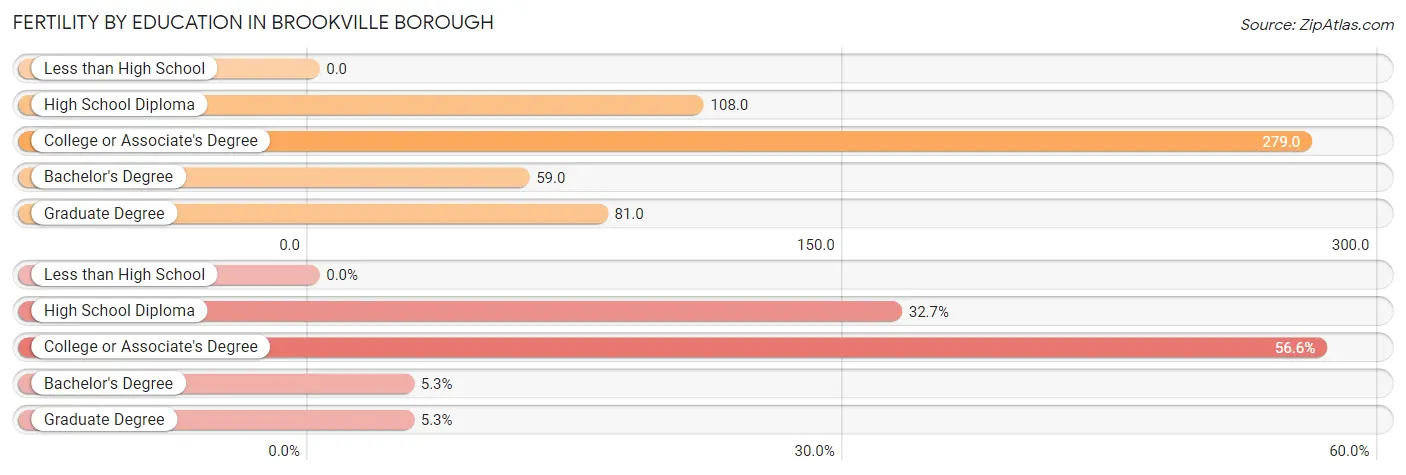
| Educational Attainment | Women with Births | Births / 1,000 Women |
| Less than High School | 0 (0.0%) | 0.0 |
| High School Diploma | 37 (32.7%) | 108.0 |
| College or Associate's Degree | 64 (56.6%) | 279.0 |
| Bachelor's Degree | 6 (5.3%) | 59.0 |
| Graduate Degree | 6 (5.3%) | 81.0 |
| Total | 113 (100.0%) | 137.0 |
Fertility by Education by Marriage Status in Brookville borough
37.2% of women with births in Brookville borough are unmarried. Women with the educational attainment of college or associate's degree are most likely to be married with 100.0% of them married at childbirth, while women with the educational attainment of bachelor's degree are least likely to be married with 100.0% of them unmarried at childbirth.
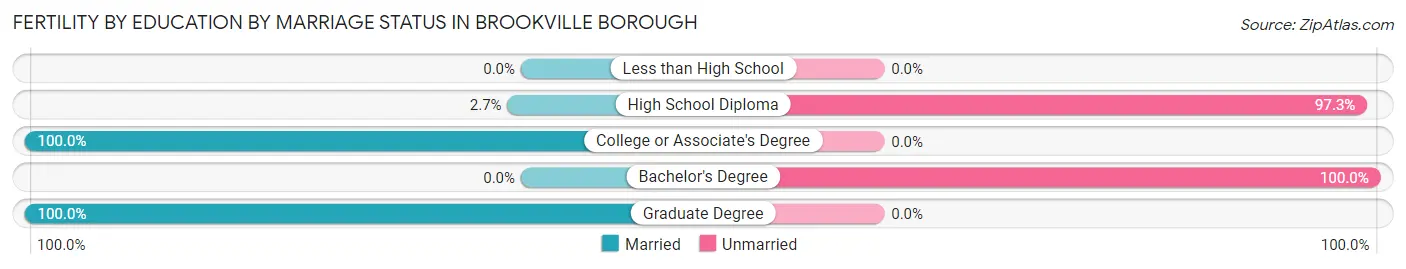
| Educational Attainment | Married | Unmarried |
| Less than High School | 0 (0.0%) | 0 (0.0%) |
| High School Diploma | 1 (2.7%) | 36 (97.3%) |
| College or Associate's Degree | 64 (100.0%) | 0 (0.0%) |
| Bachelor's Degree | 0 (0.0%) | 6 (100.0%) |
| Graduate Degree | 6 (100.0%) | 0 (0.0%) |
| Total | 71 (62.8%) | 42 (37.2%) |
Employment Characteristics in Brookville borough
Employment by Class of Employer in Brookville borough
Among the 1,857 employed individuals in Brookville borough, private company employees (1,377 | 74.2%), not-for-profit organizations (146 | 7.9%), and local government employees (92 | 5.0%) make up the most common classes of employment.
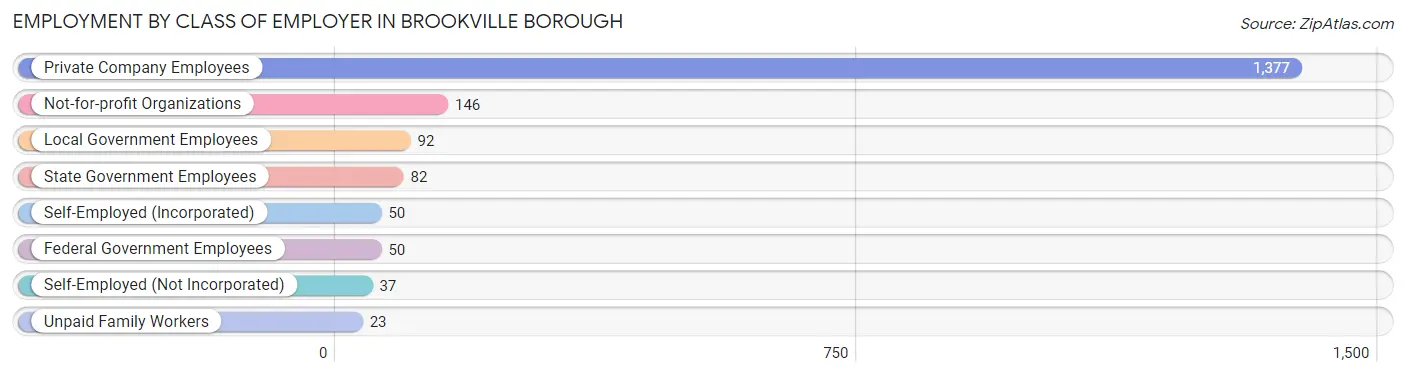
| Employer Class | # Employees | % Employees |
| Private Company Employees | 1,377 | 74.2% |
| Self-Employed (Incorporated) | 50 | 2.7% |
| Self-Employed (Not Incorporated) | 37 | 2.0% |
| Not-for-profit Organizations | 146 | 7.9% |
| Local Government Employees | 92 | 5.0% |
| State Government Employees | 82 | 4.4% |
| Federal Government Employees | 50 | 2.7% |
| Unpaid Family Workers | 23 | 1.2% |
| Total | 1,857 | 100.0% |
Employment Status by Age in Brookville borough
According to the labor force statistics for Brookville borough, out of the total population over 16 years of age (3,111), 65.5% or 2,038 individuals are in the labor force, with 8.1% or 165 of them unemployed. The age group with the highest labor force participation rate is 30 to 34 years, with 96.1% or 299 individuals in the labor force. Within the labor force, the 55 to 59 years age range has the highest percentage of unemployed individuals, with 17.0% or 38 of them being unemployed.
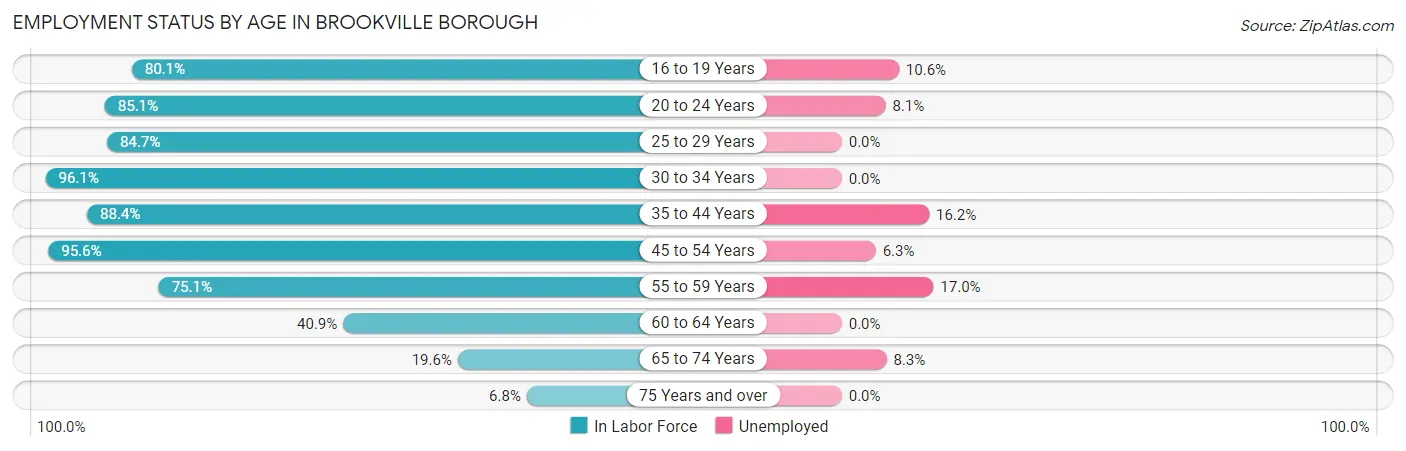
| Age Bracket | In Labor Force | Unemployed |
| 16 to 19 Years | 113 (80.1%) | 12 (10.6%) |
| 20 to 24 Years | 222 (85.1%) | 18 (8.1%) |
| 25 to 29 Years | 233 (84.7%) | 0 (0.0%) |
| 30 to 34 Years | 299 (96.1%) | 0 (0.0%) |
| 35 to 44 Years | 426 (88.4%) | 69 (16.2%) |
| 45 to 54 Years | 349 (95.6%) | 22 (6.3%) |
| 55 to 59 Years | 223 (75.1%) | 38 (17.0%) |
| 60 to 64 Years | 63 (40.9%) | 0 (0.0%) |
| 65 to 74 Years | 84 (19.6%) | 7 (8.3%) |
| 75 Years and over | 27 (6.8%) | 0 (0.0%) |
| Total | 2,038 (65.5%) | 165 (8.1%) |
Employment Status by Educational Attainment in Brookville borough
According to labor force statistics for Brookville borough, 84.6% of individuals (1,594) out of the total population between 25 and 64 years of age (1,884) are in the labor force, with 8.1% or 129 of them being unemployed. The group with the highest labor force participation rate are those with the educational attainment of college / associate degree, with 88.1% or 519 individuals in the labor force. Within the labor force, individuals with less than high school education have the highest percentage of unemployment, with 59.1% or 26 of them being unemployed.
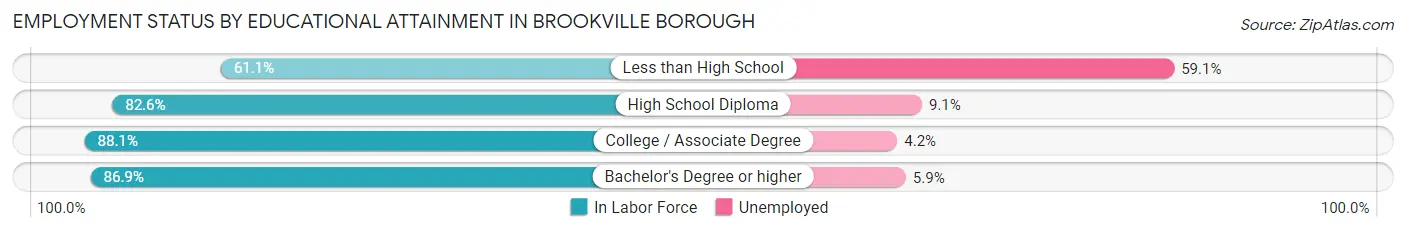
| Educational Attainment | In Labor Force | Unemployed |
| Less than High School | 44 (61.1%) | 43 (59.1%) |
| High School Diploma | 637 (82.6%) | 70 (9.1%) |
| College / Associate Degree | 519 (88.1%) | 25 (4.2%) |
| Bachelor's Degree or higher | 393 (86.9%) | 27 (5.9%) |
| Total | 1,594 (84.6%) | 153 (8.1%) |
Employment Occupations by Sex in Brookville borough
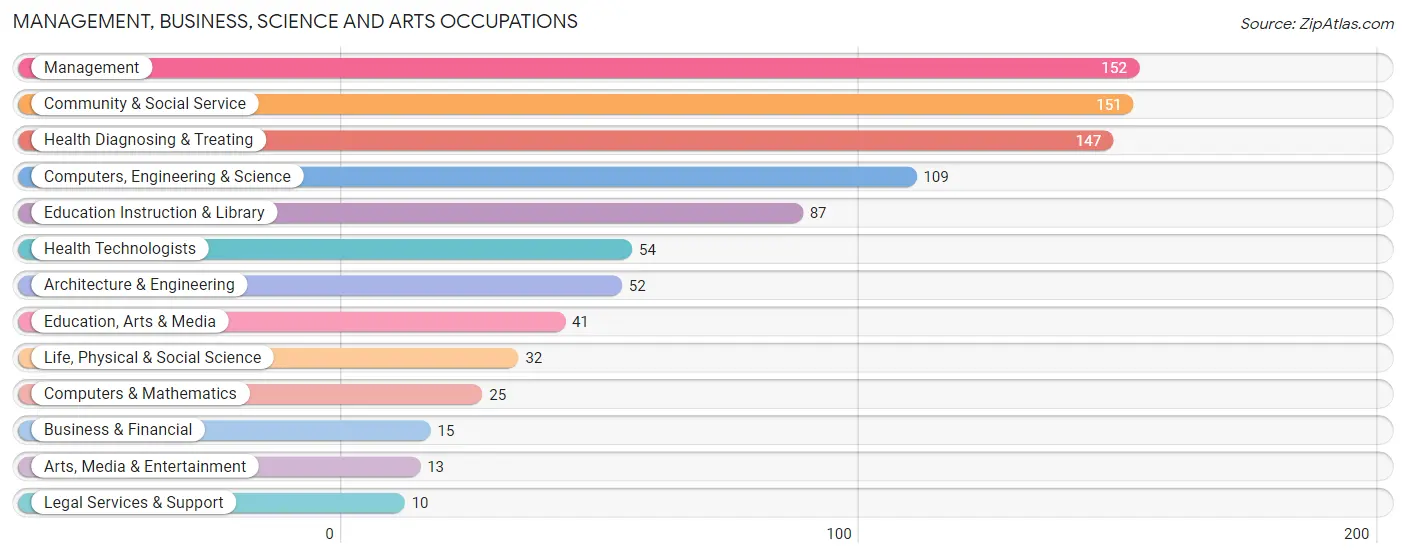
Management, Business, Science and Arts Occupations
The most common Management, Business, Science and Arts occupations in Brookville borough are Management (152 | 8.1%), Community & Social Service (151 | 8.1%), Health Diagnosing & Treating (147 | 7.9%), Computers, Engineering & Science (109 | 5.8%), and Education Instruction & Library (87 | 4.6%).
Management, Business, Science and Arts Occupations by Sex
Within the Management, Business, Science and Arts occupations in Brookville borough, the most male-oriented occupations are Computers & Mathematics (100.0%), Architecture & Engineering (100.0%), and Legal Services & Support (100.0%), while the most female-oriented occupations are Business & Financial (100.0%), Health Diagnosing & Treating (85.0%), and Education Instruction & Library (83.9%).
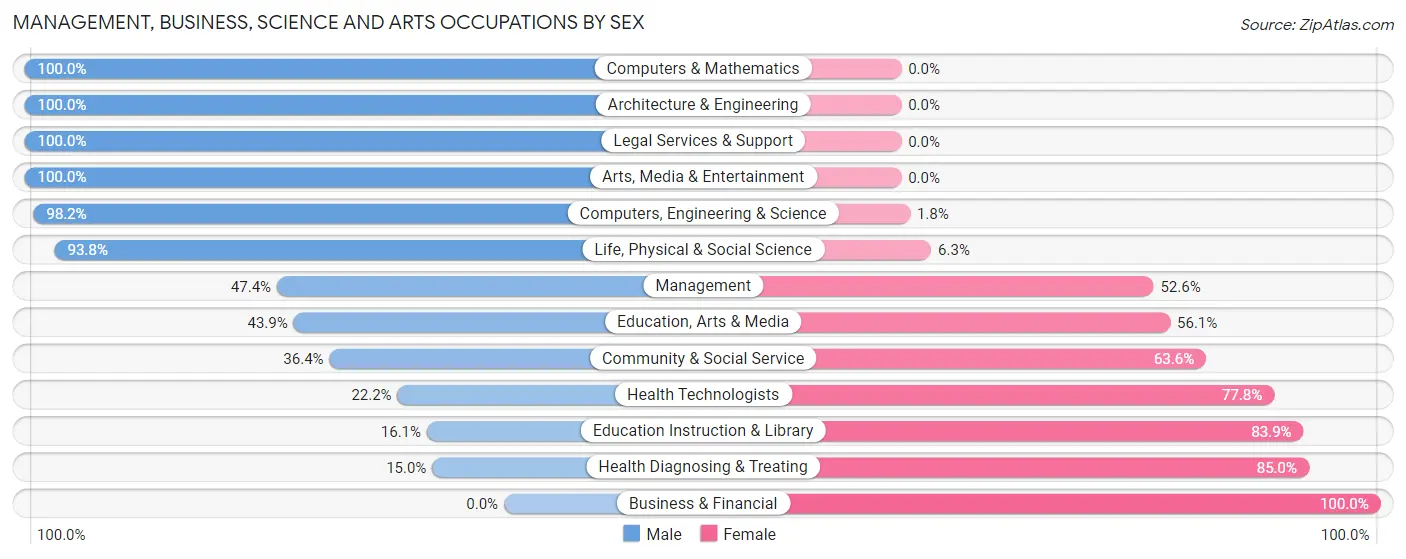
| Occupation | Male | Female |
| Management | 72 (47.4%) | 80 (52.6%) |
| Business & Financial | 0 (0.0%) | 15 (100.0%) |
| Computers, Engineering & Science | 107 (98.2%) | 2 (1.8%) |
| Computers & Mathematics | 25 (100.0%) | 0 (0.0%) |
| Architecture & Engineering | 52 (100.0%) | 0 (0.0%) |
| Life, Physical & Social Science | 30 (93.8%) | 2 (6.2%) |
| Community & Social Service | 55 (36.4%) | 96 (63.6%) |
| Education, Arts & Media | 18 (43.9%) | 23 (56.1%) |
| Legal Services & Support | 10 (100.0%) | 0 (0.0%) |
| Education Instruction & Library | 14 (16.1%) | 73 (83.9%) |
| Arts, Media & Entertainment | 13 (100.0%) | 0 (0.0%) |
| Health Diagnosing & Treating | 22 (15.0%) | 125 (85.0%) |
| Health Technologists | 12 (22.2%) | 42 (77.8%) |
| Total (Category) | 256 (44.6%) | 318 (55.4%) |
| Total (Overall) | 1,014 (54.1%) | 859 (45.9%) |
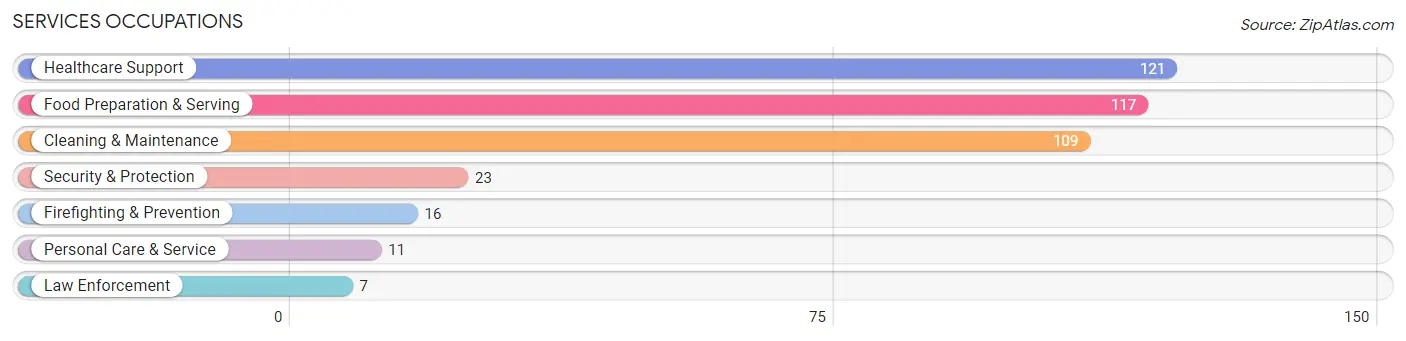
Services Occupations
The most common Services occupations in Brookville borough are Healthcare Support (121 | 6.5%), Food Preparation & Serving (117 | 6.2%), Cleaning & Maintenance (109 | 5.8%), Security & Protection (23 | 1.2%), and Firefighting & Prevention (16 | 0.9%).
Services Occupations by Sex
Within the Services occupations in Brookville borough, the most male-oriented occupations are Firefighting & Prevention (68.8%), Cleaning & Maintenance (50.5%), and Security & Protection (47.8%), while the most female-oriented occupations are Law Enforcement (100.0%), Personal Care & Service (100.0%), and Healthcare Support (83.5%).
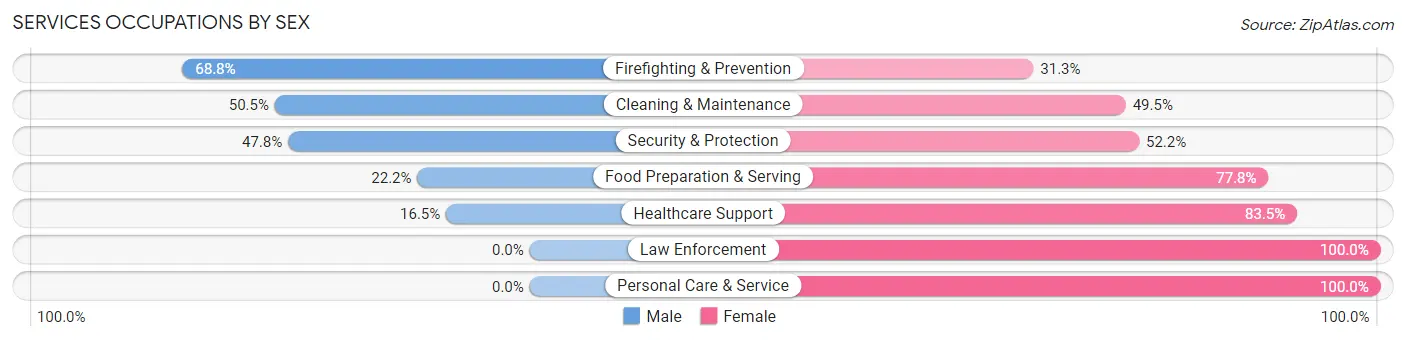
| Occupation | Male | Female |
| Healthcare Support | 20 (16.5%) | 101 (83.5%) |
| Security & Protection | 11 (47.8%) | 12 (52.2%) |
| Firefighting & Prevention | 11 (68.8%) | 5 (31.2%) |
| Law Enforcement | 0 (0.0%) | 7 (100.0%) |
| Food Preparation & Serving | 26 (22.2%) | 91 (77.8%) |
| Cleaning & Maintenance | 55 (50.5%) | 54 (49.5%) |
| Personal Care & Service | 0 (0.0%) | 11 (100.0%) |
| Total (Category) | 112 (29.4%) | 269 (70.6%) |
| Total (Overall) | 1,014 (54.1%) | 859 (45.9%) |
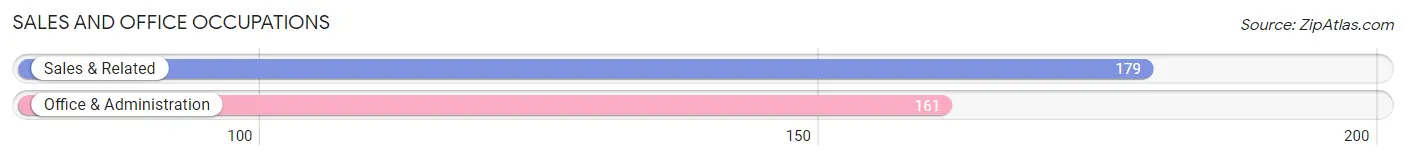
Sales and Office Occupations
The most common Sales and Office occupations in Brookville borough are Sales & Related (179 | 9.6%), and Office & Administration (161 | 8.6%).
Sales and Office Occupations by Sex
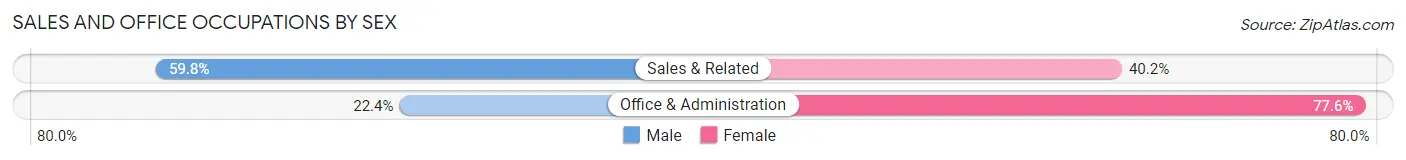
| Occupation | Male | Female |
| Sales & Related | 107 (59.8%) | 72 (40.2%) |
| Office & Administration | 36 (22.4%) | 125 (77.6%) |
| Total (Category) | 143 (42.1%) | 197 (57.9%) |
| Total (Overall) | 1,014 (54.1%) | 859 (45.9%) |
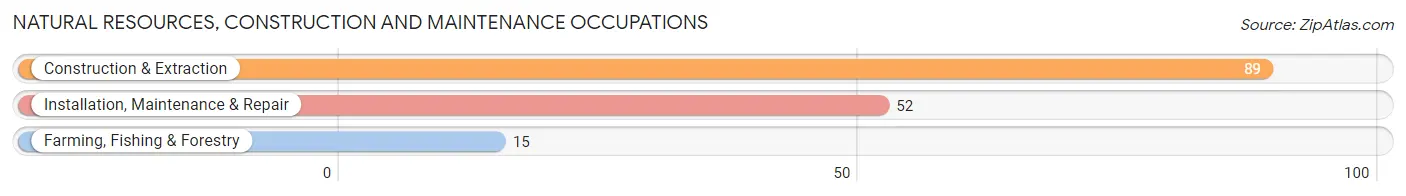
Natural Resources, Construction and Maintenance Occupations
The most common Natural Resources, Construction and Maintenance occupations in Brookville borough are Construction & Extraction (89 | 4.8%), Installation, Maintenance & Repair (52 | 2.8%), and Farming, Fishing & Forestry (15 | 0.8%).
Natural Resources, Construction and Maintenance Occupations by Sex
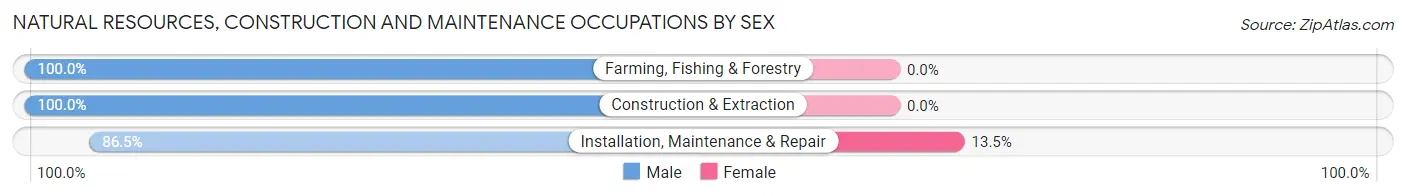
| Occupation | Male | Female |
| Farming, Fishing & Forestry | 15 (100.0%) | 0 (0.0%) |
| Construction & Extraction | 89 (100.0%) | 0 (0.0%) |
| Installation, Maintenance & Repair | 45 (86.5%) | 7 (13.5%) |
| Total (Category) | 149 (95.5%) | 7 (4.5%) |
| Total (Overall) | 1,014 (54.1%) | 859 (45.9%) |
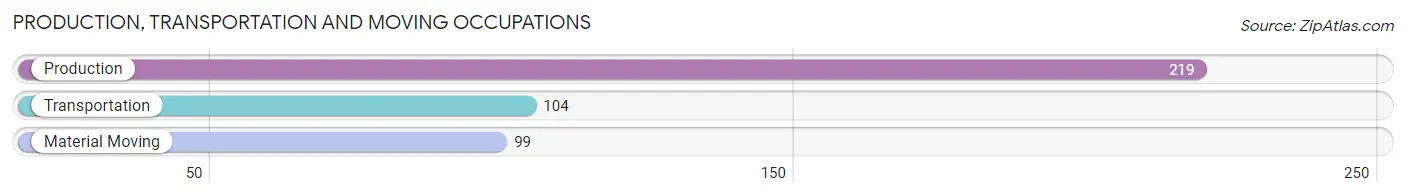
Production, Transportation and Moving Occupations
The most common Production, Transportation and Moving occupations in Brookville borough are Production (219 | 11.7%), Transportation (104 | 5.6%), and Material Moving (99 | 5.3%).
Production, Transportation and Moving Occupations by Sex
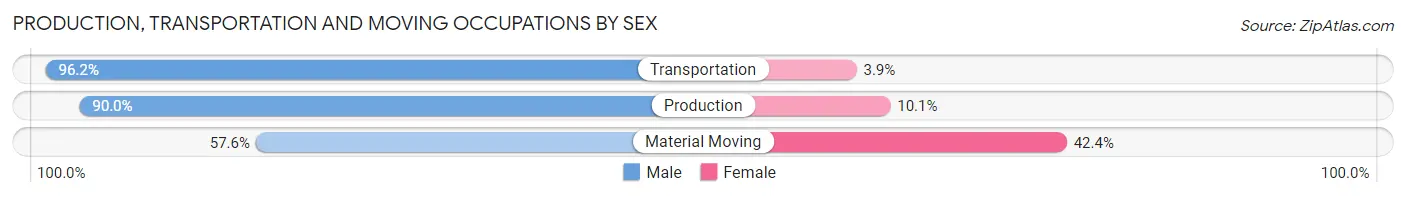
| Occupation | Male | Female |
| Production | 197 (89.9%) | 22 (10.1%) |
| Transportation | 100 (96.2%) | 4 (3.8%) |
| Material Moving | 57 (57.6%) | 42 (42.4%) |
| Total (Category) | 354 (83.9%) | 68 (16.1%) |
| Total (Overall) | 1,014 (54.1%) | 859 (45.9%) |
Employment Industries by Sex in Brookville borough
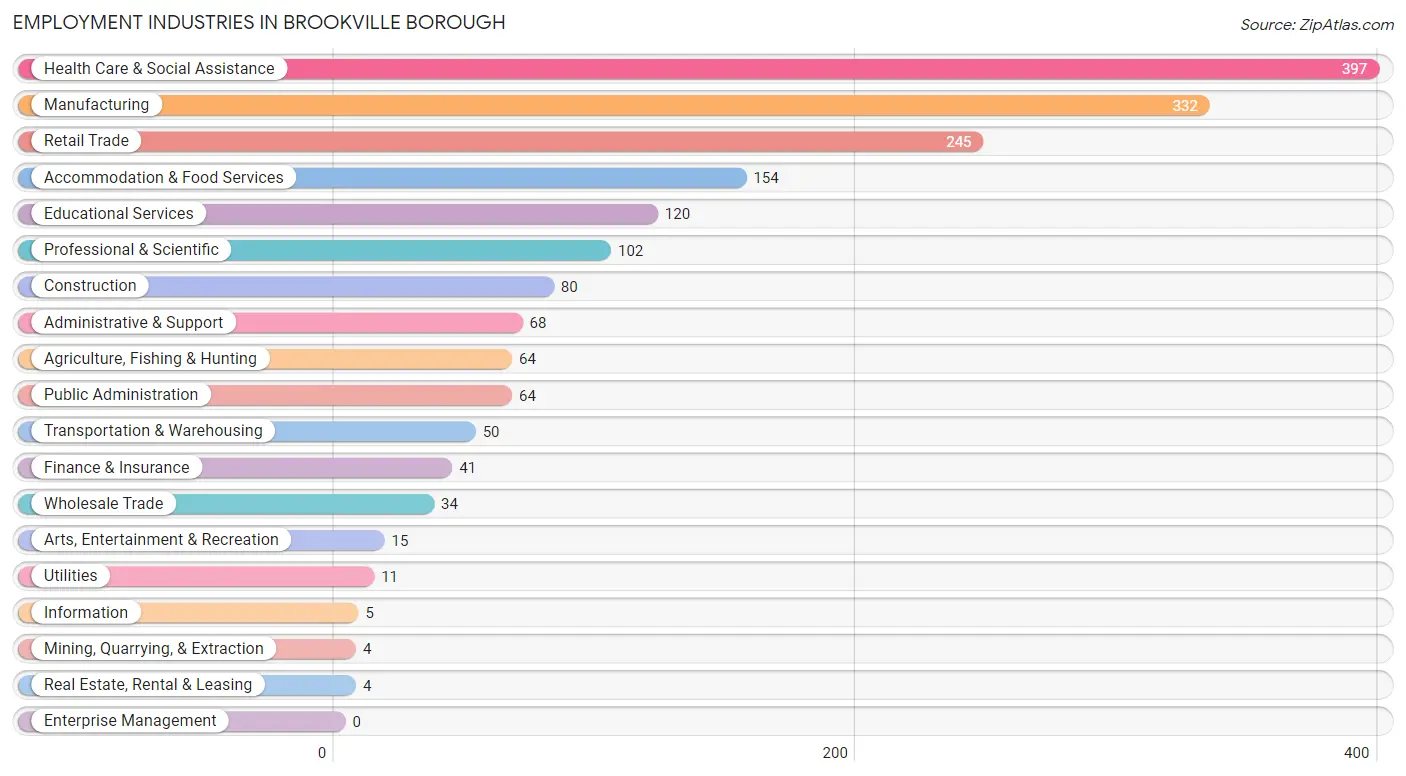
Employment Industries in Brookville borough
The major employment industries in Brookville borough include Health Care & Social Assistance (397 | 21.2%), Manufacturing (332 | 17.7%), Retail Trade (245 | 13.1%), Accommodation & Food Services (154 | 8.2%), and Educational Services (120 | 6.4%).
Employment Industries by Sex in Brookville borough
The Brookville borough industries that see more men than women are Mining, Quarrying, & Extraction (100.0%), Construction (100.0%), and Utilities (100.0%), whereas the industries that tend to have a higher number of women are Information (100.0%), Real Estate, Rental & Leasing (100.0%), and Health Care & Social Assistance (86.2%).
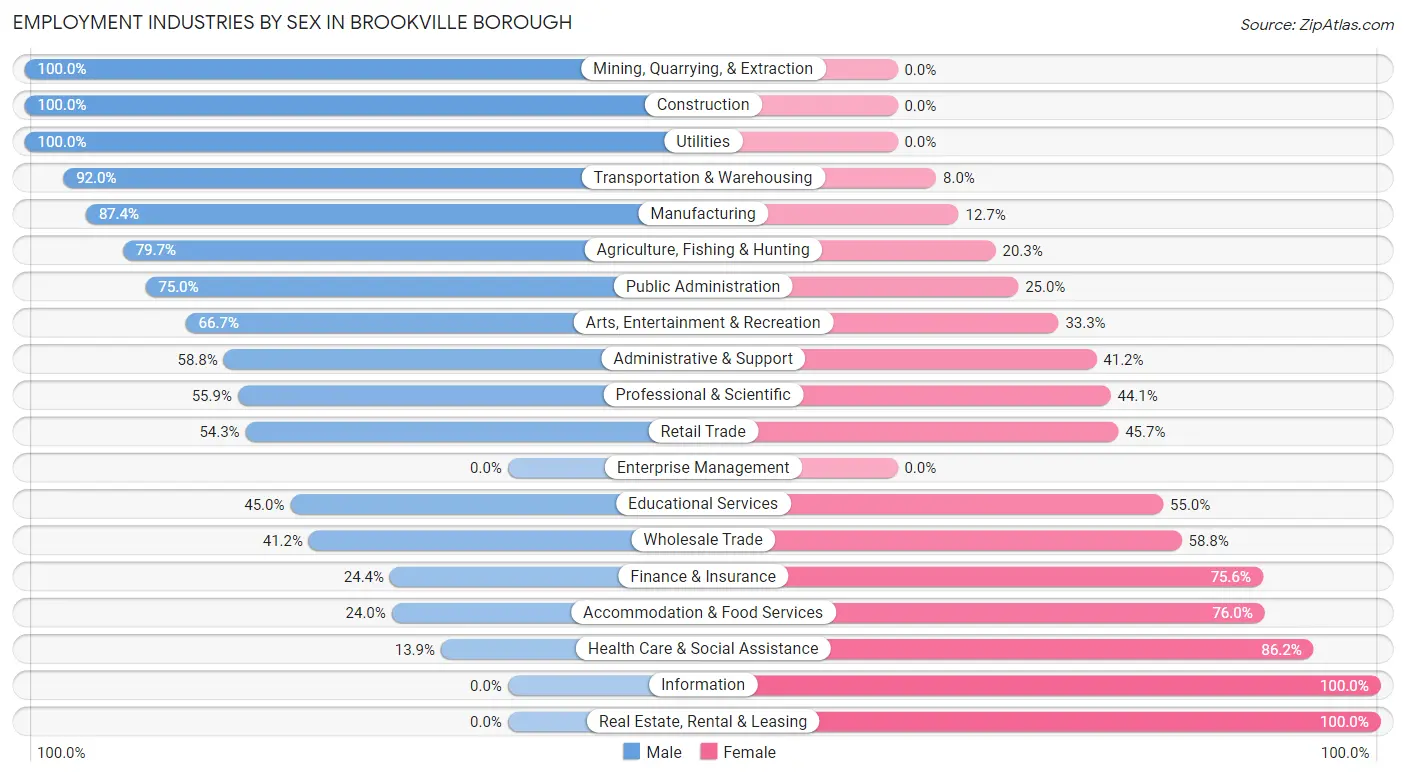
| Industry | Male | Female |
| Agriculture, Fishing & Hunting | 51 (79.7%) | 13 (20.3%) |
| Mining, Quarrying, & Extraction | 4 (100.0%) | 0 (0.0%) |
| Construction | 80 (100.0%) | 0 (0.0%) |
| Manufacturing | 290 (87.4%) | 42 (12.7%) |
| Wholesale Trade | 14 (41.2%) | 20 (58.8%) |
| Retail Trade | 133 (54.3%) | 112 (45.7%) |
| Transportation & Warehousing | 46 (92.0%) | 4 (8.0%) |
| Utilities | 11 (100.0%) | 0 (0.0%) |
| Information | 0 (0.0%) | 5 (100.0%) |
| Finance & Insurance | 10 (24.4%) | 31 (75.6%) |
| Real Estate, Rental & Leasing | 0 (0.0%) | 4 (100.0%) |
| Professional & Scientific | 57 (55.9%) | 45 (44.1%) |
| Enterprise Management | 0 (0.0%) | 0 (0.0%) |
| Administrative & Support | 40 (58.8%) | 28 (41.2%) |
| Educational Services | 54 (45.0%) | 66 (55.0%) |
| Health Care & Social Assistance | 55 (13.9%) | 342 (86.2%) |
| Arts, Entertainment & Recreation | 10 (66.7%) | 5 (33.3%) |
| Accommodation & Food Services | 37 (24.0%) | 117 (76.0%) |
| Public Administration | 48 (75.0%) | 16 (25.0%) |
| Total | 1,014 (54.1%) | 859 (45.9%) |
Education in Brookville borough
School Enrollment in Brookville borough
The most common levels of schooling among the 770 students in Brookville borough are elementary school (256 | 33.3%), middle school (148 | 19.2%), and high school (135 | 17.5%).
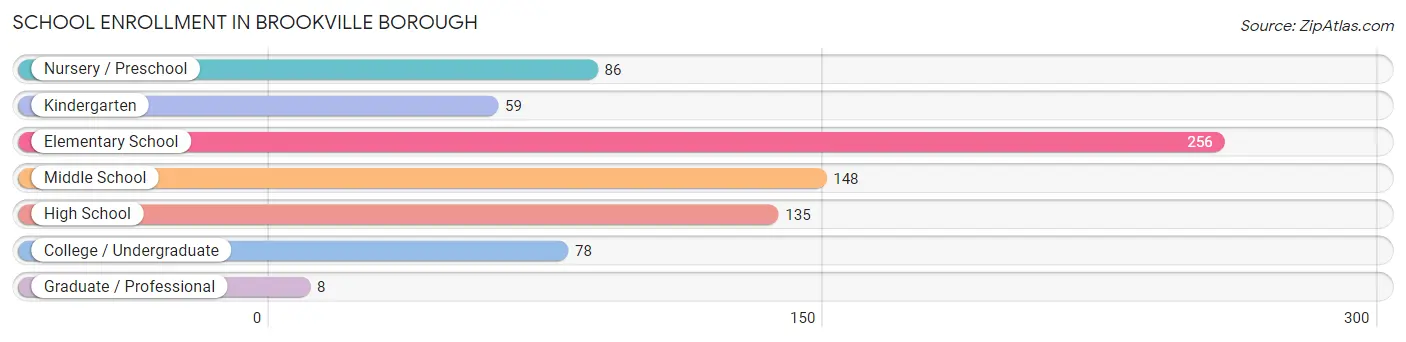
| School Level | # Students | % Students |
| Nursery / Preschool | 86 | 11.2% |
| Kindergarten | 59 | 7.7% |
| Elementary School | 256 | 33.3% |
| Middle School | 148 | 19.2% |
| High School | 135 | 17.5% |
| College / Undergraduate | 78 | 10.1% |
| Graduate / Professional | 8 | 1.0% |
| Total | 770 | 100.0% |
School Enrollment by Age by Funding Source in Brookville borough
Out of a total of 770 students who are enrolled in schools in Brookville borough, 100 (13.0%) attend a private institution, while the remaining 670 (87.0%) are enrolled in public schools. The age group of 35 years and over has the highest likelihood of being enrolled in private schools, with 6 (21.4% in the age bracket) enrolled. Conversely, the age group of 15 to 17 year olds has the lowest likelihood of being enrolled in a private school, with 104 (100.0% in the age bracket) attending a public institution.
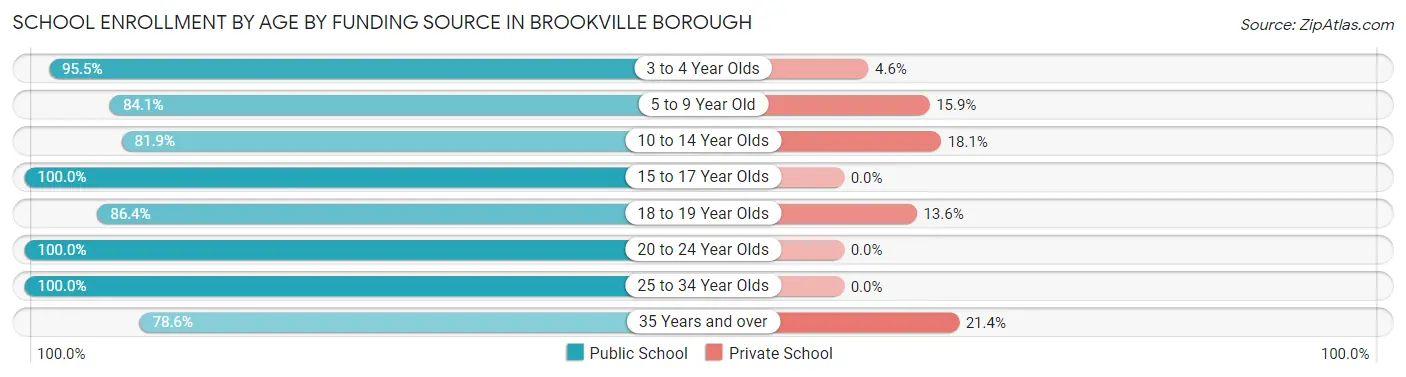
| Age Bracket | Public School | Private School |
| 3 to 4 Year Olds | 42 (95.5%) | 2 (4.5%) |
| 5 to 9 Year Old | 285 (84.1%) | 54 (15.9%) |
| 10 to 14 Year Olds | 136 (81.9%) | 30 (18.1%) |
| 15 to 17 Year Olds | 104 (100.0%) | 0 (0.0%) |
| 18 to 19 Year Olds | 51 (86.4%) | 8 (13.6%) |
| 20 to 24 Year Olds | 9 (100.0%) | 0 (0.0%) |
| 25 to 34 Year Olds | 21 (100.0%) | 0 (0.0%) |
| 35 Years and over | 22 (78.6%) | 6 (21.4%) |
| Total | 670 (87.0%) | 100 (13.0%) |
Educational Attainment by Field of Study in Brookville borough
Education (268 | 31.3%), science & technology (157 | 18.3%), psychology (94 | 11.0%), arts & humanities (56 | 6.5%), and business (49 | 5.7%) are the most common fields of study among 857 individuals in Brookville borough who have obtained a bachelor's degree or higher.
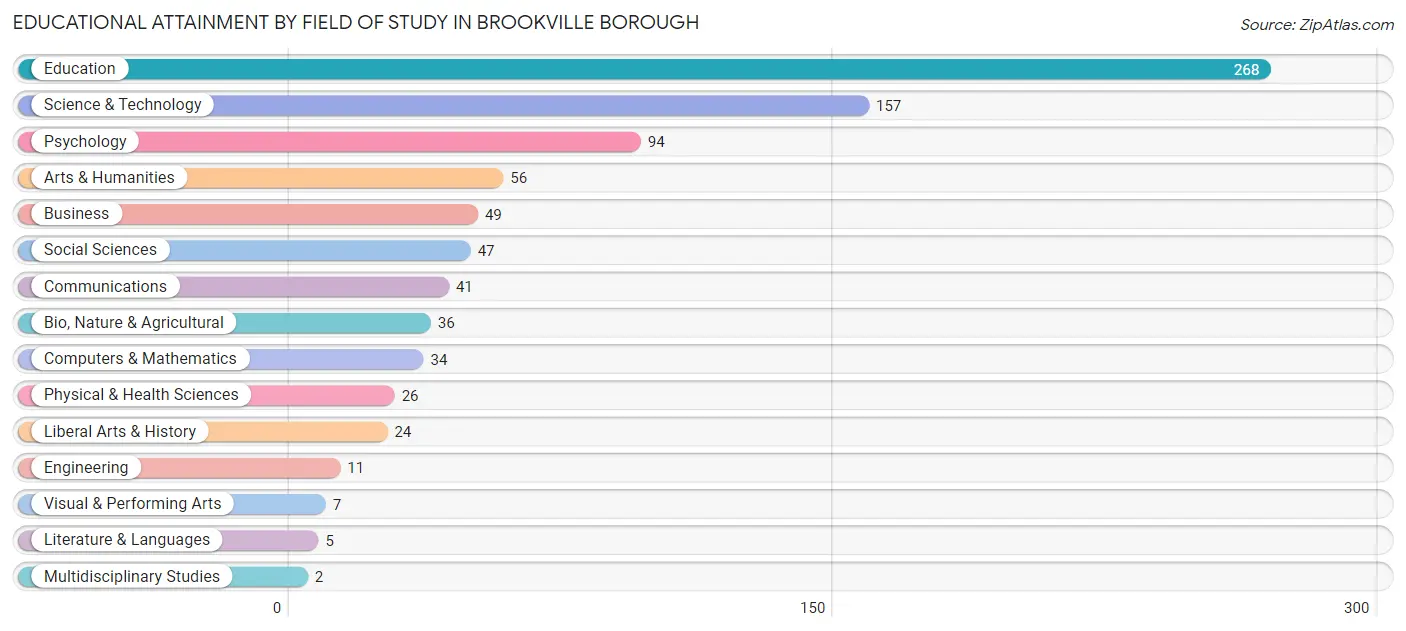
| Field of Study | # Graduates | % Graduates |
| Computers & Mathematics | 34 | 4.0% |
| Bio, Nature & Agricultural | 36 | 4.2% |
| Physical & Health Sciences | 26 | 3.0% |
| Psychology | 94 | 11.0% |
| Social Sciences | 47 | 5.5% |
| Engineering | 11 | 1.3% |
| Multidisciplinary Studies | 2 | 0.2% |
| Science & Technology | 157 | 18.3% |
| Business | 49 | 5.7% |
| Education | 268 | 31.3% |
| Literature & Languages | 5 | 0.6% |
| Liberal Arts & History | 24 | 2.8% |
| Visual & Performing Arts | 7 | 0.8% |
| Communications | 41 | 4.8% |
| Arts & Humanities | 56 | 6.5% |
| Total | 857 | 100.0% |
Transportation & Commute in Brookville borough
Vehicle Availability by Sex in Brookville borough
The most prevalent vehicle ownership categories in Brookville borough are males with 3 vehicles (309, accounting for 30.7%) and females with 3 vehicles (179, making up 36.3%).
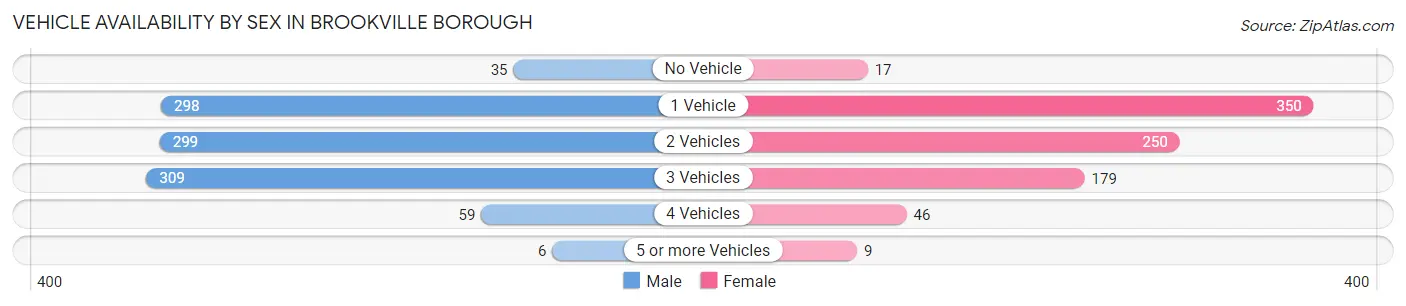
| Vehicles Available | Male | Female |
| No Vehicle | 35 (3.5%) | 17 (2.0%) |
| 1 Vehicle | 298 (29.6%) | 350 (41.1%) |
| 2 Vehicles | 299 (29.7%) | 250 (29.4%) |
| 3 Vehicles | 309 (30.7%) | 179 (21.0%) |
| 4 Vehicles | 59 (5.9%) | 46 (5.4%) |
| 5 or more Vehicles | 6 (0.6%) | 9 (1.1%) |
| Total | 1,006 (100.0%) | 851 (100.0%) |
Commute Time in Brookville borough
The most frequently occuring commute durations in Brookville borough are 5 to 9 minutes (538 commuters, 30.6%), 10 to 14 minutes (355 commuters, 20.2%), and less than 5 minutes (223 commuters, 12.7%).
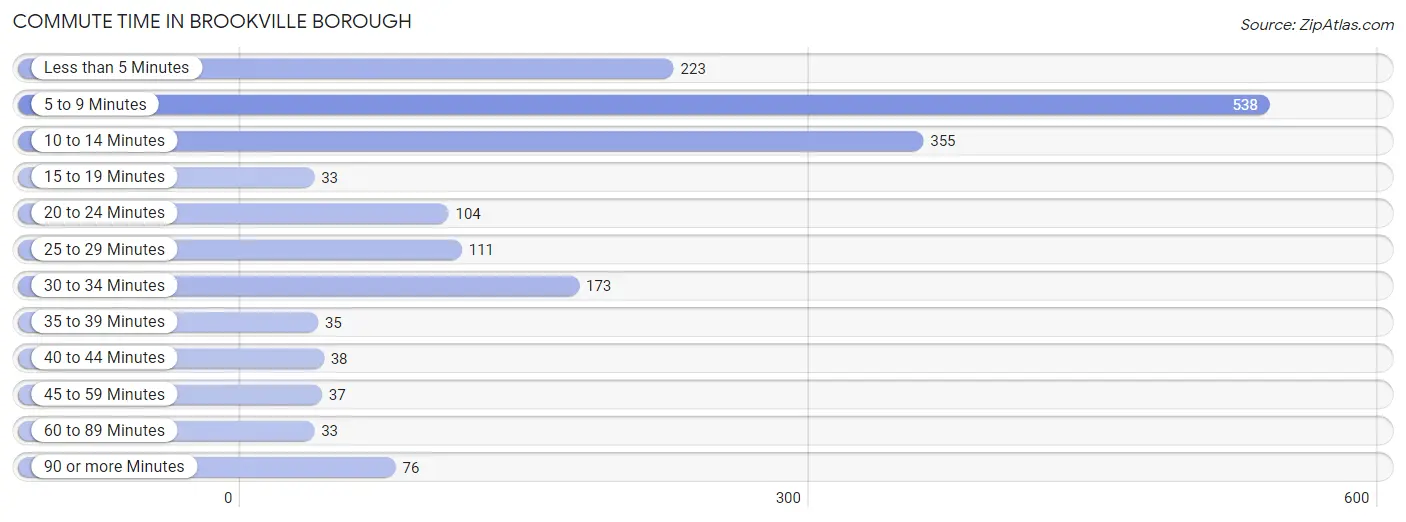
| Commute Time | # Commuters | % Commuters |
| Less than 5 Minutes | 223 | 12.7% |
| 5 to 9 Minutes | 538 | 30.6% |
| 10 to 14 Minutes | 355 | 20.2% |
| 15 to 19 Minutes | 33 | 1.9% |
| 20 to 24 Minutes | 104 | 5.9% |
| 25 to 29 Minutes | 111 | 6.3% |
| 30 to 34 Minutes | 173 | 9.9% |
| 35 to 39 Minutes | 35 | 2.0% |
| 40 to 44 Minutes | 38 | 2.2% |
| 45 to 59 Minutes | 37 | 2.1% |
| 60 to 89 Minutes | 33 | 1.9% |
| 90 or more Minutes | 76 | 4.3% |
Commute Time by Sex in Brookville borough
The most common commute times in Brookville borough are 5 to 9 minutes (276 commuters, 28.4%) for males and 5 to 9 minutes (262 commuters, 33.4%) for females.
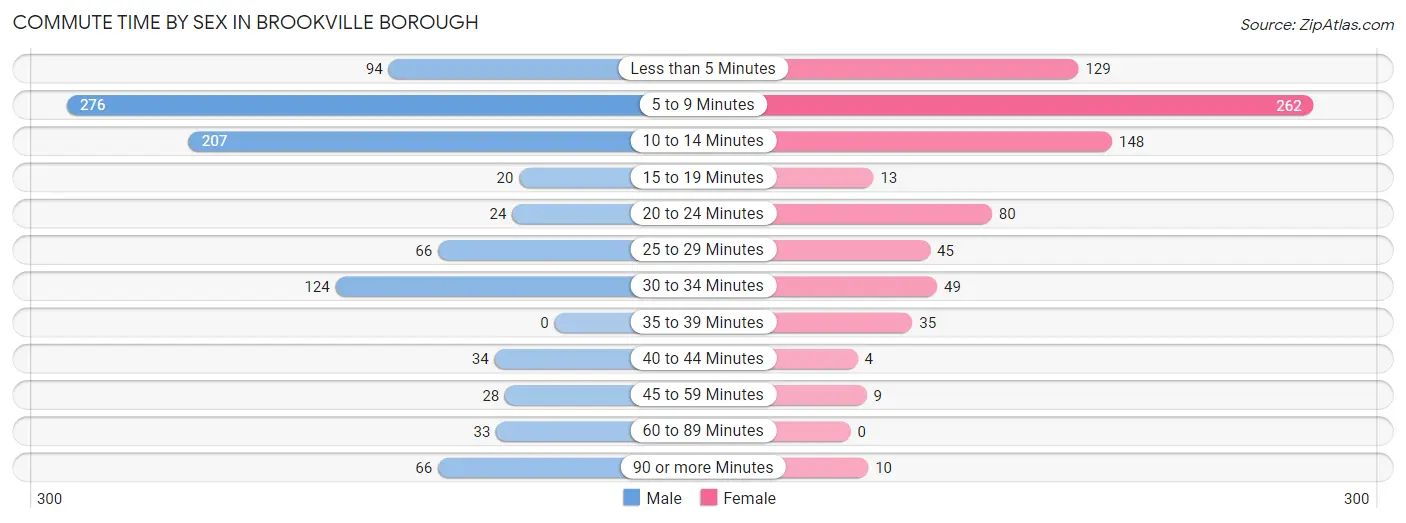
| Commute Time | Male | Female |
| Less than 5 Minutes | 94 (9.7%) | 129 (16.5%) |
| 5 to 9 Minutes | 276 (28.4%) | 262 (33.4%) |
| 10 to 14 Minutes | 207 (21.3%) | 148 (18.9%) |
| 15 to 19 Minutes | 20 (2.1%) | 13 (1.7%) |
| 20 to 24 Minutes | 24 (2.5%) | 80 (10.2%) |
| 25 to 29 Minutes | 66 (6.8%) | 45 (5.7%) |
| 30 to 34 Minutes | 124 (12.8%) | 49 (6.2%) |
| 35 to 39 Minutes | 0 (0.0%) | 35 (4.5%) |
| 40 to 44 Minutes | 34 (3.5%) | 4 (0.5%) |
| 45 to 59 Minutes | 28 (2.9%) | 9 (1.1%) |
| 60 to 89 Minutes | 33 (3.4%) | 0 (0.0%) |
| 90 or more Minutes | 66 (6.8%) | 10 (1.3%) |
Time of Departure to Work by Sex in Brookville borough
The most frequent times of departure to work in Brookville borough are 7:30 AM to 7:59 AM (167, 17.2%) for males and 7:30 AM to 7:59 AM (124, 15.8%) for females.
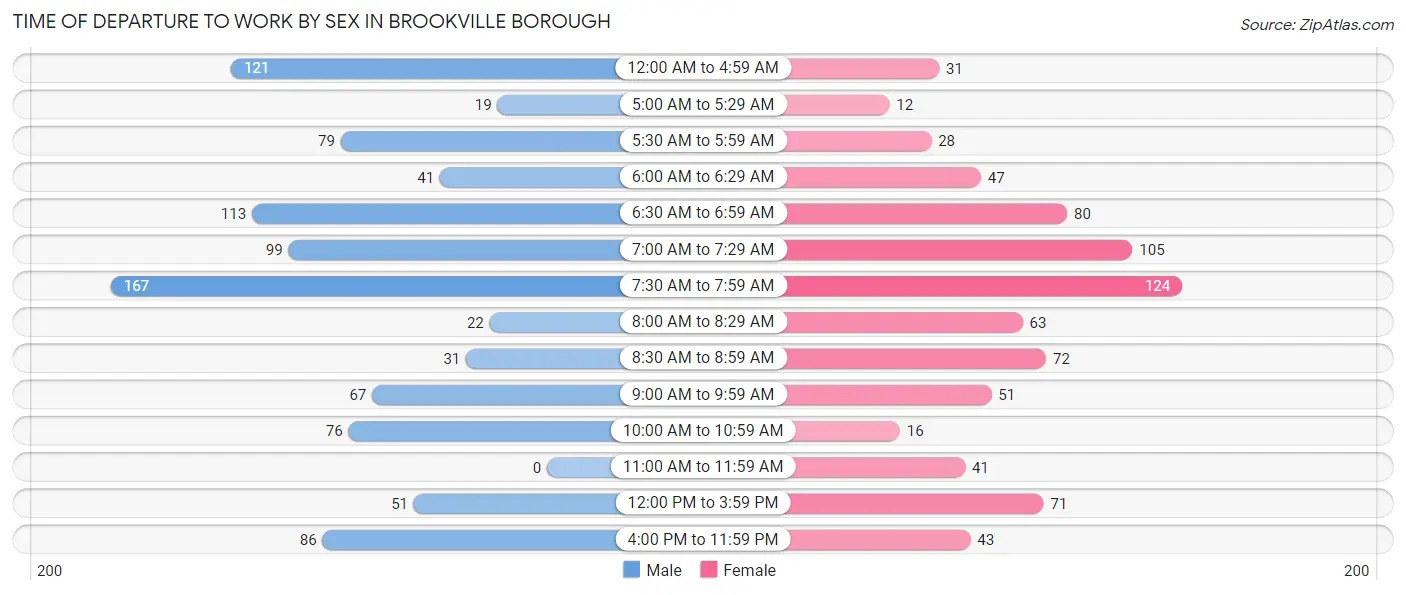
| Time of Departure | Male | Female |
| 12:00 AM to 4:59 AM | 121 (12.4%) | 31 (4.0%) |
| 5:00 AM to 5:29 AM | 19 (1.9%) | 12 (1.5%) |
| 5:30 AM to 5:59 AM | 79 (8.1%) | 28 (3.6%) |
| 6:00 AM to 6:29 AM | 41 (4.2%) | 47 (6.0%) |
| 6:30 AM to 6:59 AM | 113 (11.6%) | 80 (10.2%) |
| 7:00 AM to 7:29 AM | 99 (10.2%) | 105 (13.4%) |
| 7:30 AM to 7:59 AM | 167 (17.2%) | 124 (15.8%) |
| 8:00 AM to 8:29 AM | 22 (2.3%) | 63 (8.0%) |
| 8:30 AM to 8:59 AM | 31 (3.2%) | 72 (9.2%) |
| 9:00 AM to 9:59 AM | 67 (6.9%) | 51 (6.5%) |
| 10:00 AM to 10:59 AM | 76 (7.8%) | 16 (2.0%) |
| 11:00 AM to 11:59 AM | 0 (0.0%) | 41 (5.2%) |
| 12:00 PM to 3:59 PM | 51 (5.2%) | 71 (9.1%) |
| 4:00 PM to 11:59 PM | 86 (8.8%) | 43 (5.5%) |
| Total | 972 (100.0%) | 784 (100.0%) |
Housing Occupancy in Brookville borough
Occupancy by Ownership in Brookville borough
Of the total 1,719 dwellings in Brookville borough, owner-occupied units account for 991 (57.7%), while renter-occupied units make up 728 (42.3%).
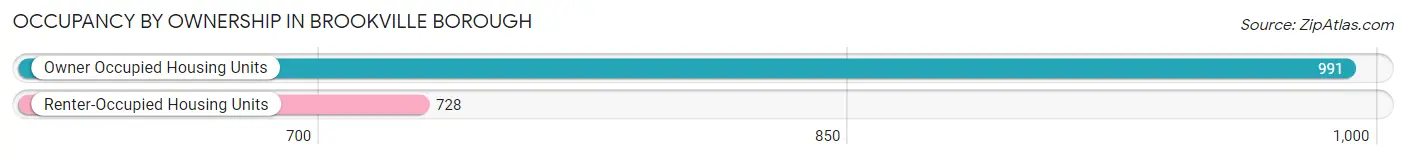
| Occupancy | # Housing Units | % Housing Units |
| Owner Occupied Housing Units | 991 | 57.7% |
| Renter-Occupied Housing Units | 728 | 42.3% |
| Total Occupied Housing Units | 1,719 | 100.0% |
Occupancy by Household Size in Brookville borough
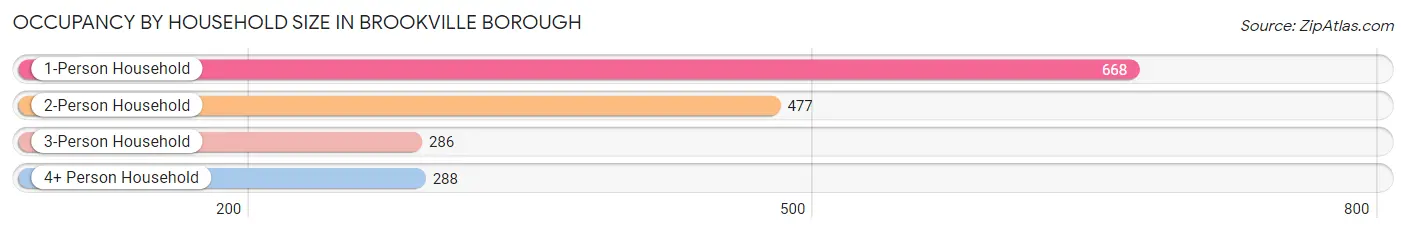
| Household Size | # Housing Units | % Housing Units |
| 1-Person Household | 668 | 38.9% |
| 2-Person Household | 477 | 27.8% |
| 3-Person Household | 286 | 16.6% |
| 4+ Person Household | 288 | 16.8% |
| Total Housing Units | 1,719 | 100.0% |
Occupancy by Ownership by Household Size in Brookville borough
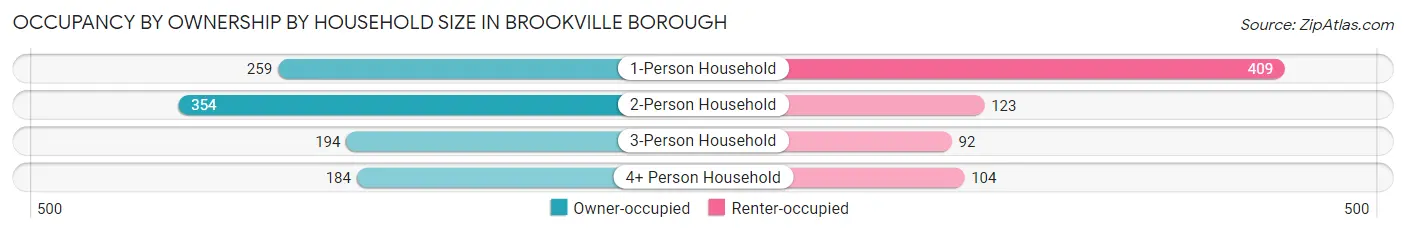
| Household Size | Owner-occupied | Renter-occupied |
| 1-Person Household | 259 (38.8%) | 409 (61.2%) |
| 2-Person Household | 354 (74.2%) | 123 (25.8%) |
| 3-Person Household | 194 (67.8%) | 92 (32.2%) |
| 4+ Person Household | 184 (63.9%) | 104 (36.1%) |
| Total Housing Units | 991 (57.7%) | 728 (42.3%) |
Occupancy by Educational Attainment in Brookville borough
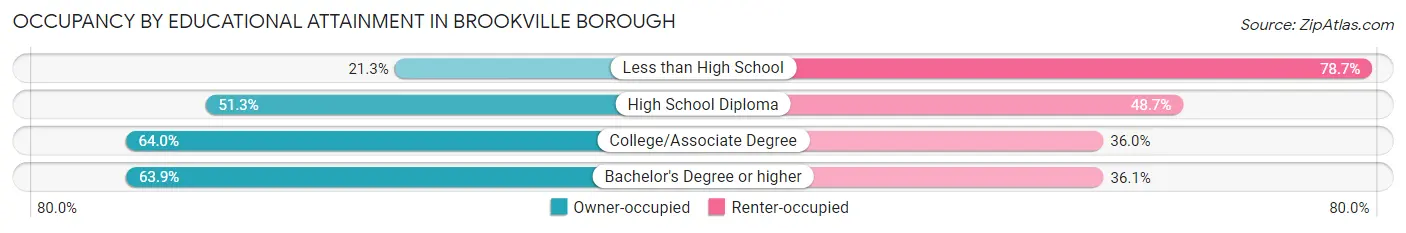
| Household Size | Owner-occupied | Renter-occupied |
| Less than High School | 16 (21.3%) | 59 (78.7%) |
| High School Diploma | 310 (51.3%) | 294 (48.7%) |
| College/Associate Degree | 293 (64.0%) | 165 (36.0%) |
| Bachelor's Degree or higher | 372 (63.9%) | 210 (36.1%) |
Occupancy by Age of Householder in Brookville borough
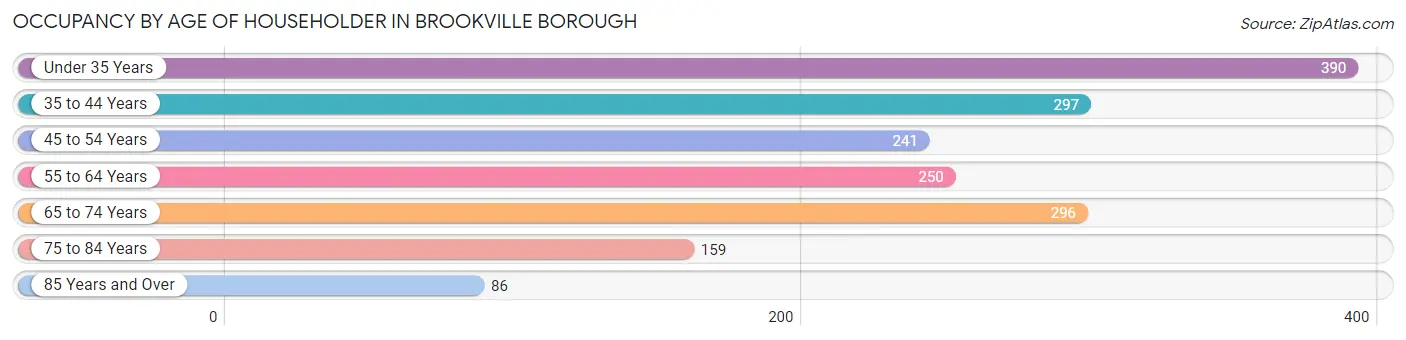
| Age Bracket | # Households | % Households |
| Under 35 Years | 390 | 22.7% |
| 35 to 44 Years | 297 | 17.3% |
| 45 to 54 Years | 241 | 14.0% |
| 55 to 64 Years | 250 | 14.5% |
| 65 to 74 Years | 296 | 17.2% |
| 75 to 84 Years | 159 | 9.2% |
| 85 Years and Over | 86 | 5.0% |
| Total | 1,719 | 100.0% |
Housing Finances in Brookville borough
Median Income by Occupancy in Brookville borough
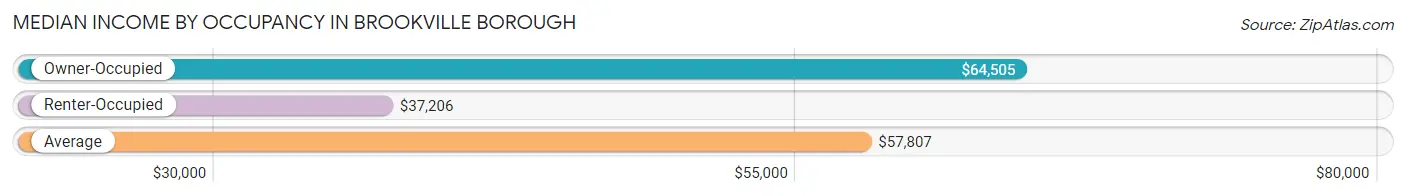
| Occupancy Type | # Households | Median Income |
| Owner-Occupied | 991 (57.7%) | $64,505 |
| Renter-Occupied | 728 (42.3%) | $37,206 |
| Average | 1,719 (100.0%) | $57,807 |
Occupancy by Householder Income Bracket in Brookville borough
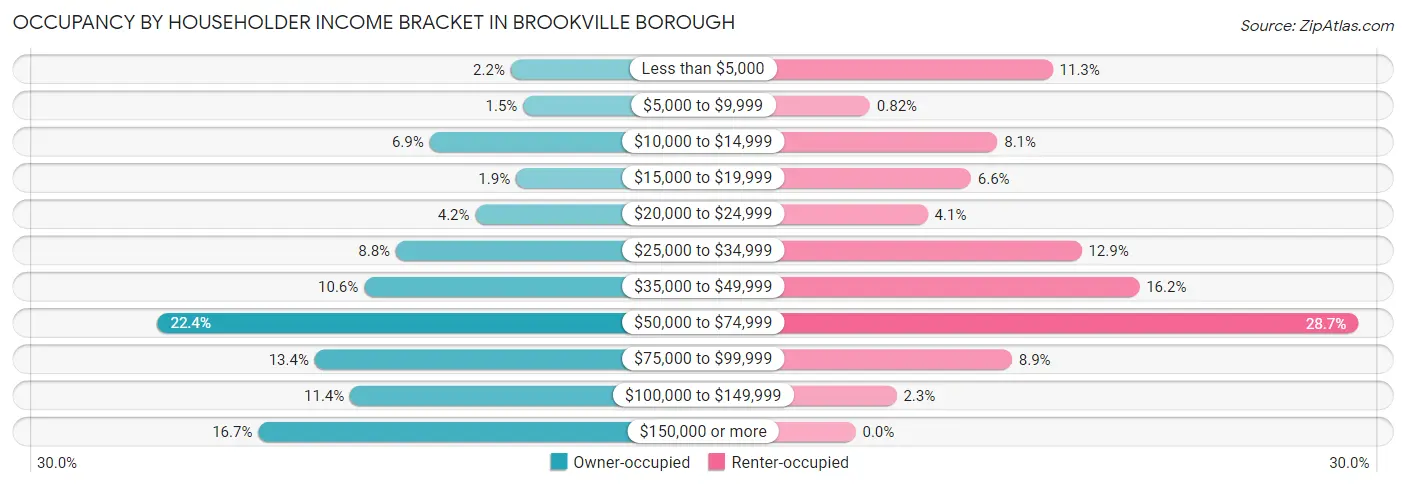
| Income Bracket | Owner-occupied | Renter-occupied |
| Less than $5,000 | 22 (2.2%) | 82 (11.3%) |
| $5,000 to $9,999 | 15 (1.5%) | 6 (0.8%) |
| $10,000 to $14,999 | 68 (6.9%) | 59 (8.1%) |
| $15,000 to $19,999 | 19 (1.9%) | 48 (6.6%) |
| $20,000 to $24,999 | 42 (4.2%) | 30 (4.1%) |
| $25,000 to $34,999 | 87 (8.8%) | 94 (12.9%) |
| $35,000 to $49,999 | 105 (10.6%) | 118 (16.2%) |
| $50,000 to $74,999 | 222 (22.4%) | 209 (28.7%) |
| $75,000 to $99,999 | 133 (13.4%) | 65 (8.9%) |
| $100,000 to $149,999 | 113 (11.4%) | 17 (2.3%) |
| $150,000 or more | 165 (16.7%) | 0 (0.0%) |
| Total | 991 (100.0%) | 728 (100.0%) |
Monthly Housing Cost Tiers in Brookville borough
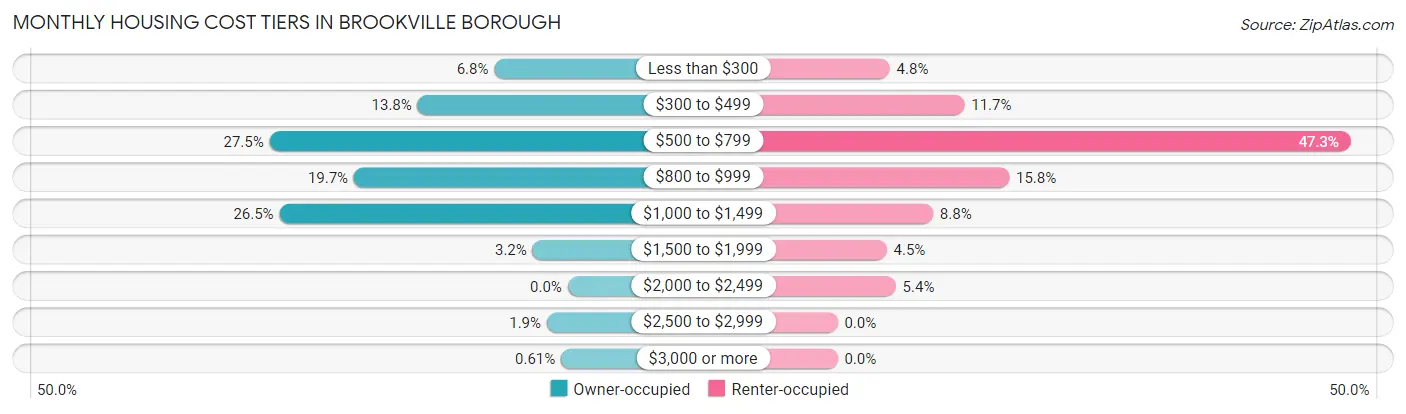
| Monthly Cost | Owner-occupied | Renter-occupied |
| Less than $300 | 67 (6.8%) | 35 (4.8%) |
| $300 to $499 | 137 (13.8%) | 85 (11.7%) |
| $500 to $799 | 272 (27.5%) | 344 (47.2%) |
| $800 to $999 | 195 (19.7%) | 115 (15.8%) |
| $1,000 to $1,499 | 263 (26.5%) | 64 (8.8%) |
| $1,500 to $1,999 | 32 (3.2%) | 33 (4.5%) |
| $2,000 to $2,499 | 0 (0.0%) | 39 (5.4%) |
| $2,500 to $2,999 | 19 (1.9%) | 0 (0.0%) |
| $3,000 or more | 6 (0.6%) | 0 (0.0%) |
| Total | 991 (100.0%) | 728 (100.0%) |
Physical Housing Characteristics in Brookville borough
Housing Structures in Brookville borough
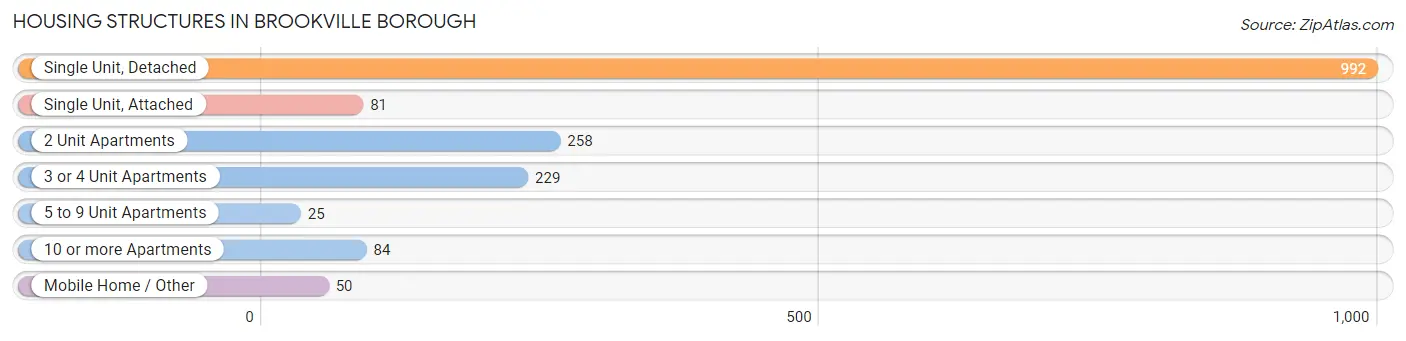
| Structure Type | # Housing Units | % Housing Units |
| Single Unit, Detached | 992 | 57.7% |
| Single Unit, Attached | 81 | 4.7% |
| 2 Unit Apartments | 258 | 15.0% |
| 3 or 4 Unit Apartments | 229 | 13.3% |
| 5 to 9 Unit Apartments | 25 | 1.5% |
| 10 or more Apartments | 84 | 4.9% |
| Mobile Home / Other | 50 | 2.9% |
| Total | 1,719 | 100.0% |
Housing Structures by Occupancy in Brookville borough
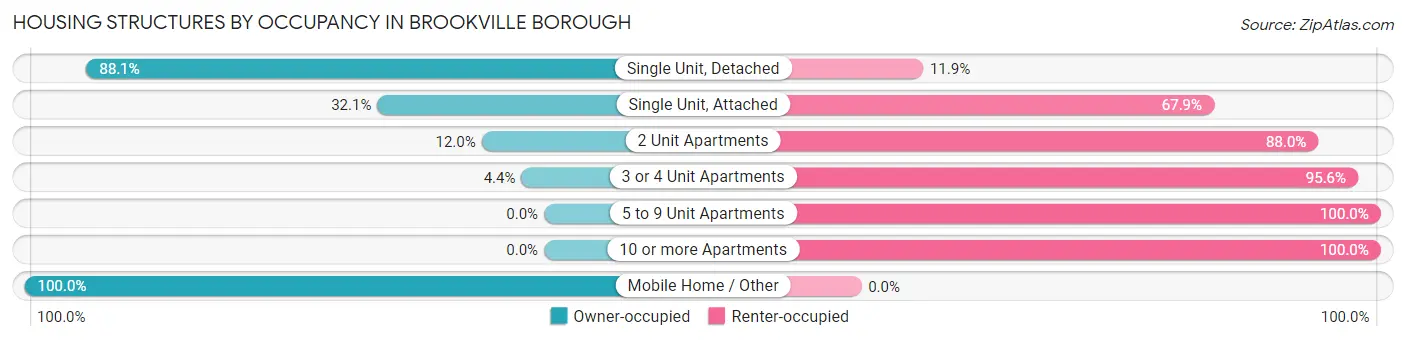
| Structure Type | Owner-occupied | Renter-occupied |
| Single Unit, Detached | 874 (88.1%) | 118 (11.9%) |
| Single Unit, Attached | 26 (32.1%) | 55 (67.9%) |
| 2 Unit Apartments | 31 (12.0%) | 227 (88.0%) |
| 3 or 4 Unit Apartments | 10 (4.4%) | 219 (95.6%) |
| 5 to 9 Unit Apartments | 0 (0.0%) | 25 (100.0%) |
| 10 or more Apartments | 0 (0.0%) | 84 (100.0%) |
| Mobile Home / Other | 50 (100.0%) | 0 (0.0%) |
| Total | 991 (57.7%) | 728 (42.3%) |
Housing Structures by Number of Rooms in Brookville borough
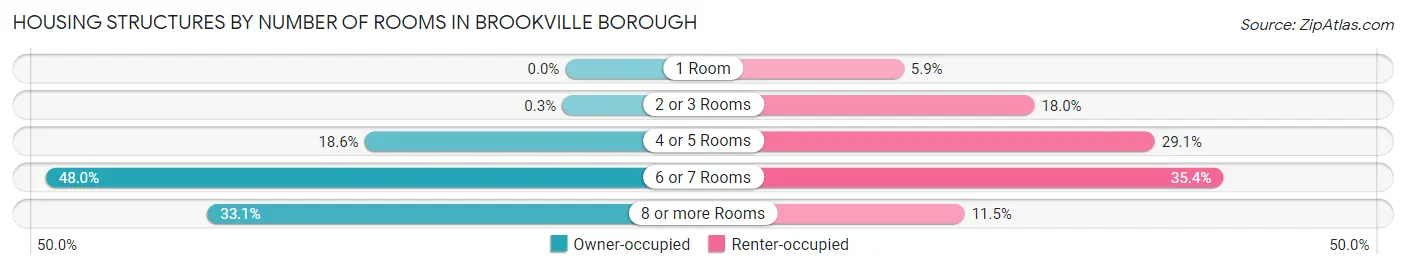
| Number of Rooms | Owner-occupied | Renter-occupied |
| 1 Room | 0 (0.0%) | 43 (5.9%) |
| 2 or 3 Rooms | 3 (0.3%) | 131 (18.0%) |
| 4 or 5 Rooms | 184 (18.6%) | 212 (29.1%) |
| 6 or 7 Rooms | 476 (48.0%) | 258 (35.4%) |
| 8 or more Rooms | 328 (33.1%) | 84 (11.5%) |
| Total | 991 (100.0%) | 728 (100.0%) |
Housing Structure by Heating Type in Brookville borough
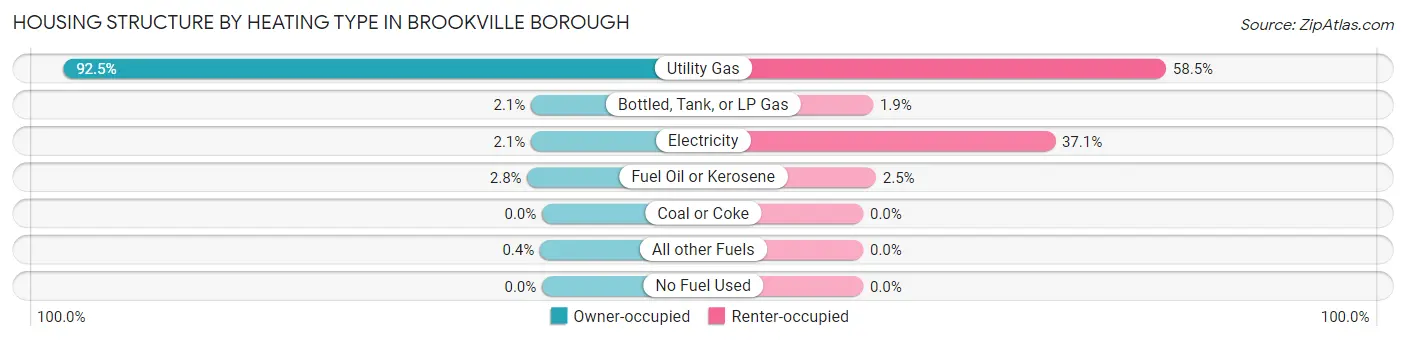
| Heating Type | Owner-occupied | Renter-occupied |
| Utility Gas | 917 (92.5%) | 426 (58.5%) |
| Bottled, Tank, or LP Gas | 21 (2.1%) | 14 (1.9%) |
| Electricity | 21 (2.1%) | 270 (37.1%) |
| Fuel Oil or Kerosene | 28 (2.8%) | 18 (2.5%) |
| Coal or Coke | 0 (0.0%) | 0 (0.0%) |
| All other Fuels | 4 (0.4%) | 0 (0.0%) |
| No Fuel Used | 0 (0.0%) | 0 (0.0%) |
| Total | 991 (100.0%) | 728 (100.0%) |
Household Vehicle Usage in Brookville borough
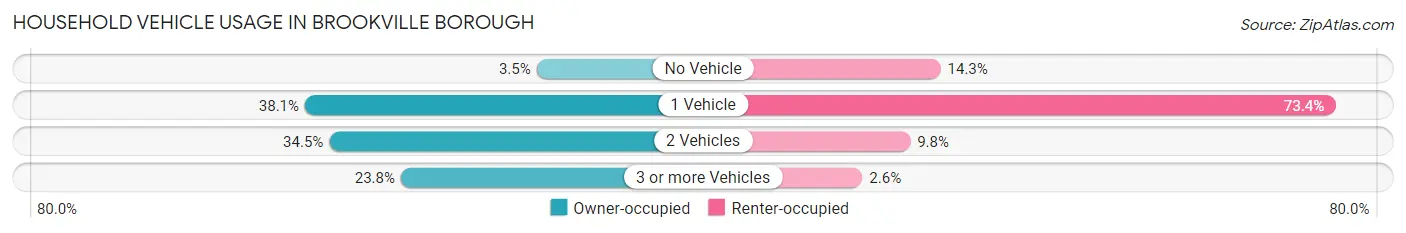
| Vehicles per Household | Owner-occupied | Renter-occupied |
| No Vehicle | 35 (3.5%) | 104 (14.3%) |
| 1 Vehicle | 378 (38.1%) | 534 (73.4%) |
| 2 Vehicles | 342 (34.5%) | 71 (9.8%) |
| 3 or more Vehicles | 236 (23.8%) | 19 (2.6%) |
| Total | 991 (100.0%) | 728 (100.0%) |
Real Estate & Mortgages in Brookville borough
Real Estate and Mortgage Overview in Brookville borough
| Characteristic | Without Mortgage | With Mortgage |
| Housing Units | 427 | 564 |
| Median Property Value | $118,700 | $115,800 |
| Median Household Income | $58,313 | $86 |
| Monthly Housing Costs | $511 | $6 |
| Real Estate Taxes | $1,951 | $9 |
Property Value by Mortgage Status in Brookville borough
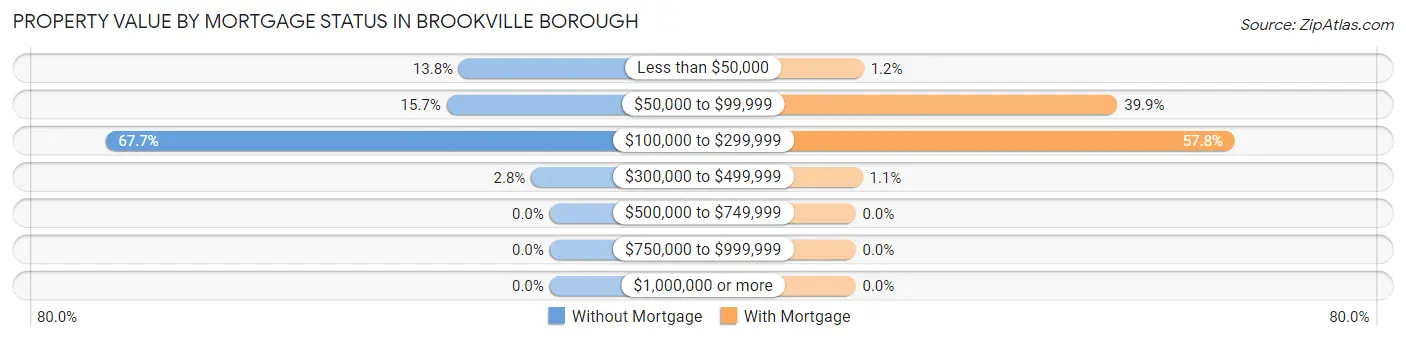
| Property Value | Without Mortgage | With Mortgage |
| Less than $50,000 | 59 (13.8%) | 7 (1.2%) |
| $50,000 to $99,999 | 67 (15.7%) | 225 (39.9%) |
| $100,000 to $299,999 | 289 (67.7%) | 326 (57.8%) |
| $300,000 to $499,999 | 12 (2.8%) | 6 (1.1%) |
| $500,000 to $749,999 | 0 (0.0%) | 0 (0.0%) |
| $750,000 to $999,999 | 0 (0.0%) | 0 (0.0%) |
| $1,000,000 or more | 0 (0.0%) | 0 (0.0%) |
| Total | 427 (100.0%) | 564 (100.0%) |
Household Income by Mortgage Status in Brookville borough
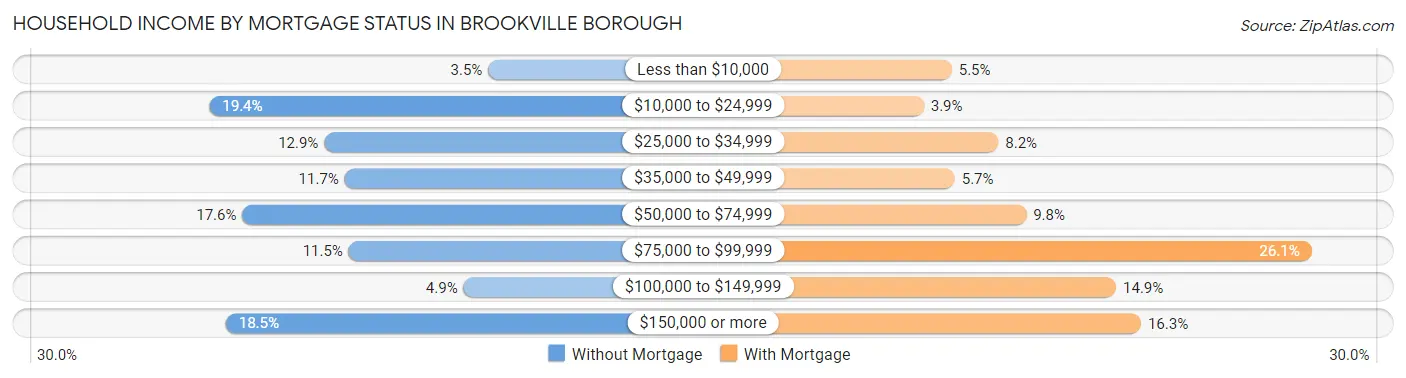
| Household Income | Without Mortgage | With Mortgage |
| Less than $10,000 | 15 (3.5%) | 31 (5.5%) |
| $10,000 to $24,999 | 83 (19.4%) | 22 (3.9%) |
| $25,000 to $34,999 | 55 (12.9%) | 46 (8.2%) |
| $35,000 to $49,999 | 50 (11.7%) | 32 (5.7%) |
| $50,000 to $74,999 | 75 (17.6%) | 55 (9.8%) |
| $75,000 to $99,999 | 49 (11.5%) | 147 (26.1%) |
| $100,000 to $149,999 | 21 (4.9%) | 84 (14.9%) |
| $150,000 or more | 79 (18.5%) | 92 (16.3%) |
| Total | 427 (100.0%) | 564 (100.0%) |
Property Value to Household Income Ratio in Brookville borough
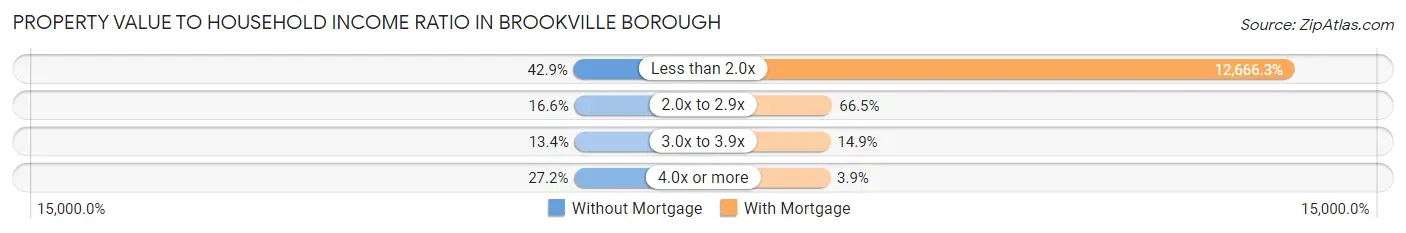
| Value-to-Income Ratio | Without Mortgage | With Mortgage |
| Less than 2.0x | 183 (42.9%) | 71,438 (12,666.3%) |
| 2.0x to 2.9x | 71 (16.6%) | 375 (66.5%) |
| 3.0x to 3.9x | 57 (13.4%) | 84 (14.9%) |
| 4.0x or more | 116 (27.2%) | 22 (3.9%) |
| Total | 427 (100.0%) | 564 (100.0%) |
Real Estate Taxes by Mortgage Status in Brookville borough
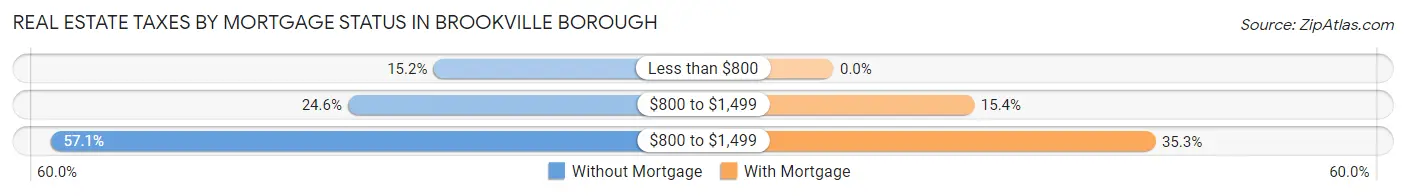
| Property Taxes | Without Mortgage | With Mortgage |
| Less than $800 | 65 (15.2%) | 0 (0.0%) |
| $800 to $1,499 | 105 (24.6%) | 87 (15.4%) |
| $800 to $1,499 | 244 (57.1%) | 199 (35.3%) |
| Total | 427 (100.0%) | 564 (100.0%) |
Health & Disability in Brookville borough
Health Insurance Coverage by Age in Brookville borough
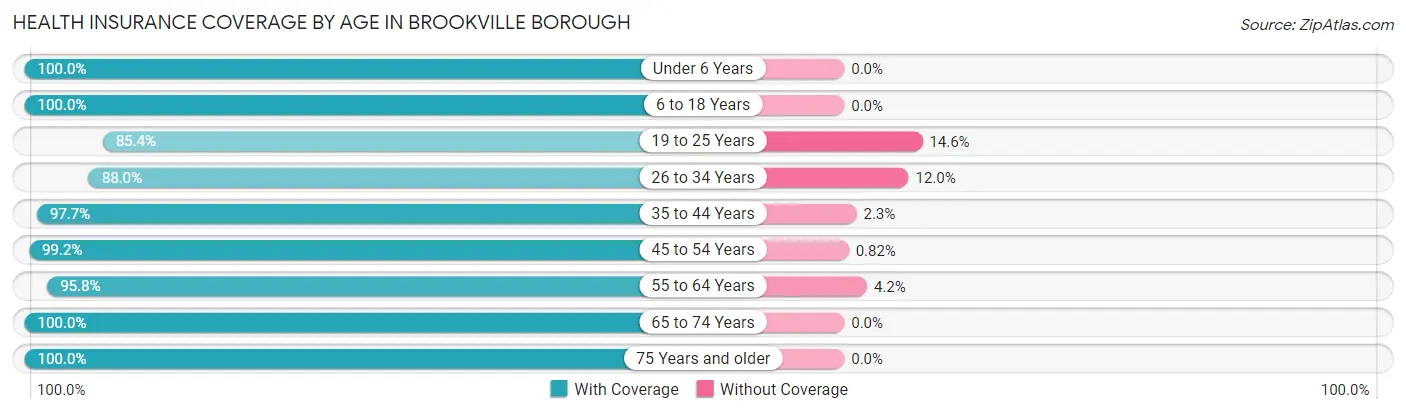
| Age Bracket | With Coverage | Without Coverage |
| Under 6 Years | 371 (100.0%) | 0 (0.0%) |
| 6 to 18 Years | 621 (100.0%) | 0 (0.0%) |
| 19 to 25 Years | 299 (85.4%) | 51 (14.6%) |
| 26 to 34 Years | 448 (88.0%) | 61 (12.0%) |
| 35 to 44 Years | 471 (97.7%) | 11 (2.3%) |
| 45 to 54 Years | 362 (99.2%) | 3 (0.8%) |
| 55 to 64 Years | 430 (95.8%) | 19 (4.2%) |
| 65 to 74 Years | 414 (100.0%) | 0 (0.0%) |
| 75 Years and older | 303 (100.0%) | 0 (0.0%) |
| Total | 3,719 (96.3%) | 145 (3.7%) |
Health Insurance Coverage by Citizenship Status in Brookville borough
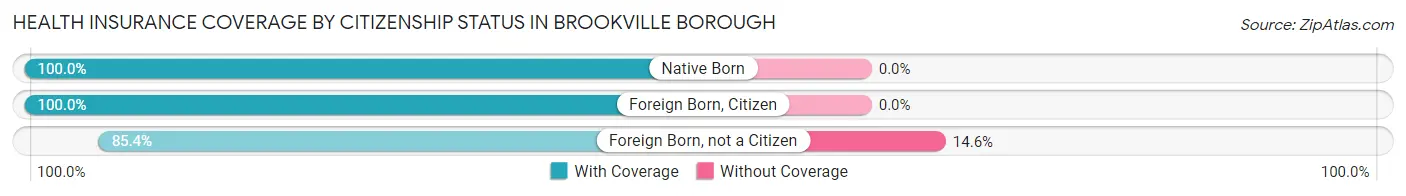
| Citizenship Status | With Coverage | Without Coverage |
| Native Born | 371 (100.0%) | 0 (0.0%) |
| Foreign Born, Citizen | 621 (100.0%) | 0 (0.0%) |
| Foreign Born, not a Citizen | 299 (85.4%) | 51 (14.6%) |
Health Insurance Coverage by Household Income in Brookville borough
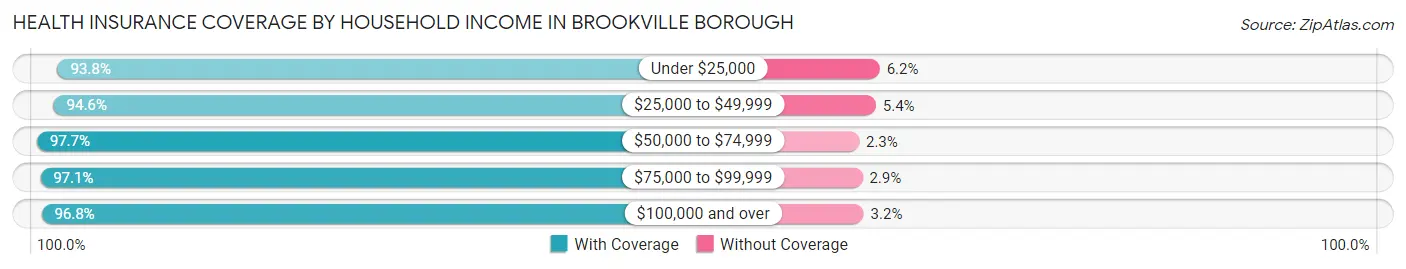
| Household Income | With Coverage | Without Coverage |
| Under $25,000 | 502 (93.8%) | 33 (6.2%) |
| $25,000 to $49,999 | 748 (94.6%) | 43 (5.4%) |
| $50,000 to $74,999 | 1,150 (97.7%) | 27 (2.3%) |
| $75,000 to $99,999 | 398 (97.1%) | 12 (2.9%) |
| $100,000 and over | 920 (96.8%) | 30 (3.2%) |
Public vs Private Health Insurance Coverage by Age in Brookville borough
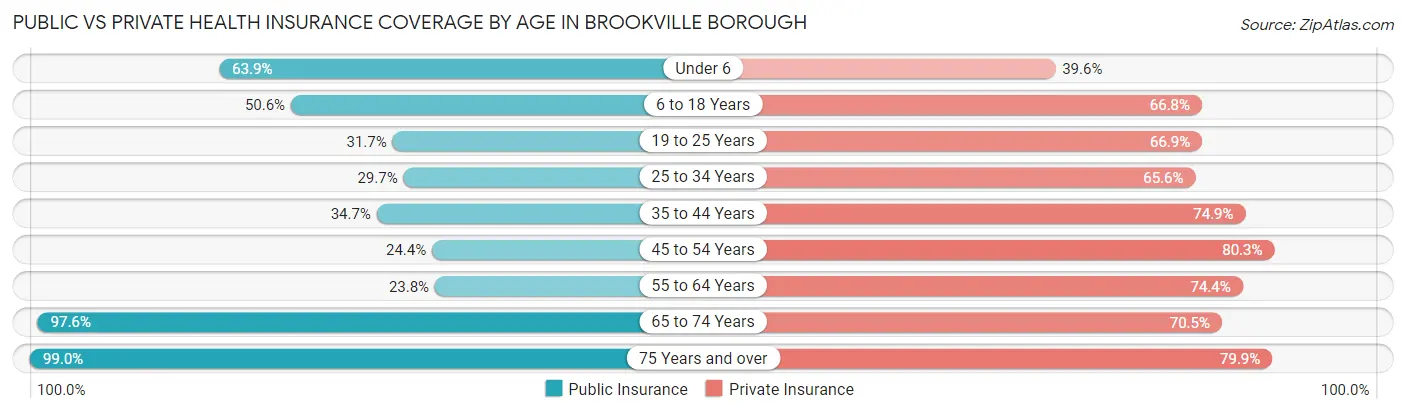
| Age Bracket | Public Insurance | Private Insurance |
| Under 6 | 237 (63.9%) | 147 (39.6%) |
| 6 to 18 Years | 314 (50.6%) | 415 (66.8%) |
| 19 to 25 Years | 111 (31.7%) | 234 (66.9%) |
| 25 to 34 Years | 151 (29.7%) | 334 (65.6%) |
| 35 to 44 Years | 167 (34.6%) | 361 (74.9%) |
| 45 to 54 Years | 89 (24.4%) | 293 (80.3%) |
| 55 to 64 Years | 107 (23.8%) | 334 (74.4%) |
| 65 to 74 Years | 404 (97.6%) | 292 (70.5%) |
| 75 Years and over | 300 (99.0%) | 242 (79.9%) |
| Total | 1,880 (48.6%) | 2,652 (68.6%) |
Disability Status by Sex by Age in Brookville borough
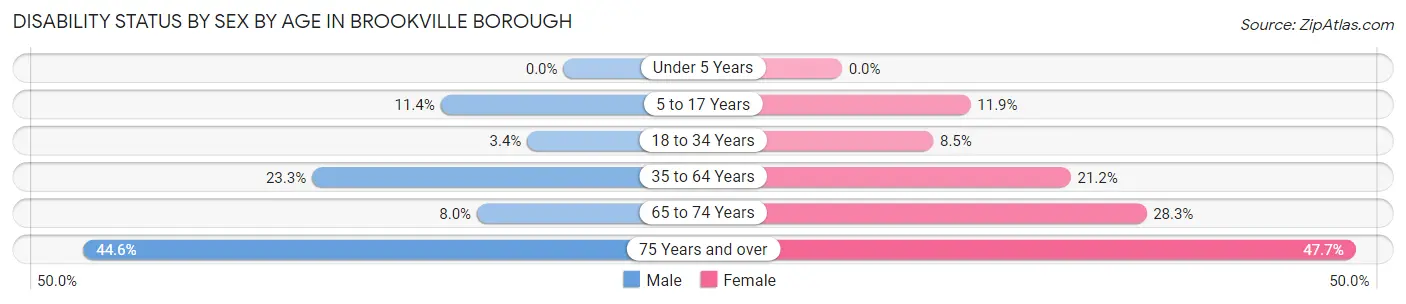
| Age Bracket | Male | Female |
| Under 5 Years | 0 (0.0%) | 0 (0.0%) |
| 5 to 17 Years | 44 (11.4%) | 34 (11.9%) |
| 18 to 34 Years | 15 (3.4%) | 40 (8.5%) |
| 35 to 64 Years | 154 (23.3%) | 135 (21.2%) |
| 65 to 74 Years | 19 (8.0%) | 50 (28.2%) |
| 75 Years and over | 49 (44.6%) | 92 (47.7%) |
Disability Class by Sex by Age in Brookville borough
Disability Class: Hearing Difficulty
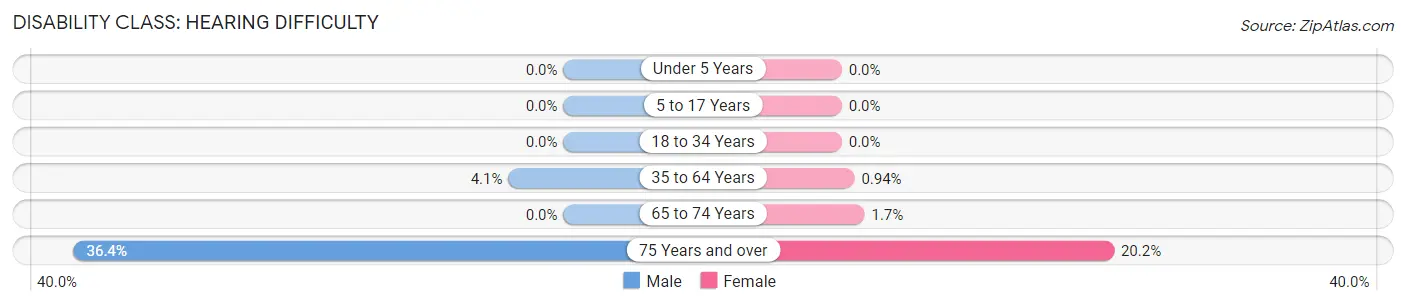
| Age Bracket | Male | Female |
| Under 5 Years | 0 (0.0%) | 0 (0.0%) |
| 5 to 17 Years | 0 (0.0%) | 0 (0.0%) |
| 18 to 34 Years | 0 (0.0%) | 0 (0.0%) |
| 35 to 64 Years | 27 (4.1%) | 6 (0.9%) |
| 65 to 74 Years | 0 (0.0%) | 3 (1.7%) |
| 75 Years and over | 40 (36.4%) | 39 (20.2%) |
Disability Class: Vision Difficulty
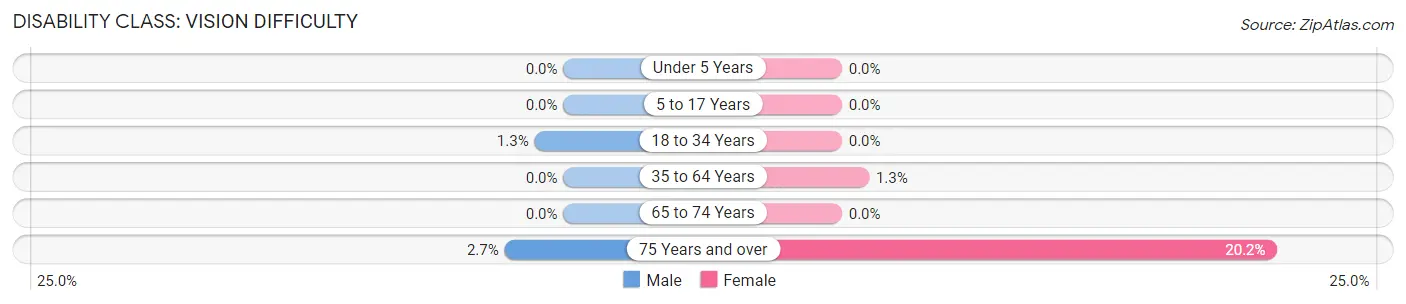
| Age Bracket | Male | Female |
| Under 5 Years | 0 (0.0%) | 0 (0.0%) |
| 5 to 17 Years | 0 (0.0%) | 0 (0.0%) |
| 18 to 34 Years | 6 (1.3%) | 0 (0.0%) |
| 35 to 64 Years | 0 (0.0%) | 8 (1.3%) |
| 65 to 74 Years | 0 (0.0%) | 0 (0.0%) |
| 75 Years and over | 3 (2.7%) | 39 (20.2%) |
Disability Class: Cognitive Difficulty
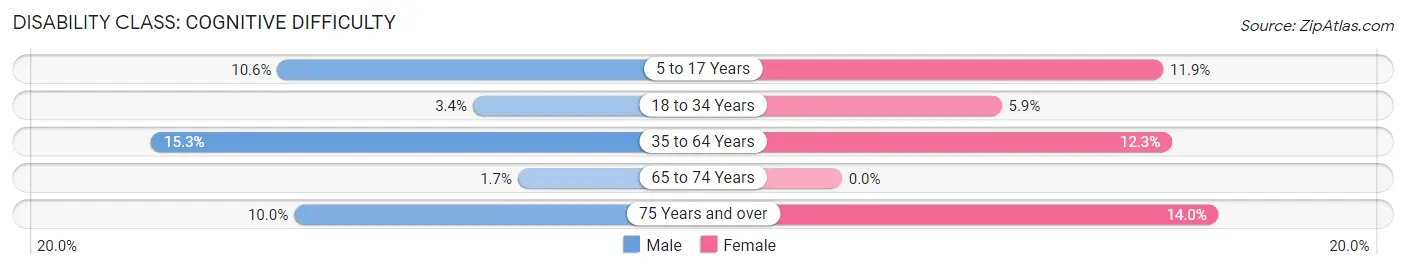
| Age Bracket | Male | Female |
| 5 to 17 Years | 41 (10.6%) | 34 (11.9%) |
| 18 to 34 Years | 15 (3.4%) | 28 (5.9%) |
| 35 to 64 Years | 101 (15.3%) | 78 (12.3%) |
| 65 to 74 Years | 4 (1.7%) | 0 (0.0%) |
| 75 Years and over | 11 (10.0%) | 27 (14.0%) |
Disability Class: Ambulatory Difficulty
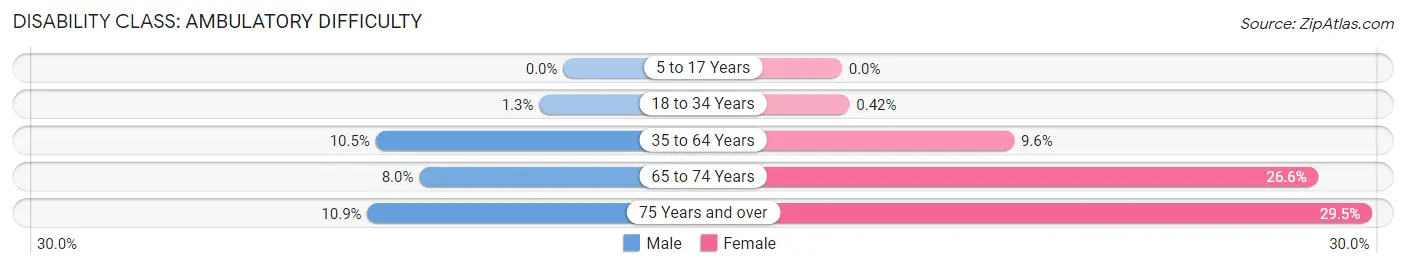
| Age Bracket | Male | Female |
| 5 to 17 Years | 0 (0.0%) | 0 (0.0%) |
| 18 to 34 Years | 6 (1.3%) | 2 (0.4%) |
| 35 to 64 Years | 69 (10.4%) | 61 (9.6%) |
| 65 to 74 Years | 19 (8.0%) | 47 (26.6%) |
| 75 Years and over | 12 (10.9%) | 57 (29.5%) |
Disability Class: Self-Care Difficulty
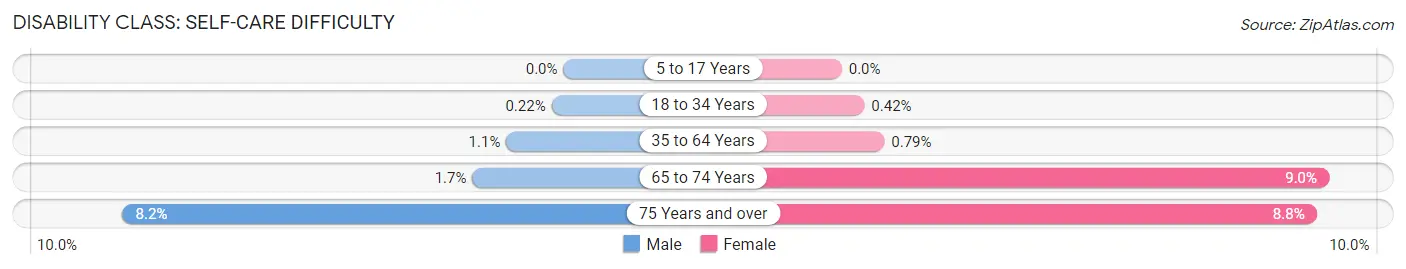
| Age Bracket | Male | Female |
| 5 to 17 Years | 0 (0.0%) | 0 (0.0%) |
| 18 to 34 Years | 1 (0.2%) | 2 (0.4%) |
| 35 to 64 Years | 7 (1.1%) | 5 (0.8%) |
| 65 to 74 Years | 4 (1.7%) | 16 (9.0%) |
| 75 Years and over | 9 (8.2%) | 17 (8.8%) |
Technology Access in Brookville borough
Computing Device Access in Brookville borough
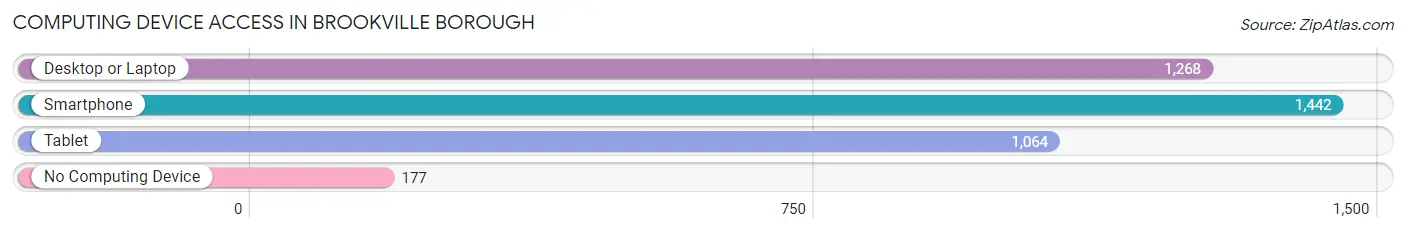
| Device Type | # Households | % Households |
| Desktop or Laptop | 1,268 | 73.8% |
| Smartphone | 1,442 | 83.9% |
| Tablet | 1,064 | 61.9% |
| No Computing Device | 177 | 10.3% |
| Total | 1,719 | 100.0% |
Internet Access in Brookville borough
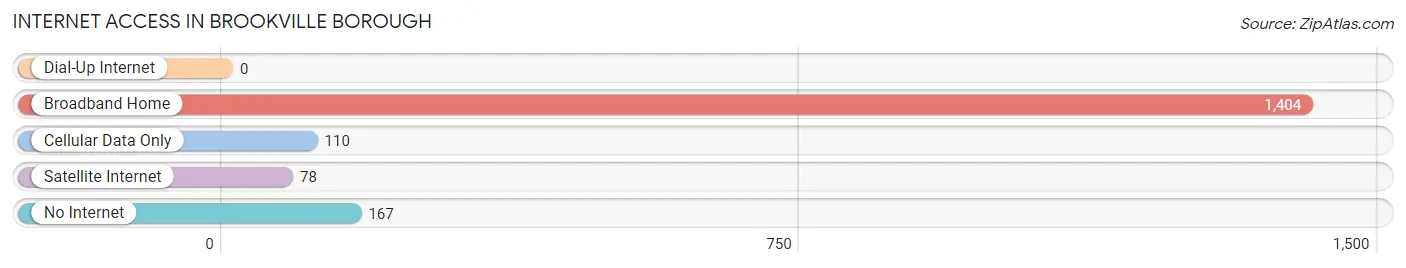
| Internet Type | # Households | % Households |
| Dial-Up Internet | 0 | 0.0% |
| Broadband Home | 1,404 | 81.7% |
| Cellular Data Only | 110 | 6.4% |
| Satellite Internet | 78 | 4.5% |
| No Internet | 167 | 9.7% |
| Total | 1,719 | 100.0% |
Brookville borough Summary
Introduction
Located in western Pennsylvania, the borough of Brookville is a small town with a population of 2,621 as of the 2010 census. It is situated in Jefferson County, approximately 50 miles northeast of Pittsburgh. The borough was founded in 1832 and is known for its historic buildings, quaint downtown, and friendly atmosphere.
History
The area that is now Brookville was first settled in the late 1700s by a group of settlers from Connecticut. The town was originally known as “Mudtown” due to the muddy conditions of the area. In 1832, the town was officially incorporated as the borough of Brookville.
The town was named after the nearby stream, which was named after the brook trout that were found in the area. The town quickly grew and became a center of commerce and industry. The first post office was established in 1833 and the first school was built in 1835.
The town was also home to several mills, including a sawmill, gristmill, and woolen mill. The town was also home to a number of churches, including the First Presbyterian Church, which was founded in 1837.
In the late 1800s, the town was home to a number of businesses, including a bank, a newspaper, a hotel, and a number of stores. The town was also home to a number of fraternal organizations, including the Odd Fellows and the Masons.
The town was also home to a number of notable people, including the first mayor of Brookville, William H. Smith, and the first postmaster, John W. Smith.
Geography
Brookville is located in western Pennsylvania, approximately 50 miles northeast of Pittsburgh. The borough is situated in Jefferson County and is bordered by the boroughs of Summerville, Falls Creek, and Reynoldsville.
The borough is located in the Allegheny Plateau region of Pennsylvania and is surrounded by rolling hills and forests. The borough is located at an elevation of 1,400 feet and is situated on the banks of the Clarion River.
The borough covers an area of 1.2 square miles and is home to a number of parks, including the Brookville Borough Park and the Brookville Community Park.
Economy
The economy of Brookville is largely based on tourism and retail. The town is home to a number of antique stores, gift shops, and restaurants. The town is also home to a number of manufacturing companies, including a furniture manufacturer and a plastics manufacturer.
The town is also home to a number of service-based businesses, including a number of law firms, accounting firms, and medical offices. The town is also home to a number of educational institutions, including the Brookville Area School District and the Jefferson County Community College.
Demographics
As of the 2010 census, the population of Brookville was 2,621. The population is largely white (96.2%) and the median age is 43.7 years. The median household income is $41,944 and the median home value is $112,400.
Conclusion
Brookville is a small borough located in western Pennsylvania. The town is known for its historic buildings, quaint downtown, and friendly atmosphere. The economy of the town is largely based on tourism and retail, and the town is home to a number of manufacturing companies, service-based businesses, and educational institutions. The population of the town is largely white and the median age is 43.7 years.
Common Questions
What is Per Capita Income in Brookville borough?
Per Capita income in Brookville borough is $28,787.
What is the Median Family Income in Brookville borough?
Median Family Income in Brookville borough is $64,459.
What is the Median Household income in Brookville borough?
Median Household Income in Brookville borough is $57,807.
What is Income or Wage Gap in Brookville borough?
Income or Wage Gap in Brookville borough is 26.7%.
Women in Brookville borough earn 73.3 cents for every dollar earned by a man.
What is Inequality or Gini Index in Brookville borough?
Inequality or Gini Index in Brookville borough is 0.42.
What is the Total Population of Brookville borough?
Total Population of Brookville borough is 3,974.
What is the Total Male Population of Brookville borough?
Total Male Population of Brookville borough is 2,025.
What is the Total Female Population of Brookville borough?
Total Female Population of Brookville borough is 1,949.
What is the Ratio of Males per 100 Females in Brookville borough?
There are 103.90 Males per 100 Females in Brookville borough.
What is the Ratio of Females per 100 Males in Brookville borough?
There are 96.25 Females per 100 Males in Brookville borough.
What is the Median Population Age in Brookville borough?
Median Population Age in Brookville borough is 37.1 Years.
What is the Average Family Size in Brookville borough
Average Family Size in Brookville borough is 3.1 People.
What is the Average Household Size in Brookville borough
Average Household Size in Brookville borough is 2.2 People.
How Large is the Labor Force in Brookville borough?
There are 2,038 People in the Labor Forcein in Brookville borough.
What is the Percentage of People in the Labor Force in Brookville borough?
65.5% of People are in the Labor Force in Brookville borough.
What is the Unemployment Rate in Brookville borough?
Unemployment Rate in Brookville borough is 8.1%.