Bridgeville borough, PA Map & Demographics
Bridgeville borough Overview
$37,930
PER CAPITA INCOME
$73,500
AVG FAMILY INCOME
$55,709
AVG HOUSEHOLD INCOME
25.0%
WAGE / INCOME GAP [ % ]
75.0¢/ $1
WAGE / INCOME GAP [ $ ]
$9,921
FAMILY INCOME DEFICIT
0.43
INEQUALITY / GINI INDEX
4,777
TOTAL POPULATION
2,424
MALE POPULATION
2,353
FEMALE POPULATION
103.02
MALES / 100 FEMALES
97.07
FEMALES / 100 MALES
43.0
MEDIAN AGE
2.8
AVG FAMILY SIZE
1.9
AVG HOUSEHOLD SIZE
2,697
LABOR FORCE [ PEOPLE ]
65.9%
PERCENT IN LABOR FORCE
6.7%
UNEMPLOYMENT RATE
Income in Bridgeville borough
Income Overview in Bridgeville borough
Per Capita Income in Bridgeville borough is $37,930, while median incomes of families and households are $73,500 and $55,709 respectively.
| Characteristic | Number | Measure |
| Per Capita Income | 4,777 | $37,930 |
| Median Family Income | 1,138 | $73,500 |
| Mean Family Income | 1,138 | $93,659 |
| Median Household Income | 2,485 | $55,709 |
| Mean Household Income | 2,485 | $70,818 |
| Income Deficit | 1,138 | $9,921 |
| Wage / Income Gap (%) | 4,777 | 25.03% |
| Wage / Income Gap ($) | 4,777 | 74.97¢ per $1 |
| Gini / Inequality Index | 4,777 | 0.43 |
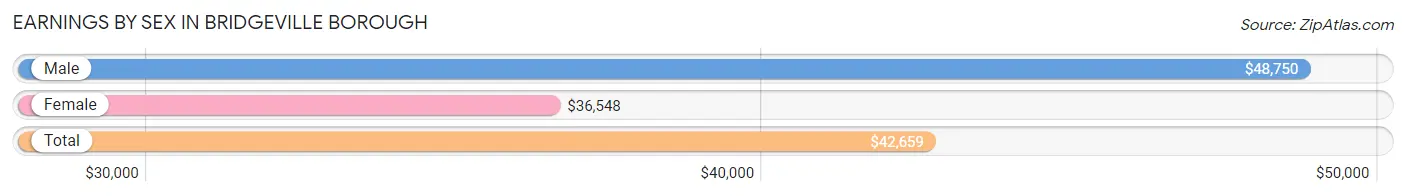
Earnings by Sex in Bridgeville borough
Average Earnings in Bridgeville borough are $42,659, $48,750 for men and $36,548 for women, a difference of 25.0%.
| Sex | Number | Average Earnings |
| Male | 1,464 (51.7%) | $48,750 |
| Female | 1,368 (48.3%) | $36,548 |
| Total | 2,832 (100.0%) | $42,659 |
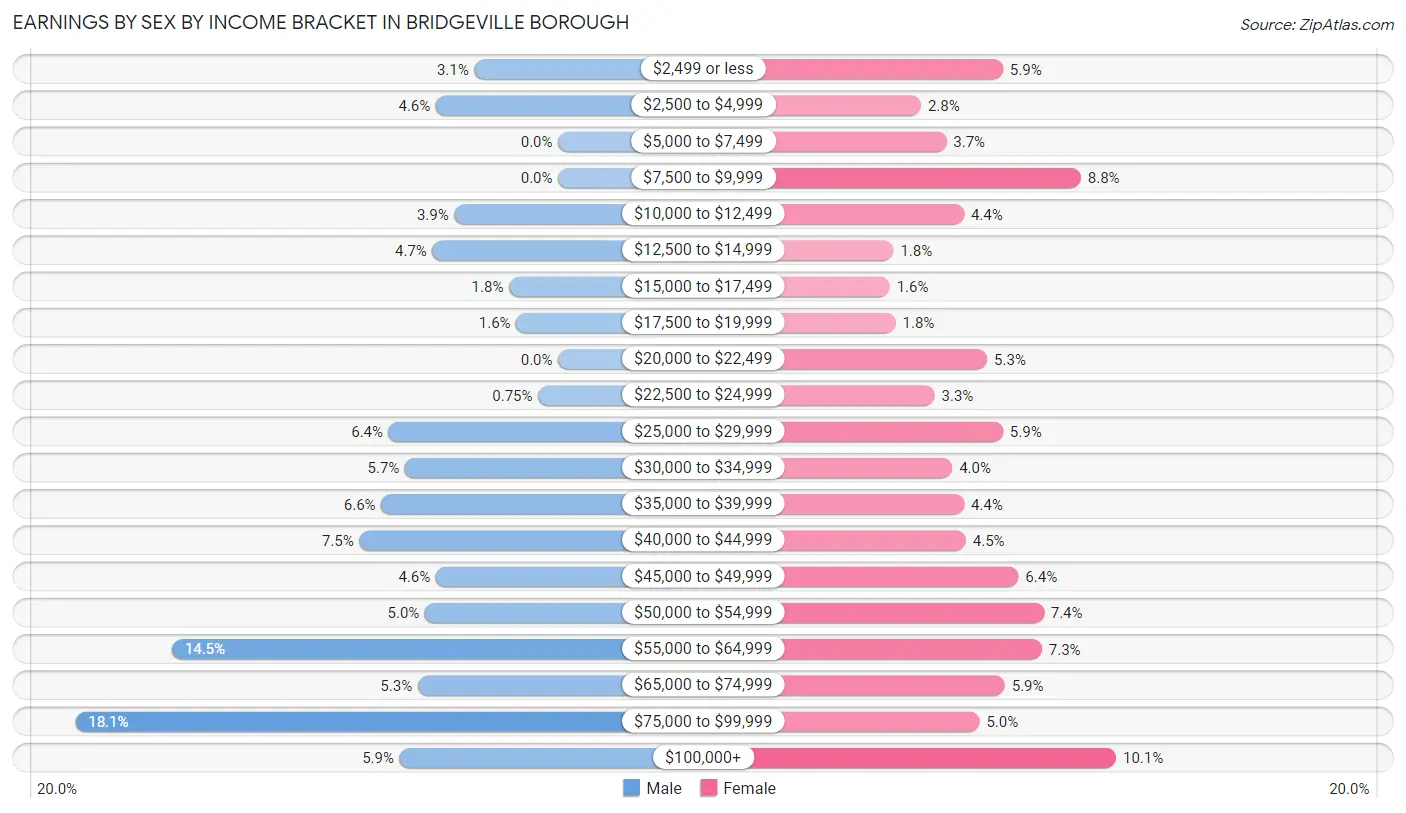
Earnings by Sex by Income Bracket in Bridgeville borough
The most common earnings brackets in Bridgeville borough are $75,000 to $99,999 for men (265 | 18.1%) and $100,000+ for women (138 | 10.1%).
| Income | Male | Female |
| $2,499 or less | 46 (3.1%) | 80 (5.9%) |
| $2,500 to $4,999 | 67 (4.6%) | 38 (2.8%) |
| $5,000 to $7,499 | 0 (0.0%) | 51 (3.7%) |
| $7,500 to $9,999 | 0 (0.0%) | 120 (8.8%) |
| $10,000 to $12,499 | 57 (3.9%) | 60 (4.4%) |
| $12,500 to $14,999 | 69 (4.7%) | 24 (1.8%) |
| $15,000 to $17,499 | 27 (1.8%) | 22 (1.6%) |
| $17,500 to $19,999 | 23 (1.6%) | 25 (1.8%) |
| $20,000 to $22,499 | 0 (0.0%) | 72 (5.3%) |
| $22,500 to $24,999 | 11 (0.7%) | 45 (3.3%) |
| $25,000 to $29,999 | 93 (6.4%) | 80 (5.9%) |
| $30,000 to $34,999 | 84 (5.7%) | 54 (4.0%) |
| $35,000 to $39,999 | 97 (6.6%) | 60 (4.4%) |
| $40,000 to $44,999 | 109 (7.4%) | 61 (4.5%) |
| $45,000 to $49,999 | 67 (4.6%) | 88 (6.4%) |
| $50,000 to $54,999 | 73 (5.0%) | 101 (7.4%) |
| $55,000 to $64,999 | 212 (14.5%) | 100 (7.3%) |
| $65,000 to $74,999 | 77 (5.3%) | 81 (5.9%) |
| $75,000 to $99,999 | 265 (18.1%) | 68 (5.0%) |
| $100,000+ | 87 (5.9%) | 138 (10.1%) |
| Total | 1,464 (100.0%) | 1,368 (100.0%) |
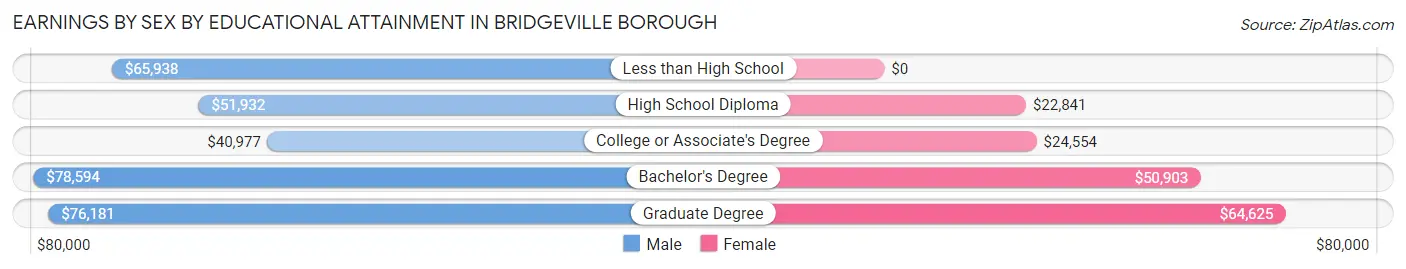
Earnings by Sex by Educational Attainment in Bridgeville borough
Average earnings in Bridgeville borough are $57,946 for men and $40,030 for women, a difference of 30.9%. Men with an educational attainment of bachelor's degree enjoy the highest average annual earnings of $78,594, while those with college or associate's degree education earn the least with $40,977. Women with an educational attainment of graduate degree earn the most with the average annual earnings of $64,625, while those with high school diploma education have the smallest earnings of $22,841.
| Educational Attainment | Male Income | Female Income |
| Less than High School | $65,938 | $0 |
| High School Diploma | $51,932 | $22,841 |
| College or Associate's Degree | $40,977 | $24,554 |
| Bachelor's Degree | $78,594 | $50,903 |
| Graduate Degree | $76,181 | $64,625 |
| Total | $57,946 | $40,030 |
Family Income in Bridgeville borough
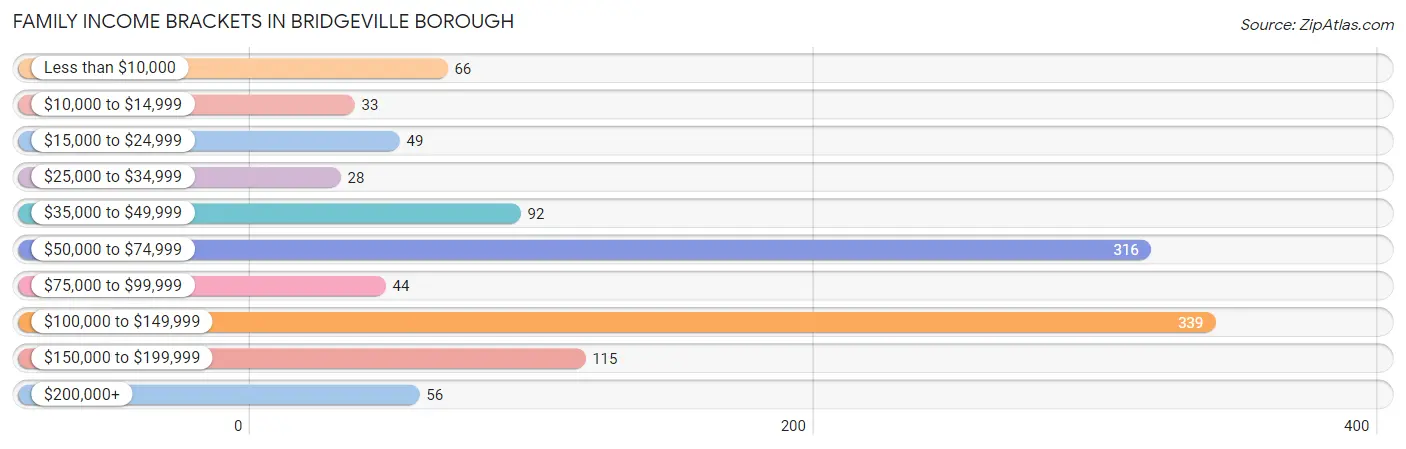
Family Income Brackets in Bridgeville borough
According to the Bridgeville borough family income data, there are 339 families falling into the $100,000 to $149,999 income range, which is the most common income bracket and makes up 29.8% of all families. Conversely, the $25,000 to $34,999 income bracket is the least frequent group with only 28 families (2.5%) belonging to this category.
| Income Bracket | # Families | % Families |
| Less than $10,000 | 66 | 5.8% |
| $10,000 to $14,999 | 33 | 2.9% |
| $15,000 to $24,999 | 49 | 4.3% |
| $25,000 to $34,999 | 28 | 2.5% |
| $35,000 to $49,999 | 92 | 8.1% |
| $50,000 to $74,999 | 316 | 27.8% |
| $75,000 to $99,999 | 44 | 3.9% |
| $100,000 to $149,999 | 339 | 29.8% |
| $150,000 to $199,999 | 115 | 10.1% |
| $200,000+ | 56 | 4.9% |
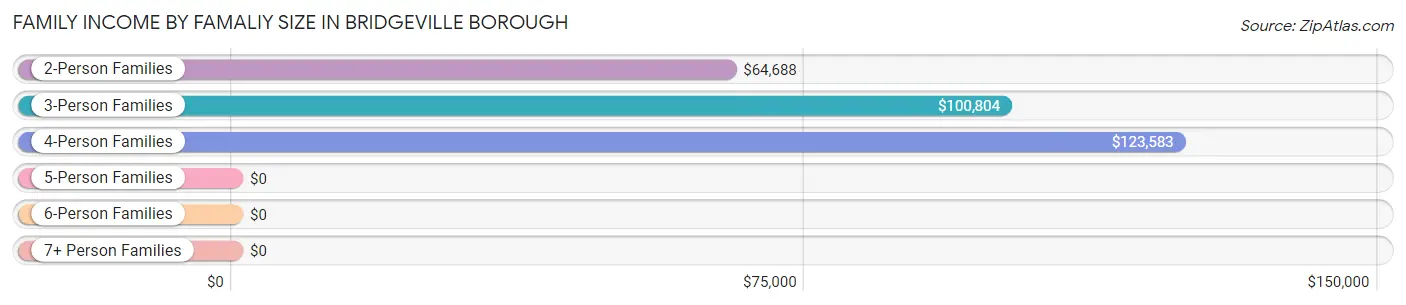
Family Income by Famaliy Size in Bridgeville borough
4-person families (190 | 16.7%) account for the highest median family income in Bridgeville borough with $123,583 per family, while 3-person families (215 | 18.9%) have the highest median income of $33,601 per family member.
| Income Bracket | # Families | Median Income |
| 2-Person Families | 694 (61.0%) | $64,688 |
| 3-Person Families | 215 (18.9%) | $100,804 |
| 4-Person Families | 190 (16.7%) | $123,583 |
| 5-Person Families | 19 (1.7%) | $0 |
| 6-Person Families | 20 (1.8%) | $0 |
| 7+ Person Families | 0 (0.0%) | $0 |
| Total | 1,138 (100.0%) | $73,500 |
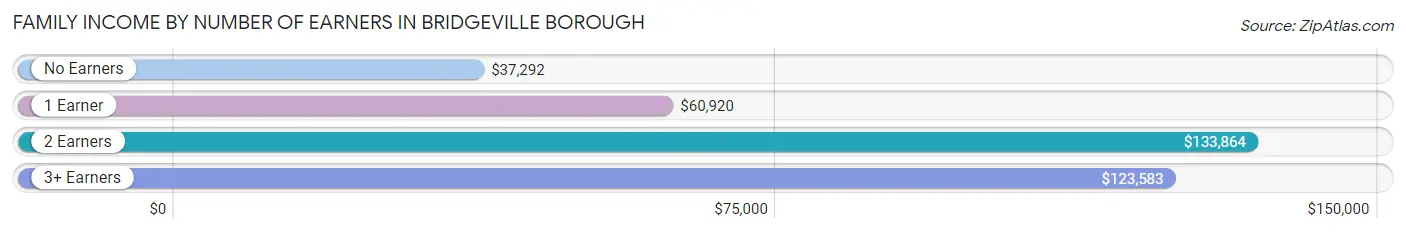
Family Income by Number of Earners in Bridgeville borough
The median family income in Bridgeville borough is $73,500, with families comprising 2 earners (420) having the highest median family income of $133,864, while families with no earners (152) have the lowest median family income of $37,292, accounting for 36.9% and 13.4% of families, respectively.
| Number of Earners | # Families | Median Income |
| No Earners | 152 (13.4%) | $37,292 |
| 1 Earner | 425 (37.3%) | $60,920 |
| 2 Earners | 420 (36.9%) | $133,864 |
| 3+ Earners | 141 (12.4%) | $123,583 |
| Total | 1,138 (100.0%) | $73,500 |
Household Income in Bridgeville borough
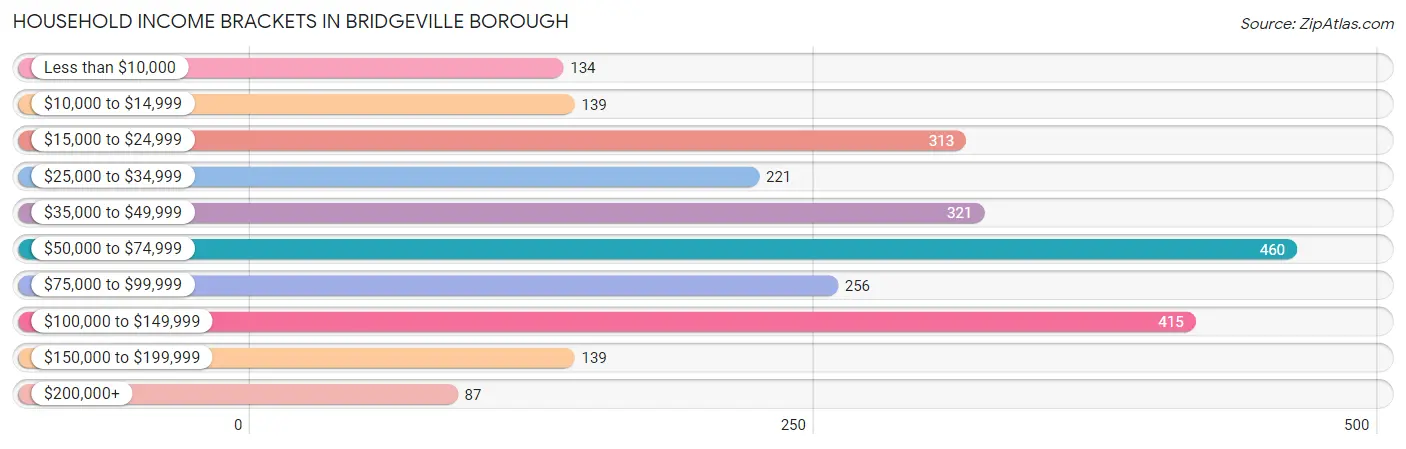
Household Income Brackets in Bridgeville borough
With 460 households falling in the category, the $50,000 to $74,999 income range is the most frequent in Bridgeville borough, accounting for 18.5% of all households. In contrast, only 87 households (3.5%) fall into the $200,000+ income bracket, making it the least populous group.
| Income Bracket | # Households | % Households |
| Less than $10,000 | 134 | 5.4% |
| $10,000 to $14,999 | 139 | 5.6% |
| $15,000 to $24,999 | 313 | 12.6% |
| $25,000 to $34,999 | 221 | 8.9% |
| $35,000 to $49,999 | 321 | 12.9% |
| $50,000 to $74,999 | 460 | 18.5% |
| $75,000 to $99,999 | 256 | 10.3% |
| $100,000 to $149,999 | 415 | 16.7% |
| $150,000 to $199,999 | 139 | 5.6% |
| $200,000+ | 87 | 3.5% |
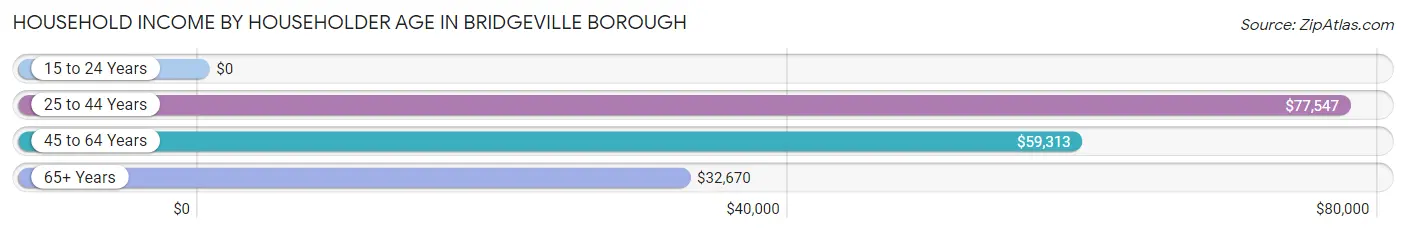
Household Income by Householder Age in Bridgeville borough
The median household income in Bridgeville borough is $55,709, with the highest median household income of $77,547 found in the 25 to 44 years age bracket for the primary householder. A total of 810 households (32.6%) fall into this category. Meanwhile, the 15 to 24 years age bracket for the primary householder has the lowest median household income of $0, with 67 households (2.7%) in this group.
| Income Bracket | # Households | Median Income |
| 15 to 24 Years | 67 (2.7%) | $0 |
| 25 to 44 Years | 810 (32.6%) | $77,547 |
| 45 to 64 Years | 777 (31.3%) | $59,313 |
| 65+ Years | 831 (33.4%) | $32,670 |
| Total | 2,485 (100.0%) | $55,709 |
Poverty in Bridgeville borough
Income Below Poverty by Sex and Age in Bridgeville borough
With 11.5% poverty level for males and 12.8% for females among the residents of Bridgeville borough, 15 year old males and 15 year old females are the most vulnerable to poverty, with 6 males (100.0%) and 9 females (75.0%) in their respective age groups living below the poverty level.
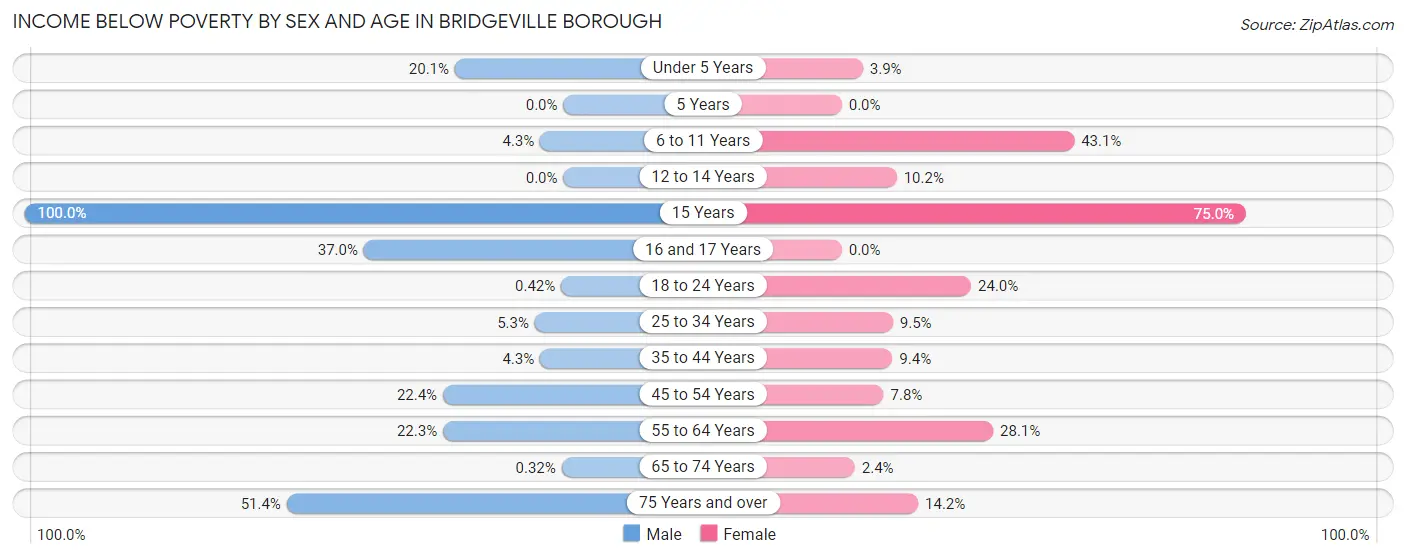
| Age Bracket | Male | Female |
| Under 5 Years | 29 (20.1%) | 5 (3.9%) |
| 5 Years | 0 (0.0%) | 0 (0.0%) |
| 6 to 11 Years | 5 (4.3%) | 22 (43.1%) |
| 12 to 14 Years | 0 (0.0%) | 10 (10.2%) |
| 15 Years | 6 (100.0%) | 9 (75.0%) |
| 16 and 17 Years | 20 (37.0%) | 0 (0.0%) |
| 18 to 24 Years | 1 (0.4%) | 24 (24.0%) |
| 25 to 34 Years | 24 (5.3%) | 31 (9.5%) |
| 35 to 44 Years | 14 (4.3%) | 31 (9.4%) |
| 45 to 54 Years | 57 (22.4%) | 25 (7.8%) |
| 55 to 64 Years | 61 (22.3%) | 84 (28.1%) |
| 65 to 74 Years | 1 (0.3%) | 7 (2.4%) |
| 75 Years and over | 57 (51.3%) | 52 (14.2%) |
| Total | 275 (11.5%) | 300 (12.8%) |
Income Above Poverty by Sex and Age in Bridgeville borough
According to the poverty statistics in Bridgeville borough, males aged 5 years and females aged 16 and 17 years are the age groups that are most secure financially, with 100.0% of males and 100.0% of females in these age groups living above the poverty line.
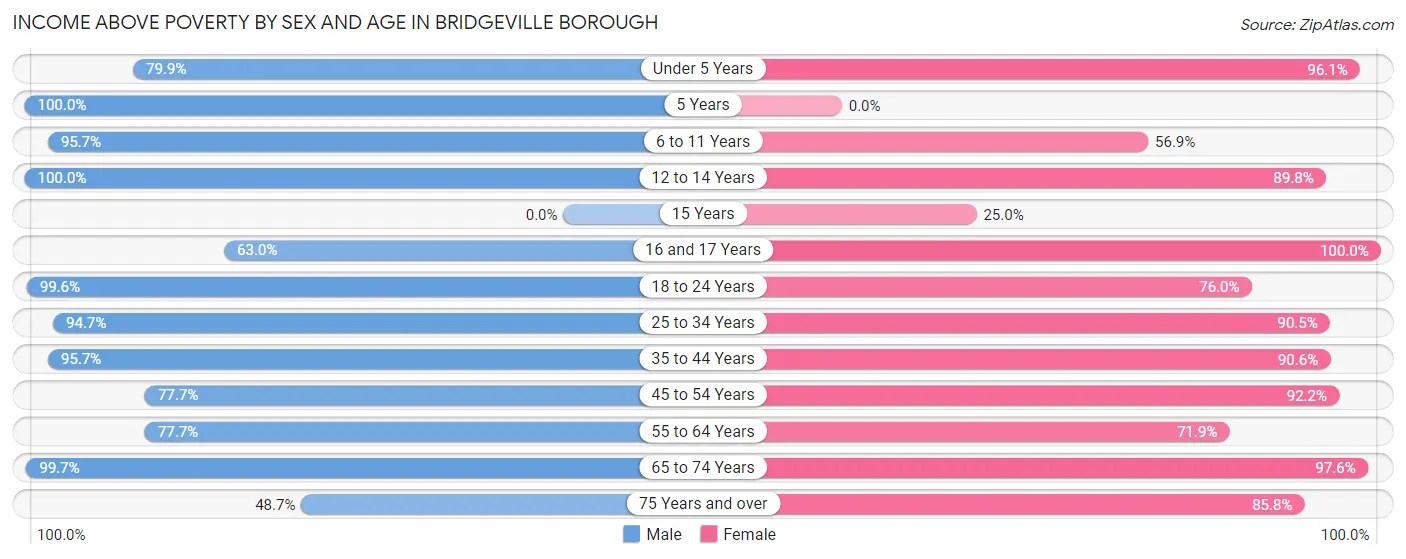
| Age Bracket | Male | Female |
| Under 5 Years | 115 (79.9%) | 123 (96.1%) |
| 5 Years | 30 (100.0%) | 0 (0.0%) |
| 6 to 11 Years | 111 (95.7%) | 29 (56.9%) |
| 12 to 14 Years | 90 (100.0%) | 88 (89.8%) |
| 15 Years | 0 (0.0%) | 3 (25.0%) |
| 16 and 17 Years | 34 (63.0%) | 30 (100.0%) |
| 18 to 24 Years | 237 (99.6%) | 76 (76.0%) |
| 25 to 34 Years | 429 (94.7%) | 296 (90.5%) |
| 35 to 44 Years | 309 (95.7%) | 299 (90.6%) |
| 45 to 54 Years | 198 (77.6%) | 297 (92.2%) |
| 55 to 64 Years | 212 (77.7%) | 215 (71.9%) |
| 65 to 74 Years | 307 (99.7%) | 282 (97.6%) |
| 75 Years and over | 54 (48.6%) | 315 (85.8%) |
| Total | 2,126 (88.5%) | 2,053 (87.3%) |
Income Below Poverty Among Married-Couple Families in Bridgeville borough
The poverty statistics for married-couple families in Bridgeville borough show that 9.7% or 69 of the total 711 families live below the poverty line. Families with no children have the highest poverty rate of 14.0%, comprising of 69 families. On the other hand, families with 1 or 2 children have the lowest poverty rate of 0.0%, which includes 0 families.
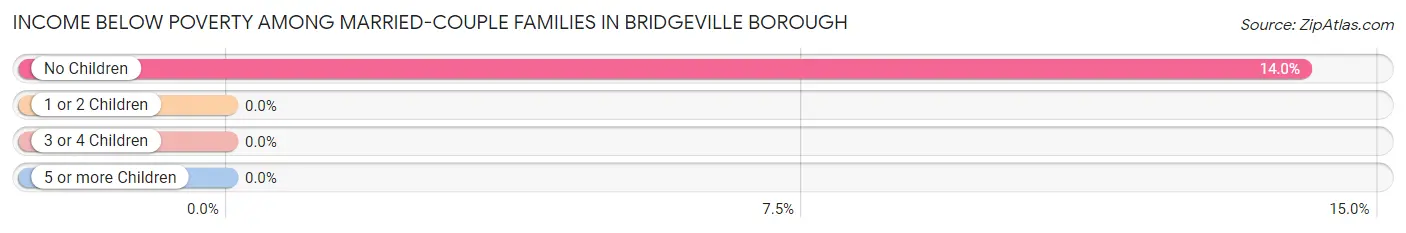
| Children | Above Poverty | Below Poverty |
| No Children | 423 (86.0%) | 69 (14.0%) |
| 1 or 2 Children | 219 (100.0%) | 0 (0.0%) |
| 3 or 4 Children | 0 (0.0%) | 0 (0.0%) |
| 5 or more Children | 0 (0.0%) | 0 (0.0%) |
| Total | 642 (90.3%) | 69 (9.7%) |
Income Below Poverty Among Single-Parent Households in Bridgeville borough
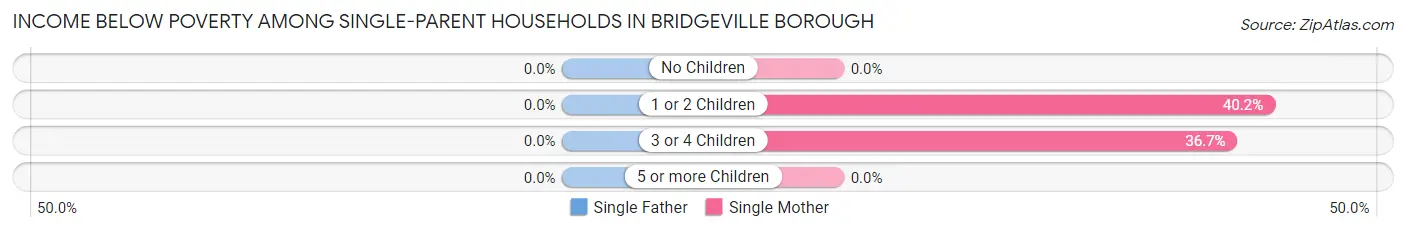
| Children | Single Father | Single Mother |
| No Children | 0 (0.0%) | 0 (0.0%) |
| 1 or 2 Children | 0 (0.0%) | 47 (40.2%) |
| 3 or 4 Children | 0 (0.0%) | 11 (36.7%) |
| 5 or more Children | 0 (0.0%) | 0 (0.0%) |
| Total | 0 (0.0%) | 58 (22.5%) |
Income Below Poverty Among Married-Couple vs Single-Parent Households in Bridgeville borough
The poverty data for Bridgeville borough shows that 69 of the married-couple family households (9.7%) and 58 of the single-parent households (13.6%) are living below the poverty level. Within the married-couple family households, those with no children have the highest poverty rate, with 69 households (14.0%) falling below the poverty line. Among the single-parent households, those with 1 or 2 children have the highest poverty rate, with 47 household (22.3%) living below poverty.
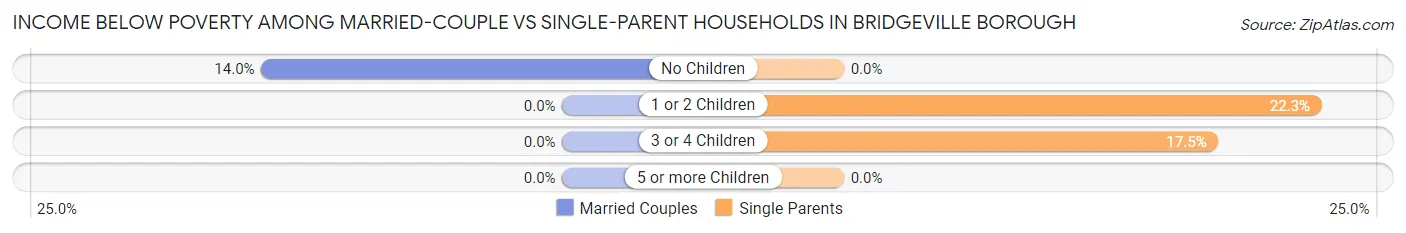
| Children | Married-Couple Families | Single-Parent Households |
| No Children | 69 (14.0%) | 0 (0.0%) |
| 1 or 2 Children | 0 (0.0%) | 47 (22.3%) |
| 3 or 4 Children | 0 (0.0%) | 11 (17.5%) |
| 5 or more Children | 0 (0.0%) | 0 (0.0%) |
| Total | 69 (9.7%) | 58 (13.6%) |
Race in Bridgeville borough
The most populous races in Bridgeville borough are White / Caucasian (4,365 | 91.4%), Black / African American (224 | 4.7%), and Two or more Races (163 | 3.4%).
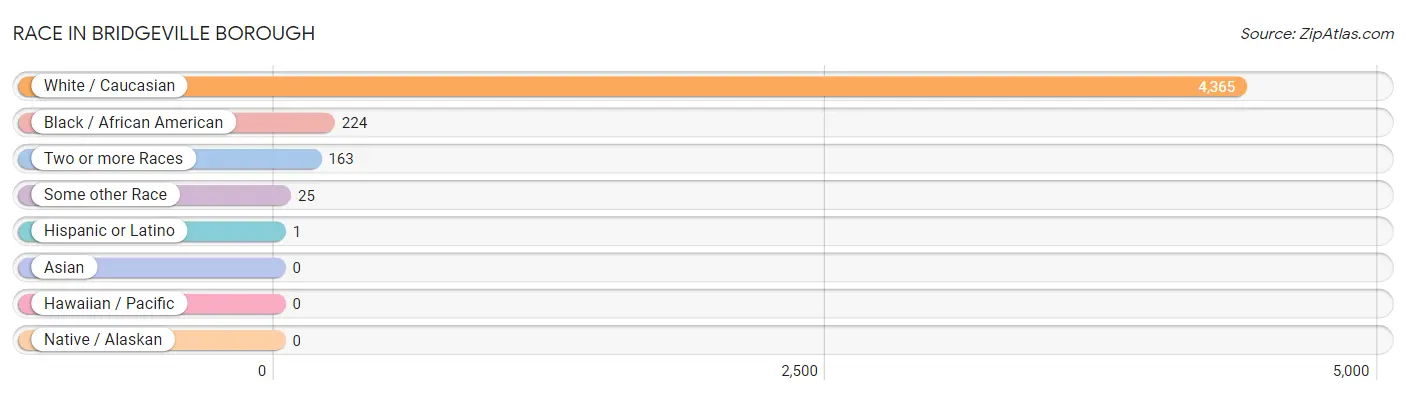
| Race | # Population | % Population |
| Asian | 0 | 0.0% |
| Black / African American | 224 | 4.7% |
| Hawaiian / Pacific | 0 | 0.0% |
| Hispanic or Latino | 1 | 0.0% |
| Native / Alaskan | 0 | 0.0% |
| White / Caucasian | 4,365 | 91.4% |
| Two or more Races | 163 | 3.4% |
| Some other Race | 25 | 0.5% |
| Total | 4,777 | 100.0% |
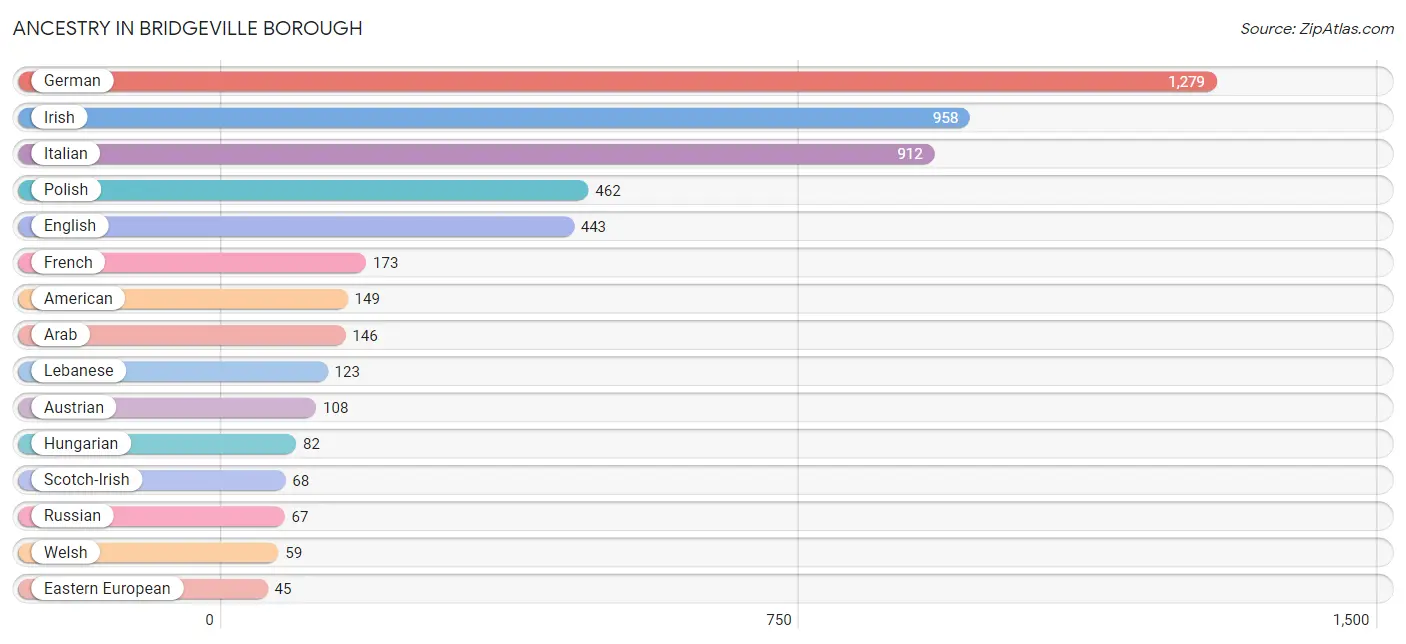
Ancestry in Bridgeville borough
The most populous ancestries reported in Bridgeville borough are German (1,279 | 26.8%), Irish (958 | 20.1%), Italian (912 | 19.1%), Polish (462 | 9.7%), and English (443 | 9.3%), together accounting for 84.9% of all Bridgeville borough residents.
| Ancestry | # Population | % Population |
| American | 149 | 3.1% |
| Apache | 4 | 0.1% |
| Arab | 146 | 3.1% |
| Austrian | 108 | 2.3% |
| Belgian | 8 | 0.2% |
| Blackfeet | 4 | 0.1% |
| British | 44 | 0.9% |
| Bulgarian | 5 | 0.1% |
| Canadian | 25 | 0.5% |
| Cherokee | 7 | 0.2% |
| Croatian | 13 | 0.3% |
| Czechoslovakian | 5 | 0.1% |
| Dutch | 14 | 0.3% |
| Eastern European | 45 | 0.9% |
| English | 443 | 9.3% |
| European | 44 | 0.9% |
| French | 173 | 3.6% |
| German | 1,279 | 26.8% |
| Greek | 29 | 0.6% |
| Hungarian | 82 | 1.7% |
| Irish | 958 | 20.1% |
| Italian | 912 | 19.1% |
| Korean | 6 | 0.1% |
| Lebanese | 123 | 2.6% |
| Lithuanian | 19 | 0.4% |
| Mexican | 1 | 0.0% |
| Norwegian | 18 | 0.4% |
| Polish | 462 | 9.7% |
| Russian | 67 | 1.4% |
| Scotch-Irish | 68 | 1.4% |
| Scottish | 43 | 0.9% |
| Serbian | 13 | 0.3% |
| Slovak | 41 | 0.9% |
| Slovene | 32 | 0.7% |
| Swiss | 30 | 0.6% |
| Syrian | 23 | 0.5% |
| Ukrainian | 40 | 0.8% |
| Welsh | 59 | 1.2% |
| Yugoslavian | 12 | 0.3% | View All 39 Rows |
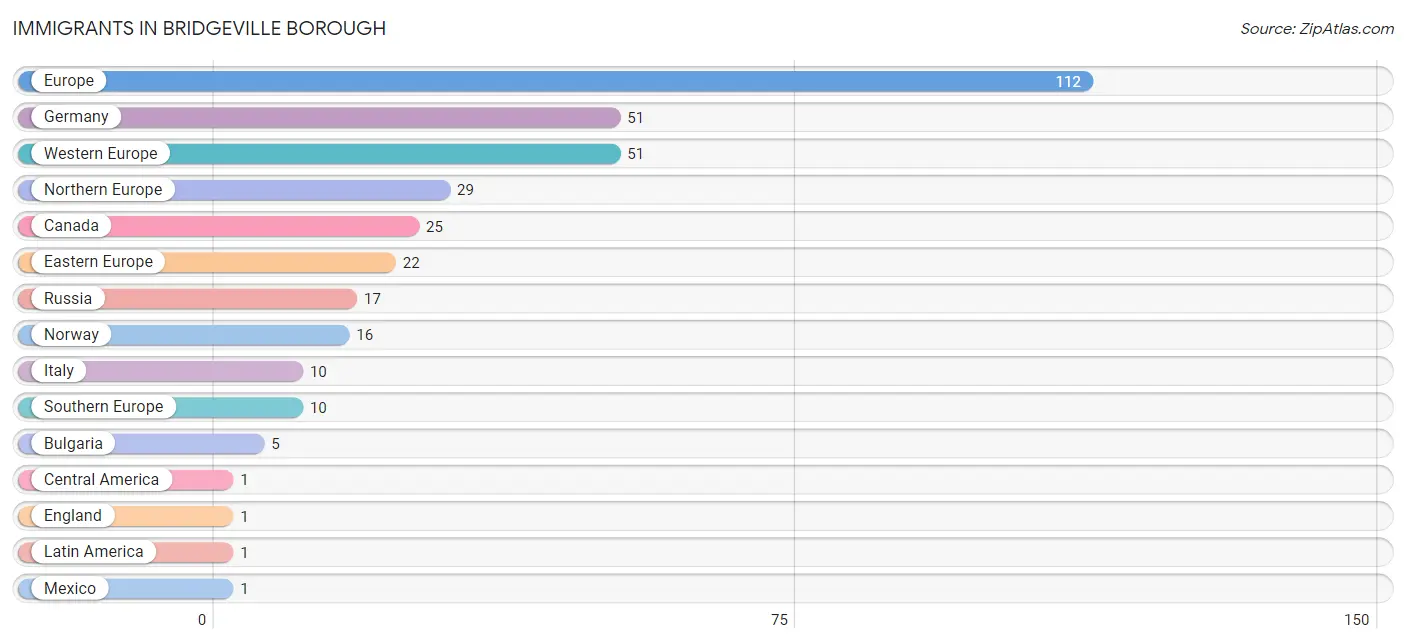
Immigrants in Bridgeville borough
The most numerous immigrant groups reported in Bridgeville borough came from Europe (112 | 2.3%), Germany (51 | 1.1%), Western Europe (51 | 1.1%), Northern Europe (29 | 0.6%), and Canada (25 | 0.5%), together accounting for 5.6% of all Bridgeville borough residents.
| Immigration Origin | # Population | % Population |
| Bulgaria | 5 | 0.1% |
| Canada | 25 | 0.5% |
| Central America | 1 | 0.0% |
| Eastern Europe | 22 | 0.5% |
| England | 1 | 0.0% |
| Europe | 112 | 2.3% |
| Germany | 51 | 1.1% |
| Italy | 10 | 0.2% |
| Latin America | 1 | 0.0% |
| Mexico | 1 | 0.0% |
| Northern Europe | 29 | 0.6% |
| Norway | 16 | 0.3% |
| Russia | 17 | 0.4% |
| Southern Europe | 10 | 0.2% |
| Western Europe | 51 | 1.1% | View All 15 Rows |
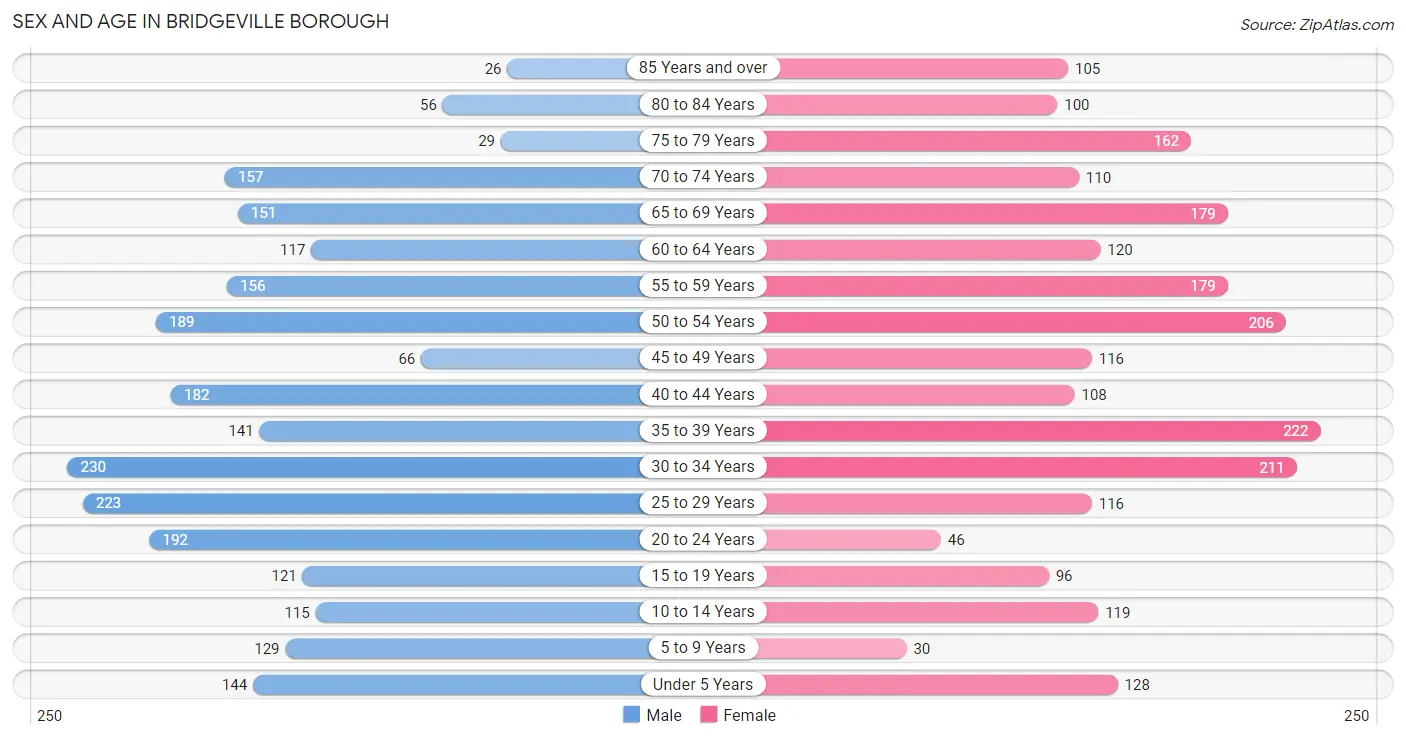
Sex and Age in Bridgeville borough
Sex and Age in Bridgeville borough
The most populous age groups in Bridgeville borough are 30 to 34 Years (230 | 9.5%) for men and 35 to 39 Years (222 | 9.4%) for women.
| Age Bracket | Male | Female |
| Under 5 Years | 144 (5.9%) | 128 (5.4%) |
| 5 to 9 Years | 129 (5.3%) | 30 (1.3%) |
| 10 to 14 Years | 115 (4.7%) | 119 (5.1%) |
| 15 to 19 Years | 121 (5.0%) | 96 (4.1%) |
| 20 to 24 Years | 192 (7.9%) | 46 (1.9%) |
| 25 to 29 Years | 223 (9.2%) | 116 (4.9%) |
| 30 to 34 Years | 230 (9.5%) | 211 (9.0%) |
| 35 to 39 Years | 141 (5.8%) | 222 (9.4%) |
| 40 to 44 Years | 182 (7.5%) | 108 (4.6%) |
| 45 to 49 Years | 66 (2.7%) | 116 (4.9%) |
| 50 to 54 Years | 189 (7.8%) | 206 (8.7%) |
| 55 to 59 Years | 156 (6.4%) | 179 (7.6%) |
| 60 to 64 Years | 117 (4.8%) | 120 (5.1%) |
| 65 to 69 Years | 151 (6.2%) | 179 (7.6%) |
| 70 to 74 Years | 157 (6.5%) | 110 (4.7%) |
| 75 to 79 Years | 29 (1.2%) | 162 (6.9%) |
| 80 to 84 Years | 56 (2.3%) | 100 (4.3%) |
| 85 Years and over | 26 (1.1%) | 105 (4.5%) |
| Total | 2,424 (100.0%) | 2,353 (100.0%) |
Families and Households in Bridgeville borough
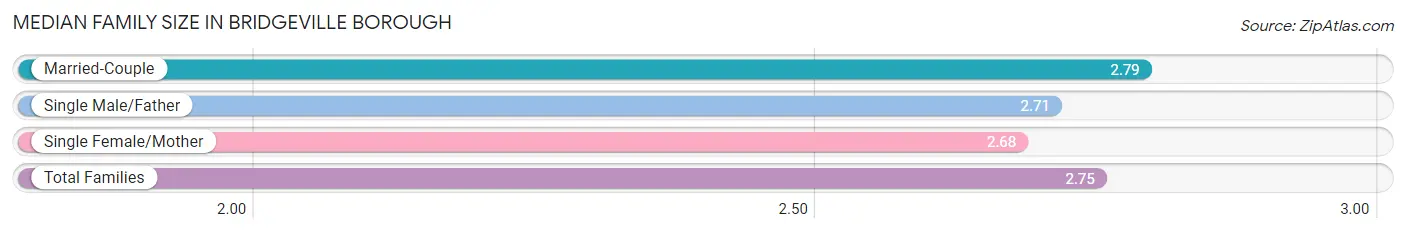
Median Family Size in Bridgeville borough
The median family size in Bridgeville borough is 2.75 persons per family, with married-couple families (711 | 62.5%) accounting for the largest median family size of 2.79 persons per family. On the other hand, single female/mother families (258 | 22.7%) represent the smallest median family size with 2.68 persons per family.
| Family Type | # Families | Family Size |
| Married-Couple | 711 (62.5%) | 2.79 |
| Single Male/Father | 169 (14.8%) | 2.71 |
| Single Female/Mother | 258 (22.7%) | 2.68 |
| Total Families | 1,138 (100.0%) | 2.75 |
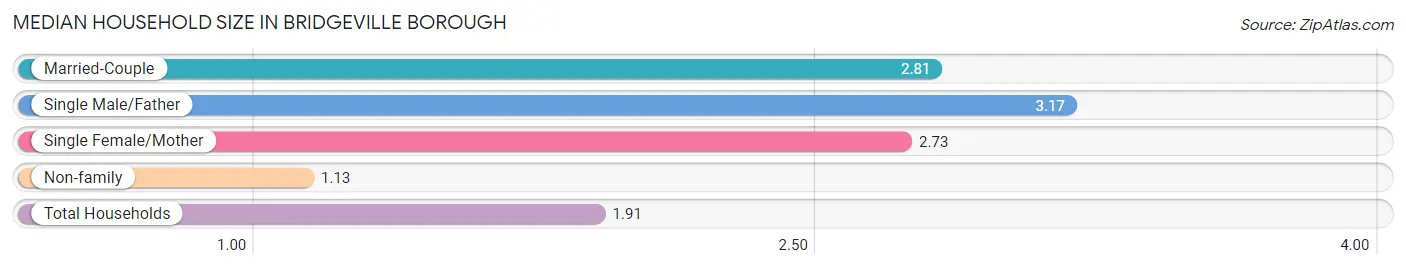
Median Household Size in Bridgeville borough
The median household size in Bridgeville borough is 1.91 persons per household, with single male/father households (169 | 6.8%) accounting for the largest median household size of 3.17 persons per household. non-family households (1,347 | 54.2%) represent the smallest median household size with 1.13 persons per household.
| Household Type | # Households | Household Size |
| Married-Couple | 711 (28.6%) | 2.81 |
| Single Male/Father | 169 (6.8%) | 3.17 |
| Single Female/Mother | 258 (10.4%) | 2.73 |
| Non-family | 1,347 (54.2%) | 1.13 |
| Total Households | 2,485 (100.0%) | 1.91 |
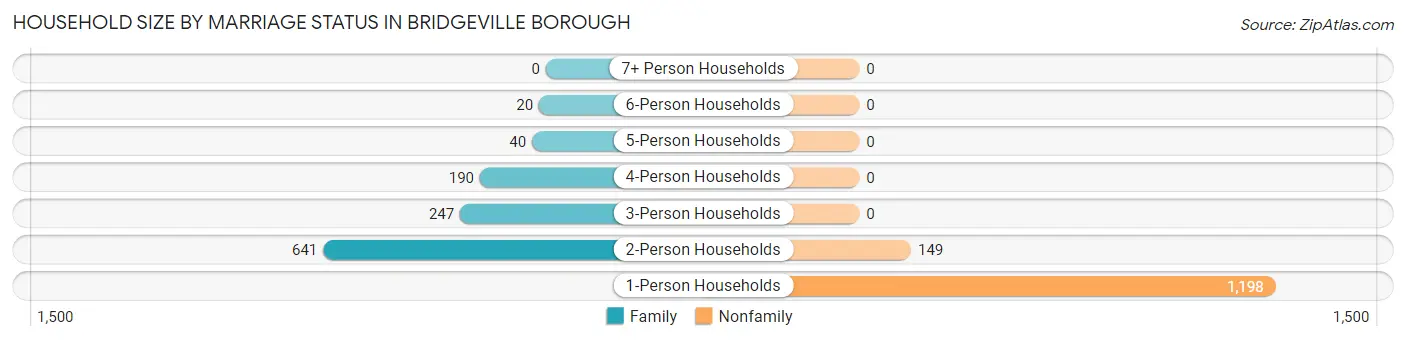
Household Size by Marriage Status in Bridgeville borough
Out of a total of 2,485 households in Bridgeville borough, 1,138 (45.8%) are family households, while 1,347 (54.2%) are nonfamily households. The most numerous type of family households are 2-person households, comprising 641, and the most common type of nonfamily households are 1-person households, comprising 1,198.
| Household Size | Family Households | Nonfamily Households |
| 1-Person Households | - | 1,198 (48.2%) |
| 2-Person Households | 641 (25.8%) | 149 (6.0%) |
| 3-Person Households | 247 (9.9%) | 0 (0.0%) |
| 4-Person Households | 190 (7.6%) | 0 (0.0%) |
| 5-Person Households | 40 (1.6%) | 0 (0.0%) |
| 6-Person Households | 20 (0.8%) | 0 (0.0%) |
| 7+ Person Households | 0 (0.0%) | 0 (0.0%) |
| Total | 1,138 (45.8%) | 1,347 (54.2%) |
Female Fertility in Bridgeville borough
Fertility by Age in Bridgeville borough
Average fertility rate in Bridgeville borough is 57.0 births per 1,000 women. Women in the age bracket of 35 to 50 years have the highest fertility rate with 74.0 births per 1,000 women. Women in the age bracket of 35 to 50 years acount for 65.4% of all women with births.
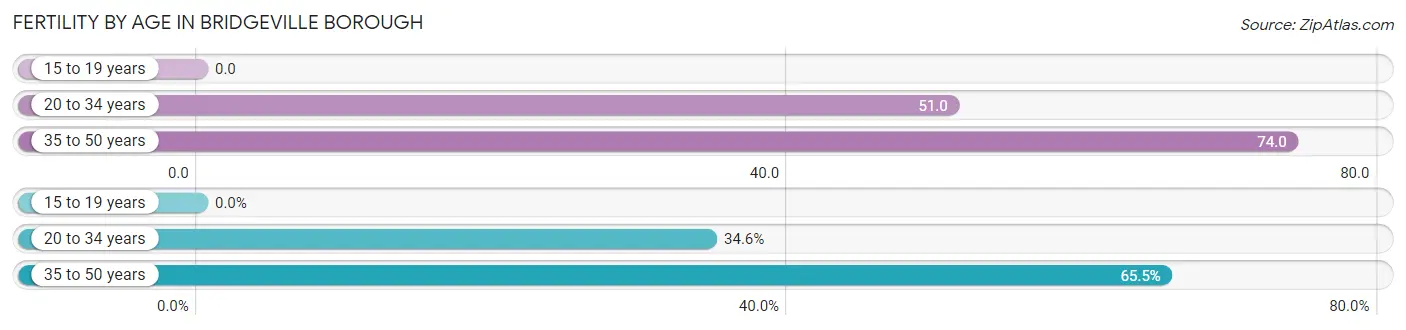
| Age Bracket | Women with Births | Births / 1,000 Women |
| 15 to 19 years | 0 (0.0%) | 0.0 |
| 20 to 34 years | 19 (34.5%) | 51.0 |
| 35 to 50 years | 36 (65.4%) | 74.0 |
| Total | 55 (100.0%) | 57.0 |
Fertility by Age by Marriage Status in Bridgeville borough
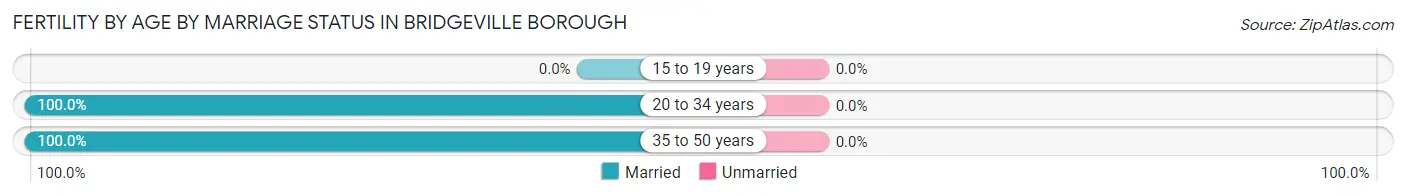
| Age Bracket | Married | Unmarried |
| 15 to 19 years | 0 (0.0%) | 0 (0.0%) |
| 20 to 34 years | 19 (100.0%) | 0 (0.0%) |
| 35 to 50 years | 36 (100.0%) | 0 (0.0%) |
| Total | 55 (100.0%) | 0 (0.0%) |
Fertility by Education in Bridgeville borough
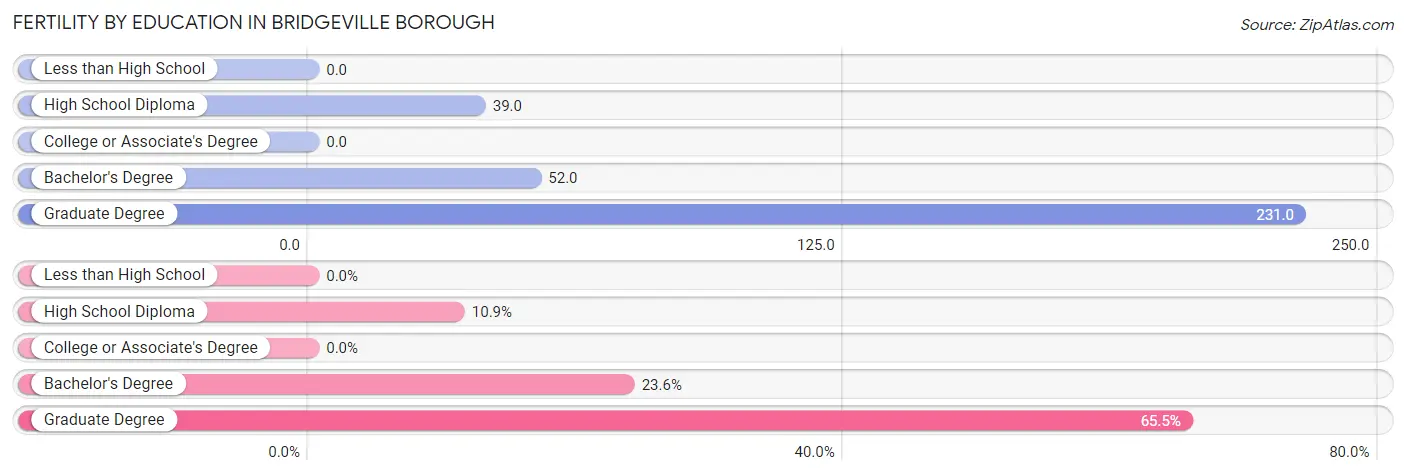
| Educational Attainment | Women with Births | Births / 1,000 Women |
| Less than High School | 0 (0.0%) | 0.0 |
| High School Diploma | 6 (10.9%) | 39.0 |
| College or Associate's Degree | 0 (0.0%) | 0.0 |
| Bachelor's Degree | 13 (23.6%) | 52.0 |
| Graduate Degree | 36 (65.4%) | 231.0 |
| Total | 55 (100.0%) | 57.0 |
Fertility by Education by Marriage Status in Bridgeville borough
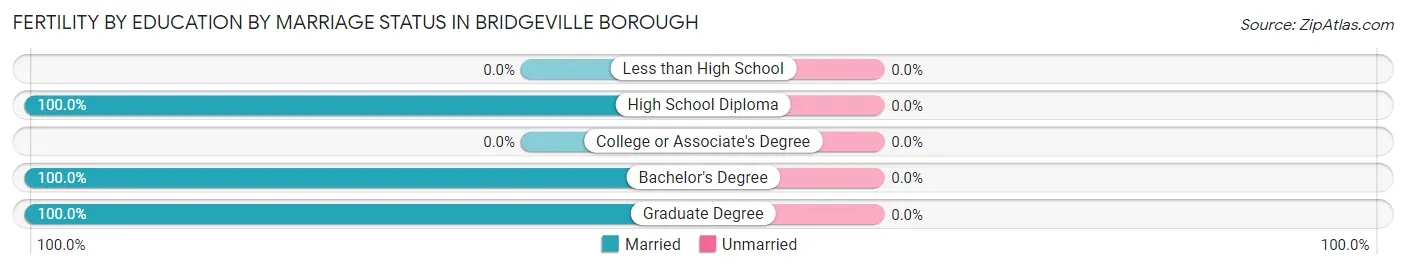
| Educational Attainment | Married | Unmarried |
| Less than High School | 0 (0.0%) | 0 (0.0%) |
| High School Diploma | 6 (100.0%) | 0 (0.0%) |
| College or Associate's Degree | 0 (0.0%) | 0 (0.0%) |
| Bachelor's Degree | 13 (100.0%) | 0 (0.0%) |
| Graduate Degree | 36 (100.0%) | 0 (0.0%) |
| Total | 55 (100.0%) | 0 (0.0%) |
Employment Characteristics in Bridgeville borough
Employment by Class of Employer in Bridgeville borough
Among the 2,490 employed individuals in Bridgeville borough, private company employees (1,885 | 75.7%), not-for-profit organizations (319 | 12.8%), and local government employees (81 | 3.3%) make up the most common classes of employment.
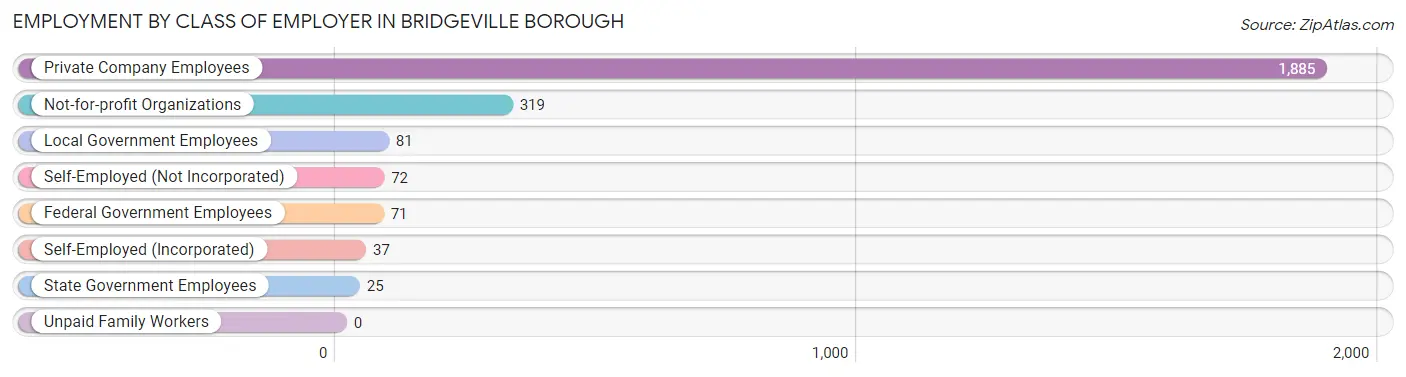
| Employer Class | # Employees | % Employees |
| Private Company Employees | 1,885 | 75.7% |
| Self-Employed (Incorporated) | 37 | 1.5% |
| Self-Employed (Not Incorporated) | 72 | 2.9% |
| Not-for-profit Organizations | 319 | 12.8% |
| Local Government Employees | 81 | 3.3% |
| State Government Employees | 25 | 1.0% |
| Federal Government Employees | 71 | 2.9% |
| Unpaid Family Workers | 0 | 0.0% |
| Total | 2,490 | 100.0% |
Employment Status by Age in Bridgeville borough
According to the labor force statistics for Bridgeville borough, out of the total population over 16 years of age (4,092), 65.9% or 2,697 individuals are in the labor force, with 6.7% or 181 of them unemployed. The age group with the highest labor force participation rate is 30 to 34 years, with 95.7% or 422 individuals in the labor force. Within the labor force, the 35 to 44 years age range has the highest percentage of unemployed individuals, with 20.4% or 124 of them being unemployed.
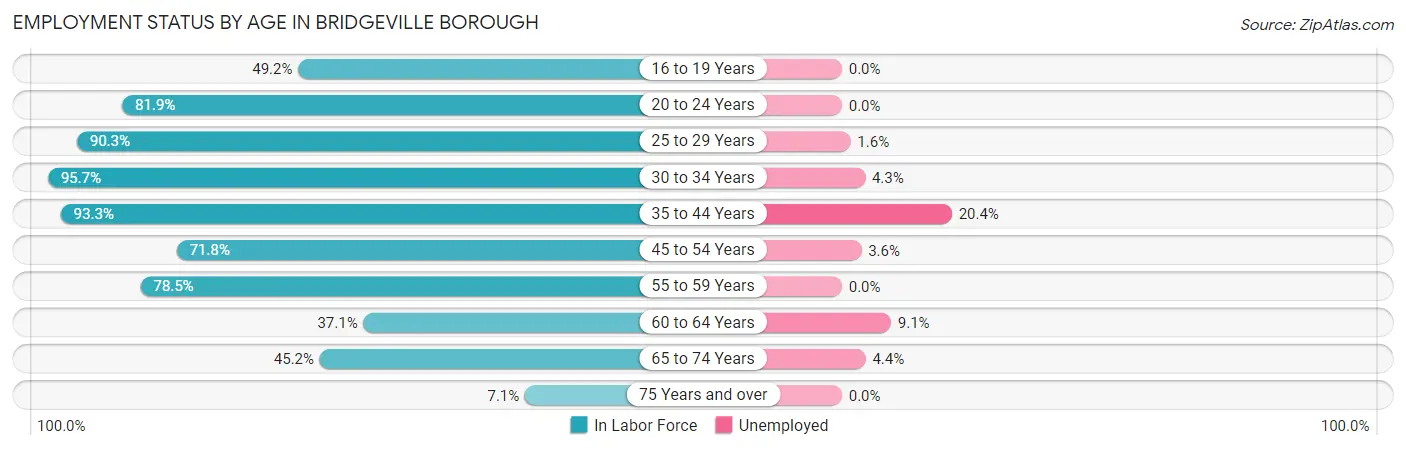
| Age Bracket | In Labor Force | Unemployed |
| 16 to 19 Years | 97 (49.2%) | 0 (0.0%) |
| 20 to 24 Years | 195 (81.9%) | 0 (0.0%) |
| 25 to 29 Years | 306 (90.3%) | 5 (1.6%) |
| 30 to 34 Years | 422 (95.7%) | 18 (4.3%) |
| 35 to 44 Years | 609 (93.3%) | 124 (20.4%) |
| 45 to 54 Years | 414 (71.8%) | 15 (3.6%) |
| 55 to 59 Years | 263 (78.5%) | 0 (0.0%) |
| 60 to 64 Years | 88 (37.1%) | 8 (9.1%) |
| 65 to 74 Years | 270 (45.2%) | 12 (4.4%) |
| 75 Years and over | 34 (7.1%) | 0 (0.0%) |
| Total | 2,697 (65.9%) | 181 (6.7%) |
Employment Status by Educational Attainment in Bridgeville borough
According to labor force statistics for Bridgeville borough, 81.4% of individuals (2,102) out of the total population between 25 and 64 years of age (2,582) are in the labor force, with 8.1% or 170 of them being unemployed. The group with the highest labor force participation rate are those with the educational attainment of bachelor's degree or higher, with 92.2% or 833 individuals in the labor force. Within the labor force, individuals with college / associate degree education have the highest percentage of unemployment, with 18.0% or 116 of them being unemployed.
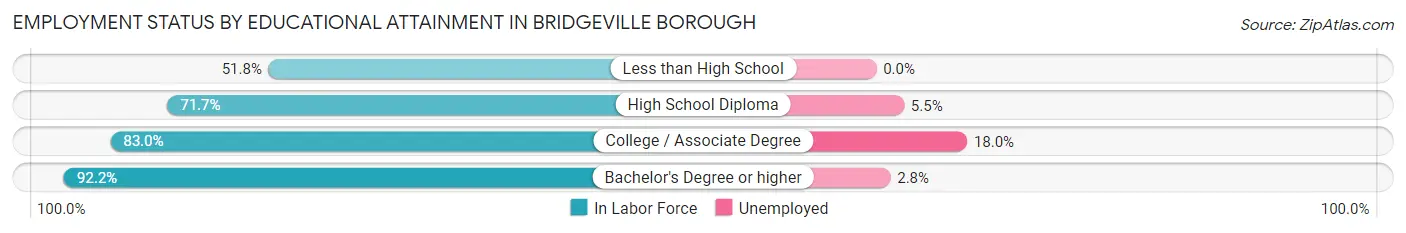
| Educational Attainment | In Labor Force | Unemployed |
| Less than High School | 58 (51.8%) | 0 (0.0%) |
| High School Diploma | 568 (71.7%) | 44 (5.5%) |
| College / Associate Degree | 643 (83.0%) | 140 (18.0%) |
| Bachelor's Degree or higher | 833 (92.2%) | 25 (2.8%) |
| Total | 2,102 (81.4%) | 209 (8.1%) |
Employment Occupations by Sex in Bridgeville borough
Management, Business, Science and Arts Occupations
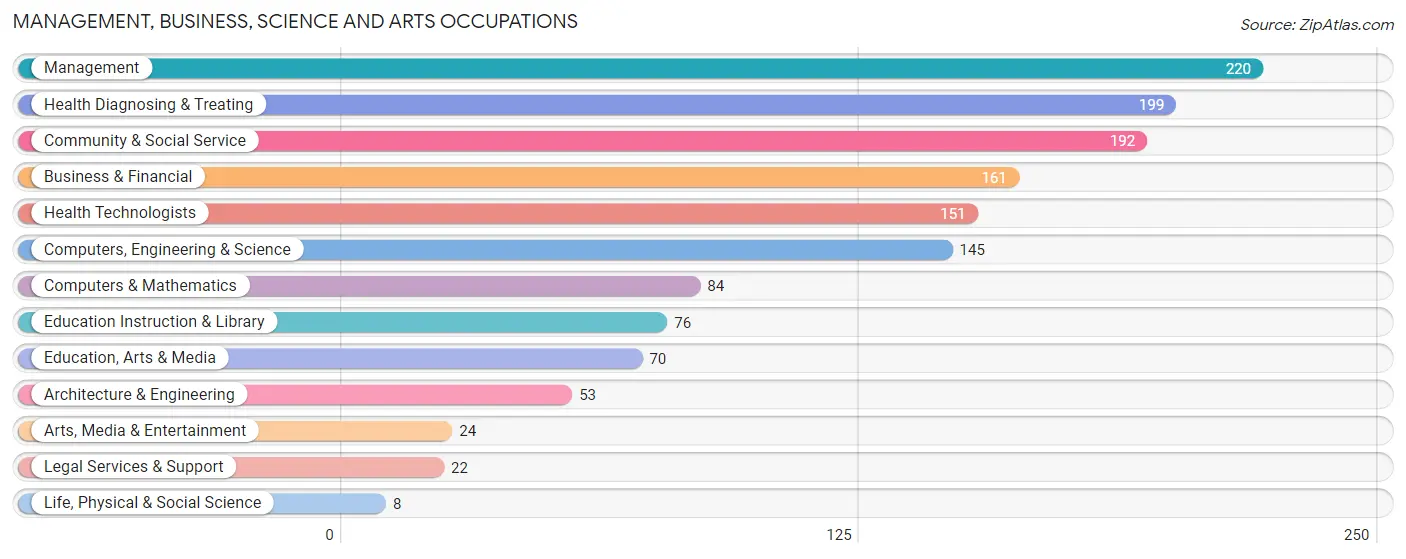
The most common Management, Business, Science and Arts occupations in Bridgeville borough are Management (220 | 8.7%), Health Diagnosing & Treating (199 | 7.9%), Community & Social Service (192 | 7.6%), Business & Financial (161 | 6.4%), and Health Technologists (151 | 6.0%).
Management, Business, Science and Arts Occupations by Sex
Within the Management, Business, Science and Arts occupations in Bridgeville borough, the most male-oriented occupations are Computers & Mathematics (100.0%), Architecture & Engineering (100.0%), and Computers, Engineering & Science (94.5%), while the most female-oriented occupations are Life, Physical & Social Science (100.0%), Education, Arts & Media (77.1%), and Education Instruction & Library (73.7%).
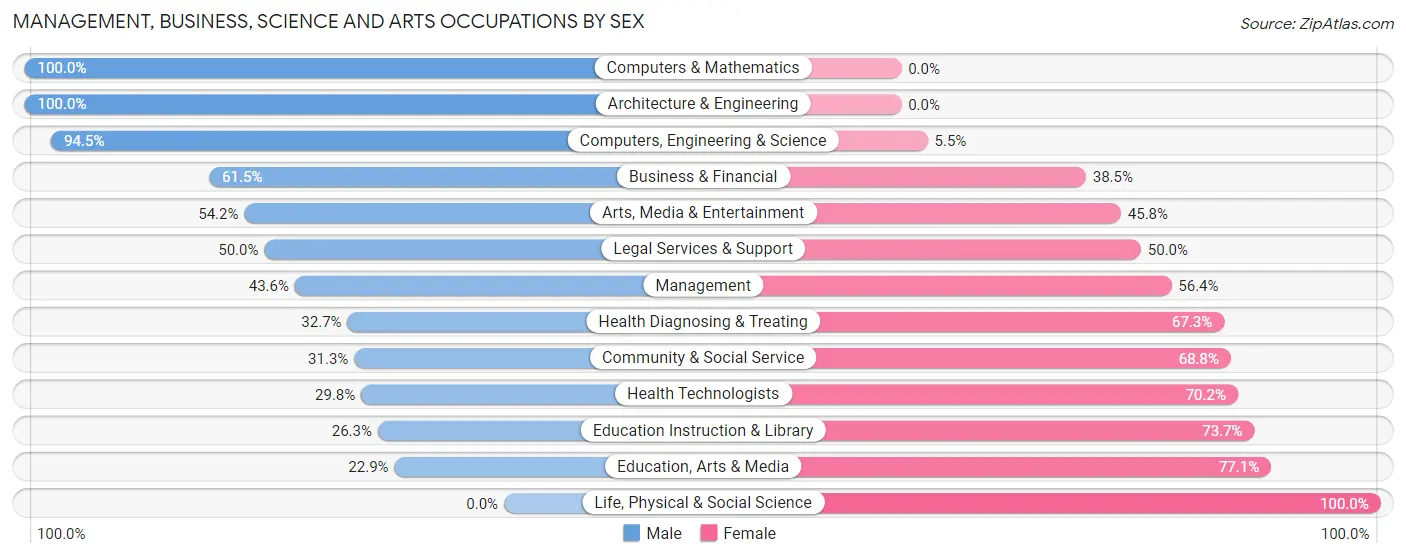
| Occupation | Male | Female |
| Management | 96 (43.6%) | 124 (56.4%) |
| Business & Financial | 99 (61.5%) | 62 (38.5%) |
| Computers, Engineering & Science | 137 (94.5%) | 8 (5.5%) |
| Computers & Mathematics | 84 (100.0%) | 0 (0.0%) |
| Architecture & Engineering | 53 (100.0%) | 0 (0.0%) |
| Life, Physical & Social Science | 0 (0.0%) | 8 (100.0%) |
| Community & Social Service | 60 (31.2%) | 132 (68.8%) |
| Education, Arts & Media | 16 (22.9%) | 54 (77.1%) |
| Legal Services & Support | 11 (50.0%) | 11 (50.0%) |
| Education Instruction & Library | 20 (26.3%) | 56 (73.7%) |
| Arts, Media & Entertainment | 13 (54.2%) | 11 (45.8%) |
| Health Diagnosing & Treating | 65 (32.7%) | 134 (67.3%) |
| Health Technologists | 45 (29.8%) | 106 (70.2%) |
| Total (Category) | 457 (49.8%) | 460 (50.2%) |
| Total (Overall) | 1,288 (51.2%) | 1,228 (48.8%) |
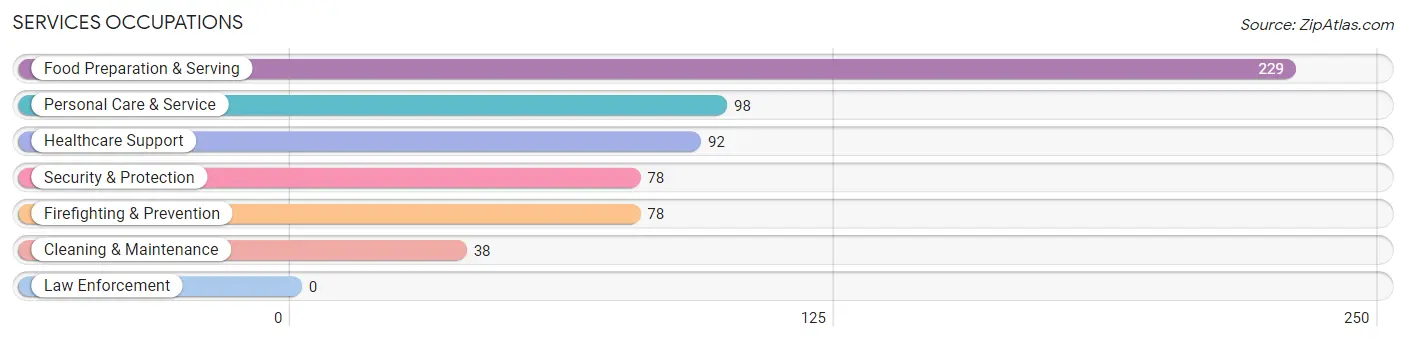
Services Occupations
The most common Services occupations in Bridgeville borough are Food Preparation & Serving (229 | 9.1%), Personal Care & Service (98 | 3.9%), Healthcare Support (92 | 3.7%), Security & Protection (78 | 3.1%), and Firefighting & Prevention (78 | 3.1%).
Services Occupations by Sex
Within the Services occupations in Bridgeville borough, the most male-oriented occupations are Security & Protection (66.7%), Firefighting & Prevention (66.7%), and Food Preparation & Serving (39.7%), while the most female-oriented occupations are Cleaning & Maintenance (100.0%), Healthcare Support (77.2%), and Personal Care & Service (74.5%).
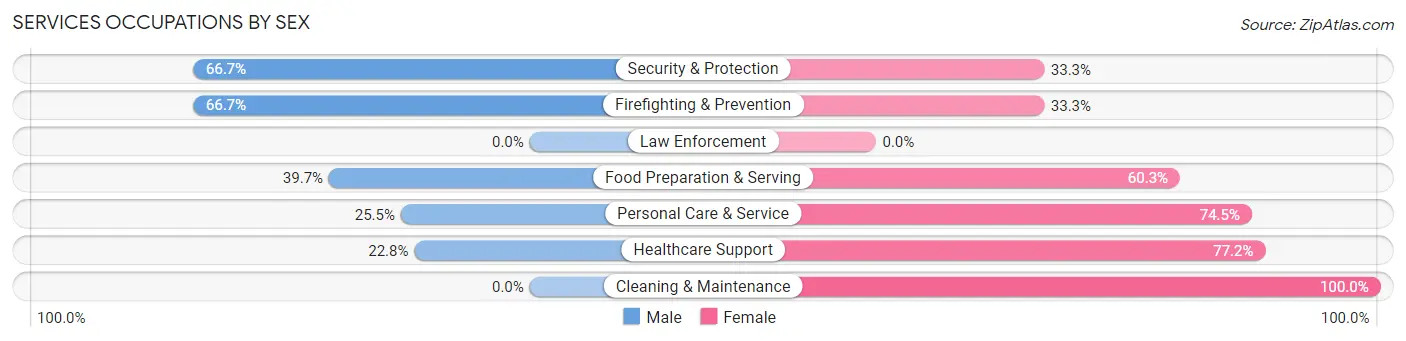
| Occupation | Male | Female |
| Healthcare Support | 21 (22.8%) | 71 (77.2%) |
| Security & Protection | 52 (66.7%) | 26 (33.3%) |
| Firefighting & Prevention | 52 (66.7%) | 26 (33.3%) |
| Law Enforcement | 0 (0.0%) | 0 (0.0%) |
| Food Preparation & Serving | 91 (39.7%) | 138 (60.3%) |
| Cleaning & Maintenance | 0 (0.0%) | 38 (100.0%) |
| Personal Care & Service | 25 (25.5%) | 73 (74.5%) |
| Total (Category) | 189 (35.3%) | 346 (64.7%) |
| Total (Overall) | 1,288 (51.2%) | 1,228 (48.8%) |
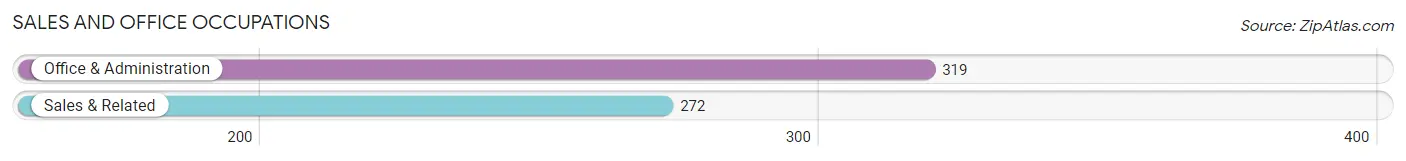
Sales and Office Occupations
The most common Sales and Office occupations in Bridgeville borough are Office & Administration (319 | 12.7%), and Sales & Related (272 | 10.8%).
Sales and Office Occupations by Sex
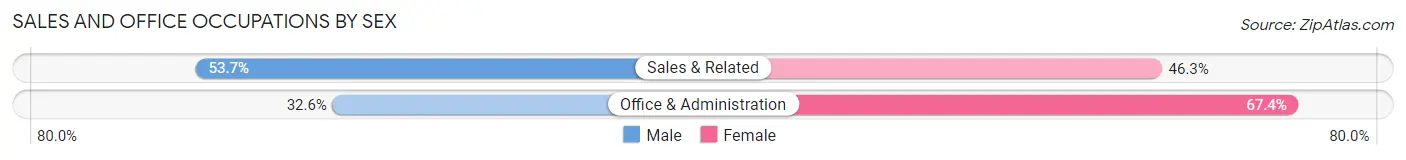
| Occupation | Male | Female |
| Sales & Related | 146 (53.7%) | 126 (46.3%) |
| Office & Administration | 104 (32.6%) | 215 (67.4%) |
| Total (Category) | 250 (42.3%) | 341 (57.7%) |
| Total (Overall) | 1,288 (51.2%) | 1,228 (48.8%) |
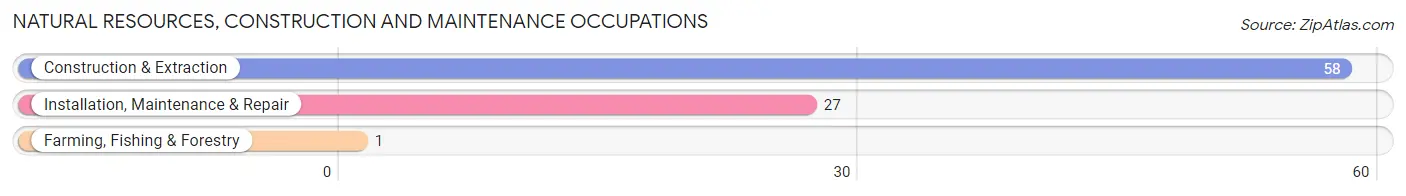
Natural Resources, Construction and Maintenance Occupations
The most common Natural Resources, Construction and Maintenance occupations in Bridgeville borough are Construction & Extraction (58 | 2.3%), Installation, Maintenance & Repair (27 | 1.1%), and Farming, Fishing & Forestry (1 | 0.0%).
Natural Resources, Construction and Maintenance Occupations by Sex
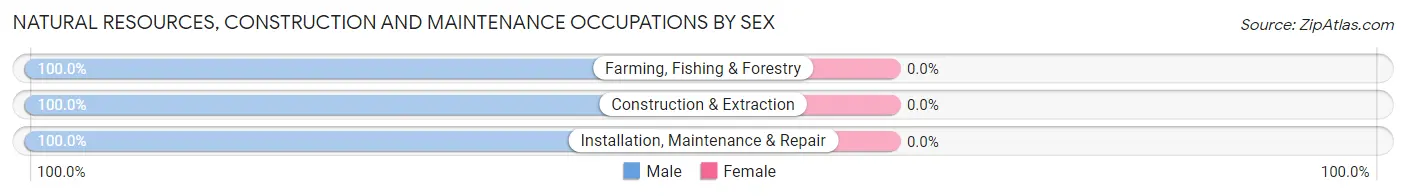
| Occupation | Male | Female |
| Farming, Fishing & Forestry | 1 (100.0%) | 0 (0.0%) |
| Construction & Extraction | 58 (100.0%) | 0 (0.0%) |
| Installation, Maintenance & Repair | 27 (100.0%) | 0 (0.0%) |
| Total (Category) | 86 (100.0%) | 0 (0.0%) |
| Total (Overall) | 1,288 (51.2%) | 1,228 (48.8%) |
Production, Transportation and Moving Occupations
The most common Production, Transportation and Moving occupations in Bridgeville borough are Production (217 | 8.6%), Material Moving (119 | 4.7%), and Transportation (51 | 2.0%).
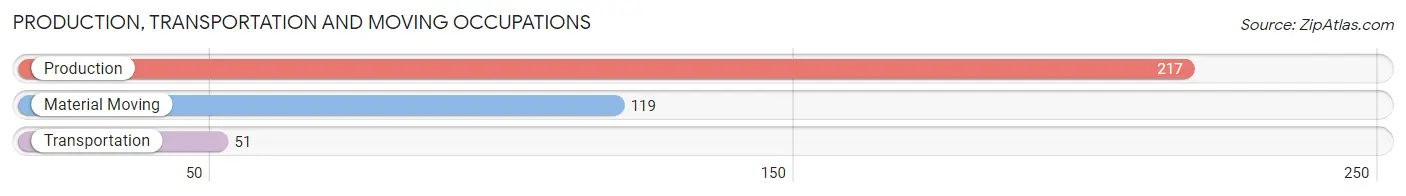
Production, Transportation and Moving Occupations by Sex
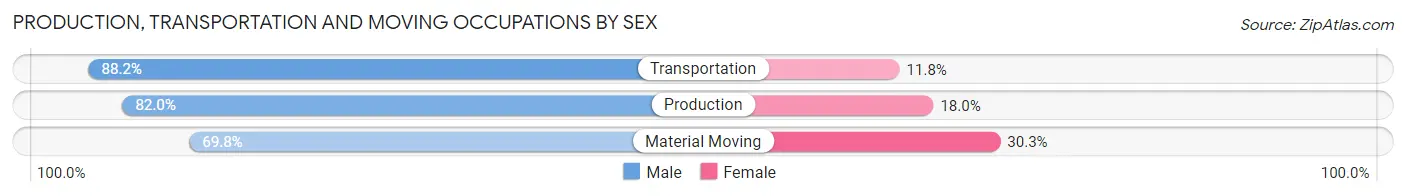
| Occupation | Male | Female |
| Production | 178 (82.0%) | 39 (18.0%) |
| Transportation | 45 (88.2%) | 6 (11.8%) |
| Material Moving | 83 (69.8%) | 36 (30.2%) |
| Total (Category) | 306 (79.1%) | 81 (20.9%) |
| Total (Overall) | 1,288 (51.2%) | 1,228 (48.8%) |
Employment Industries by Sex in Bridgeville borough
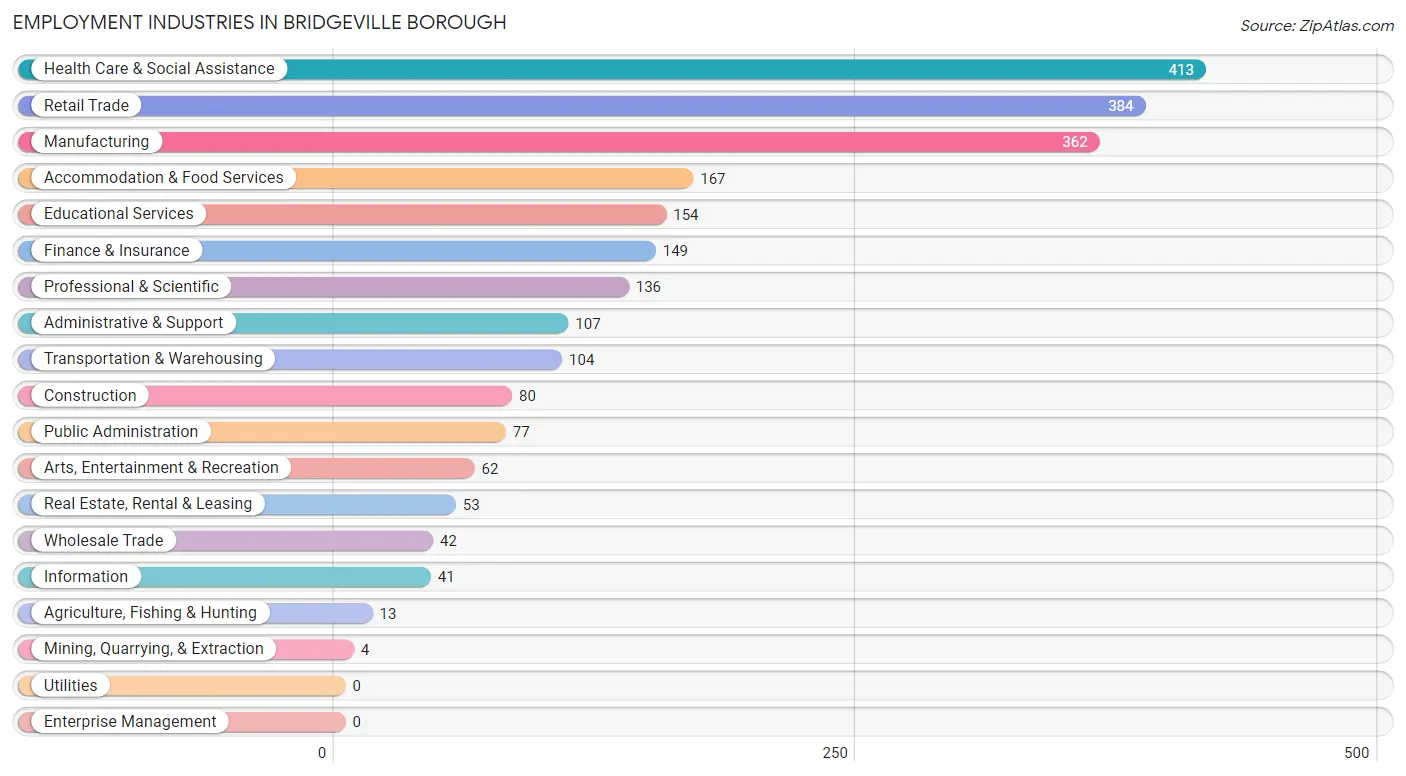
Employment Industries in Bridgeville borough
The major employment industries in Bridgeville borough include Health Care & Social Assistance (413 | 16.4%), Retail Trade (384 | 15.3%), Manufacturing (362 | 14.4%), Accommodation & Food Services (167 | 6.6%), and Educational Services (154 | 6.1%).
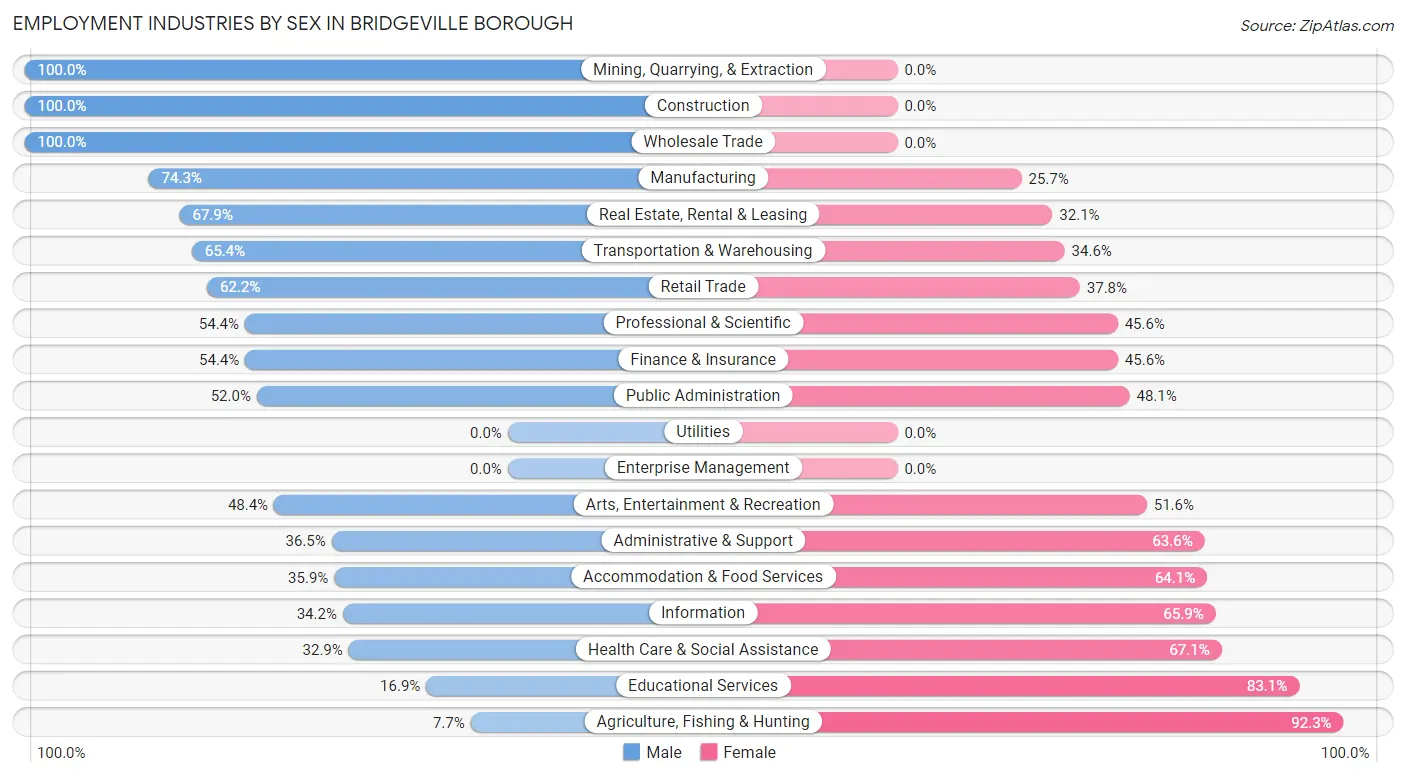
Employment Industries by Sex in Bridgeville borough
The Bridgeville borough industries that see more men than women are Mining, Quarrying, & Extraction (100.0%), Construction (100.0%), and Wholesale Trade (100.0%), whereas the industries that tend to have a higher number of women are Agriculture, Fishing & Hunting (92.3%), Educational Services (83.1%), and Health Care & Social Assistance (67.1%).
| Industry | Male | Female |
| Agriculture, Fishing & Hunting | 1 (7.7%) | 12 (92.3%) |
| Mining, Quarrying, & Extraction | 4 (100.0%) | 0 (0.0%) |
| Construction | 80 (100.0%) | 0 (0.0%) |
| Manufacturing | 269 (74.3%) | 93 (25.7%) |
| Wholesale Trade | 42 (100.0%) | 0 (0.0%) |
| Retail Trade | 239 (62.2%) | 145 (37.8%) |
| Transportation & Warehousing | 68 (65.4%) | 36 (34.6%) |
| Utilities | 0 (0.0%) | 0 (0.0%) |
| Information | 14 (34.2%) | 27 (65.8%) |
| Finance & Insurance | 81 (54.4%) | 68 (45.6%) |
| Real Estate, Rental & Leasing | 36 (67.9%) | 17 (32.1%) |
| Professional & Scientific | 74 (54.4%) | 62 (45.6%) |
| Enterprise Management | 0 (0.0%) | 0 (0.0%) |
| Administrative & Support | 39 (36.4%) | 68 (63.5%) |
| Educational Services | 26 (16.9%) | 128 (83.1%) |
| Health Care & Social Assistance | 136 (32.9%) | 277 (67.1%) |
| Arts, Entertainment & Recreation | 30 (48.4%) | 32 (51.6%) |
| Accommodation & Food Services | 60 (35.9%) | 107 (64.1%) |
| Public Administration | 40 (51.9%) | 37 (48.0%) |
| Total | 1,288 (51.2%) | 1,228 (48.8%) |
Education in Bridgeville borough
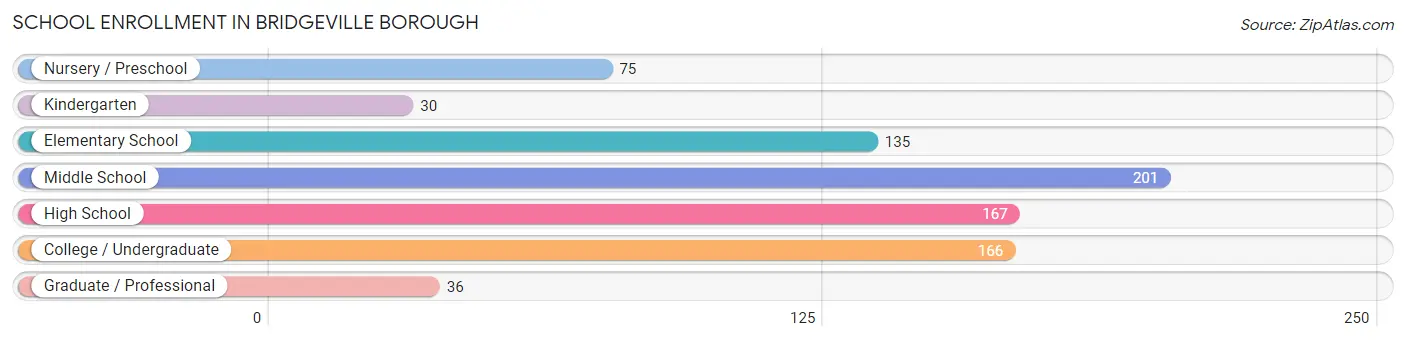
School Enrollment in Bridgeville borough
The most common levels of schooling among the 810 students in Bridgeville borough are middle school (201 | 24.8%), high school (167 | 20.6%), and college / undergraduate (166 | 20.5%).
| School Level | # Students | % Students |
| Nursery / Preschool | 75 | 9.3% |
| Kindergarten | 30 | 3.7% |
| Elementary School | 135 | 16.7% |
| Middle School | 201 | 24.8% |
| High School | 167 | 20.6% |
| College / Undergraduate | 166 | 20.5% |
| Graduate / Professional | 36 | 4.4% |
| Total | 810 | 100.0% |
School Enrollment by Age by Funding Source in Bridgeville borough
Out of a total of 810 students who are enrolled in schools in Bridgeville borough, 201 (24.8%) attend a private institution, while the remaining 609 (75.2%) are enrolled in public schools. The age group of 20 to 24 year olds has the highest likelihood of being enrolled in private schools, with 58 (65.9% in the age bracket) enrolled. Conversely, the age group of 10 to 14 year olds has the lowest likelihood of being enrolled in a private school, with 224 (100.0% in the age bracket) attending a public institution.
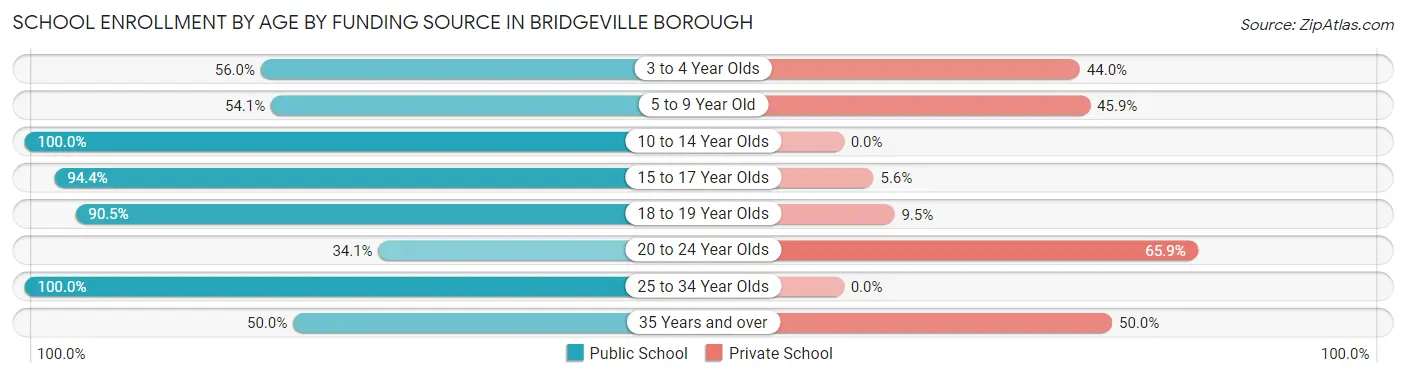
| Age Bracket | Public School | Private School |
| 3 to 4 Year Olds | 42 (56.0%) | 33 (44.0%) |
| 5 to 9 Year Old | 86 (54.1%) | 73 (45.9%) |
| 10 to 14 Year Olds | 224 (100.0%) | 0 (0.0%) |
| 15 to 17 Year Olds | 102 (94.4%) | 6 (5.6%) |
| 18 to 19 Year Olds | 67 (90.5%) | 7 (9.5%) |
| 20 to 24 Year Olds | 30 (34.1%) | 58 (65.9%) |
| 25 to 34 Year Olds | 34 (100.0%) | 0 (0.0%) |
| 35 Years and over | 24 (50.0%) | 24 (50.0%) |
| Total | 609 (75.2%) | 201 (24.8%) |
Educational Attainment by Field of Study in Bridgeville borough
Business (278 | 24.1%), science & technology (133 | 11.5%), social sciences (105 | 9.1%), education (100 | 8.7%), and engineering (89 | 7.7%) are the most common fields of study among 1,154 individuals in Bridgeville borough who have obtained a bachelor's degree or higher.
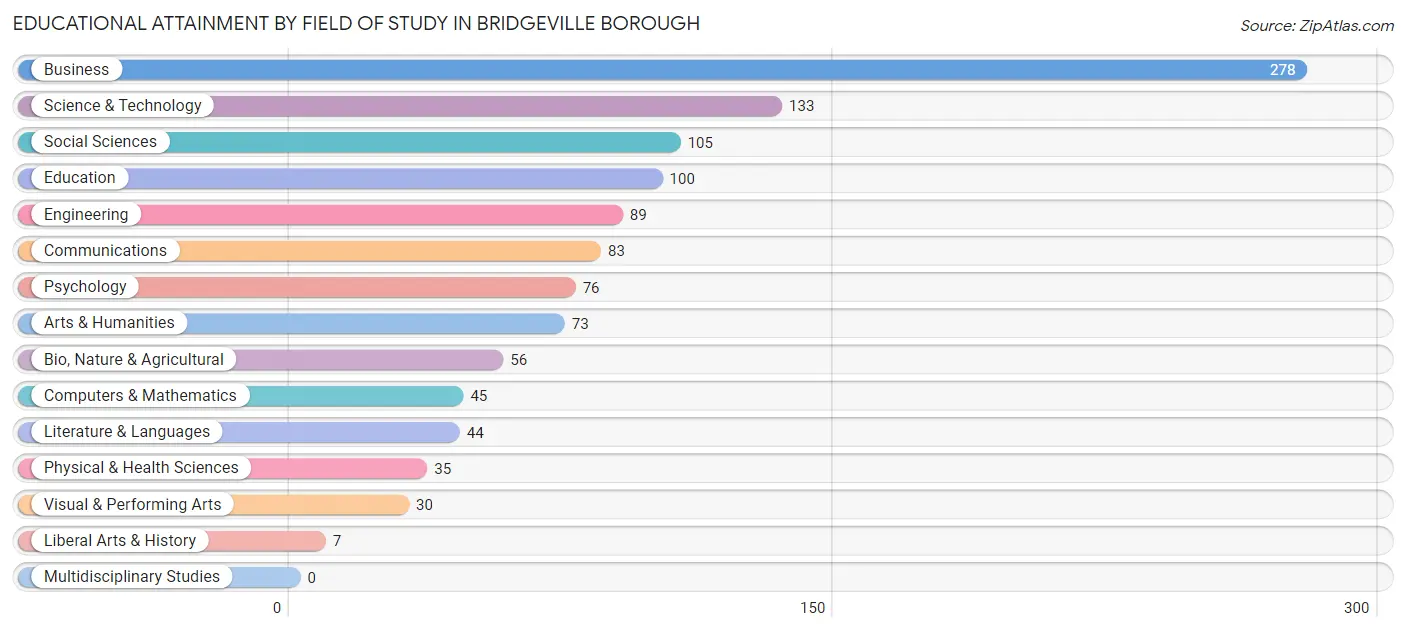
| Field of Study | # Graduates | % Graduates |
| Computers & Mathematics | 45 | 3.9% |
| Bio, Nature & Agricultural | 56 | 4.9% |
| Physical & Health Sciences | 35 | 3.0% |
| Psychology | 76 | 6.6% |
| Social Sciences | 105 | 9.1% |
| Engineering | 89 | 7.7% |
| Multidisciplinary Studies | 0 | 0.0% |
| Science & Technology | 133 | 11.5% |
| Business | 278 | 24.1% |
| Education | 100 | 8.7% |
| Literature & Languages | 44 | 3.8% |
| Liberal Arts & History | 7 | 0.6% |
| Visual & Performing Arts | 30 | 2.6% |
| Communications | 83 | 7.2% |
| Arts & Humanities | 73 | 6.3% |
| Total | 1,154 | 100.0% |
Transportation & Commute in Bridgeville borough
Vehicle Availability by Sex in Bridgeville borough
The most prevalent vehicle ownership categories in Bridgeville borough are males with 2 vehicles (460, accounting for 35.8%) and females with 2 vehicles (518, making up 38.3%).
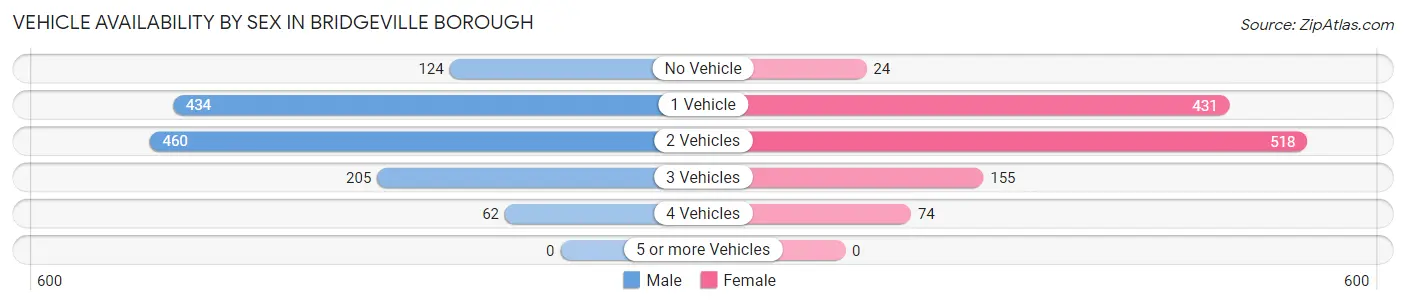
| Vehicles Available | Male | Female |
| No Vehicle | 124 (9.7%) | 24 (2.0%) |
| 1 Vehicle | 434 (33.8%) | 431 (35.9%) |
| 2 Vehicles | 460 (35.8%) | 518 (43.1%) |
| 3 Vehicles | 205 (16.0%) | 155 (12.9%) |
| 4 Vehicles | 62 (4.8%) | 74 (6.2%) |
| 5 or more Vehicles | 0 (0.0%) | 0 (0.0%) |
| Total | 1,285 (100.0%) | 1,202 (100.0%) |
Commute Time in Bridgeville borough
The most frequently occuring commute durations in Bridgeville borough are 20 to 24 minutes (510 commuters, 24.0%), 15 to 19 minutes (373 commuters, 17.5%), and 5 to 9 minutes (254 commuters, 11.9%).
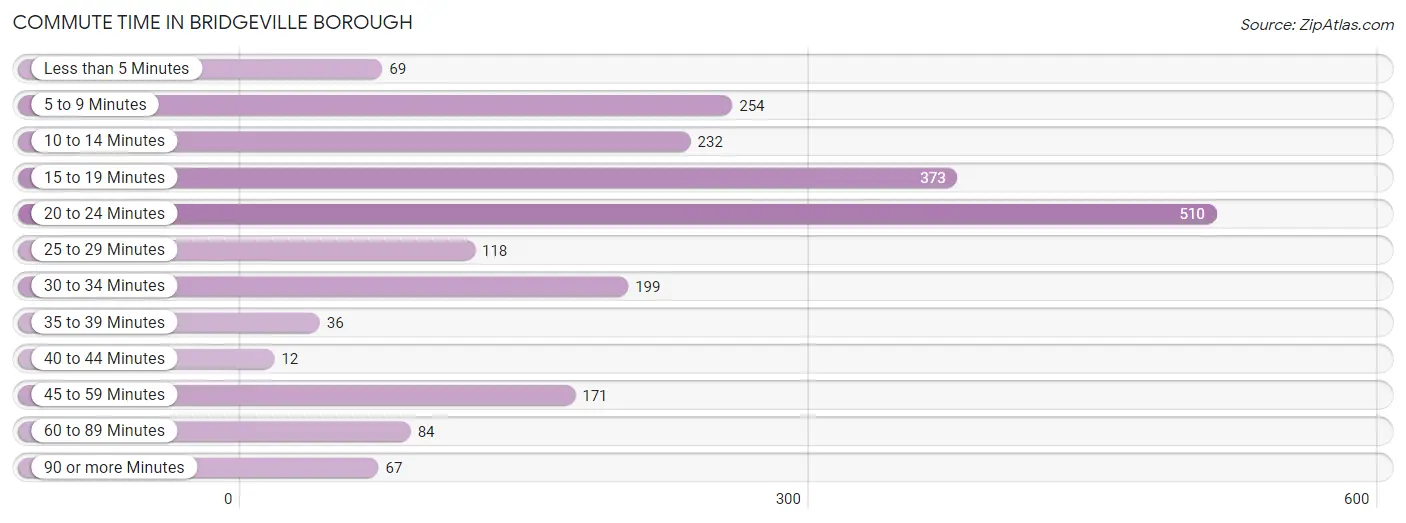
| Commute Time | # Commuters | % Commuters |
| Less than 5 Minutes | 69 | 3.3% |
| 5 to 9 Minutes | 254 | 11.9% |
| 10 to 14 Minutes | 232 | 10.9% |
| 15 to 19 Minutes | 373 | 17.5% |
| 20 to 24 Minutes | 510 | 24.0% |
| 25 to 29 Minutes | 118 | 5.6% |
| 30 to 34 Minutes | 199 | 9.4% |
| 35 to 39 Minutes | 36 | 1.7% |
| 40 to 44 Minutes | 12 | 0.6% |
| 45 to 59 Minutes | 171 | 8.1% |
| 60 to 89 Minutes | 84 | 4.0% |
| 90 or more Minutes | 67 | 3.2% |
Commute Time by Sex in Bridgeville borough
The most common commute times in Bridgeville borough are 20 to 24 minutes (285 commuters, 23.4%) for males and 20 to 24 minutes (225 commuters, 24.7%) for females.
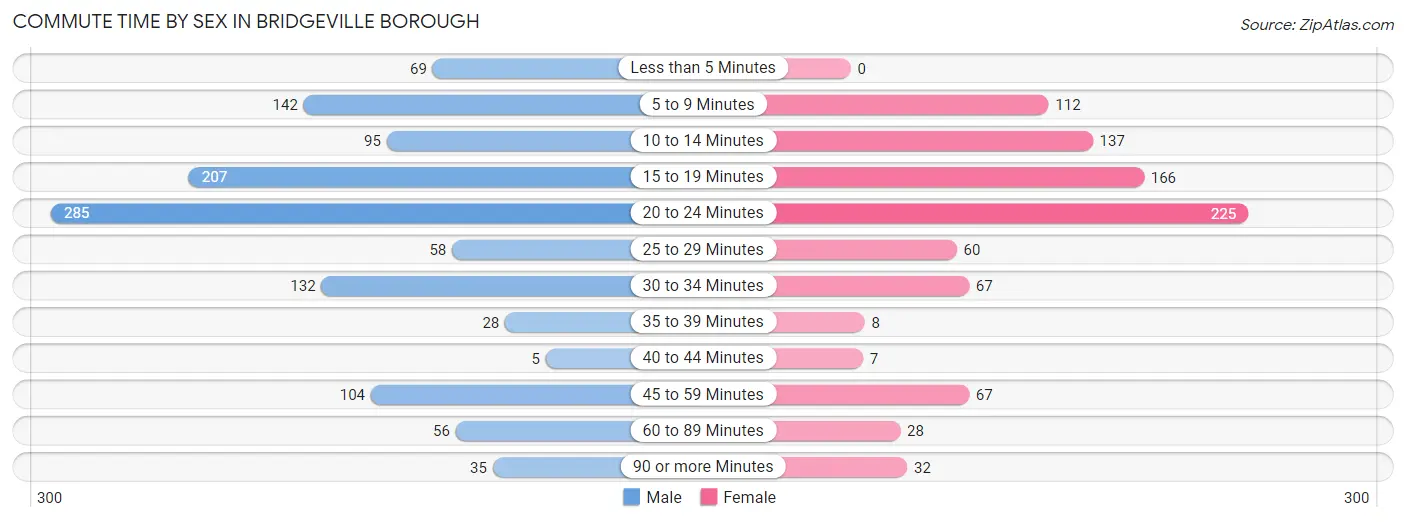
| Commute Time | Male | Female |
| Less than 5 Minutes | 69 (5.7%) | 0 (0.0%) |
| 5 to 9 Minutes | 142 (11.7%) | 112 (12.3%) |
| 10 to 14 Minutes | 95 (7.8%) | 137 (15.1%) |
| 15 to 19 Minutes | 207 (17.0%) | 166 (18.3%) |
| 20 to 24 Minutes | 285 (23.4%) | 225 (24.7%) |
| 25 to 29 Minutes | 58 (4.8%) | 60 (6.6%) |
| 30 to 34 Minutes | 132 (10.9%) | 67 (7.4%) |
| 35 to 39 Minutes | 28 (2.3%) | 8 (0.9%) |
| 40 to 44 Minutes | 5 (0.4%) | 7 (0.8%) |
| 45 to 59 Minutes | 104 (8.6%) | 67 (7.4%) |
| 60 to 89 Minutes | 56 (4.6%) | 28 (3.1%) |
| 90 or more Minutes | 35 (2.9%) | 32 (3.5%) |
Time of Departure to Work by Sex in Bridgeville borough
The most frequent times of departure to work in Bridgeville borough are 7:30 AM to 7:59 AM (232, 19.1%) for males and 9:00 AM to 9:59 AM (147, 16.2%) for females.
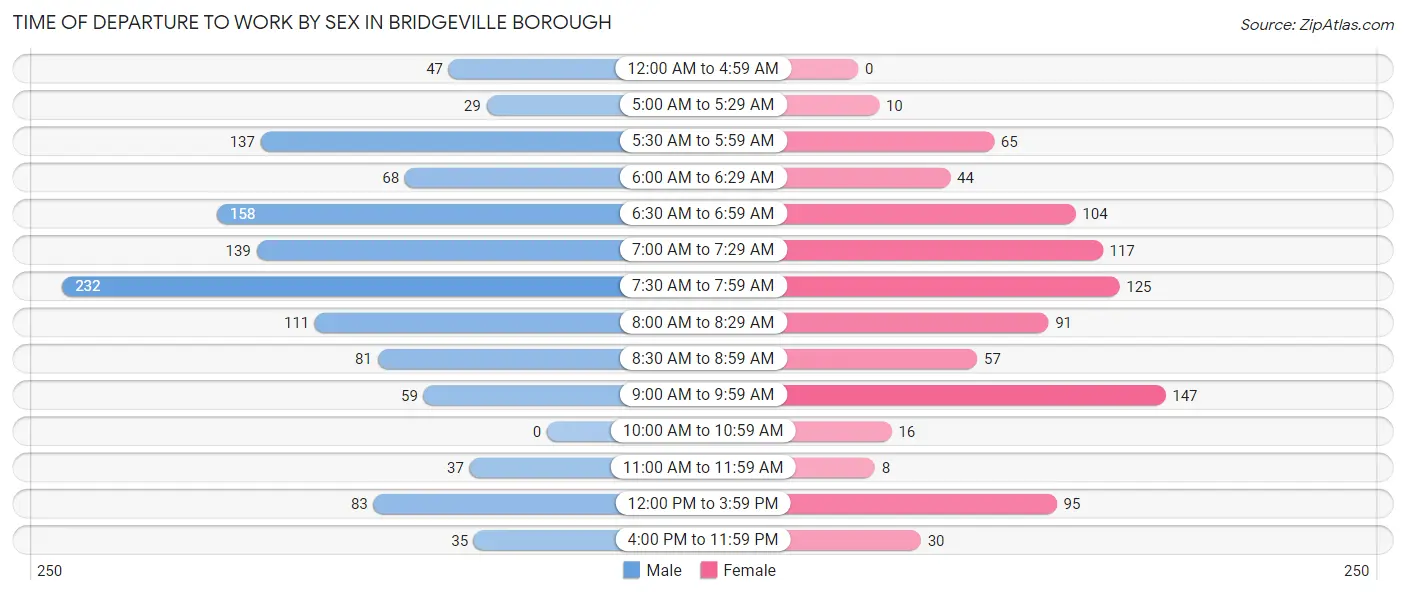
| Time of Departure | Male | Female |
| 12:00 AM to 4:59 AM | 47 (3.9%) | 0 (0.0%) |
| 5:00 AM to 5:29 AM | 29 (2.4%) | 10 (1.1%) |
| 5:30 AM to 5:59 AM | 137 (11.3%) | 65 (7.1%) |
| 6:00 AM to 6:29 AM | 68 (5.6%) | 44 (4.8%) |
| 6:30 AM to 6:59 AM | 158 (13.0%) | 104 (11.4%) |
| 7:00 AM to 7:29 AM | 139 (11.4%) | 117 (12.9%) |
| 7:30 AM to 7:59 AM | 232 (19.1%) | 125 (13.8%) |
| 8:00 AM to 8:29 AM | 111 (9.1%) | 91 (10.0%) |
| 8:30 AM to 8:59 AM | 81 (6.7%) | 57 (6.3%) |
| 9:00 AM to 9:59 AM | 59 (4.9%) | 147 (16.2%) |
| 10:00 AM to 10:59 AM | 0 (0.0%) | 16 (1.8%) |
| 11:00 AM to 11:59 AM | 37 (3.0%) | 8 (0.9%) |
| 12:00 PM to 3:59 PM | 83 (6.8%) | 95 (10.4%) |
| 4:00 PM to 11:59 PM | 35 (2.9%) | 30 (3.3%) |
| Total | 1,216 (100.0%) | 909 (100.0%) |
Housing Occupancy in Bridgeville borough
Occupancy by Ownership in Bridgeville borough
Of the total 2,485 dwellings in Bridgeville borough, owner-occupied units account for 1,502 (60.4%), while renter-occupied units make up 983 (39.6%).
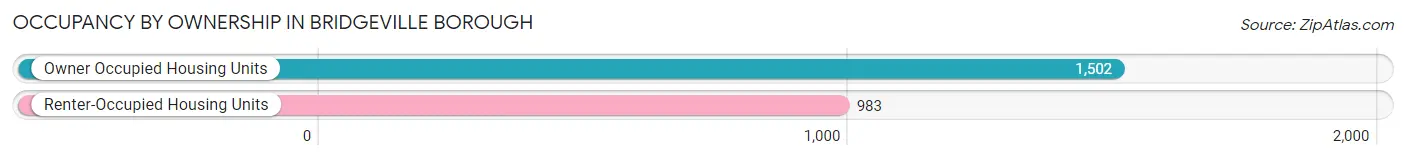
| Occupancy | # Housing Units | % Housing Units |
| Owner Occupied Housing Units | 1,502 | 60.4% |
| Renter-Occupied Housing Units | 983 | 39.6% |
| Total Occupied Housing Units | 2,485 | 100.0% |
Occupancy by Household Size in Bridgeville borough
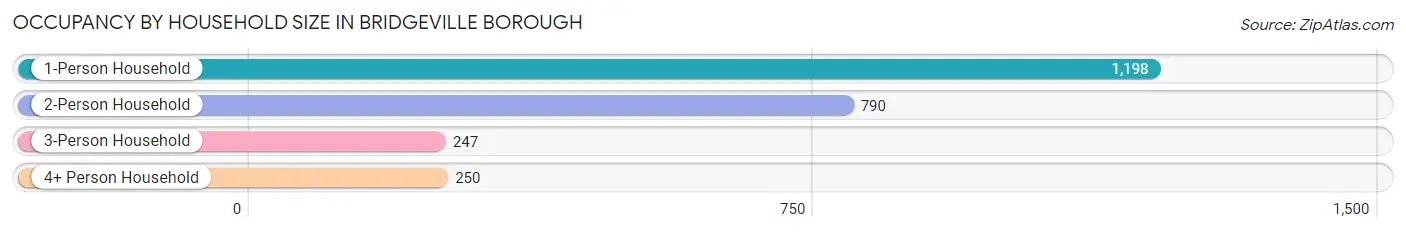
| Household Size | # Housing Units | % Housing Units |
| 1-Person Household | 1,198 | 48.2% |
| 2-Person Household | 790 | 31.8% |
| 3-Person Household | 247 | 9.9% |
| 4+ Person Household | 250 | 10.1% |
| Total Housing Units | 2,485 | 100.0% |
Occupancy by Ownership by Household Size in Bridgeville borough
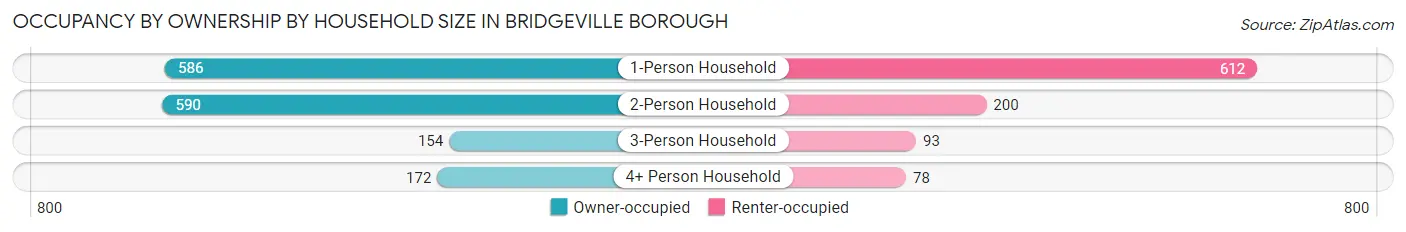
| Household Size | Owner-occupied | Renter-occupied |
| 1-Person Household | 586 (48.9%) | 612 (51.1%) |
| 2-Person Household | 590 (74.7%) | 200 (25.3%) |
| 3-Person Household | 154 (62.4%) | 93 (37.7%) |
| 4+ Person Household | 172 (68.8%) | 78 (31.2%) |
| Total Housing Units | 1,502 (60.4%) | 983 (39.6%) |
Occupancy by Educational Attainment in Bridgeville borough
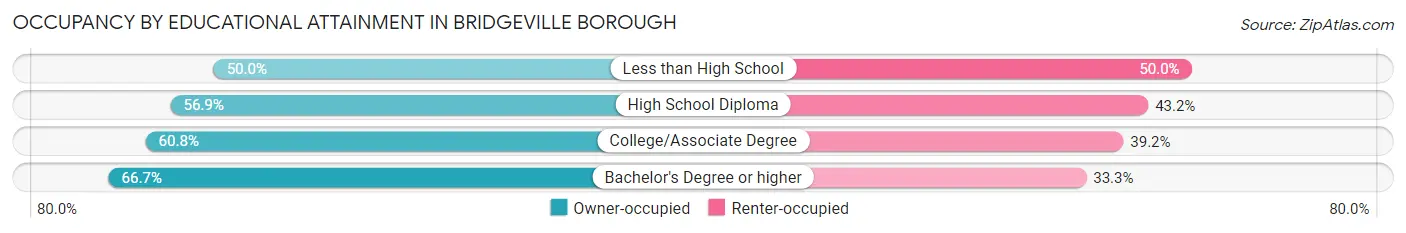
| Household Size | Owner-occupied | Renter-occupied |
| Less than High School | 76 (50.0%) | 76 (50.0%) |
| High School Diploma | 535 (56.9%) | 406 (43.1%) |
| College/Associate Degree | 383 (60.8%) | 247 (39.2%) |
| Bachelor's Degree or higher | 508 (66.7%) | 254 (33.3%) |
Occupancy by Age of Householder in Bridgeville borough
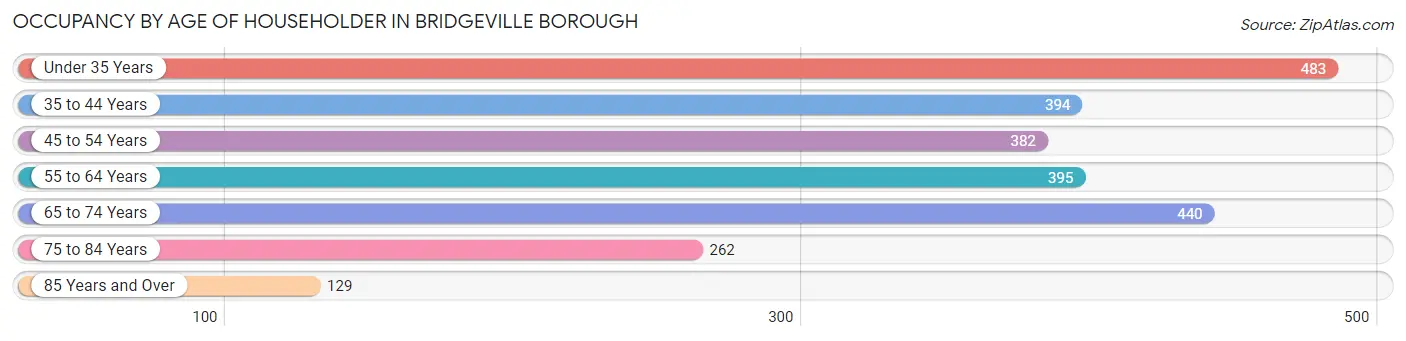
| Age Bracket | # Households | % Households |
| Under 35 Years | 483 | 19.4% |
| 35 to 44 Years | 394 | 15.9% |
| 45 to 54 Years | 382 | 15.4% |
| 55 to 64 Years | 395 | 15.9% |
| 65 to 74 Years | 440 | 17.7% |
| 75 to 84 Years | 262 | 10.5% |
| 85 Years and Over | 129 | 5.2% |
| Total | 2,485 | 100.0% |
Housing Finances in Bridgeville borough
Median Income by Occupancy in Bridgeville borough
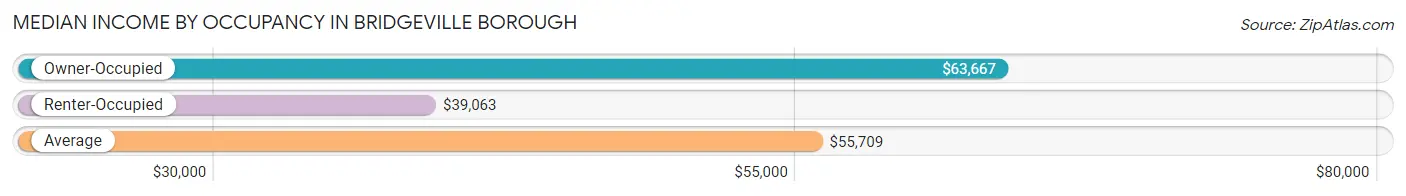
| Occupancy Type | # Households | Median Income |
| Owner-Occupied | 1,502 (60.4%) | $63,667 |
| Renter-Occupied | 983 (39.6%) | $39,063 |
| Average | 2,485 (100.0%) | $55,709 |
Occupancy by Householder Income Bracket in Bridgeville borough
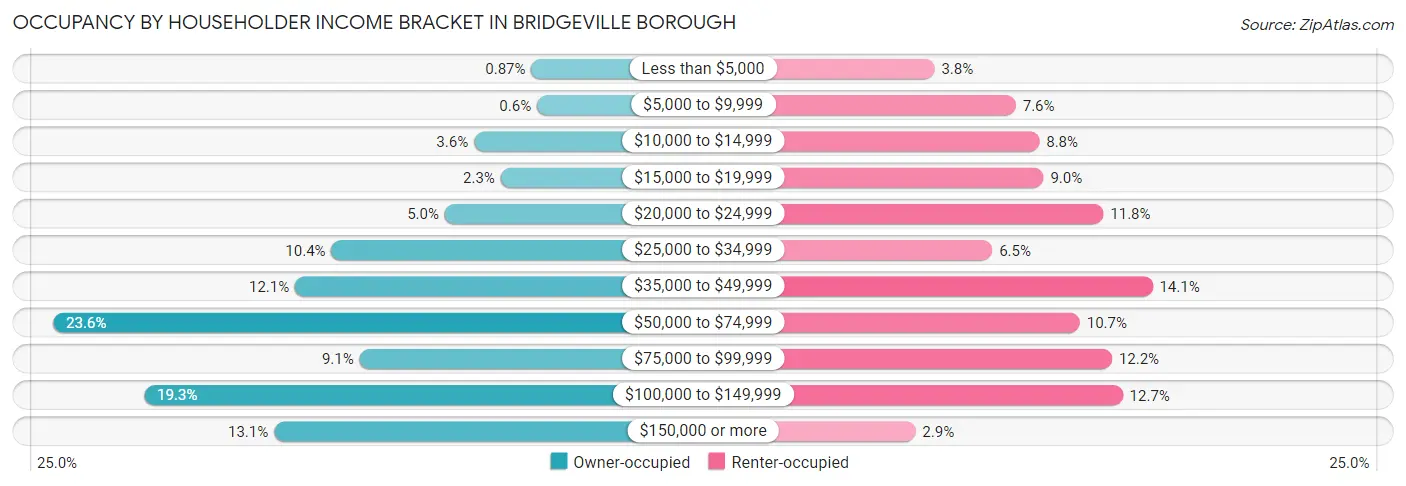
| Income Bracket | Owner-occupied | Renter-occupied |
| Less than $5,000 | 13 (0.9%) | 37 (3.8%) |
| $5,000 to $9,999 | 9 (0.6%) | 75 (7.6%) |
| $10,000 to $14,999 | 54 (3.6%) | 86 (8.7%) |
| $15,000 to $19,999 | 35 (2.3%) | 88 (8.9%) |
| $20,000 to $24,999 | 75 (5.0%) | 116 (11.8%) |
| $25,000 to $34,999 | 156 (10.4%) | 64 (6.5%) |
| $35,000 to $49,999 | 182 (12.1%) | 139 (14.1%) |
| $50,000 to $74,999 | 355 (23.6%) | 105 (10.7%) |
| $75,000 to $99,999 | 136 (9.0%) | 120 (12.2%) |
| $100,000 to $149,999 | 290 (19.3%) | 125 (12.7%) |
| $150,000 or more | 197 (13.1%) | 28 (2.9%) |
| Total | 1,502 (100.0%) | 983 (100.0%) |
Monthly Housing Cost Tiers in Bridgeville borough
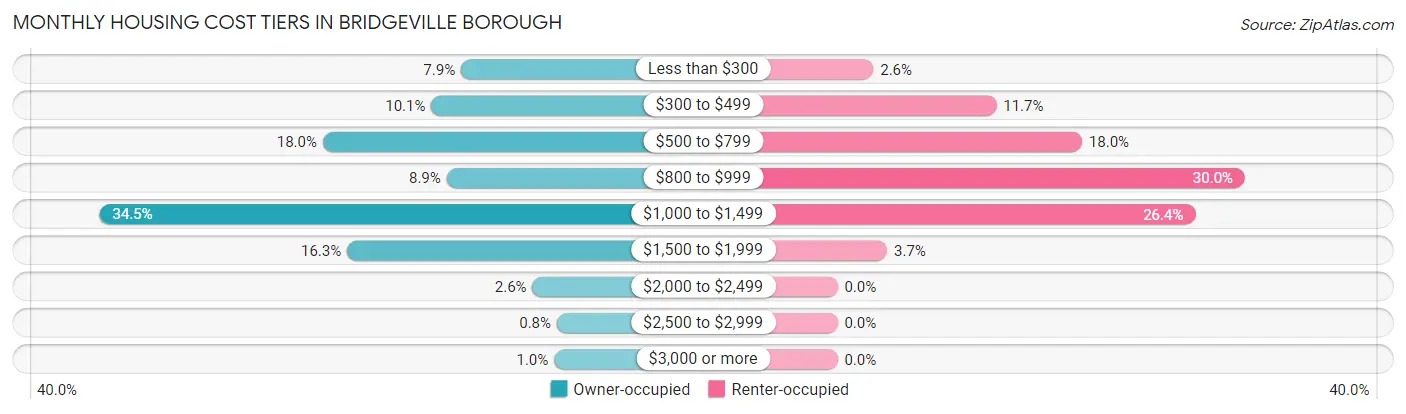
| Monthly Cost | Owner-occupied | Renter-occupied |
| Less than $300 | 118 (7.9%) | 26 (2.6%) |
| $300 to $499 | 151 (10.1%) | 115 (11.7%) |
| $500 to $799 | 271 (18.0%) | 177 (18.0%) |
| $800 to $999 | 134 (8.9%) | 295 (30.0%) |
| $1,000 to $1,499 | 518 (34.5%) | 259 (26.4%) |
| $1,500 to $1,999 | 244 (16.3%) | 36 (3.7%) |
| $2,000 to $2,499 | 39 (2.6%) | 0 (0.0%) |
| $2,500 to $2,999 | 12 (0.8%) | 0 (0.0%) |
| $3,000 or more | 15 (1.0%) | 0 (0.0%) |
| Total | 1,502 (100.0%) | 983 (100.0%) |
Physical Housing Characteristics in Bridgeville borough
Housing Structures in Bridgeville borough
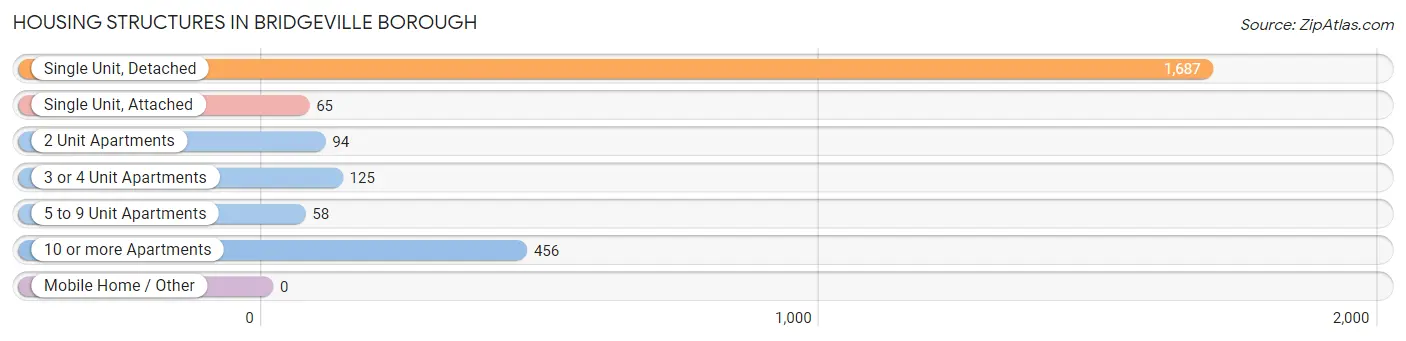
| Structure Type | # Housing Units | % Housing Units |
| Single Unit, Detached | 1,687 | 67.9% |
| Single Unit, Attached | 65 | 2.6% |
| 2 Unit Apartments | 94 | 3.8% |
| 3 or 4 Unit Apartments | 125 | 5.0% |
| 5 to 9 Unit Apartments | 58 | 2.3% |
| 10 or more Apartments | 456 | 18.3% |
| Mobile Home / Other | 0 | 0.0% |
| Total | 2,485 | 100.0% |
Housing Structures by Occupancy in Bridgeville borough
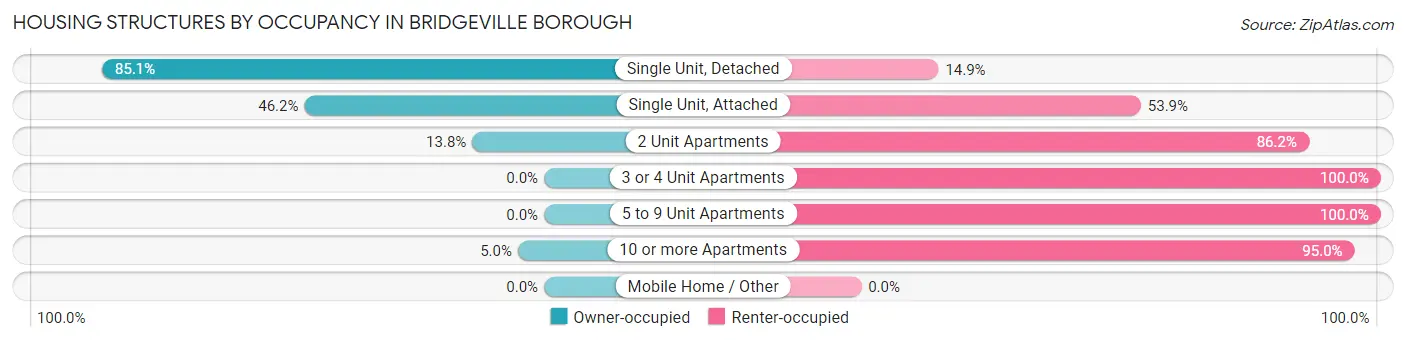
| Structure Type | Owner-occupied | Renter-occupied |
| Single Unit, Detached | 1,436 (85.1%) | 251 (14.9%) |
| Single Unit, Attached | 30 (46.2%) | 35 (53.8%) |
| 2 Unit Apartments | 13 (13.8%) | 81 (86.2%) |
| 3 or 4 Unit Apartments | 0 (0.0%) | 125 (100.0%) |
| 5 to 9 Unit Apartments | 0 (0.0%) | 58 (100.0%) |
| 10 or more Apartments | 23 (5.0%) | 433 (95.0%) |
| Mobile Home / Other | 0 (0.0%) | 0 (0.0%) |
| Total | 1,502 (60.4%) | 983 (39.6%) |
Housing Structures by Number of Rooms in Bridgeville borough
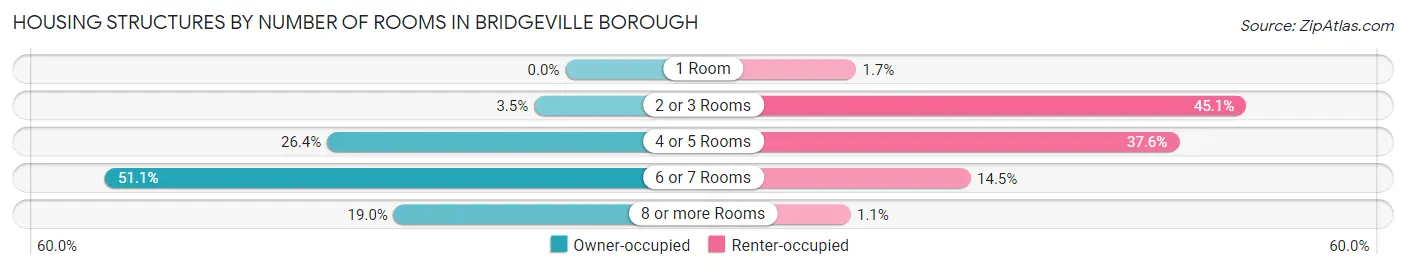
| Number of Rooms | Owner-occupied | Renter-occupied |
| 1 Room | 0 (0.0%) | 17 (1.7%) |
| 2 or 3 Rooms | 52 (3.5%) | 443 (45.1%) |
| 4 or 5 Rooms | 397 (26.4%) | 370 (37.6%) |
| 6 or 7 Rooms | 767 (51.1%) | 142 (14.4%) |
| 8 or more Rooms | 286 (19.0%) | 11 (1.1%) |
| Total | 1,502 (100.0%) | 983 (100.0%) |
Housing Structure by Heating Type in Bridgeville borough
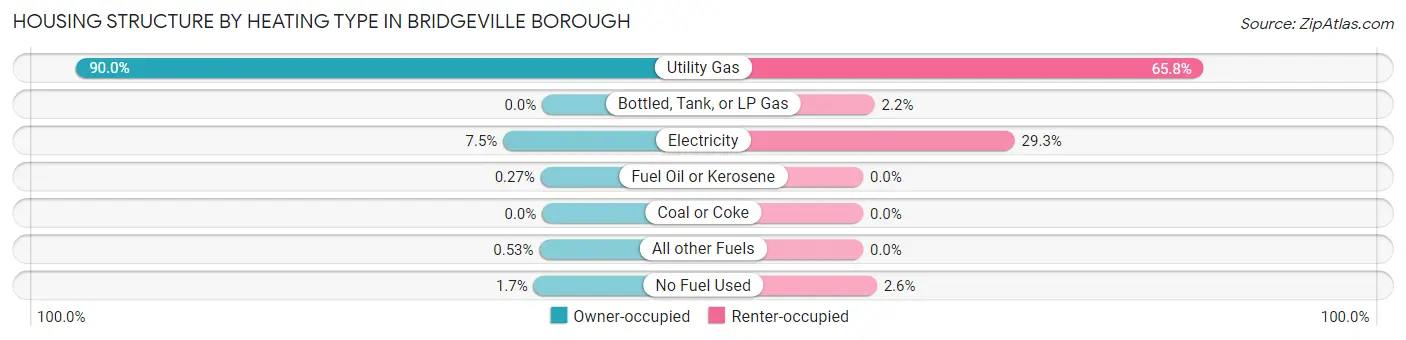
| Heating Type | Owner-occupied | Renter-occupied |
| Utility Gas | 1,352 (90.0%) | 647 (65.8%) |
| Bottled, Tank, or LP Gas | 0 (0.0%) | 22 (2.2%) |
| Electricity | 113 (7.5%) | 288 (29.3%) |
| Fuel Oil or Kerosene | 4 (0.3%) | 0 (0.0%) |
| Coal or Coke | 0 (0.0%) | 0 (0.0%) |
| All other Fuels | 8 (0.5%) | 0 (0.0%) |
| No Fuel Used | 25 (1.7%) | 26 (2.6%) |
| Total | 1,502 (100.0%) | 983 (100.0%) |
Household Vehicle Usage in Bridgeville borough
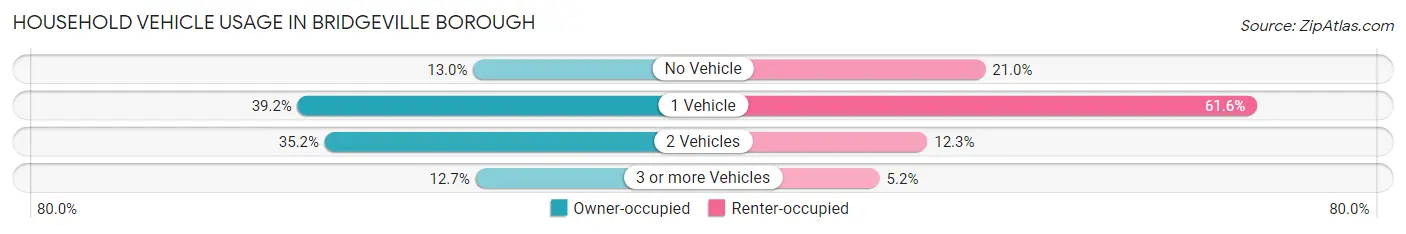
| Vehicles per Household | Owner-occupied | Renter-occupied |
| No Vehicle | 195 (13.0%) | 206 (21.0%) |
| 1 Vehicle | 589 (39.2%) | 605 (61.6%) |
| 2 Vehicles | 528 (35.1%) | 121 (12.3%) |
| 3 or more Vehicles | 190 (12.7%) | 51 (5.2%) |
| Total | 1,502 (100.0%) | 983 (100.0%) |
Real Estate & Mortgages in Bridgeville borough
Real Estate and Mortgage Overview in Bridgeville borough
| Characteristic | Without Mortgage | With Mortgage |
| Housing Units | 583 | 919 |
| Median Property Value | $119,900 | $167,100 |
| Median Household Income | $50,066 | $161 |
| Monthly Housing Costs | $527 | $0 |
| Real Estate Taxes | $2,705 | $21 |
Property Value by Mortgage Status in Bridgeville borough
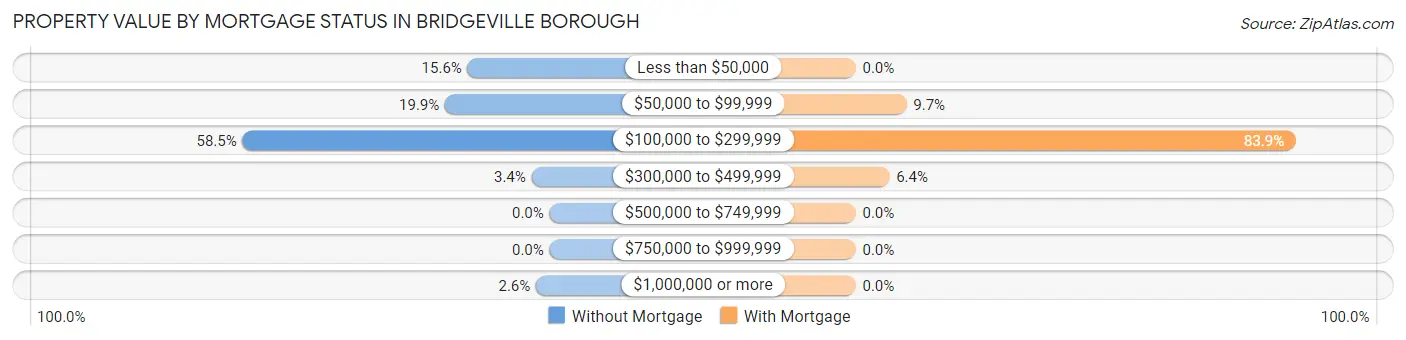
| Property Value | Without Mortgage | With Mortgage |
| Less than $50,000 | 91 (15.6%) | 0 (0.0%) |
| $50,000 to $99,999 | 116 (19.9%) | 89 (9.7%) |
| $100,000 to $299,999 | 341 (58.5%) | 771 (83.9%) |
| $300,000 to $499,999 | 20 (3.4%) | 59 (6.4%) |
| $500,000 to $749,999 | 0 (0.0%) | 0 (0.0%) |
| $750,000 to $999,999 | 0 (0.0%) | 0 (0.0%) |
| $1,000,000 or more | 15 (2.6%) | 0 (0.0%) |
| Total | 583 (100.0%) | 919 (100.0%) |
Household Income by Mortgage Status in Bridgeville borough
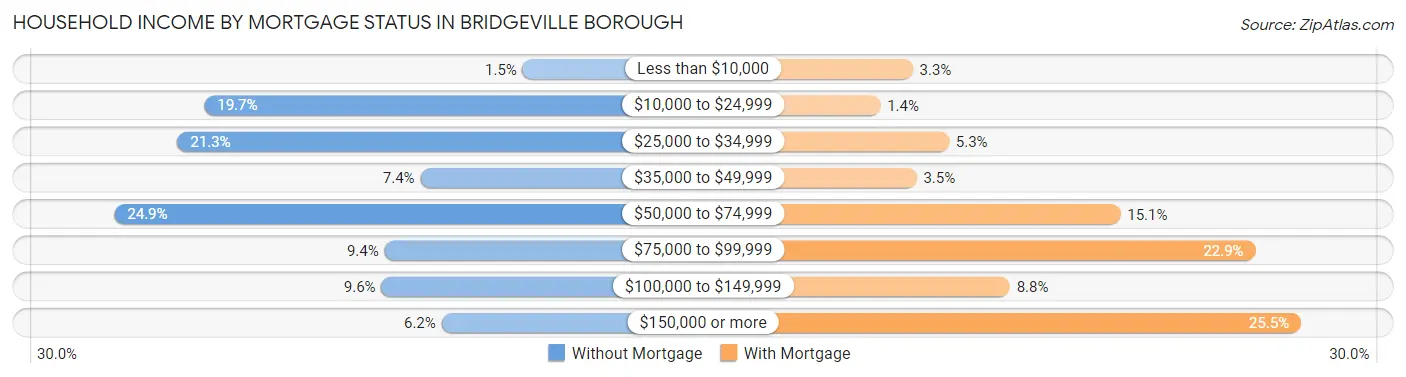
| Household Income | Without Mortgage | With Mortgage |
| Less than $10,000 | 9 (1.5%) | 30 (3.3%) |
| $10,000 to $24,999 | 115 (19.7%) | 13 (1.4%) |
| $25,000 to $34,999 | 124 (21.3%) | 49 (5.3%) |
| $35,000 to $49,999 | 43 (7.4%) | 32 (3.5%) |
| $50,000 to $74,999 | 145 (24.9%) | 139 (15.1%) |
| $75,000 to $99,999 | 55 (9.4%) | 210 (22.9%) |
| $100,000 to $149,999 | 56 (9.6%) | 81 (8.8%) |
| $150,000 or more | 36 (6.2%) | 234 (25.5%) |
| Total | 583 (100.0%) | 919 (100.0%) |
Property Value to Household Income Ratio in Bridgeville borough
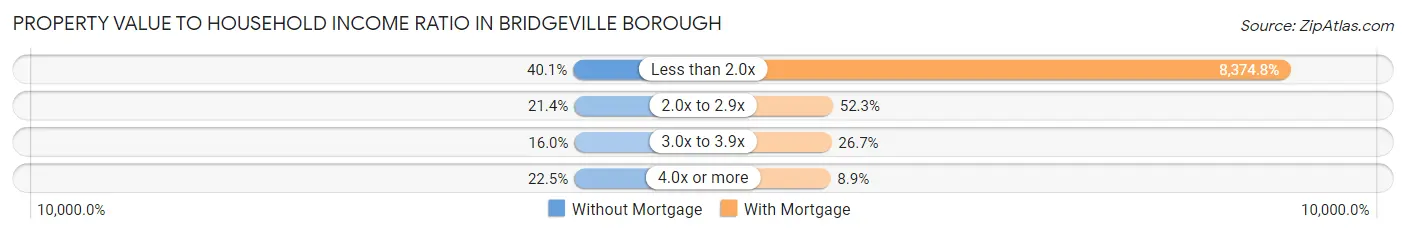
| Value-to-Income Ratio | Without Mortgage | With Mortgage |
| Less than 2.0x | 234 (40.1%) | 76,964 (8,374.8%) |
| 2.0x to 2.9x | 125 (21.4%) | 481 (52.3%) |
| 3.0x to 3.9x | 93 (16.0%) | 245 (26.7%) |
| 4.0x or more | 131 (22.5%) | 82 (8.9%) |
| Total | 583 (100.0%) | 919 (100.0%) |
Real Estate Taxes by Mortgage Status in Bridgeville borough
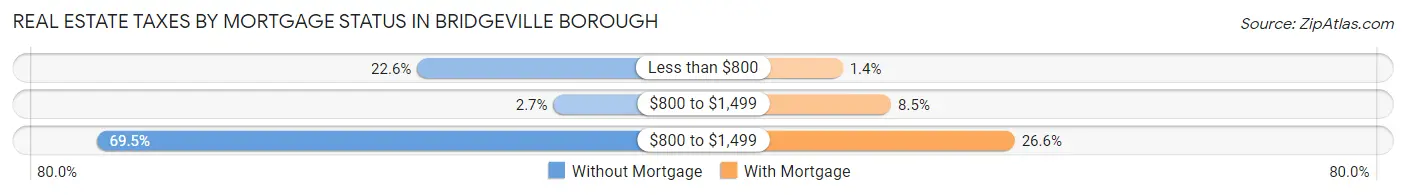
| Property Taxes | Without Mortgage | With Mortgage |
| Less than $800 | 132 (22.6%) | 13 (1.4%) |
| $800 to $1,499 | 16 (2.7%) | 78 (8.5%) |
| $800 to $1,499 | 405 (69.5%) | 244 (26.6%) |
| Total | 583 (100.0%) | 919 (100.0%) |
Health & Disability in Bridgeville borough
Health Insurance Coverage by Age in Bridgeville borough
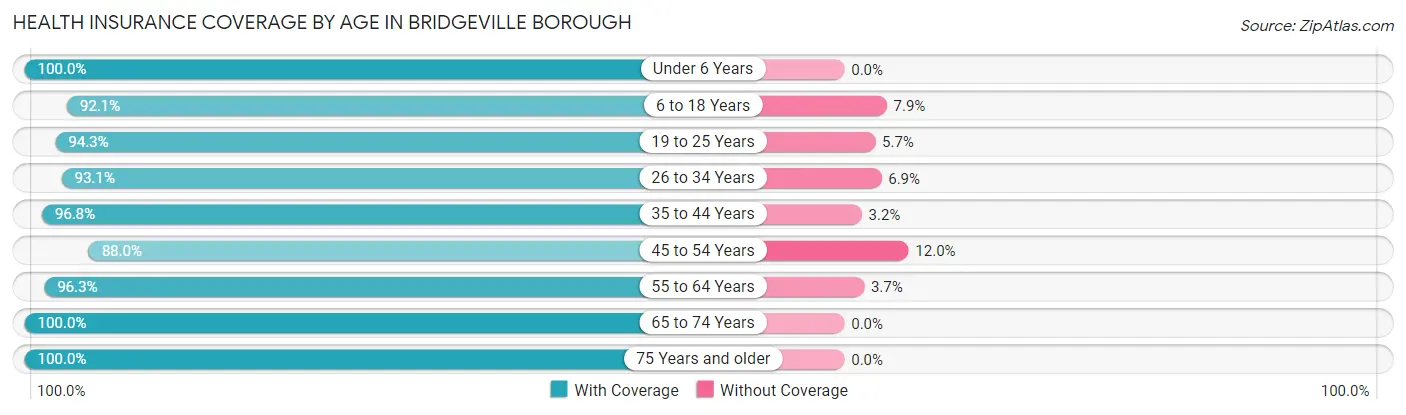
| Age Bracket | With Coverage | Without Coverage |
| Under 6 Years | 302 (100.0%) | 0 (0.0%) |
| 6 to 18 Years | 467 (92.1%) | 40 (7.9%) |
| 19 to 25 Years | 345 (94.3%) | 21 (5.7%) |
| 26 to 34 Years | 661 (93.1%) | 49 (6.9%) |
| 35 to 44 Years | 632 (96.8%) | 21 (3.2%) |
| 45 to 54 Years | 508 (88.0%) | 69 (12.0%) |
| 55 to 64 Years | 551 (96.3%) | 21 (3.7%) |
| 65 to 74 Years | 597 (100.0%) | 0 (0.0%) |
| 75 Years and older | 478 (100.0%) | 0 (0.0%) |
| Total | 4,541 (95.4%) | 221 (4.6%) |
Health Insurance Coverage by Citizenship Status in Bridgeville borough
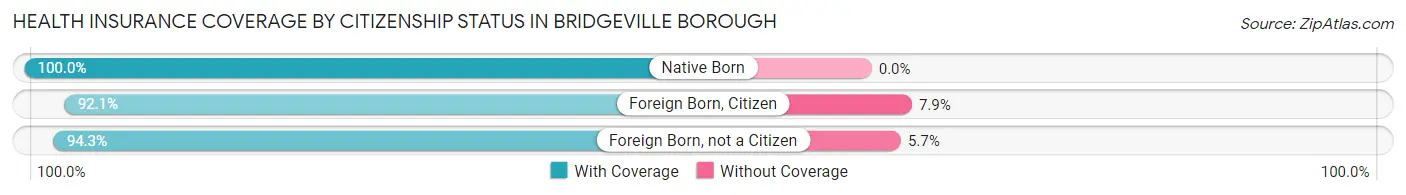
| Citizenship Status | With Coverage | Without Coverage |
| Native Born | 302 (100.0%) | 0 (0.0%) |
| Foreign Born, Citizen | 467 (92.1%) | 40 (7.9%) |
| Foreign Born, not a Citizen | 345 (94.3%) | 21 (5.7%) |
Health Insurance Coverage by Household Income in Bridgeville borough
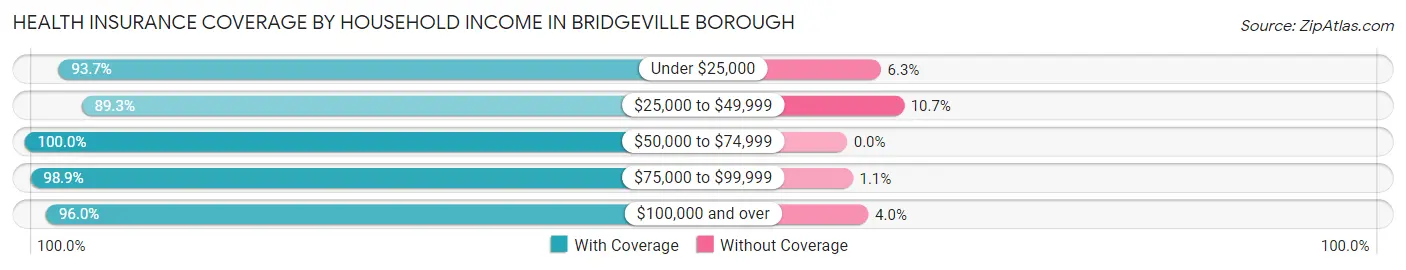
| Household Income | With Coverage | Without Coverage |
| Under $25,000 | 709 (93.7%) | 48 (6.3%) |
| $25,000 to $49,999 | 763 (89.3%) | 91 (10.7%) |
| $50,000 to $74,999 | 894 (100.0%) | 0 (0.0%) |
| $75,000 to $99,999 | 370 (98.9%) | 4 (1.1%) |
| $100,000 and over | 1,802 (96.0%) | 75 (4.0%) |
Public vs Private Health Insurance Coverage by Age in Bridgeville borough
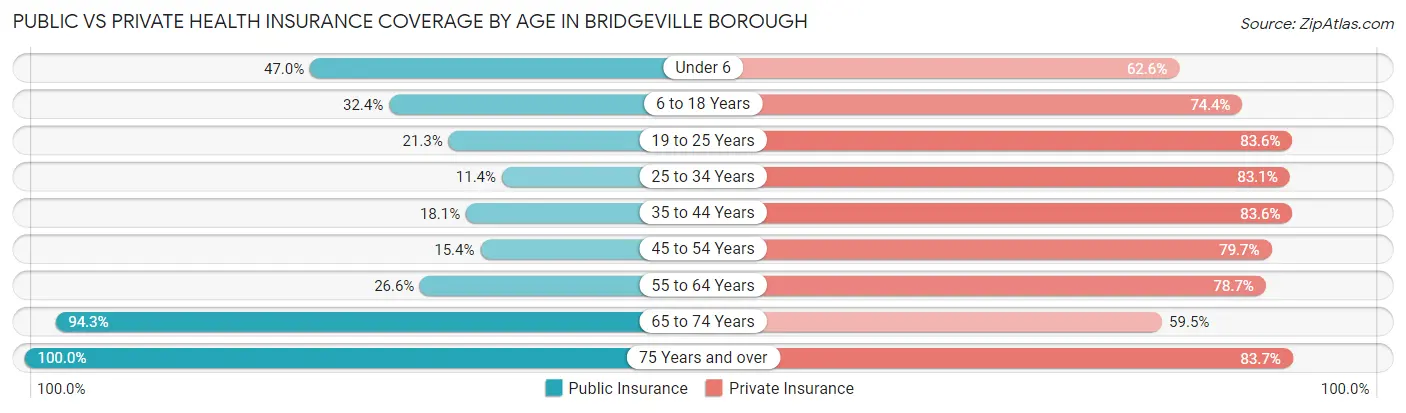
| Age Bracket | Public Insurance | Private Insurance |
| Under 6 | 142 (47.0%) | 189 (62.6%) |
| 6 to 18 Years | 164 (32.4%) | 377 (74.4%) |
| 19 to 25 Years | 78 (21.3%) | 306 (83.6%) |
| 25 to 34 Years | 81 (11.4%) | 590 (83.1%) |
| 35 to 44 Years | 118 (18.1%) | 546 (83.6%) |
| 45 to 54 Years | 89 (15.4%) | 460 (79.7%) |
| 55 to 64 Years | 152 (26.6%) | 450 (78.7%) |
| 65 to 74 Years | 563 (94.3%) | 355 (59.5%) |
| 75 Years and over | 478 (100.0%) | 400 (83.7%) |
| Total | 1,865 (39.2%) | 3,673 (77.1%) |
Disability Status by Sex by Age in Bridgeville borough
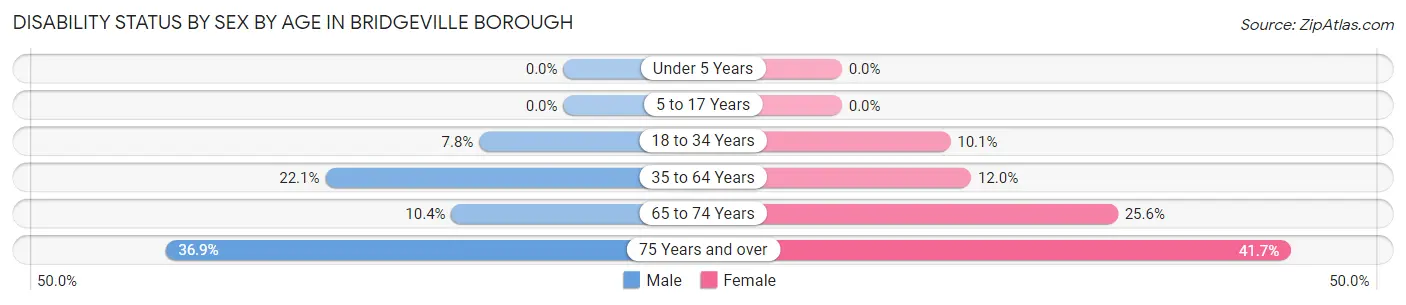
| Age Bracket | Male | Female |
| Under 5 Years | 0 (0.0%) | 0 (0.0%) |
| 5 to 17 Years | 0 (0.0%) | 0 (0.0%) |
| 18 to 34 Years | 54 (7.8%) | 43 (10.1%) |
| 35 to 64 Years | 188 (22.1%) | 114 (12.0%) |
| 65 to 74 Years | 32 (10.4%) | 74 (25.6%) |
| 75 Years and over | 41 (36.9%) | 153 (41.7%) |
Disability Class by Sex by Age in Bridgeville borough
Disability Class: Hearing Difficulty
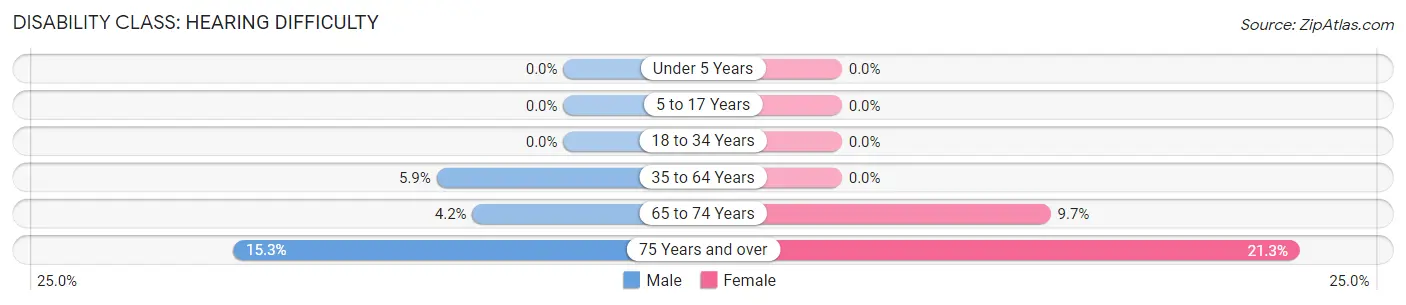
| Age Bracket | Male | Female |
| Under 5 Years | 0 (0.0%) | 0 (0.0%) |
| 5 to 17 Years | 0 (0.0%) | 0 (0.0%) |
| 18 to 34 Years | 0 (0.0%) | 0 (0.0%) |
| 35 to 64 Years | 50 (5.9%) | 0 (0.0%) |
| 65 to 74 Years | 13 (4.2%) | 28 (9.7%) |
| 75 Years and over | 17 (15.3%) | 78 (21.2%) |
Disability Class: Vision Difficulty
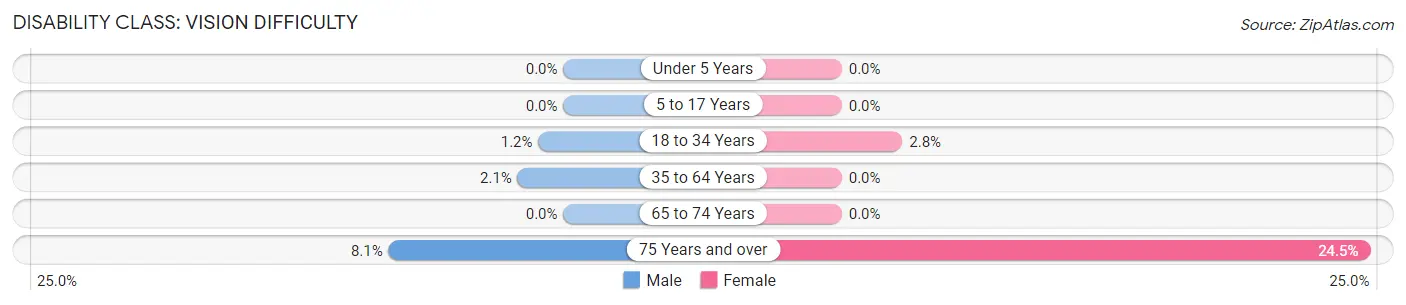
| Age Bracket | Male | Female |
| Under 5 Years | 0 (0.0%) | 0 (0.0%) |
| 5 to 17 Years | 0 (0.0%) | 0 (0.0%) |
| 18 to 34 Years | 8 (1.2%) | 12 (2.8%) |
| 35 to 64 Years | 18 (2.1%) | 0 (0.0%) |
| 65 to 74 Years | 0 (0.0%) | 0 (0.0%) |
| 75 Years and over | 9 (8.1%) | 90 (24.5%) |
Disability Class: Cognitive Difficulty
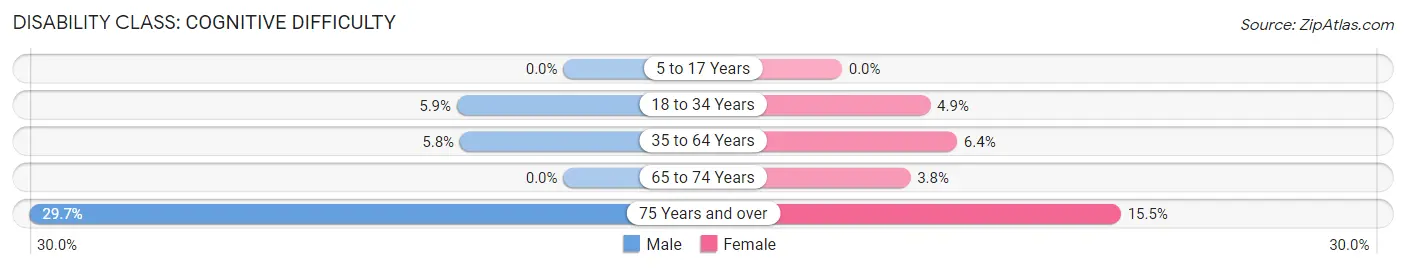
| Age Bracket | Male | Female |
| 5 to 17 Years | 0 (0.0%) | 0 (0.0%) |
| 18 to 34 Years | 41 (5.9%) | 21 (4.9%) |
| 35 to 64 Years | 49 (5.8%) | 61 (6.4%) |
| 65 to 74 Years | 0 (0.0%) | 11 (3.8%) |
| 75 Years and over | 33 (29.7%) | 57 (15.5%) |
Disability Class: Ambulatory Difficulty
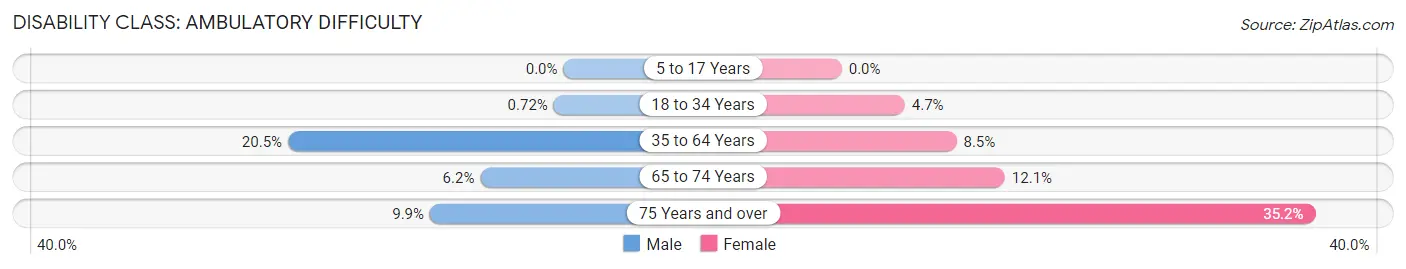
| Age Bracket | Male | Female |
| 5 to 17 Years | 0 (0.0%) | 0 (0.0%) |
| 18 to 34 Years | 5 (0.7%) | 20 (4.7%) |
| 35 to 64 Years | 174 (20.4%) | 81 (8.5%) |
| 65 to 74 Years | 19 (6.2%) | 35 (12.1%) |
| 75 Years and over | 11 (9.9%) | 129 (35.1%) |
Disability Class: Self-Care Difficulty
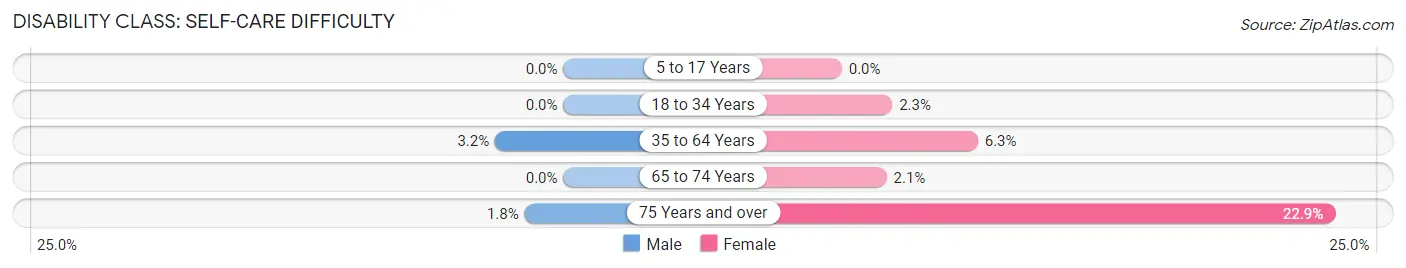
| Age Bracket | Male | Female |
| 5 to 17 Years | 0 (0.0%) | 0 (0.0%) |
| 18 to 34 Years | 0 (0.0%) | 10 (2.3%) |
| 35 to 64 Years | 27 (3.2%) | 60 (6.3%) |
| 65 to 74 Years | 0 (0.0%) | 6 (2.1%) |
| 75 Years and over | 2 (1.8%) | 84 (22.9%) |
Technology Access in Bridgeville borough
Computing Device Access in Bridgeville borough
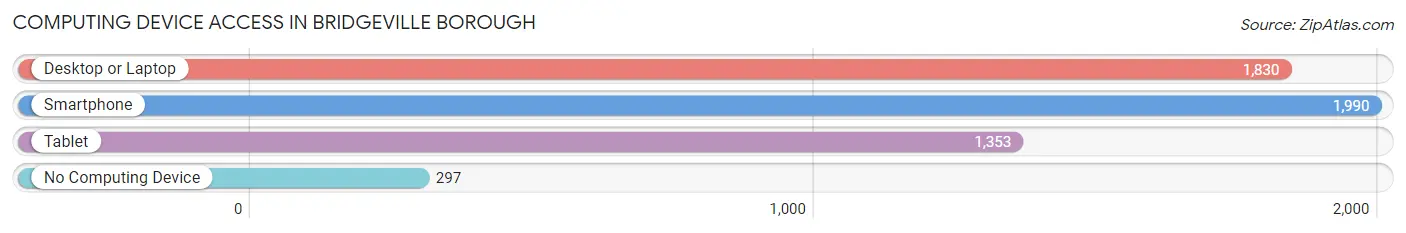
| Device Type | # Households | % Households |
| Desktop or Laptop | 1,830 | 73.6% |
| Smartphone | 1,990 | 80.1% |
| Tablet | 1,353 | 54.4% |
| No Computing Device | 297 | 11.9% |
| Total | 2,485 | 100.0% |
Internet Access in Bridgeville borough
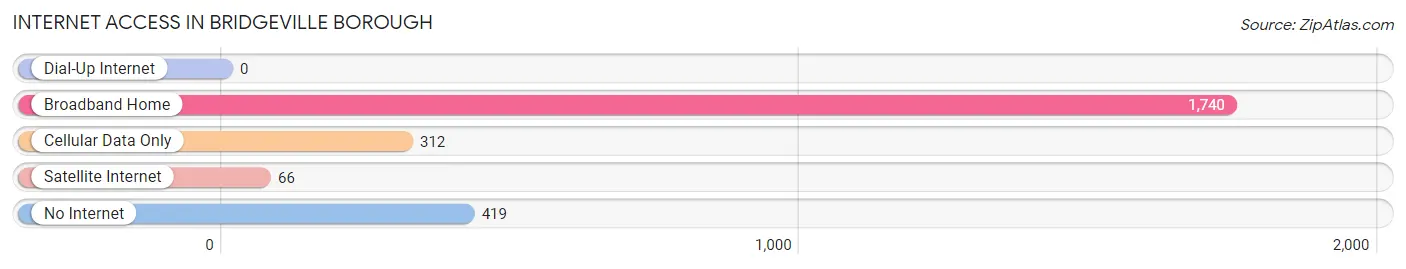
| Internet Type | # Households | % Households |
| Dial-Up Internet | 0 | 0.0% |
| Broadband Home | 1,740 | 70.0% |
| Cellular Data Only | 312 | 12.6% |
| Satellite Internet | 66 | 2.7% |
| No Internet | 419 | 16.9% |
| Total | 2,485 | 100.0% |
Bridgeville borough Summary
Bridgeville Borough is a small borough located in Allegheny County, Pennsylvania. It is situated approximately 15 miles southwest of Pittsburgh and is part of the Pittsburgh Metropolitan Statistical Area. The borough is home to a population of approximately 5,000 people and covers an area of 1.2 square miles.
History
The area that is now Bridgeville Borough was first settled in the late 1700s by a group of German immigrants. The area was originally known as “Bridgeport” and was named after the bridge that was built over Chartiers Creek in 1816. The bridge was built by a local landowner, John Robinson, and was the first bridge to span the creek.
In 1836, the area was officially incorporated as Bridgeville Borough. The borough was named after the bridge that had been built over the creek. The borough quickly grew and by the late 1800s, it had become a thriving industrial center. The borough was home to several factories, including a glass factory, a brickyard, and a paper mill.
The borough continued to grow throughout the 20th century and by the 1950s, it had become a popular suburb of Pittsburgh. The borough was home to several large businesses, including a steel mill, a chemical plant, and a paper mill.
Geography
Bridgeville Borough is located in Allegheny County, Pennsylvania. It is situated approximately 15 miles southwest of Pittsburgh and is part of the Pittsburgh Metropolitan Statistical Area. The borough covers an area of 1.2 square miles and is bordered by Collier Township to the north, South Fayette Township to the east, and Scott Township to the south and west.
The borough is situated in the Allegheny Plateau region of Pennsylvania and is characterized by rolling hills and valleys. The borough is home to several creeks, including Chartiers Creek, which flows through the borough. The borough is also home to several parks, including Bridgeville Park and Chartiers Creek Park.
Economy
The economy of Bridgeville Borough is largely based on the service industry. The borough is home to several restaurants, retail stores, and other businesses. The borough is also home to several large employers, including a steel mill, a chemical plant, and a paper mill.
The borough is also home to several educational institutions, including the University of Pittsburgh, Carnegie Mellon University, and the Community College of Allegheny County. The borough is also home to several medical facilities, including Allegheny General Hospital and UPMC St. Margaret Hospital.
Demographics
As of the 2010 census, the population of Bridgeville Borough was 5,148. The racial makeup of the borough was 94.3% White, 2.3% African American, 0.3% Native American, 1.2% Asian, 0.1% Pacific Islander, 0.7% from other races, and 1.2% from two or more races. Hispanic or Latino of any race were 1.9% of the population.
The median household income in Bridgeville Borough was $50,945 and the median family income was $60,917. The per capita income for the borough was $25,945. About 5.3% of families and 7.2% of the population were below the poverty line, including 8.3% of those under age 18 and 5.2% of those age 65 or over.
Common Questions
What is Per Capita Income in Bridgeville borough?
Per Capita income in Bridgeville borough is $37,930.
What is the Median Family Income in Bridgeville borough?
Median Family Income in Bridgeville borough is $73,500.
What is the Median Household income in Bridgeville borough?
Median Household Income in Bridgeville borough is $55,709.
What is Income or Wage Gap in Bridgeville borough?
Income or Wage Gap in Bridgeville borough is 25.0%.
Women in Bridgeville borough earn 75.0 cents for every dollar earned by a man.
What is Family Income Deficit in Bridgeville borough?
Family Income Deficit in Bridgeville borough is $9,921.
Families that are below poverty line in Bridgeville borough earn $9,921 less on average than the poverty threshold level.
What is Inequality or Gini Index in Bridgeville borough?
Inequality or Gini Index in Bridgeville borough is 0.43.
What is the Total Population of Bridgeville borough?
Total Population of Bridgeville borough is 4,777.
What is the Total Male Population of Bridgeville borough?
Total Male Population of Bridgeville borough is 2,424.
What is the Total Female Population of Bridgeville borough?
Total Female Population of Bridgeville borough is 2,353.
What is the Ratio of Males per 100 Females in Bridgeville borough?
There are 103.02 Males per 100 Females in Bridgeville borough.
What is the Ratio of Females per 100 Males in Bridgeville borough?
There are 97.07 Females per 100 Males in Bridgeville borough.
What is the Median Population Age in Bridgeville borough?
Median Population Age in Bridgeville borough is 43.0 Years.
What is the Average Family Size in Bridgeville borough
Average Family Size in Bridgeville borough is 2.8 People.
What is the Average Household Size in Bridgeville borough
Average Household Size in Bridgeville borough is 1.9 People.
How Large is the Labor Force in Bridgeville borough?
There are 2,697 People in the Labor Forcein in Bridgeville borough.
What is the Percentage of People in the Labor Force in Bridgeville borough?
65.9% of People are in the Labor Force in Bridgeville borough.
What is the Unemployment Rate in Bridgeville borough?
Unemployment Rate in Bridgeville borough is 6.7%.