Bobtown, PA Map & Demographics
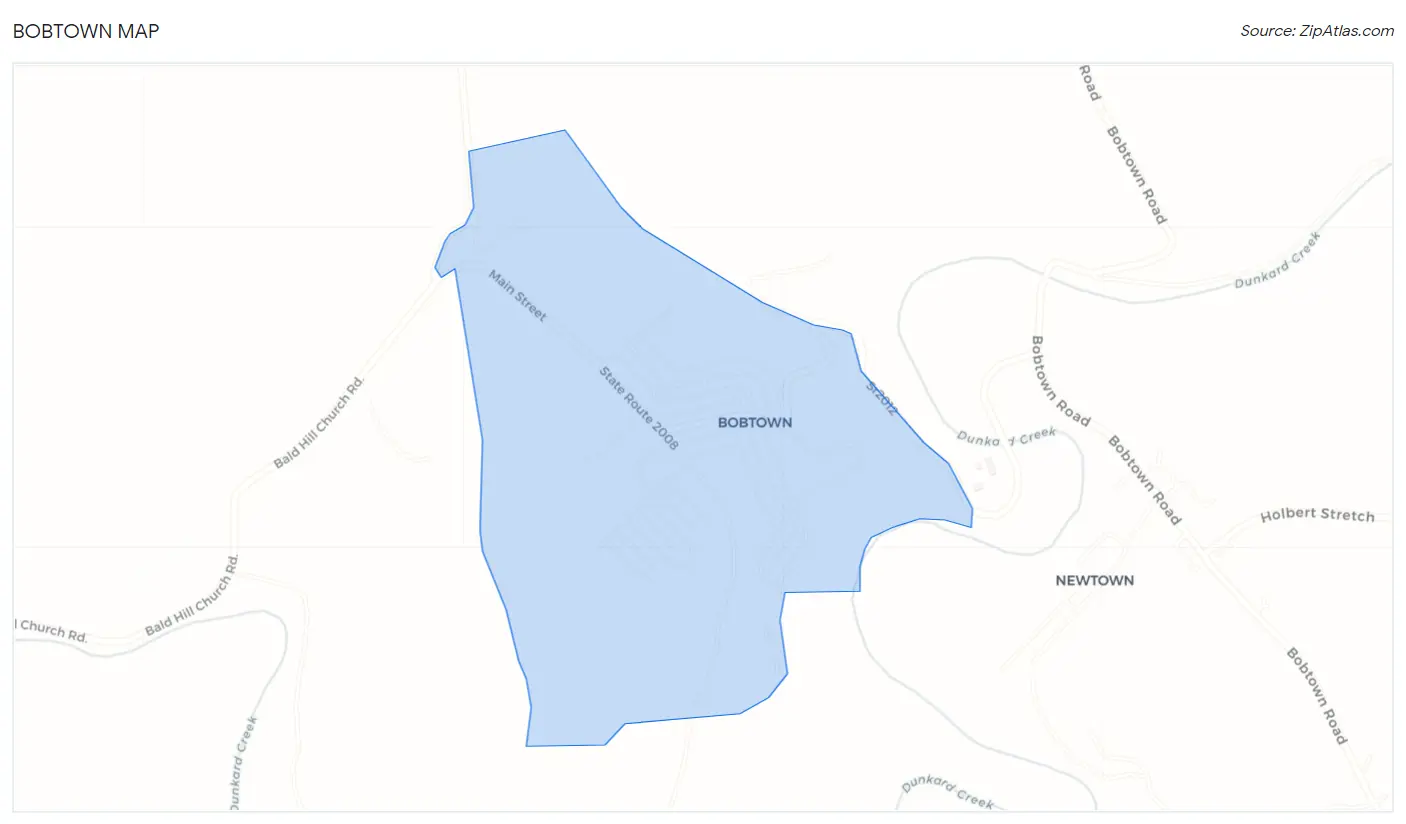
Bobtown Map
Bobtown Overview
$18,874
PER CAPITA INCOME
$46,716
AVG FAMILY INCOME
$46,618
AVG HOUSEHOLD INCOME
30.4%
WAGE / INCOME GAP [ % ]
69.6¢/ $1
WAGE / INCOME GAP [ $ ]
0.40
INEQUALITY / GINI INDEX
780
TOTAL POPULATION
287
MALE POPULATION
493
FEMALE POPULATION
58.22
MALES / 100 FEMALES
171.78
FEMALES / 100 MALES
29.4
MEDIAN AGE
3.5
AVG FAMILY SIZE
3.2
AVG HOUSEHOLD SIZE
249
LABOR FORCE [ PEOPLE ]
47.1%
PERCENT IN LABOR FORCE
Bobtown Zip Codes
Bobtown Area Codes
Income in Bobtown
Income Overview in Bobtown
Per Capita Income in Bobtown is $18,874, while median incomes of families and households are $46,716 and $46,618 respectively.
| Characteristic | Number | Measure |
| Per Capita Income | 780 | $18,874 |
| Median Family Income | 210 | $46,716 |
| Mean Family Income | 210 | $55,667 |
| Median Household Income | 244 | $46,618 |
| Mean Household Income | 244 | $57,426 |
| Income Deficit | 210 | $0 |
| Wage / Income Gap (%) | 780 | 30.42% |
| Wage / Income Gap ($) | 780 | 69.58¢ per $1 |
| Gini / Inequality Index | 780 | 0.40 |
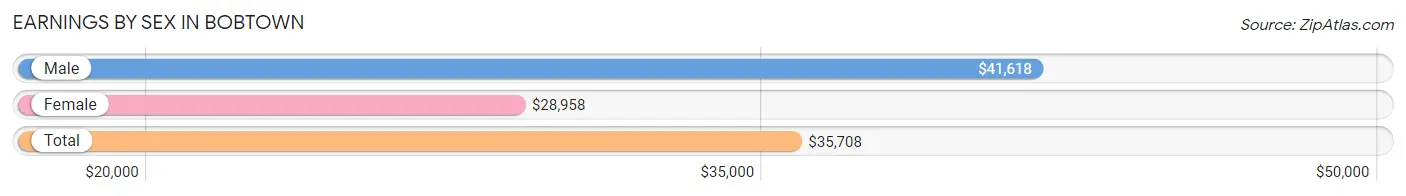
Earnings by Sex in Bobtown
Average Earnings in Bobtown are $35,708, $41,618 for men and $28,958 for women, a difference of 30.4%.
| Sex | Number | Average Earnings |
| Male | 118 (47.0%) | $41,618 |
| Female | 133 (53.0%) | $28,958 |
| Total | 251 (100.0%) | $35,708 |
Earnings by Sex by Income Bracket in Bobtown
The most common earnings brackets in Bobtown are $12,500 to $14,999 for men (35 | 29.7%) and $35,000 to $39,999 for women (30 | 22.6%).

| Income | Male | Female |
| $2,499 or less | 0 (0.0%) | 12 (9.0%) |
| $2,500 to $4,999 | 0 (0.0%) | 0 (0.0%) |
| $5,000 to $7,499 | 6 (5.1%) | 0 (0.0%) |
| $7,500 to $9,999 | 0 (0.0%) | 0 (0.0%) |
| $10,000 to $12,499 | 0 (0.0%) | 0 (0.0%) |
| $12,500 to $14,999 | 35 (29.7%) | 0 (0.0%) |
| $15,000 to $17,499 | 0 (0.0%) | 0 (0.0%) |
| $17,500 to $19,999 | 0 (0.0%) | 29 (21.8%) |
| $20,000 to $22,499 | 0 (0.0%) | 8 (6.0%) |
| $22,500 to $24,999 | 0 (0.0%) | 0 (0.0%) |
| $25,000 to $29,999 | 0 (0.0%) | 20 (15.0%) |
| $30,000 to $34,999 | 7 (5.9%) | 0 (0.0%) |
| $35,000 to $39,999 | 0 (0.0%) | 30 (22.6%) |
| $40,000 to $44,999 | 23 (19.5%) | 8 (6.0%) |
| $45,000 to $49,999 | 16 (13.6%) | 5 (3.8%) |
| $50,000 to $54,999 | 0 (0.0%) | 0 (0.0%) |
| $55,000 to $64,999 | 9 (7.6%) | 0 (0.0%) |
| $65,000 to $74,999 | 8 (6.8%) | 9 (6.8%) |
| $75,000 to $99,999 | 0 (0.0%) | 0 (0.0%) |
| $100,000+ | 14 (11.9%) | 12 (9.0%) |
| Total | 118 (100.0%) | 133 (100.0%) |
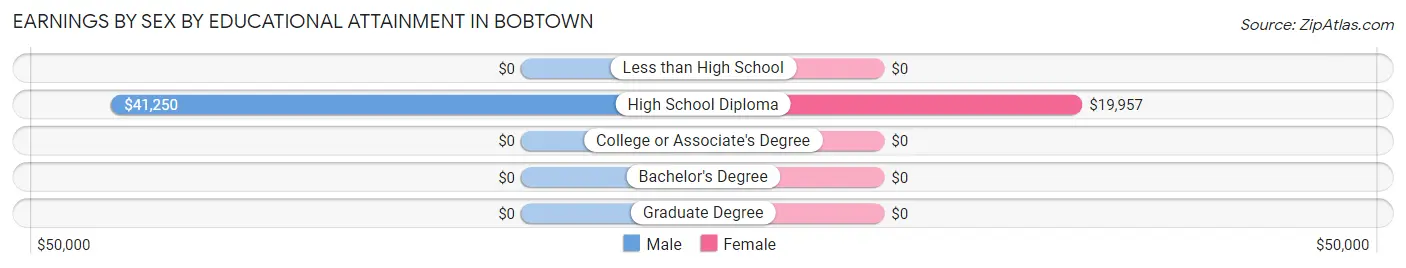
Earnings by Sex by Educational Attainment in Bobtown
Average earnings in Bobtown are $41,544 for men and $32,500 for women, a difference of 21.8%. Men with an educational attainment of high school diploma enjoy the highest average annual earnings of $41,250, while those with high school diploma education earn the least with $41,250. Women with an educational attainment of high school diploma earn the most with the average annual earnings of $19,957, while those with high school diploma education have the smallest earnings of $19,957.
| Educational Attainment | Male Income | Female Income |
| Less than High School | - | - |
| High School Diploma | $41,250 | $19,957 |
| College or Associate's Degree | - | - |
| Bachelor's Degree | - | - |
| Graduate Degree | - | - |
| Total | $41,544 | $32,500 |
Family Income in Bobtown
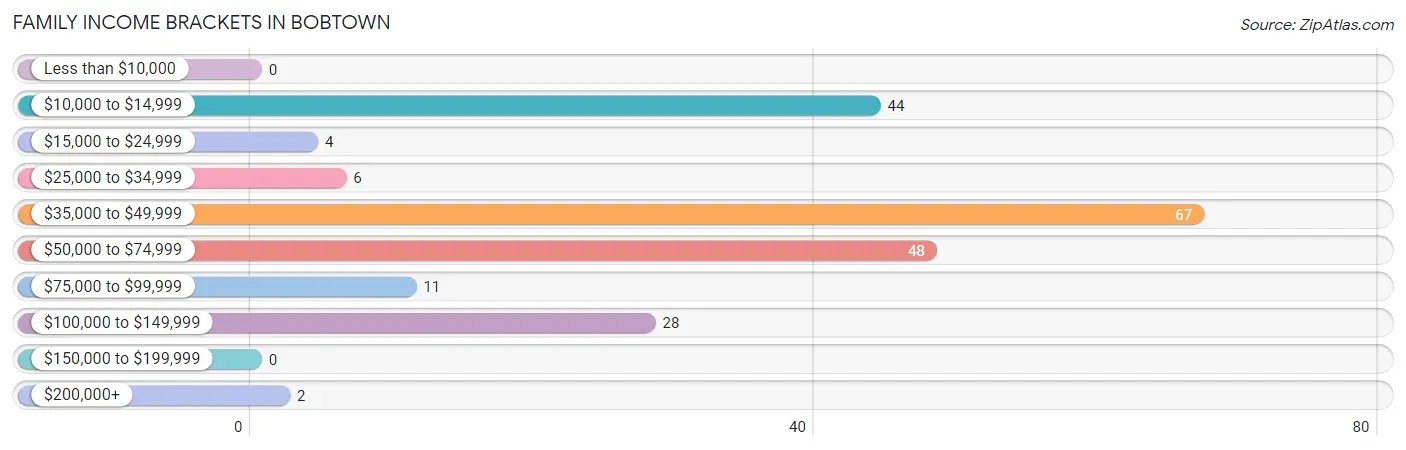
Family Income Brackets in Bobtown
According to the Bobtown family income data, there are 67 families falling into the $35,000 to $49,999 income range, which is the most common income bracket and makes up 31.9% of all families.
| Income Bracket | # Families | % Families |
| Less than $10,000 | 0 | 0.0% |
| $10,000 to $14,999 | 44 | 21.0% |
| $15,000 to $24,999 | 4 | 1.9% |
| $25,000 to $34,999 | 6 | 2.9% |
| $35,000 to $49,999 | 67 | 31.9% |
| $50,000 to $74,999 | 48 | 22.9% |
| $75,000 to $99,999 | 11 | 5.2% |
| $100,000 to $149,999 | 28 | 13.3% |
| $150,000 to $199,999 | 0 | 0.0% |
| $200,000+ | 2 | 1.0% |
Family Income by Famaliy Size in Bobtown
2-person families (21 | 10.0%) account for the highest median family income in Bobtown with $113,523 per family, while 2-person families (21 | 10.0%) have the highest median income of $56,762 per family member.
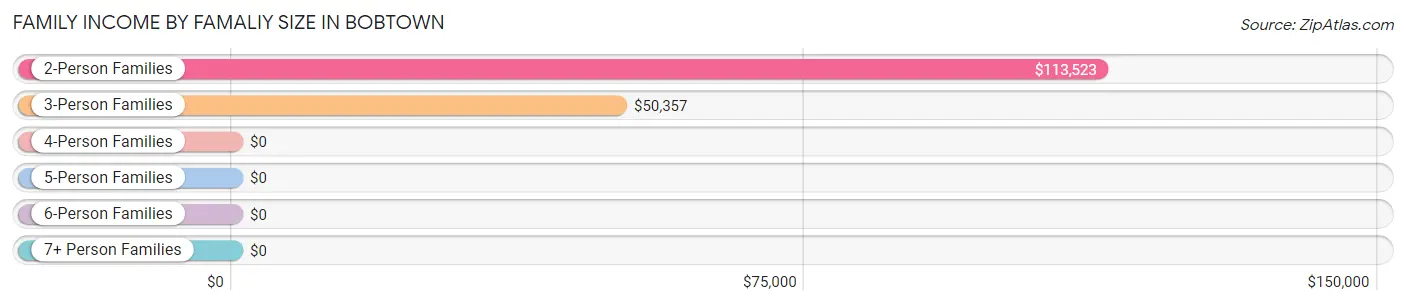
| Income Bracket | # Families | Median Income |
| 2-Person Families | 21 (10.0%) | $113,523 |
| 3-Person Families | 122 (58.1%) | $50,357 |
| 4-Person Families | 23 (11.0%) | $0 |
| 5-Person Families | 0 (0.0%) | $0 |
| 6-Person Families | 44 (20.9%) | $0 |
| 7+ Person Families | 0 (0.0%) | $0 |
| Total | 210 (100.0%) | $46,716 |
Family Income by Number of Earners in Bobtown
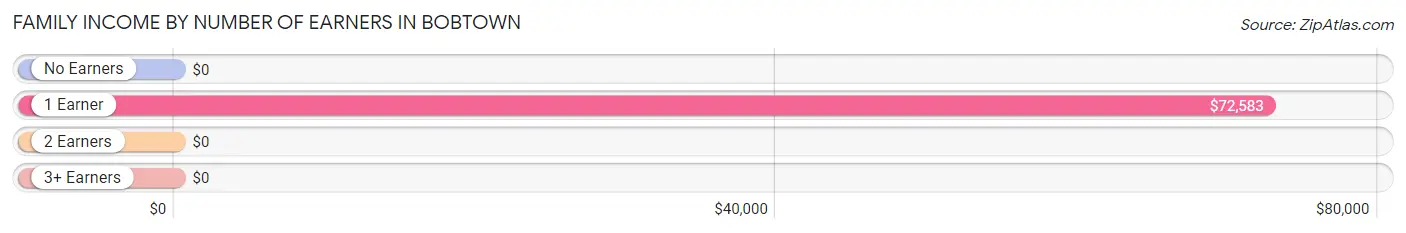
| Number of Earners | # Families | Median Income |
| No Earners | 74 (35.2%) | $0 |
| 1 Earner | 58 (27.6%) | $72,583 |
| 2 Earners | 78 (37.1%) | $0 |
| 3+ Earners | 0 (0.0%) | $0 |
| Total | 210 (100.0%) | $46,716 |
Household Income in Bobtown
Household Income Brackets in Bobtown
With 67 households falling in the category, the $35,000 to $49,999 income range is the most frequent in Bobtown, accounting for 27.5% of all households.
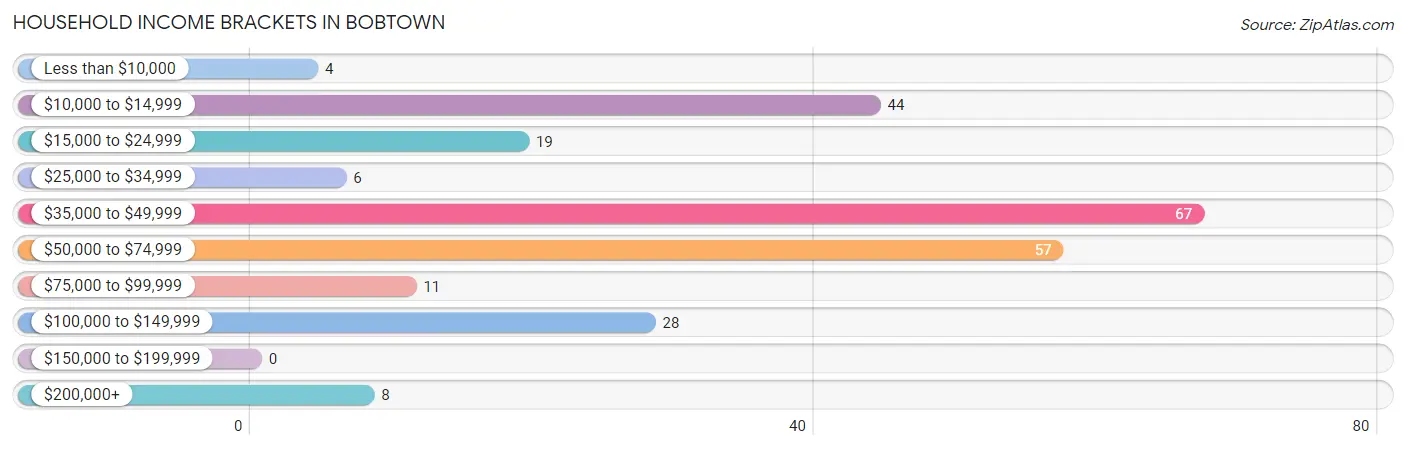
| Income Bracket | # Households | % Households |
| Less than $10,000 | 4 | 1.6% |
| $10,000 to $14,999 | 44 | 18.0% |
| $15,000 to $24,999 | 19 | 7.8% |
| $25,000 to $34,999 | 6 | 2.5% |
| $35,000 to $49,999 | 67 | 27.5% |
| $50,000 to $74,999 | 57 | 23.4% |
| $75,000 to $99,999 | 11 | 4.5% |
| $100,000 to $149,999 | 28 | 11.5% |
| $150,000 to $199,999 | 0 | 0.0% |
| $200,000+ | 8 | 3.3% |
Household Income by Householder Age in Bobtown
The median household income in Bobtown is $46,618, with the highest median household income of $56,875 found in the 65+ years age bracket for the primary householder. A total of 71 households (29.1%) fall into this category. Meanwhile, the 15 to 24 years age bracket for the primary householder has the lowest median household income of $0, with 11 households (4.5%) in this group.
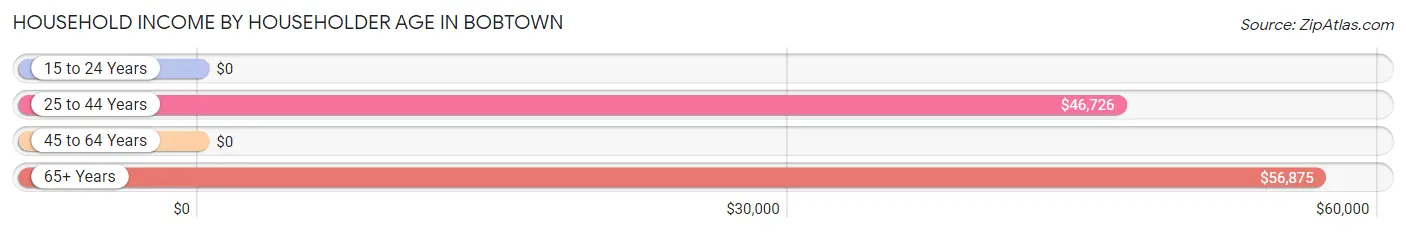
| Income Bracket | # Households | Median Income |
| 15 to 24 Years | 11 (4.5%) | $0 |
| 25 to 44 Years | 70 (28.7%) | $46,726 |
| 45 to 64 Years | 92 (37.7%) | $0 |
| 65+ Years | 71 (29.1%) | $56,875 |
| Total | 244 (100.0%) | $46,618 |
Poverty in Bobtown
Income Below Poverty by Sex and Age in Bobtown
With 2.8% poverty level for males and 47.5% for females among the residents of Bobtown, 45 to 54 year old males and under 5 year old females are the most vulnerable to poverty, with 4 males (33.3%) and 90 females (100.0%) in their respective age groups living below the poverty level.
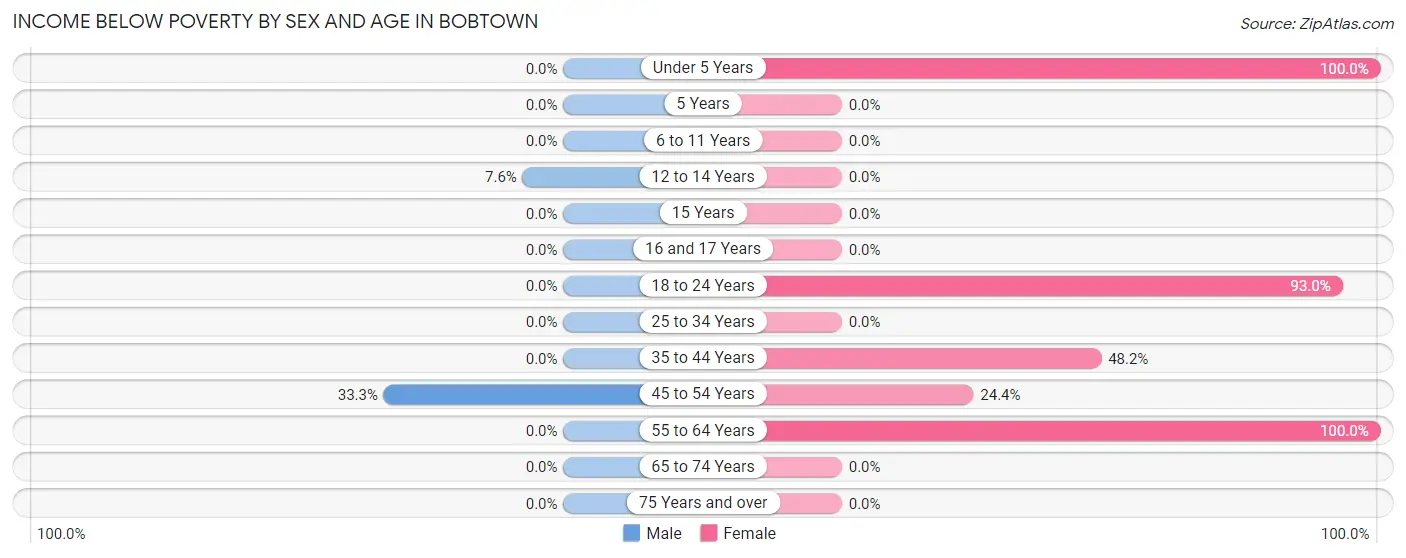
| Age Bracket | Male | Female |
| Under 5 Years | 0 (0.0%) | 90 (100.0%) |
| 5 Years | 0 (0.0%) | 0 (0.0%) |
| 6 to 11 Years | 0 (0.0%) | 0 (0.0%) |
| 12 to 14 Years | 4 (7.5%) | 0 (0.0%) |
| 15 Years | 0 (0.0%) | 0 (0.0%) |
| 16 and 17 Years | 0 (0.0%) | 0 (0.0%) |
| 18 to 24 Years | 0 (0.0%) | 66 (93.0%) |
| 25 to 34 Years | 0 (0.0%) | 0 (0.0%) |
| 35 to 44 Years | 0 (0.0%) | 13 (48.1%) |
| 45 to 54 Years | 4 (33.3%) | 21 (24.4%) |
| 55 to 64 Years | 0 (0.0%) | 44 (100.0%) |
| 65 to 74 Years | 0 (0.0%) | 0 (0.0%) |
| 75 Years and over | 0 (0.0%) | 0 (0.0%) |
| Total | 8 (2.8%) | 234 (47.5%) |
Income Above Poverty by Sex and Age in Bobtown
According to the poverty statistics in Bobtown, males aged 5 years and females aged 12 to 14 years are the age groups that are most secure financially, with 100.0% of males and 100.0% of females in these age groups living above the poverty line.
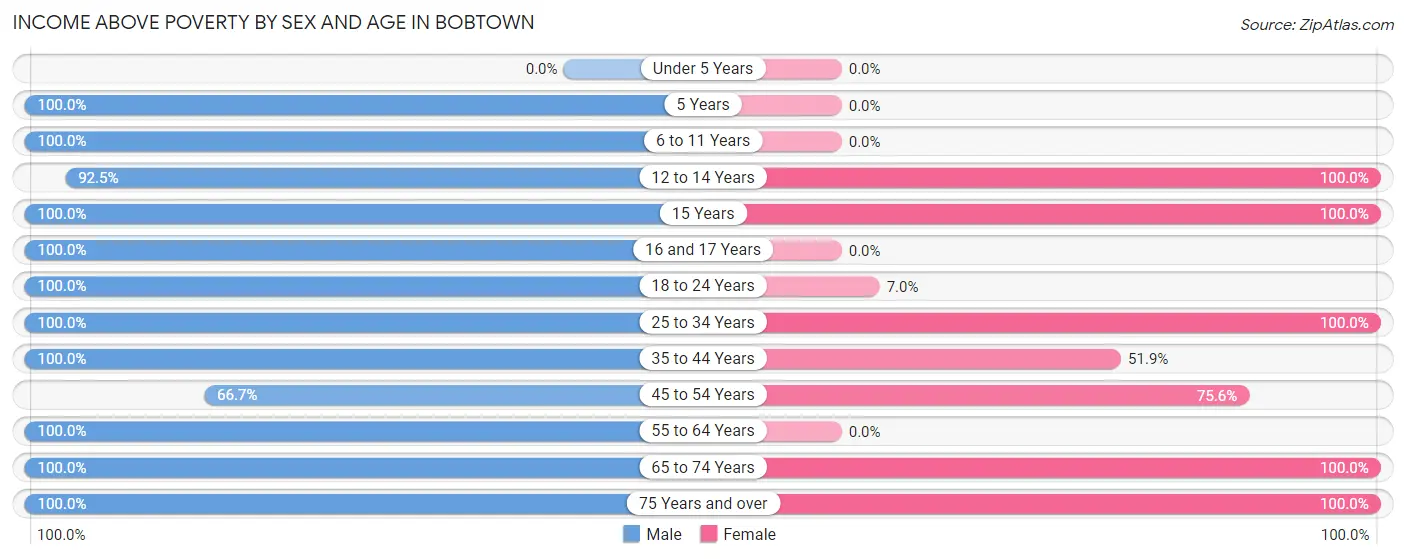
| Age Bracket | Male | Female |
| Under 5 Years | 0 (0.0%) | 0 (0.0%) |
| 5 Years | 16 (100.0%) | 0 (0.0%) |
| 6 to 11 Years | 31 (100.0%) | 0 (0.0%) |
| 12 to 14 Years | 49 (92.4%) | 36 (100.0%) |
| 15 Years | 16 (100.0%) | 9 (100.0%) |
| 16 and 17 Years | 16 (100.0%) | 0 (0.0%) |
| 18 to 24 Years | 29 (100.0%) | 5 (7.0%) |
| 25 to 34 Years | 14 (100.0%) | 58 (100.0%) |
| 35 to 44 Years | 50 (100.0%) | 14 (51.8%) |
| 45 to 54 Years | 8 (66.7%) | 65 (75.6%) |
| 55 to 64 Years | 25 (100.0%) | 0 (0.0%) |
| 65 to 74 Years | 21 (100.0%) | 27 (100.0%) |
| 75 Years and over | 4 (100.0%) | 45 (100.0%) |
| Total | 279 (97.2%) | 259 (52.5%) |
Income Below Poverty Among Married-Couple Families in Bobtown
The poverty statistics for married-couple families in Bobtown show that 4.3% or 4 of the total 93 families live below the poverty line. Families with 1 or 2 children have the highest poverty rate of 6.4%, comprising of 4 families. On the other hand, families with no children have the lowest poverty rate of 0.0%, which includes 0 families.
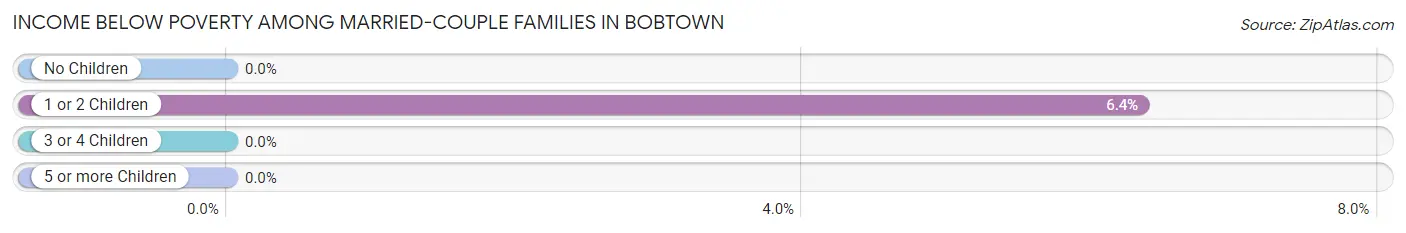
| Children | Above Poverty | Below Poverty |
| No Children | 30 (100.0%) | 0 (0.0%) |
| 1 or 2 Children | 59 (93.6%) | 4 (6.4%) |
| 3 or 4 Children | 0 (0.0%) | 0 (0.0%) |
| 5 or more Children | 0 (0.0%) | 0 (0.0%) |
| Total | 89 (95.7%) | 4 (4.3%) |
Income Below Poverty Among Single-Parent Households in Bobtown
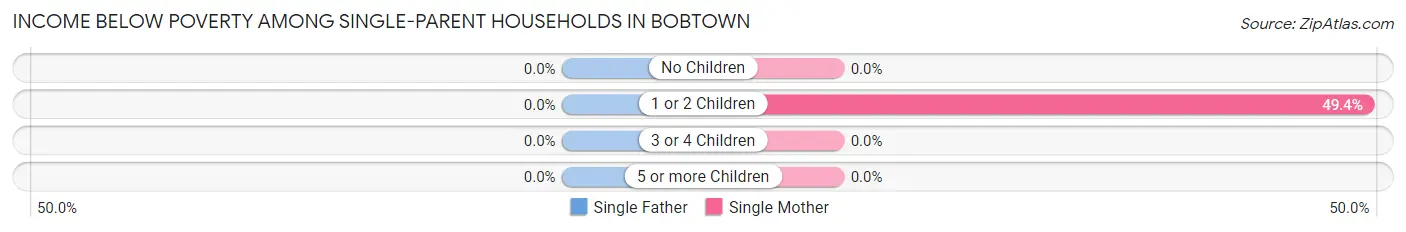
| Children | Single Father | Single Mother |
| No Children | 0 (0.0%) | 0 (0.0%) |
| 1 or 2 Children | 0 (0.0%) | 44 (49.4%) |
| 3 or 4 Children | 0 (0.0%) | 0 (0.0%) |
| 5 or more Children | 0 (0.0%) | 0 (0.0%) |
| Total | 0 (0.0%) | 44 (49.4%) |
Income Below Poverty Among Married-Couple vs Single-Parent Households in Bobtown
The poverty data for Bobtown shows that 4 of the married-couple family households (4.3%) and 44 of the single-parent households (37.6%) are living below the poverty level. Within the married-couple family households, those with 1 or 2 children have the highest poverty rate, with 4 households (6.4%) falling below the poverty line. Among the single-parent households, those with 1 or 2 children have the highest poverty rate, with 44 household (49.4%) living below poverty.
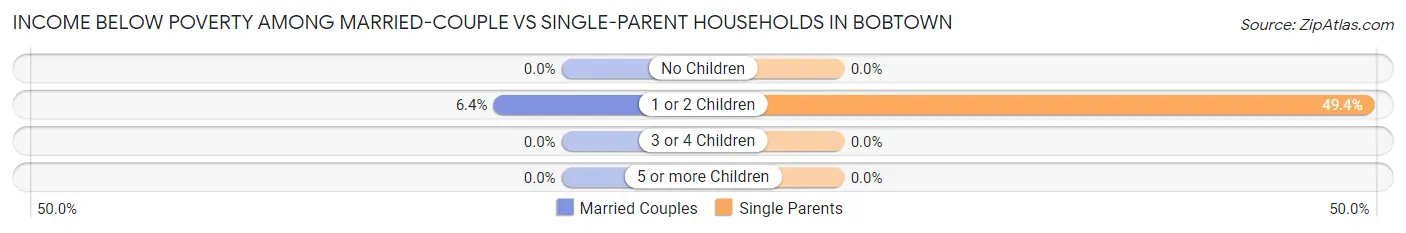
| Children | Married-Couple Families | Single-Parent Households |
| No Children | 0 (0.0%) | 0 (0.0%) |
| 1 or 2 Children | 4 (6.4%) | 44 (49.4%) |
| 3 or 4 Children | 0 (0.0%) | 0 (0.0%) |
| 5 or more Children | 0 (0.0%) | 0 (0.0%) |
| Total | 4 (4.3%) | 44 (37.6%) |
Race in Bobtown
The most populous races in Bobtown are White / Caucasian (752 | 96.4%), Two or more Races (28 | 3.6%), and Hispanic or Latino (24 | 3.1%).
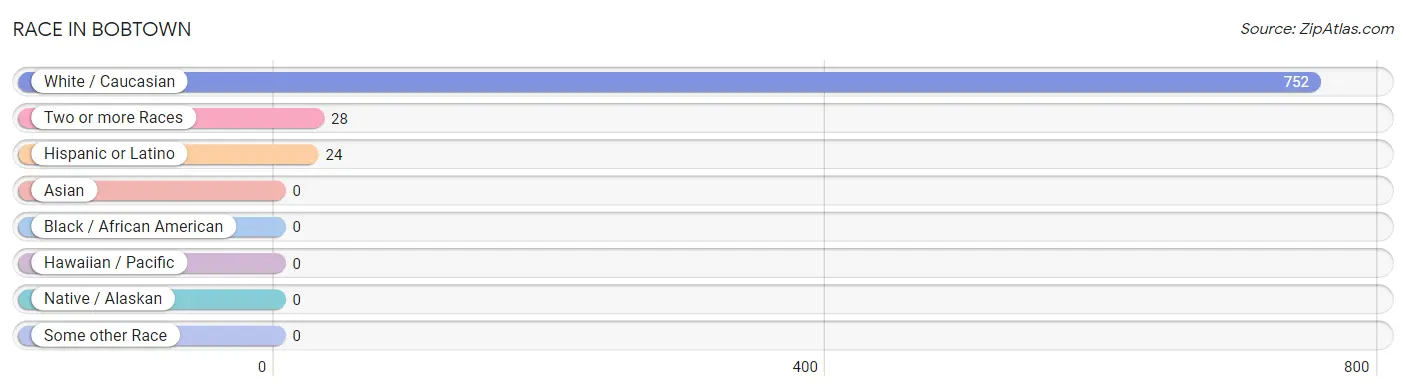
| Race | # Population | % Population |
| Asian | 0 | 0.0% |
| Black / African American | 0 | 0.0% |
| Hawaiian / Pacific | 0 | 0.0% |
| Hispanic or Latino | 24 | 3.1% |
| Native / Alaskan | 0 | 0.0% |
| White / Caucasian | 752 | 96.4% |
| Two or more Races | 28 | 3.6% |
| Some other Race | 0 | 0.0% |
| Total | 780 | 100.0% |
Ancestry in Bobtown
The most populous ancestries reported in Bobtown are American (234 | 30.0%), Irish (208 | 26.7%), German (146 | 18.7%), Italian (143 | 18.3%), and Polish (90 | 11.5%), together accounting for 105.3% of all Bobtown residents.
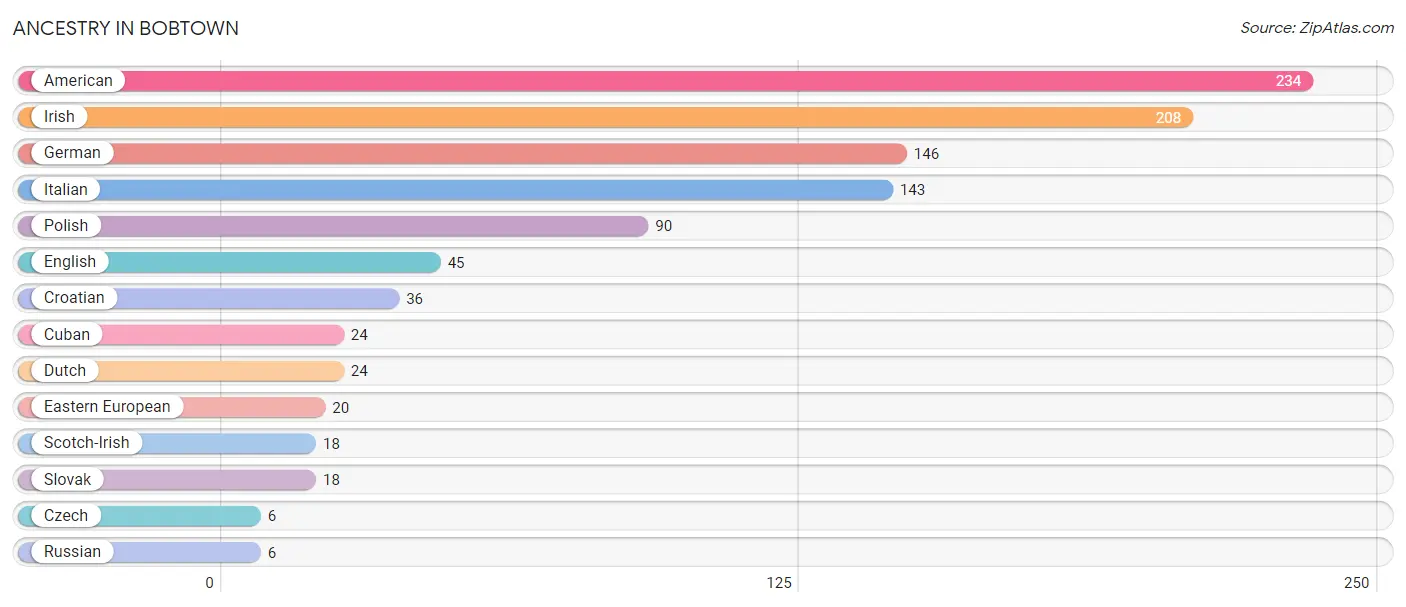
| Ancestry | # Population | % Population |
| American | 234 | 30.0% |
| Croatian | 36 | 4.6% |
| Cuban | 24 | 3.1% |
| Czech | 6 | 0.8% |
| Dutch | 24 | 3.1% |
| Eastern European | 20 | 2.6% |
| English | 45 | 5.8% |
| German | 146 | 18.7% |
| Irish | 208 | 26.7% |
| Italian | 143 | 18.3% |
| Polish | 90 | 11.5% |
| Russian | 6 | 0.8% |
| Scotch-Irish | 18 | 2.3% |
| Slovak | 18 | 2.3% | View All 14 Rows |
Immigrants in Bobtown

| Immigration Origin | # Population | % Population | View All 0 Rows |
Sex and Age in Bobtown
Sex and Age in Bobtown
The most populous age groups in Bobtown are 10 to 14 Years (59 | 20.6%) for men and Under 5 Years (90 | 18.3%) for women.
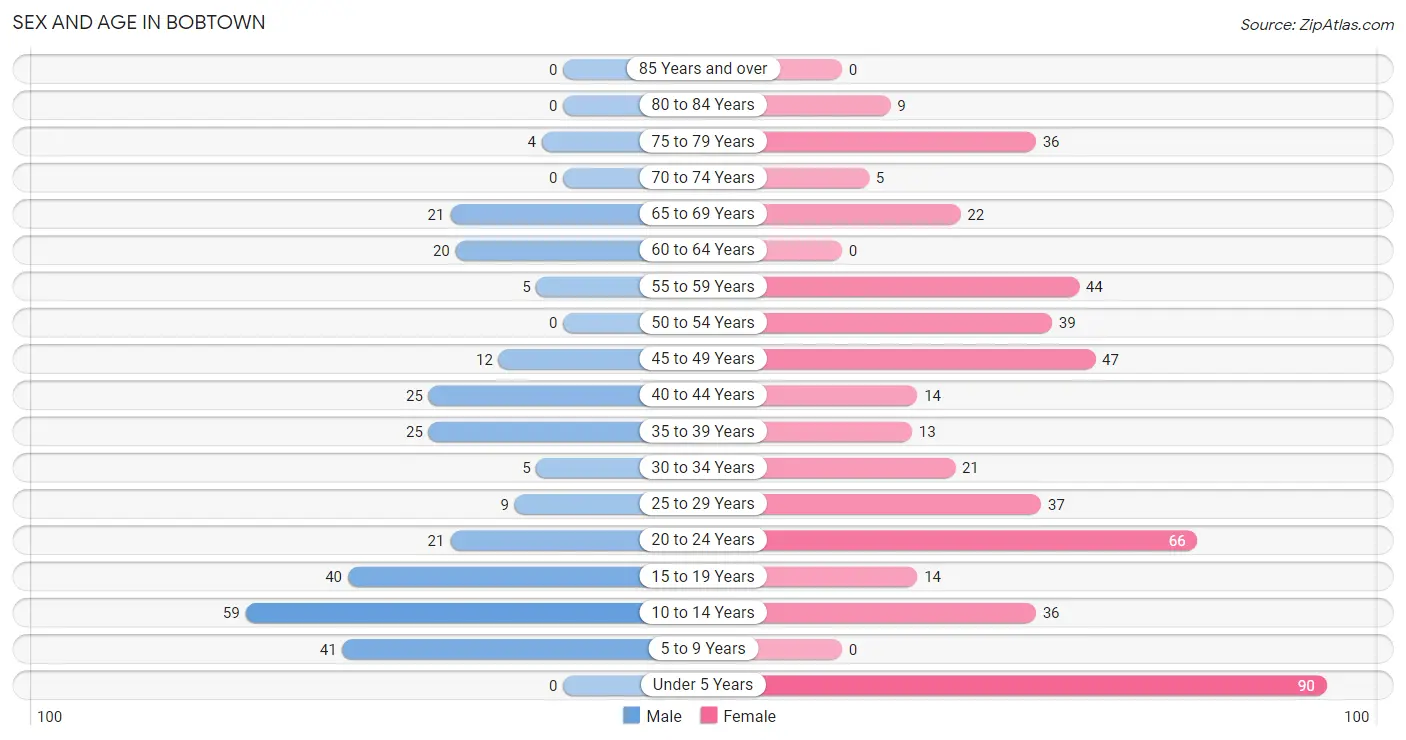
| Age Bracket | Male | Female |
| Under 5 Years | 0 (0.0%) | 90 (18.3%) |
| 5 to 9 Years | 41 (14.3%) | 0 (0.0%) |
| 10 to 14 Years | 59 (20.6%) | 36 (7.3%) |
| 15 to 19 Years | 40 (13.9%) | 14 (2.8%) |
| 20 to 24 Years | 21 (7.3%) | 66 (13.4%) |
| 25 to 29 Years | 9 (3.1%) | 37 (7.5%) |
| 30 to 34 Years | 5 (1.7%) | 21 (4.3%) |
| 35 to 39 Years | 25 (8.7%) | 13 (2.6%) |
| 40 to 44 Years | 25 (8.7%) | 14 (2.8%) |
| 45 to 49 Years | 12 (4.2%) | 47 (9.5%) |
| 50 to 54 Years | 0 (0.0%) | 39 (7.9%) |
| 55 to 59 Years | 5 (1.7%) | 44 (8.9%) |
| 60 to 64 Years | 20 (7.0%) | 0 (0.0%) |
| 65 to 69 Years | 21 (7.3%) | 22 (4.5%) |
| 70 to 74 Years | 0 (0.0%) | 5 (1.0%) |
| 75 to 79 Years | 4 (1.4%) | 36 (7.3%) |
| 80 to 84 Years | 0 (0.0%) | 9 (1.8%) |
| 85 Years and over | 0 (0.0%) | 0 (0.0%) |
| Total | 287 (100.0%) | 493 (100.0%) |
Families and Households in Bobtown
Median Family Size in Bobtown
The median family size in Bobtown is 3.52 persons per family, with single female/mother families (89 | 42.4%) accounting for the largest median family size of 3.84 persons per family. On the other hand, single male/father families (28 | 13.3%) represent the smallest median family size with 2.93 persons per family.
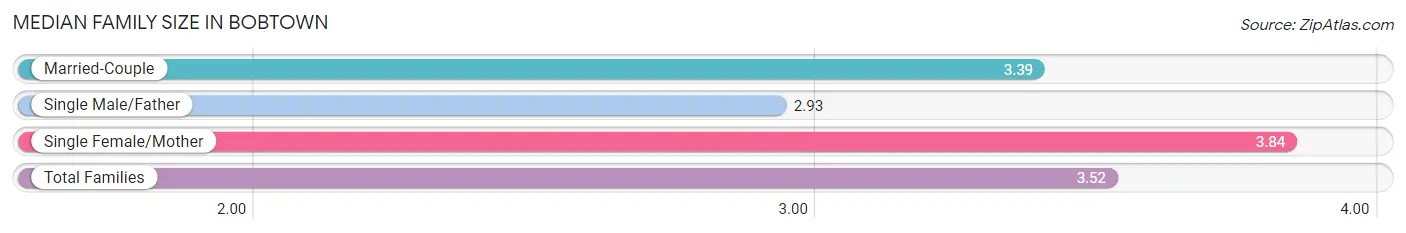
| Family Type | # Families | Family Size |
| Married-Couple | 93 (44.3%) | 3.39 |
| Single Male/Father | 28 (13.3%) | 2.93 |
| Single Female/Mother | 89 (42.4%) | 3.84 |
| Total Families | 210 (100.0%) | 3.52 |
Median Household Size in Bobtown
The median household size in Bobtown is 3.20 persons per household, with single female/mother households (89 | 36.5%) accounting for the largest median household size of 3.84 persons per household. non-family households (34 | 13.9%) represent the smallest median household size with 1.21 persons per household.
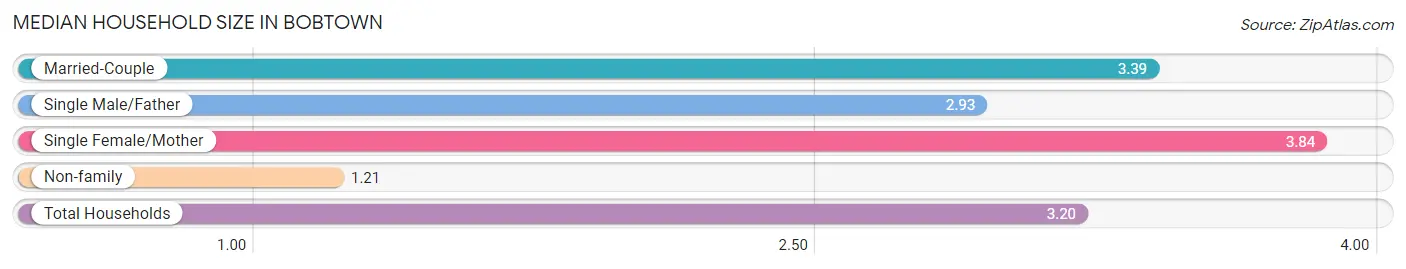
| Household Type | # Households | Household Size |
| Married-Couple | 93 (38.1%) | 3.39 |
| Single Male/Father | 28 (11.5%) | 2.93 |
| Single Female/Mother | 89 (36.5%) | 3.84 |
| Non-family | 34 (13.9%) | 1.21 |
| Total Households | 244 (100.0%) | 3.20 |
Household Size by Marriage Status in Bobtown
Out of a total of 244 households in Bobtown, 210 (86.1%) are family households, while 34 (13.9%) are nonfamily households. The most numerous type of family households are 3-person households, comprising 122, and the most common type of nonfamily households are 1-person households, comprising 28.
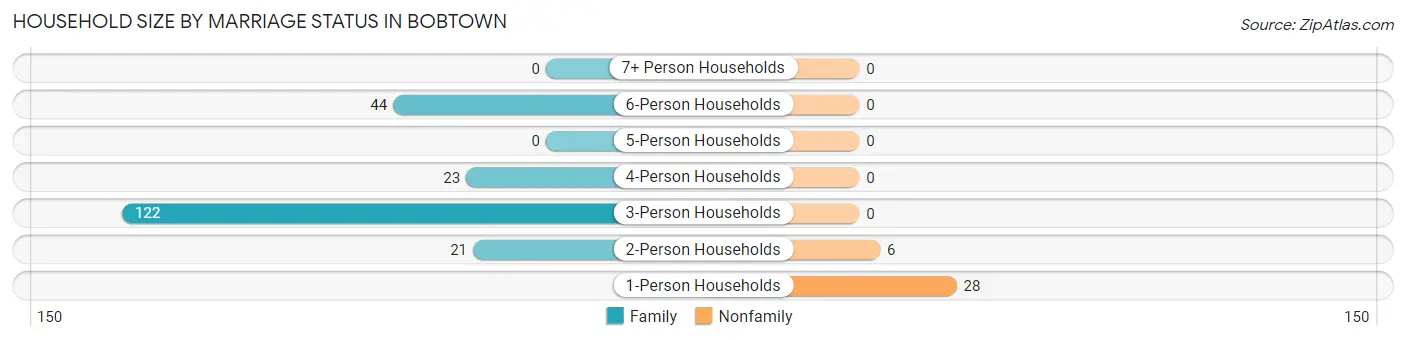
| Household Size | Family Households | Nonfamily Households |
| 1-Person Households | - | 28 (11.5%) |
| 2-Person Households | 21 (8.6%) | 6 (2.5%) |
| 3-Person Households | 122 (50.0%) | 0 (0.0%) |
| 4-Person Households | 23 (9.4%) | 0 (0.0%) |
| 5-Person Households | 0 (0.0%) | 0 (0.0%) |
| 6-Person Households | 44 (18.0%) | 0 (0.0%) |
| 7+ Person Households | 0 (0.0%) | 0 (0.0%) |
| Total | 210 (86.1%) | 34 (13.9%) |
Female Fertility in Bobtown
Fertility by Age in Bobtown
Average fertility rate in Bobtown is 146.0 births per 1,000 women. Women in the age bracket of 20 to 34 years have the highest fertility rate with 274.0 births per 1,000 women. Women in the age bracket of 20 to 34 years acount for 100.0% of all women with births.
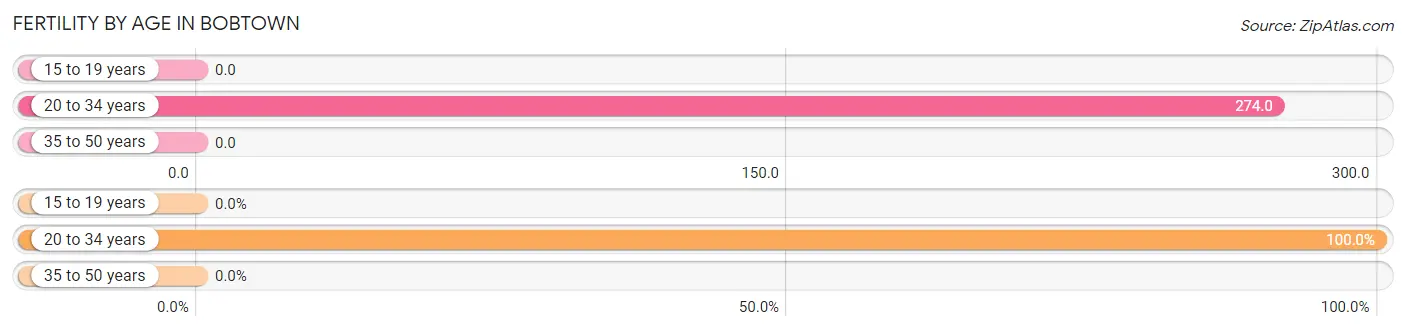
| Age Bracket | Women with Births | Births / 1,000 Women |
| 15 to 19 years | 0 (0.0%) | 0.0 |
| 20 to 34 years | 34 (100.0%) | 274.0 |
| 35 to 50 years | 0 (0.0%) | 0.0 |
| Total | 34 (100.0%) | 146.0 |
Fertility by Age by Marriage Status in Bobtown
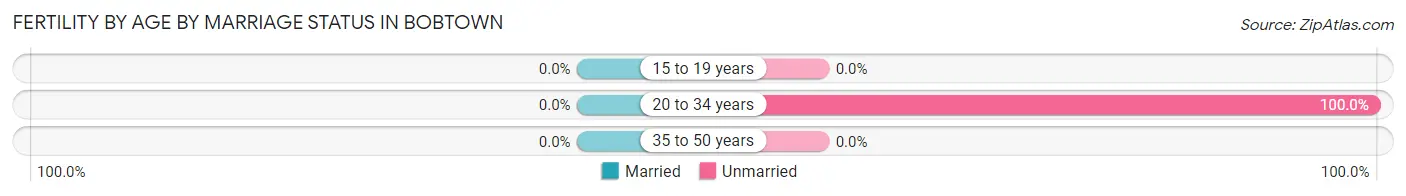
| Age Bracket | Married | Unmarried |
| 15 to 19 years | 0 (0.0%) | 0 (0.0%) |
| 20 to 34 years | 0 (0.0%) | 34 (100.0%) |
| 35 to 50 years | 0 (0.0%) | 0 (0.0%) |
| Total | 0 (0.0%) | 34 (100.0%) |
Fertility by Education in Bobtown
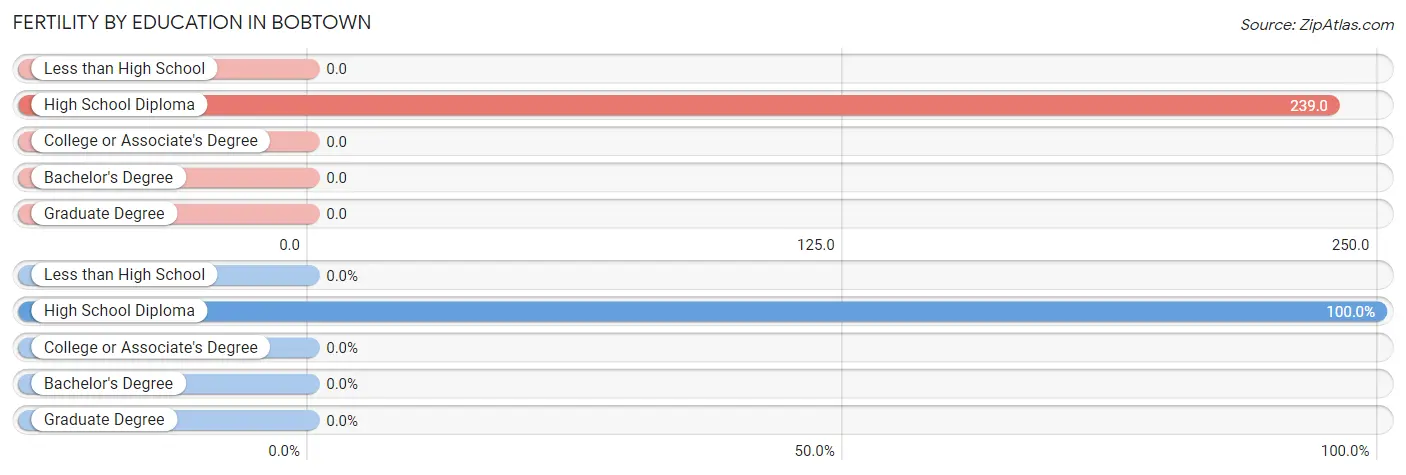
| Educational Attainment | Women with Births | Births / 1,000 Women |
| Less than High School | 0 (0.0%) | 0.0 |
| High School Diploma | 34 (100.0%) | 239.0 |
| College or Associate's Degree | 0 (0.0%) | 0.0 |
| Bachelor's Degree | 0 (0.0%) | 0.0 |
| Graduate Degree | 0 (0.0%) | 0.0 |
| Total | 34 (100.0%) | 146.0 |
Fertility by Education by Marriage Status in Bobtown
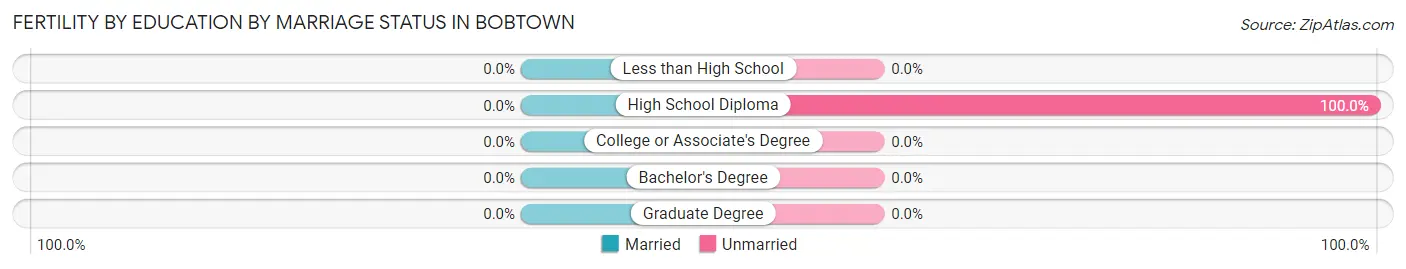
| Educational Attainment | Married | Unmarried |
| Less than High School | 0 (0.0%) | 0 (0.0%) |
| High School Diploma | 0 (0.0%) | 34 (100.0%) |
| College or Associate's Degree | 0 (0.0%) | 0 (0.0%) |
| Bachelor's Degree | 0 (0.0%) | 0 (0.0%) |
| Graduate Degree | 0 (0.0%) | 0 (0.0%) |
| Total | 0 (0.0%) | 34 (100.0%) |
Employment Characteristics in Bobtown
Employment by Class of Employer in Bobtown
Among the 237 employed individuals in Bobtown, private company employees (135 | 57.0%), not-for-profit organizations (60 | 25.3%), and self-employed (not incorporated) (25 | 10.5%) make up the most common classes of employment.
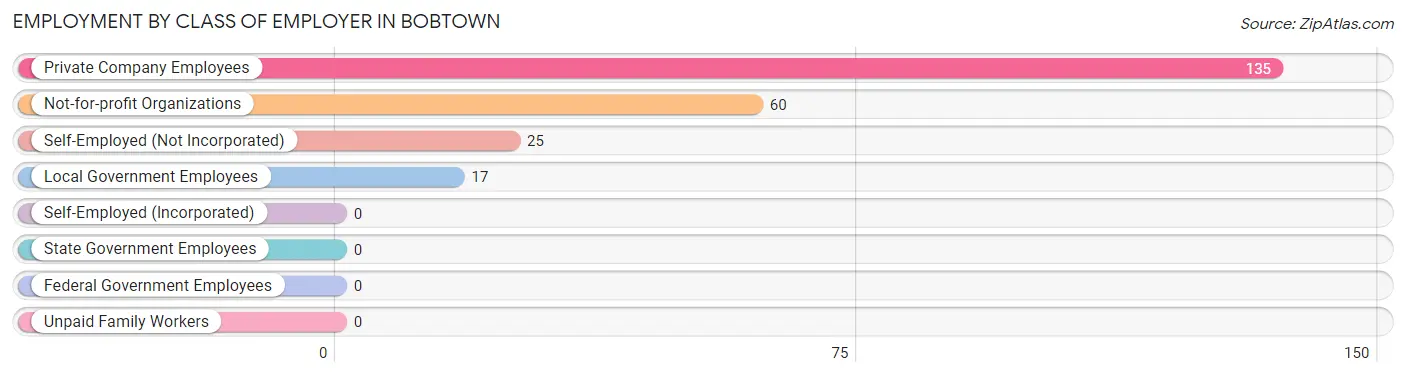
| Employer Class | # Employees | % Employees |
| Private Company Employees | 135 | 57.0% |
| Self-Employed (Incorporated) | 0 | 0.0% |
| Self-Employed (Not Incorporated) | 25 | 10.5% |
| Not-for-profit Organizations | 60 | 25.3% |
| Local Government Employees | 17 | 7.2% |
| State Government Employees | 0 | 0.0% |
| Federal Government Employees | 0 | 0.0% |
| Unpaid Family Workers | 0 | 0.0% |
| Total | 237 | 100.0% |
Employment Status by Age in Bobtown
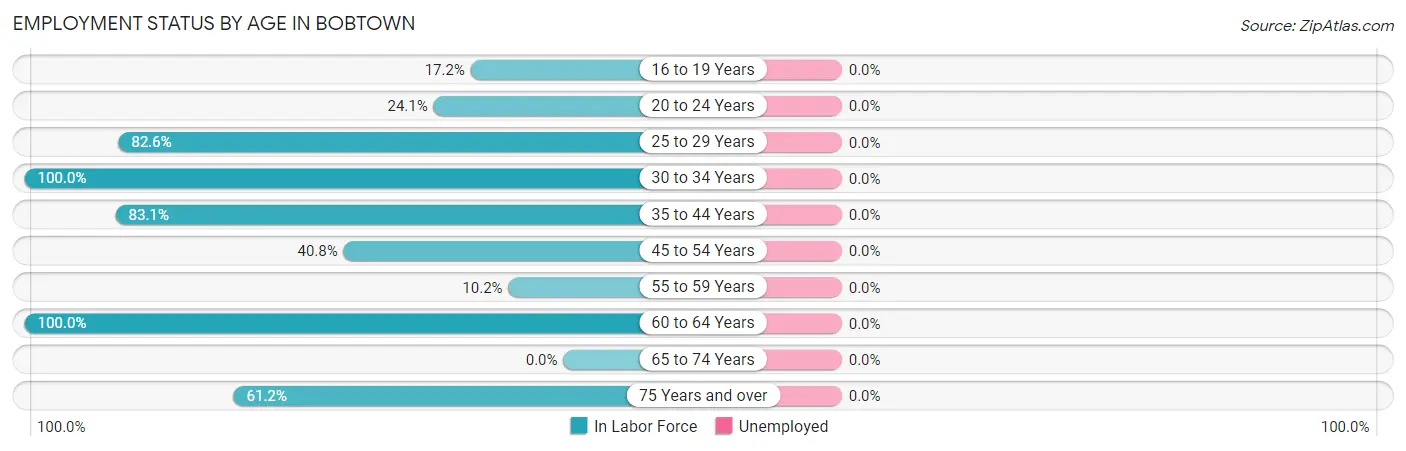
| Age Bracket | In Labor Force | Unemployed |
| 16 to 19 Years | 5 (17.2%) | 0 (0.0%) |
| 20 to 24 Years | 21 (24.1%) | 0 (0.0%) |
| 25 to 29 Years | 38 (82.6%) | 0 (0.0%) |
| 30 to 34 Years | 26 (100.0%) | 0 (0.0%) |
| 35 to 44 Years | 64 (83.1%) | 0 (0.0%) |
| 45 to 54 Years | 40 (40.8%) | 0 (0.0%) |
| 55 to 59 Years | 5 (10.2%) | 0 (0.0%) |
| 60 to 64 Years | 20 (100.0%) | 0 (0.0%) |
| 65 to 74 Years | 0 (0.0%) | 0 (0.0%) |
| 75 Years and over | 30 (61.2%) | 0 (0.0%) |
| Total | 249 (47.1%) | 0 (0.0%) |
Employment Status by Educational Attainment in Bobtown
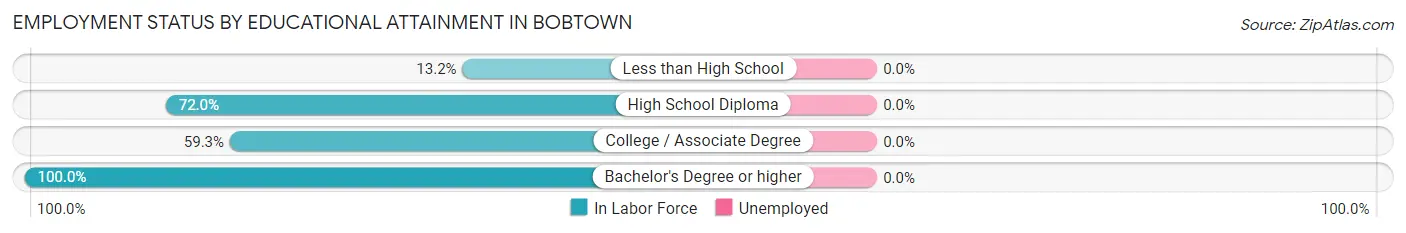
| Educational Attainment | In Labor Force | Unemployed |
| Less than High School | 7 (13.2%) | 0 (0.0%) |
| High School Diploma | 136 (72.0%) | 0 (0.0%) |
| College / Associate Degree | 35 (59.3%) | 0 (0.0%) |
| Bachelor's Degree or higher | 15 (100.0%) | 0 (0.0%) |
| Total | 193 (61.1%) | 0 (0.0%) |
Employment Occupations by Sex in Bobtown
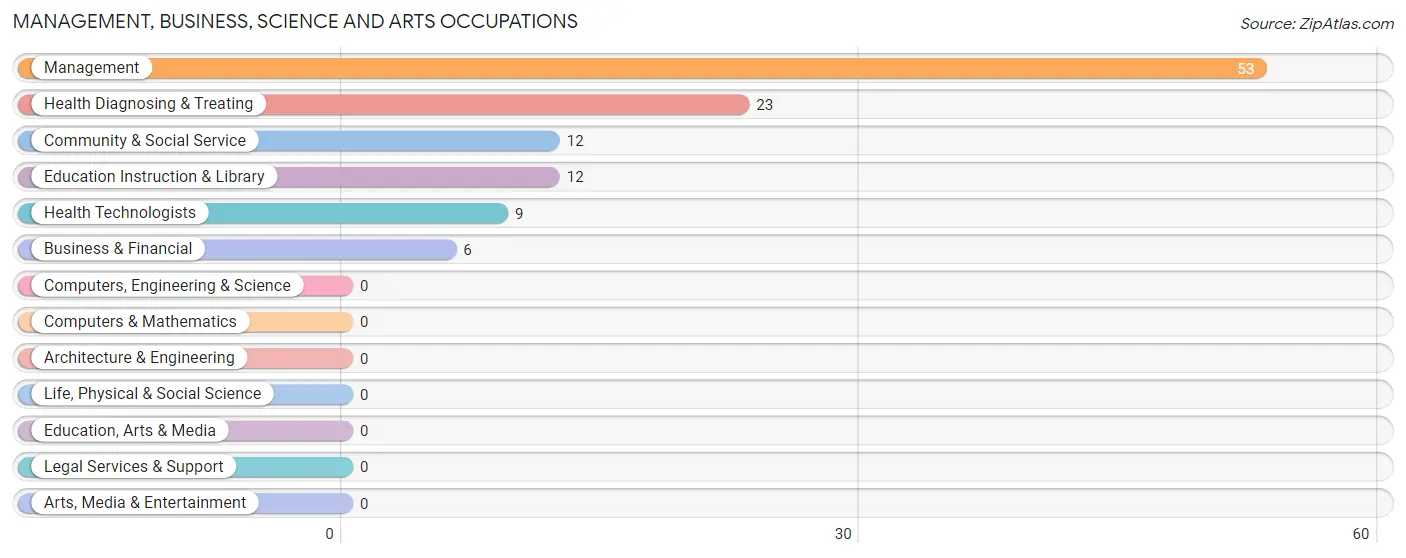
Management, Business, Science and Arts Occupations
The most common Management, Business, Science and Arts occupations in Bobtown are Management (53 | 21.3%), Health Diagnosing & Treating (23 | 9.2%), Community & Social Service (12 | 4.8%), Education Instruction & Library (12 | 4.8%), and Health Technologists (9 | 3.6%).
Management, Business, Science and Arts Occupations by Sex
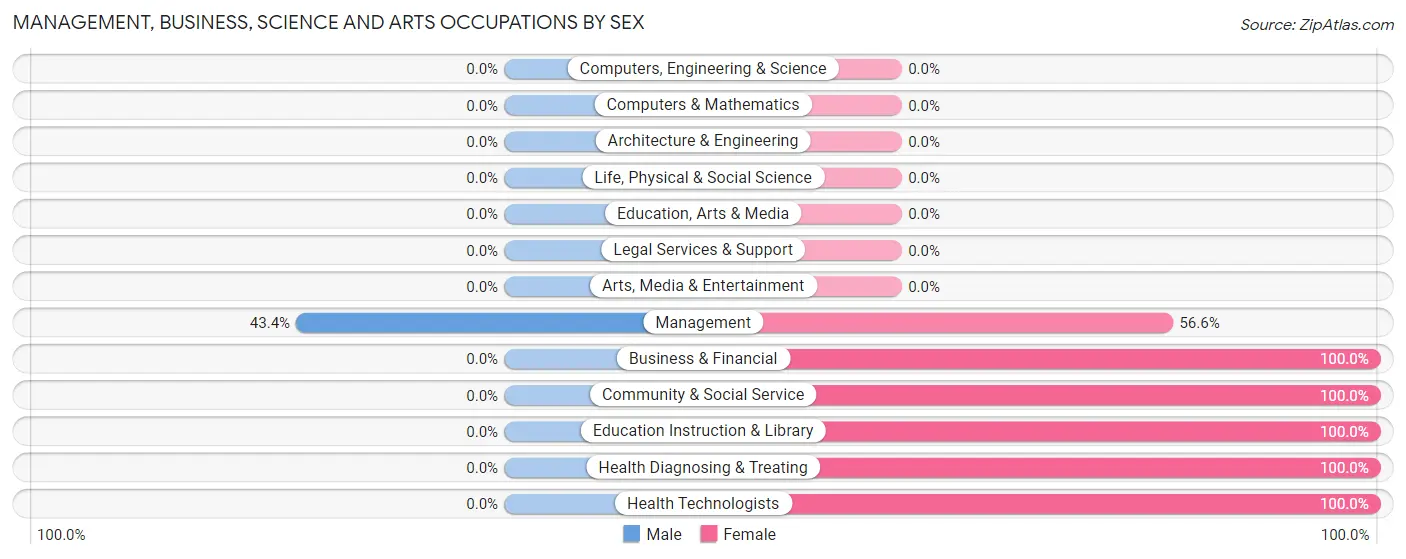
| Occupation | Male | Female |
| Management | 23 (43.4%) | 30 (56.6%) |
| Business & Financial | 0 (0.0%) | 6 (100.0%) |
| Computers, Engineering & Science | 0 (0.0%) | 0 (0.0%) |
| Computers & Mathematics | 0 (0.0%) | 0 (0.0%) |
| Architecture & Engineering | 0 (0.0%) | 0 (0.0%) |
| Life, Physical & Social Science | 0 (0.0%) | 0 (0.0%) |
| Community & Social Service | 0 (0.0%) | 12 (100.0%) |
| Education, Arts & Media | 0 (0.0%) | 0 (0.0%) |
| Legal Services & Support | 0 (0.0%) | 0 (0.0%) |
| Education Instruction & Library | 0 (0.0%) | 12 (100.0%) |
| Arts, Media & Entertainment | 0 (0.0%) | 0 (0.0%) |
| Health Diagnosing & Treating | 0 (0.0%) | 23 (100.0%) |
| Health Technologists | 0 (0.0%) | 9 (100.0%) |
| Total (Category) | 23 (24.5%) | 71 (75.5%) |
| Total (Overall) | 116 (46.6%) | 133 (53.4%) |
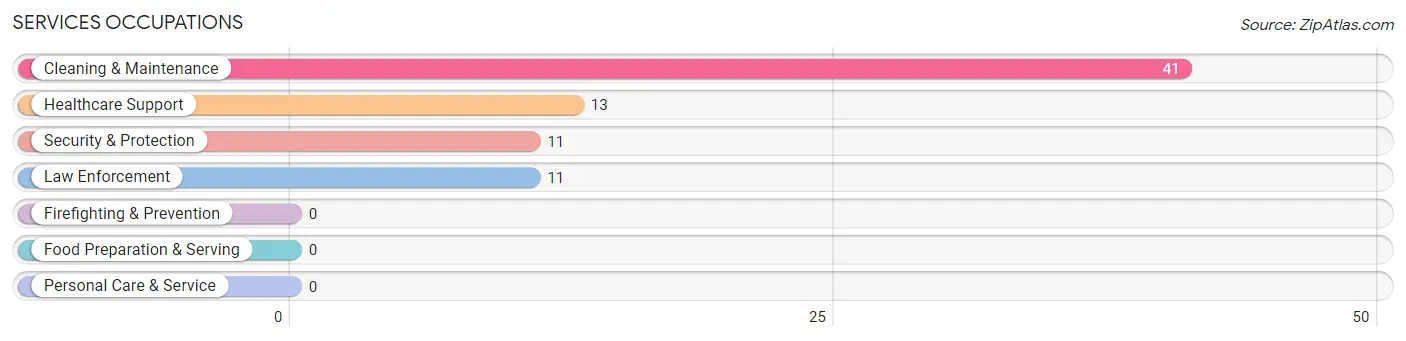
Services Occupations
The most common Services occupations in Bobtown are Cleaning & Maintenance (41 | 16.5%), Healthcare Support (13 | 5.2%), Security & Protection (11 | 4.4%), and Law Enforcement (11 | 4.4%).
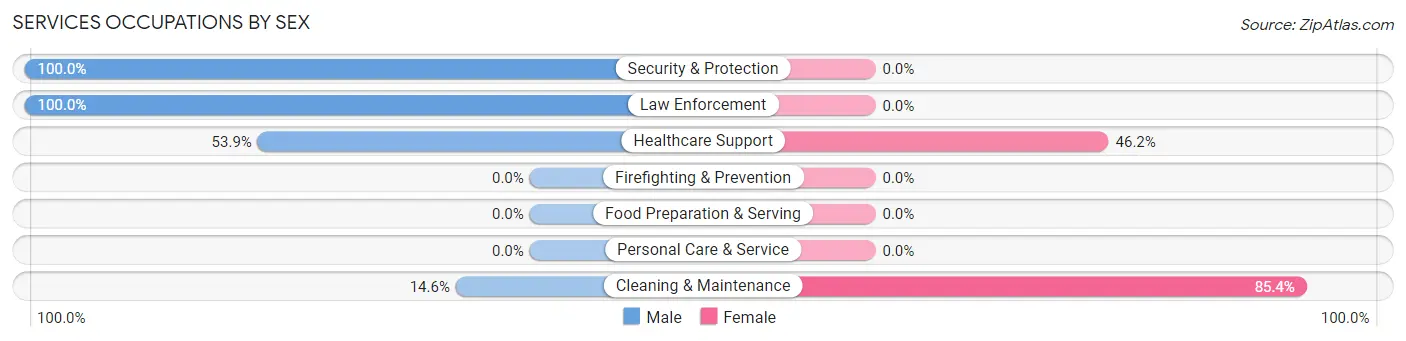
Services Occupations by Sex
Within the Services occupations in Bobtown, the most male-oriented occupations are Security & Protection (100.0%), Law Enforcement (100.0%), and Healthcare Support (53.8%), while the most female-oriented occupations are Cleaning & Maintenance (85.4%), and Healthcare Support (46.2%).
| Occupation | Male | Female |
| Healthcare Support | 7 (53.8%) | 6 (46.2%) |
| Security & Protection | 11 (100.0%) | 0 (0.0%) |
| Firefighting & Prevention | 0 (0.0%) | 0 (0.0%) |
| Law Enforcement | 11 (100.0%) | 0 (0.0%) |
| Food Preparation & Serving | 0 (0.0%) | 0 (0.0%) |
| Cleaning & Maintenance | 6 (14.6%) | 35 (85.4%) |
| Personal Care & Service | 0 (0.0%) | 0 (0.0%) |
| Total (Category) | 24 (36.9%) | 41 (63.1%) |
| Total (Overall) | 116 (46.6%) | 133 (53.4%) |
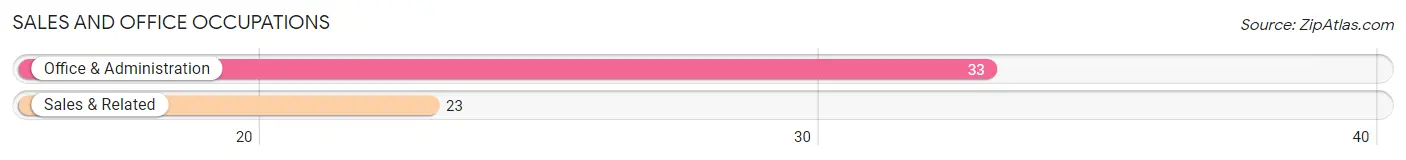
Sales and Office Occupations
The most common Sales and Office occupations in Bobtown are Office & Administration (33 | 13.3%), and Sales & Related (23 | 9.2%).
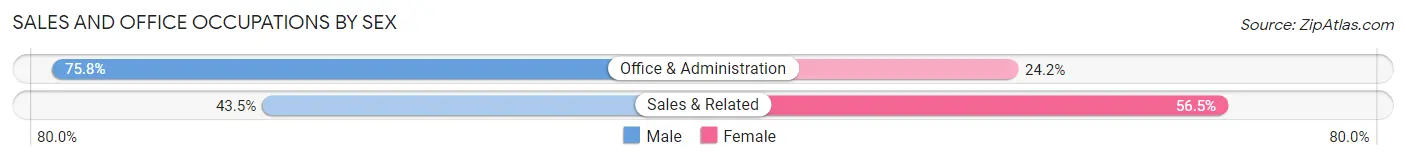
Sales and Office Occupations by Sex
| Occupation | Male | Female |
| Sales & Related | 10 (43.5%) | 13 (56.5%) |
| Office & Administration | 25 (75.8%) | 8 (24.2%) |
| Total (Category) | 35 (62.5%) | 21 (37.5%) |
| Total (Overall) | 116 (46.6%) | 133 (53.4%) |
Natural Resources, Construction and Maintenance Occupations
The most common Natural Resources, Construction and Maintenance occupations in Bobtown are , and Construction & Extraction (26 | 10.4%).
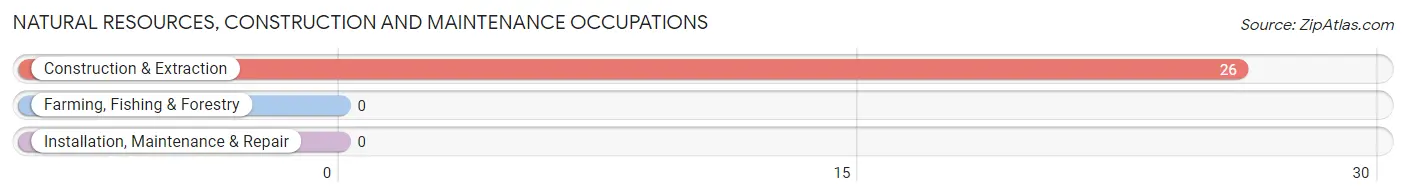
Natural Resources, Construction and Maintenance Occupations by Sex
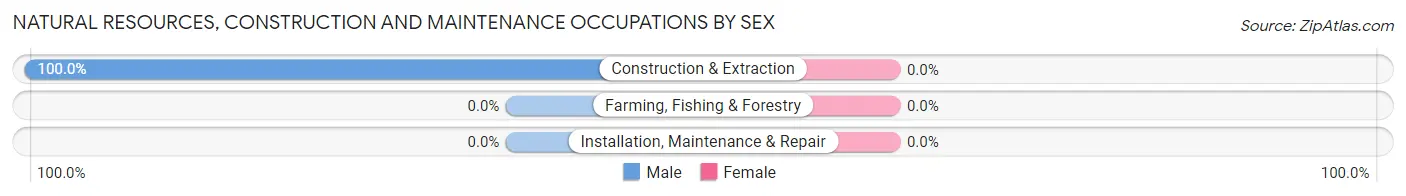
| Occupation | Male | Female |
| Farming, Fishing & Forestry | 0 (0.0%) | 0 (0.0%) |
| Construction & Extraction | 26 (100.0%) | 0 (0.0%) |
| Installation, Maintenance & Repair | 0 (0.0%) | 0 (0.0%) |
| Total (Category) | 26 (100.0%) | 0 (0.0%) |
| Total (Overall) | 116 (46.6%) | 133 (53.4%) |
Production, Transportation and Moving Occupations
The most common Production, Transportation and Moving occupations in Bobtown are , and Production (8 | 3.2%).
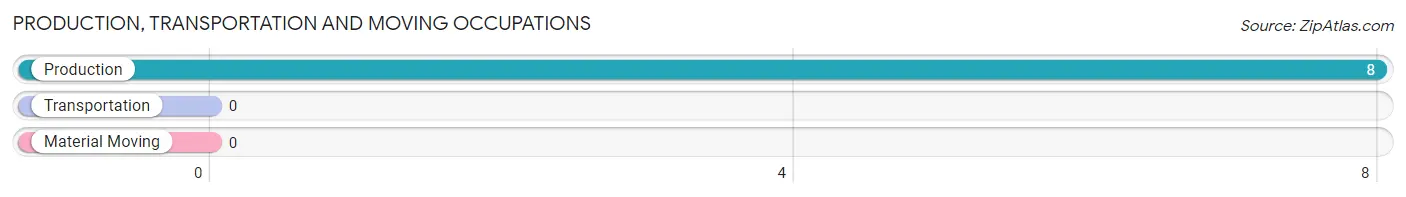
Production, Transportation and Moving Occupations by Sex
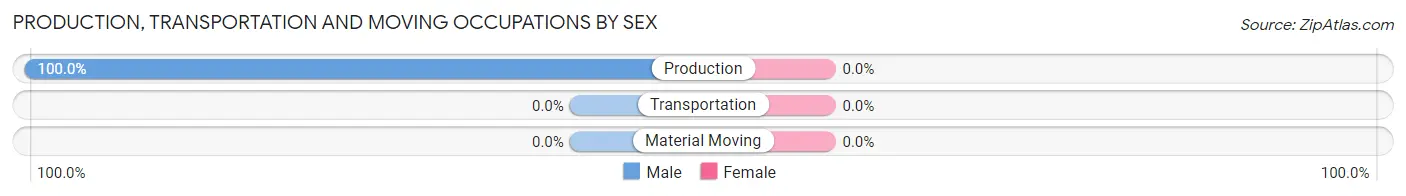
| Occupation | Male | Female |
| Production | 8 (100.0%) | 0 (0.0%) |
| Transportation | 0 (0.0%) | 0 (0.0%) |
| Material Moving | 0 (0.0%) | 0 (0.0%) |
| Total (Category) | 8 (100.0%) | 0 (0.0%) |
| Total (Overall) | 116 (46.6%) | 133 (53.4%) |
Employment Industries by Sex in Bobtown
Employment Industries in Bobtown
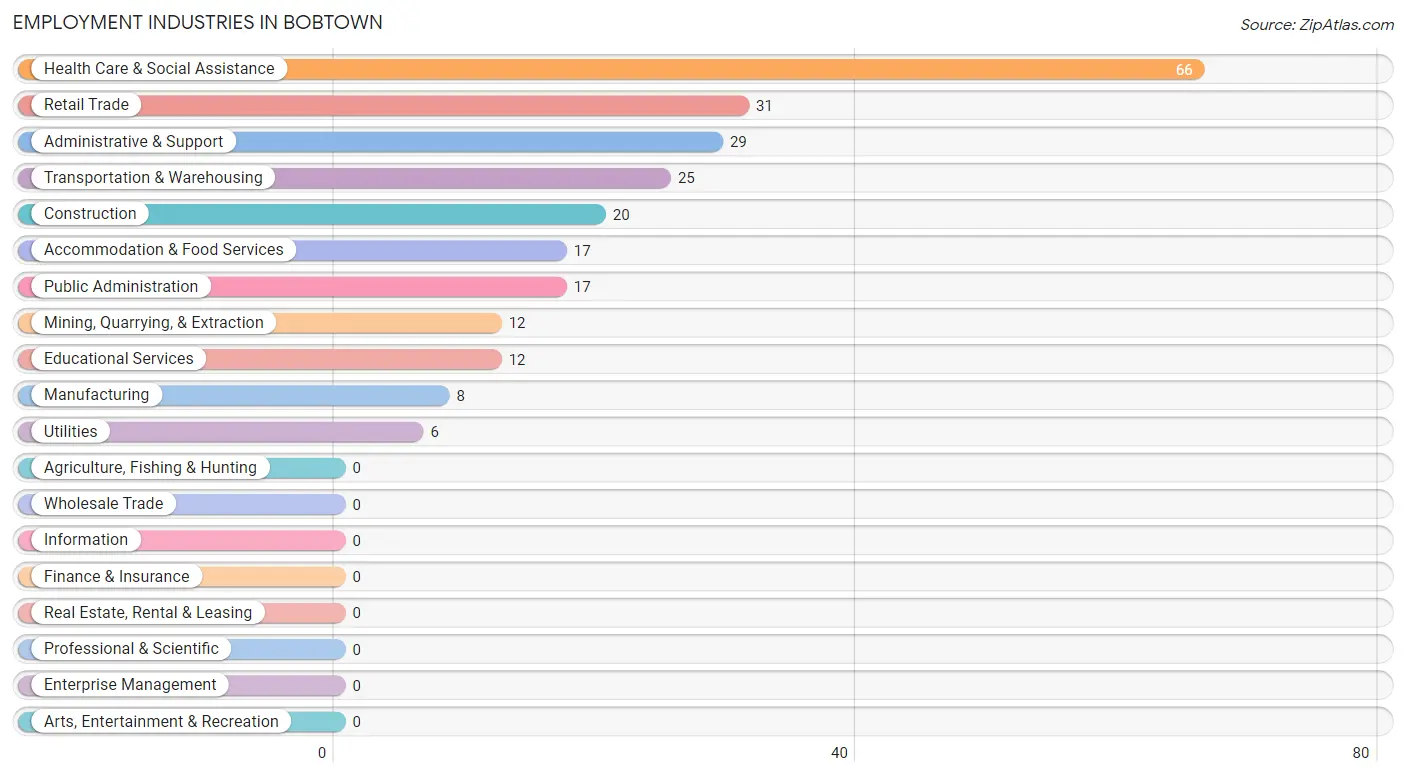
The major employment industries in Bobtown include Health Care & Social Assistance (66 | 26.5%), Retail Trade (31 | 12.4%), Administrative & Support (29 | 11.7%), Transportation & Warehousing (25 | 10.0%), and Construction (20 | 8.0%).
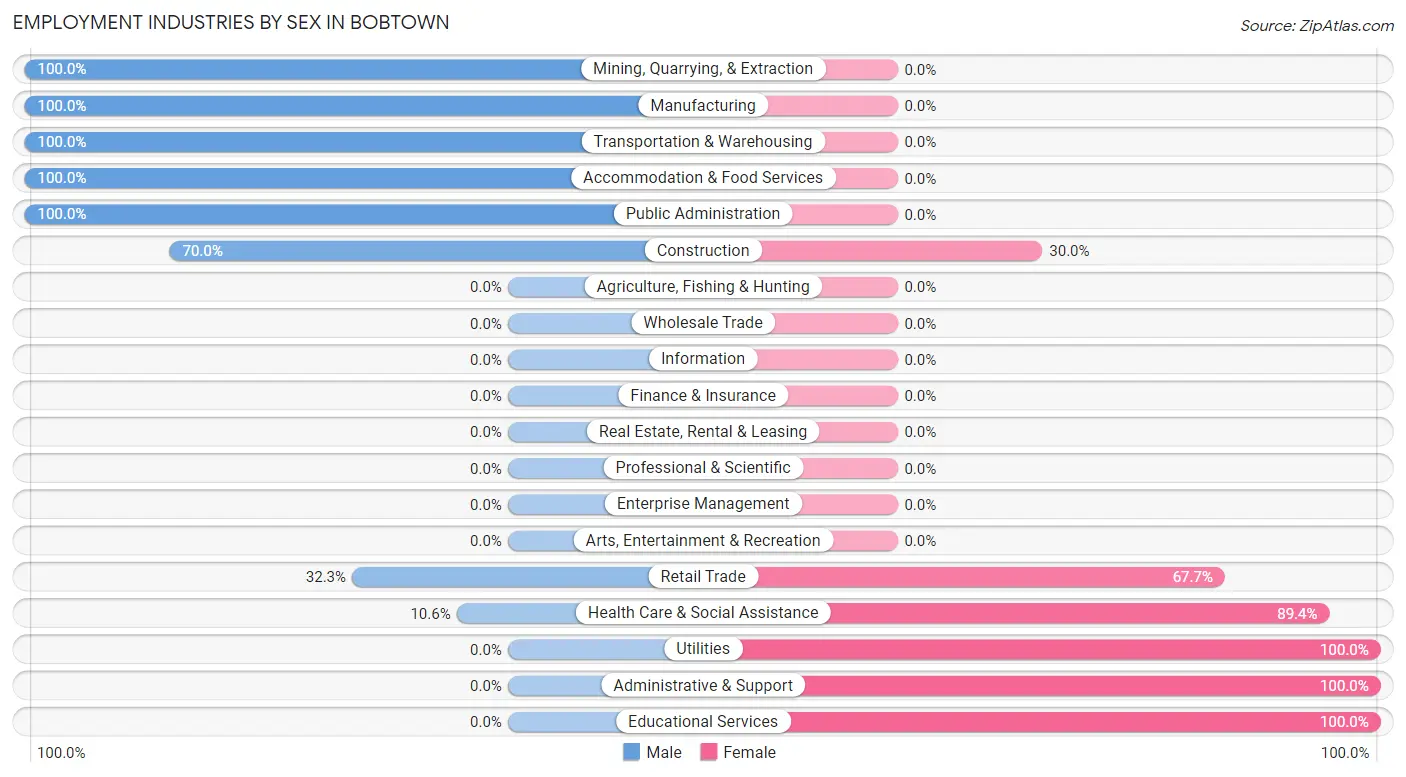
Employment Industries by Sex in Bobtown
The Bobtown industries that see more men than women are Mining, Quarrying, & Extraction (100.0%), Manufacturing (100.0%), and Transportation & Warehousing (100.0%), whereas the industries that tend to have a higher number of women are Utilities (100.0%), Administrative & Support (100.0%), and Educational Services (100.0%).
| Industry | Male | Female |
| Agriculture, Fishing & Hunting | 0 (0.0%) | 0 (0.0%) |
| Mining, Quarrying, & Extraction | 12 (100.0%) | 0 (0.0%) |
| Construction | 14 (70.0%) | 6 (30.0%) |
| Manufacturing | 8 (100.0%) | 0 (0.0%) |
| Wholesale Trade | 0 (0.0%) | 0 (0.0%) |
| Retail Trade | 10 (32.3%) | 21 (67.7%) |
| Transportation & Warehousing | 25 (100.0%) | 0 (0.0%) |
| Utilities | 0 (0.0%) | 6 (100.0%) |
| Information | 0 (0.0%) | 0 (0.0%) |
| Finance & Insurance | 0 (0.0%) | 0 (0.0%) |
| Real Estate, Rental & Leasing | 0 (0.0%) | 0 (0.0%) |
| Professional & Scientific | 0 (0.0%) | 0 (0.0%) |
| Enterprise Management | 0 (0.0%) | 0 (0.0%) |
| Administrative & Support | 0 (0.0%) | 29 (100.0%) |
| Educational Services | 0 (0.0%) | 12 (100.0%) |
| Health Care & Social Assistance | 7 (10.6%) | 59 (89.4%) |
| Arts, Entertainment & Recreation | 0 (0.0%) | 0 (0.0%) |
| Accommodation & Food Services | 17 (100.0%) | 0 (0.0%) |
| Public Administration | 17 (100.0%) | 0 (0.0%) |
| Total | 116 (46.6%) | 133 (53.4%) |
Education in Bobtown
School Enrollment in Bobtown
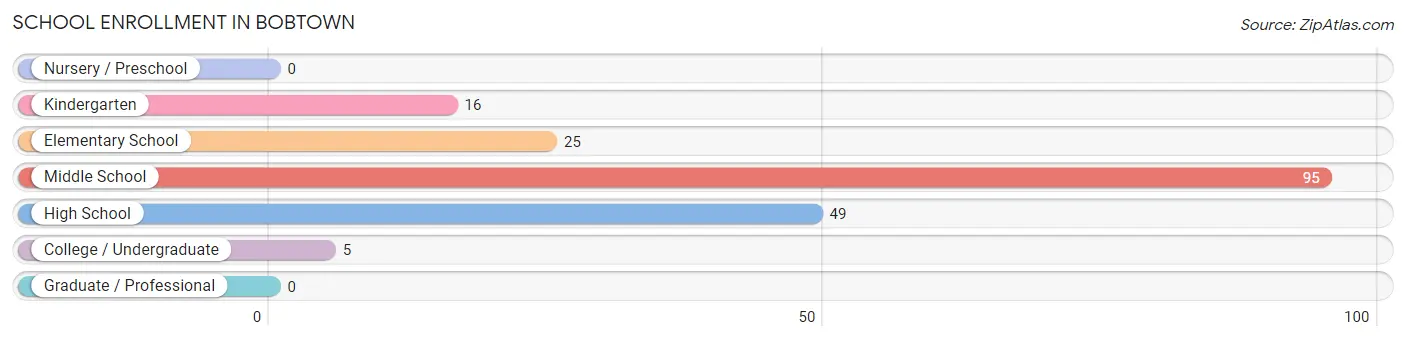
The most common levels of schooling among the 190 students in Bobtown are middle school (95 | 50.0%), high school (49 | 25.8%), and elementary school (25 | 13.2%).
| School Level | # Students | % Students |
| Nursery / Preschool | 0 | 0.0% |
| Kindergarten | 16 | 8.4% |
| Elementary School | 25 | 13.2% |
| Middle School | 95 | 50.0% |
| High School | 49 | 25.8% |
| College / Undergraduate | 5 | 2.6% |
| Graduate / Professional | 0 | 0.0% |
| Total | 190 | 100.0% |
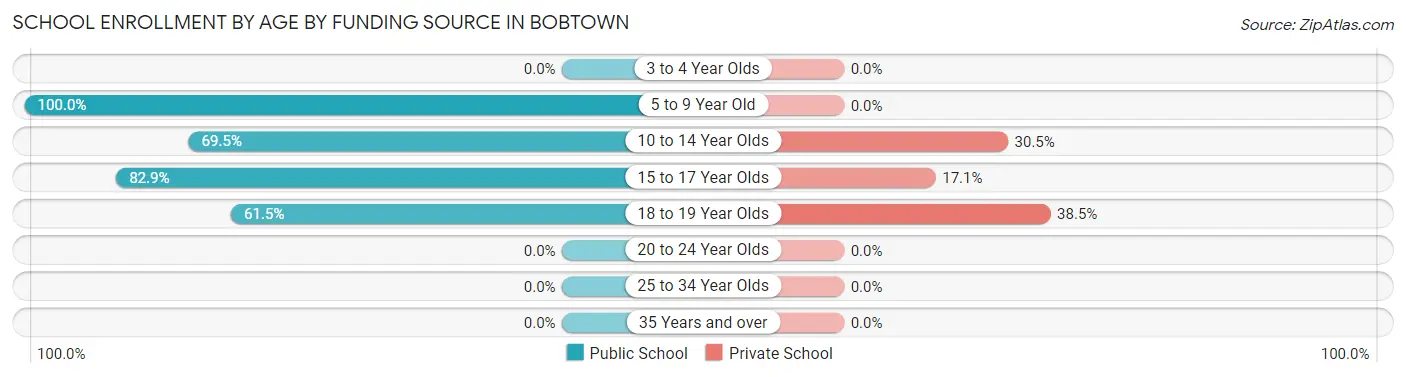
School Enrollment by Age by Funding Source in Bobtown
Out of a total of 190 students who are enrolled in schools in Bobtown, 41 (21.6%) attend a private institution, while the remaining 149 (78.4%) are enrolled in public schools. The age group of 18 to 19 year olds has the highest likelihood of being enrolled in private schools, with 5 (38.5% in the age bracket) enrolled. Conversely, the age group of 5 to 9 year old has the lowest likelihood of being enrolled in a private school, with 41 (100.0% in the age bracket) attending a public institution.
| Age Bracket | Public School | Private School |
| 3 to 4 Year Olds | 0 (0.0%) | 0 (0.0%) |
| 5 to 9 Year Old | 41 (100.0%) | 0 (0.0%) |
| 10 to 14 Year Olds | 66 (69.5%) | 29 (30.5%) |
| 15 to 17 Year Olds | 34 (82.9%) | 7 (17.1%) |
| 18 to 19 Year Olds | 8 (61.5%) | 5 (38.5%) |
| 20 to 24 Year Olds | 0 (0.0%) | 0 (0.0%) |
| 25 to 34 Year Olds | 0 (0.0%) | 0 (0.0%) |
| 35 Years and over | 0 (0.0%) | 0 (0.0%) |
| Total | 149 (78.4%) | 41 (21.6%) |
Educational Attainment by Field of Study in Bobtown
Science & technology (30 | 44.8%), social sciences (16 | 23.9%), liberal arts & history (9 | 13.4%), business (6 | 9.0%), and education (6 | 9.0%) are the most common fields of study among 67 individuals in Bobtown who have obtained a bachelor's degree or higher.
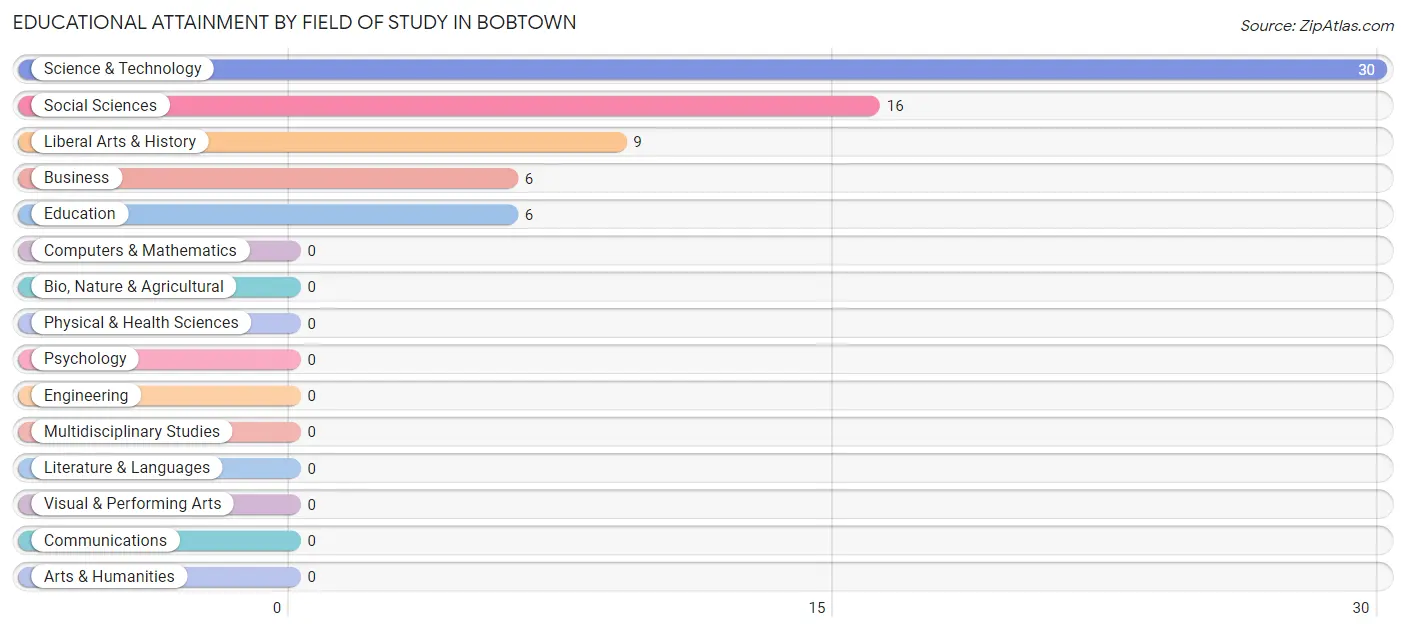
| Field of Study | # Graduates | % Graduates |
| Computers & Mathematics | 0 | 0.0% |
| Bio, Nature & Agricultural | 0 | 0.0% |
| Physical & Health Sciences | 0 | 0.0% |
| Psychology | 0 | 0.0% |
| Social Sciences | 16 | 23.9% |
| Engineering | 0 | 0.0% |
| Multidisciplinary Studies | 0 | 0.0% |
| Science & Technology | 30 | 44.8% |
| Business | 6 | 9.0% |
| Education | 6 | 9.0% |
| Literature & Languages | 0 | 0.0% |
| Liberal Arts & History | 9 | 13.4% |
| Visual & Performing Arts | 0 | 0.0% |
| Communications | 0 | 0.0% |
| Arts & Humanities | 0 | 0.0% |
| Total | 67 | 100.0% |
Transportation & Commute in Bobtown
Vehicle Availability by Sex in Bobtown
The most prevalent vehicle ownership categories in Bobtown are males with 3 vehicles (56, accounting for 48.3%) and females with 3 vehicles (39, making up 46.3%).
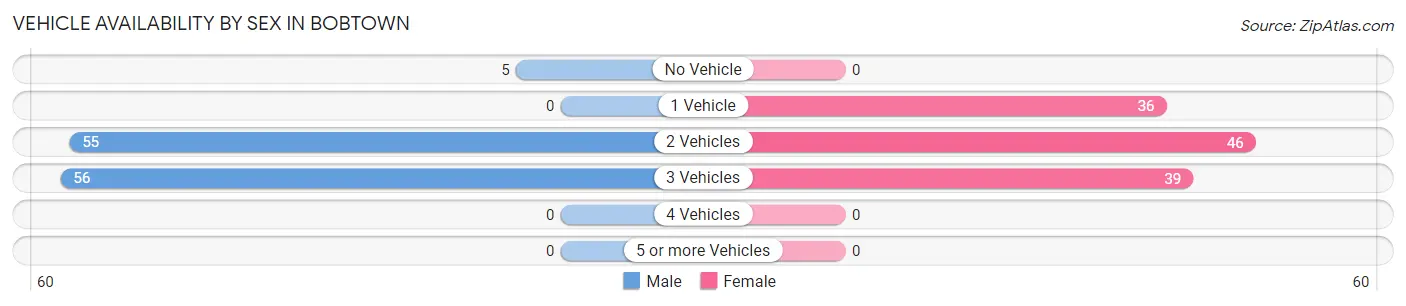
| Vehicles Available | Male | Female |
| No Vehicle | 5 (4.3%) | 0 (0.0%) |
| 1 Vehicle | 0 (0.0%) | 36 (29.7%) |
| 2 Vehicles | 55 (47.4%) | 46 (38.0%) |
| 3 Vehicles | 56 (48.3%) | 39 (32.2%) |
| 4 Vehicles | 0 (0.0%) | 0 (0.0%) |
| 5 or more Vehicles | 0 (0.0%) | 0 (0.0%) |
| Total | 116 (100.0%) | 121 (100.0%) |
Commute Time in Bobtown
The most frequently occuring commute durations in Bobtown are 30 to 34 minutes (89 commuters, 43.0%), 25 to 29 minutes (51 commuters, 24.6%), and 5 to 9 minutes (14 commuters, 6.8%).
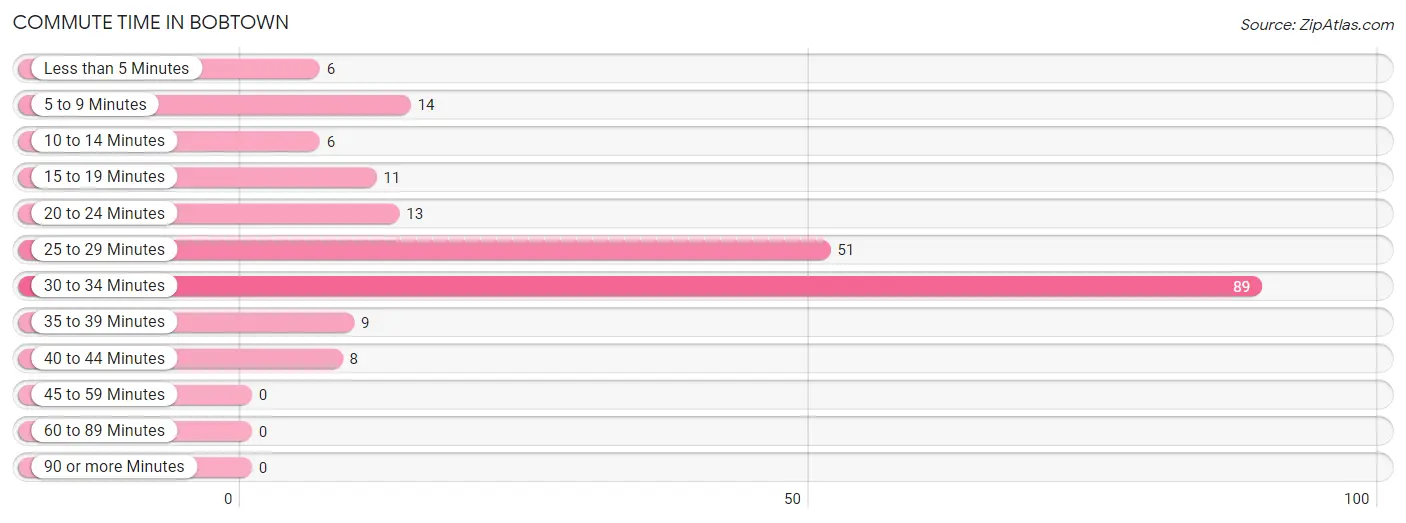
| Commute Time | # Commuters | % Commuters |
| Less than 5 Minutes | 6 | 2.9% |
| 5 to 9 Minutes | 14 | 6.8% |
| 10 to 14 Minutes | 6 | 2.9% |
| 15 to 19 Minutes | 11 | 5.3% |
| 20 to 24 Minutes | 13 | 6.3% |
| 25 to 29 Minutes | 51 | 24.6% |
| 30 to 34 Minutes | 89 | 43.0% |
| 35 to 39 Minutes | 9 | 4.3% |
| 40 to 44 Minutes | 8 | 3.9% |
| 45 to 59 Minutes | 0 | 0.0% |
| 60 to 89 Minutes | 0 | 0.0% |
| 90 or more Minutes | 0 | 0.0% |
Commute Time by Sex in Bobtown
The most common commute times in Bobtown are 30 to 34 minutes (89 commuters, 76.7%) for males and 25 to 29 minutes (43 commuters, 47.2%) for females.
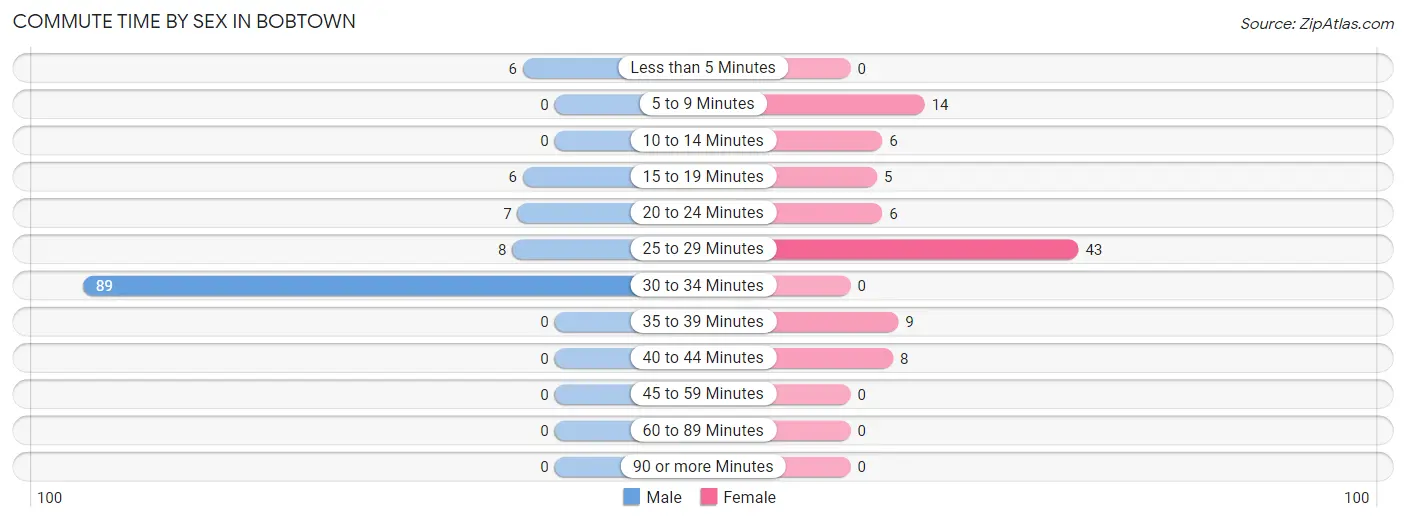
| Commute Time | Male | Female |
| Less than 5 Minutes | 6 (5.2%) | 0 (0.0%) |
| 5 to 9 Minutes | 0 (0.0%) | 14 (15.4%) |
| 10 to 14 Minutes | 0 (0.0%) | 6 (6.6%) |
| 15 to 19 Minutes | 6 (5.2%) | 5 (5.5%) |
| 20 to 24 Minutes | 7 (6.0%) | 6 (6.6%) |
| 25 to 29 Minutes | 8 (6.9%) | 43 (47.2%) |
| 30 to 34 Minutes | 89 (76.7%) | 0 (0.0%) |
| 35 to 39 Minutes | 0 (0.0%) | 9 (9.9%) |
| 40 to 44 Minutes | 0 (0.0%) | 8 (8.8%) |
| 45 to 59 Minutes | 0 (0.0%) | 0 (0.0%) |
| 60 to 89 Minutes | 0 (0.0%) | 0 (0.0%) |
| 90 or more Minutes | 0 (0.0%) | 0 (0.0%) |
Time of Departure to Work by Sex in Bobtown
The most frequent times of departure to work in Bobtown are 6:30 AM to 6:59 AM (34, 29.3%) for males and 7:30 AM to 7:59 AM (29, 31.9%) for females.
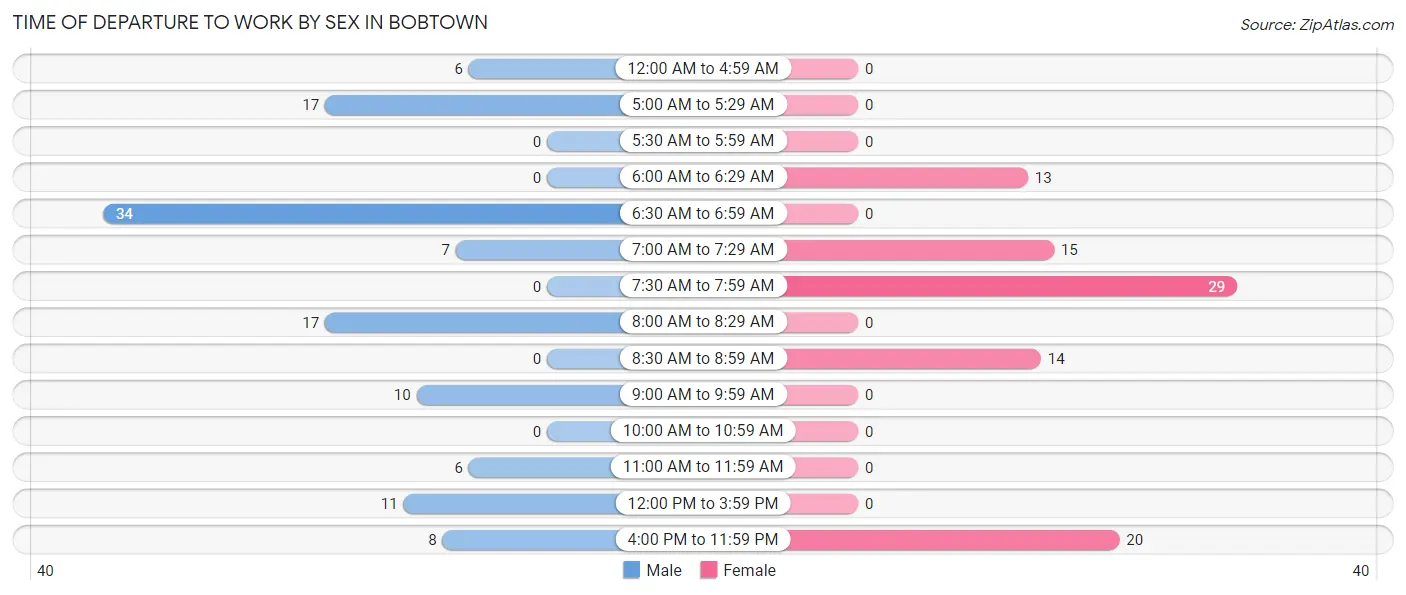
| Time of Departure | Male | Female |
| 12:00 AM to 4:59 AM | 6 (5.2%) | 0 (0.0%) |
| 5:00 AM to 5:29 AM | 17 (14.7%) | 0 (0.0%) |
| 5:30 AM to 5:59 AM | 0 (0.0%) | 0 (0.0%) |
| 6:00 AM to 6:29 AM | 0 (0.0%) | 13 (14.3%) |
| 6:30 AM to 6:59 AM | 34 (29.3%) | 0 (0.0%) |
| 7:00 AM to 7:29 AM | 7 (6.0%) | 15 (16.5%) |
| 7:30 AM to 7:59 AM | 0 (0.0%) | 29 (31.9%) |
| 8:00 AM to 8:29 AM | 17 (14.7%) | 0 (0.0%) |
| 8:30 AM to 8:59 AM | 0 (0.0%) | 14 (15.4%) |
| 9:00 AM to 9:59 AM | 10 (8.6%) | 0 (0.0%) |
| 10:00 AM to 10:59 AM | 0 (0.0%) | 0 (0.0%) |
| 11:00 AM to 11:59 AM | 6 (5.2%) | 0 (0.0%) |
| 12:00 PM to 3:59 PM | 11 (9.5%) | 0 (0.0%) |
| 4:00 PM to 11:59 PM | 8 (6.9%) | 20 (22.0%) |
| Total | 116 (100.0%) | 91 (100.0%) |
Housing Occupancy in Bobtown
Occupancy by Ownership in Bobtown
Of the total 244 dwellings in Bobtown, owner-occupied units account for 188 (77.0%), while renter-occupied units make up 56 (23.0%).
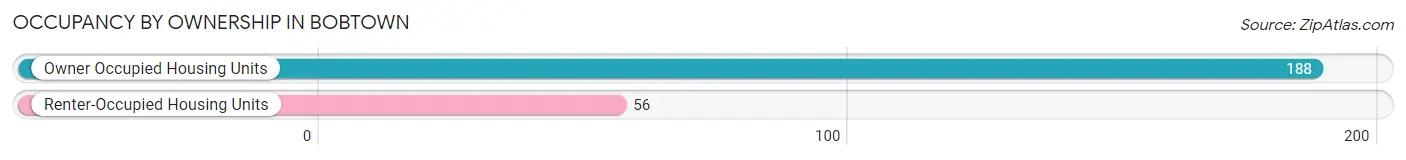
| Occupancy | # Housing Units | % Housing Units |
| Owner Occupied Housing Units | 188 | 77.0% |
| Renter-Occupied Housing Units | 56 | 23.0% |
| Total Occupied Housing Units | 244 | 100.0% |
Occupancy by Household Size in Bobtown
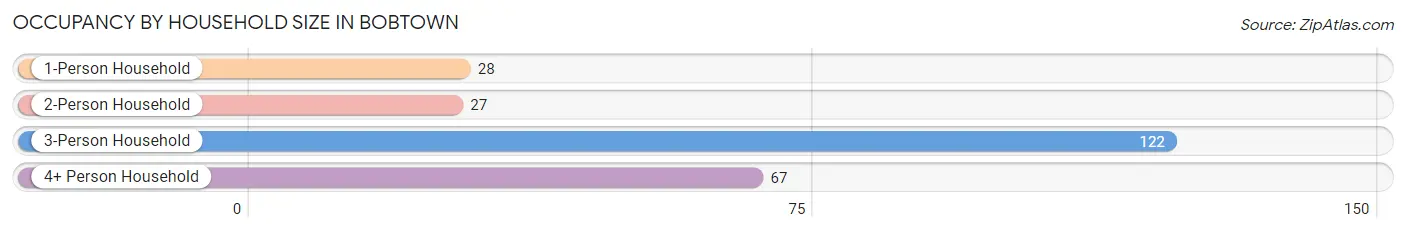
| Household Size | # Housing Units | % Housing Units |
| 1-Person Household | 28 | 11.5% |
| 2-Person Household | 27 | 11.1% |
| 3-Person Household | 122 | 50.0% |
| 4+ Person Household | 67 | 27.5% |
| Total Housing Units | 244 | 100.0% |
Occupancy by Ownership by Household Size in Bobtown
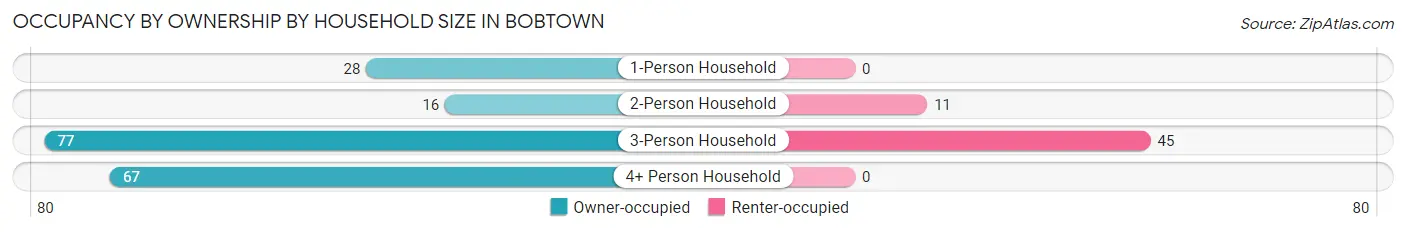
| Household Size | Owner-occupied | Renter-occupied |
| 1-Person Household | 28 (100.0%) | 0 (0.0%) |
| 2-Person Household | 16 (59.3%) | 11 (40.7%) |
| 3-Person Household | 77 (63.1%) | 45 (36.9%) |
| 4+ Person Household | 67 (100.0%) | 0 (0.0%) |
| Total Housing Units | 188 (77.0%) | 56 (23.0%) |
Occupancy by Educational Attainment in Bobtown
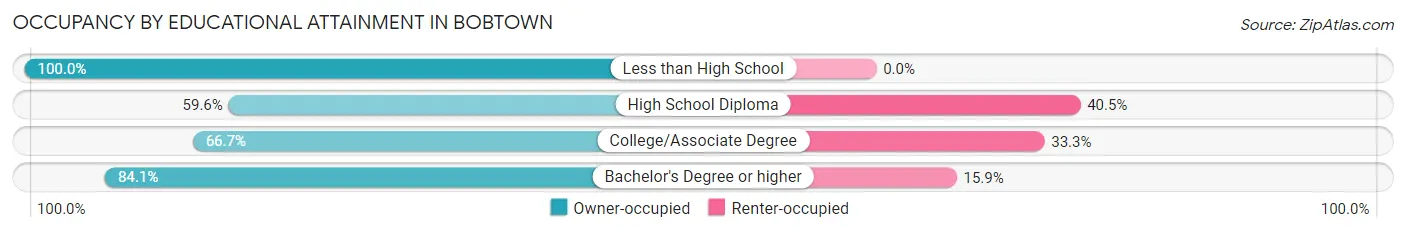
| Household Size | Owner-occupied | Renter-occupied |
| Less than High School | 59 (100.0%) | 0 (0.0%) |
| High School Diploma | 53 (59.6%) | 36 (40.5%) |
| College/Associate Degree | 18 (66.7%) | 9 (33.3%) |
| Bachelor's Degree or higher | 58 (84.1%) | 11 (15.9%) |
Occupancy by Age of Householder in Bobtown
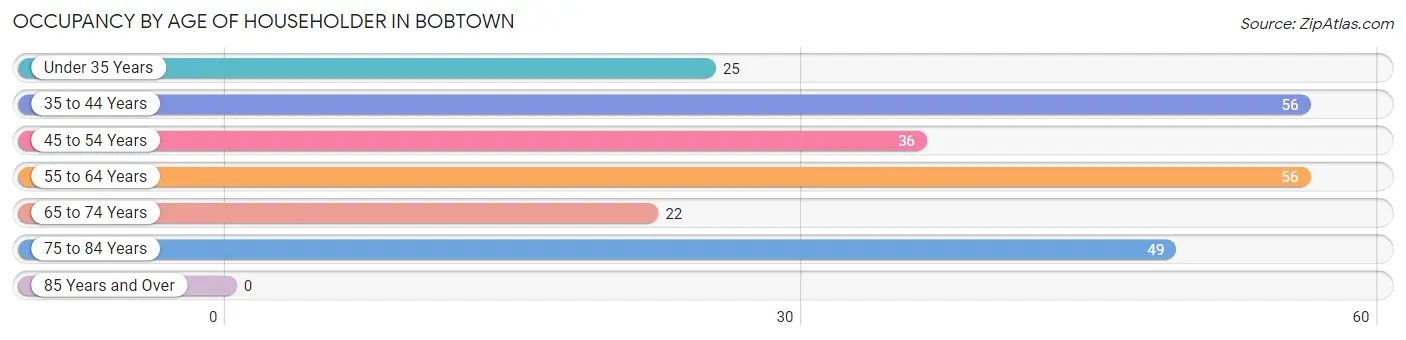
| Age Bracket | # Households | % Households |
| Under 35 Years | 25 | 10.2% |
| 35 to 44 Years | 56 | 23.0% |
| 45 to 54 Years | 36 | 14.7% |
| 55 to 64 Years | 56 | 23.0% |
| 65 to 74 Years | 22 | 9.0% |
| 75 to 84 Years | 49 | 20.1% |
| 85 Years and Over | 0 | 0.0% |
| Total | 244 | 100.0% |
Housing Finances in Bobtown
Median Income by Occupancy in Bobtown
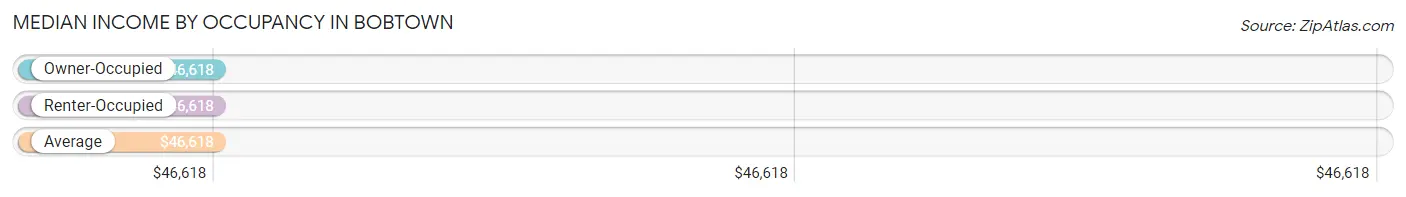
| Occupancy Type | # Households | Median Income |
| Owner-Occupied | 188 (77.0%) | $46,618 |
| Renter-Occupied | 56 (23.0%) | $46,618 |
| Average | 244 (100.0%) | $46,618 |
Occupancy by Householder Income Bracket in Bobtown
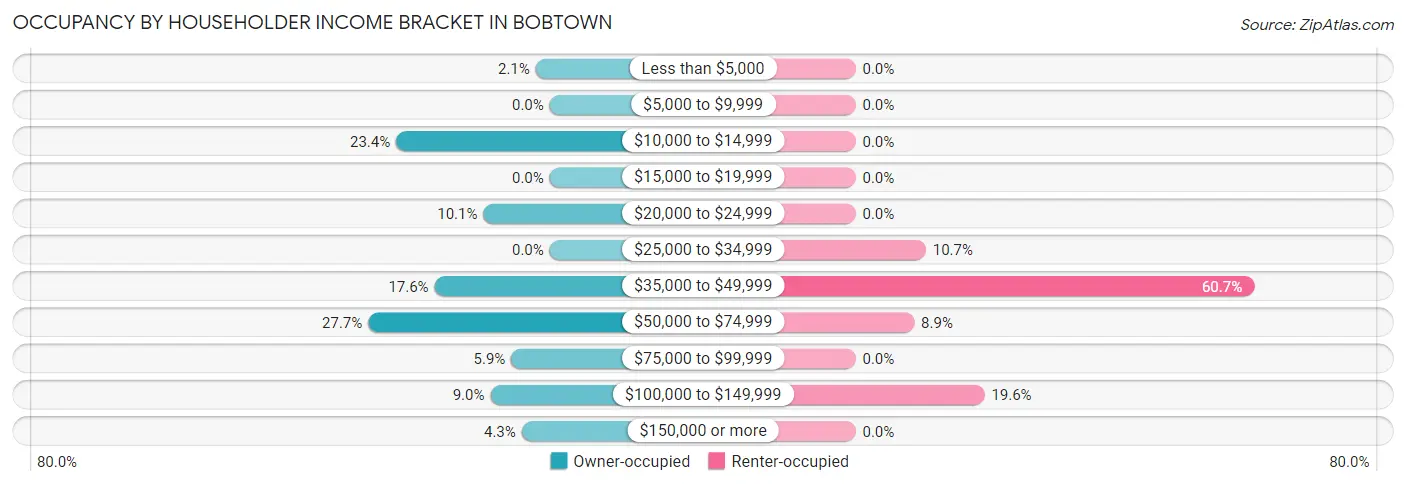
| Income Bracket | Owner-occupied | Renter-occupied |
| Less than $5,000 | 4 (2.1%) | 0 (0.0%) |
| $5,000 to $9,999 | 0 (0.0%) | 0 (0.0%) |
| $10,000 to $14,999 | 44 (23.4%) | 0 (0.0%) |
| $15,000 to $19,999 | 0 (0.0%) | 0 (0.0%) |
| $20,000 to $24,999 | 19 (10.1%) | 0 (0.0%) |
| $25,000 to $34,999 | 0 (0.0%) | 6 (10.7%) |
| $35,000 to $49,999 | 33 (17.5%) | 34 (60.7%) |
| $50,000 to $74,999 | 52 (27.7%) | 5 (8.9%) |
| $75,000 to $99,999 | 11 (5.9%) | 0 (0.0%) |
| $100,000 to $149,999 | 17 (9.0%) | 11 (19.6%) |
| $150,000 or more | 8 (4.3%) | 0 (0.0%) |
| Total | 188 (100.0%) | 56 (100.0%) |
Monthly Housing Cost Tiers in Bobtown
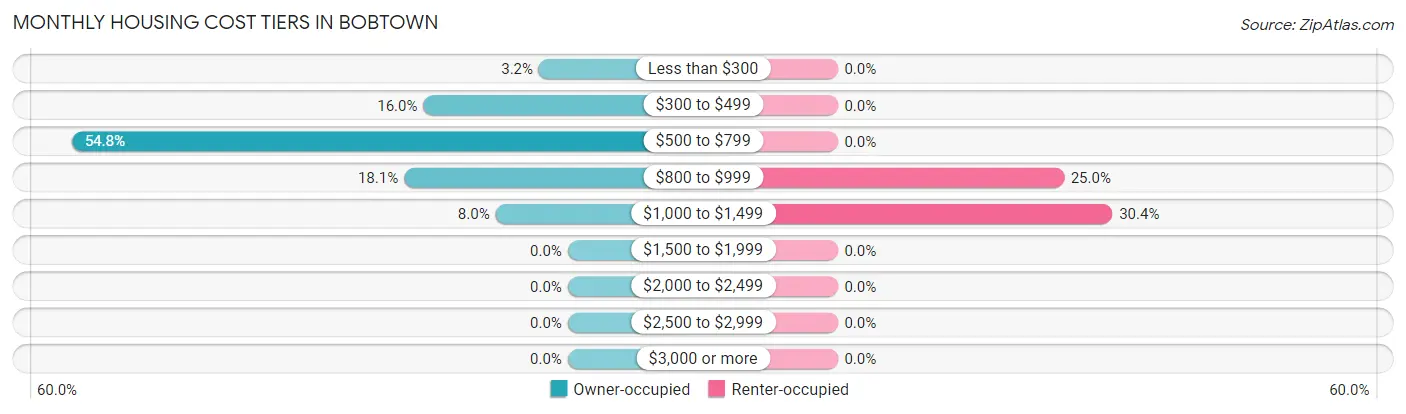
| Monthly Cost | Owner-occupied | Renter-occupied |
| Less than $300 | 6 (3.2%) | 0 (0.0%) |
| $300 to $499 | 30 (16.0%) | 0 (0.0%) |
| $500 to $799 | 103 (54.8%) | 0 (0.0%) |
| $800 to $999 | 34 (18.1%) | 14 (25.0%) |
| $1,000 to $1,499 | 15 (8.0%) | 17 (30.4%) |
| $1,500 to $1,999 | 0 (0.0%) | 0 (0.0%) |
| $2,000 to $2,499 | 0 (0.0%) | 0 (0.0%) |
| $2,500 to $2,999 | 0 (0.0%) | 0 (0.0%) |
| $3,000 or more | 0 (0.0%) | 0 (0.0%) |
| Total | 188 (100.0%) | 56 (100.0%) |
Physical Housing Characteristics in Bobtown
Housing Structures in Bobtown
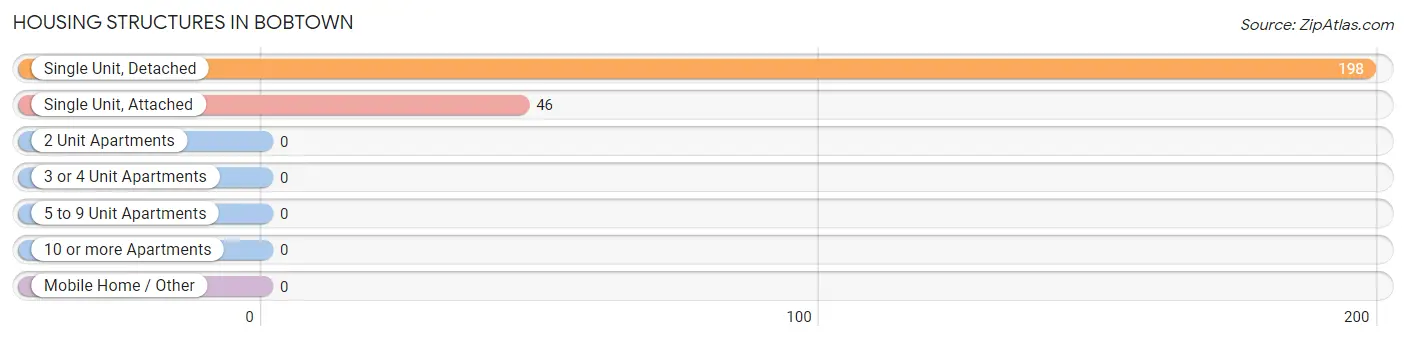
| Structure Type | # Housing Units | % Housing Units |
| Single Unit, Detached | 198 | 81.1% |
| Single Unit, Attached | 46 | 18.9% |
| 2 Unit Apartments | 0 | 0.0% |
| 3 or 4 Unit Apartments | 0 | 0.0% |
| 5 to 9 Unit Apartments | 0 | 0.0% |
| 10 or more Apartments | 0 | 0.0% |
| Mobile Home / Other | 0 | 0.0% |
| Total | 244 | 100.0% |
Housing Structures by Occupancy in Bobtown
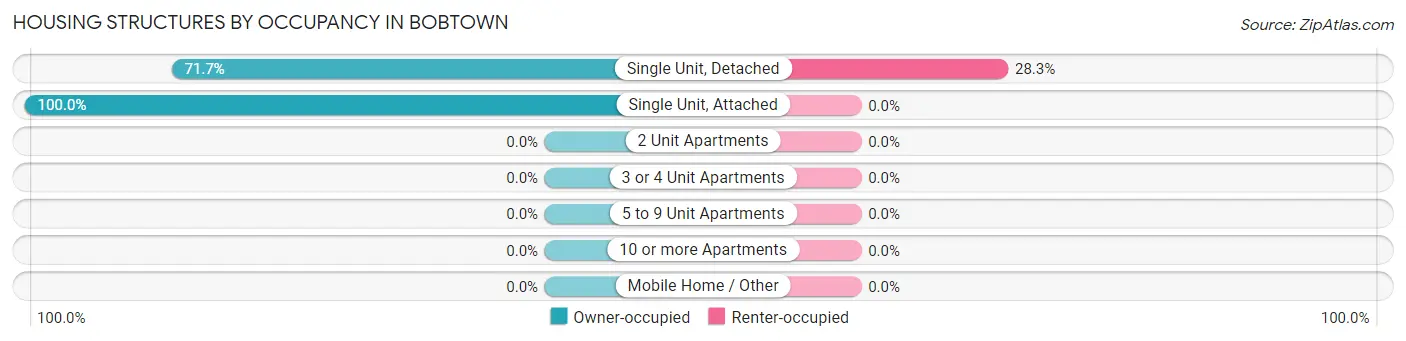
| Structure Type | Owner-occupied | Renter-occupied |
| Single Unit, Detached | 142 (71.7%) | 56 (28.3%) |
| Single Unit, Attached | 46 (100.0%) | 0 (0.0%) |
| 2 Unit Apartments | 0 (0.0%) | 0 (0.0%) |
| 3 or 4 Unit Apartments | 0 (0.0%) | 0 (0.0%) |
| 5 to 9 Unit Apartments | 0 (0.0%) | 0 (0.0%) |
| 10 or more Apartments | 0 (0.0%) | 0 (0.0%) |
| Mobile Home / Other | 0 (0.0%) | 0 (0.0%) |
| Total | 188 (77.0%) | 56 (23.0%) |
Housing Structures by Number of Rooms in Bobtown
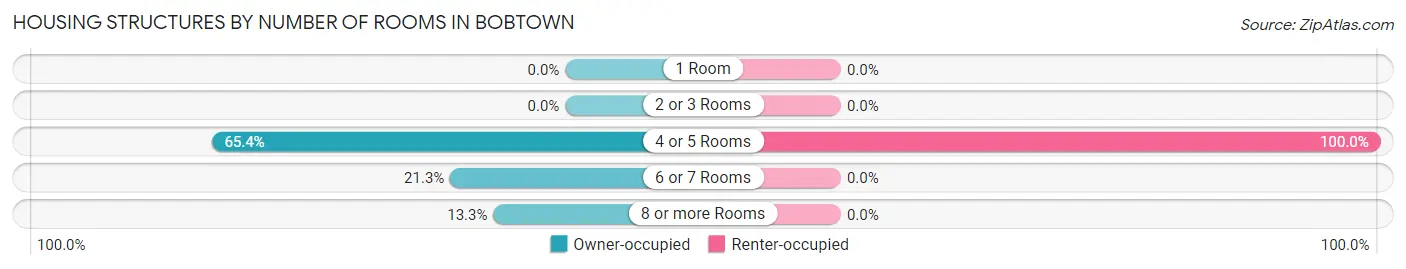
| Number of Rooms | Owner-occupied | Renter-occupied |
| 1 Room | 0 (0.0%) | 0 (0.0%) |
| 2 or 3 Rooms | 0 (0.0%) | 0 (0.0%) |
| 4 or 5 Rooms | 123 (65.4%) | 56 (100.0%) |
| 6 or 7 Rooms | 40 (21.3%) | 0 (0.0%) |
| 8 or more Rooms | 25 (13.3%) | 0 (0.0%) |
| Total | 188 (100.0%) | 56 (100.0%) |
Housing Structure by Heating Type in Bobtown
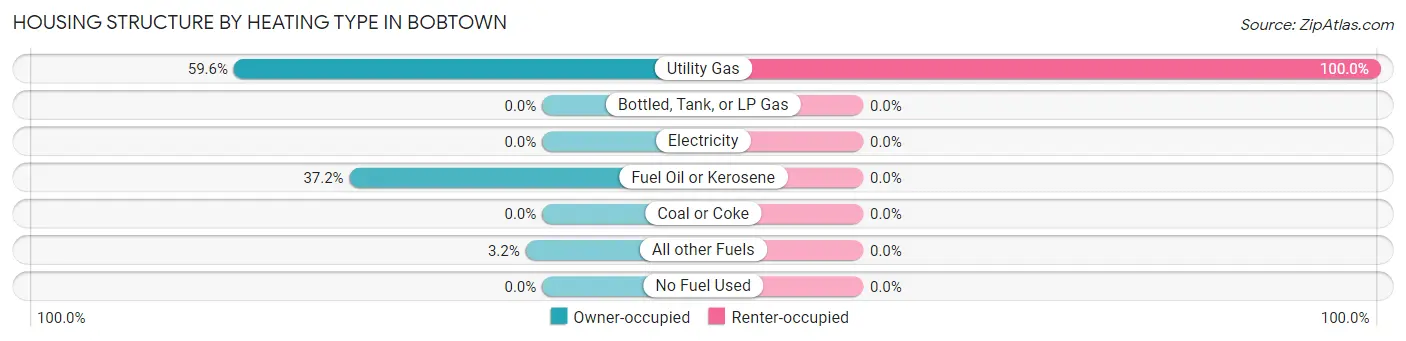
| Heating Type | Owner-occupied | Renter-occupied |
| Utility Gas | 112 (59.6%) | 56 (100.0%) |
| Bottled, Tank, or LP Gas | 0 (0.0%) | 0 (0.0%) |
| Electricity | 0 (0.0%) | 0 (0.0%) |
| Fuel Oil or Kerosene | 70 (37.2%) | 0 (0.0%) |
| Coal or Coke | 0 (0.0%) | 0 (0.0%) |
| All other Fuels | 6 (3.2%) | 0 (0.0%) |
| No Fuel Used | 0 (0.0%) | 0 (0.0%) |
| Total | 188 (100.0%) | 56 (100.0%) |
Household Vehicle Usage in Bobtown
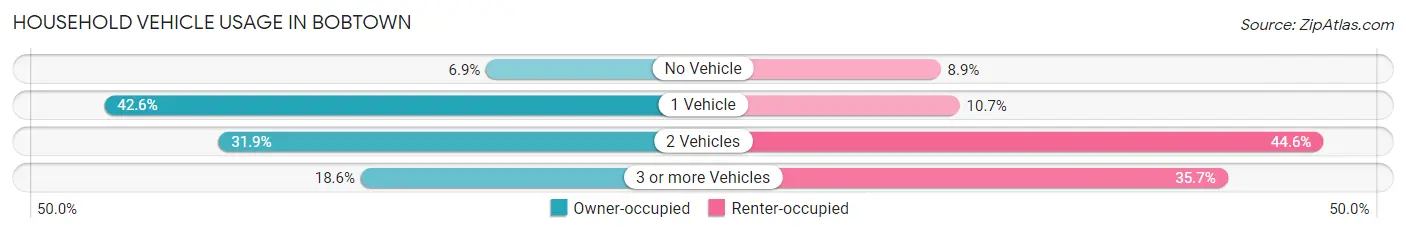
| Vehicles per Household | Owner-occupied | Renter-occupied |
| No Vehicle | 13 (6.9%) | 5 (8.9%) |
| 1 Vehicle | 80 (42.5%) | 6 (10.7%) |
| 2 Vehicles | 60 (31.9%) | 25 (44.6%) |
| 3 or more Vehicles | 35 (18.6%) | 20 (35.7%) |
| Total | 188 (100.0%) | 56 (100.0%) |
Real Estate & Mortgages in Bobtown
Real Estate and Mortgage Overview in Bobtown
| Characteristic | Without Mortgage | With Mortgage |
| Housing Units | 116 | 72 |
| Median Property Value | $60,000 | $53,900 |
| Median Household Income | - | - |
| Monthly Housing Costs | $550 | $0 |
| Real Estate Taxes | $711 | $0 |
Property Value by Mortgage Status in Bobtown
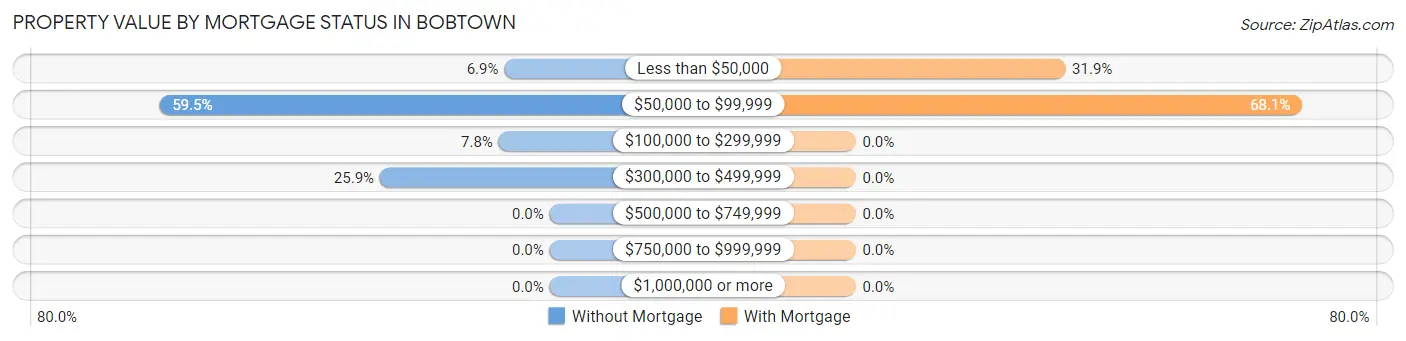
| Property Value | Without Mortgage | With Mortgage |
| Less than $50,000 | 8 (6.9%) | 23 (31.9%) |
| $50,000 to $99,999 | 69 (59.5%) | 49 (68.1%) |
| $100,000 to $299,999 | 9 (7.8%) | 0 (0.0%) |
| $300,000 to $499,999 | 30 (25.9%) | 0 (0.0%) |
| $500,000 to $749,999 | 0 (0.0%) | 0 (0.0%) |
| $750,000 to $999,999 | 0 (0.0%) | 0 (0.0%) |
| $1,000,000 or more | 0 (0.0%) | 0 (0.0%) |
| Total | 116 (100.0%) | 72 (100.0%) |
Household Income by Mortgage Status in Bobtown
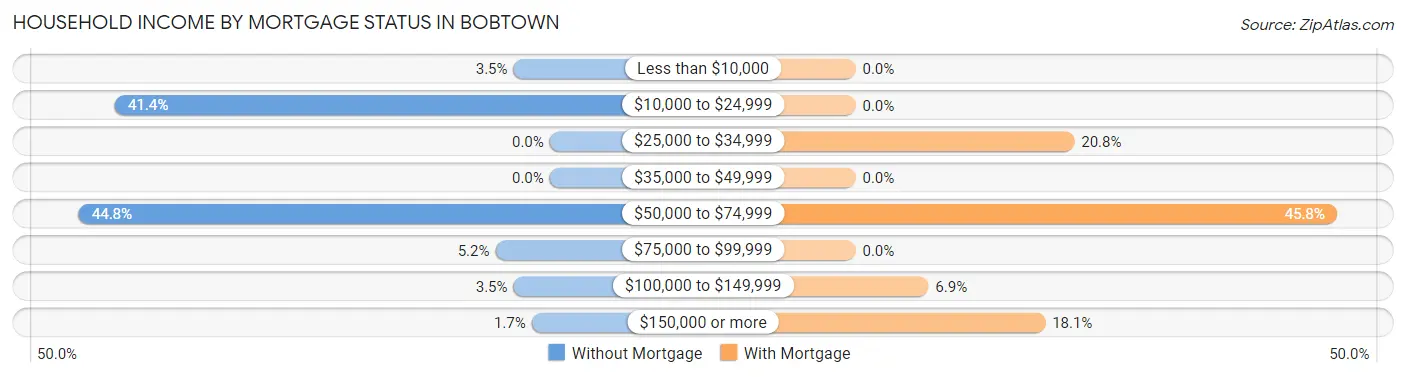
| Household Income | Without Mortgage | With Mortgage |
| Less than $10,000 | 4 (3.5%) | 0 (0.0%) |
| $10,000 to $24,999 | 48 (41.4%) | 0 (0.0%) |
| $25,000 to $34,999 | 0 (0.0%) | 15 (20.8%) |
| $35,000 to $49,999 | 0 (0.0%) | 0 (0.0%) |
| $50,000 to $74,999 | 52 (44.8%) | 33 (45.8%) |
| $75,000 to $99,999 | 6 (5.2%) | 0 (0.0%) |
| $100,000 to $149,999 | 4 (3.5%) | 5 (6.9%) |
| $150,000 or more | 2 (1.7%) | 13 (18.1%) |
| Total | 116 (100.0%) | 72 (100.0%) |
Property Value to Household Income Ratio in Bobtown
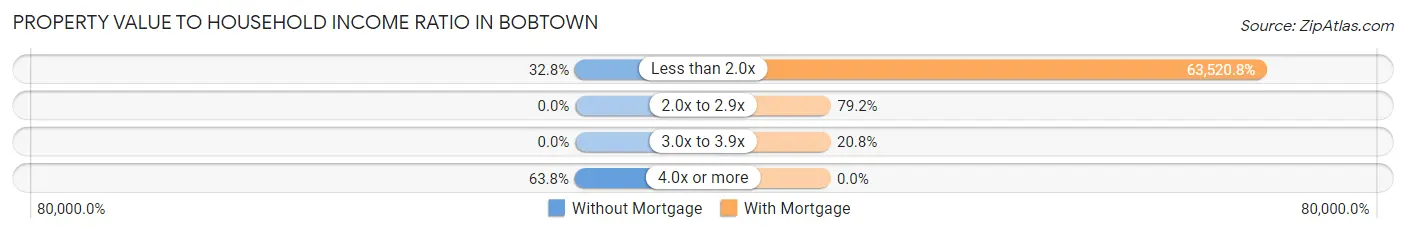
| Value-to-Income Ratio | Without Mortgage | With Mortgage |
| Less than 2.0x | 38 (32.8%) | 45,735 (63,520.8%) |
| 2.0x to 2.9x | 0 (0.0%) | 57 (79.2%) |
| 3.0x to 3.9x | 0 (0.0%) | 15 (20.8%) |
| 4.0x or more | 74 (63.8%) | 0 (0.0%) |
| Total | 116 (100.0%) | 72 (100.0%) |
Real Estate Taxes by Mortgage Status in Bobtown
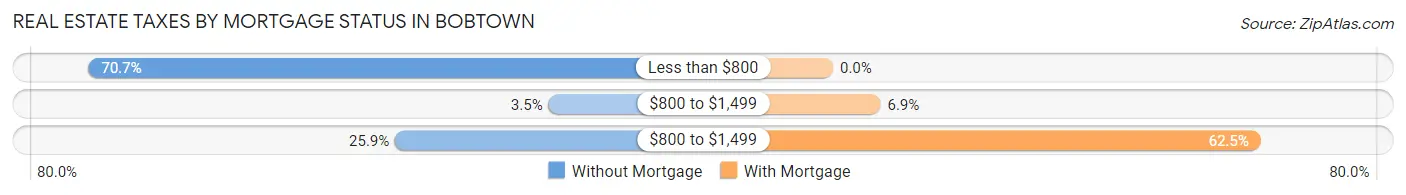
| Property Taxes | Without Mortgage | With Mortgage |
| Less than $800 | 82 (70.7%) | 0 (0.0%) |
| $800 to $1,499 | 4 (3.5%) | 5 (6.9%) |
| $800 to $1,499 | 30 (25.9%) | 45 (62.5%) |
| Total | 116 (100.0%) | 72 (100.0%) |
Health & Disability in Bobtown
Health Insurance Coverage by Age in Bobtown
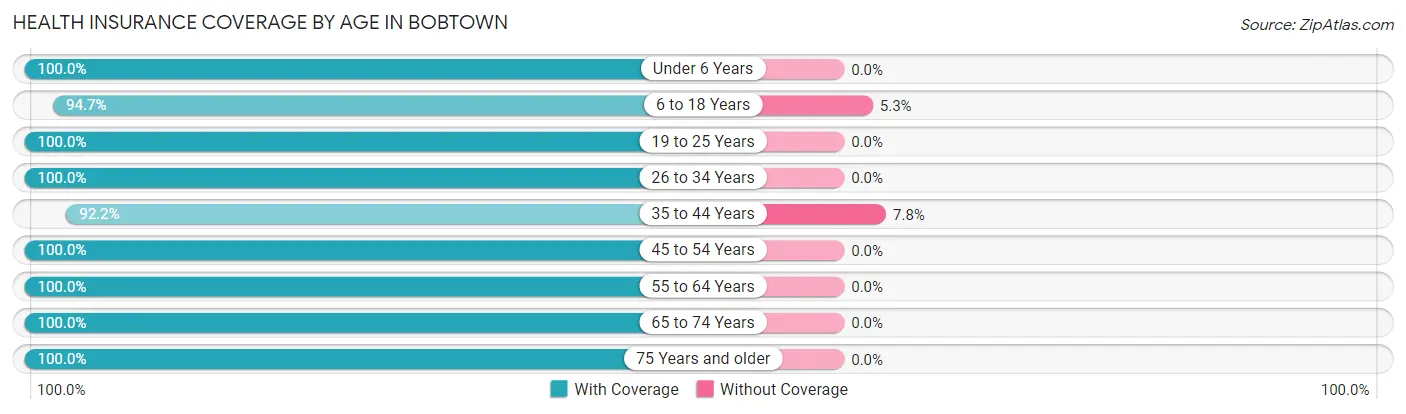
| Age Bracket | With Coverage | Without Coverage |
| Under 6 Years | 106 (100.0%) | 0 (0.0%) |
| 6 to 18 Years | 160 (94.7%) | 9 (5.3%) |
| 19 to 25 Years | 92 (100.0%) | 0 (0.0%) |
| 26 to 34 Years | 72 (100.0%) | 0 (0.0%) |
| 35 to 44 Years | 71 (92.2%) | 6 (7.8%) |
| 45 to 54 Years | 98 (100.0%) | 0 (0.0%) |
| 55 to 64 Years | 69 (100.0%) | 0 (0.0%) |
| 65 to 74 Years | 48 (100.0%) | 0 (0.0%) |
| 75 Years and older | 49 (100.0%) | 0 (0.0%) |
| Total | 765 (98.1%) | 15 (1.9%) |
Health Insurance Coverage by Citizenship Status in Bobtown
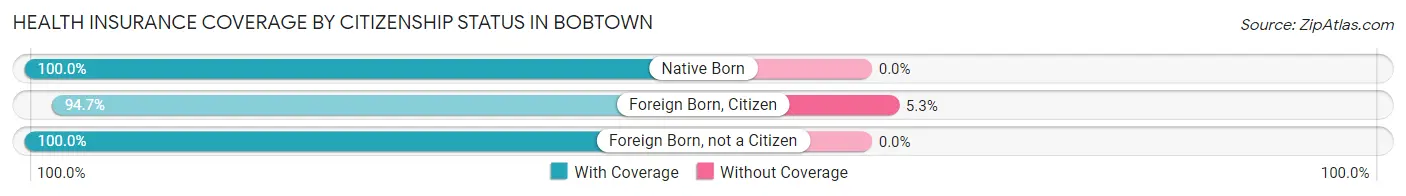
| Citizenship Status | With Coverage | Without Coverage |
| Native Born | 106 (100.0%) | 0 (0.0%) |
| Foreign Born, Citizen | 160 (94.7%) | 9 (5.3%) |
| Foreign Born, not a Citizen | 92 (100.0%) | 0 (0.0%) |
Health Insurance Coverage by Household Income in Bobtown
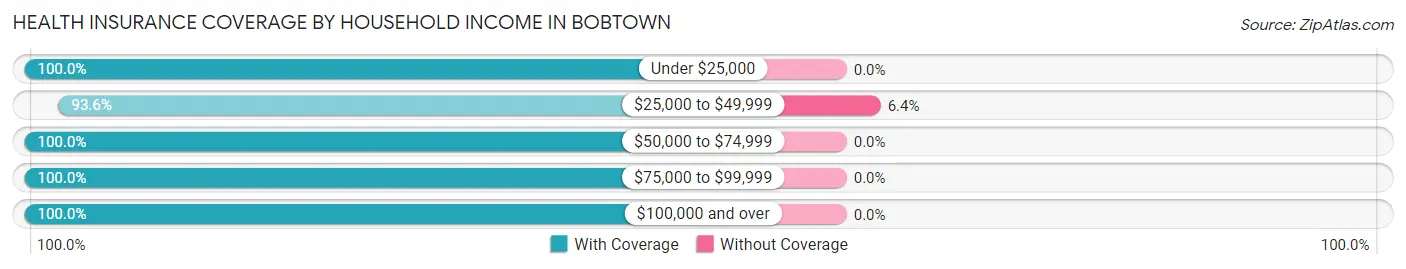
| Household Income | With Coverage | Without Coverage |
| Under $25,000 | 257 (100.0%) | 0 (0.0%) |
| $25,000 to $49,999 | 221 (93.6%) | 15 (6.4%) |
| $50,000 to $74,999 | 135 (100.0%) | 0 (0.0%) |
| $75,000 to $99,999 | 44 (100.0%) | 0 (0.0%) |
| $100,000 and over | 108 (100.0%) | 0 (0.0%) |
Public vs Private Health Insurance Coverage by Age in Bobtown
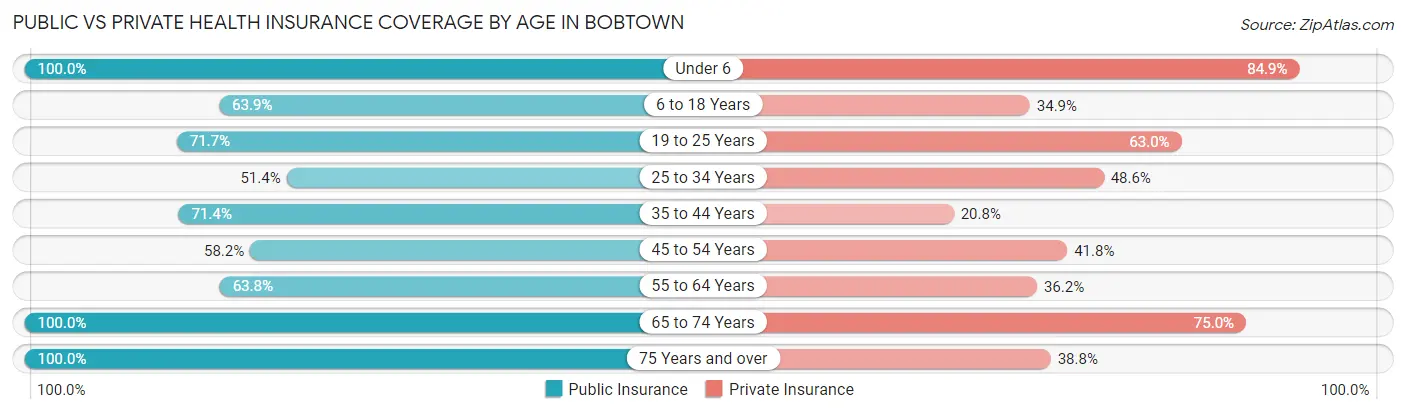
| Age Bracket | Public Insurance | Private Insurance |
| Under 6 | 106 (100.0%) | 90 (84.9%) |
| 6 to 18 Years | 108 (63.9%) | 59 (34.9%) |
| 19 to 25 Years | 66 (71.7%) | 58 (63.0%) |
| 25 to 34 Years | 37 (51.4%) | 35 (48.6%) |
| 35 to 44 Years | 55 (71.4%) | 16 (20.8%) |
| 45 to 54 Years | 57 (58.2%) | 41 (41.8%) |
| 55 to 64 Years | 44 (63.8%) | 25 (36.2%) |
| 65 to 74 Years | 48 (100.0%) | 36 (75.0%) |
| 75 Years and over | 49 (100.0%) | 19 (38.8%) |
| Total | 570 (73.1%) | 379 (48.6%) |
Disability Status by Sex by Age in Bobtown
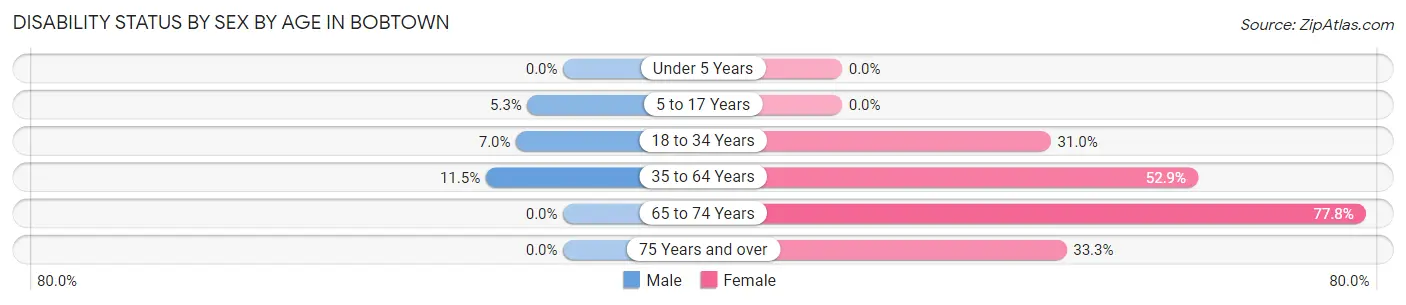
| Age Bracket | Male | Female |
| Under 5 Years | 0 (0.0%) | 0 (0.0%) |
| 5 to 17 Years | 7 (5.3%) | 0 (0.0%) |
| 18 to 34 Years | 3 (7.0%) | 40 (31.0%) |
| 35 to 64 Years | 10 (11.5%) | 83 (52.9%) |
| 65 to 74 Years | 0 (0.0%) | 21 (77.8%) |
| 75 Years and over | 0 (0.0%) | 15 (33.3%) |
Disability Class by Sex by Age in Bobtown
Disability Class: Hearing Difficulty
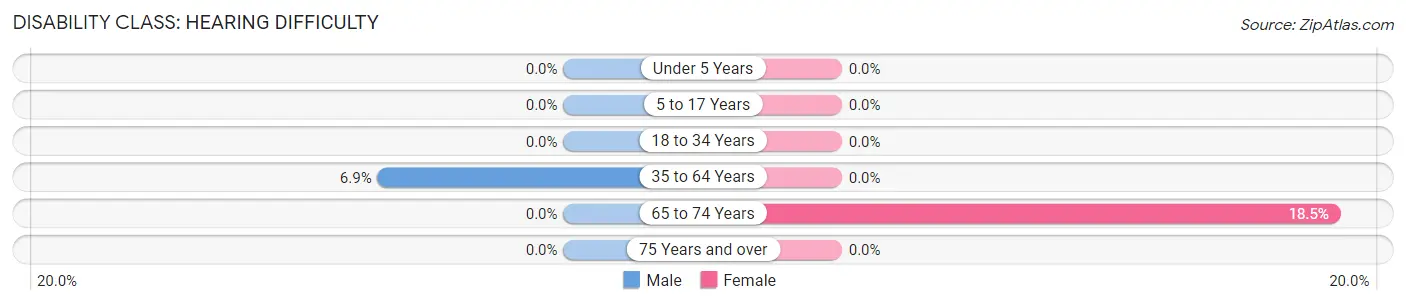
| Age Bracket | Male | Female |
| Under 5 Years | 0 (0.0%) | 0 (0.0%) |
| 5 to 17 Years | 0 (0.0%) | 0 (0.0%) |
| 18 to 34 Years | 0 (0.0%) | 0 (0.0%) |
| 35 to 64 Years | 6 (6.9%) | 0 (0.0%) |
| 65 to 74 Years | 0 (0.0%) | 5 (18.5%) |
| 75 Years and over | 0 (0.0%) | 0 (0.0%) |
Disability Class: Vision Difficulty
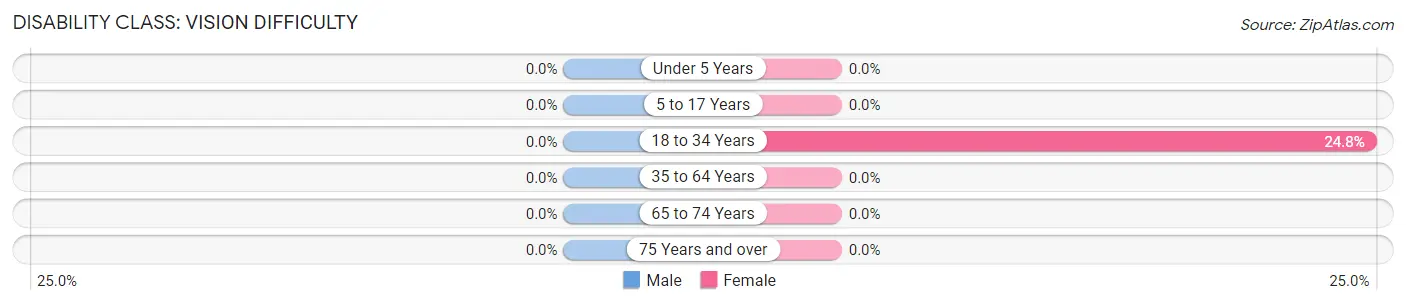
| Age Bracket | Male | Female |
| Under 5 Years | 0 (0.0%) | 0 (0.0%) |
| 5 to 17 Years | 0 (0.0%) | 0 (0.0%) |
| 18 to 34 Years | 0 (0.0%) | 32 (24.8%) |
| 35 to 64 Years | 0 (0.0%) | 0 (0.0%) |
| 65 to 74 Years | 0 (0.0%) | 0 (0.0%) |
| 75 Years and over | 0 (0.0%) | 0 (0.0%) |
Disability Class: Cognitive Difficulty
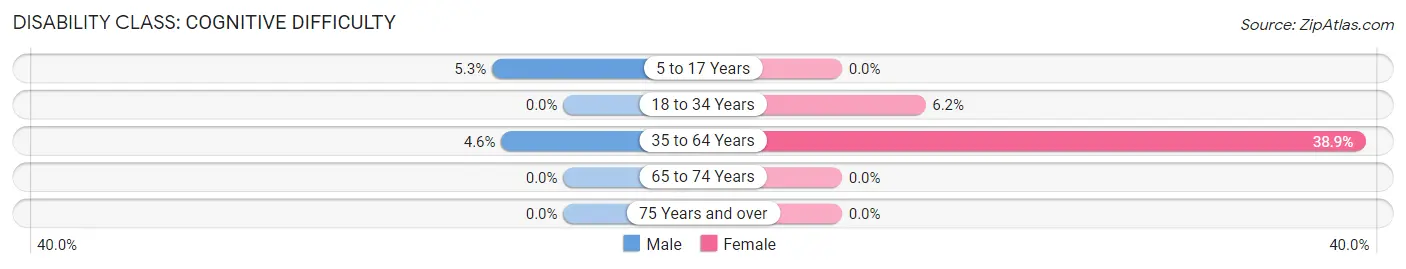
| Age Bracket | Male | Female |
| 5 to 17 Years | 7 (5.3%) | 0 (0.0%) |
| 18 to 34 Years | 0 (0.0%) | 8 (6.2%) |
| 35 to 64 Years | 4 (4.6%) | 61 (38.9%) |
| 65 to 74 Years | 0 (0.0%) | 0 (0.0%) |
| 75 Years and over | 0 (0.0%) | 0 (0.0%) |
Disability Class: Ambulatory Difficulty
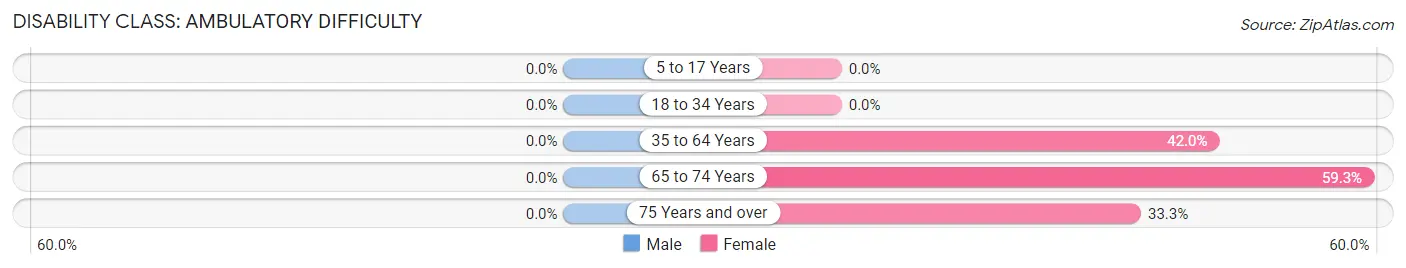
| Age Bracket | Male | Female |
| 5 to 17 Years | 0 (0.0%) | 0 (0.0%) |
| 18 to 34 Years | 0 (0.0%) | 0 (0.0%) |
| 35 to 64 Years | 0 (0.0%) | 66 (42.0%) |
| 65 to 74 Years | 0 (0.0%) | 16 (59.3%) |
| 75 Years and over | 0 (0.0%) | 15 (33.3%) |
Disability Class: Self-Care Difficulty
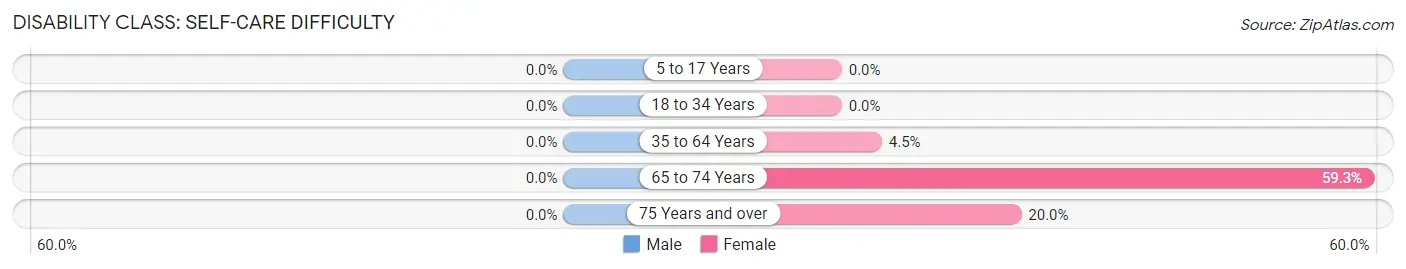
| Age Bracket | Male | Female |
| 5 to 17 Years | 0 (0.0%) | 0 (0.0%) |
| 18 to 34 Years | 0 (0.0%) | 0 (0.0%) |
| 35 to 64 Years | 0 (0.0%) | 7 (4.5%) |
| 65 to 74 Years | 0 (0.0%) | 16 (59.3%) |
| 75 Years and over | 0 (0.0%) | 9 (20.0%) |
Technology Access in Bobtown
Computing Device Access in Bobtown
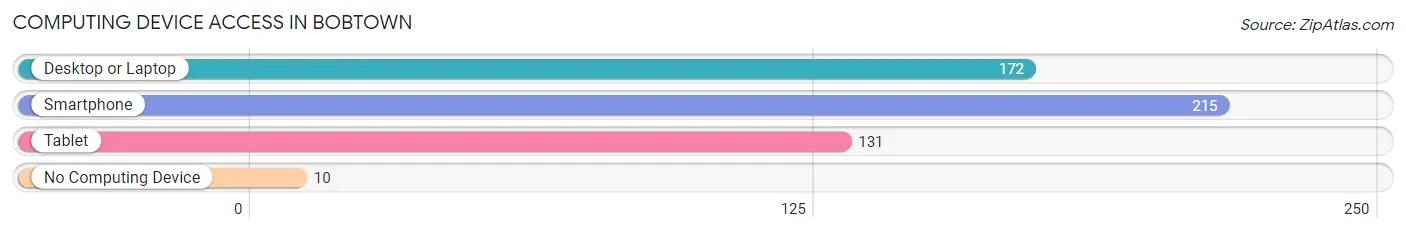
| Device Type | # Households | % Households |
| Desktop or Laptop | 172 | 70.5% |
| Smartphone | 215 | 88.1% |
| Tablet | 131 | 53.7% |
| No Computing Device | 10 | 4.1% |
| Total | 244 | 100.0% |
Internet Access in Bobtown
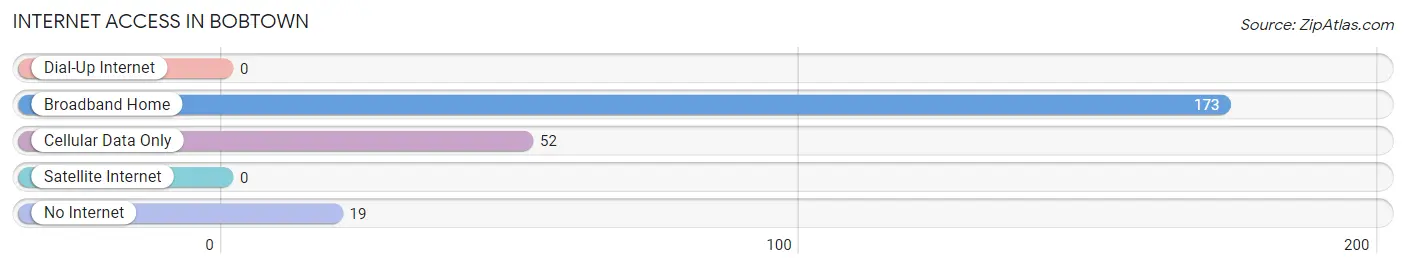
| Internet Type | # Households | % Households |
| Dial-Up Internet | 0 | 0.0% |
| Broadband Home | 173 | 70.9% |
| Cellular Data Only | 52 | 21.3% |
| Satellite Internet | 0 | 0.0% |
| No Internet | 19 | 7.8% |
| Total | 244 | 100.0% |
Bobtown Summary
Bobtown is a small borough located in Greene County, Pennsylvania. It is situated in the foothills of the Allegheny Mountains, approximately 40 miles south of Pittsburgh. The population of Bobtown was 545 at the 2010 census.
History
Bobtown was founded in 1876 by Robert and Mary Bobb, who purchased the land from the local Native American tribes. The town was originally known as Bobbtown, but the name was changed to Bobtown in 1883. The town was incorporated in 1887.
Bobtown was a coal mining town, and the coal industry was the main source of employment for the town's residents. The coal mines were owned by the Bobtown Coal Company, which was founded in 1887. The company operated several mines in the area, including the Bobtown Mine, which was the largest and most productive.
The town was also home to several other businesses, including a general store, a blacksmith shop, a hotel, and a post office. The town also had a school, which was built in 1891.
Geography
Bobtown is located in Greene County, Pennsylvania, in the foothills of the Allegheny Mountains. The town is situated at an elevation of 1,400 feet above sea level. The town is located approximately 40 miles south of Pittsburgh.
The town is bordered by the towns of Waynesburg to the north, Carmichaels to the east, and Wind Ridge to the south. The town is also bordered by the Monongahela River to the west.
Economy
The economy of Bobtown is largely based on the coal mining industry. The town is home to several coal mines, including the Bobtown Mine, which is the largest and most productive. The coal industry is the main source of employment for the town's residents.
In addition to the coal industry, Bobtown is also home to several other businesses, including a general store, a blacksmith shop, a hotel, and a post office. The town also has a school, which was built in 1891.
Demographics
As of the 2010 census, the population of Bobtown was 545. The racial makeup of the town was 97.3% White, 0.7% African American, 0.2% Native American, 0.2% Asian, and 1.6% from other races. The median household income was $37,500, and the median family income was $41,250.
The town is served by the Bobtown Area School District, which consists of one elementary school, one middle school, and one high school. The town is also home to several churches, including the Bobtown United Methodist Church, the Bobtown Presbyterian Church, and the Bobtown Baptist Church.
Common Questions
What is Per Capita Income in Bobtown?
Per Capita income in Bobtown is $18,874.
What is the Median Family Income in Bobtown?
Median Family Income in Bobtown is $46,716.
What is the Median Household income in Bobtown?
Median Household Income in Bobtown is $46,618.
What is Income or Wage Gap in Bobtown?
Income or Wage Gap in Bobtown is 30.4%.
Women in Bobtown earn 69.6 cents for every dollar earned by a man.
What is Inequality or Gini Index in Bobtown?
Inequality or Gini Index in Bobtown is 0.40.
What is the Total Population of Bobtown?
Total Population of Bobtown is 780.
What is the Total Male Population of Bobtown?
Total Male Population of Bobtown is 287.
What is the Total Female Population of Bobtown?
Total Female Population of Bobtown is 493.
What is the Ratio of Males per 100 Females in Bobtown?
There are 58.22 Males per 100 Females in Bobtown.
What is the Ratio of Females per 100 Males in Bobtown?
There are 171.78 Females per 100 Males in Bobtown.
What is the Median Population Age in Bobtown?
Median Population Age in Bobtown is 29.4 Years.
What is the Average Family Size in Bobtown
Average Family Size in Bobtown is 3.5 People.
What is the Average Household Size in Bobtown
Average Household Size in Bobtown is 3.2 People.
How Large is the Labor Force in Bobtown?
There are 249 People in the Labor Forcein in Bobtown.
What is the Percentage of People in the Labor Force in Bobtown?
47.1% of People are in the Labor Force in Bobtown.