Blue Ridge Summit, PA Map & Demographics
Blue Ridge Summit Map
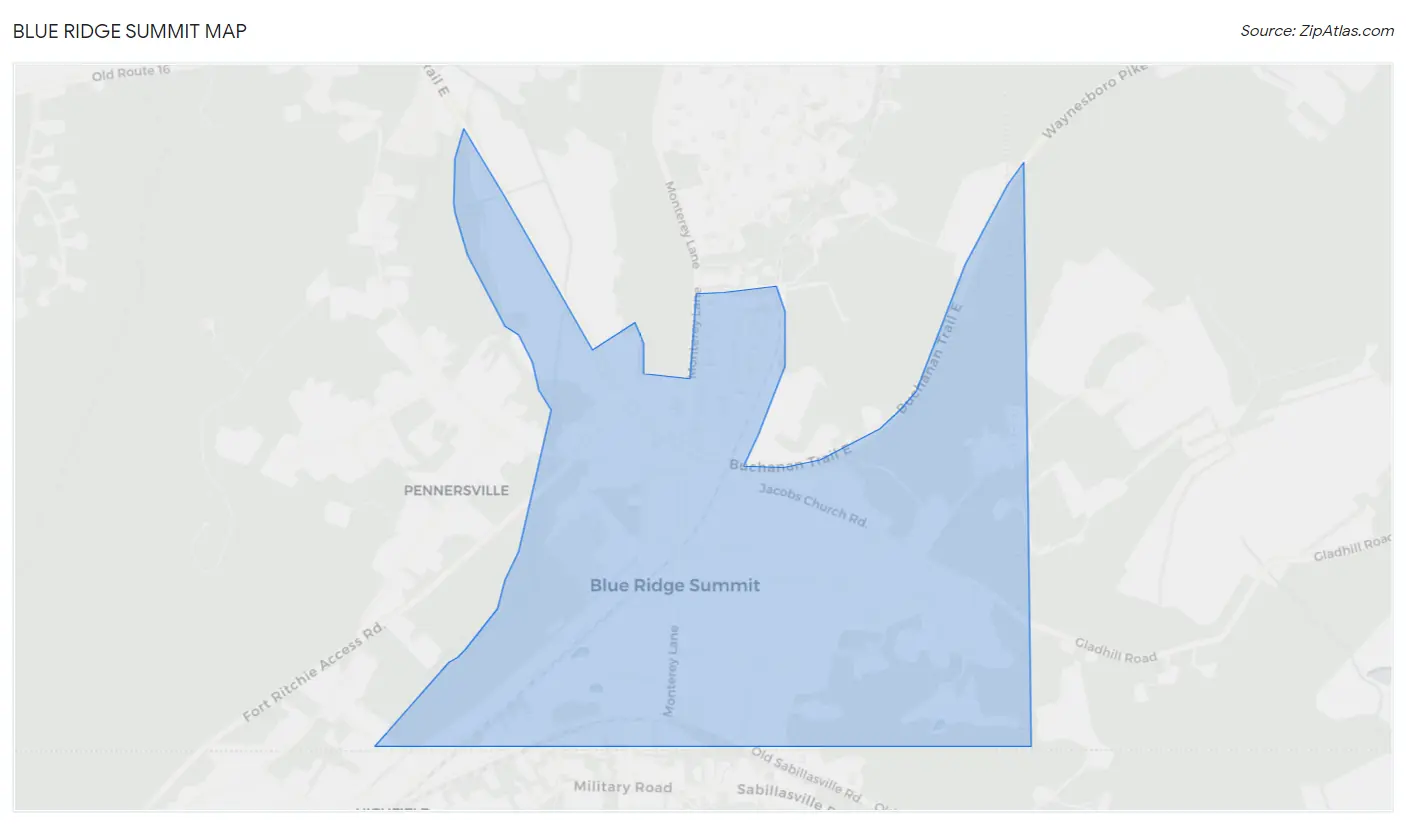
Blue Ridge Summit Overview
$30,907
PER CAPITA INCOME
$102,938
AVG FAMILY INCOME
$44,348
AVG HOUSEHOLD INCOME
5.3%
WAGE / INCOME GAP [ % ]
94.7¢/ $1
WAGE / INCOME GAP [ $ ]
0.40
INEQUALITY / GINI INDEX
1,039
TOTAL POPULATION
622
MALE POPULATION
417
FEMALE POPULATION
149.16
MALES / 100 FEMALES
67.04
FEMALES / 100 MALES
42.2
MEDIAN AGE
3.2
AVG FAMILY SIZE
2.0
AVG HOUSEHOLD SIZE
503
LABOR FORCE [ PEOPLE ]
61.9%
PERCENT IN LABOR FORCE
0.2%
UNEMPLOYMENT RATE
Blue Ridge Summit Zip Codes
Blue Ridge Summit Area Codes
Income in Blue Ridge Summit
Income Overview in Blue Ridge Summit
Per Capita Income in Blue Ridge Summit is $30,907, while median incomes of families and households are $102,938 and $44,348 respectively.
| Characteristic | Number | Measure |
| Per Capita Income | 1,039 | $30,907 |
| Median Family Income | 217 | $102,938 |
| Mean Family Income | 217 | $97,400 |
| Median Household Income | 512 | $44,348 |
| Mean Household Income | 512 | $64,176 |
| Income Deficit | 217 | $0 |
| Wage / Income Gap (%) | 1,039 | 5.26% |
| Wage / Income Gap ($) | 1,039 | 94.74¢ per $1 |
| Gini / Inequality Index | 1,039 | 0.40 |
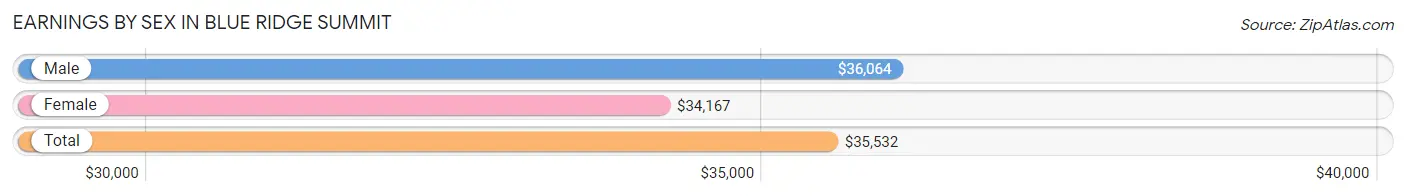
Earnings by Sex in Blue Ridge Summit
Average Earnings in Blue Ridge Summit are $35,532, $36,064 for men and $34,167 for women, a difference of 5.3%.
| Sex | Number | Average Earnings |
| Male | 328 (65.3%) | $36,064 |
| Female | 174 (34.7%) | $34,167 |
| Total | 502 (100.0%) | $35,532 |
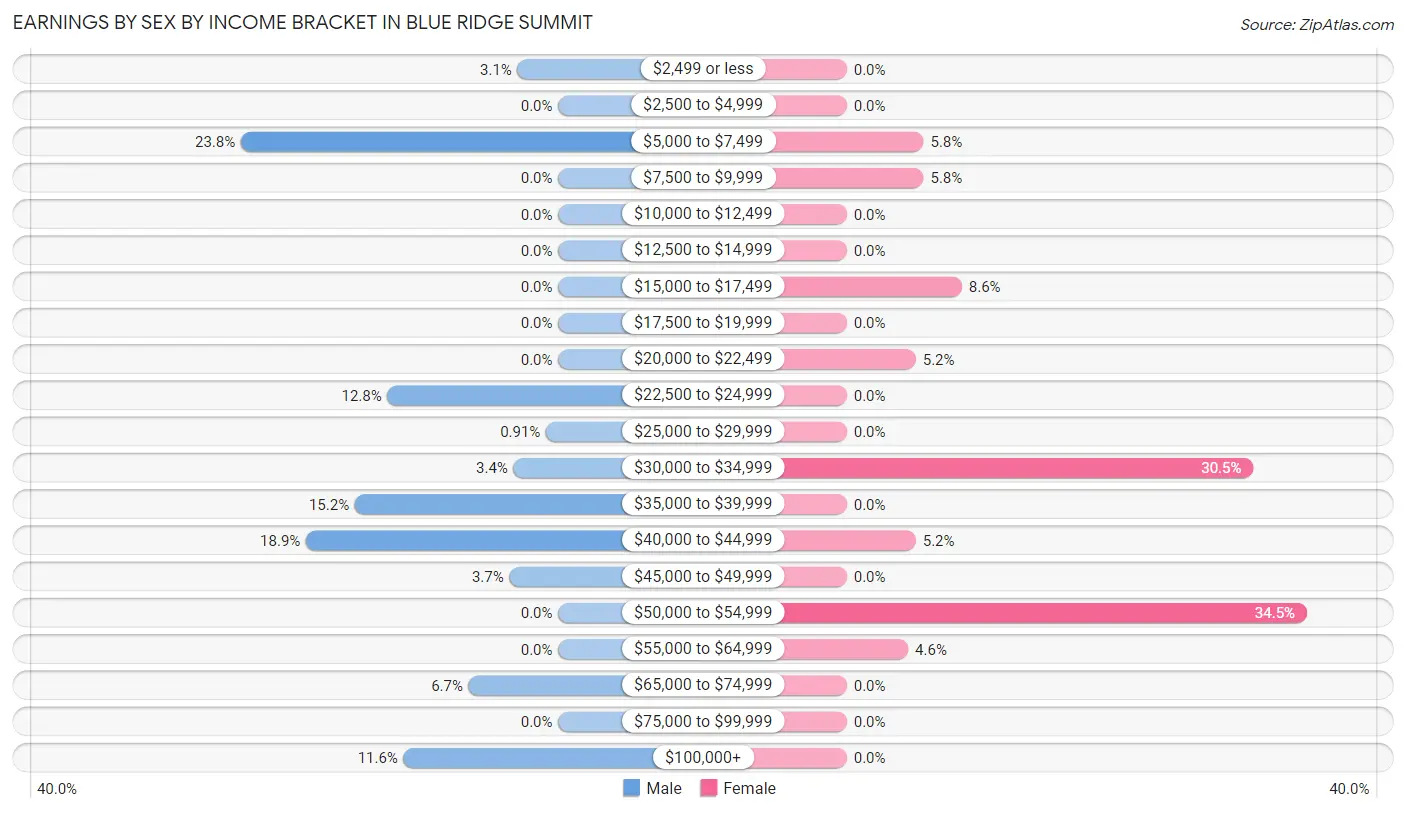
Earnings by Sex by Income Bracket in Blue Ridge Summit
The most common earnings brackets in Blue Ridge Summit are $5,000 to $7,499 for men (78 | 23.8%) and $50,000 to $54,999 for women (60 | 34.5%).
| Income | Male | Female |
| $2,499 or less | 10 (3.0%) | 0 (0.0%) |
| $2,500 to $4,999 | 0 (0.0%) | 0 (0.0%) |
| $5,000 to $7,499 | 78 (23.8%) | 10 (5.8%) |
| $7,500 to $9,999 | 0 (0.0%) | 10 (5.8%) |
| $10,000 to $12,499 | 0 (0.0%) | 0 (0.0%) |
| $12,500 to $14,999 | 0 (0.0%) | 0 (0.0%) |
| $15,000 to $17,499 | 0 (0.0%) | 15 (8.6%) |
| $17,500 to $19,999 | 0 (0.0%) | 0 (0.0%) |
| $20,000 to $22,499 | 0 (0.0%) | 9 (5.2%) |
| $22,500 to $24,999 | 42 (12.8%) | 0 (0.0%) |
| $25,000 to $29,999 | 3 (0.9%) | 0 (0.0%) |
| $30,000 to $34,999 | 11 (3.4%) | 53 (30.5%) |
| $35,000 to $39,999 | 50 (15.2%) | 0 (0.0%) |
| $40,000 to $44,999 | 62 (18.9%) | 9 (5.2%) |
| $45,000 to $49,999 | 12 (3.7%) | 0 (0.0%) |
| $50,000 to $54,999 | 0 (0.0%) | 60 (34.5%) |
| $55,000 to $64,999 | 0 (0.0%) | 8 (4.6%) |
| $65,000 to $74,999 | 22 (6.7%) | 0 (0.0%) |
| $75,000 to $99,999 | 0 (0.0%) | 0 (0.0%) |
| $100,000+ | 38 (11.6%) | 0 (0.0%) |
| Total | 328 (100.0%) | 174 (100.0%) |
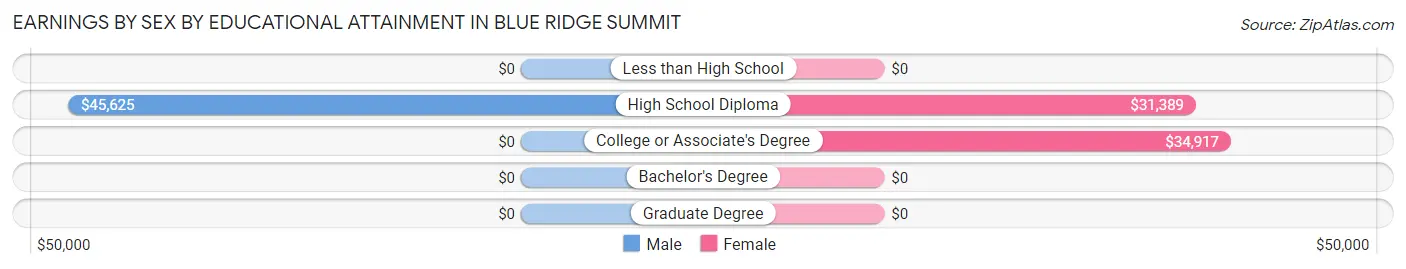
Earnings by Sex by Educational Attainment in Blue Ridge Summit
Average earnings in Blue Ridge Summit are $43,925 for men and $34,167 for women, a difference of 22.2%. Men with an educational attainment of high school diploma enjoy the highest average annual earnings of $45,625, while those with high school diploma education earn the least with $45,625. Women with an educational attainment of college or associate's degree earn the most with the average annual earnings of $34,917, while those with high school diploma education have the smallest earnings of $31,389.
| Educational Attainment | Male Income | Female Income |
| Less than High School | - | - |
| High School Diploma | $45,625 | $31,389 |
| College or Associate's Degree | - | - |
| Bachelor's Degree | - | - |
| Graduate Degree | - | - |
| Total | $43,925 | $34,167 |
Family Income in Blue Ridge Summit
Family Income Brackets in Blue Ridge Summit
According to the Blue Ridge Summit family income data, there are 80 families falling into the $100,000 to $149,999 income range, which is the most common income bracket and makes up 36.9% of all families.
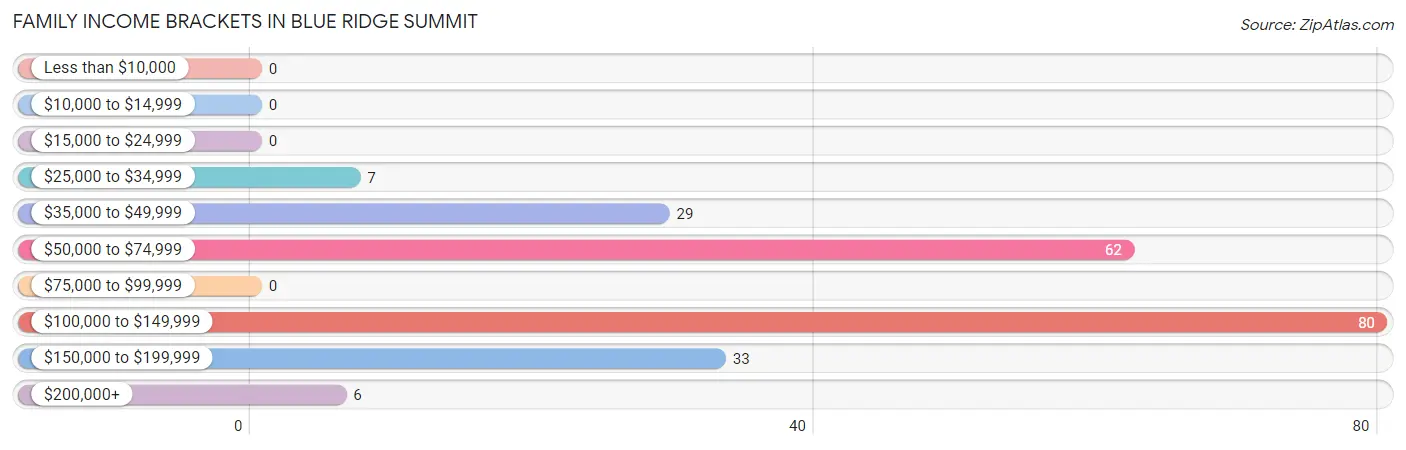
| Income Bracket | # Families | % Families |
| Less than $10,000 | 0 | 0.0% |
| $10,000 to $14,999 | 0 | 0.0% |
| $15,000 to $24,999 | 0 | 0.0% |
| $25,000 to $34,999 | 7 | 3.2% |
| $35,000 to $49,999 | 29 | 13.4% |
| $50,000 to $74,999 | 62 | 28.6% |
| $75,000 to $99,999 | 0 | 0.0% |
| $100,000 to $149,999 | 80 | 36.9% |
| $150,000 to $199,999 | 33 | 15.2% |
| $200,000+ | 6 | 2.8% |
Family Income by Famaliy Size in Blue Ridge Summit
2-person families (89 | 41.0%) account for the highest median family income in Blue Ridge Summit with $64,036 per family, while 2-person families (89 | 41.0%) have the highest median income of $32,018 per family member.
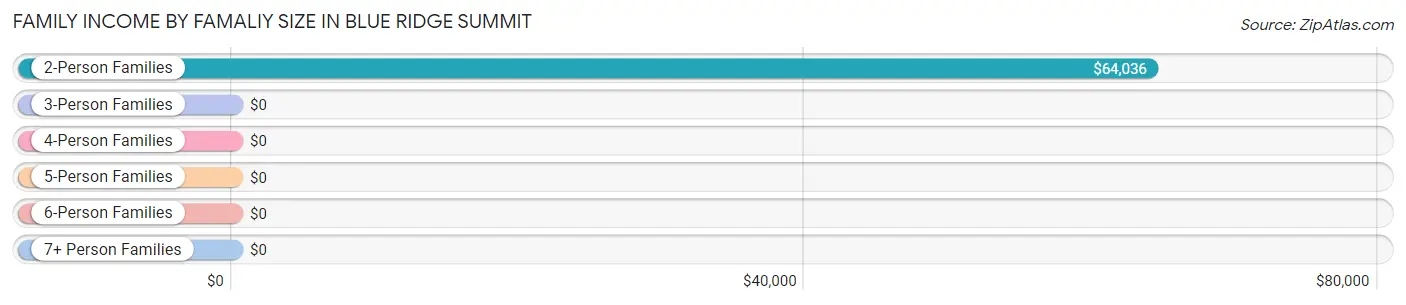
| Income Bracket | # Families | Median Income |
| 2-Person Families | 89 (41.0%) | $64,036 |
| 3-Person Families | 28 (12.9%) | $0 |
| 4-Person Families | 45 (20.7%) | $0 |
| 5-Person Families | 48 (22.1%) | $0 |
| 6-Person Families | 0 (0.0%) | $0 |
| 7+ Person Families | 7 (3.2%) | $0 |
| Total | 217 (100.0%) | $102,938 |
Family Income by Number of Earners in Blue Ridge Summit
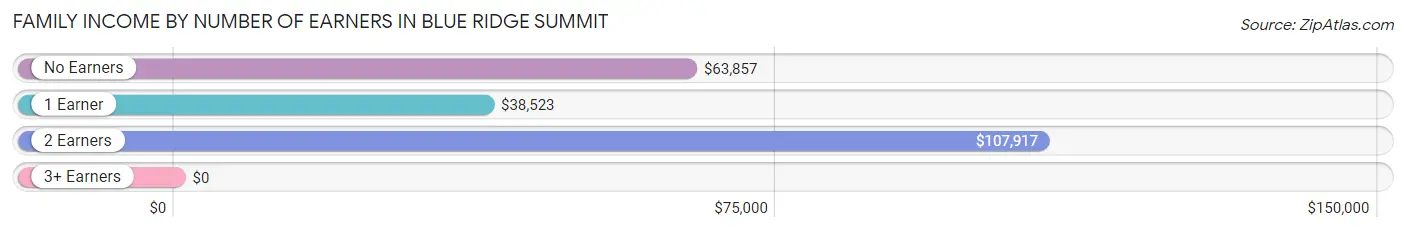
| Number of Earners | # Families | Median Income |
| No Earners | 52 (24.0%) | $63,857 |
| 1 Earner | 35 (16.1%) | $38,523 |
| 2 Earners | 81 (37.3%) | $107,917 |
| 3+ Earners | 49 (22.6%) | $0 |
| Total | 217 (100.0%) | $102,938 |
Household Income in Blue Ridge Summit
Household Income Brackets in Blue Ridge Summit
With 111 households falling in the category, the $15,000 to $24,999 income range is the most frequent in Blue Ridge Summit, accounting for 21.7% of all households.
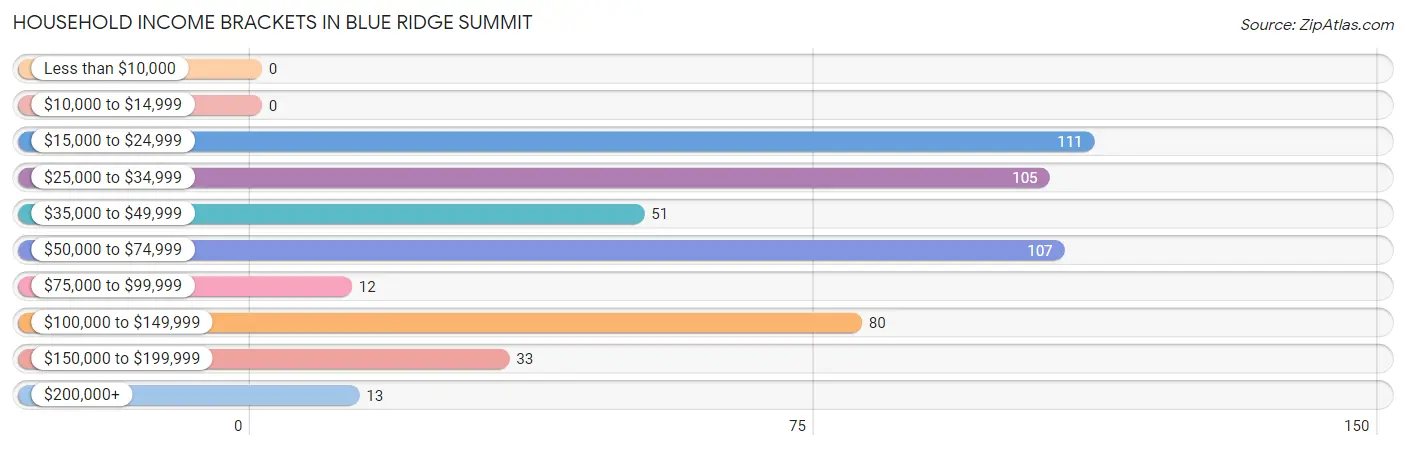
| Income Bracket | # Households | % Households |
| Less than $10,000 | 0 | 0.0% |
| $10,000 to $14,999 | 0 | 0.0% |
| $15,000 to $24,999 | 111 | 21.7% |
| $25,000 to $34,999 | 105 | 20.5% |
| $35,000 to $49,999 | 51 | 10.0% |
| $50,000 to $74,999 | 107 | 20.9% |
| $75,000 to $99,999 | 12 | 2.3% |
| $100,000 to $149,999 | 80 | 15.6% |
| $150,000 to $199,999 | 33 | 6.4% |
| $200,000+ | 13 | 2.5% |
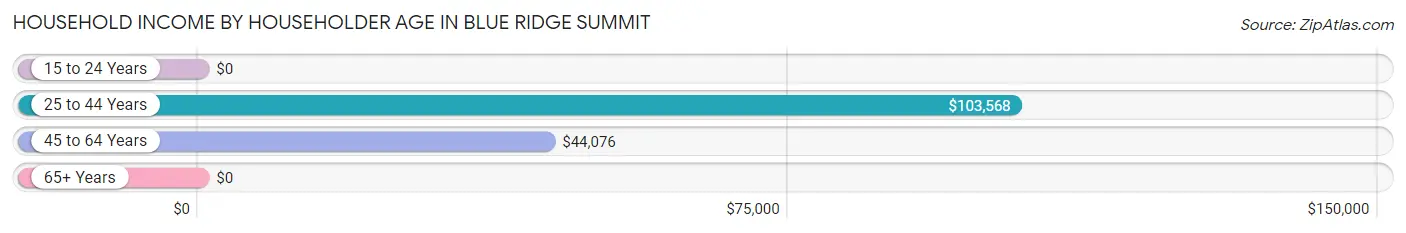
Household Income by Householder Age in Blue Ridge Summit
The median household income in Blue Ridge Summit is $44,348, with the highest median household income of $103,568 found in the 25 to 44 years age bracket for the primary householder. A total of 121 households (23.6%) fall into this category. Meanwhile, the 15 to 24 years age bracket for the primary householder has the lowest median household income of $0, with 42 households (8.2%) in this group.
| Income Bracket | # Households | Median Income |
| 15 to 24 Years | 42 (8.2%) | $0 |
| 25 to 44 Years | 121 (23.6%) | $103,568 |
| 45 to 64 Years | 157 (30.7%) | $44,076 |
| 65+ Years | 192 (37.5%) | $0 |
| Total | 512 (100.0%) | $44,348 |
Poverty in Blue Ridge Summit
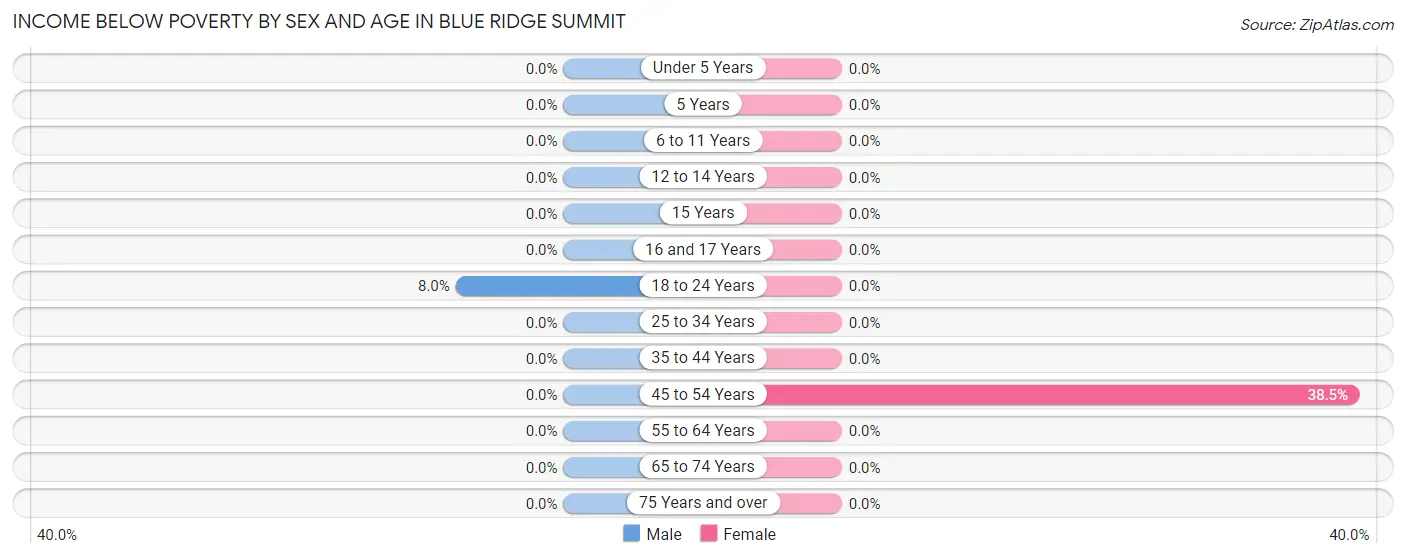
Income Below Poverty by Sex and Age in Blue Ridge Summit
With 1.6% poverty level for males and 2.4% for females among the residents of Blue Ridge Summit, 18 to 24 year old males and 45 to 54 year old females are the most vulnerable to poverty, with 10 males (8.0%) and 10 females (38.5%) in their respective age groups living below the poverty level.
| Age Bracket | Male | Female |
| Under 5 Years | 0 (0.0%) | 0 (0.0%) |
| 5 Years | 0 (0.0%) | 0 (0.0%) |
| 6 to 11 Years | 0 (0.0%) | 0 (0.0%) |
| 12 to 14 Years | 0 (0.0%) | 0 (0.0%) |
| 15 Years | 0 (0.0%) | 0 (0.0%) |
| 16 and 17 Years | 0 (0.0%) | 0 (0.0%) |
| 18 to 24 Years | 10 (8.0%) | 0 (0.0%) |
| 25 to 34 Years | 0 (0.0%) | 0 (0.0%) |
| 35 to 44 Years | 0 (0.0%) | 0 (0.0%) |
| 45 to 54 Years | 0 (0.0%) | 10 (38.5%) |
| 55 to 64 Years | 0 (0.0%) | 0 (0.0%) |
| 65 to 74 Years | 0 (0.0%) | 0 (0.0%) |
| 75 Years and over | 0 (0.0%) | 0 (0.0%) |
| Total | 10 (1.6%) | 10 (2.4%) |
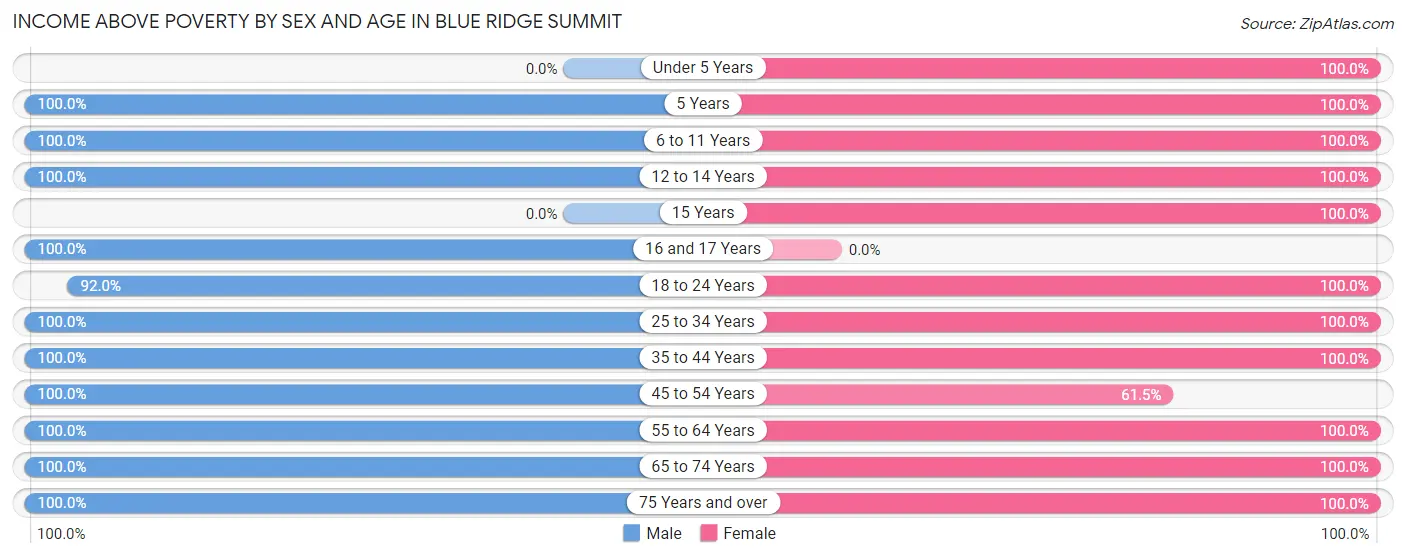
Income Above Poverty by Sex and Age in Blue Ridge Summit
According to the poverty statistics in Blue Ridge Summit, males aged 5 years and females aged under 5 years are the age groups that are most secure financially, with 100.0% of males and 100.0% of females in these age groups living above the poverty line.
| Age Bracket | Male | Female |
| Under 5 Years | 0 (0.0%) | 6 (100.0%) |
| 5 Years | 6 (100.0%) | 10 (100.0%) |
| 6 to 11 Years | 26 (100.0%) | 38 (100.0%) |
| 12 to 14 Years | 64 (100.0%) | 24 (100.0%) |
| 15 Years | 0 (0.0%) | 45 (100.0%) |
| 16 and 17 Years | 13 (100.0%) | 0 (0.0%) |
| 18 to 24 Years | 115 (92.0%) | 14 (100.0%) |
| 25 to 34 Years | 19 (100.0%) | 37 (100.0%) |
| 35 to 44 Years | 43 (100.0%) | 86 (100.0%) |
| 45 to 54 Years | 58 (100.0%) | 16 (61.5%) |
| 55 to 64 Years | 90 (100.0%) | 79 (100.0%) |
| 65 to 74 Years | 151 (100.0%) | 23 (100.0%) |
| 75 Years and over | 19 (100.0%) | 29 (100.0%) |
| Total | 604 (98.4%) | 407 (97.6%) |
Income Below Poverty Among Married-Couple Families in Blue Ridge Summit
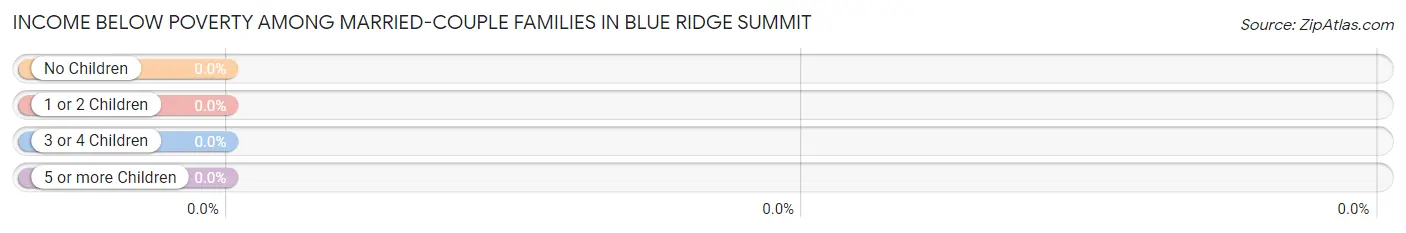
| Children | Above Poverty | Below Poverty |
| No Children | 36 (100.0%) | 0 (0.0%) |
| 1 or 2 Children | 96 (100.0%) | 0 (0.0%) |
| 3 or 4 Children | 1 (100.0%) | 0 (0.0%) |
| 5 or more Children | 6 (100.0%) | 0 (0.0%) |
| Total | 139 (100.0%) | 0 (0.0%) |
Income Below Poverty Among Single-Parent Households in Blue Ridge Summit
| Children | Single Father | Single Mother |
| No Children | 0 (0.0%) | 0 (0.0%) |
| 1 or 2 Children | 0 (0.0%) | 0 (0.0%) |
| 3 or 4 Children | 0 (0.0%) | 0 (0.0%) |
| 5 or more Children | 0 (0.0%) | 0 (0.0%) |
| Total | 0 (0.0%) | 0 (0.0%) |
Income Below Poverty Among Married-Couple vs Single-Parent Households in Blue Ridge Summit
| Children | Married-Couple Families | Single-Parent Households |
| No Children | 0 (0.0%) | 0 (0.0%) |
| 1 or 2 Children | 0 (0.0%) | 0 (0.0%) |
| 3 or 4 Children | 0 (0.0%) | 0 (0.0%) |
| 5 or more Children | 0 (0.0%) | 0 (0.0%) |
| Total | 0 (0.0%) | 0 (0.0%) |
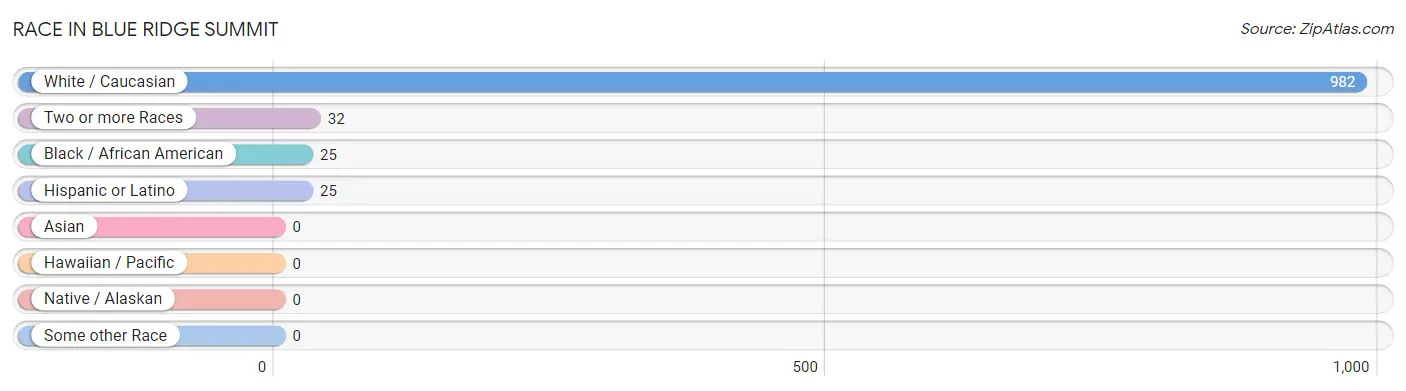
Race in Blue Ridge Summit
The most populous races in Blue Ridge Summit are White / Caucasian (982 | 94.5%), Two or more Races (32 | 3.1%), and Black / African American (25 | 2.4%).
| Race | # Population | % Population |
| Asian | 0 | 0.0% |
| Black / African American | 25 | 2.4% |
| Hawaiian / Pacific | 0 | 0.0% |
| Hispanic or Latino | 25 | 2.4% |
| Native / Alaskan | 0 | 0.0% |
| White / Caucasian | 982 | 94.5% |
| Two or more Races | 32 | 3.1% |
| Some other Race | 0 | 0.0% |
| Total | 1,039 | 100.0% |
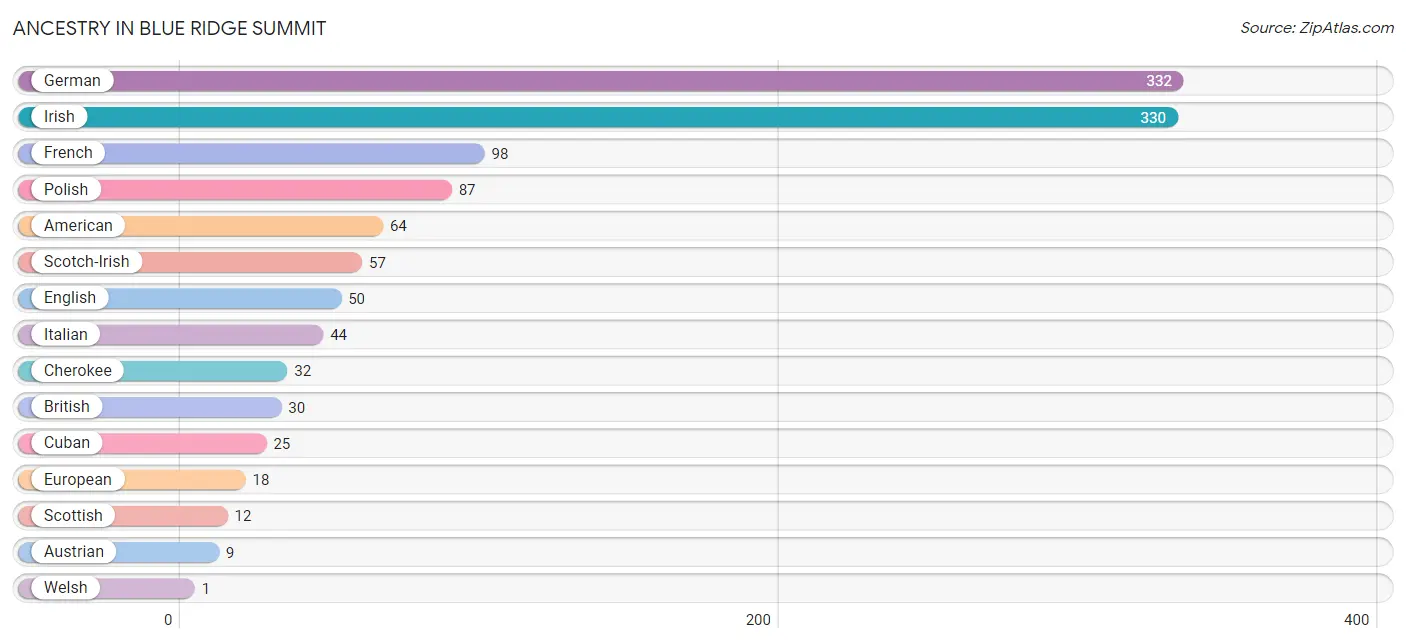
Ancestry in Blue Ridge Summit
The most populous ancestries reported in Blue Ridge Summit are German (332 | 32.0%), Irish (330 | 31.8%), French (98 | 9.4%), Polish (87 | 8.4%), and American (64 | 6.2%), together accounting for 87.7% of all Blue Ridge Summit residents.
| Ancestry | # Population | % Population |
| American | 64 | 6.2% |
| Austrian | 9 | 0.9% |
| British | 30 | 2.9% |
| Cherokee | 32 | 3.1% |
| Cuban | 25 | 2.4% |
| English | 50 | 4.8% |
| European | 18 | 1.7% |
| French | 98 | 9.4% |
| German | 332 | 32.0% |
| Irish | 330 | 31.8% |
| Italian | 44 | 4.2% |
| Polish | 87 | 8.4% |
| Scotch-Irish | 57 | 5.5% |
| Scottish | 12 | 1.1% |
| Welsh | 1 | 0.1% | View All 15 Rows |
Immigrants in Blue Ridge Summit

| Immigration Origin | # Population | % Population | View All 0 Rows |
Sex and Age in Blue Ridge Summit
Sex and Age in Blue Ridge Summit
The most populous age groups in Blue Ridge Summit are 70 to 74 Years (104 | 16.7%) for men and 40 to 44 Years (56 | 13.4%) for women.
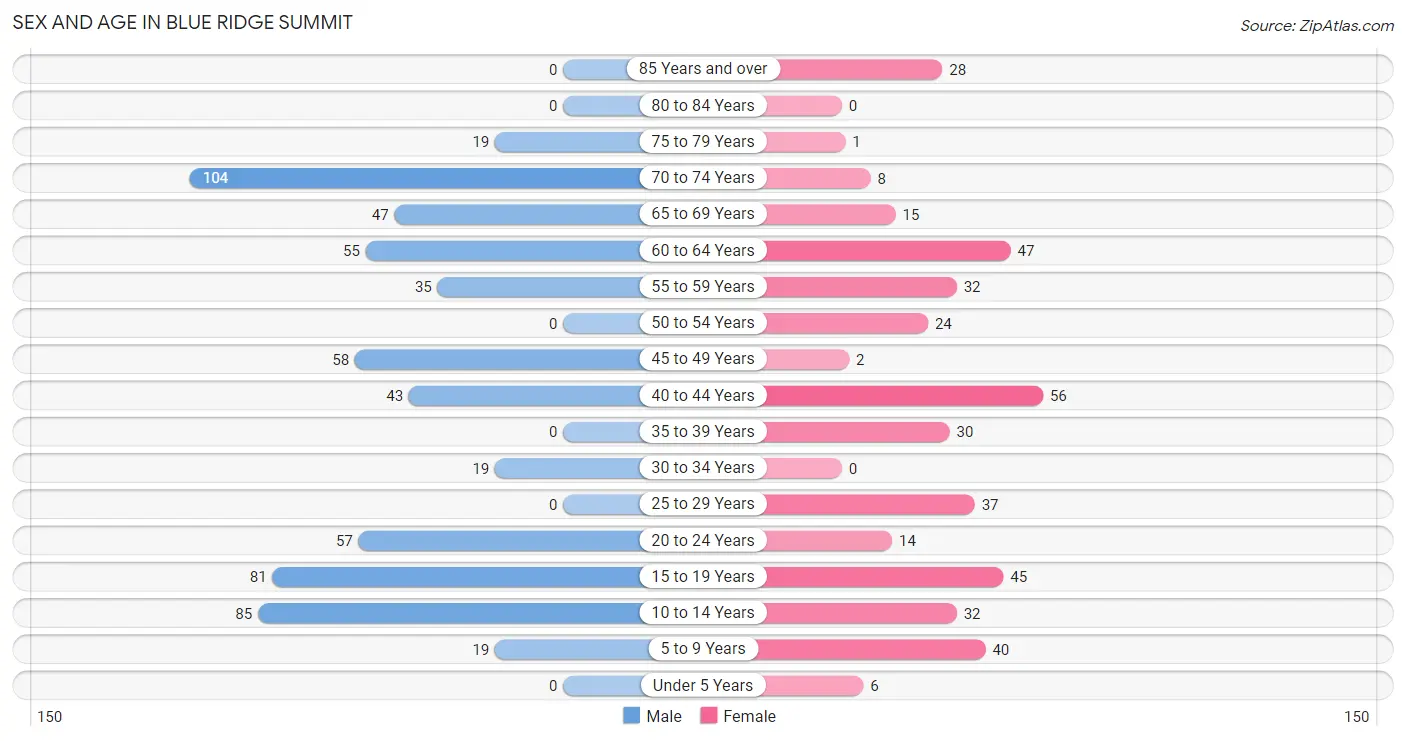
| Age Bracket | Male | Female |
| Under 5 Years | 0 (0.0%) | 6 (1.4%) |
| 5 to 9 Years | 19 (3.0%) | 40 (9.6%) |
| 10 to 14 Years | 85 (13.7%) | 32 (7.7%) |
| 15 to 19 Years | 81 (13.0%) | 45 (10.8%) |
| 20 to 24 Years | 57 (9.2%) | 14 (3.4%) |
| 25 to 29 Years | 0 (0.0%) | 37 (8.9%) |
| 30 to 34 Years | 19 (3.0%) | 0 (0.0%) |
| 35 to 39 Years | 0 (0.0%) | 30 (7.2%) |
| 40 to 44 Years | 43 (6.9%) | 56 (13.4%) |
| 45 to 49 Years | 58 (9.3%) | 2 (0.5%) |
| 50 to 54 Years | 0 (0.0%) | 24 (5.8%) |
| 55 to 59 Years | 35 (5.6%) | 32 (7.7%) |
| 60 to 64 Years | 55 (8.8%) | 47 (11.3%) |
| 65 to 69 Years | 47 (7.6%) | 15 (3.6%) |
| 70 to 74 Years | 104 (16.7%) | 8 (1.9%) |
| 75 to 79 Years | 19 (3.0%) | 1 (0.2%) |
| 80 to 84 Years | 0 (0.0%) | 0 (0.0%) |
| 85 Years and over | 0 (0.0%) | 28 (6.7%) |
| Total | 622 (100.0%) | 417 (100.0%) |
Families and Households in Blue Ridge Summit
Median Family Size in Blue Ridge Summit
The median family size in Blue Ridge Summit is 3.22 persons per family, with married-couple families (139 | 64.1%) accounting for the largest median family size of 3.82 persons per family. On the other hand, single female/mother families (48 | 22.1%) represent the smallest median family size with 1.83 persons per family.
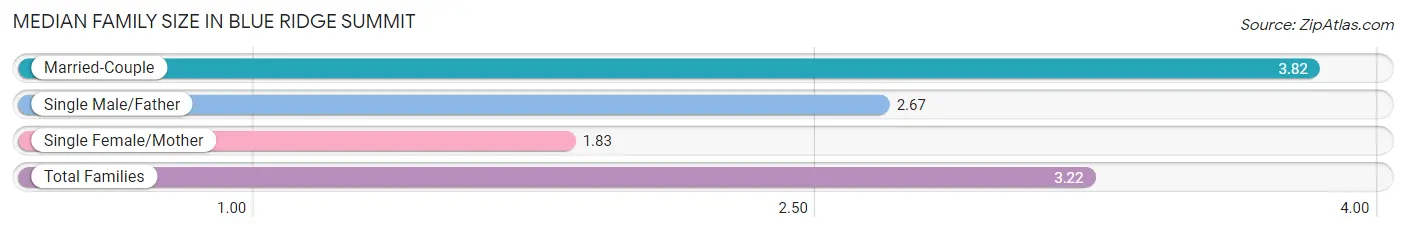
| Family Type | # Families | Family Size |
| Married-Couple | 139 (64.1%) | 3.82 |
| Single Male/Father | 30 (13.8%) | 2.67 |
| Single Female/Mother | 48 (22.1%) | 1.83 |
| Total Families | 217 (100.0%) | 3.22 |
Median Household Size in Blue Ridge Summit
The median household size in Blue Ridge Summit is 2.03 persons per household, with married-couple households (139 | 27.2%) accounting for the largest median household size of 3.82 persons per household. non-family households (295 | 57.6%) represent the smallest median household size with 1.09 persons per household.
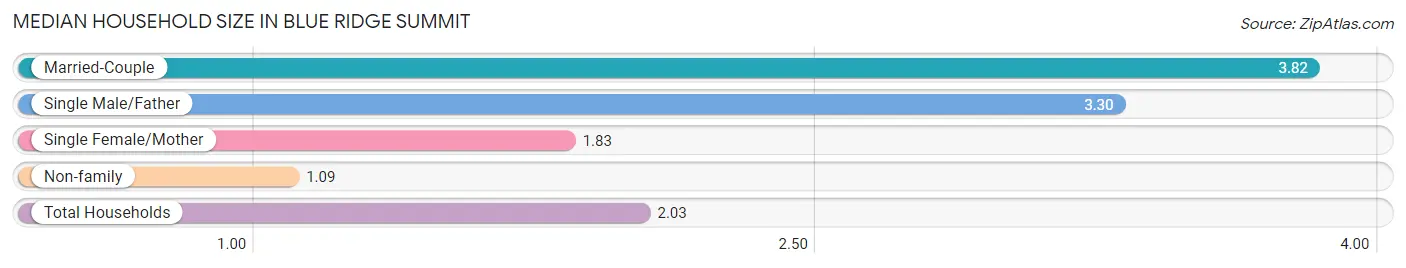
| Household Type | # Households | Household Size |
| Married-Couple | 139 (27.2%) | 3.82 |
| Single Male/Father | 30 (5.9%) | 3.30 |
| Single Female/Mother | 48 (9.4%) | 1.83 |
| Non-family | 295 (57.6%) | 1.09 |
| Total Households | 512 (100.0%) | 2.03 |
Household Size by Marriage Status in Blue Ridge Summit
Out of a total of 512 households in Blue Ridge Summit, 217 (42.4%) are family households, while 295 (57.6%) are nonfamily households. The most numerous type of family households are 2-person households, comprising 78, and the most common type of nonfamily households are 1-person households, comprising 288.
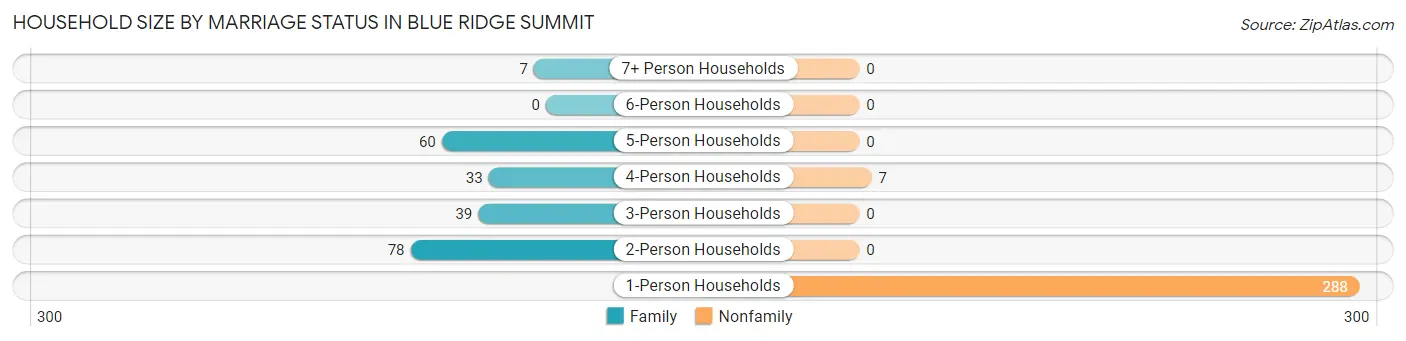
| Household Size | Family Households | Nonfamily Households |
| 1-Person Households | - | 288 (56.2%) |
| 2-Person Households | 78 (15.2%) | 0 (0.0%) |
| 3-Person Households | 39 (7.6%) | 0 (0.0%) |
| 4-Person Households | 33 (6.5%) | 7 (1.4%) |
| 5-Person Households | 60 (11.7%) | 0 (0.0%) |
| 6-Person Households | 0 (0.0%) | 0 (0.0%) |
| 7+ Person Households | 7 (1.4%) | 0 (0.0%) |
| Total | 217 (42.4%) | 295 (57.6%) |
Female Fertility in Blue Ridge Summit
Fertility by Age in Blue Ridge Summit
| Age Bracket | Women with Births | Births / 1,000 Women |
| 15 to 19 years | 0 (0.0%) | 0.0 |
| 20 to 34 years | 0 (0.0%) | 0.0 |
| 35 to 50 years | 0 (0.0%) | 0.0 |
| Total | 0 (0.0%) | 0.0 |
Fertility by Age by Marriage Status in Blue Ridge Summit
| Age Bracket | Married | Unmarried |
| 15 to 19 years | 0 (0.0%) | 0 (0.0%) |
| 20 to 34 years | 0 (0.0%) | 0 (0.0%) |
| 35 to 50 years | 0 (0.0%) | 0 (0.0%) |
| Total | 0 (0.0%) | 0 (0.0%) |
Fertility by Education in Blue Ridge Summit
| Educational Attainment | Women with Births | Births / 1,000 Women |
| Less than High School | 0 (0.0%) | 0.0 |
| High School Diploma | 0 (0.0%) | 0.0 |
| College or Associate's Degree | 0 (0.0%) | 0.0 |
| Bachelor's Degree | 0 (0.0%) | 0.0 |
| Graduate Degree | 0 (0.0%) | 0.0 |
| Total | 0 (0.0%) | 0.0 |
Fertility by Education by Marriage Status in Blue Ridge Summit
| Educational Attainment | Married | Unmarried |
| Less than High School | 0 (0.0%) | 0 (0.0%) |
| High School Diploma | 0 (0.0%) | 0 (0.0%) |
| College or Associate's Degree | 0 (0.0%) | 0 (0.0%) |
| Bachelor's Degree | 0 (0.0%) | 0 (0.0%) |
| Graduate Degree | 0 (0.0%) | 0 (0.0%) |
| Total | 0 (0.0%) | 0 (0.0%) |
Employment Characteristics in Blue Ridge Summit
Employment by Class of Employer in Blue Ridge Summit
Among the 436 employed individuals in Blue Ridge Summit, private company employees (383 | 87.8%), and not-for-profit organizations (53 | 12.2%) make up the most common classes of employment.
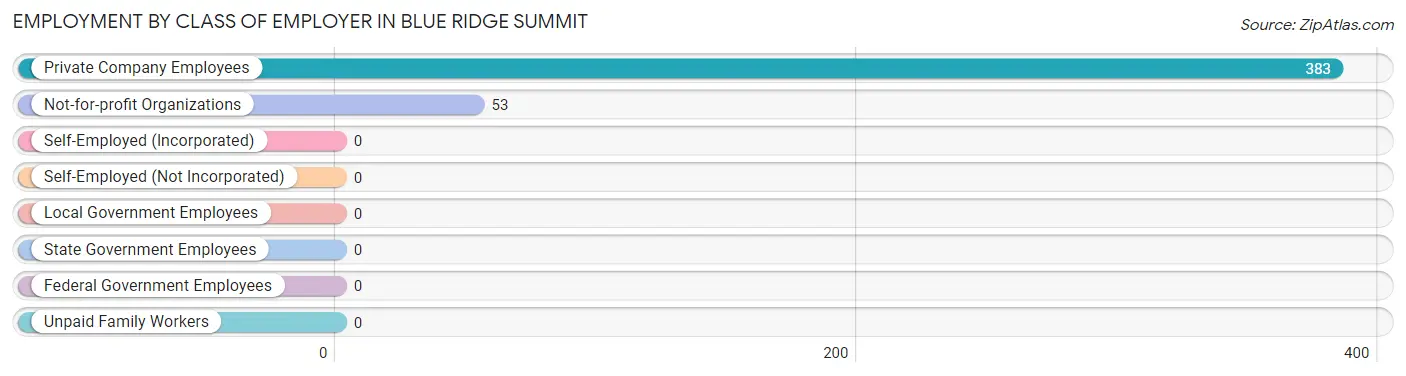
| Employer Class | # Employees | % Employees |
| Private Company Employees | 383 | 87.8% |
| Self-Employed (Incorporated) | 0 | 0.0% |
| Self-Employed (Not Incorporated) | 0 | 0.0% |
| Not-for-profit Organizations | 53 | 12.2% |
| Local Government Employees | 0 | 0.0% |
| State Government Employees | 0 | 0.0% |
| Federal Government Employees | 0 | 0.0% |
| Unpaid Family Workers | 0 | 0.0% |
| Total | 436 | 100.0% |
Employment Status by Age in Blue Ridge Summit
According to the labor force statistics for Blue Ridge Summit, out of the total population over 16 years of age (812), 61.9% or 503 individuals are in the labor force, with 0.2% or 1 of them unemployed. The age group with the highest labor force participation rate is 25 to 29 years, with 100.0% or 37 individuals in the labor force. Within the labor force, the 16 to 19 years age range has the highest percentage of unemployed individuals, with 1.3% or 1 of them being unemployed.
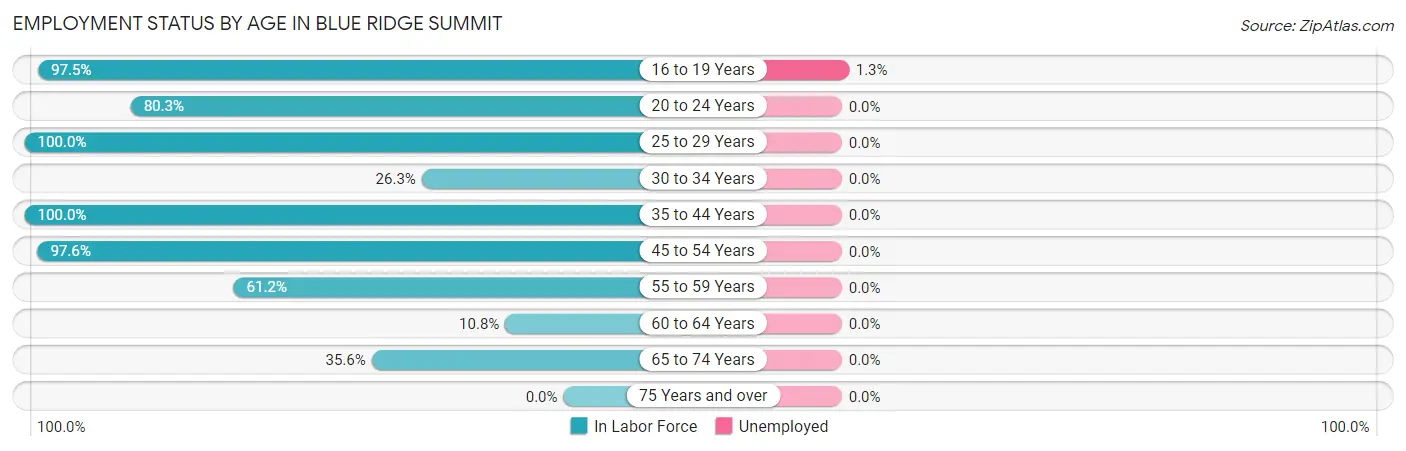
| Age Bracket | In Labor Force | Unemployed |
| 16 to 19 Years | 79 (97.5%) | 1 (1.3%) |
| 20 to 24 Years | 57 (80.3%) | 0 (0.0%) |
| 25 to 29 Years | 37 (100.0%) | 0 (0.0%) |
| 30 to 34 Years | 5 (26.3%) | 0 (0.0%) |
| 35 to 44 Years | 129 (100.0%) | 0 (0.0%) |
| 45 to 54 Years | 82 (97.6%) | 0 (0.0%) |
| 55 to 59 Years | 41 (61.2%) | 0 (0.0%) |
| 60 to 64 Years | 11 (10.8%) | 0 (0.0%) |
| 65 to 74 Years | 62 (35.6%) | 0 (0.0%) |
| 75 Years and over | 0 (0.0%) | 0 (0.0%) |
| Total | 503 (61.9%) | 1 (0.2%) |
Employment Status by Educational Attainment in Blue Ridge Summit
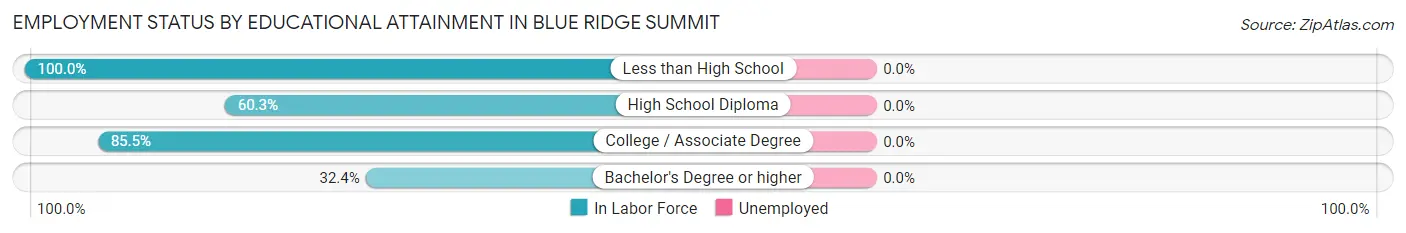
| Educational Attainment | In Labor Force | Unemployed |
| Less than High School | 1 (100.0%) | 0 (0.0%) |
| High School Diploma | 73 (60.3%) | 0 (0.0%) |
| College / Associate Degree | 207 (85.5%) | 0 (0.0%) |
| Bachelor's Degree or higher | 24 (32.4%) | 0 (0.0%) |
| Total | 305 (69.6%) | 0 (0.0%) |
Employment Occupations by Sex in Blue Ridge Summit
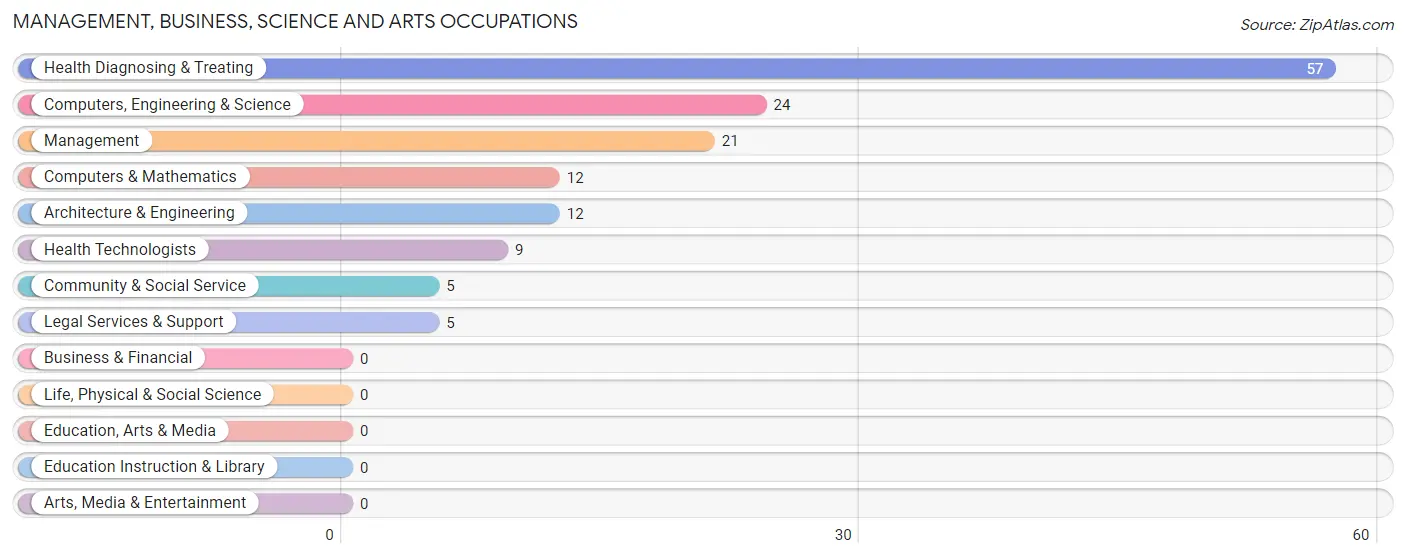
Management, Business, Science and Arts Occupations
The most common Management, Business, Science and Arts occupations in Blue Ridge Summit are Health Diagnosing & Treating (57 | 11.4%), Computers, Engineering & Science (24 | 4.8%), Management (21 | 4.2%), Computers & Mathematics (12 | 2.4%), and Architecture & Engineering (12 | 2.4%).
Management, Business, Science and Arts Occupations by Sex
Within the Management, Business, Science and Arts occupations in Blue Ridge Summit, the most male-oriented occupations are Architecture & Engineering (100.0%), and Computers, Engineering & Science (50.0%), while the most female-oriented occupations are Management (100.0%), Computers & Mathematics (100.0%), and Community & Social Service (100.0%).
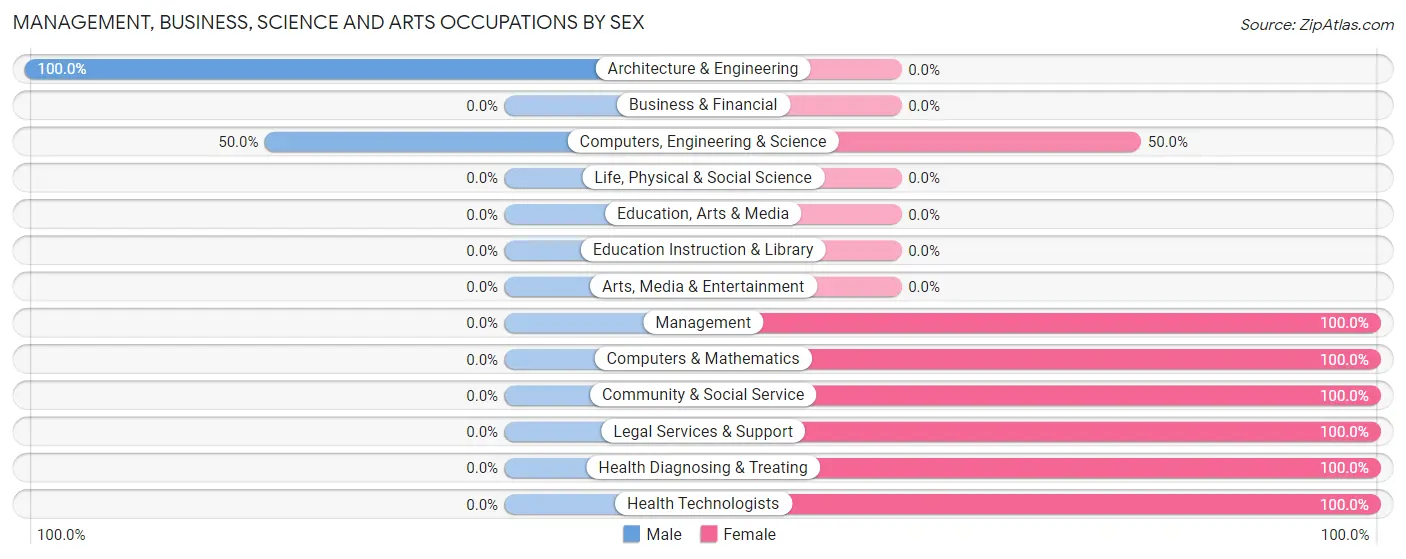
| Occupation | Male | Female |
| Management | 0 (0.0%) | 21 (100.0%) |
| Business & Financial | 0 (0.0%) | 0 (0.0%) |
| Computers, Engineering & Science | 12 (50.0%) | 12 (50.0%) |
| Computers & Mathematics | 0 (0.0%) | 12 (100.0%) |
| Architecture & Engineering | 12 (100.0%) | 0 (0.0%) |
| Life, Physical & Social Science | 0 (0.0%) | 0 (0.0%) |
| Community & Social Service | 0 (0.0%) | 5 (100.0%) |
| Education, Arts & Media | 0 (0.0%) | 0 (0.0%) |
| Legal Services & Support | 0 (0.0%) | 5 (100.0%) |
| Education Instruction & Library | 0 (0.0%) | 0 (0.0%) |
| Arts, Media & Entertainment | 0 (0.0%) | 0 (0.0%) |
| Health Diagnosing & Treating | 0 (0.0%) | 57 (100.0%) |
| Health Technologists | 0 (0.0%) | 9 (100.0%) |
| Total (Category) | 12 (11.2%) | 95 (88.8%) |
| Total (Overall) | 328 (65.3%) | 174 (34.7%) |
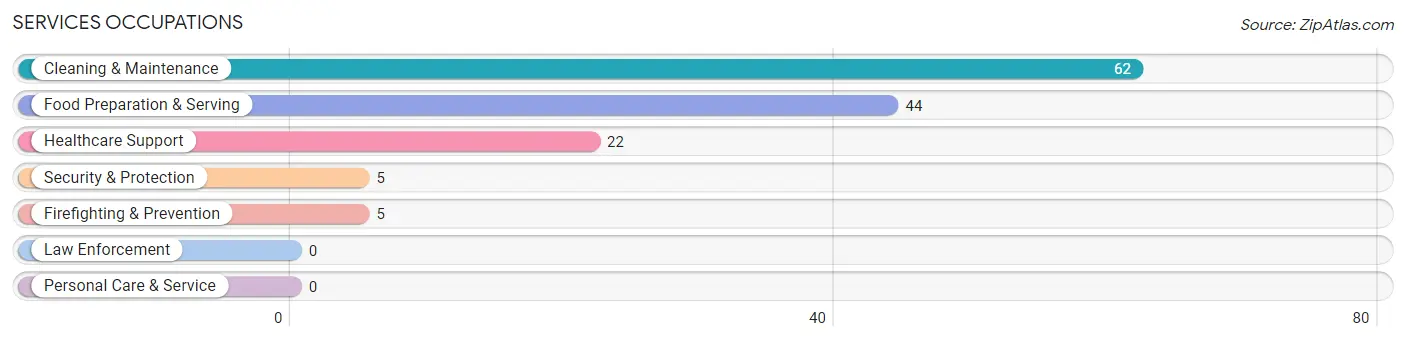
Services Occupations
The most common Services occupations in Blue Ridge Summit are Cleaning & Maintenance (62 | 12.3%), Food Preparation & Serving (44 | 8.8%), Healthcare Support (22 | 4.4%), Security & Protection (5 | 1.0%), and Firefighting & Prevention (5 | 1.0%).
Services Occupations by Sex
Within the Services occupations in Blue Ridge Summit, the most male-oriented occupations are Security & Protection (100.0%), Firefighting & Prevention (100.0%), and Cleaning & Maintenance (91.9%), while the most female-oriented occupations are Healthcare Support (100.0%), Food Preparation & Serving (77.3%), and Cleaning & Maintenance (8.1%).
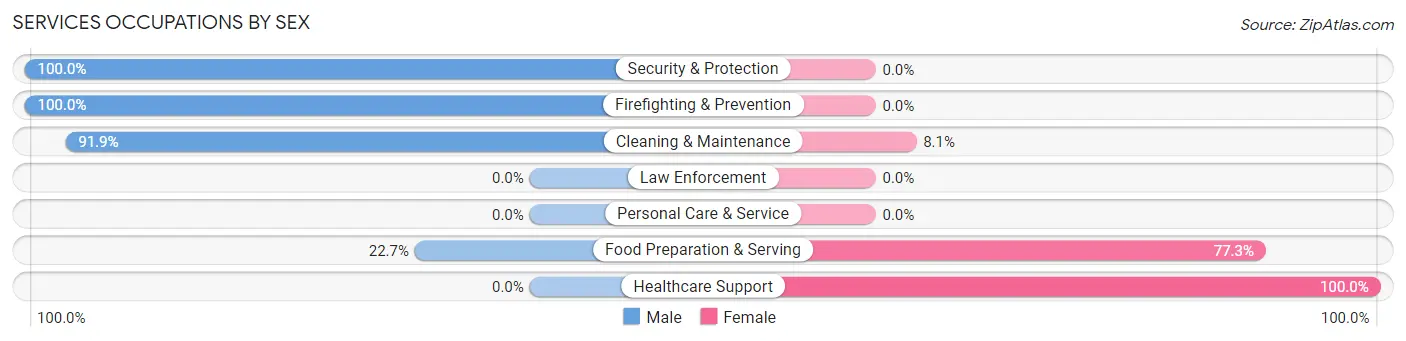
| Occupation | Male | Female |
| Healthcare Support | 0 (0.0%) | 22 (100.0%) |
| Security & Protection | 5 (100.0%) | 0 (0.0%) |
| Firefighting & Prevention | 5 (100.0%) | 0 (0.0%) |
| Law Enforcement | 0 (0.0%) | 0 (0.0%) |
| Food Preparation & Serving | 10 (22.7%) | 34 (77.3%) |
| Cleaning & Maintenance | 57 (91.9%) | 5 (8.1%) |
| Personal Care & Service | 0 (0.0%) | 0 (0.0%) |
| Total (Category) | 72 (54.1%) | 61 (45.9%) |
| Total (Overall) | 328 (65.3%) | 174 (34.7%) |
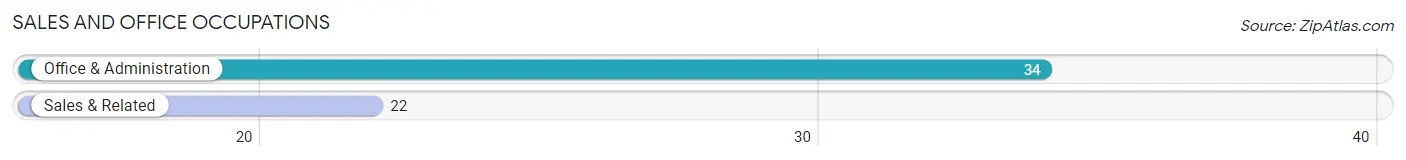
Sales and Office Occupations
The most common Sales and Office occupations in Blue Ridge Summit are Office & Administration (34 | 6.8%), and Sales & Related (22 | 4.4%).
Sales and Office Occupations by Sex
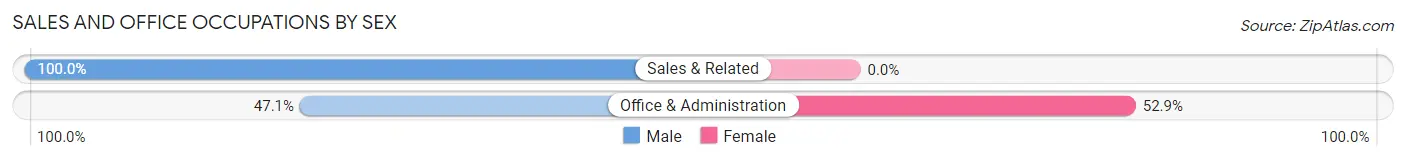
| Occupation | Male | Female |
| Sales & Related | 22 (100.0%) | 0 (0.0%) |
| Office & Administration | 16 (47.1%) | 18 (52.9%) |
| Total (Category) | 38 (67.9%) | 18 (32.1%) |
| Total (Overall) | 328 (65.3%) | 174 (34.7%) |
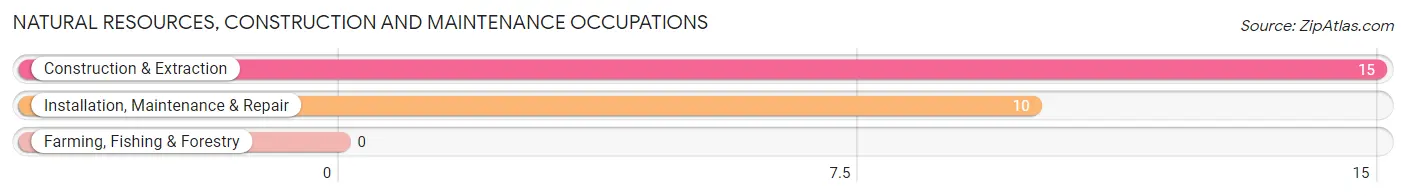
Natural Resources, Construction and Maintenance Occupations
The most common Natural Resources, Construction and Maintenance occupations in Blue Ridge Summit are Construction & Extraction (15 | 3.0%), and Installation, Maintenance & Repair (10 | 2.0%).
Natural Resources, Construction and Maintenance Occupations by Sex
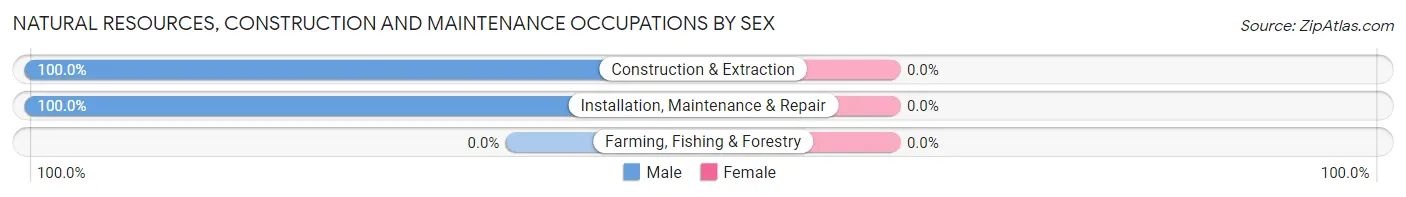
| Occupation | Male | Female |
| Farming, Fishing & Forestry | 0 (0.0%) | 0 (0.0%) |
| Construction & Extraction | 15 (100.0%) | 0 (0.0%) |
| Installation, Maintenance & Repair | 10 (100.0%) | 0 (0.0%) |
| Total (Category) | 25 (100.0%) | 0 (0.0%) |
| Total (Overall) | 328 (65.3%) | 174 (34.7%) |
Production, Transportation and Moving Occupations
The most common Production, Transportation and Moving occupations in Blue Ridge Summit are Material Moving (121 | 24.1%), Production (50 | 10.0%), and Transportation (10 | 2.0%).
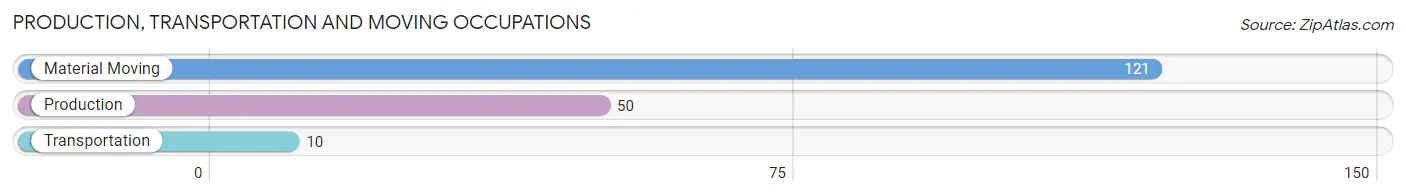
Production, Transportation and Moving Occupations by Sex
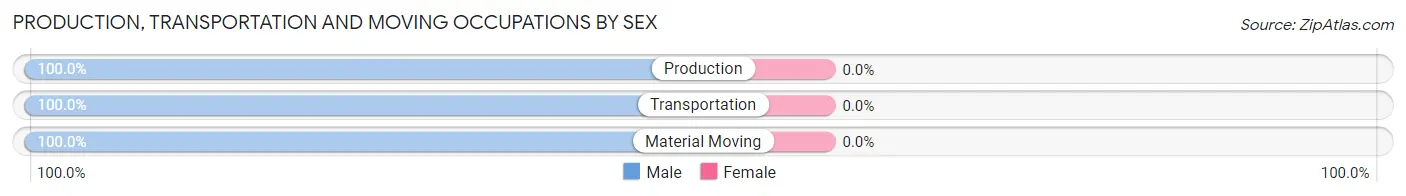
| Occupation | Male | Female |
| Production | 50 (100.0%) | 0 (0.0%) |
| Transportation | 10 (100.0%) | 0 (0.0%) |
| Material Moving | 121 (100.0%) | 0 (0.0%) |
| Total (Category) | 181 (100.0%) | 0 (0.0%) |
| Total (Overall) | 328 (65.3%) | 174 (34.7%) |
Employment Industries by Sex in Blue Ridge Summit
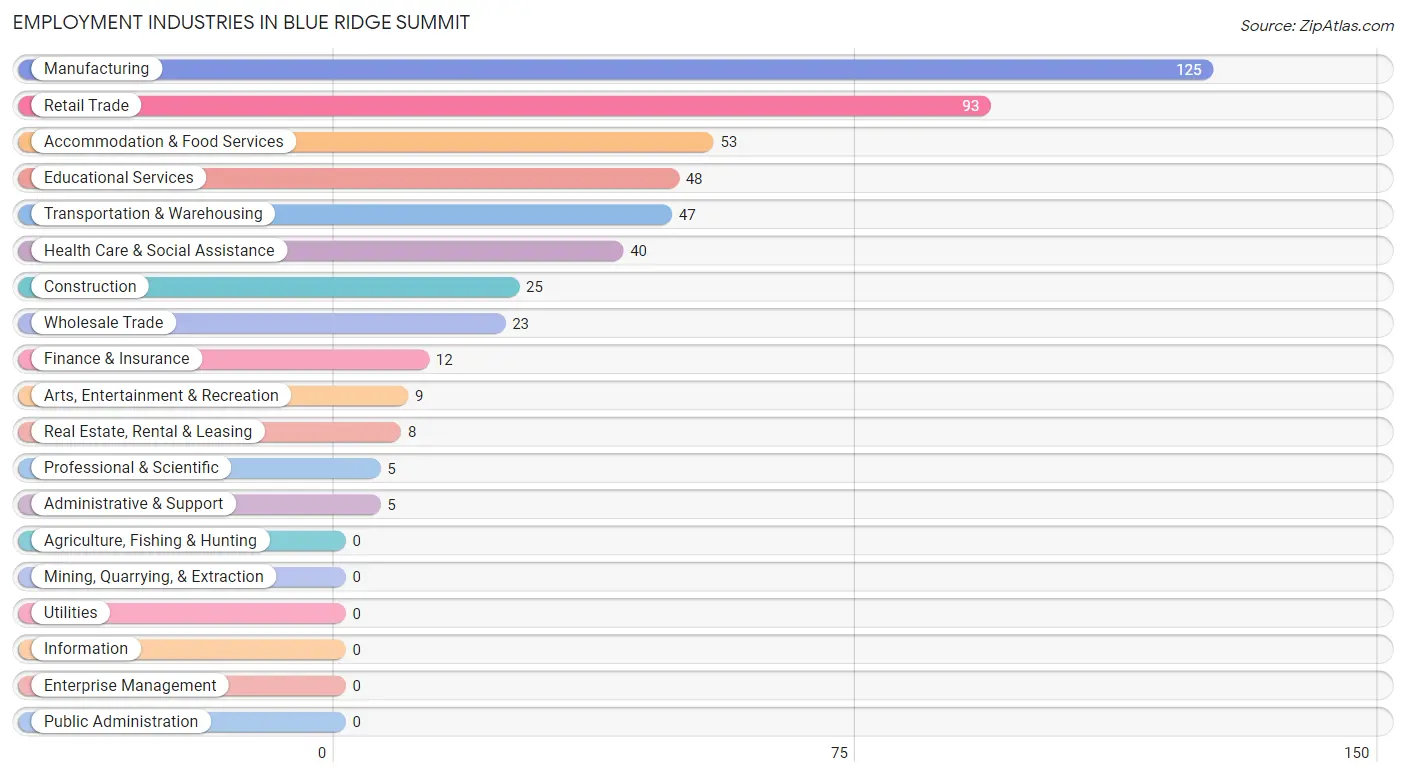
Employment Industries in Blue Ridge Summit
The major employment industries in Blue Ridge Summit include Manufacturing (125 | 24.9%), Retail Trade (93 | 18.5%), Accommodation & Food Services (53 | 10.6%), Educational Services (48 | 9.6%), and Transportation & Warehousing (47 | 9.4%).
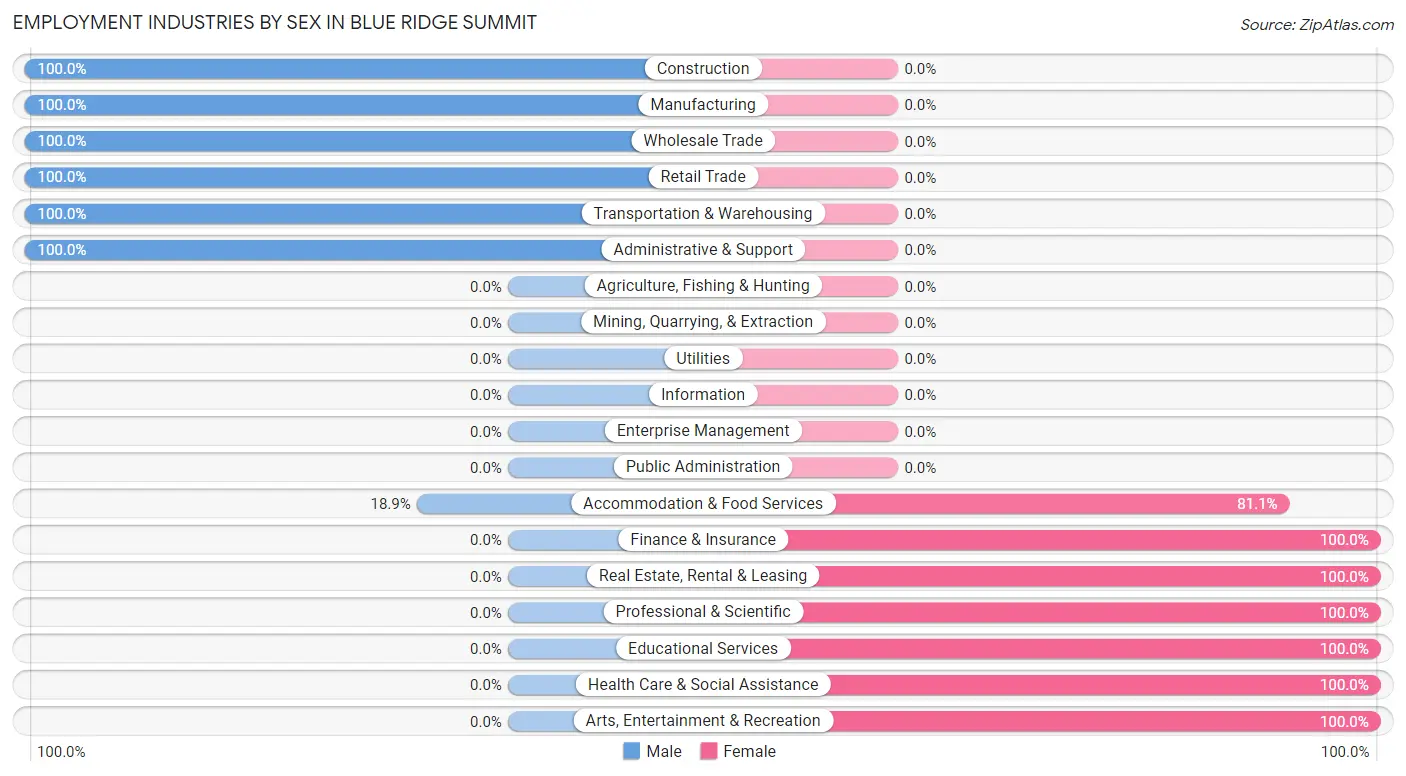
Employment Industries by Sex in Blue Ridge Summit
The Blue Ridge Summit industries that see more men than women are Construction (100.0%), Manufacturing (100.0%), and Wholesale Trade (100.0%), whereas the industries that tend to have a higher number of women are Finance & Insurance (100.0%), Real Estate, Rental & Leasing (100.0%), and Professional & Scientific (100.0%).
| Industry | Male | Female |
| Agriculture, Fishing & Hunting | 0 (0.0%) | 0 (0.0%) |
| Mining, Quarrying, & Extraction | 0 (0.0%) | 0 (0.0%) |
| Construction | 25 (100.0%) | 0 (0.0%) |
| Manufacturing | 125 (100.0%) | 0 (0.0%) |
| Wholesale Trade | 23 (100.0%) | 0 (0.0%) |
| Retail Trade | 93 (100.0%) | 0 (0.0%) |
| Transportation & Warehousing | 47 (100.0%) | 0 (0.0%) |
| Utilities | 0 (0.0%) | 0 (0.0%) |
| Information | 0 (0.0%) | 0 (0.0%) |
| Finance & Insurance | 0 (0.0%) | 12 (100.0%) |
| Real Estate, Rental & Leasing | 0 (0.0%) | 8 (100.0%) |
| Professional & Scientific | 0 (0.0%) | 5 (100.0%) |
| Enterprise Management | 0 (0.0%) | 0 (0.0%) |
| Administrative & Support | 5 (100.0%) | 0 (0.0%) |
| Educational Services | 0 (0.0%) | 48 (100.0%) |
| Health Care & Social Assistance | 0 (0.0%) | 40 (100.0%) |
| Arts, Entertainment & Recreation | 0 (0.0%) | 9 (100.0%) |
| Accommodation & Food Services | 10 (18.9%) | 43 (81.1%) |
| Public Administration | 0 (0.0%) | 0 (0.0%) |
| Total | 328 (65.3%) | 174 (34.7%) |
Education in Blue Ridge Summit
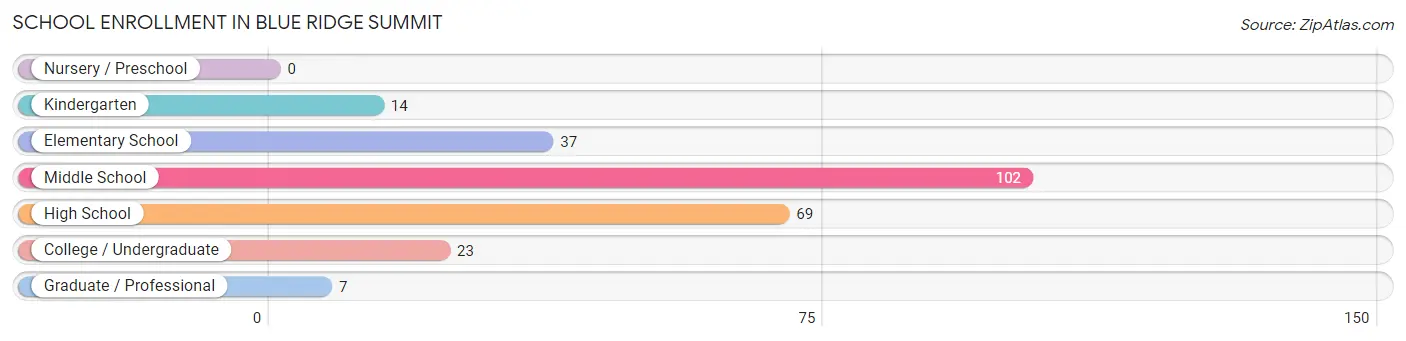
School Enrollment in Blue Ridge Summit
The most common levels of schooling among the 252 students in Blue Ridge Summit are middle school (102 | 40.5%), high school (69 | 27.4%), and elementary school (37 | 14.7%).
| School Level | # Students | % Students |
| Nursery / Preschool | 0 | 0.0% |
| Kindergarten | 14 | 5.6% |
| Elementary School | 37 | 14.7% |
| Middle School | 102 | 40.5% |
| High School | 69 | 27.4% |
| College / Undergraduate | 23 | 9.1% |
| Graduate / Professional | 7 | 2.8% |
| Total | 252 | 100.0% |
School Enrollment by Age by Funding Source in Blue Ridge Summit
Out of a total of 252 students who are enrolled in schools in Blue Ridge Summit, 17 (6.7%) attend a private institution, while the remaining 235 (93.3%) are enrolled in public schools. The age group of 20 to 24 year olds has the highest likelihood of being enrolled in private schools, with 3 (100.0% in the age bracket) enrolled. Conversely, the age group of 10 to 14 year olds has the lowest likelihood of being enrolled in a private school, with 115 (98.3% in the age bracket) attending a public institution.
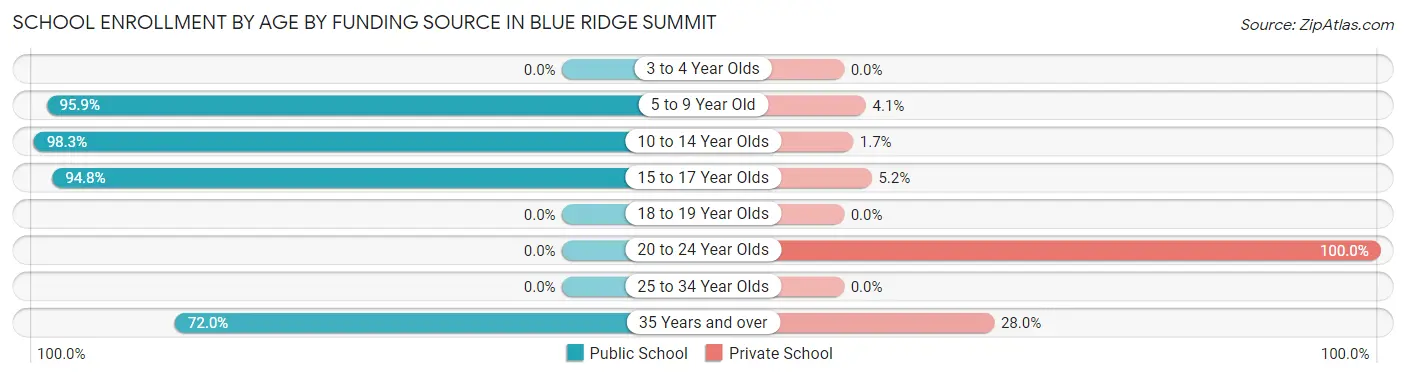
| Age Bracket | Public School | Private School |
| 3 to 4 Year Olds | 0 (0.0%) | 0 (0.0%) |
| 5 to 9 Year Old | 47 (95.9%) | 2 (4.1%) |
| 10 to 14 Year Olds | 115 (98.3%) | 2 (1.7%) |
| 15 to 17 Year Olds | 55 (94.8%) | 3 (5.2%) |
| 18 to 19 Year Olds | 0 (0.0%) | 0 (0.0%) |
| 20 to 24 Year Olds | 0 (0.0%) | 3 (100.0%) |
| 25 to 34 Year Olds | 0 (0.0%) | 0 (0.0%) |
| 35 Years and over | 18 (72.0%) | 7 (28.0%) |
| Total | 235 (93.3%) | 17 (6.7%) |
Educational Attainment by Field of Study in Blue Ridge Summit
Psychology (53 | 52.0%), education (35 | 34.3%), arts & humanities (8 | 7.8%), and bio, nature & agricultural (6 | 5.9%) are the most common fields of study among 102 individuals in Blue Ridge Summit who have obtained a bachelor's degree or higher.
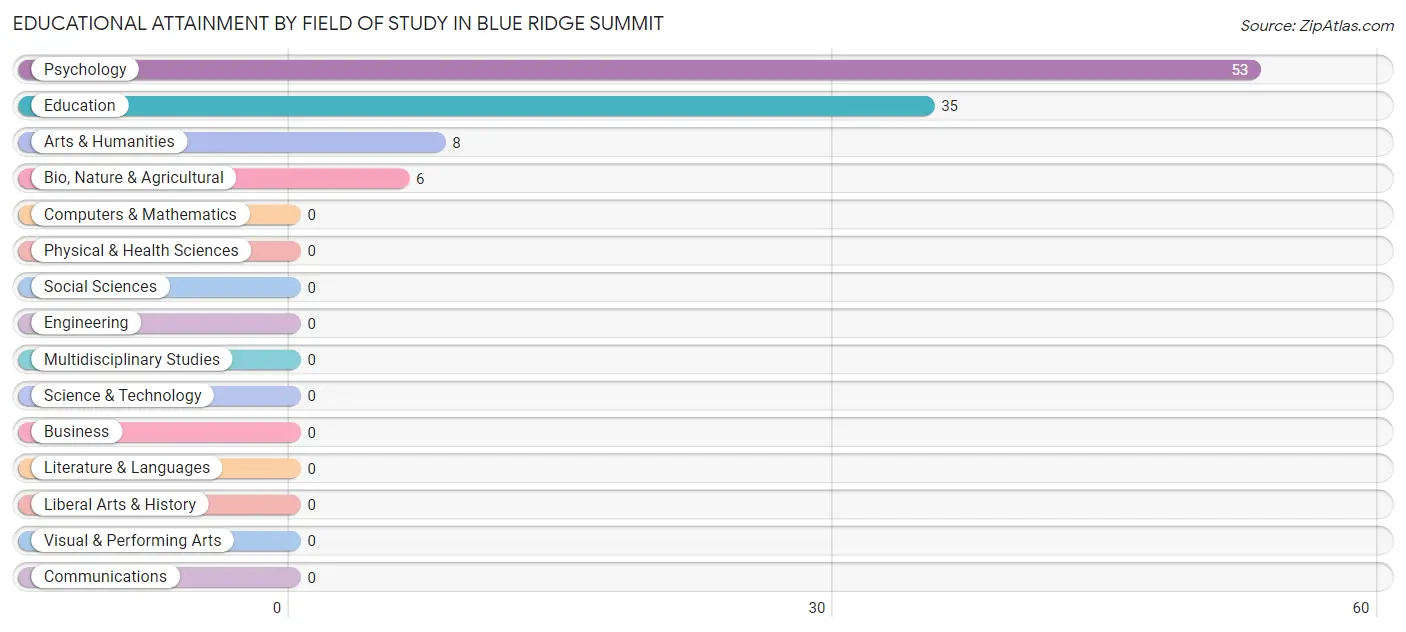
| Field of Study | # Graduates | % Graduates |
| Computers & Mathematics | 0 | 0.0% |
| Bio, Nature & Agricultural | 6 | 5.9% |
| Physical & Health Sciences | 0 | 0.0% |
| Psychology | 53 | 52.0% |
| Social Sciences | 0 | 0.0% |
| Engineering | 0 | 0.0% |
| Multidisciplinary Studies | 0 | 0.0% |
| Science & Technology | 0 | 0.0% |
| Business | 0 | 0.0% |
| Education | 35 | 34.3% |
| Literature & Languages | 0 | 0.0% |
| Liberal Arts & History | 0 | 0.0% |
| Visual & Performing Arts | 0 | 0.0% |
| Communications | 0 | 0.0% |
| Arts & Humanities | 8 | 7.8% |
| Total | 102 | 100.0% |
Transportation & Commute in Blue Ridge Summit
Vehicle Availability by Sex in Blue Ridge Summit
The most prevalent vehicle ownership categories in Blue Ridge Summit are males with 1 vehicle (167, accounting for 61.6%) and females with 1 vehicle (58, making up 101.2%).
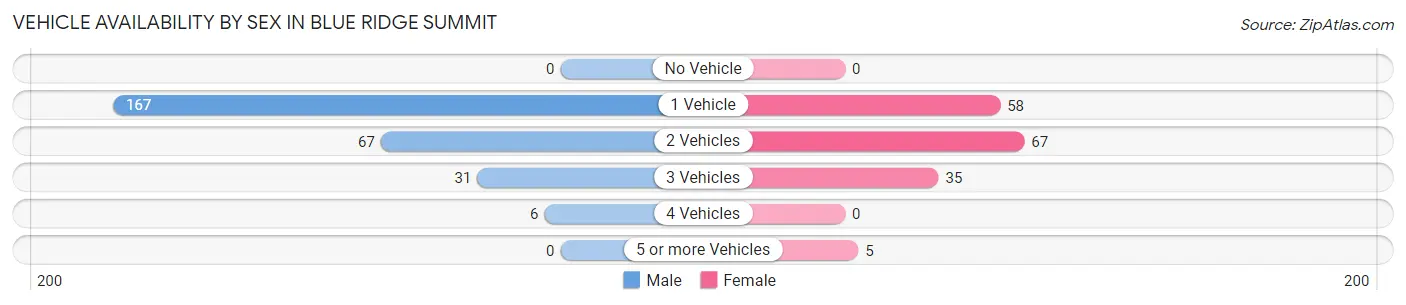
| Vehicles Available | Male | Female |
| No Vehicle | 0 (0.0%) | 0 (0.0%) |
| 1 Vehicle | 167 (61.6%) | 58 (35.1%) |
| 2 Vehicles | 67 (24.7%) | 67 (40.6%) |
| 3 Vehicles | 31 (11.4%) | 35 (21.2%) |
| 4 Vehicles | 6 (2.2%) | 0 (0.0%) |
| 5 or more Vehicles | 0 (0.0%) | 5 (3.0%) |
| Total | 271 (100.0%) | 165 (100.0%) |
Commute Time in Blue Ridge Summit
The most frequently occuring commute durations in Blue Ridge Summit are 10 to 14 minutes (93 commuters, 27.8%), 5 to 9 minutes (74 commuters, 22.1%), and 60 to 89 minutes (42 commuters, 12.5%).
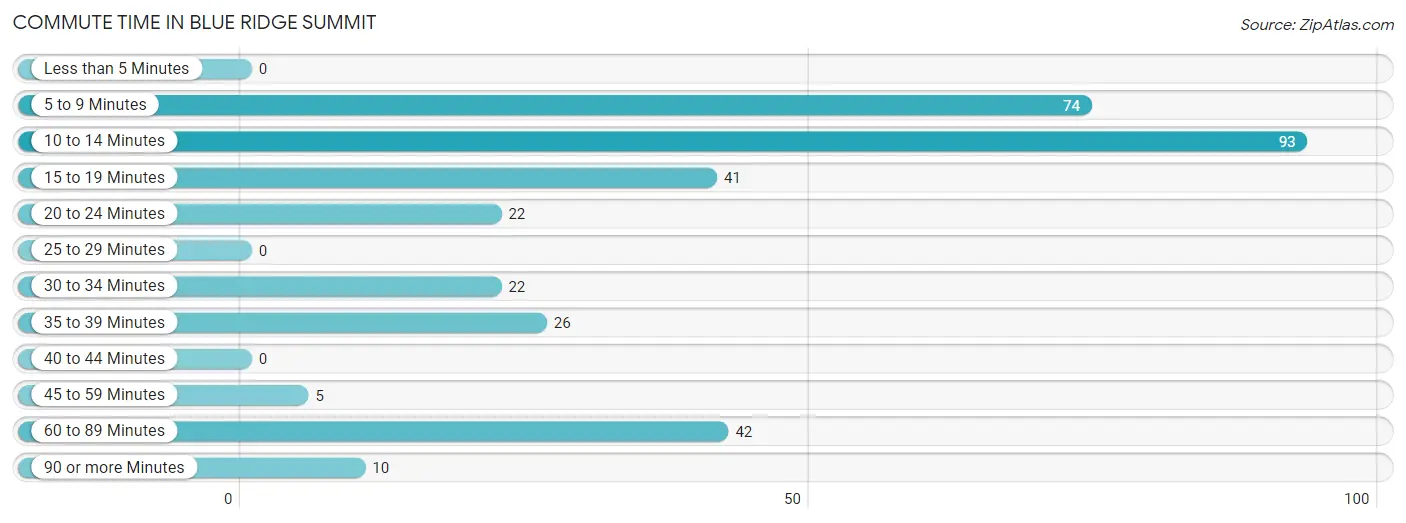
| Commute Time | # Commuters | % Commuters |
| Less than 5 Minutes | 0 | 0.0% |
| 5 to 9 Minutes | 74 | 22.1% |
| 10 to 14 Minutes | 93 | 27.8% |
| 15 to 19 Minutes | 41 | 12.2% |
| 20 to 24 Minutes | 22 | 6.6% |
| 25 to 29 Minutes | 0 | 0.0% |
| 30 to 34 Minutes | 22 | 6.6% |
| 35 to 39 Minutes | 26 | 7.8% |
| 40 to 44 Minutes | 0 | 0.0% |
| 45 to 59 Minutes | 5 | 1.5% |
| 60 to 89 Minutes | 42 | 12.5% |
| 90 or more Minutes | 10 | 3.0% |
Commute Time by Sex in Blue Ridge Summit
The most common commute times in Blue Ridge Summit are 10 to 14 minutes (93 commuters, 39.4%) for males and 5 to 9 minutes (27 commuters, 27.3%) for females.
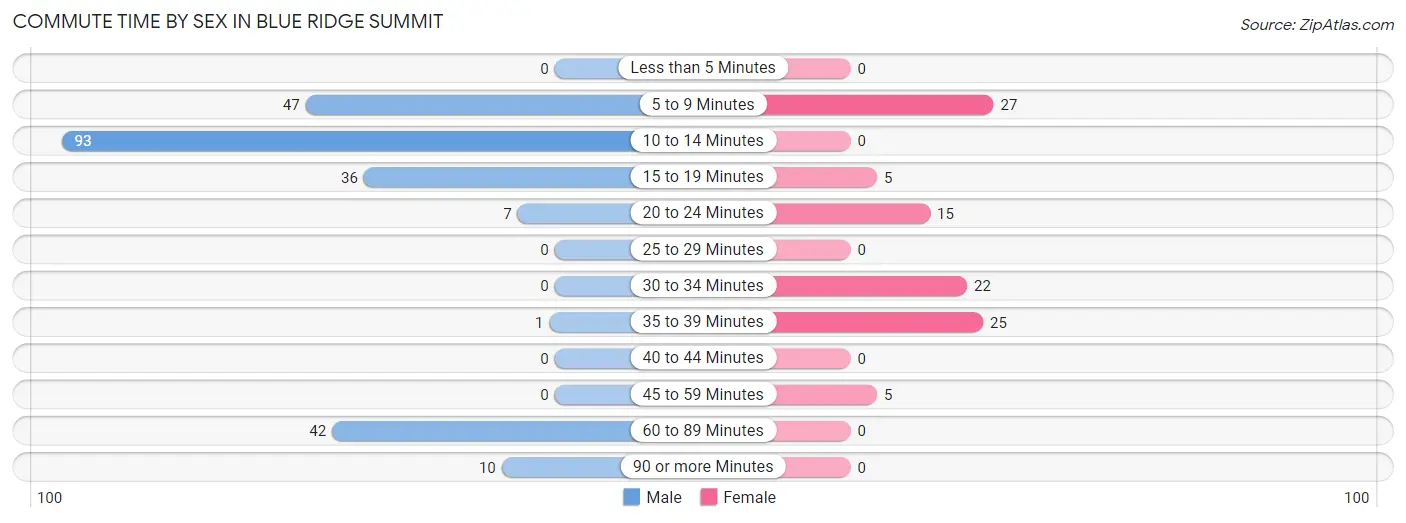
| Commute Time | Male | Female |
| Less than 5 Minutes | 0 (0.0%) | 0 (0.0%) |
| 5 to 9 Minutes | 47 (19.9%) | 27 (27.3%) |
| 10 to 14 Minutes | 93 (39.4%) | 0 (0.0%) |
| 15 to 19 Minutes | 36 (15.2%) | 5 (5.1%) |
| 20 to 24 Minutes | 7 (3.0%) | 15 (15.1%) |
| 25 to 29 Minutes | 0 (0.0%) | 0 (0.0%) |
| 30 to 34 Minutes | 0 (0.0%) | 22 (22.2%) |
| 35 to 39 Minutes | 1 (0.4%) | 25 (25.3%) |
| 40 to 44 Minutes | 0 (0.0%) | 0 (0.0%) |
| 45 to 59 Minutes | 0 (0.0%) | 5 (5.1%) |
| 60 to 89 Minutes | 42 (17.8%) | 0 (0.0%) |
| 90 or more Minutes | 10 (4.2%) | 0 (0.0%) |
Time of Departure to Work by Sex in Blue Ridge Summit
The most frequent times of departure to work in Blue Ridge Summit are 8:00 AM to 8:29 AM (68, 28.8%) for males and 12:00 PM to 3:59 PM (34, 34.3%) for females.
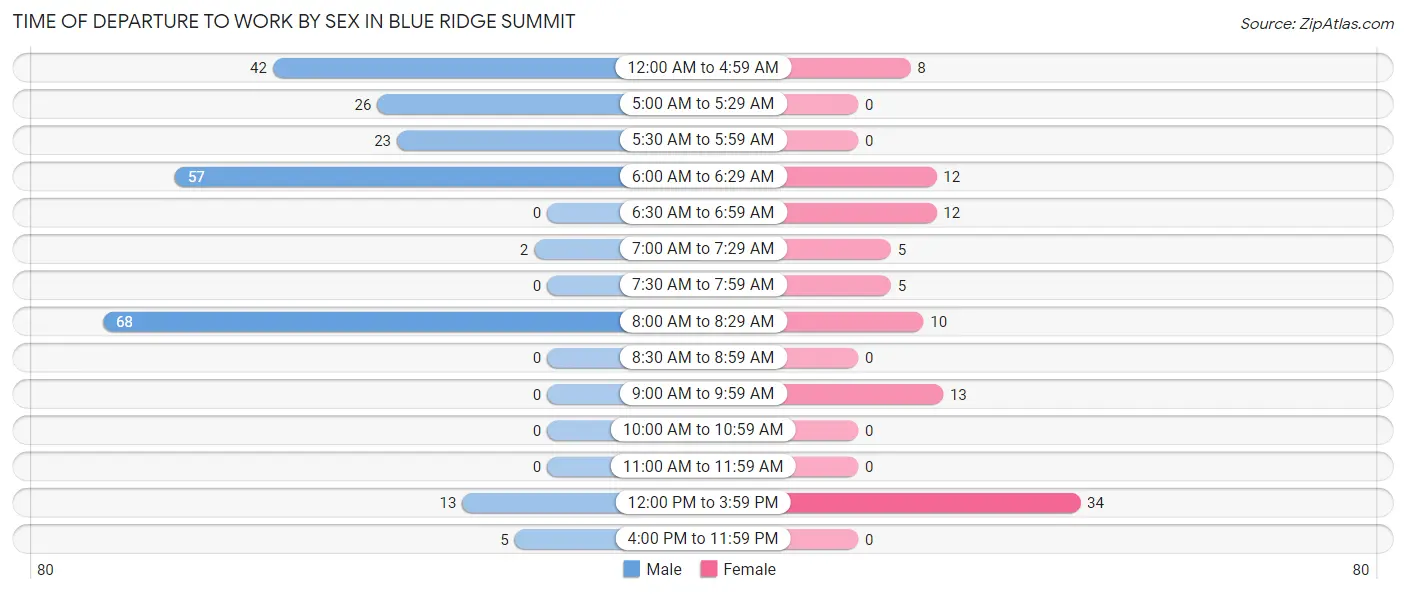
| Time of Departure | Male | Female |
| 12:00 AM to 4:59 AM | 42 (17.8%) | 8 (8.1%) |
| 5:00 AM to 5:29 AM | 26 (11.0%) | 0 (0.0%) |
| 5:30 AM to 5:59 AM | 23 (9.8%) | 0 (0.0%) |
| 6:00 AM to 6:29 AM | 57 (24.1%) | 12 (12.1%) |
| 6:30 AM to 6:59 AM | 0 (0.0%) | 12 (12.1%) |
| 7:00 AM to 7:29 AM | 2 (0.9%) | 5 (5.1%) |
| 7:30 AM to 7:59 AM | 0 (0.0%) | 5 (5.1%) |
| 8:00 AM to 8:29 AM | 68 (28.8%) | 10 (10.1%) |
| 8:30 AM to 8:59 AM | 0 (0.0%) | 0 (0.0%) |
| 9:00 AM to 9:59 AM | 0 (0.0%) | 13 (13.1%) |
| 10:00 AM to 10:59 AM | 0 (0.0%) | 0 (0.0%) |
| 11:00 AM to 11:59 AM | 0 (0.0%) | 0 (0.0%) |
| 12:00 PM to 3:59 PM | 13 (5.5%) | 34 (34.3%) |
| 4:00 PM to 11:59 PM | 5 (2.1%) | 0 (0.0%) |
| Total | 236 (100.0%) | 99 (100.0%) |
Housing Occupancy in Blue Ridge Summit
Occupancy by Ownership in Blue Ridge Summit
Of the total 512 dwellings in Blue Ridge Summit, owner-occupied units account for 192 (37.5%), while renter-occupied units make up 320 (62.5%).
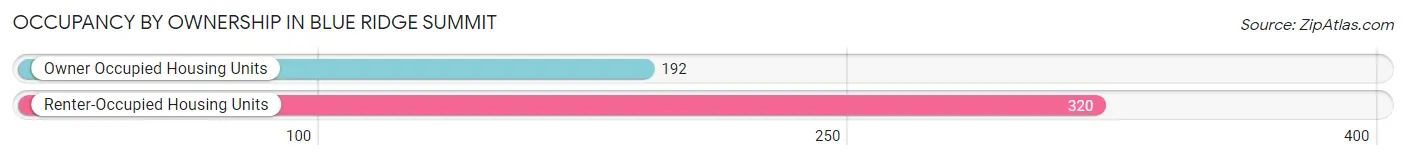
| Occupancy | # Housing Units | % Housing Units |
| Owner Occupied Housing Units | 192 | 37.5% |
| Renter-Occupied Housing Units | 320 | 62.5% |
| Total Occupied Housing Units | 512 | 100.0% |
Occupancy by Household Size in Blue Ridge Summit
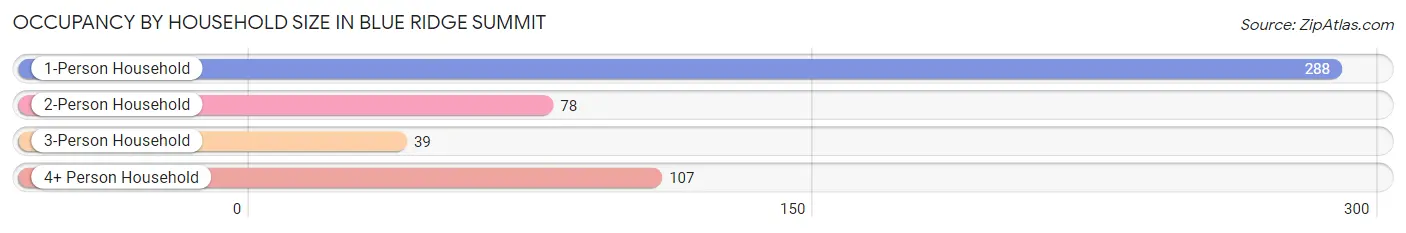
| Household Size | # Housing Units | % Housing Units |
| 1-Person Household | 288 | 56.2% |
| 2-Person Household | 78 | 15.2% |
| 3-Person Household | 39 | 7.6% |
| 4+ Person Household | 107 | 20.9% |
| Total Housing Units | 512 | 100.0% |
Occupancy by Ownership by Household Size in Blue Ridge Summit
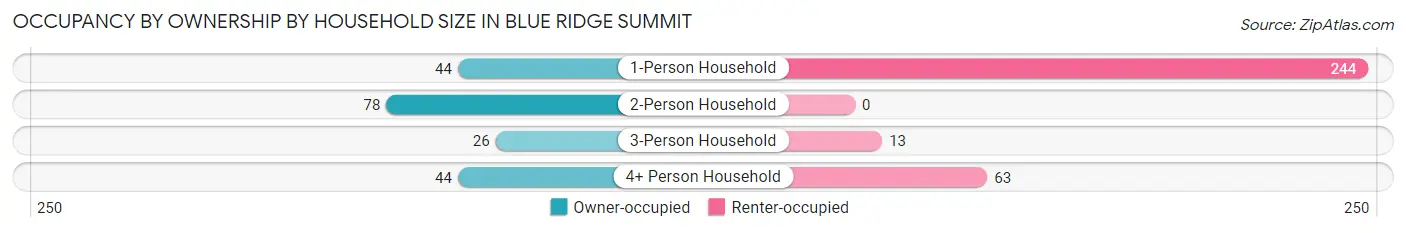
| Household Size | Owner-occupied | Renter-occupied |
| 1-Person Household | 44 (15.3%) | 244 (84.7%) |
| 2-Person Household | 78 (100.0%) | 0 (0.0%) |
| 3-Person Household | 26 (66.7%) | 13 (33.3%) |
| 4+ Person Household | 44 (41.1%) | 63 (58.9%) |
| Total Housing Units | 192 (37.5%) | 320 (62.5%) |
Occupancy by Educational Attainment in Blue Ridge Summit
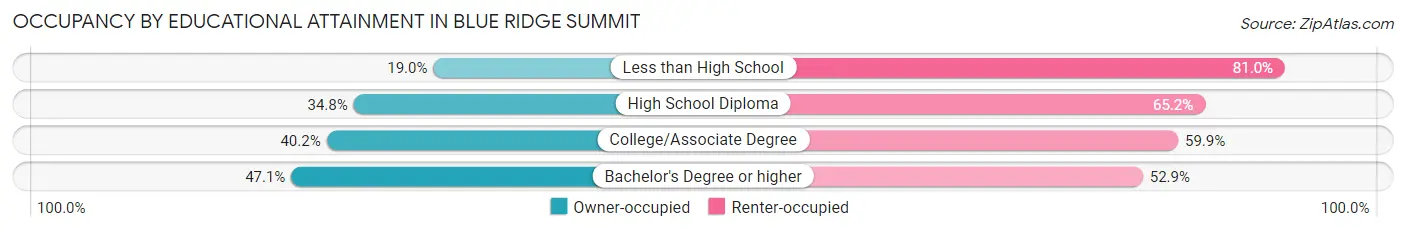
| Household Size | Owner-occupied | Renter-occupied |
| Less than High School | 11 (19.0%) | 47 (81.0%) |
| High School Diploma | 40 (34.8%) | 75 (65.2%) |
| College/Associate Degree | 108 (40.2%) | 161 (59.9%) |
| Bachelor's Degree or higher | 33 (47.1%) | 37 (52.9%) |
Occupancy by Age of Householder in Blue Ridge Summit
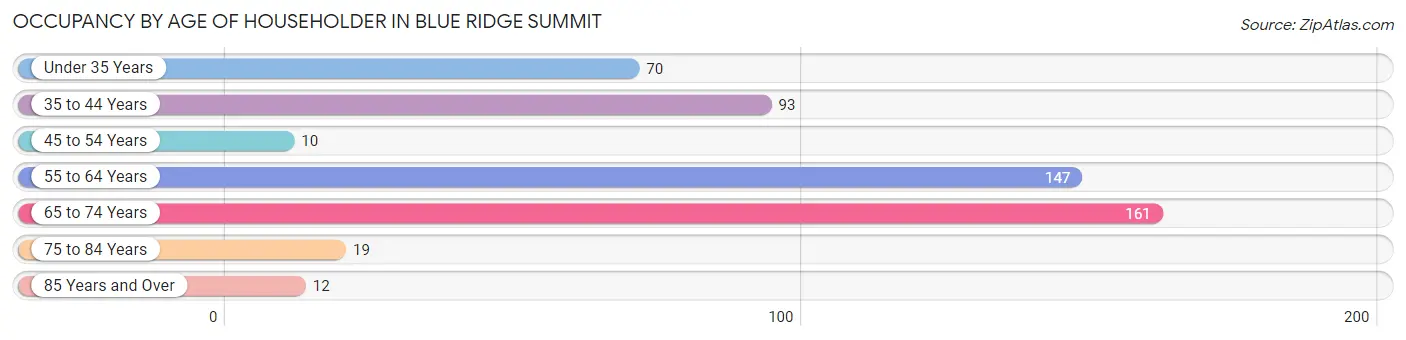
| Age Bracket | # Households | % Households |
| Under 35 Years | 70 | 13.7% |
| 35 to 44 Years | 93 | 18.2% |
| 45 to 54 Years | 10 | 1.9% |
| 55 to 64 Years | 147 | 28.7% |
| 65 to 74 Years | 161 | 31.5% |
| 75 to 84 Years | 19 | 3.7% |
| 85 Years and Over | 12 | 2.3% |
| Total | 512 | 100.0% |
Housing Finances in Blue Ridge Summit
Median Income by Occupancy in Blue Ridge Summit
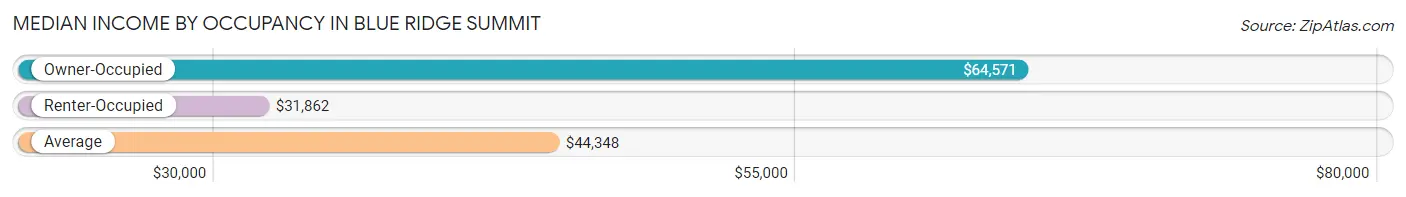
| Occupancy Type | # Households | Median Income |
| Owner-Occupied | 192 (37.5%) | $64,571 |
| Renter-Occupied | 320 (62.5%) | $31,862 |
| Average | 512 (100.0%) | $44,348 |
Occupancy by Householder Income Bracket in Blue Ridge Summit
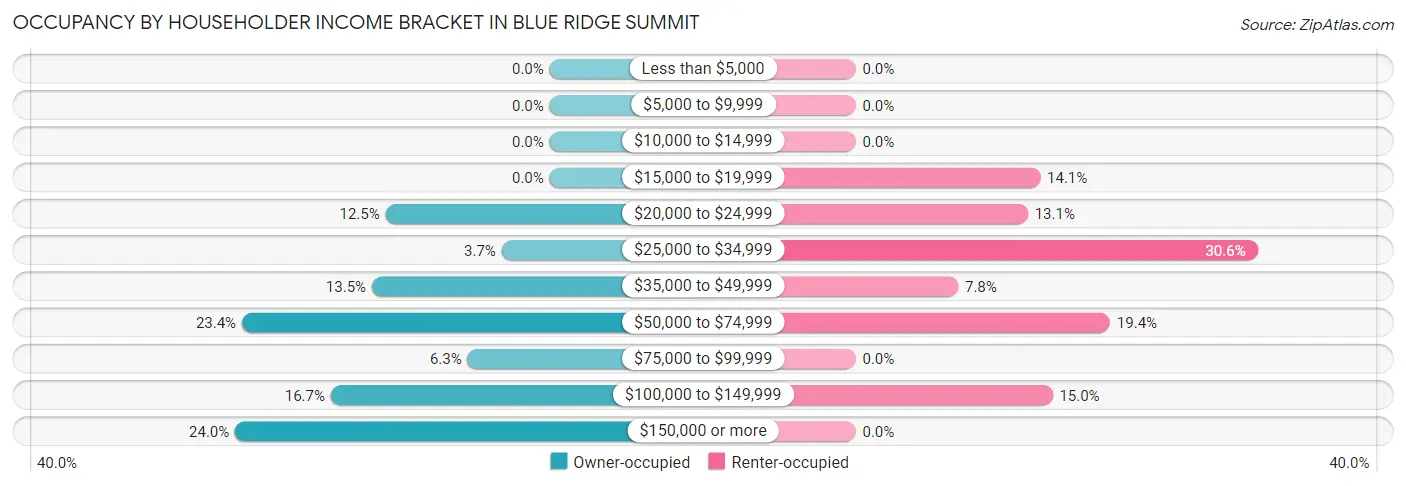
| Income Bracket | Owner-occupied | Renter-occupied |
| Less than $5,000 | 0 (0.0%) | 0 (0.0%) |
| $5,000 to $9,999 | 0 (0.0%) | 0 (0.0%) |
| $10,000 to $14,999 | 0 (0.0%) | 0 (0.0%) |
| $15,000 to $19,999 | 0 (0.0%) | 45 (14.1%) |
| $20,000 to $24,999 | 24 (12.5%) | 42 (13.1%) |
| $25,000 to $34,999 | 7 (3.6%) | 98 (30.6%) |
| $35,000 to $49,999 | 26 (13.5%) | 25 (7.8%) |
| $50,000 to $74,999 | 45 (23.4%) | 62 (19.4%) |
| $75,000 to $99,999 | 12 (6.2%) | 0 (0.0%) |
| $100,000 to $149,999 | 32 (16.7%) | 48 (15.0%) |
| $150,000 or more | 46 (24.0%) | 0 (0.0%) |
| Total | 192 (100.0%) | 320 (100.0%) |
Monthly Housing Cost Tiers in Blue Ridge Summit
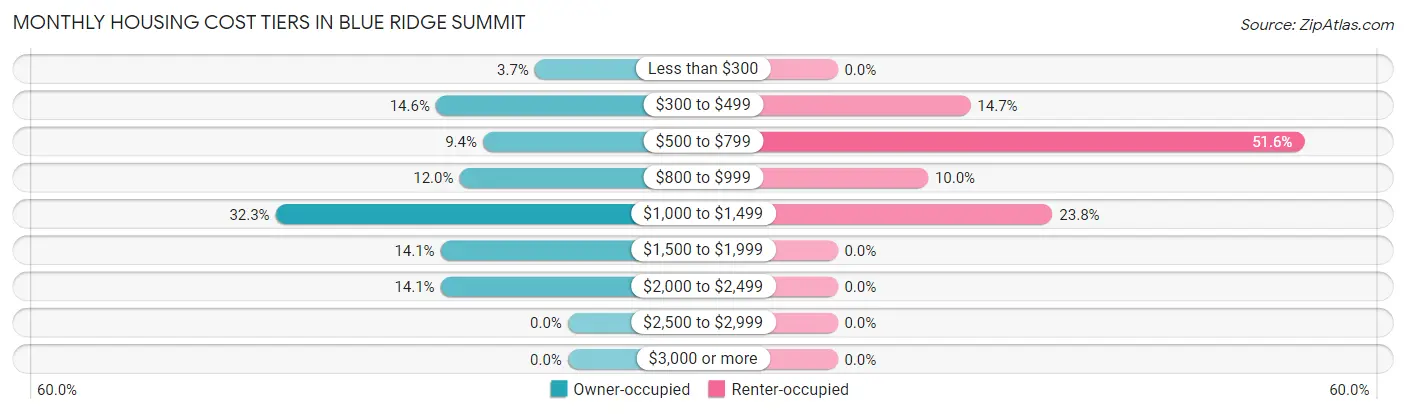
| Monthly Cost | Owner-occupied | Renter-occupied |
| Less than $300 | 7 (3.6%) | 0 (0.0%) |
| $300 to $499 | 28 (14.6%) | 47 (14.7%) |
| $500 to $799 | 18 (9.4%) | 165 (51.6%) |
| $800 to $999 | 23 (12.0%) | 32 (10.0%) |
| $1,000 to $1,499 | 62 (32.3%) | 76 (23.7%) |
| $1,500 to $1,999 | 27 (14.1%) | 0 (0.0%) |
| $2,000 to $2,499 | 27 (14.1%) | 0 (0.0%) |
| $2,500 to $2,999 | 0 (0.0%) | 0 (0.0%) |
| $3,000 or more | 0 (0.0%) | 0 (0.0%) |
| Total | 192 (100.0%) | 320 (100.0%) |
Physical Housing Characteristics in Blue Ridge Summit
Housing Structures in Blue Ridge Summit
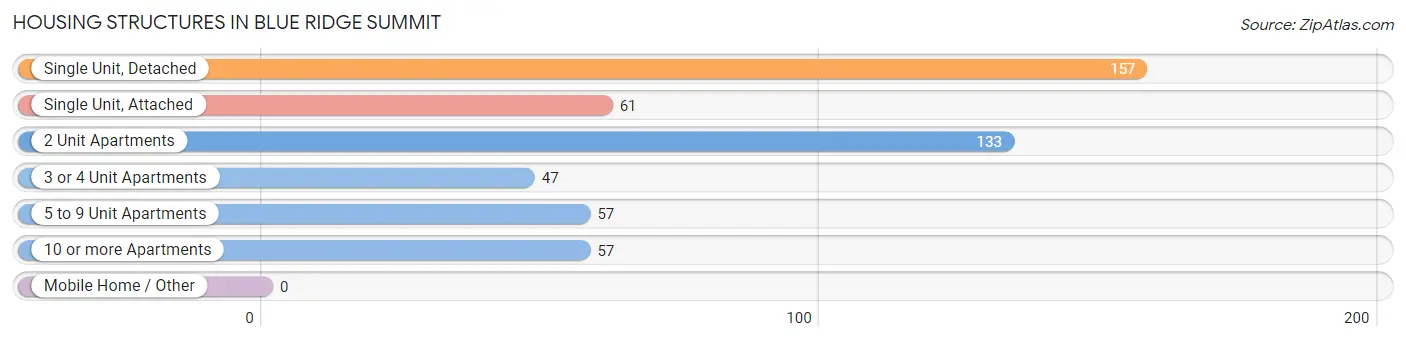
| Structure Type | # Housing Units | % Housing Units |
| Single Unit, Detached | 157 | 30.7% |
| Single Unit, Attached | 61 | 11.9% |
| 2 Unit Apartments | 133 | 26.0% |
| 3 or 4 Unit Apartments | 47 | 9.2% |
| 5 to 9 Unit Apartments | 57 | 11.1% |
| 10 or more Apartments | 57 | 11.1% |
| Mobile Home / Other | 0 | 0.0% |
| Total | 512 | 100.0% |
Housing Structures by Occupancy in Blue Ridge Summit
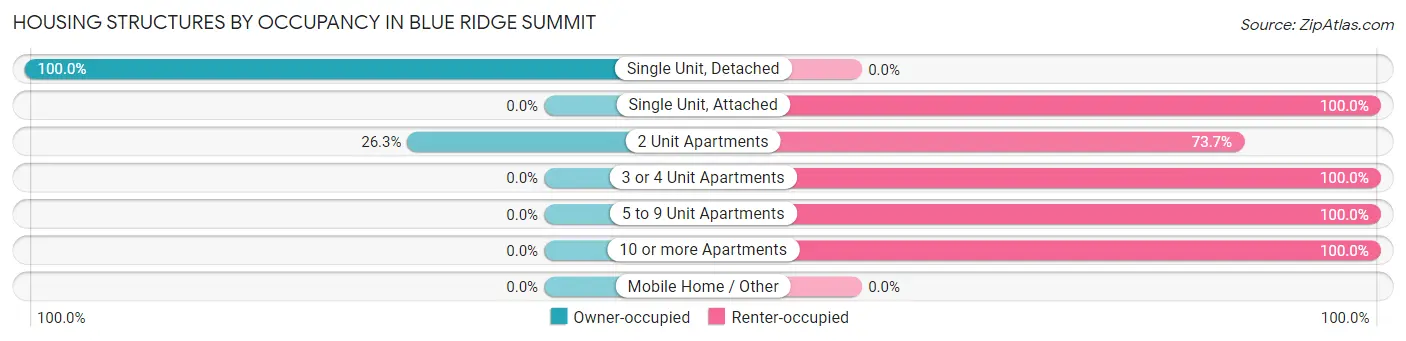
| Structure Type | Owner-occupied | Renter-occupied |
| Single Unit, Detached | 157 (100.0%) | 0 (0.0%) |
| Single Unit, Attached | 0 (0.0%) | 61 (100.0%) |
| 2 Unit Apartments | 35 (26.3%) | 98 (73.7%) |
| 3 or 4 Unit Apartments | 0 (0.0%) | 47 (100.0%) |
| 5 to 9 Unit Apartments | 0 (0.0%) | 57 (100.0%) |
| 10 or more Apartments | 0 (0.0%) | 57 (100.0%) |
| Mobile Home / Other | 0 (0.0%) | 0 (0.0%) |
| Total | 192 (37.5%) | 320 (62.5%) |
Housing Structures by Number of Rooms in Blue Ridge Summit
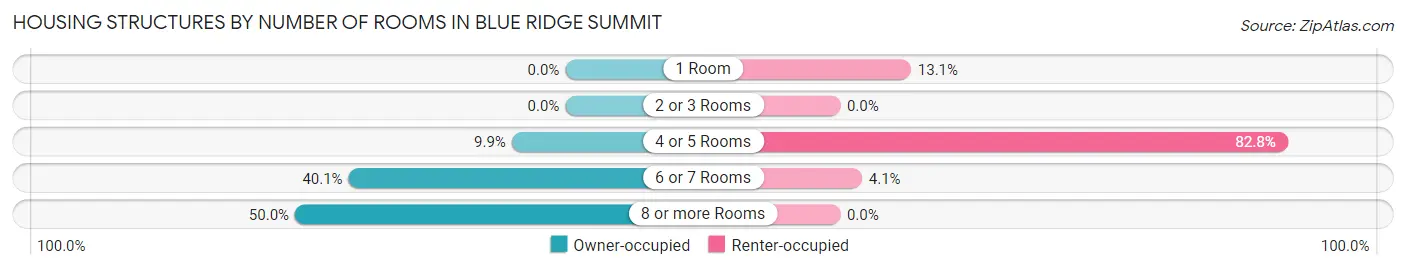
| Number of Rooms | Owner-occupied | Renter-occupied |
| 1 Room | 0 (0.0%) | 42 (13.1%) |
| 2 or 3 Rooms | 0 (0.0%) | 0 (0.0%) |
| 4 or 5 Rooms | 19 (9.9%) | 265 (82.8%) |
| 6 or 7 Rooms | 77 (40.1%) | 13 (4.1%) |
| 8 or more Rooms | 96 (50.0%) | 0 (0.0%) |
| Total | 192 (100.0%) | 320 (100.0%) |
Housing Structure by Heating Type in Blue Ridge Summit
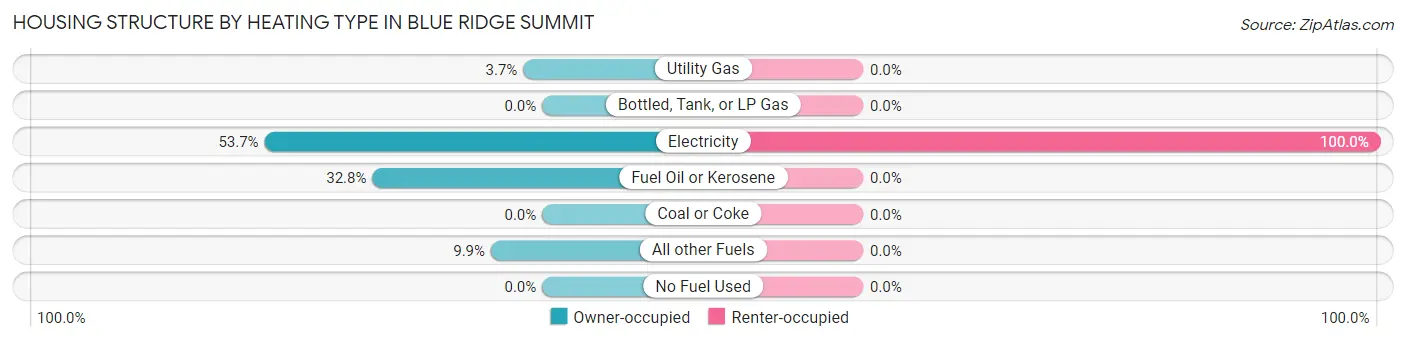
| Heating Type | Owner-occupied | Renter-occupied |
| Utility Gas | 7 (3.6%) | 0 (0.0%) |
| Bottled, Tank, or LP Gas | 0 (0.0%) | 0 (0.0%) |
| Electricity | 103 (53.6%) | 320 (100.0%) |
| Fuel Oil or Kerosene | 63 (32.8%) | 0 (0.0%) |
| Coal or Coke | 0 (0.0%) | 0 (0.0%) |
| All other Fuels | 19 (9.9%) | 0 (0.0%) |
| No Fuel Used | 0 (0.0%) | 0 (0.0%) |
| Total | 192 (100.0%) | 320 (100.0%) |
Household Vehicle Usage in Blue Ridge Summit
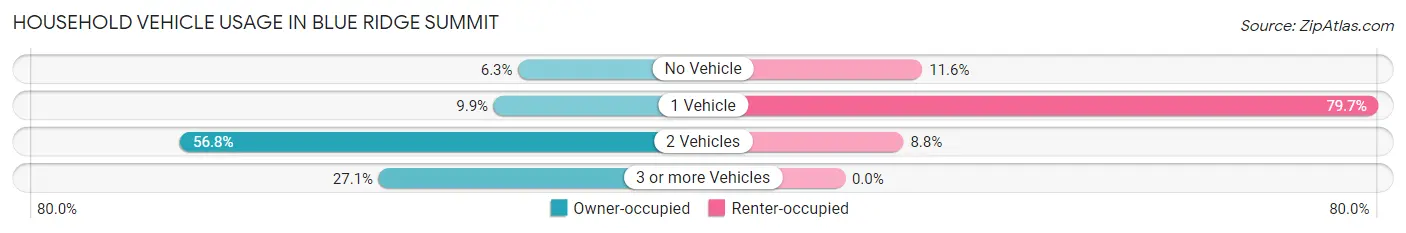
| Vehicles per Household | Owner-occupied | Renter-occupied |
| No Vehicle | 12 (6.2%) | 37 (11.6%) |
| 1 Vehicle | 19 (9.9%) | 255 (79.7%) |
| 2 Vehicles | 109 (56.8%) | 28 (8.7%) |
| 3 or more Vehicles | 52 (27.1%) | 0 (0.0%) |
| Total | 192 (100.0%) | 320 (100.0%) |
Real Estate & Mortgages in Blue Ridge Summit
Real Estate and Mortgage Overview in Blue Ridge Summit
| Characteristic | Without Mortgage | With Mortgage |
| Housing Units | 57 | 135 |
| Median Property Value | $202,500 | $298,300 |
| Median Household Income | - | - |
| Monthly Housing Costs | $608 | $0 |
| Real Estate Taxes | $2,960 | $0 |
Property Value by Mortgage Status in Blue Ridge Summit
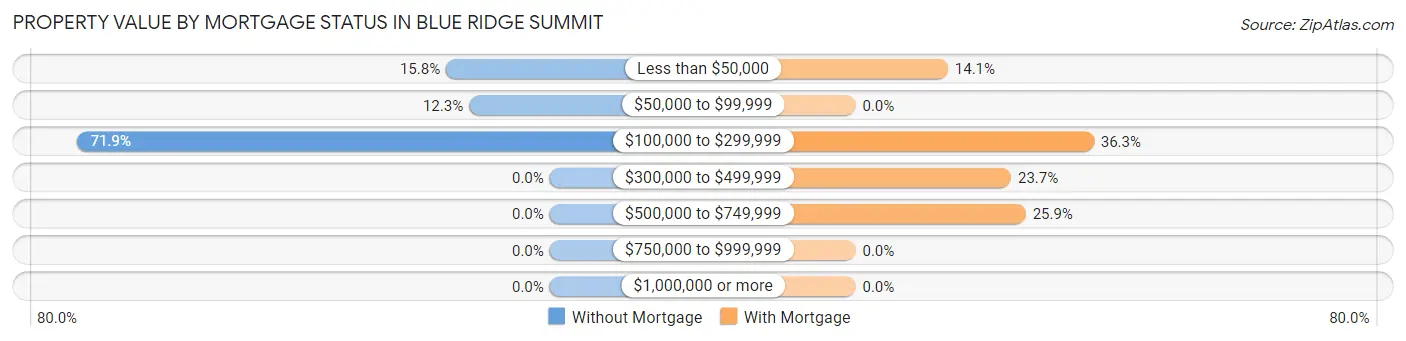
| Property Value | Without Mortgage | With Mortgage |
| Less than $50,000 | 9 (15.8%) | 19 (14.1%) |
| $50,000 to $99,999 | 7 (12.3%) | 0 (0.0%) |
| $100,000 to $299,999 | 41 (71.9%) | 49 (36.3%) |
| $300,000 to $499,999 | 0 (0.0%) | 32 (23.7%) |
| $500,000 to $749,999 | 0 (0.0%) | 35 (25.9%) |
| $750,000 to $999,999 | 0 (0.0%) | 0 (0.0%) |
| $1,000,000 or more | 0 (0.0%) | 0 (0.0%) |
| Total | 57 (100.0%) | 135 (100.0%) |
Household Income by Mortgage Status in Blue Ridge Summit
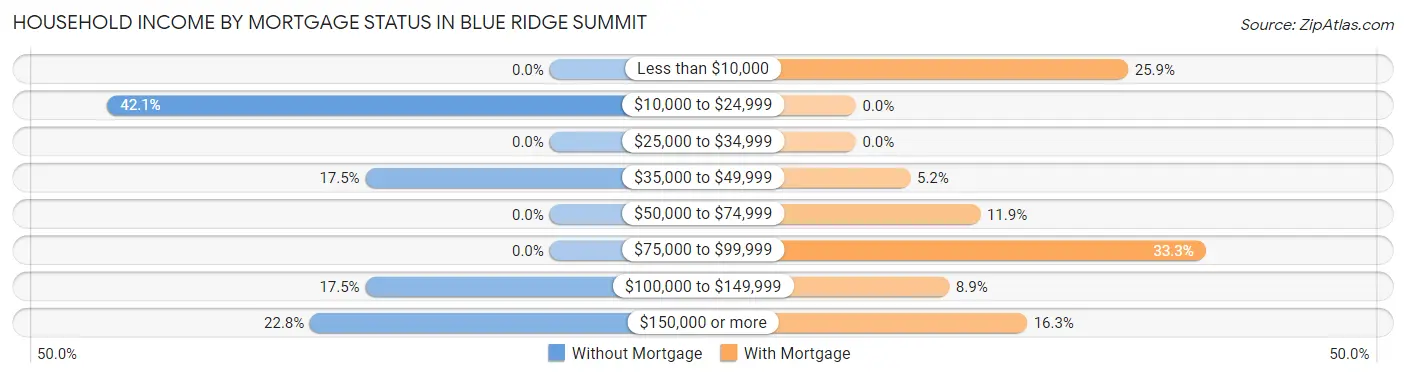
| Household Income | Without Mortgage | With Mortgage |
| Less than $10,000 | 0 (0.0%) | 35 (25.9%) |
| $10,000 to $24,999 | 24 (42.1%) | 0 (0.0%) |
| $25,000 to $34,999 | 0 (0.0%) | 0 (0.0%) |
| $35,000 to $49,999 | 10 (17.5%) | 7 (5.2%) |
| $50,000 to $74,999 | 0 (0.0%) | 16 (11.8%) |
| $75,000 to $99,999 | 0 (0.0%) | 45 (33.3%) |
| $100,000 to $149,999 | 10 (17.5%) | 12 (8.9%) |
| $150,000 or more | 13 (22.8%) | 22 (16.3%) |
| Total | 57 (100.0%) | 135 (100.0%) |
Property Value to Household Income Ratio in Blue Ridge Summit
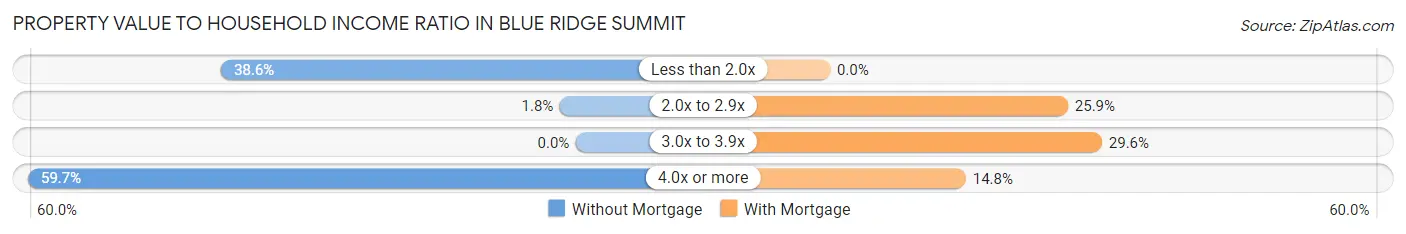
| Value-to-Income Ratio | Without Mortgage | With Mortgage |
| Less than 2.0x | 22 (38.6%) | 0 (0.0%) |
| 2.0x to 2.9x | 1 (1.8%) | 35 (25.9%) |
| 3.0x to 3.9x | 0 (0.0%) | 40 (29.6%) |
| 4.0x or more | 34 (59.7%) | 20 (14.8%) |
| Total | 57 (100.0%) | 135 (100.0%) |
Real Estate Taxes by Mortgage Status in Blue Ridge Summit
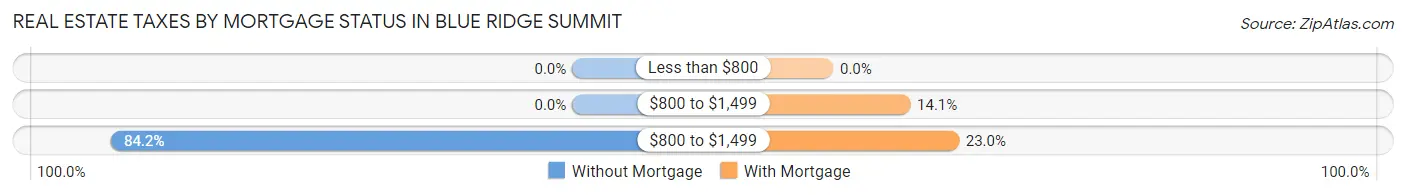
| Property Taxes | Without Mortgage | With Mortgage |
| Less than $800 | 0 (0.0%) | 0 (0.0%) |
| $800 to $1,499 | 0 (0.0%) | 19 (14.1%) |
| $800 to $1,499 | 48 (84.2%) | 31 (23.0%) |
| Total | 57 (100.0%) | 135 (100.0%) |
Health & Disability in Blue Ridge Summit
Health Insurance Coverage by Age in Blue Ridge Summit
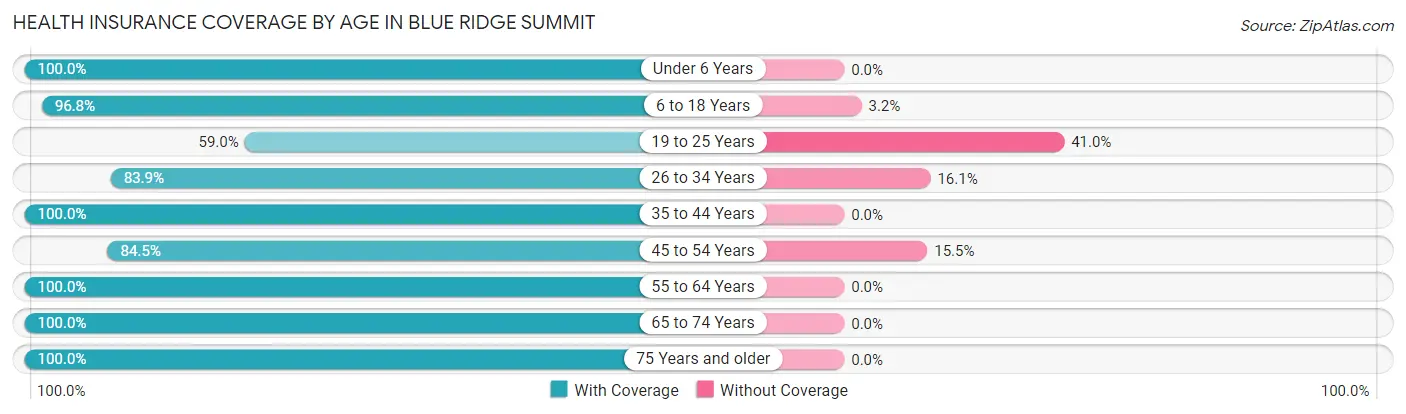
| Age Bracket | With Coverage | Without Coverage |
| Under 6 Years | 22 (100.0%) | 0 (0.0%) |
| 6 to 18 Years | 211 (96.8%) | 7 (3.2%) |
| 19 to 25 Years | 82 (59.0%) | 57 (41.0%) |
| 26 to 34 Years | 47 (83.9%) | 9 (16.1%) |
| 35 to 44 Years | 129 (100.0%) | 0 (0.0%) |
| 45 to 54 Years | 71 (84.5%) | 13 (15.5%) |
| 55 to 64 Years | 169 (100.0%) | 0 (0.0%) |
| 65 to 74 Years | 174 (100.0%) | 0 (0.0%) |
| 75 Years and older | 48 (100.0%) | 0 (0.0%) |
| Total | 953 (91.7%) | 86 (8.3%) |
Health Insurance Coverage by Citizenship Status in Blue Ridge Summit
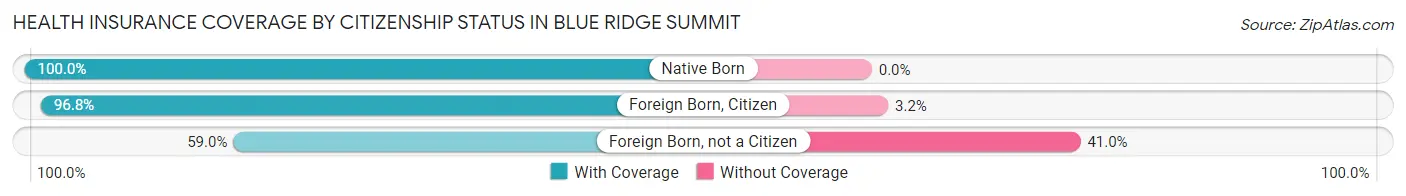
| Citizenship Status | With Coverage | Without Coverage |
| Native Born | 22 (100.0%) | 0 (0.0%) |
| Foreign Born, Citizen | 211 (96.8%) | 7 (3.2%) |
| Foreign Born, not a Citizen | 82 (59.0%) | 57 (41.0%) |
Health Insurance Coverage by Household Income in Blue Ridge Summit
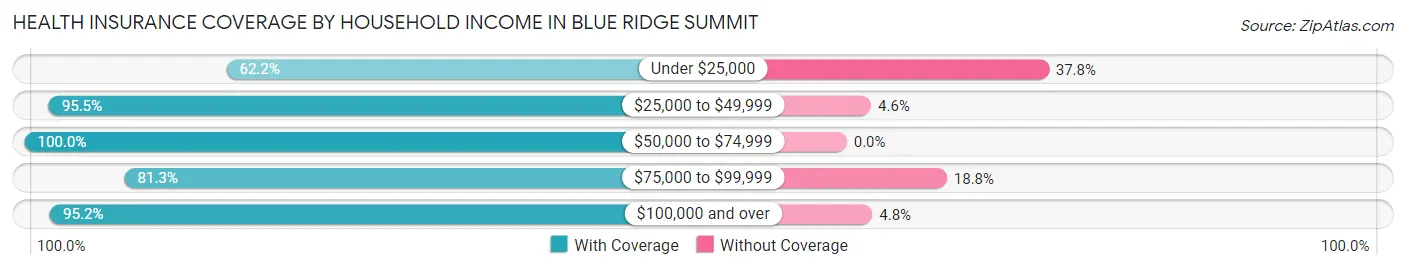
| Household Income | With Coverage | Without Coverage |
| Under $25,000 | 69 (62.2%) | 42 (37.8%) |
| $25,000 to $49,999 | 210 (95.5%) | 10 (4.5%) |
| $50,000 to $74,999 | 138 (100.0%) | 0 (0.0%) |
| $75,000 to $99,999 | 39 (81.2%) | 9 (18.8%) |
| $100,000 and over | 497 (95.2%) | 25 (4.8%) |
Public vs Private Health Insurance Coverage by Age in Blue Ridge Summit
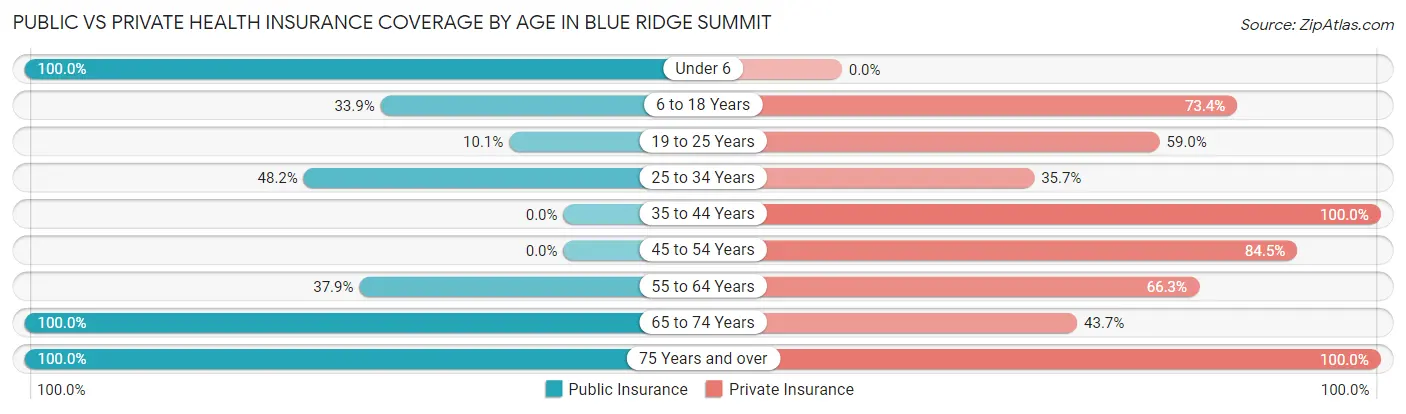
| Age Bracket | Public Insurance | Private Insurance |
| Under 6 | 22 (100.0%) | 0 (0.0%) |
| 6 to 18 Years | 74 (33.9%) | 160 (73.4%) |
| 19 to 25 Years | 14 (10.1%) | 82 (59.0%) |
| 25 to 34 Years | 27 (48.2%) | 20 (35.7%) |
| 35 to 44 Years | 0 (0.0%) | 129 (100.0%) |
| 45 to 54 Years | 0 (0.0%) | 71 (84.5%) |
| 55 to 64 Years | 64 (37.9%) | 112 (66.3%) |
| 65 to 74 Years | 174 (100.0%) | 76 (43.7%) |
| 75 Years and over | 48 (100.0%) | 48 (100.0%) |
| Total | 423 (40.7%) | 698 (67.2%) |
Disability Status by Sex by Age in Blue Ridge Summit
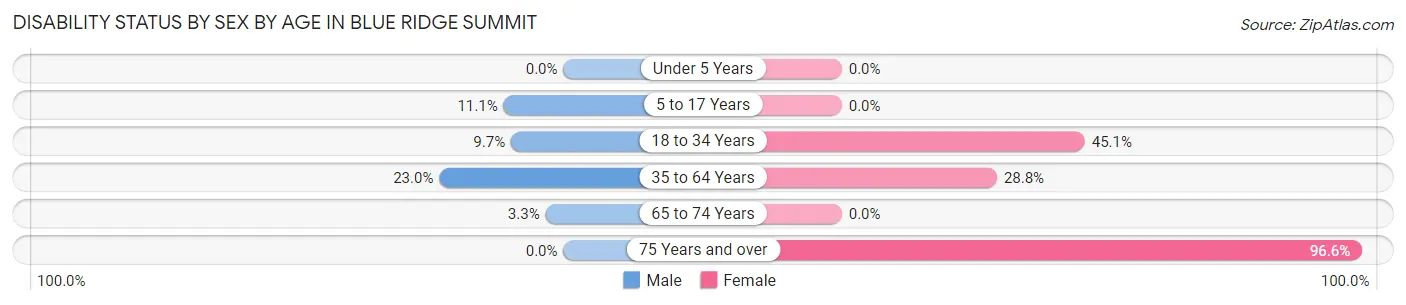
| Age Bracket | Male | Female |
| Under 5 Years | 0 (0.0%) | 0 (0.0%) |
| 5 to 17 Years | 13 (11.1%) | 0 (0.0%) |
| 18 to 34 Years | 14 (9.7%) | 23 (45.1%) |
| 35 to 64 Years | 44 (23.0%) | 55 (28.8%) |
| 65 to 74 Years | 5 (3.3%) | 0 (0.0%) |
| 75 Years and over | 0 (0.0%) | 28 (96.6%) |
Disability Class by Sex by Age in Blue Ridge Summit
Disability Class: Hearing Difficulty
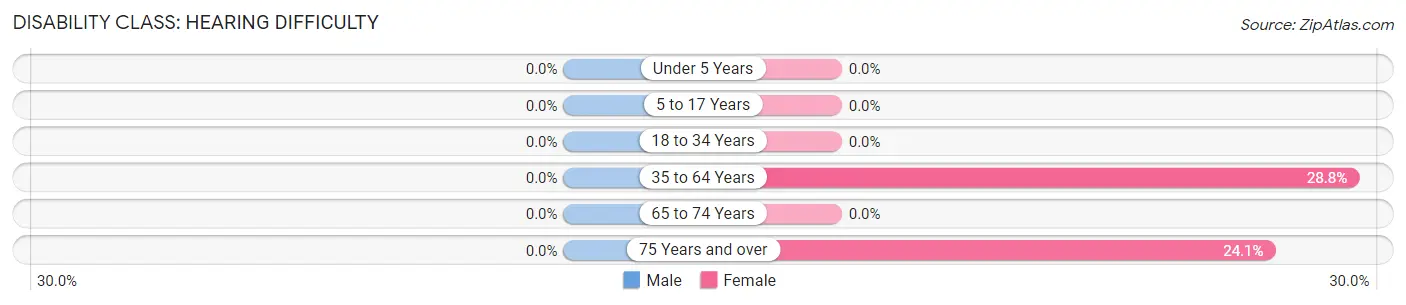
| Age Bracket | Male | Female |
| Under 5 Years | 0 (0.0%) | 0 (0.0%) |
| 5 to 17 Years | 0 (0.0%) | 0 (0.0%) |
| 18 to 34 Years | 0 (0.0%) | 0 (0.0%) |
| 35 to 64 Years | 0 (0.0%) | 55 (28.8%) |
| 65 to 74 Years | 0 (0.0%) | 0 (0.0%) |
| 75 Years and over | 0 (0.0%) | 7 (24.1%) |
Disability Class: Vision Difficulty
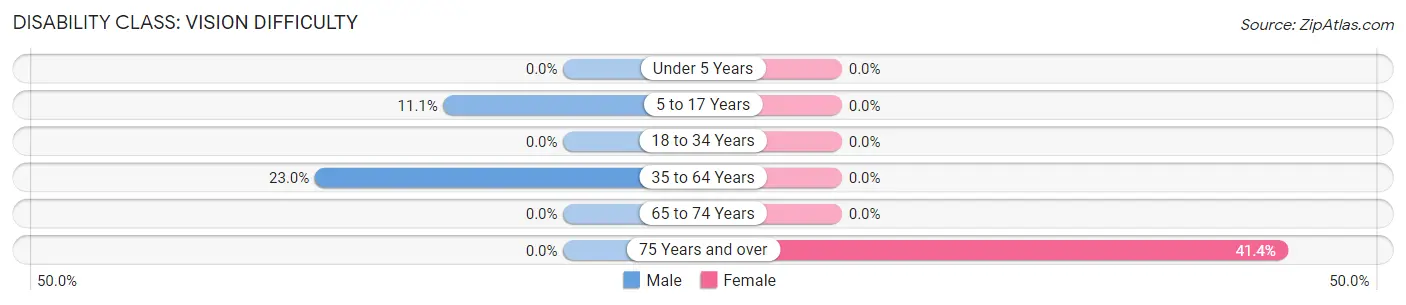
| Age Bracket | Male | Female |
| Under 5 Years | 0 (0.0%) | 0 (0.0%) |
| 5 to 17 Years | 13 (11.1%) | 0 (0.0%) |
| 18 to 34 Years | 0 (0.0%) | 0 (0.0%) |
| 35 to 64 Years | 44 (23.0%) | 0 (0.0%) |
| 65 to 74 Years | 0 (0.0%) | 0 (0.0%) |
| 75 Years and over | 0 (0.0%) | 12 (41.4%) |
Disability Class: Cognitive Difficulty
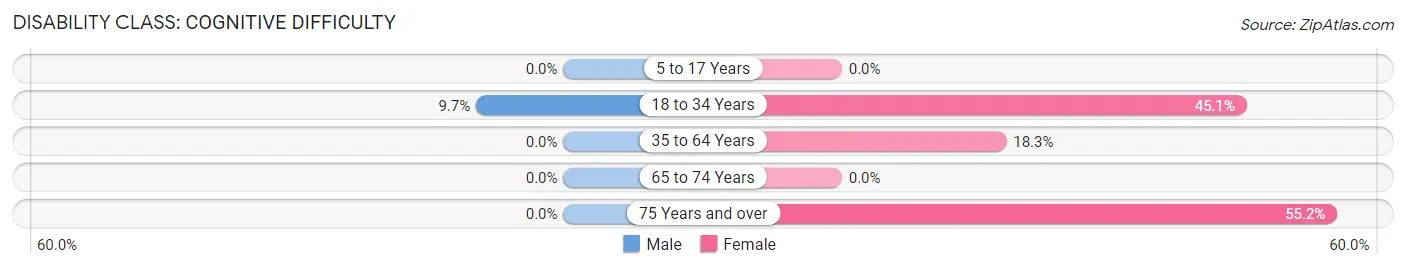
| Age Bracket | Male | Female |
| 5 to 17 Years | 0 (0.0%) | 0 (0.0%) |
| 18 to 34 Years | 14 (9.7%) | 23 (45.1%) |
| 35 to 64 Years | 0 (0.0%) | 35 (18.3%) |
| 65 to 74 Years | 0 (0.0%) | 0 (0.0%) |
| 75 Years and over | 0 (0.0%) | 16 (55.2%) |
Disability Class: Ambulatory Difficulty
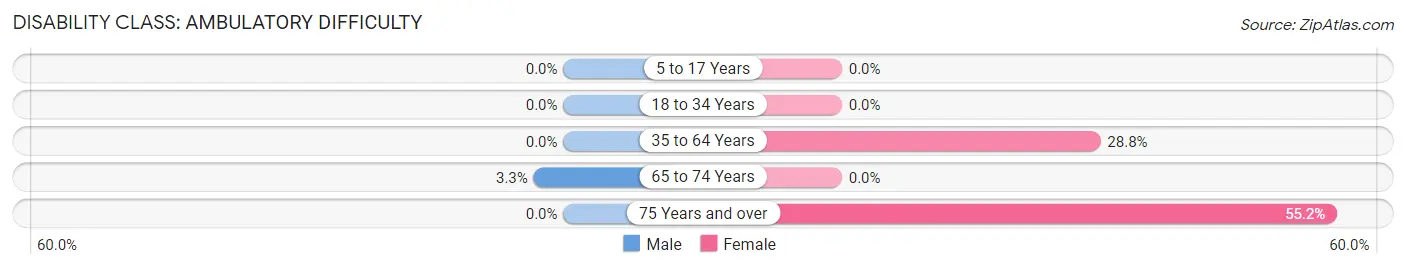
| Age Bracket | Male | Female |
| 5 to 17 Years | 0 (0.0%) | 0 (0.0%) |
| 18 to 34 Years | 0 (0.0%) | 0 (0.0%) |
| 35 to 64 Years | 0 (0.0%) | 55 (28.8%) |
| 65 to 74 Years | 5 (3.3%) | 0 (0.0%) |
| 75 Years and over | 0 (0.0%) | 16 (55.2%) |
Disability Class: Self-Care Difficulty
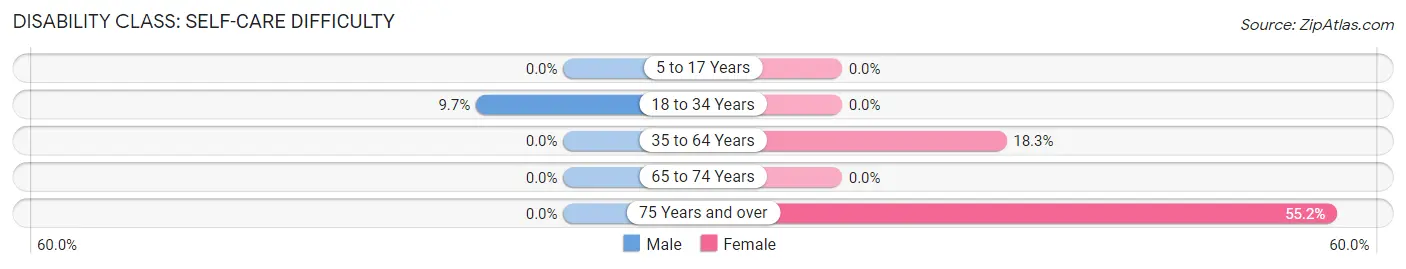
| Age Bracket | Male | Female |
| 5 to 17 Years | 0 (0.0%) | 0 (0.0%) |
| 18 to 34 Years | 14 (9.7%) | 0 (0.0%) |
| 35 to 64 Years | 0 (0.0%) | 35 (18.3%) |
| 65 to 74 Years | 0 (0.0%) | 0 (0.0%) |
| 75 Years and over | 0 (0.0%) | 16 (55.2%) |
Technology Access in Blue Ridge Summit
Computing Device Access in Blue Ridge Summit
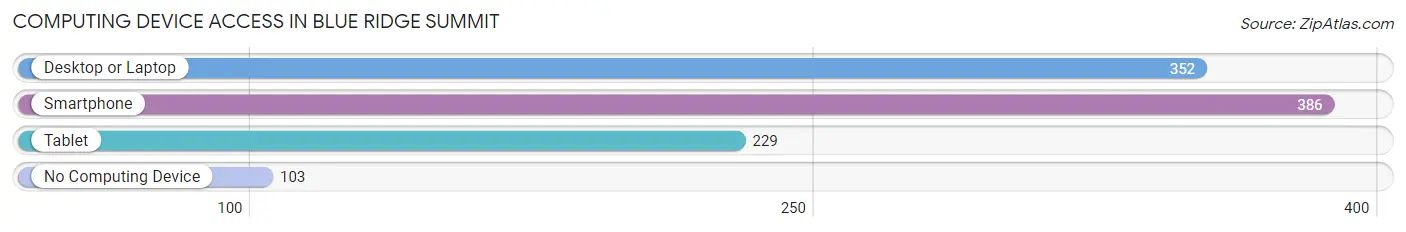
| Device Type | # Households | % Households |
| Desktop or Laptop | 352 | 68.8% |
| Smartphone | 386 | 75.4% |
| Tablet | 229 | 44.7% |
| No Computing Device | 103 | 20.1% |
| Total | 512 | 100.0% |
Internet Access in Blue Ridge Summit
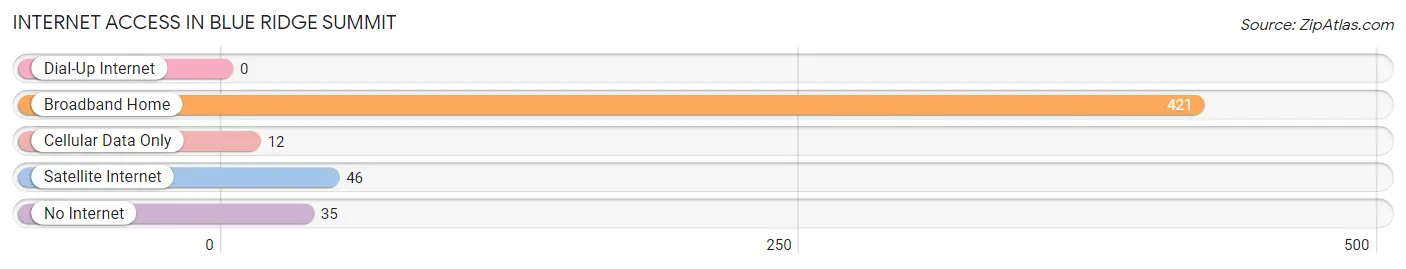
| Internet Type | # Households | % Households |
| Dial-Up Internet | 0 | 0.0% |
| Broadband Home | 421 | 82.2% |
| Cellular Data Only | 12 | 2.3% |
| Satellite Internet | 46 | 9.0% |
| No Internet | 35 | 6.8% |
| Total | 512 | 100.0% |
Blue Ridge Summit Summary
Introduction
Blue Ridge Summit is a small borough located in Franklin County, Pennsylvania. It is situated in the Cumberland Valley, near the Maryland border. The population of the borough was 1,541 at the 2010 census. The town is known for its scenic views of the Blue Ridge Mountains and its proximity to the Appalachian Trail.
History
Blue Ridge Summit was founded in 1837 by a group of settlers from Maryland. The town was originally known as Pen Mar, named after the nearby Pen Mar Park. The park was a popular destination for visitors from the Baltimore and Washington D.C. area. In 1854, the town was renamed Blue Ridge Summit.
The town was an important stop on the Western Maryland Railroad, which connected Baltimore and Hagerstown, Maryland. The railroad was a major factor in the growth of the town. In the late 19th century, the town was a popular summer resort destination for wealthy families from Baltimore and Washington D.C.
The town was also home to a number of factories, including a paper mill, a brickyard, and a canning factory. The factories provided employment for many of the town’s residents.
Geography
Blue Ridge Summit is located in the Cumberland Valley, near the Maryland border. The town is situated at the base of the Blue Ridge Mountains, which provide a scenic backdrop. The town is located at an elevation of 1,890 feet.
The town is located near the Appalachian Trail, which passes through the nearby town of Waynesboro. The town is also located near the Catoctin Mountain Park, which is a popular destination for hikers and campers.
The town is located near the intersection of Interstate 81 and U.S. Route 30. The town is also served by the Western Maryland Railroad, which connects the town to Baltimore and Hagerstown, Maryland.
Economy
The economy of Blue Ridge Summit is largely based on tourism. The town is a popular destination for visitors from the Baltimore and Washington D.C. area. The town is also home to a number of small businesses, including restaurants, shops, and bed and breakfasts.
The town is also home to a number of factories, including a paper mill, a brickyard, and a canning factory. The factories provide employment for many of the town’s residents.
Demographics
The population of Blue Ridge Summit was 1,541 at the 2010 census. The town has a median household income of $45,000. The town is predominantly white, with a small African American population. The town is also home to a small Hispanic population.
Conclusion
Blue Ridge Summit is a small borough located in Franklin County, Pennsylvania. The town is known for its scenic views of the Blue Ridge Mountains and its proximity to the Appalachian Trail. The town is a popular destination for visitors from the Baltimore and Washington D.C. area. The town is also home to a number of small businesses and factories, which provide employment for many of the town’s residents. The population of the town was 1,541 at the 2010 census.
Common Questions
What is Per Capita Income in Blue Ridge Summit?
Per Capita income in Blue Ridge Summit is $30,907.
What is the Median Family Income in Blue Ridge Summit?
Median Family Income in Blue Ridge Summit is $102,938.
What is the Median Household income in Blue Ridge Summit?
Median Household Income in Blue Ridge Summit is $44,348.
What is Income or Wage Gap in Blue Ridge Summit?
Income or Wage Gap in Blue Ridge Summit is 5.3%.
Women in Blue Ridge Summit earn 94.7 cents for every dollar earned by a man.
What is Inequality or Gini Index in Blue Ridge Summit?
Inequality or Gini Index in Blue Ridge Summit is 0.40.
What is the Total Population of Blue Ridge Summit?
Total Population of Blue Ridge Summit is 1,039.
What is the Total Male Population of Blue Ridge Summit?
Total Male Population of Blue Ridge Summit is 622.
What is the Total Female Population of Blue Ridge Summit?
Total Female Population of Blue Ridge Summit is 417.
What is the Ratio of Males per 100 Females in Blue Ridge Summit?
There are 149.16 Males per 100 Females in Blue Ridge Summit.
What is the Ratio of Females per 100 Males in Blue Ridge Summit?
There are 67.04 Females per 100 Males in Blue Ridge Summit.
What is the Median Population Age in Blue Ridge Summit?
Median Population Age in Blue Ridge Summit is 42.2 Years.
What is the Average Family Size in Blue Ridge Summit
Average Family Size in Blue Ridge Summit is 3.2 People.
What is the Average Household Size in Blue Ridge Summit
Average Household Size in Blue Ridge Summit is 2.0 People.
How Large is the Labor Force in Blue Ridge Summit?
There are 503 People in the Labor Forcein in Blue Ridge Summit.
What is the Percentage of People in the Labor Force in Blue Ridge Summit?
61.9% of People are in the Labor Force in Blue Ridge Summit.
What is the Unemployment Rate in Blue Ridge Summit?
Unemployment Rate in Blue Ridge Summit is 0.2%.