Bigler, PA Map & Demographics
Bigler Map
Bigler Overview
$35,438
PER CAPITA INCOME
$69,333
AVG FAMILY INCOME
$68,833
AVG HOUSEHOLD INCOME
0.35
INEQUALITY / GINI INDEX
476
TOTAL POPULATION
234
MALE POPULATION
242
FEMALE POPULATION
96.69
MALES / 100 FEMALES
103.42
FEMALES / 100 MALES
34.5
MEDIAN AGE
2.8
AVG FAMILY SIZE
2.6
AVG HOUSEHOLD SIZE
389
LABOR FORCE [ PEOPLE ]
89.0%
PERCENT IN LABOR FORCE
2.8%
UNEMPLOYMENT RATE
Bigler Zip Codes
Bigler Area Codes
Income in Bigler
Income Overview in Bigler
Per Capita Income in Bigler is $35,438, while median incomes of families and households are $69,333 and $68,833 respectively.
| Characteristic | Number | Measure |
| Per Capita Income | 476 | $35,438 |
| Median Family Income | 162 | $69,333 |
| Mean Family Income | 162 | $105,669 |
| Median Household Income | 180 | $68,833 |
| Mean Household Income | 180 | $97,752 |
| Income Deficit | 162 | $0 |
| Wage / Income Gap (%) | 476 | 0.00% |
| Wage / Income Gap ($) | 476 | 100.00¢ per $1 |
| Gini / Inequality Index | 476 | 0.35 |
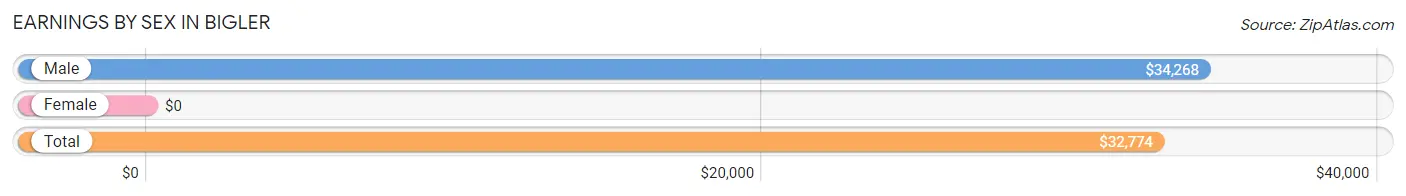
Earnings by Sex in Bigler
| Sex | Number | Average Earnings |
| Male | 204 (50.9%) | $34,268 |
| Female | 197 (49.1%) | $0 |
| Total | 401 (100.0%) | $32,774 |
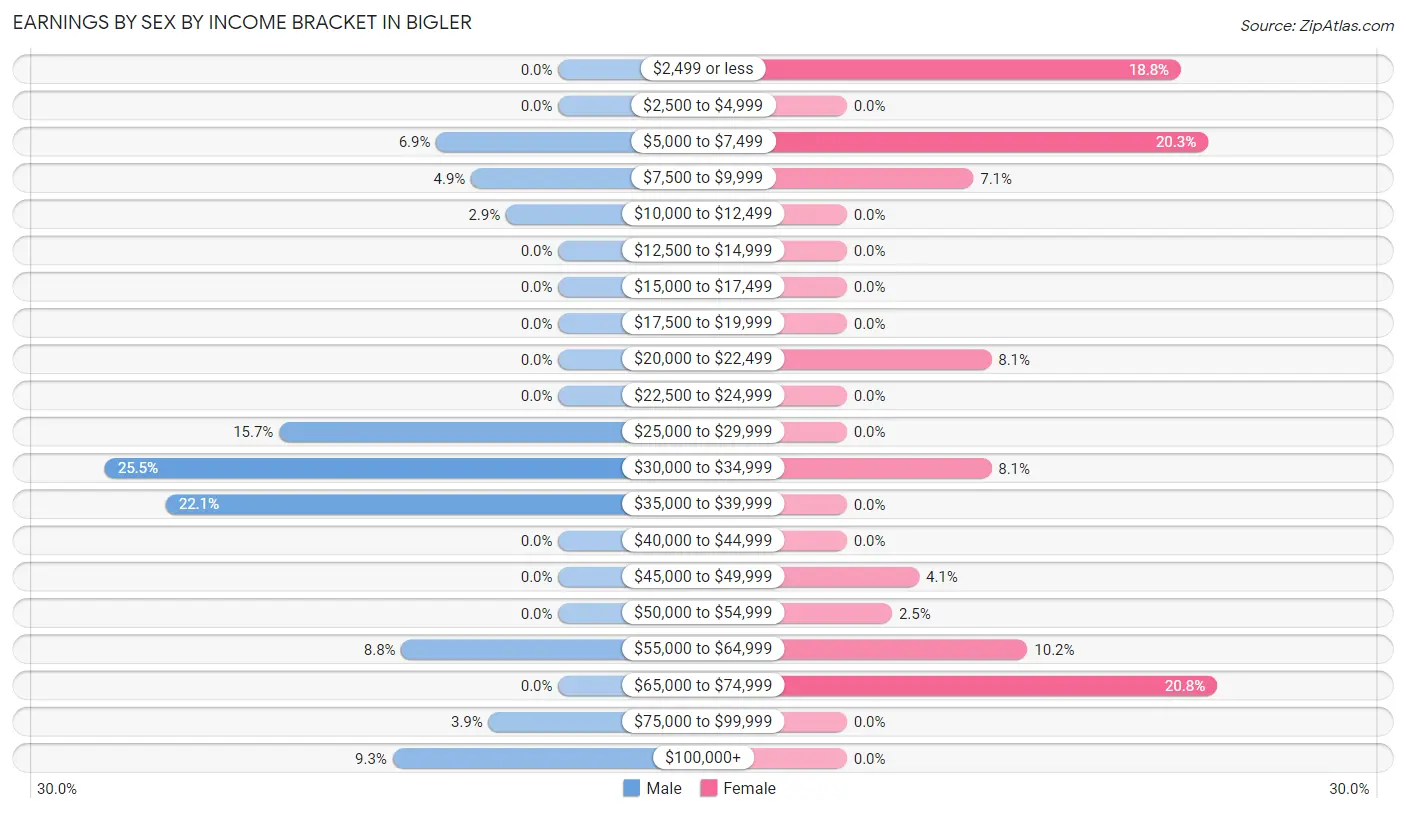
Earnings by Sex by Income Bracket in Bigler
The most common earnings brackets in Bigler are $30,000 to $34,999 for men (52 | 25.5%) and $65,000 to $74,999 for women (41 | 20.8%).
| Income | Male | Female |
| $2,499 or less | 0 (0.0%) | 37 (18.8%) |
| $2,500 to $4,999 | 0 (0.0%) | 0 (0.0%) |
| $5,000 to $7,499 | 14 (6.9%) | 40 (20.3%) |
| $7,500 to $9,999 | 10 (4.9%) | 14 (7.1%) |
| $10,000 to $12,499 | 6 (2.9%) | 0 (0.0%) |
| $12,500 to $14,999 | 0 (0.0%) | 0 (0.0%) |
| $15,000 to $17,499 | 0 (0.0%) | 0 (0.0%) |
| $17,500 to $19,999 | 0 (0.0%) | 0 (0.0%) |
| $20,000 to $22,499 | 0 (0.0%) | 16 (8.1%) |
| $22,500 to $24,999 | 0 (0.0%) | 0 (0.0%) |
| $25,000 to $29,999 | 32 (15.7%) | 0 (0.0%) |
| $30,000 to $34,999 | 52 (25.5%) | 16 (8.1%) |
| $35,000 to $39,999 | 45 (22.1%) | 0 (0.0%) |
| $40,000 to $44,999 | 0 (0.0%) | 0 (0.0%) |
| $45,000 to $49,999 | 0 (0.0%) | 8 (4.1%) |
| $50,000 to $54,999 | 0 (0.0%) | 5 (2.5%) |
| $55,000 to $64,999 | 18 (8.8%) | 20 (10.2%) |
| $65,000 to $74,999 | 0 (0.0%) | 41 (20.8%) |
| $75,000 to $99,999 | 8 (3.9%) | 0 (0.0%) |
| $100,000+ | 19 (9.3%) | 0 (0.0%) |
| Total | 204 (100.0%) | 197 (100.0%) |
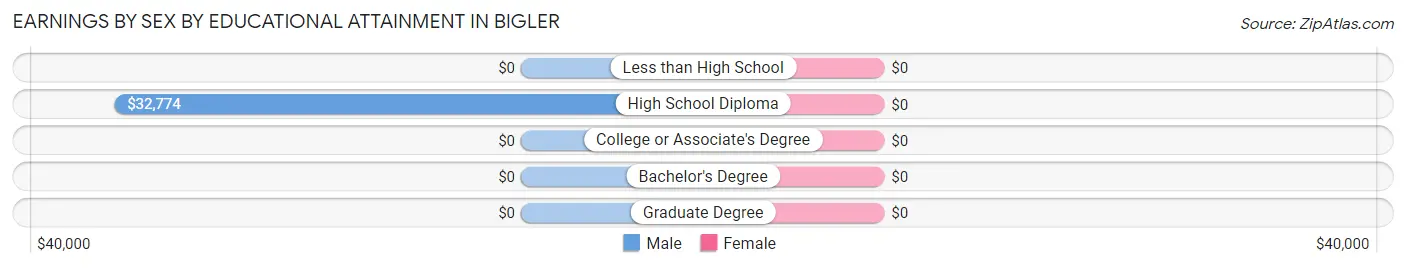
Earnings by Sex by Educational Attainment in Bigler
| Educational Attainment | Male Income | Female Income |
| Less than High School | - | - |
| High School Diploma | $32,774 | $0 |
| College or Associate's Degree | - | - |
| Bachelor's Degree | - | - |
| Graduate Degree | - | - |
| Total | $34,695 | $56,625 |
Family Income in Bigler
Family Income Brackets in Bigler
According to the Bigler family income data, there are 87 families falling into the $50,000 to $74,999 income range, which is the most common income bracket and makes up 53.7% of all families.
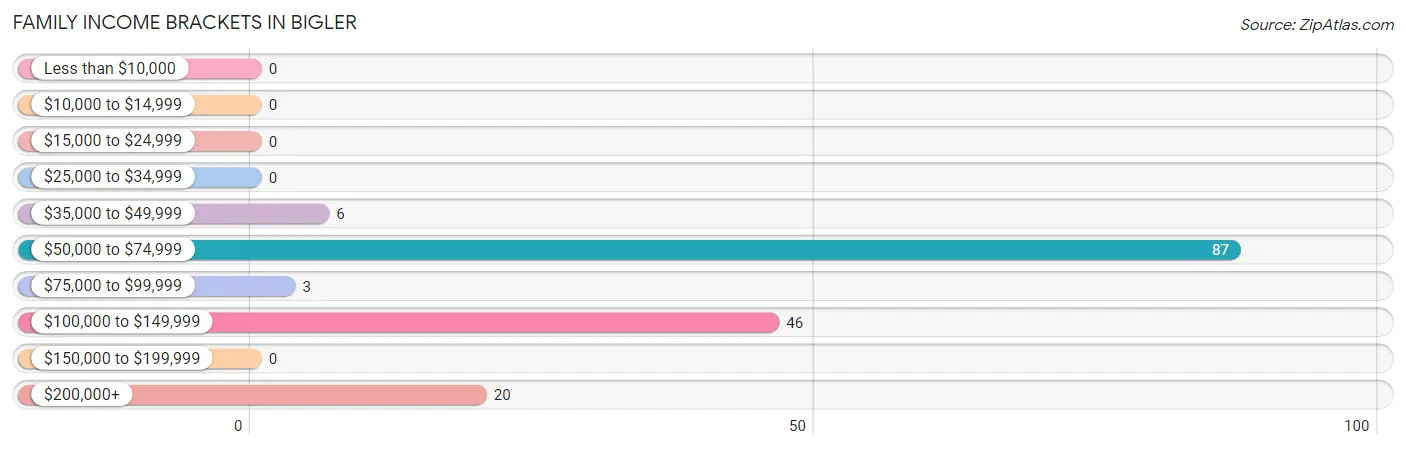
| Income Bracket | # Families | % Families |
| Less than $10,000 | 0 | 0.0% |
| $10,000 to $14,999 | 0 | 0.0% |
| $15,000 to $24,999 | 0 | 0.0% |
| $25,000 to $34,999 | 0 | 0.0% |
| $35,000 to $49,999 | 6 | 3.7% |
| $50,000 to $74,999 | 87 | 53.7% |
| $75,000 to $99,999 | 3 | 1.9% |
| $100,000 to $149,999 | 46 | 28.4% |
| $150,000 to $199,999 | 0 | 0.0% |
| $200,000+ | 20 | 12.3% |
Family Income by Famaliy Size in Bigler
4-person families (62 | 38.3%) account for the highest median family income in Bigler with $105,461 per family, while 2-person families (89 | 54.9%) have the highest median income of $34,320 per family member.
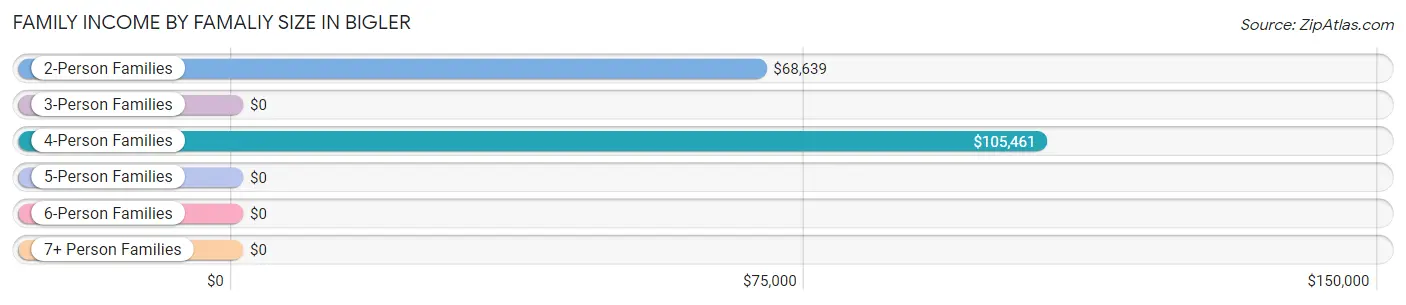
| Income Bracket | # Families | Median Income |
| 2-Person Families | 89 (54.9%) | $68,639 |
| 3-Person Families | 3 (1.8%) | $0 |
| 4-Person Families | 62 (38.3%) | $105,461 |
| 5-Person Families | 8 (4.9%) | $0 |
| 6-Person Families | 0 (0.0%) | $0 |
| 7+ Person Families | 0 (0.0%) | $0 |
| Total | 162 (100.0%) | $69,333 |
Family Income by Number of Earners in Bigler
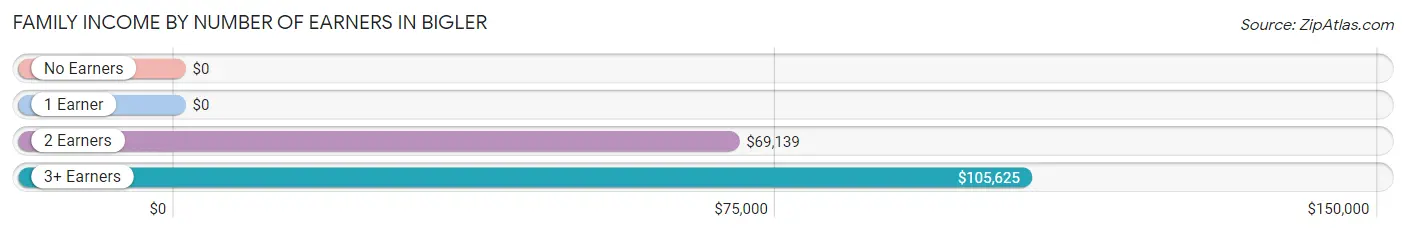
| Number of Earners | # Families | Median Income |
| No Earners | 0 (0.0%) | $0 |
| 1 Earner | 18 (11.1%) | $0 |
| 2 Earners | 87 (53.7%) | $69,139 |
| 3+ Earners | 57 (35.2%) | $105,625 |
| Total | 162 (100.0%) | $69,333 |
Household Income in Bigler
Household Income Brackets in Bigler
With 87 households falling in the category, the $50,000 to $74,999 income range is the most frequent in Bigler, accounting for 48.3% of all households.
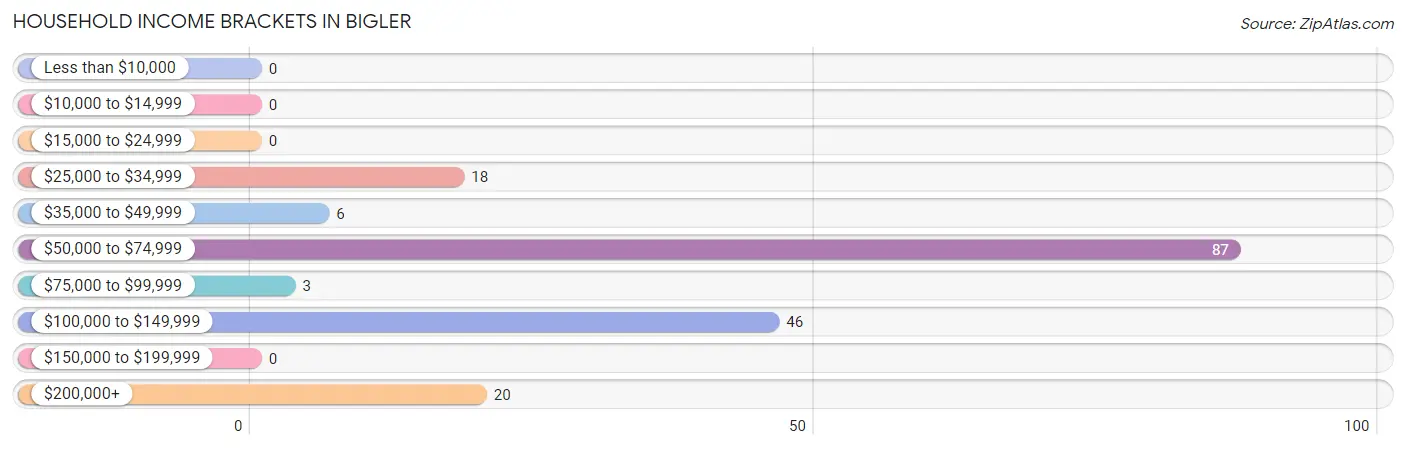
| Income Bracket | # Households | % Households |
| Less than $10,000 | 0 | 0.0% |
| $10,000 to $14,999 | 0 | 0.0% |
| $15,000 to $24,999 | 0 | 0.0% |
| $25,000 to $34,999 | 18 | 10.0% |
| $35,000 to $49,999 | 6 | 3.3% |
| $50,000 to $74,999 | 87 | 48.3% |
| $75,000 to $99,999 | 3 | 1.7% |
| $100,000 to $149,999 | 46 | 25.6% |
| $150,000 to $199,999 | 0 | 0.0% |
| $200,000+ | 20 | 11.1% |
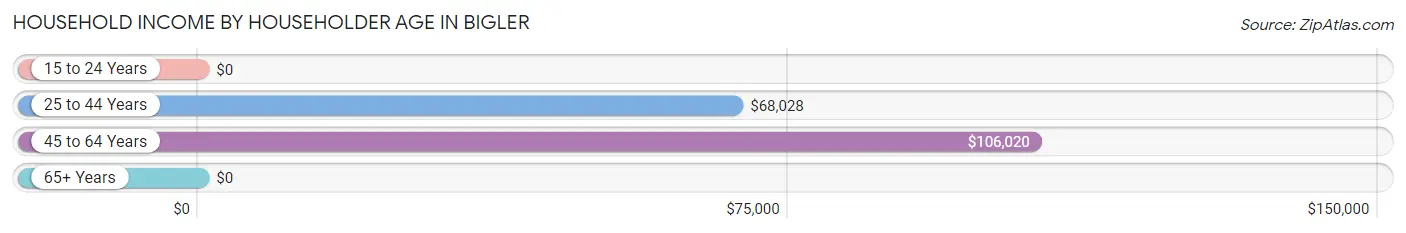
Household Income by Householder Age in Bigler
The median household income in Bigler is $68,833, with the highest median household income of $106,020 found in the 45 to 64 years age bracket for the primary householder. A total of 85 households (47.2%) fall into this category.
| Income Bracket | # Households | Median Income |
| 15 to 24 Years | 0 (0.0%) | $0 |
| 25 to 44 Years | 87 (48.3%) | $68,028 |
| 45 to 64 Years | 85 (47.2%) | $106,020 |
| 65+ Years | 8 (4.4%) | $0 |
| Total | 180 (100.0%) | $68,833 |
Poverty in Bigler
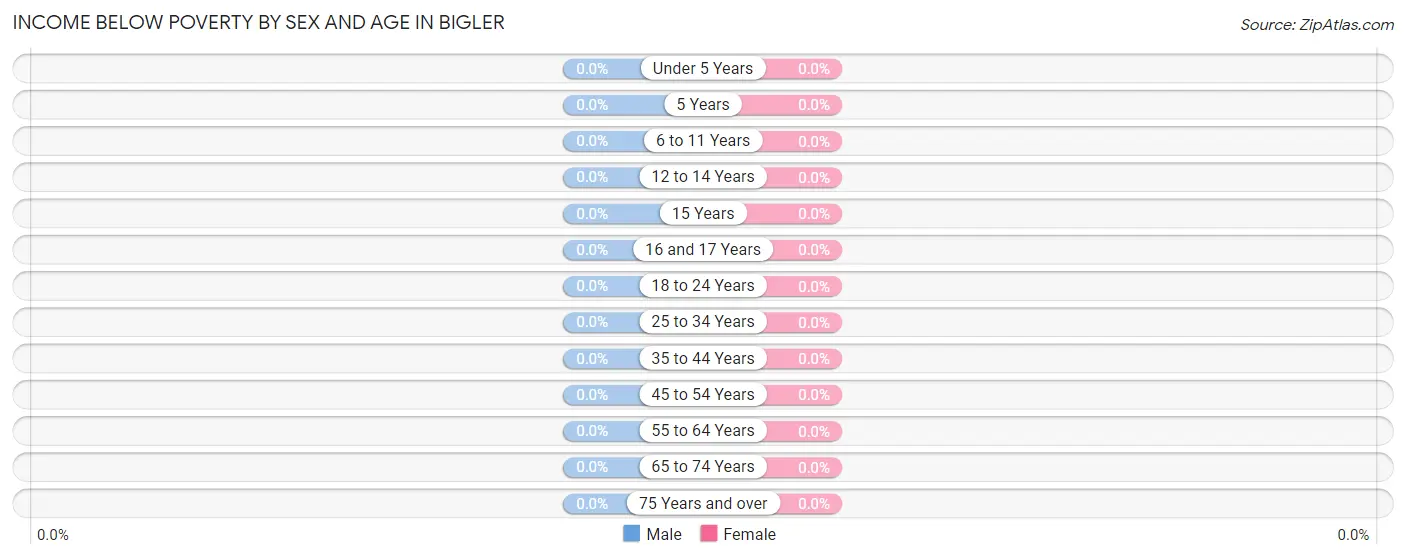
Income Below Poverty by Sex and Age in Bigler
| Age Bracket | Male | Female |
| Under 5 Years | 0 (0.0%) | 0 (0.0%) |
| 5 Years | 0 (0.0%) | 0 (0.0%) |
| 6 to 11 Years | 0 (0.0%) | 0 (0.0%) |
| 12 to 14 Years | 0 (0.0%) | 0 (0.0%) |
| 15 Years | 0 (0.0%) | 0 (0.0%) |
| 16 and 17 Years | 0 (0.0%) | 0 (0.0%) |
| 18 to 24 Years | 0 (0.0%) | 0 (0.0%) |
| 25 to 34 Years | 0 (0.0%) | 0 (0.0%) |
| 35 to 44 Years | 0 (0.0%) | 0 (0.0%) |
| 45 to 54 Years | 0 (0.0%) | 0 (0.0%) |
| 55 to 64 Years | 0 (0.0%) | 0 (0.0%) |
| 65 to 74 Years | 0 (0.0%) | 0 (0.0%) |
| 75 Years and over | 0 (0.0%) | 0 (0.0%) |
| Total | 0 (0.0%) | 0 (0.0%) |
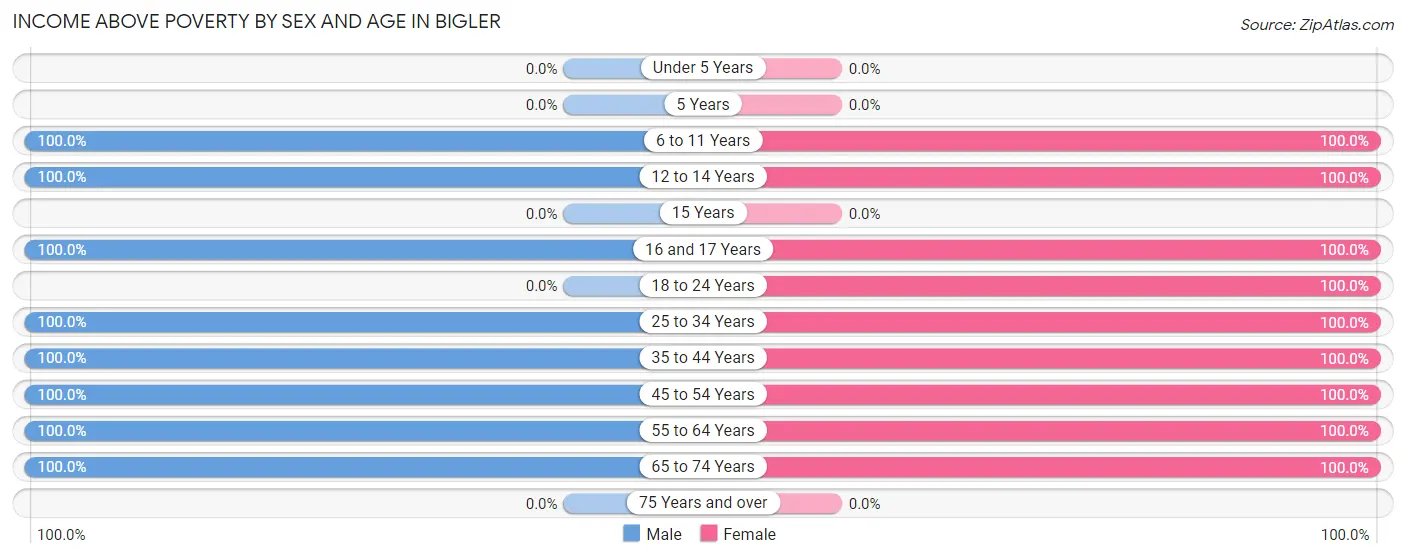
Income Above Poverty by Sex and Age in Bigler
According to the poverty statistics in Bigler, males aged 6 to 11 years and females aged 6 to 11 years are the age groups that are most secure financially, with 100.0% of males and 100.0% of females in these age groups living above the poverty line.
| Age Bracket | Male | Female |
| Under 5 Years | 0 (0.0%) | 0 (0.0%) |
| 5 Years | 0 (0.0%) | 0 (0.0%) |
| 6 to 11 Years | 8 (100.0%) | 8 (100.0%) |
| 12 to 14 Years | 15 (100.0%) | 8 (100.0%) |
| 15 Years | 0 (0.0%) | 0 (0.0%) |
| 16 and 17 Years | 14 (100.0%) | 37 (100.0%) |
| 18 to 24 Years | 0 (0.0%) | 64 (100.0%) |
| 25 to 34 Years | 63 (100.0%) | 21 (100.0%) |
| 35 to 44 Years | 19 (100.0%) | 65 (100.0%) |
| 45 to 54 Years | 24 (100.0%) | 25 (100.0%) |
| 55 to 64 Years | 84 (100.0%) | 6 (100.0%) |
| 65 to 74 Years | 7 (100.0%) | 8 (100.0%) |
| 75 Years and over | 0 (0.0%) | 0 (0.0%) |
| Total | 234 (100.0%) | 242 (100.0%) |
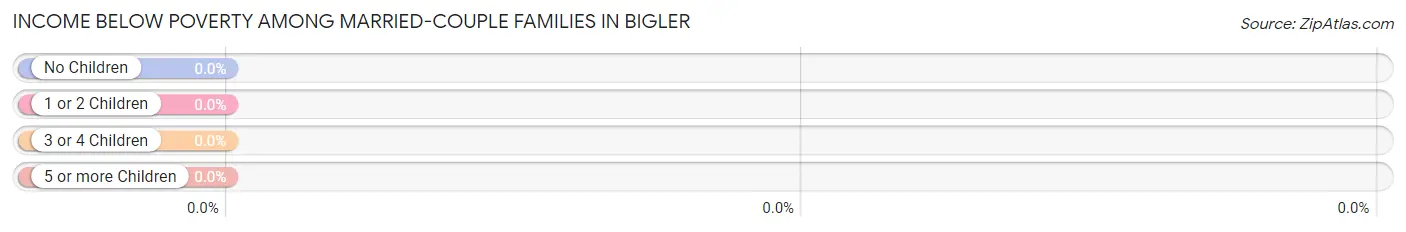
Income Below Poverty Among Married-Couple Families in Bigler
| Children | Above Poverty | Below Poverty |
| No Children | 100 (100.0%) | 0 (0.0%) |
| 1 or 2 Children | 54 (100.0%) | 0 (0.0%) |
| 3 or 4 Children | 8 (100.0%) | 0 (0.0%) |
| 5 or more Children | 0 (0.0%) | 0 (0.0%) |
| Total | 162 (100.0%) | 0 (0.0%) |
Income Below Poverty Among Single-Parent Households in Bigler
| Children | Single Father | Single Mother |
| No Children | 0 (0.0%) | 0 (0.0%) |
| 1 or 2 Children | 0 (0.0%) | 0 (0.0%) |
| 3 or 4 Children | 0 (0.0%) | 0 (0.0%) |
| 5 or more Children | 0 (0.0%) | 0 (0.0%) |
| Total | 0 (0.0%) | 0 (0.0%) |
Income Below Poverty Among Married-Couple vs Single-Parent Households in Bigler
| Children | Married-Couple Families | Single-Parent Households |
| No Children | 0 (0.0%) | 0 (0.0%) |
| 1 or 2 Children | 0 (0.0%) | 0 (0.0%) |
| 3 or 4 Children | 0 (0.0%) | 0 (0.0%) |
| 5 or more Children | 0 (0.0%) | 0 (0.0%) |
| Total | 0 (0.0%) | 0 (0.0%) |
Race in Bigler
The most populous races in Bigler are White / Caucasian (343 | 72.1%), Two or more Races (133 | 27.9%), and Hispanic or Latino (45 | 9.5%).
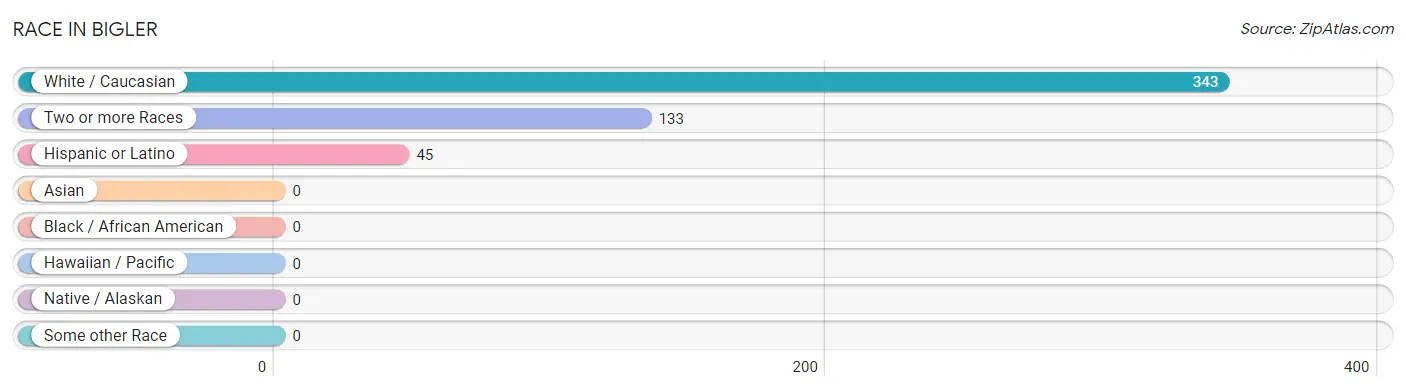
| Race | # Population | % Population |
| Asian | 0 | 0.0% |
| Black / African American | 0 | 0.0% |
| Hawaiian / Pacific | 0 | 0.0% |
| Hispanic or Latino | 45 | 9.5% |
| Native / Alaskan | 0 | 0.0% |
| White / Caucasian | 343 | 72.1% |
| Two or more Races | 133 | 27.9% |
| Some other Race | 0 | 0.0% |
| Total | 476 | 100.0% |
Ancestry in Bigler
The most populous ancestries reported in Bigler are German (152 | 31.9%), Mexican (45 | 9.5%), English (36 | 7.6%), and Irish (16 | 3.4%), together accounting for 52.3% of all Bigler residents.
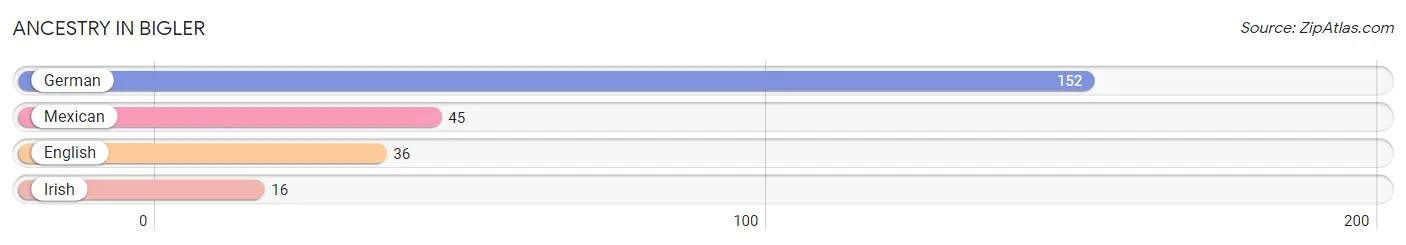
| Ancestry | # Population | % Population |
| English | 36 | 7.6% |
| German | 152 | 31.9% |
| Irish | 16 | 3.4% |
| Mexican | 45 | 9.5% | View All 4 Rows |
Immigrants in Bigler

| Immigration Origin | # Population | % Population | View All 0 Rows |
Sex and Age in Bigler
Sex and Age in Bigler
The most populous age groups in Bigler are 55 to 59 Years (78 | 33.3%) for men and 15 to 19 Years (77 | 31.8%) for women.
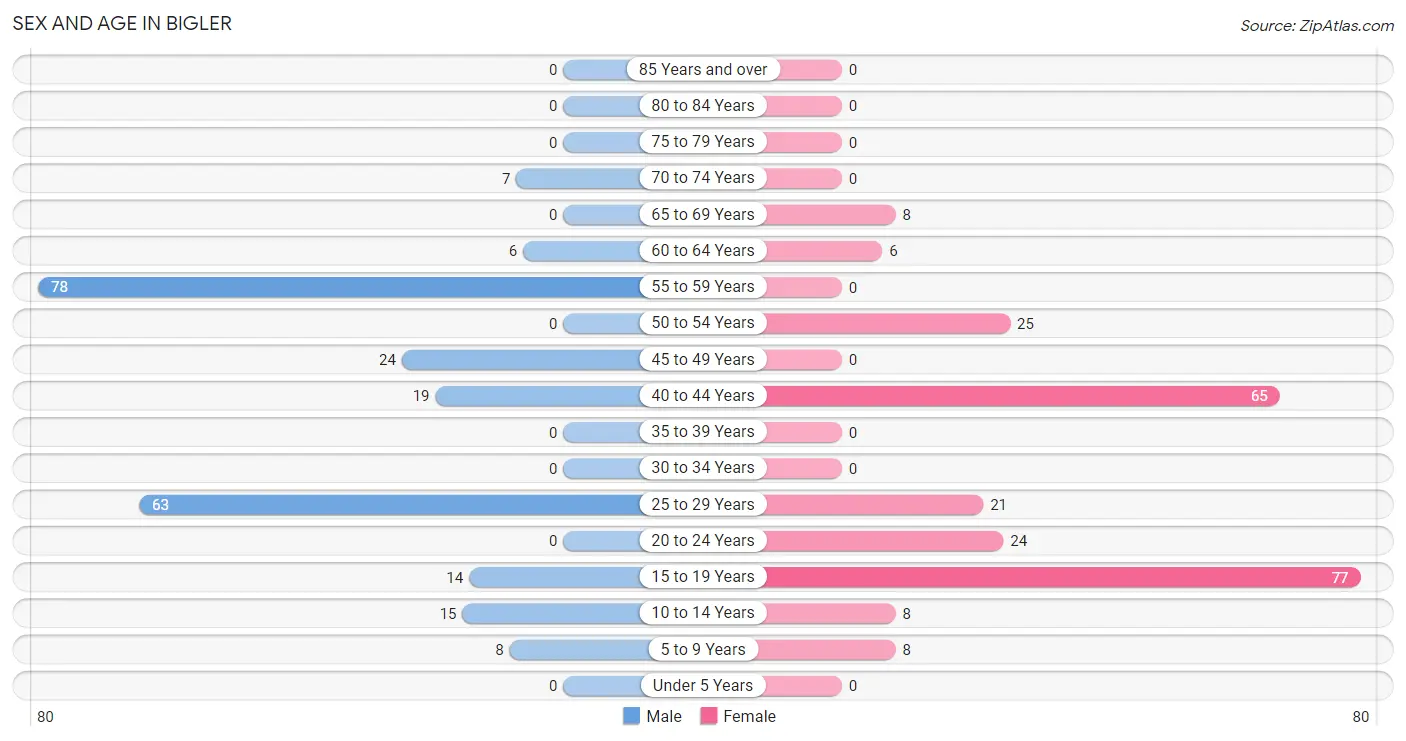
| Age Bracket | Male | Female |
| Under 5 Years | 0 (0.0%) | 0 (0.0%) |
| 5 to 9 Years | 8 (3.4%) | 8 (3.3%) |
| 10 to 14 Years | 15 (6.4%) | 8 (3.3%) |
| 15 to 19 Years | 14 (6.0%) | 77 (31.8%) |
| 20 to 24 Years | 0 (0.0%) | 24 (9.9%) |
| 25 to 29 Years | 63 (26.9%) | 21 (8.7%) |
| 30 to 34 Years | 0 (0.0%) | 0 (0.0%) |
| 35 to 39 Years | 0 (0.0%) | 0 (0.0%) |
| 40 to 44 Years | 19 (8.1%) | 65 (26.9%) |
| 45 to 49 Years | 24 (10.3%) | 0 (0.0%) |
| 50 to 54 Years | 0 (0.0%) | 25 (10.3%) |
| 55 to 59 Years | 78 (33.3%) | 0 (0.0%) |
| 60 to 64 Years | 6 (2.6%) | 6 (2.5%) |
| 65 to 69 Years | 0 (0.0%) | 8 (3.3%) |
| 70 to 74 Years | 7 (3.0%) | 0 (0.0%) |
| 75 to 79 Years | 0 (0.0%) | 0 (0.0%) |
| 80 to 84 Years | 0 (0.0%) | 0 (0.0%) |
| 85 Years and over | 0 (0.0%) | 0 (0.0%) |
| Total | 234 (100.0%) | 242 (100.0%) |
Families and Households in Bigler
Median Family Size in Bigler
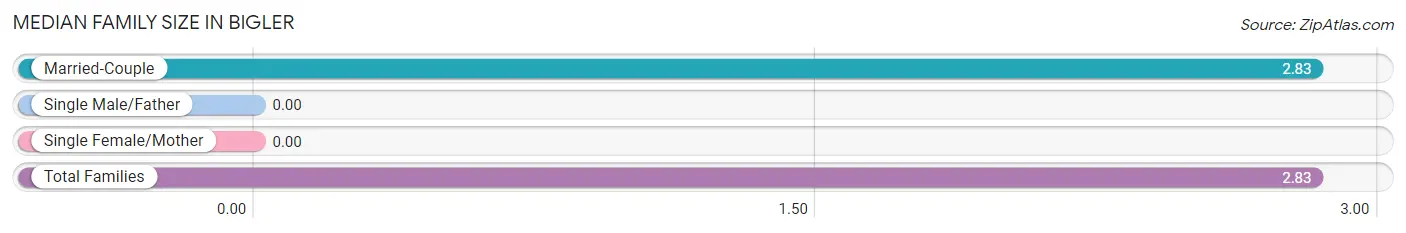
| Family Type | # Families | Family Size |
| Married-Couple | 162 (100.0%) | 2.83 |
| Single Male/Father | 0 (0.0%) | - |
| Single Female/Mother | 0 (0.0%) | - |
| Total Families | 162 (100.0%) | 2.83 |
Median Household Size in Bigler
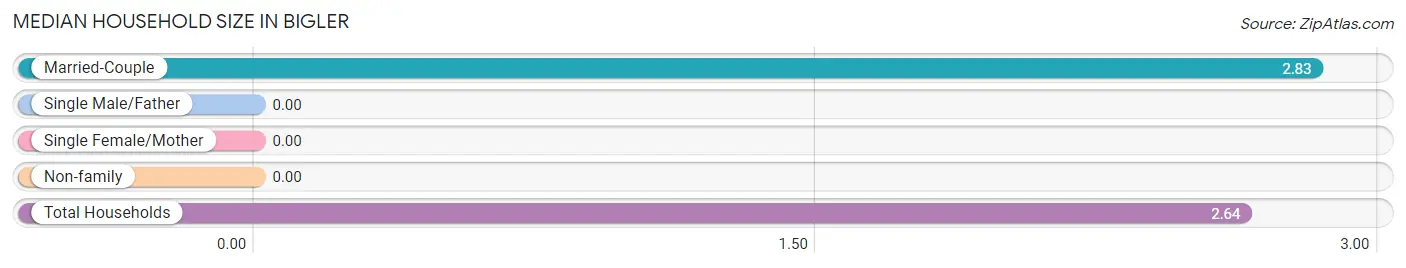
| Household Type | # Households | Household Size |
| Married-Couple | 162 (90.0%) | 2.83 |
| Single Male/Father | 0 (0.0%) | - |
| Single Female/Mother | 0 (0.0%) | - |
| Non-family | 18 (10.0%) | - |
| Total Households | 180 (100.0%) | 2.64 |
Household Size by Marriage Status in Bigler
Out of a total of 180 households in Bigler, 162 (90.0%) are family households, while 18 (10.0%) are nonfamily households. The most numerous type of family households are 2-person households, comprising 89, and the most common type of nonfamily households are 1-person households, comprising 18.
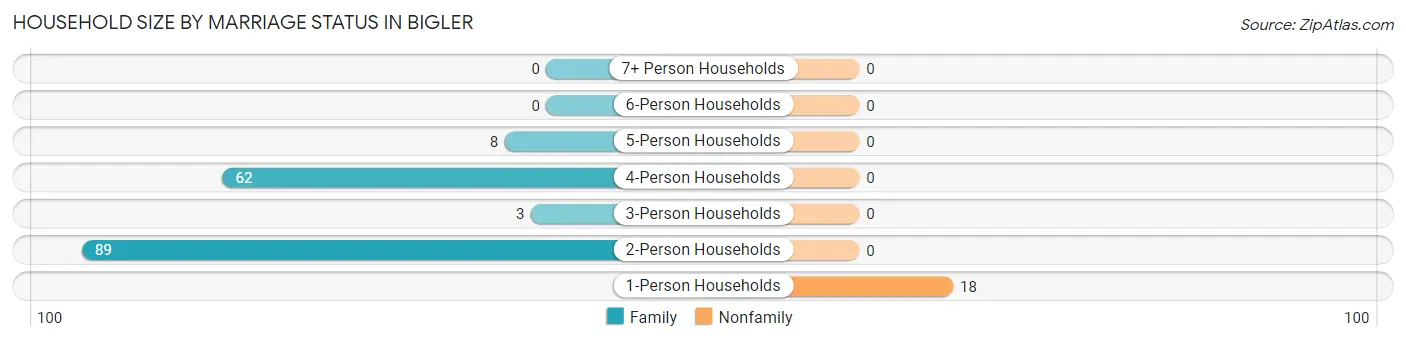
| Household Size | Family Households | Nonfamily Households |
| 1-Person Households | - | 18 (10.0%) |
| 2-Person Households | 89 (49.4%) | 0 (0.0%) |
| 3-Person Households | 3 (1.7%) | 0 (0.0%) |
| 4-Person Households | 62 (34.4%) | 0 (0.0%) |
| 5-Person Households | 8 (4.4%) | 0 (0.0%) |
| 6-Person Households | 0 (0.0%) | 0 (0.0%) |
| 7+ Person Households | 0 (0.0%) | 0 (0.0%) |
| Total | 162 (90.0%) | 18 (10.0%) |
Female Fertility in Bigler
Fertility by Age in Bigler
| Age Bracket | Women with Births | Births / 1,000 Women |
| 15 to 19 years | 0 (0.0%) | 0.0 |
| 20 to 34 years | 0 (0.0%) | 0.0 |
| 35 to 50 years | 0 (0.0%) | 0.0 |
| Total | 0 (0.0%) | 0.0 |
Fertility by Age by Marriage Status in Bigler
| Age Bracket | Married | Unmarried |
| 15 to 19 years | 0 (0.0%) | 0 (0.0%) |
| 20 to 34 years | 0 (0.0%) | 0 (0.0%) |
| 35 to 50 years | 0 (0.0%) | 0 (0.0%) |
| Total | 0 (0.0%) | 0 (0.0%) |
Fertility by Education in Bigler
| Educational Attainment | Women with Births | Births / 1,000 Women |
| Less than High School | 0 (0.0%) | 0.0 |
| High School Diploma | 0 (0.0%) | 0.0 |
| College or Associate's Degree | 0 (0.0%) | 0.0 |
| Bachelor's Degree | 0 (0.0%) | 0.0 |
| Graduate Degree | 0 (0.0%) | 0.0 |
| Total | 0 (0.0%) | 0.0 |
Fertility by Education by Marriage Status in Bigler
| Educational Attainment | Married | Unmarried |
| Less than High School | 0 (0.0%) | 0 (0.0%) |
| High School Diploma | 0 (0.0%) | 0 (0.0%) |
| College or Associate's Degree | 0 (0.0%) | 0 (0.0%) |
| Bachelor's Degree | 0 (0.0%) | 0 (0.0%) |
| Graduate Degree | 0 (0.0%) | 0 (0.0%) |
| Total | 0 (0.0%) | 0 (0.0%) |
Employment Characteristics in Bigler
Employment by Class of Employer in Bigler
Among the 378 employed individuals in Bigler, private company employees (306 | 80.9%), self-employed (not incorporated) (24 | 6.4%), and state government employees (24 | 6.4%) make up the most common classes of employment.
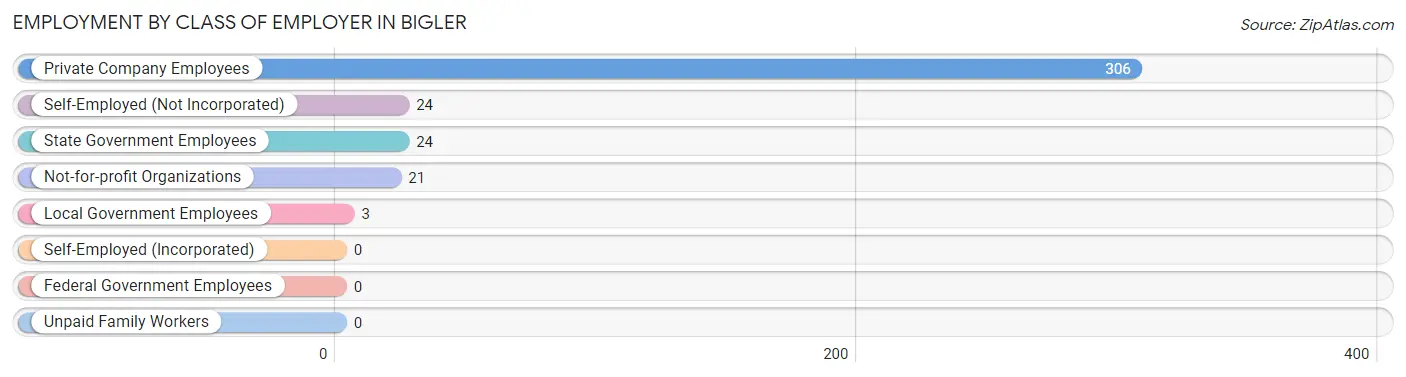
| Employer Class | # Employees | % Employees |
| Private Company Employees | 306 | 80.9% |
| Self-Employed (Incorporated) | 0 | 0.0% |
| Self-Employed (Not Incorporated) | 24 | 6.4% |
| Not-for-profit Organizations | 21 | 5.6% |
| Local Government Employees | 3 | 0.8% |
| State Government Employees | 24 | 6.4% |
| Federal Government Employees | 0 | 0.0% |
| Unpaid Family Workers | 0 | 0.0% |
| Total | 378 | 100.0% |
Employment Status by Age in Bigler
According to the labor force statistics for Bigler, out of the total population over 16 years of age (437), 89.0% or 389 individuals are in the labor force, with 2.8% or 11 of them unemployed. The age group with the highest labor force participation rate is 16 to 19 years, with 100.0% or 91 individuals in the labor force. Within the labor force, the 35 to 44 years age range has the highest percentage of unemployed individuals, with 13.1% or 11 of them being unemployed.
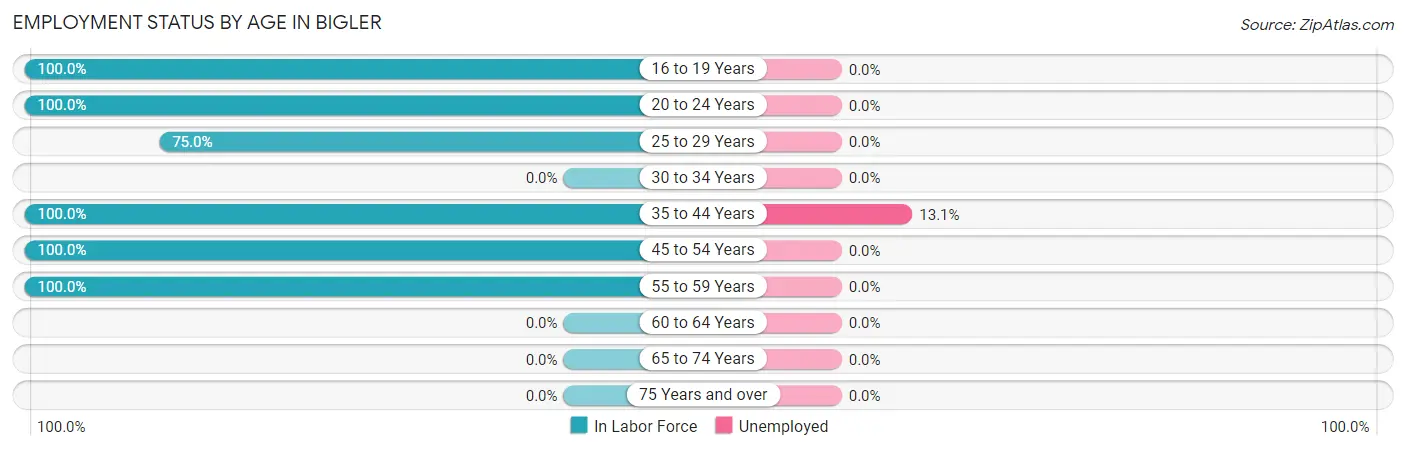
| Age Bracket | In Labor Force | Unemployed |
| 16 to 19 Years | 91 (100.0%) | 0 (0.0%) |
| 20 to 24 Years | 24 (100.0%) | 0 (0.0%) |
| 25 to 29 Years | 63 (75.0%) | 0 (0.0%) |
| 30 to 34 Years | 0 (0.0%) | 0 (0.0%) |
| 35 to 44 Years | 84 (100.0%) | 11 (13.1%) |
| 45 to 54 Years | 49 (100.0%) | 0 (0.0%) |
| 55 to 59 Years | 78 (100.0%) | 0 (0.0%) |
| 60 to 64 Years | 0 (0.0%) | 0 (0.0%) |
| 65 to 74 Years | 0 (0.0%) | 0 (0.0%) |
| 75 Years and over | 0 (0.0%) | 0 (0.0%) |
| Total | 389 (89.0%) | 11 (2.8%) |
Employment Status by Educational Attainment in Bigler
According to labor force statistics for Bigler, 89.3% of individuals (274) out of the total population between 25 and 64 years of age (307) are in the labor force, with 4.0% or 11 of them being unemployed. The group with the highest labor force participation rate are those with the educational attainment of high school diploma, with 100.0% or 89 individuals in the labor force. Within the labor force, individuals with college / associate degree education have the highest percentage of unemployment, with 14.1% or 11 of them being unemployed.
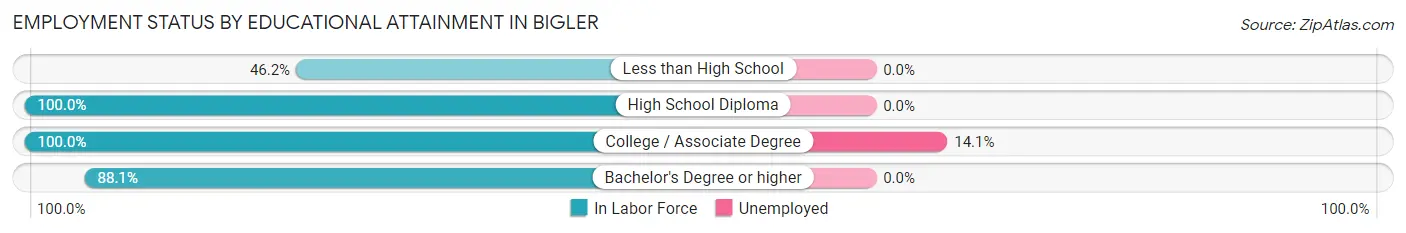
| Educational Attainment | In Labor Force | Unemployed |
| Less than High School | 18 (46.2%) | 0 (0.0%) |
| High School Diploma | 89 (100.0%) | 0 (0.0%) |
| College / Associate Degree | 78 (100.0%) | 11 (14.1%) |
| Bachelor's Degree or higher | 89 (88.1%) | 0 (0.0%) |
| Total | 274 (89.3%) | 12 (4.0%) |
Employment Occupations by Sex in Bigler
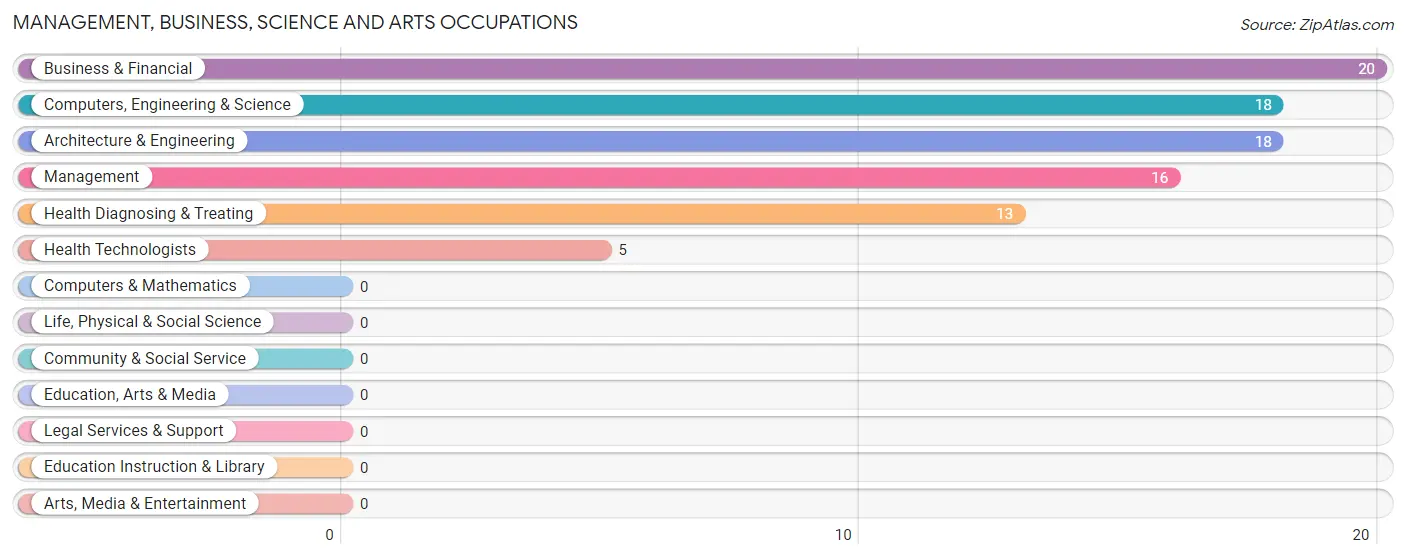
Management, Business, Science and Arts Occupations
The most common Management, Business, Science and Arts occupations in Bigler are Business & Financial (20 | 5.3%), Computers, Engineering & Science (18 | 4.8%), Architecture & Engineering (18 | 4.8%), Management (16 | 4.2%), and Health Diagnosing & Treating (13 | 3.4%).
Management, Business, Science and Arts Occupations by Sex
Within the Management, Business, Science and Arts occupations in Bigler, the most male-oriented occupations are Computers, Engineering & Science (100.0%), and Architecture & Engineering (100.0%), while the most female-oriented occupations are Management (100.0%), Business & Financial (100.0%), and Health Diagnosing & Treating (100.0%).
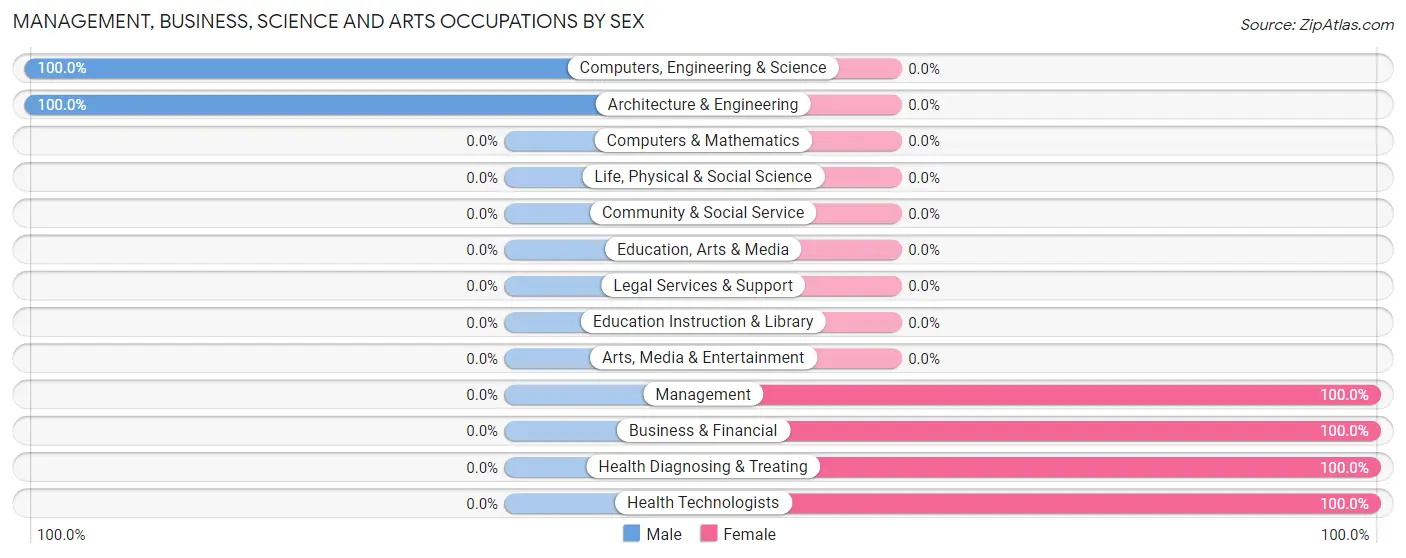
| Occupation | Male | Female |
| Management | 0 (0.0%) | 16 (100.0%) |
| Business & Financial | 0 (0.0%) | 20 (100.0%) |
| Computers, Engineering & Science | 18 (100.0%) | 0 (0.0%) |
| Computers & Mathematics | 0 (0.0%) | 0 (0.0%) |
| Architecture & Engineering | 18 (100.0%) | 0 (0.0%) |
| Life, Physical & Social Science | 0 (0.0%) | 0 (0.0%) |
| Community & Social Service | 0 (0.0%) | 0 (0.0%) |
| Education, Arts & Media | 0 (0.0%) | 0 (0.0%) |
| Legal Services & Support | 0 (0.0%) | 0 (0.0%) |
| Education Instruction & Library | 0 (0.0%) | 0 (0.0%) |
| Arts, Media & Entertainment | 0 (0.0%) | 0 (0.0%) |
| Health Diagnosing & Treating | 0 (0.0%) | 13 (100.0%) |
| Health Technologists | 0 (0.0%) | 5 (100.0%) |
| Total (Category) | 18 (26.9%) | 49 (73.1%) |
| Total (Overall) | 187 (49.5%) | 191 (50.5%) |
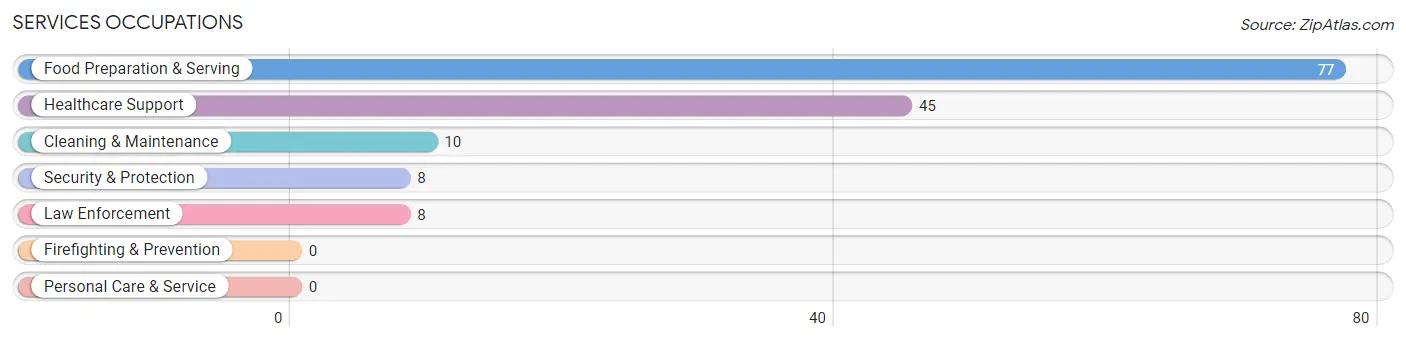
Services Occupations
The most common Services occupations in Bigler are Food Preparation & Serving (77 | 20.4%), Healthcare Support (45 | 11.9%), Cleaning & Maintenance (10 | 2.6%), Security & Protection (8 | 2.1%), and Law Enforcement (8 | 2.1%).
Services Occupations by Sex
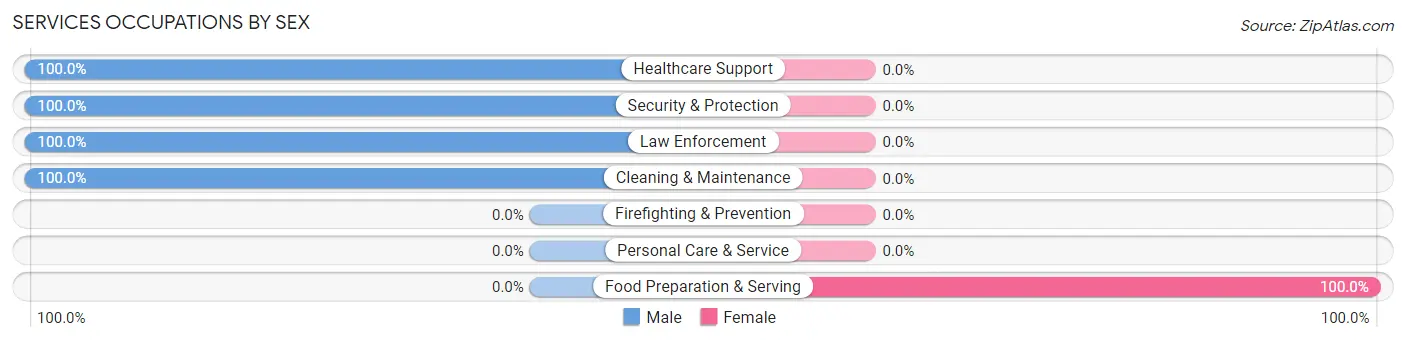
| Occupation | Male | Female |
| Healthcare Support | 45 (100.0%) | 0 (0.0%) |
| Security & Protection | 8 (100.0%) | 0 (0.0%) |
| Firefighting & Prevention | 0 (0.0%) | 0 (0.0%) |
| Law Enforcement | 8 (100.0%) | 0 (0.0%) |
| Food Preparation & Serving | 0 (0.0%) | 77 (100.0%) |
| Cleaning & Maintenance | 10 (100.0%) | 0 (0.0%) |
| Personal Care & Service | 0 (0.0%) | 0 (0.0%) |
| Total (Category) | 63 (45.0%) | 77 (55.0%) |
| Total (Overall) | 187 (49.5%) | 191 (50.5%) |
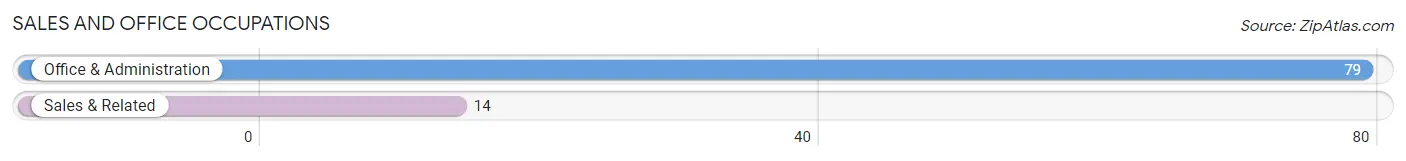
Sales and Office Occupations
The most common Sales and Office occupations in Bigler are Office & Administration (79 | 20.9%), and Sales & Related (14 | 3.7%).
Sales and Office Occupations by Sex
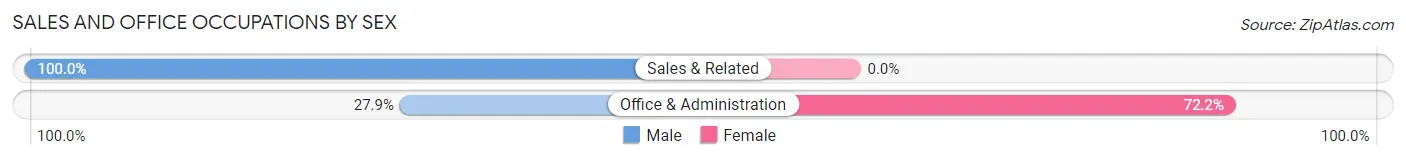
| Occupation | Male | Female |
| Sales & Related | 14 (100.0%) | 0 (0.0%) |
| Office & Administration | 22 (27.9%) | 57 (72.2%) |
| Total (Category) | 36 (38.7%) | 57 (61.3%) |
| Total (Overall) | 187 (49.5%) | 191 (50.5%) |
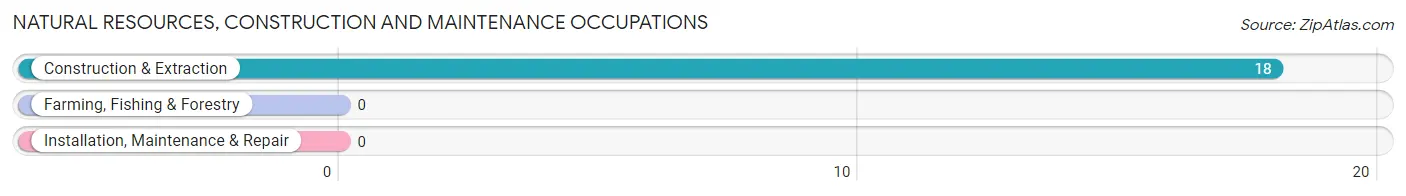
Natural Resources, Construction and Maintenance Occupations
The most common Natural Resources, Construction and Maintenance occupations in Bigler are , and Construction & Extraction (18 | 4.8%).
Natural Resources, Construction and Maintenance Occupations by Sex
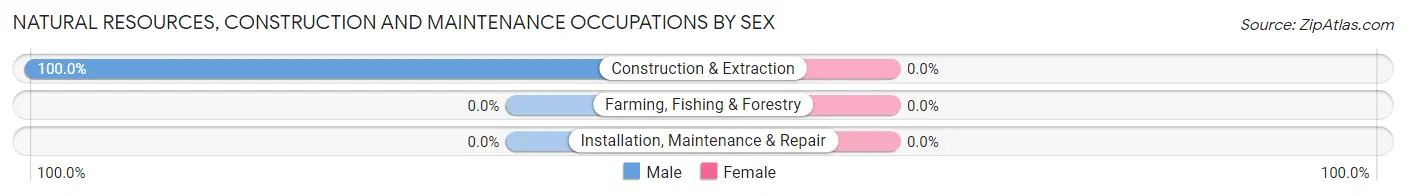
| Occupation | Male | Female |
| Farming, Fishing & Forestry | 0 (0.0%) | 0 (0.0%) |
| Construction & Extraction | 18 (100.0%) | 0 (0.0%) |
| Installation, Maintenance & Repair | 0 (0.0%) | 0 (0.0%) |
| Total (Category) | 18 (100.0%) | 0 (0.0%) |
| Total (Overall) | 187 (49.5%) | 191 (50.5%) |
Production, Transportation and Moving Occupations
The most common Production, Transportation and Moving occupations in Bigler are Production (52 | 13.8%), and Material Moving (8 | 2.1%).
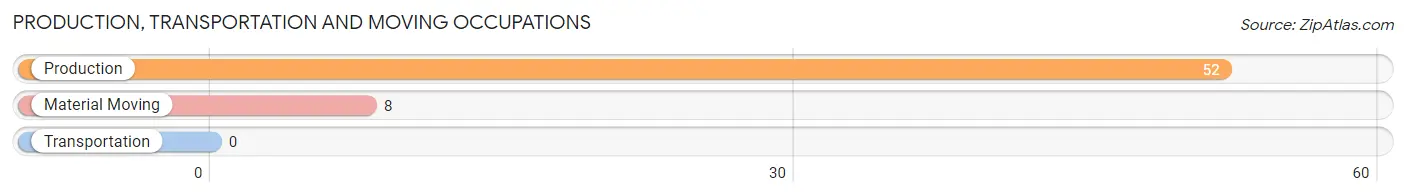
Production, Transportation and Moving Occupations by Sex
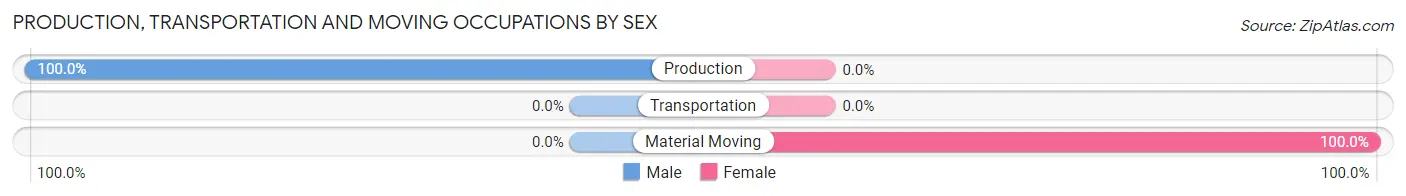
| Occupation | Male | Female |
| Production | 52 (100.0%) | 0 (0.0%) |
| Transportation | 0 (0.0%) | 0 (0.0%) |
| Material Moving | 0 (0.0%) | 8 (100.0%) |
| Total (Category) | 52 (86.7%) | 8 (13.3%) |
| Total (Overall) | 187 (49.5%) | 191 (50.5%) |
Employment Industries by Sex in Bigler
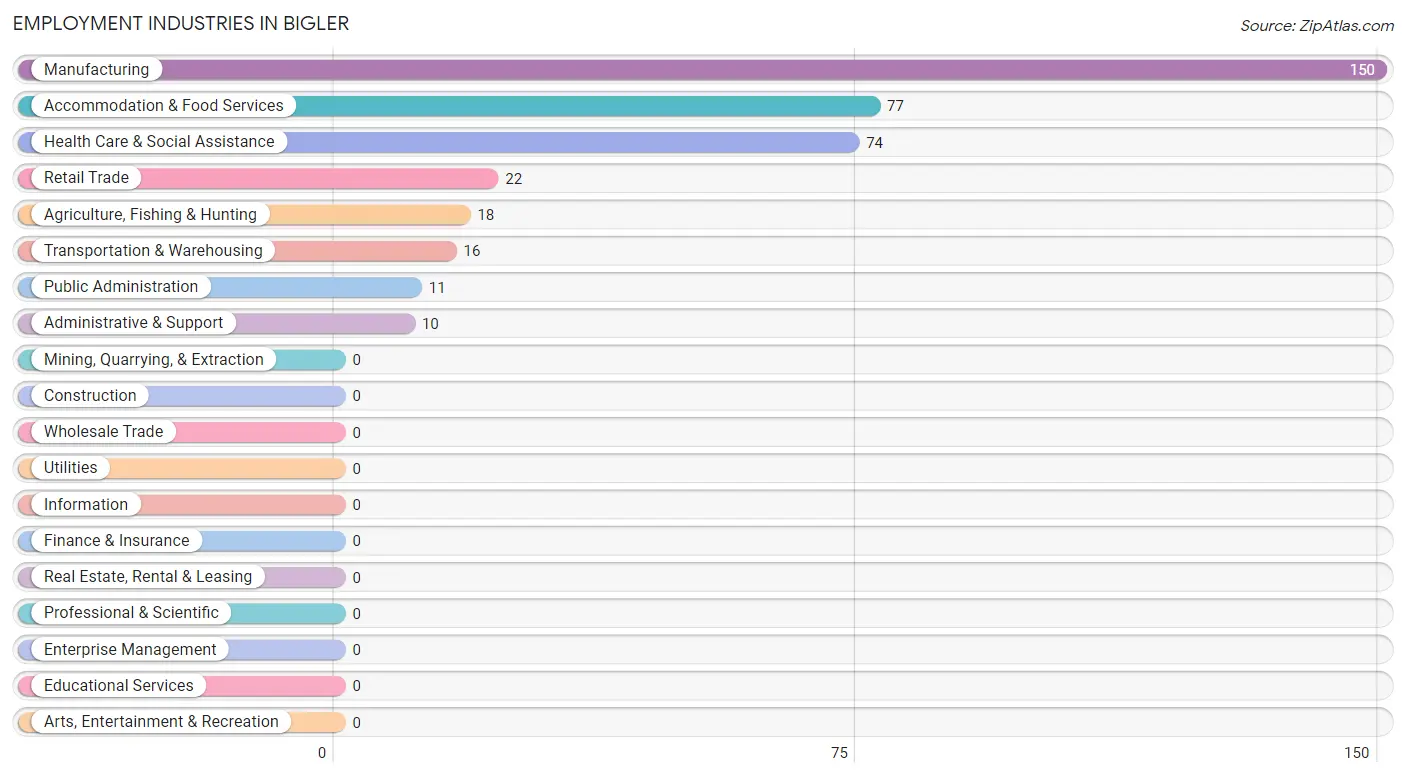
Employment Industries in Bigler
The major employment industries in Bigler include Manufacturing (150 | 39.7%), Accommodation & Food Services (77 | 20.4%), Health Care & Social Assistance (74 | 19.6%), Retail Trade (22 | 5.8%), and Agriculture, Fishing & Hunting (18 | 4.8%).
Employment Industries by Sex in Bigler
The Bigler industries that see more men than women are Agriculture, Fishing & Hunting (100.0%), Administrative & Support (100.0%), and Public Administration (100.0%), whereas the industries that tend to have a higher number of women are Transportation & Warehousing (100.0%), Accommodation & Food Services (100.0%), and Manufacturing (40.7%).
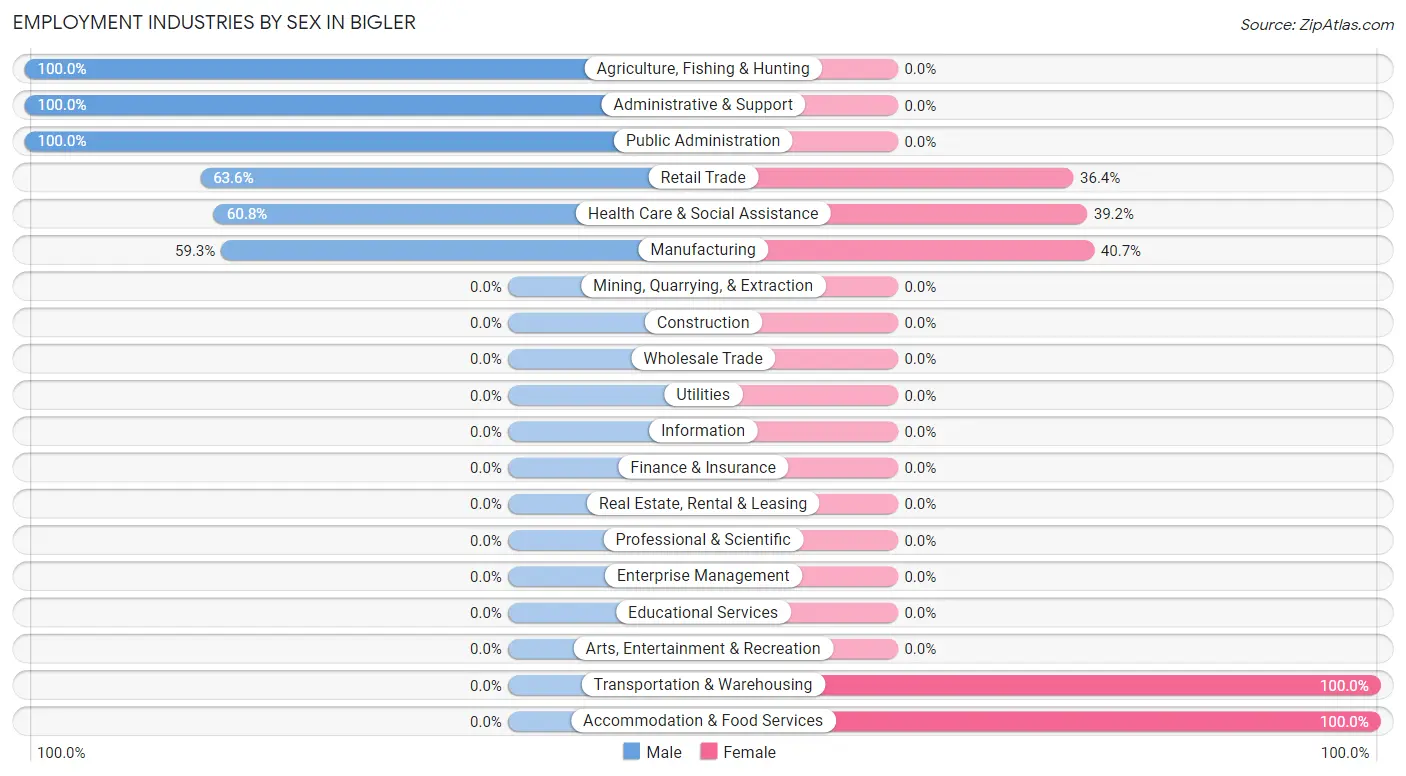
| Industry | Male | Female |
| Agriculture, Fishing & Hunting | 18 (100.0%) | 0 (0.0%) |
| Mining, Quarrying, & Extraction | 0 (0.0%) | 0 (0.0%) |
| Construction | 0 (0.0%) | 0 (0.0%) |
| Manufacturing | 89 (59.3%) | 61 (40.7%) |
| Wholesale Trade | 0 (0.0%) | 0 (0.0%) |
| Retail Trade | 14 (63.6%) | 8 (36.4%) |
| Transportation & Warehousing | 0 (0.0%) | 16 (100.0%) |
| Utilities | 0 (0.0%) | 0 (0.0%) |
| Information | 0 (0.0%) | 0 (0.0%) |
| Finance & Insurance | 0 (0.0%) | 0 (0.0%) |
| Real Estate, Rental & Leasing | 0 (0.0%) | 0 (0.0%) |
| Professional & Scientific | 0 (0.0%) | 0 (0.0%) |
| Enterprise Management | 0 (0.0%) | 0 (0.0%) |
| Administrative & Support | 10 (100.0%) | 0 (0.0%) |
| Educational Services | 0 (0.0%) | 0 (0.0%) |
| Health Care & Social Assistance | 45 (60.8%) | 29 (39.2%) |
| Arts, Entertainment & Recreation | 0 (0.0%) | 0 (0.0%) |
| Accommodation & Food Services | 0 (0.0%) | 77 (100.0%) |
| Public Administration | 11 (100.0%) | 0 (0.0%) |
| Total | 187 (49.5%) | 191 (50.5%) |
Education in Bigler
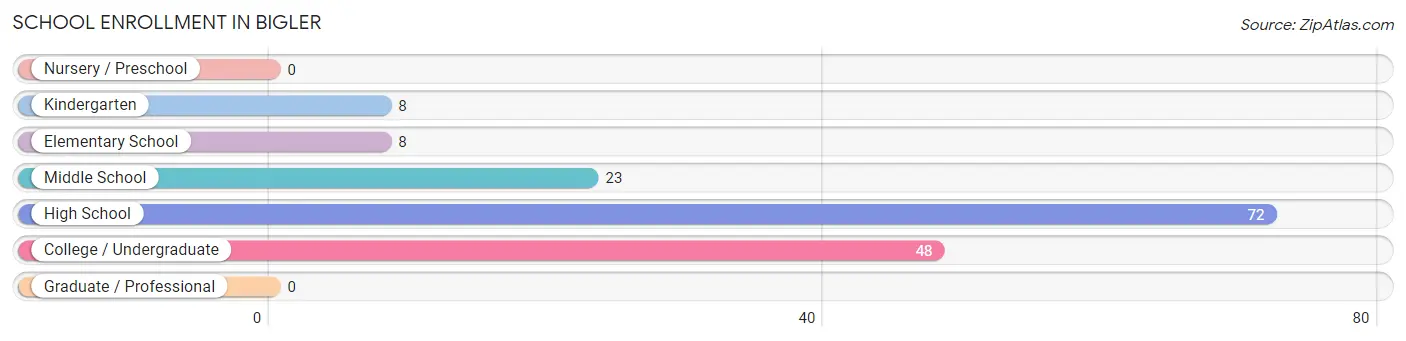
School Enrollment in Bigler
The most common levels of schooling among the 159 students in Bigler are high school (72 | 45.3%), college / undergraduate (48 | 30.2%), and middle school (23 | 14.5%).
| School Level | # Students | % Students |
| Nursery / Preschool | 0 | 0.0% |
| Kindergarten | 8 | 5.0% |
| Elementary School | 8 | 5.0% |
| Middle School | 23 | 14.5% |
| High School | 72 | 45.3% |
| College / Undergraduate | 48 | 30.2% |
| Graduate / Professional | 0 | 0.0% |
| Total | 159 | 100.0% |
School Enrollment by Age by Funding Source in Bigler
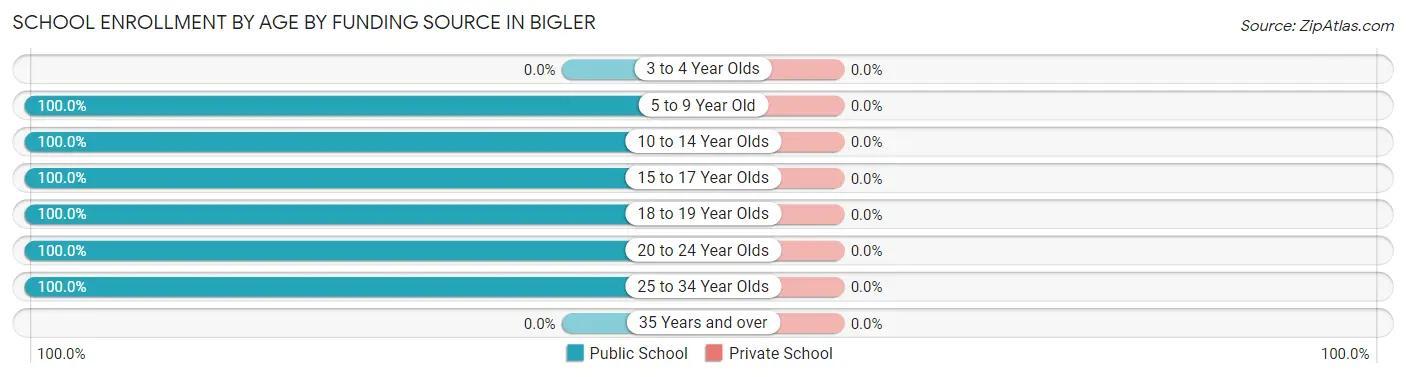
| Age Bracket | Public School | Private School |
| 3 to 4 Year Olds | 0 (0.0%) | 0 (0.0%) |
| 5 to 9 Year Old | 16 (100.0%) | 0 (0.0%) |
| 10 to 14 Year Olds | 23 (100.0%) | 0 (0.0%) |
| 15 to 17 Year Olds | 51 (100.0%) | 0 (0.0%) |
| 18 to 19 Year Olds | 40 (100.0%) | 0 (0.0%) |
| 20 to 24 Year Olds | 8 (100.0%) | 0 (0.0%) |
| 25 to 34 Year Olds | 21 (100.0%) | 0 (0.0%) |
| 35 Years and over | 0 (0.0%) | 0 (0.0%) |
| Total | 159 (100.0%) | 0 (0.0%) |
Educational Attainment by Field of Study in Bigler
Liberal arts & history (45 | 44.6%), bio, nature & agricultural (20 | 19.8%), education (19 | 18.8%), engineering (6 | 5.9%), and business (6 | 5.9%) are the most common fields of study among 101 individuals in Bigler who have obtained a bachelor's degree or higher.
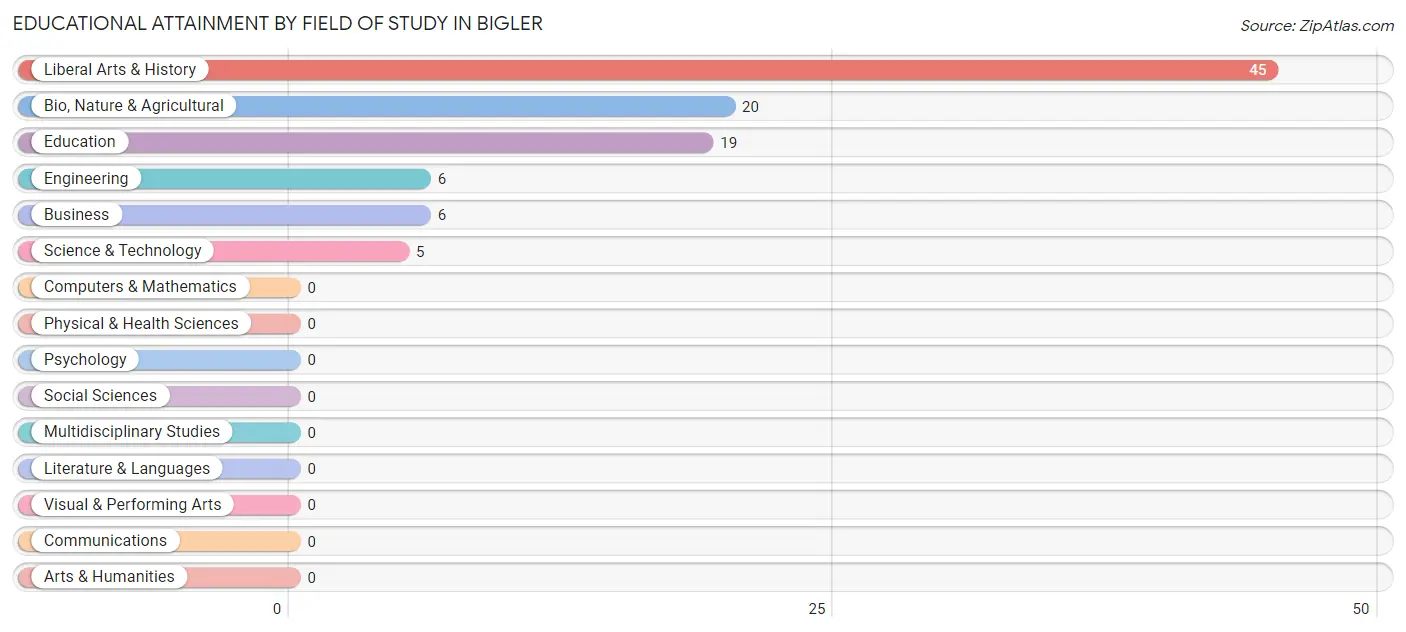
| Field of Study | # Graduates | % Graduates |
| Computers & Mathematics | 0 | 0.0% |
| Bio, Nature & Agricultural | 20 | 19.8% |
| Physical & Health Sciences | 0 | 0.0% |
| Psychology | 0 | 0.0% |
| Social Sciences | 0 | 0.0% |
| Engineering | 6 | 5.9% |
| Multidisciplinary Studies | 0 | 0.0% |
| Science & Technology | 5 | 5.0% |
| Business | 6 | 5.9% |
| Education | 19 | 18.8% |
| Literature & Languages | 0 | 0.0% |
| Liberal Arts & History | 45 | 44.6% |
| Visual & Performing Arts | 0 | 0.0% |
| Communications | 0 | 0.0% |
| Arts & Humanities | 0 | 0.0% |
| Total | 101 | 100.0% |
Transportation & Commute in Bigler
Vehicle Availability by Sex in Bigler
The most prevalent vehicle ownership categories in Bigler are males with 2 vehicles (73, accounting for 39.0%) and females with 2 vehicles (32, making up 38.2%).
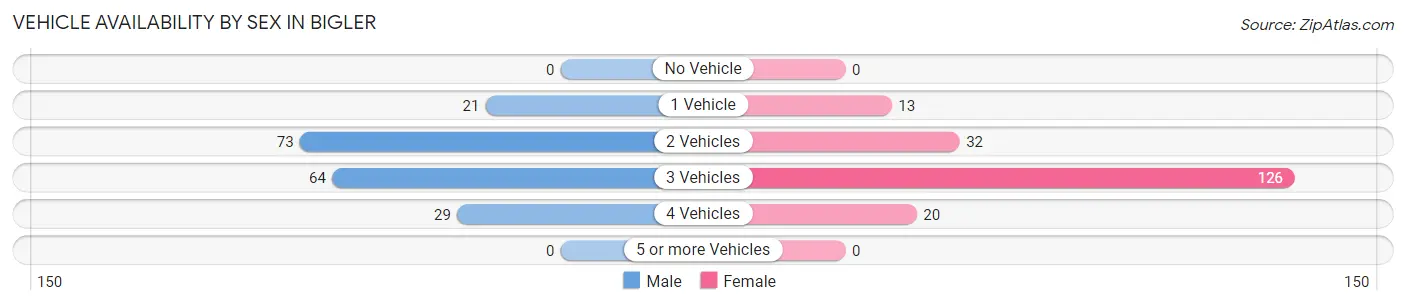
| Vehicles Available | Male | Female |
| No Vehicle | 0 (0.0%) | 0 (0.0%) |
| 1 Vehicle | 21 (11.2%) | 13 (6.8%) |
| 2 Vehicles | 73 (39.0%) | 32 (16.8%) |
| 3 Vehicles | 64 (34.2%) | 126 (66.0%) |
| 4 Vehicles | 29 (15.5%) | 20 (10.5%) |
| 5 or more Vehicles | 0 (0.0%) | 0 (0.0%) |
| Total | 187 (100.0%) | 191 (100.0%) |
Commute Time in Bigler
The most frequently occuring commute durations in Bigler are 15 to 19 minutes (101 commuters, 31.5%), 20 to 24 minutes (94 commuters, 29.3%), and 5 to 9 minutes (54 commuters, 16.8%).
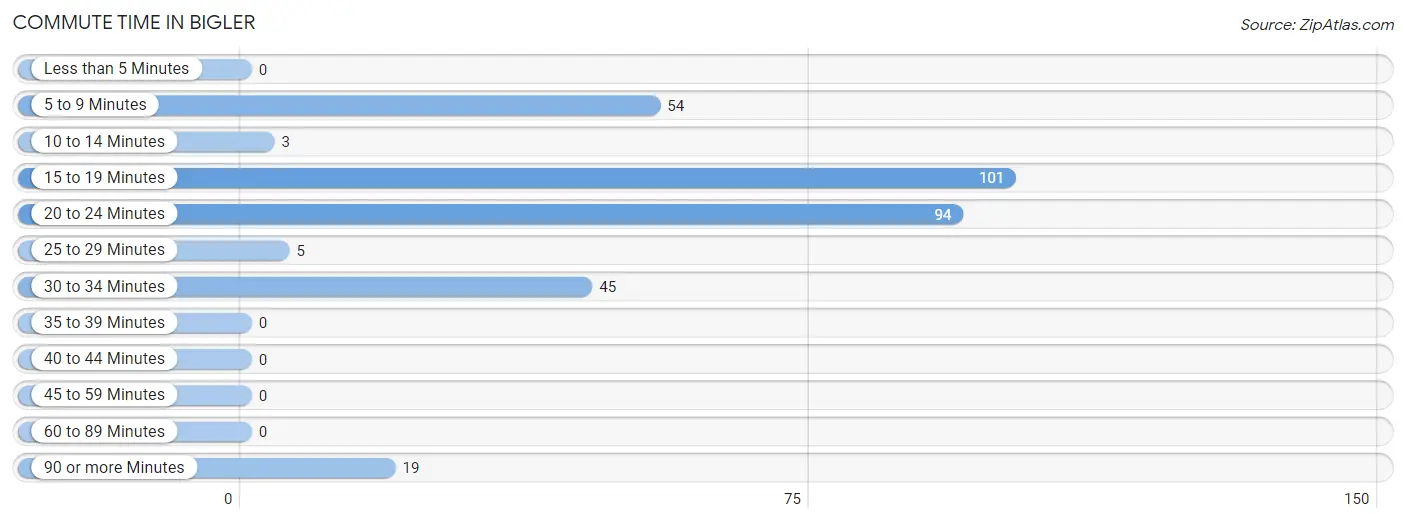
| Commute Time | # Commuters | % Commuters |
| Less than 5 Minutes | 0 | 0.0% |
| 5 to 9 Minutes | 54 | 16.8% |
| 10 to 14 Minutes | 3 | 0.9% |
| 15 to 19 Minutes | 101 | 31.5% |
| 20 to 24 Minutes | 94 | 29.3% |
| 25 to 29 Minutes | 5 | 1.6% |
| 30 to 34 Minutes | 45 | 14.0% |
| 35 to 39 Minutes | 0 | 0.0% |
| 40 to 44 Minutes | 0 | 0.0% |
| 45 to 59 Minutes | 0 | 0.0% |
| 60 to 89 Minutes | 0 | 0.0% |
| 90 or more Minutes | 19 | 5.9% |
Commute Time by Sex in Bigler
The most common commute times in Bigler are 15 to 19 minutes (101 commuters, 54.0%) for males and 20 to 24 minutes (84 commuters, 62.7%) for females.
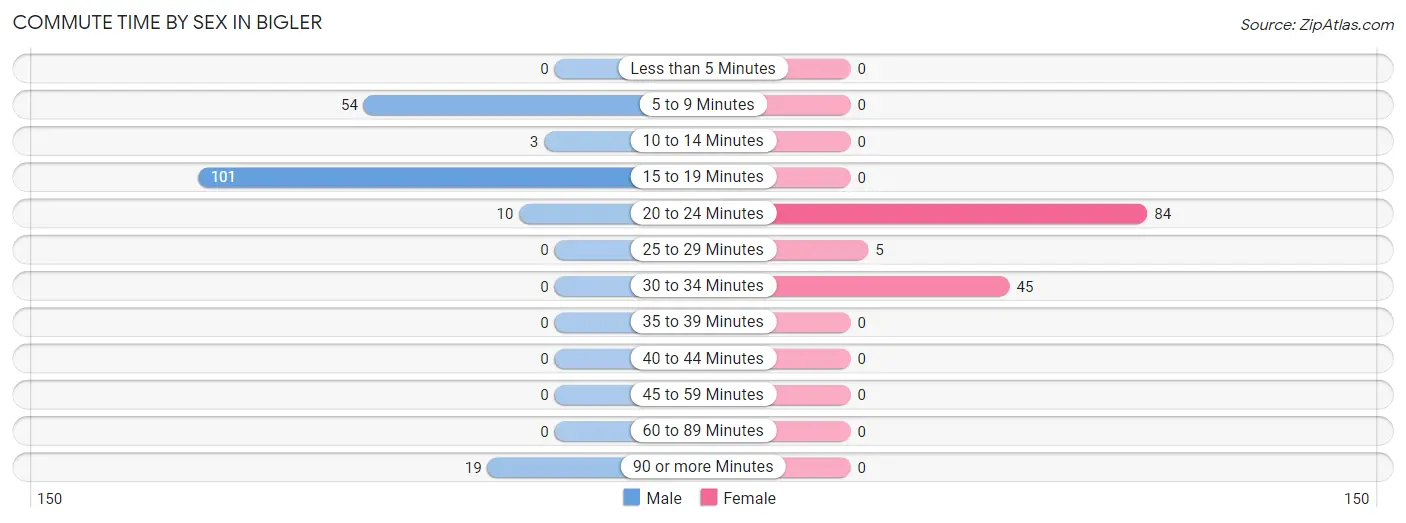
| Commute Time | Male | Female |
| Less than 5 Minutes | 0 (0.0%) | 0 (0.0%) |
| 5 to 9 Minutes | 54 (28.9%) | 0 (0.0%) |
| 10 to 14 Minutes | 3 (1.6%) | 0 (0.0%) |
| 15 to 19 Minutes | 101 (54.0%) | 0 (0.0%) |
| 20 to 24 Minutes | 10 (5.3%) | 84 (62.7%) |
| 25 to 29 Minutes | 0 (0.0%) | 5 (3.7%) |
| 30 to 34 Minutes | 0 (0.0%) | 45 (33.6%) |
| 35 to 39 Minutes | 0 (0.0%) | 0 (0.0%) |
| 40 to 44 Minutes | 0 (0.0%) | 0 (0.0%) |
| 45 to 59 Minutes | 0 (0.0%) | 0 (0.0%) |
| 60 to 89 Minutes | 0 (0.0%) | 0 (0.0%) |
| 90 or more Minutes | 19 (10.2%) | 0 (0.0%) |
Time of Departure to Work by Sex in Bigler
The most frequent times of departure to work in Bigler are 7:30 AM to 7:59 AM (97, 51.9%) for males and 12:00 PM to 3:59 PM (40, 29.8%) for females.
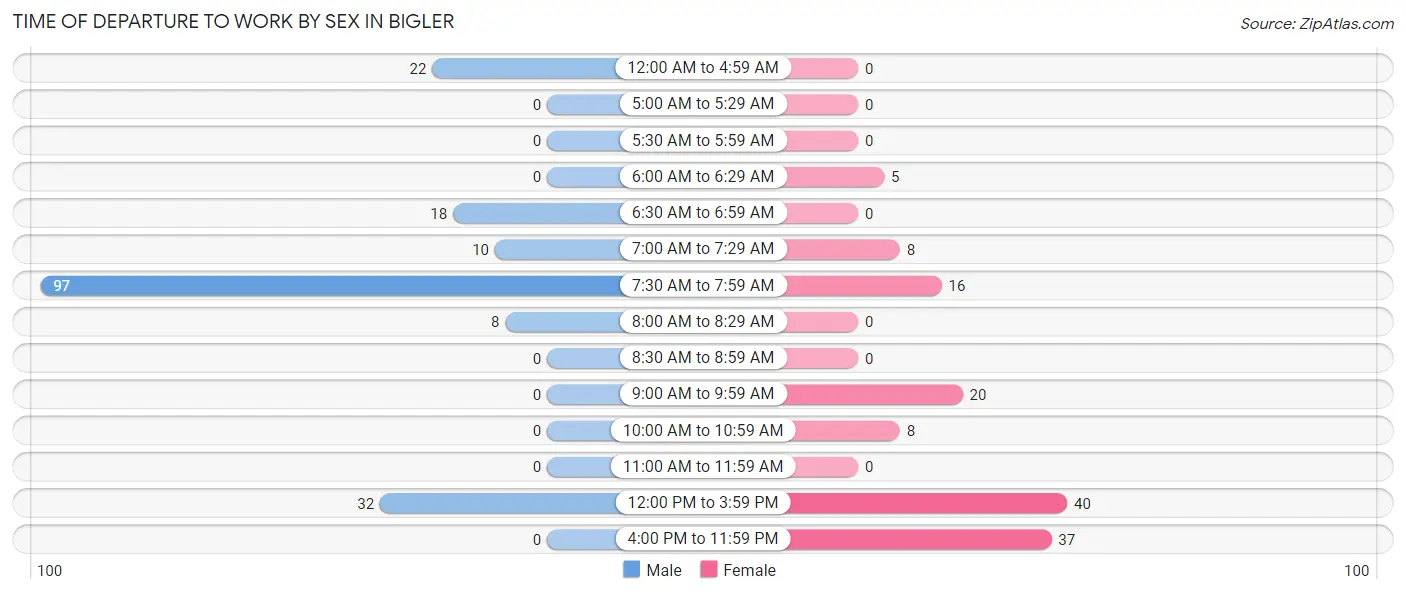
| Time of Departure | Male | Female |
| 12:00 AM to 4:59 AM | 22 (11.8%) | 0 (0.0%) |
| 5:00 AM to 5:29 AM | 0 (0.0%) | 0 (0.0%) |
| 5:30 AM to 5:59 AM | 0 (0.0%) | 0 (0.0%) |
| 6:00 AM to 6:29 AM | 0 (0.0%) | 5 (3.7%) |
| 6:30 AM to 6:59 AM | 18 (9.6%) | 0 (0.0%) |
| 7:00 AM to 7:29 AM | 10 (5.3%) | 8 (6.0%) |
| 7:30 AM to 7:59 AM | 97 (51.9%) | 16 (11.9%) |
| 8:00 AM to 8:29 AM | 8 (4.3%) | 0 (0.0%) |
| 8:30 AM to 8:59 AM | 0 (0.0%) | 0 (0.0%) |
| 9:00 AM to 9:59 AM | 0 (0.0%) | 20 (14.9%) |
| 10:00 AM to 10:59 AM | 0 (0.0%) | 8 (6.0%) |
| 11:00 AM to 11:59 AM | 0 (0.0%) | 0 (0.0%) |
| 12:00 PM to 3:59 PM | 32 (17.1%) | 40 (29.8%) |
| 4:00 PM to 11:59 PM | 0 (0.0%) | 37 (27.6%) |
| Total | 187 (100.0%) | 134 (100.0%) |
Housing Occupancy in Bigler
Occupancy by Ownership in Bigler
Of the total 180 dwellings in Bigler, owner-occupied units account for 162 (90.0%), while renter-occupied units make up 18 (10.0%).
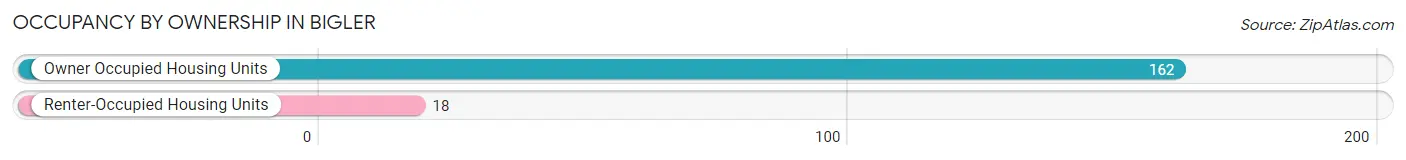
| Occupancy | # Housing Units | % Housing Units |
| Owner Occupied Housing Units | 162 | 90.0% |
| Renter-Occupied Housing Units | 18 | 10.0% |
| Total Occupied Housing Units | 180 | 100.0% |
Occupancy by Household Size in Bigler
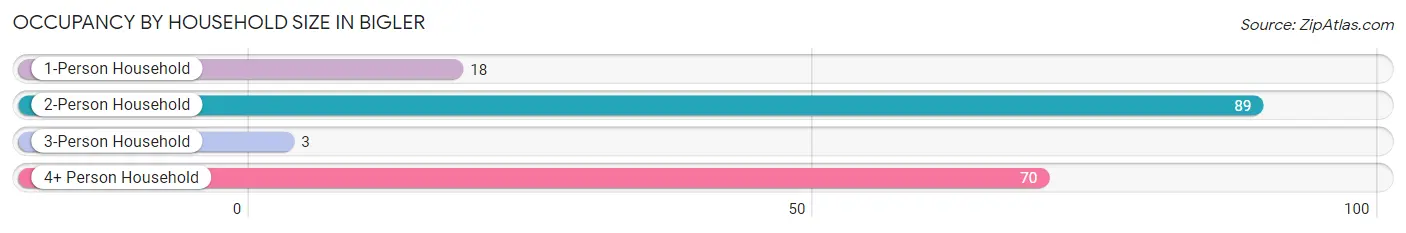
| Household Size | # Housing Units | % Housing Units |
| 1-Person Household | 18 | 10.0% |
| 2-Person Household | 89 | 49.4% |
| 3-Person Household | 3 | 1.7% |
| 4+ Person Household | 70 | 38.9% |
| Total Housing Units | 180 | 100.0% |
Occupancy by Ownership by Household Size in Bigler
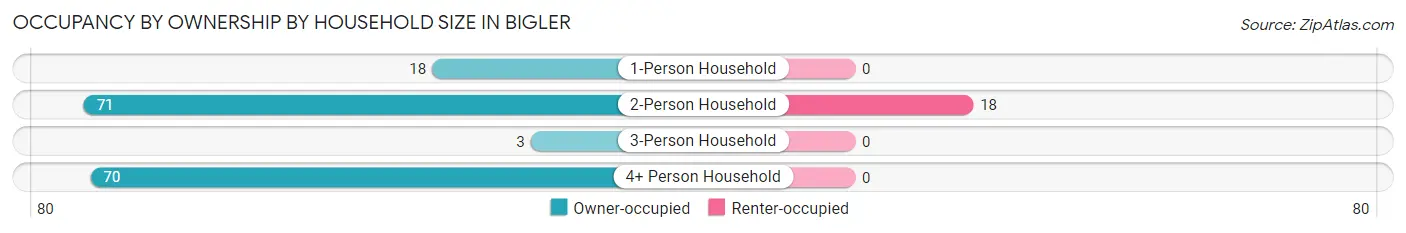
| Household Size | Owner-occupied | Renter-occupied |
| 1-Person Household | 18 (100.0%) | 0 (0.0%) |
| 2-Person Household | 71 (79.8%) | 18 (20.2%) |
| 3-Person Household | 3 (100.0%) | 0 (0.0%) |
| 4+ Person Household | 70 (100.0%) | 0 (0.0%) |
| Total Housing Units | 162 (90.0%) | 18 (10.0%) |
Occupancy by Educational Attainment in Bigler
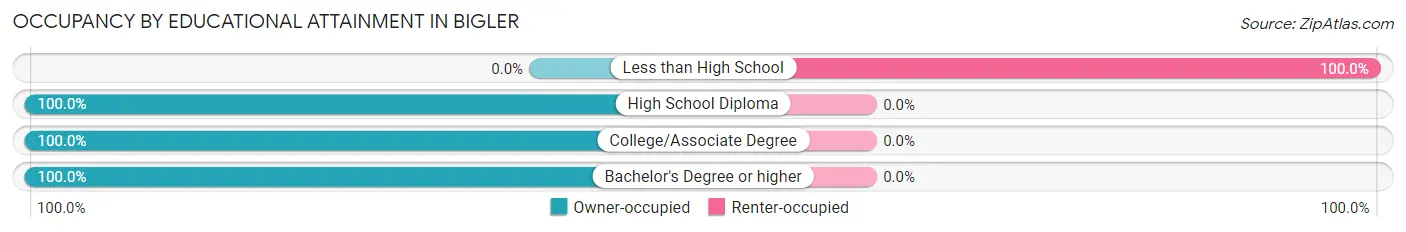
| Household Size | Owner-occupied | Renter-occupied |
| Less than High School | 0 (0.0%) | 18 (100.0%) |
| High School Diploma | 83 (100.0%) | 0 (0.0%) |
| College/Associate Degree | 8 (100.0%) | 0 (0.0%) |
| Bachelor's Degree or higher | 71 (100.0%) | 0 (0.0%) |
Occupancy by Age of Householder in Bigler
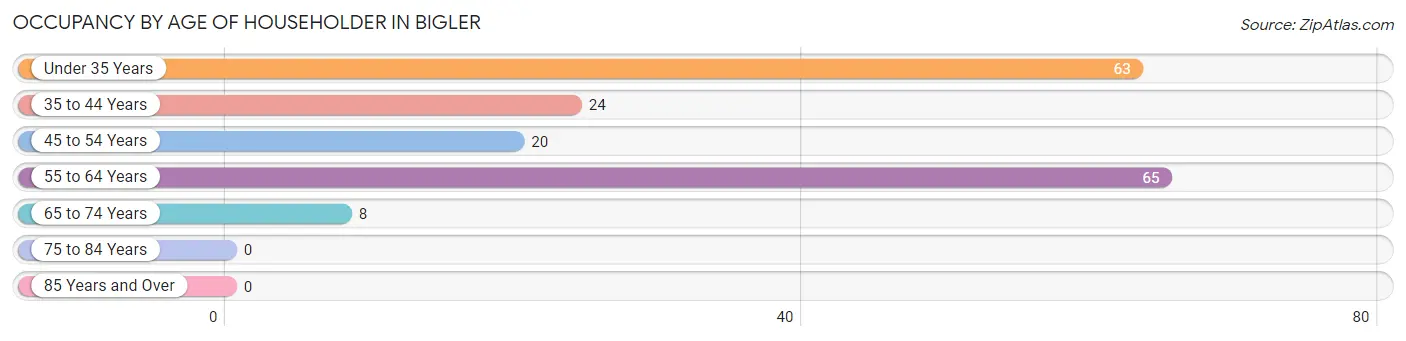
| Age Bracket | # Households | % Households |
| Under 35 Years | 63 | 35.0% |
| 35 to 44 Years | 24 | 13.3% |
| 45 to 54 Years | 20 | 11.1% |
| 55 to 64 Years | 65 | 36.1% |
| 65 to 74 Years | 8 | 4.4% |
| 75 to 84 Years | 0 | 0.0% |
| 85 Years and Over | 0 | 0.0% |
| Total | 180 | 100.0% |
Housing Finances in Bigler
Median Income by Occupancy in Bigler
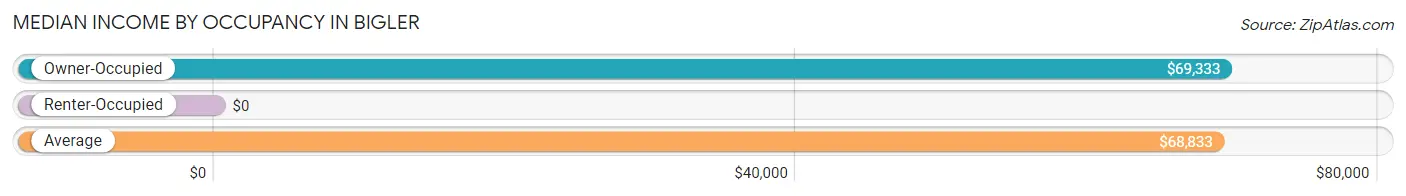
| Occupancy Type | # Households | Median Income |
| Owner-Occupied | 162 (90.0%) | $69,333 |
| Renter-Occupied | 18 (10.0%) | $0 |
| Average | 180 (100.0%) | $68,833 |
Occupancy by Householder Income Bracket in Bigler
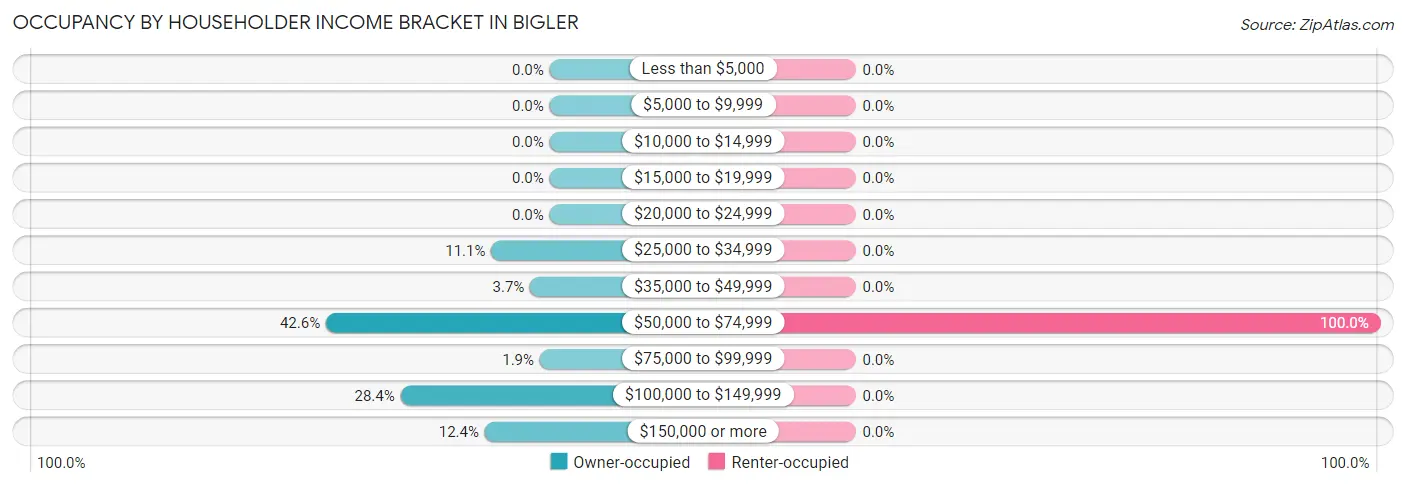
| Income Bracket | Owner-occupied | Renter-occupied |
| Less than $5,000 | 0 (0.0%) | 0 (0.0%) |
| $5,000 to $9,999 | 0 (0.0%) | 0 (0.0%) |
| $10,000 to $14,999 | 0 (0.0%) | 0 (0.0%) |
| $15,000 to $19,999 | 0 (0.0%) | 0 (0.0%) |
| $20,000 to $24,999 | 0 (0.0%) | 0 (0.0%) |
| $25,000 to $34,999 | 18 (11.1%) | 0 (0.0%) |
| $35,000 to $49,999 | 6 (3.7%) | 0 (0.0%) |
| $50,000 to $74,999 | 69 (42.6%) | 18 (100.0%) |
| $75,000 to $99,999 | 3 (1.8%) | 0 (0.0%) |
| $100,000 to $149,999 | 46 (28.4%) | 0 (0.0%) |
| $150,000 or more | 20 (12.3%) | 0 (0.0%) |
| Total | 162 (100.0%) | 18 (100.0%) |
Monthly Housing Cost Tiers in Bigler
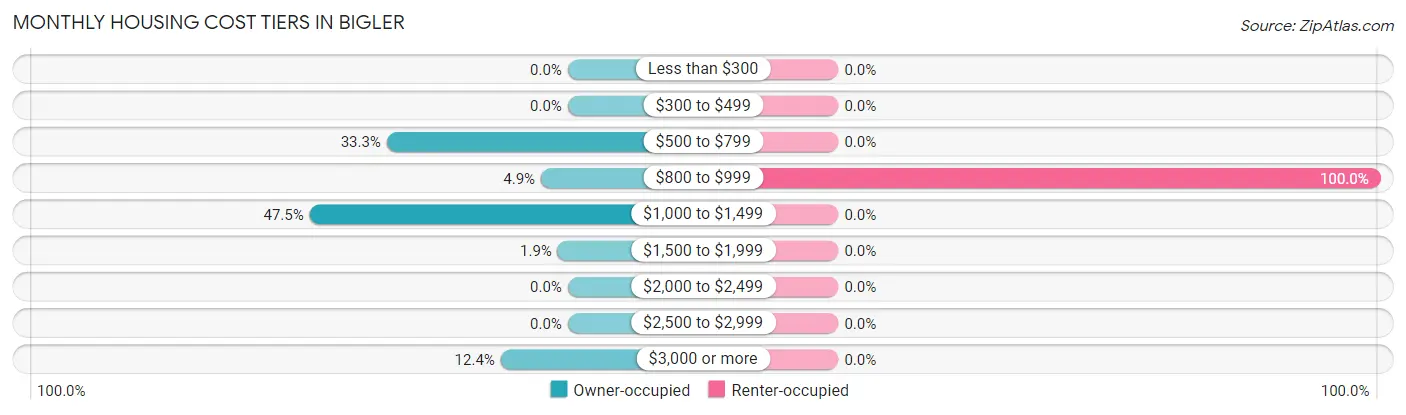
| Monthly Cost | Owner-occupied | Renter-occupied |
| Less than $300 | 0 (0.0%) | 0 (0.0%) |
| $300 to $499 | 0 (0.0%) | 0 (0.0%) |
| $500 to $799 | 54 (33.3%) | 0 (0.0%) |
| $800 to $999 | 8 (4.9%) | 18 (100.0%) |
| $1,000 to $1,499 | 77 (47.5%) | 0 (0.0%) |
| $1,500 to $1,999 | 3 (1.8%) | 0 (0.0%) |
| $2,000 to $2,499 | 0 (0.0%) | 0 (0.0%) |
| $2,500 to $2,999 | 0 (0.0%) | 0 (0.0%) |
| $3,000 or more | 20 (12.3%) | 0 (0.0%) |
| Total | 162 (100.0%) | 18 (100.0%) |
Physical Housing Characteristics in Bigler
Housing Structures in Bigler
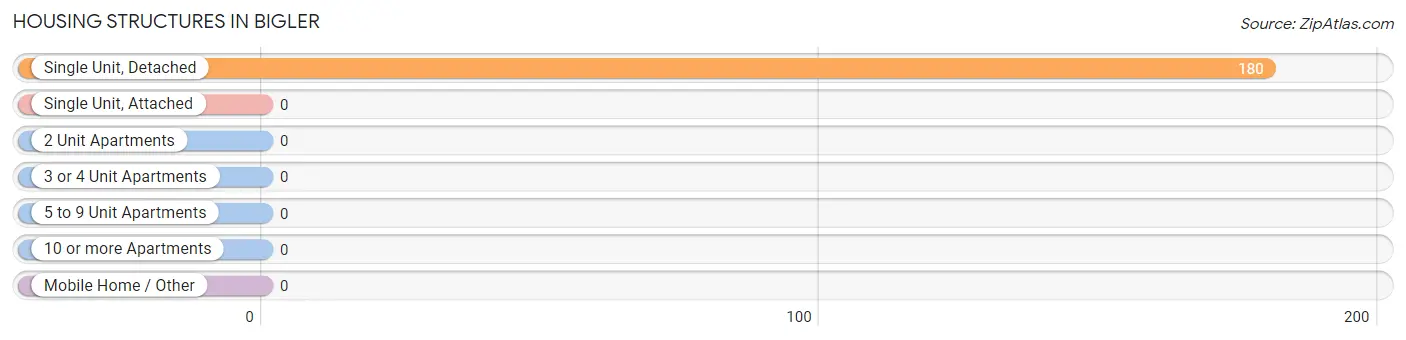
| Structure Type | # Housing Units | % Housing Units |
| Single Unit, Detached | 180 | 100.0% |
| Single Unit, Attached | 0 | 0.0% |
| 2 Unit Apartments | 0 | 0.0% |
| 3 or 4 Unit Apartments | 0 | 0.0% |
| 5 to 9 Unit Apartments | 0 | 0.0% |
| 10 or more Apartments | 0 | 0.0% |
| Mobile Home / Other | 0 | 0.0% |
| Total | 180 | 100.0% |
Housing Structures by Occupancy in Bigler
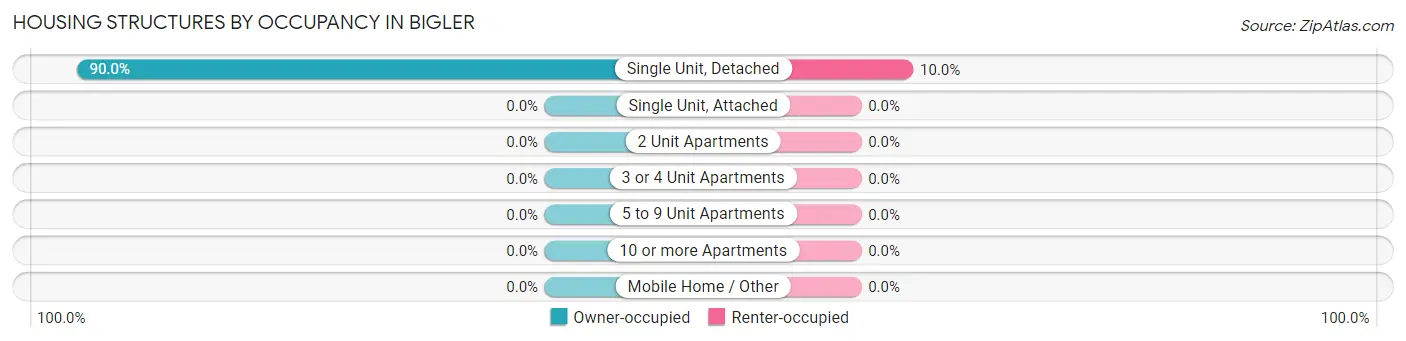
| Structure Type | Owner-occupied | Renter-occupied |
| Single Unit, Detached | 162 (90.0%) | 18 (10.0%) |
| Single Unit, Attached | 0 (0.0%) | 0 (0.0%) |
| 2 Unit Apartments | 0 (0.0%) | 0 (0.0%) |
| 3 or 4 Unit Apartments | 0 (0.0%) | 0 (0.0%) |
| 5 to 9 Unit Apartments | 0 (0.0%) | 0 (0.0%) |
| 10 or more Apartments | 0 (0.0%) | 0 (0.0%) |
| Mobile Home / Other | 0 (0.0%) | 0 (0.0%) |
| Total | 162 (90.0%) | 18 (10.0%) |
Housing Structures by Number of Rooms in Bigler
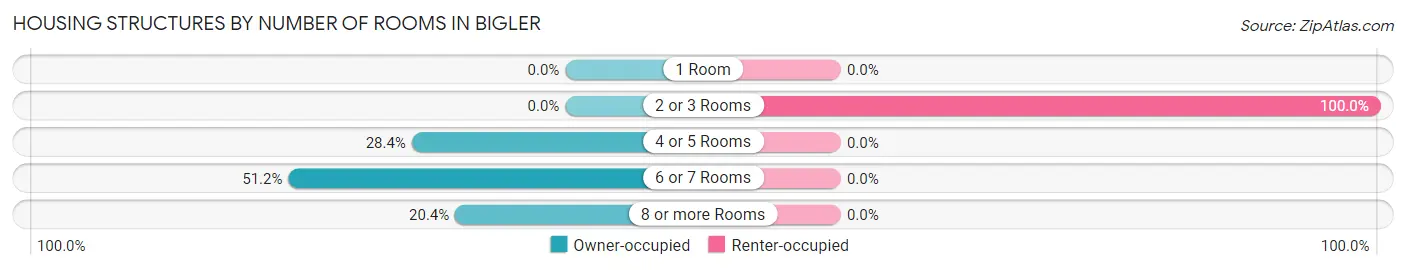
| Number of Rooms | Owner-occupied | Renter-occupied |
| 1 Room | 0 (0.0%) | 0 (0.0%) |
| 2 or 3 Rooms | 0 (0.0%) | 18 (100.0%) |
| 4 or 5 Rooms | 46 (28.4%) | 0 (0.0%) |
| 6 or 7 Rooms | 83 (51.2%) | 0 (0.0%) |
| 8 or more Rooms | 33 (20.4%) | 0 (0.0%) |
| Total | 162 (100.0%) | 18 (100.0%) |
Housing Structure by Heating Type in Bigler
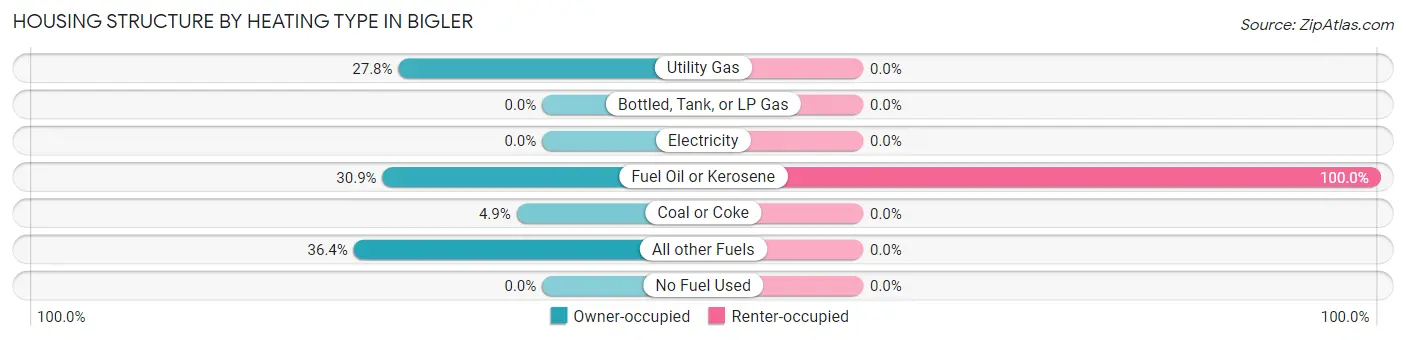
| Heating Type | Owner-occupied | Renter-occupied |
| Utility Gas | 45 (27.8%) | 0 (0.0%) |
| Bottled, Tank, or LP Gas | 0 (0.0%) | 0 (0.0%) |
| Electricity | 0 (0.0%) | 0 (0.0%) |
| Fuel Oil or Kerosene | 50 (30.9%) | 18 (100.0%) |
| Coal or Coke | 8 (4.9%) | 0 (0.0%) |
| All other Fuels | 59 (36.4%) | 0 (0.0%) |
| No Fuel Used | 0 (0.0%) | 0 (0.0%) |
| Total | 162 (100.0%) | 18 (100.0%) |
Household Vehicle Usage in Bigler
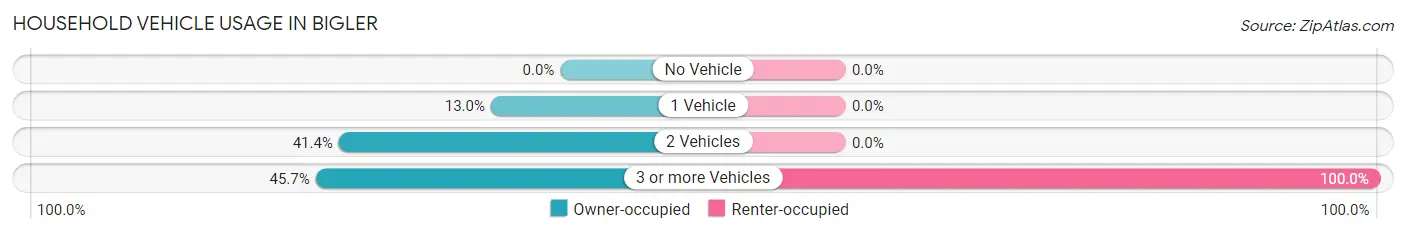
| Vehicles per Household | Owner-occupied | Renter-occupied |
| No Vehicle | 0 (0.0%) | 0 (0.0%) |
| 1 Vehicle | 21 (13.0%) | 0 (0.0%) |
| 2 Vehicles | 67 (41.4%) | 0 (0.0%) |
| 3 or more Vehicles | 74 (45.7%) | 18 (100.0%) |
| Total | 162 (100.0%) | 18 (100.0%) |
Real Estate & Mortgages in Bigler
Real Estate and Mortgage Overview in Bigler
| Characteristic | Without Mortgage | With Mortgage |
| Housing Units | 60 | 102 |
| Median Property Value | $159,200 | $143,800 |
| Median Household Income | $105,526 | $20 |
| Monthly Housing Costs | $579 | $20 |
| Real Estate Taxes | $1,684 | $0 |
Property Value by Mortgage Status in Bigler
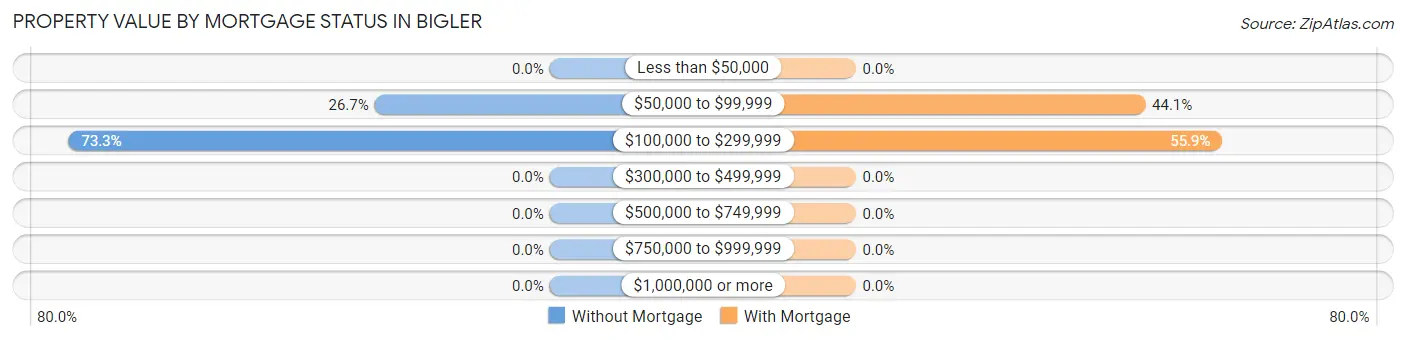
| Property Value | Without Mortgage | With Mortgage |
| Less than $50,000 | 0 (0.0%) | 0 (0.0%) |
| $50,000 to $99,999 | 16 (26.7%) | 45 (44.1%) |
| $100,000 to $299,999 | 44 (73.3%) | 57 (55.9%) |
| $300,000 to $499,999 | 0 (0.0%) | 0 (0.0%) |
| $500,000 to $749,999 | 0 (0.0%) | 0 (0.0%) |
| $750,000 to $999,999 | 0 (0.0%) | 0 (0.0%) |
| $1,000,000 or more | 0 (0.0%) | 0 (0.0%) |
| Total | 60 (100.0%) | 102 (100.0%) |
Household Income by Mortgage Status in Bigler
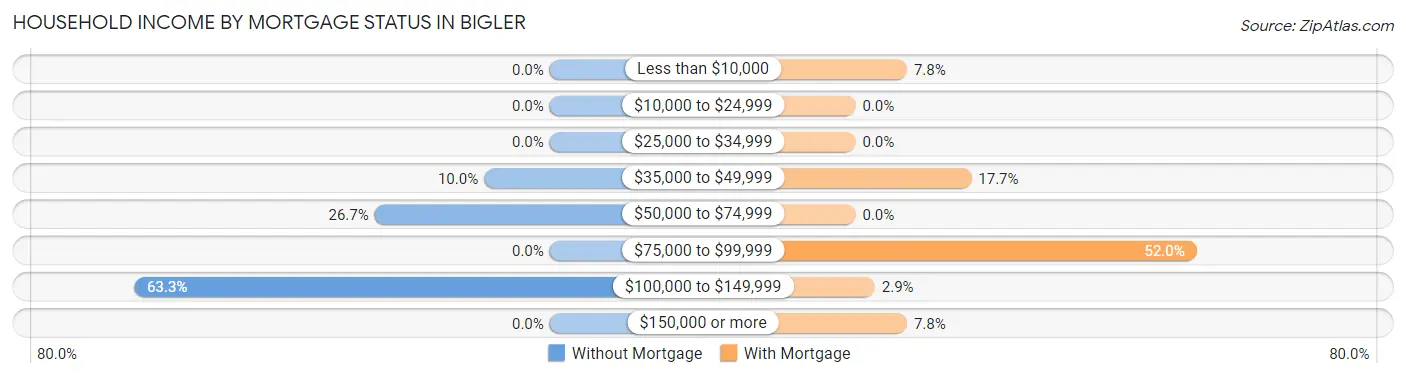
| Household Income | Without Mortgage | With Mortgage |
| Less than $10,000 | 0 (0.0%) | 8 (7.8%) |
| $10,000 to $24,999 | 0 (0.0%) | 0 (0.0%) |
| $25,000 to $34,999 | 0 (0.0%) | 0 (0.0%) |
| $35,000 to $49,999 | 6 (10.0%) | 18 (17.6%) |
| $50,000 to $74,999 | 16 (26.7%) | 0 (0.0%) |
| $75,000 to $99,999 | 0 (0.0%) | 53 (52.0%) |
| $100,000 to $149,999 | 38 (63.3%) | 3 (2.9%) |
| $150,000 or more | 0 (0.0%) | 8 (7.8%) |
| Total | 60 (100.0%) | 102 (100.0%) |
Property Value to Household Income Ratio in Bigler
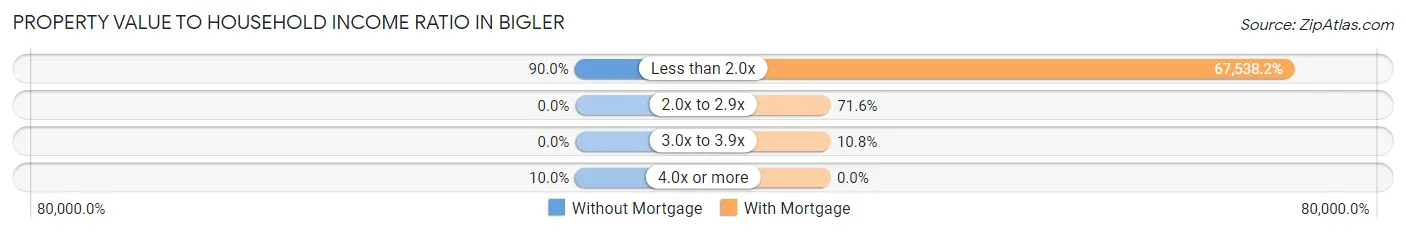
| Value-to-Income Ratio | Without Mortgage | With Mortgage |
| Less than 2.0x | 54 (90.0%) | 68,889 (67,538.2%) |
| 2.0x to 2.9x | 0 (0.0%) | 73 (71.6%) |
| 3.0x to 3.9x | 0 (0.0%) | 11 (10.8%) |
| 4.0x or more | 6 (10.0%) | 0 (0.0%) |
| Total | 60 (100.0%) | 102 (100.0%) |
Real Estate Taxes by Mortgage Status in Bigler
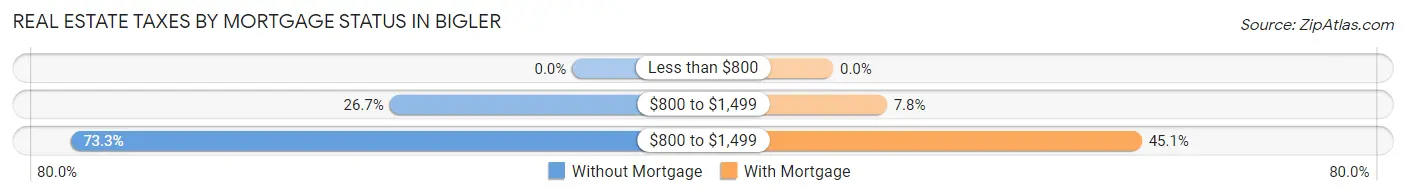
| Property Taxes | Without Mortgage | With Mortgage |
| Less than $800 | 0 (0.0%) | 0 (0.0%) |
| $800 to $1,499 | 16 (26.7%) | 8 (7.8%) |
| $800 to $1,499 | 44 (73.3%) | 46 (45.1%) |
| Total | 60 (100.0%) | 102 (100.0%) |
Health & Disability in Bigler
Health Insurance Coverage by Age in Bigler
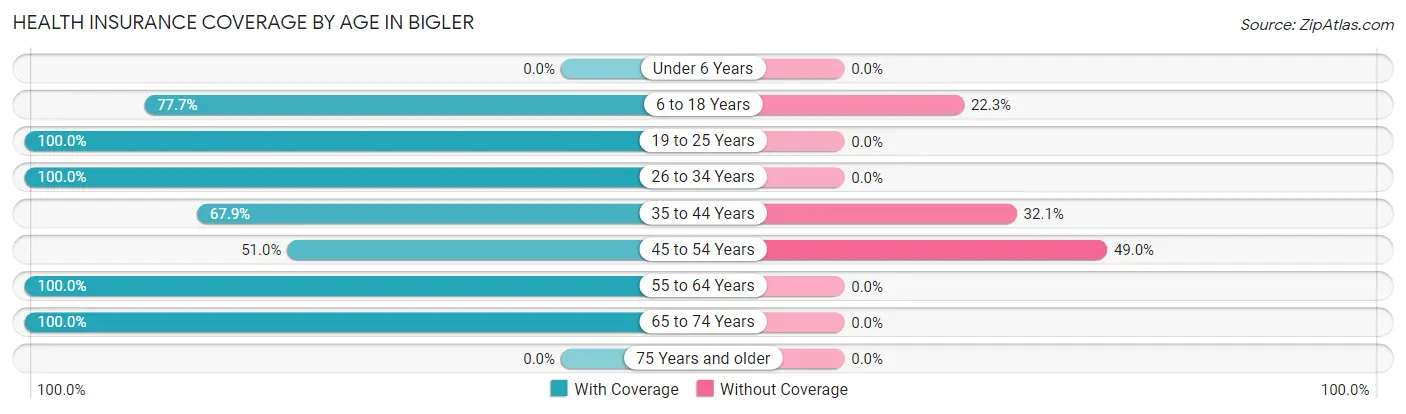
| Age Bracket | With Coverage | Without Coverage |
| Under 6 Years | 0 (0.0%) | 0 (0.0%) |
| 6 to 18 Years | 101 (77.7%) | 29 (22.3%) |
| 19 to 25 Years | 45 (100.0%) | 0 (0.0%) |
| 26 to 34 Years | 63 (100.0%) | 0 (0.0%) |
| 35 to 44 Years | 57 (67.9%) | 27 (32.1%) |
| 45 to 54 Years | 25 (51.0%) | 24 (49.0%) |
| 55 to 64 Years | 90 (100.0%) | 0 (0.0%) |
| 65 to 74 Years | 15 (100.0%) | 0 (0.0%) |
| 75 Years and older | 0 (0.0%) | 0 (0.0%) |
| Total | 396 (83.2%) | 80 (16.8%) |
Health Insurance Coverage by Citizenship Status in Bigler
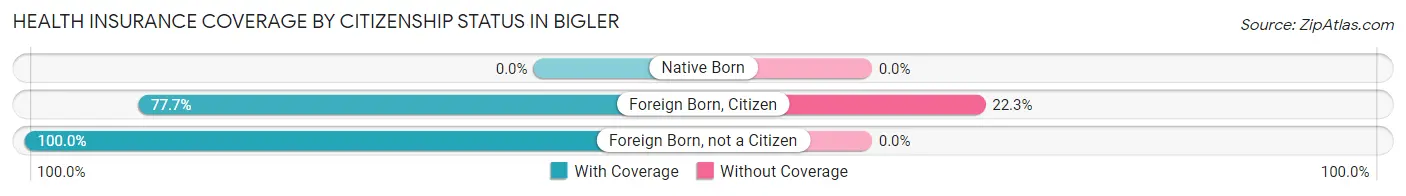
| Citizenship Status | With Coverage | Without Coverage |
| Native Born | 0 (0.0%) | 0 (0.0%) |
| Foreign Born, Citizen | 101 (77.7%) | 29 (22.3%) |
| Foreign Born, not a Citizen | 45 (100.0%) | 0 (0.0%) |
Health Insurance Coverage by Household Income in Bigler
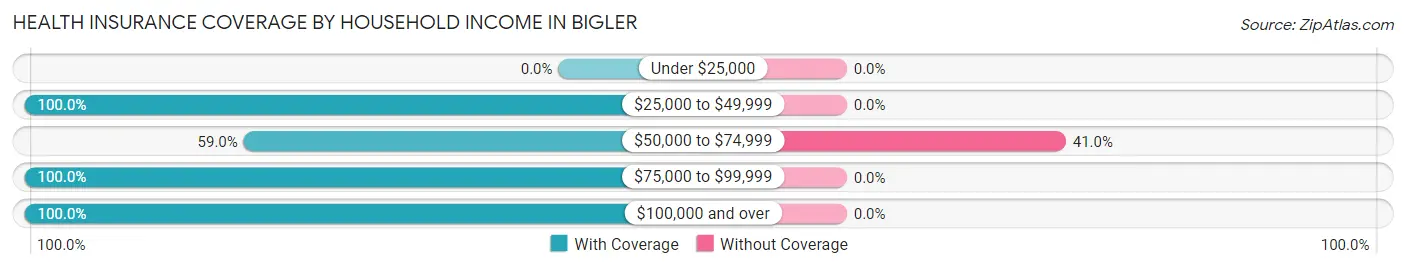
| Household Income | With Coverage | Without Coverage |
| Under $25,000 | 0 (0.0%) | 0 (0.0%) |
| $25,000 to $49,999 | 30 (100.0%) | 0 (0.0%) |
| $50,000 to $74,999 | 115 (59.0%) | 80 (41.0%) |
| $75,000 to $99,999 | 16 (100.0%) | 0 (0.0%) |
| $100,000 and over | 235 (100.0%) | 0 (0.0%) |
Public vs Private Health Insurance Coverage by Age in Bigler
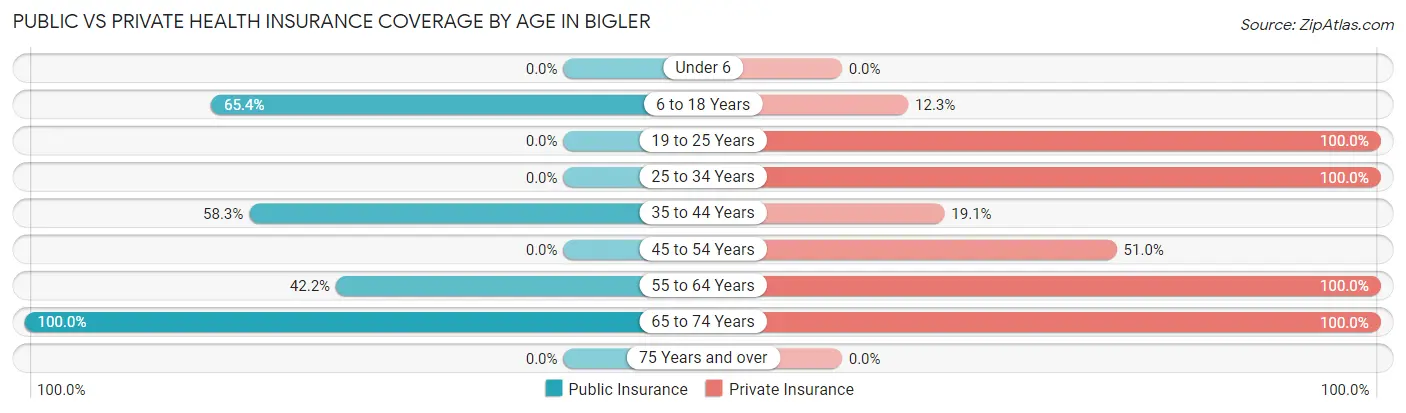
| Age Bracket | Public Insurance | Private Insurance |
| Under 6 | 0 (0.0%) | 0 (0.0%) |
| 6 to 18 Years | 85 (65.4%) | 16 (12.3%) |
| 19 to 25 Years | 0 (0.0%) | 45 (100.0%) |
| 25 to 34 Years | 0 (0.0%) | 63 (100.0%) |
| 35 to 44 Years | 49 (58.3%) | 16 (19.1%) |
| 45 to 54 Years | 0 (0.0%) | 25 (51.0%) |
| 55 to 64 Years | 38 (42.2%) | 90 (100.0%) |
| 65 to 74 Years | 15 (100.0%) | 15 (100.0%) |
| 75 Years and over | 0 (0.0%) | 0 (0.0%) |
| Total | 187 (39.3%) | 270 (56.7%) |
Disability Status by Sex by Age in Bigler
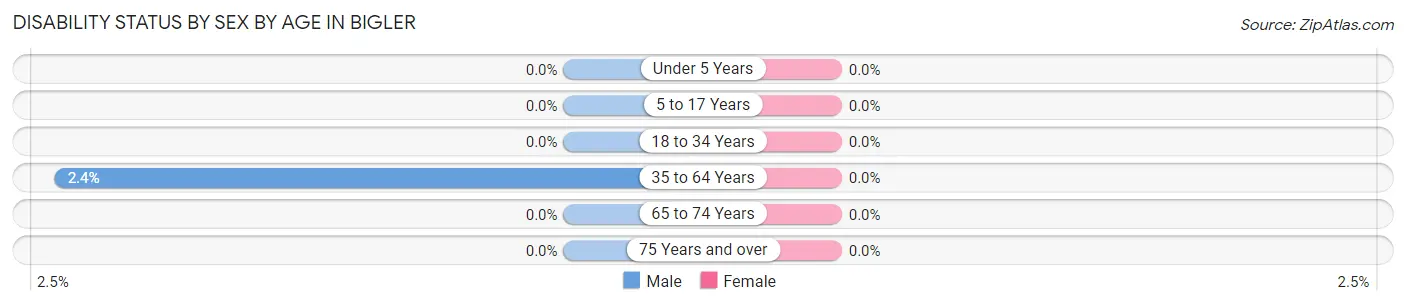
| Age Bracket | Male | Female |
| Under 5 Years | 0 (0.0%) | 0 (0.0%) |
| 5 to 17 Years | 0 (0.0%) | 0 (0.0%) |
| 18 to 34 Years | 0 (0.0%) | 0 (0.0%) |
| 35 to 64 Years | 3 (2.4%) | 0 (0.0%) |
| 65 to 74 Years | 0 (0.0%) | 0 (0.0%) |
| 75 Years and over | 0 (0.0%) | 0 (0.0%) |
Disability Class by Sex by Age in Bigler
Disability Class: Hearing Difficulty
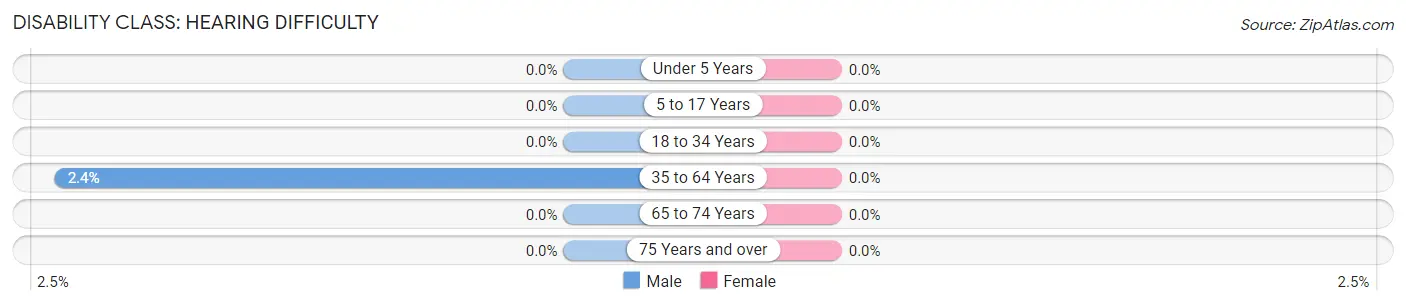
| Age Bracket | Male | Female |
| Under 5 Years | 0 (0.0%) | 0 (0.0%) |
| 5 to 17 Years | 0 (0.0%) | 0 (0.0%) |
| 18 to 34 Years | 0 (0.0%) | 0 (0.0%) |
| 35 to 64 Years | 3 (2.4%) | 0 (0.0%) |
| 65 to 74 Years | 0 (0.0%) | 0 (0.0%) |
| 75 Years and over | 0 (0.0%) | 0 (0.0%) |
Disability Class: Vision Difficulty

| Age Bracket | Male | Female |
| Under 5 Years | 0 (0.0%) | 0 (0.0%) |
| 5 to 17 Years | 0 (0.0%) | 0 (0.0%) |
| 18 to 34 Years | 0 (0.0%) | 0 (0.0%) |
| 35 to 64 Years | 3 (2.4%) | 0 (0.0%) |
| 65 to 74 Years | 0 (0.0%) | 0 (0.0%) |
| 75 Years and over | 0 (0.0%) | 0 (0.0%) |
Disability Class: Cognitive Difficulty
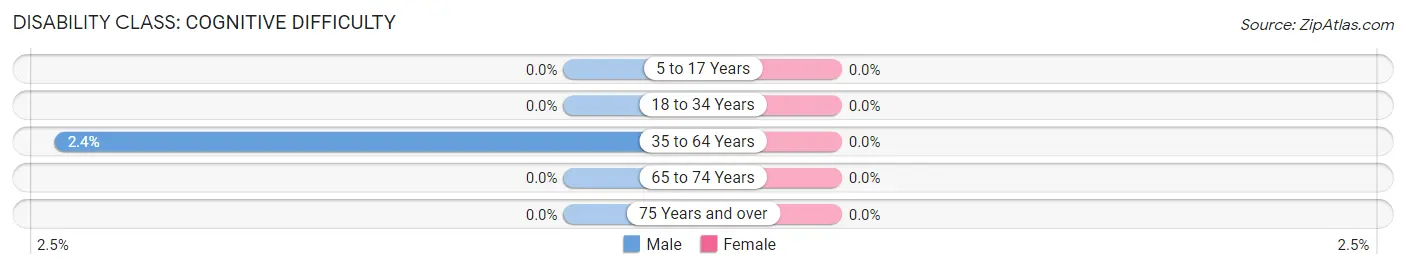
| Age Bracket | Male | Female |
| 5 to 17 Years | 0 (0.0%) | 0 (0.0%) |
| 18 to 34 Years | 0 (0.0%) | 0 (0.0%) |
| 35 to 64 Years | 3 (2.4%) | 0 (0.0%) |
| 65 to 74 Years | 0 (0.0%) | 0 (0.0%) |
| 75 Years and over | 0 (0.0%) | 0 (0.0%) |
Disability Class: Ambulatory Difficulty
| Age Bracket | Male | Female |
| 5 to 17 Years | 0 (0.0%) | 0 (0.0%) |
| 18 to 34 Years | 0 (0.0%) | 0 (0.0%) |
| 35 to 64 Years | 0 (0.0%) | 0 (0.0%) |
| 65 to 74 Years | 0 (0.0%) | 0 (0.0%) |
| 75 Years and over | 0 (0.0%) | 0 (0.0%) |
Disability Class: Self-Care Difficulty
| Age Bracket | Male | Female |
| 5 to 17 Years | 0 (0.0%) | 0 (0.0%) |
| 18 to 34 Years | 0 (0.0%) | 0 (0.0%) |
| 35 to 64 Years | 0 (0.0%) | 0 (0.0%) |
| 65 to 74 Years | 0 (0.0%) | 0 (0.0%) |
| 75 Years and over | 0 (0.0%) | 0 (0.0%) |
Technology Access in Bigler
Computing Device Access in Bigler
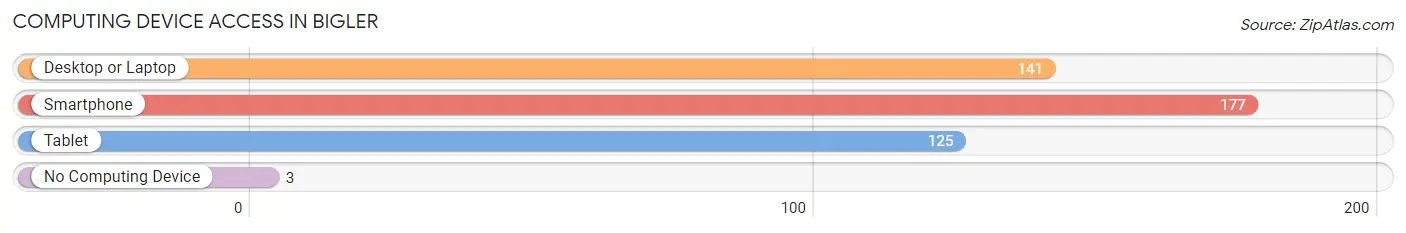
| Device Type | # Households | % Households |
| Desktop or Laptop | 141 | 78.3% |
| Smartphone | 177 | 98.3% |
| Tablet | 125 | 69.4% |
| No Computing Device | 3 | 1.7% |
| Total | 180 | 100.0% |
Internet Access in Bigler
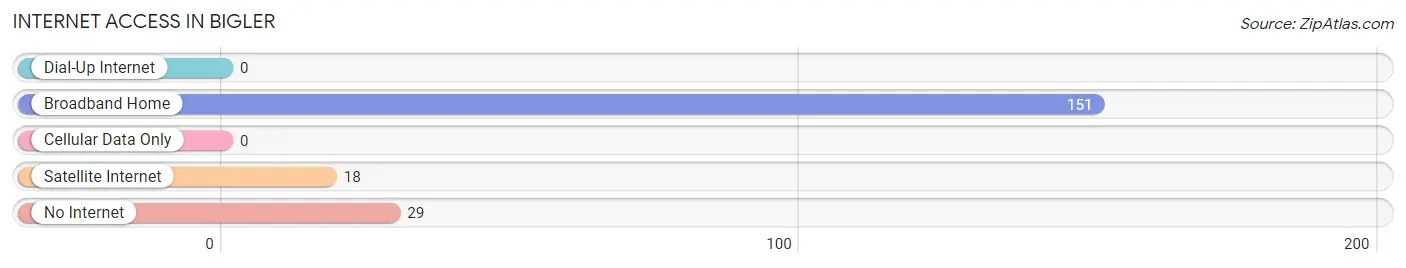
| Internet Type | # Households | % Households |
| Dial-Up Internet | 0 | 0.0% |
| Broadband Home | 151 | 83.9% |
| Cellular Data Only | 0 | 0.0% |
| Satellite Internet | 18 | 10.0% |
| No Internet | 29 | 16.1% |
| Total | 180 | 100.0% |
Bigler Summary
Bigler, Pennsylvania is a small borough located in Clearfield County, Pennsylvania. It is situated in the foothills of the Allegheny Mountains, approximately 30 miles east of the city of Altoona. The population of Bigler was 1,093 as of the 2010 census.
History
Bigler was founded in 1854 by a group of settlers from the nearby town of Clearfield. The town was named after William Bigler, who was the Governor of Pennsylvania from 1852 to 1855. The town was originally a farming community, but it soon developed into a small industrial center. The first industry in Bigler was a sawmill, which was built in 1856. This was followed by a grist mill, a tannery, and a woolen mill.
In the late 19th century, Bigler was a major coal mining center. The coal industry was the main source of employment for the town’s residents. The coal mines were owned by the Bigler Coal Company, which was founded in 1891. The company operated several mines in the area, including the Bigler Mine, which was the largest in the county.
Geography
Bigler is located in the foothills of the Allegheny Mountains, approximately 30 miles east of Altoona. The town is situated in a valley, with the Allegheny Mountains to the east and the Susquehanna River to the west. The town is located at an elevation of 1,845 feet above sea level.
The climate in Bigler is classified as humid continental, with cold winters and warm summers. The average annual temperature is 48°F, with an average high of 68°F in the summer and an average low of 28°F in the winter. The average annual precipitation is 40 inches.
Economy
The economy of Bigler is largely based on agriculture and tourism. The town is home to several farms, which produce a variety of crops, including corn, soybeans, hay, and wheat. The town is also home to several tourist attractions, including the Bigler Historical Museum, the Bigler Coal Mine, and the Bigler Covered Bridge.
The town is also home to several small businesses, including restaurants, retail stores, and service providers. The town is served by the Clearfield County Airport, which is located just outside of town.
Demographics
As of the 2010 census, the population of Bigler was 1,093. The racial makeup of the town was 97.3% White, 0.7% African American, 0.2% Native American, 0.2% Asian, 0.1% Pacific Islander, and 1.5% from other races. The median household income was $37,500, and the median family income was $45,000.
Bigler is a small, rural town with a strong sense of community. The town is home to several churches, a volunteer fire department, and a public library. The town is also home to several parks and recreational facilities, including a public swimming pool and a skate park.
Common Questions
What is Per Capita Income in Bigler?
Per Capita income in Bigler is $35,438.
What is the Median Family Income in Bigler?
Median Family Income in Bigler is $69,333.
What is the Median Household income in Bigler?
Median Household Income in Bigler is $68,833.
What is Inequality or Gini Index in Bigler?
Inequality or Gini Index in Bigler is 0.35.
What is the Total Population of Bigler?
Total Population of Bigler is 476.
What is the Total Male Population of Bigler?
Total Male Population of Bigler is 234.
What is the Total Female Population of Bigler?
Total Female Population of Bigler is 242.
What is the Ratio of Males per 100 Females in Bigler?
There are 96.69 Males per 100 Females in Bigler.
What is the Ratio of Females per 100 Males in Bigler?
There are 103.42 Females per 100 Males in Bigler.
What is the Median Population Age in Bigler?
Median Population Age in Bigler is 34.5 Years.
What is the Average Family Size in Bigler
Average Family Size in Bigler is 2.8 People.
What is the Average Household Size in Bigler
Average Household Size in Bigler is 2.6 People.
How Large is the Labor Force in Bigler?
There are 389 People in the Labor Forcein in Bigler.
What is the Percentage of People in the Labor Force in Bigler?
89.0% of People are in the Labor Force in Bigler.
What is the Unemployment Rate in Bigler?
Unemployment Rate in Bigler is 2.8%.