Bally borough, PA Map & Demographics
Bally borough Overview
$35,593
PER CAPITA INCOME
$92,578
AVG FAMILY INCOME
$71,827
AVG HOUSEHOLD INCOME
21.1%
WAGE / INCOME GAP [ % ]
78.9¢/ $1
WAGE / INCOME GAP [ $ ]
0.38
INEQUALITY / GINI INDEX
1,121
TOTAL POPULATION
554
MALE POPULATION
567
FEMALE POPULATION
97.71
MALES / 100 FEMALES
102.35
FEMALES / 100 MALES
40.6
MEDIAN AGE
3.0
AVG FAMILY SIZE
2.5
AVG HOUSEHOLD SIZE
641
LABOR FORCE [ PEOPLE ]
70.2%
PERCENT IN LABOR FORCE
1.6%
UNEMPLOYMENT RATE
Income in Bally borough
Income Overview in Bally borough
Per Capita Income in Bally borough is $35,593, while median incomes of families and households are $92,578 and $71,827 respectively.
| Characteristic | Number | Measure |
| Per Capita Income | 1,121 | $35,593 |
| Median Family Income | 275 | $92,578 |
| Mean Family Income | 275 | $104,453 |
| Median Household Income | 455 | $71,827 |
| Mean Household Income | 455 | $85,183 |
| Income Deficit | 275 | $0 |
| Wage / Income Gap (%) | 1,121 | 21.13% |
| Wage / Income Gap ($) | 1,121 | 78.87¢ per $1 |
| Gini / Inequality Index | 1,121 | 0.38 |
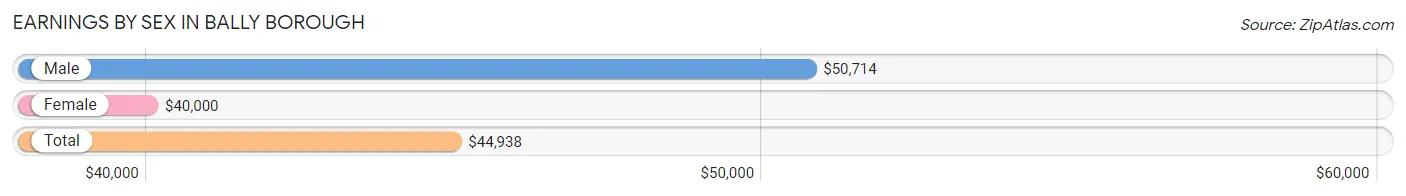
Earnings by Sex in Bally borough
Average Earnings in Bally borough are $44,938, $50,714 for men and $40,000 for women, a difference of 21.1%.
| Sex | Number | Average Earnings |
| Male | 318 (48.2%) | $50,714 |
| Female | 342 (51.8%) | $40,000 |
| Total | 660 (100.0%) | $44,938 |
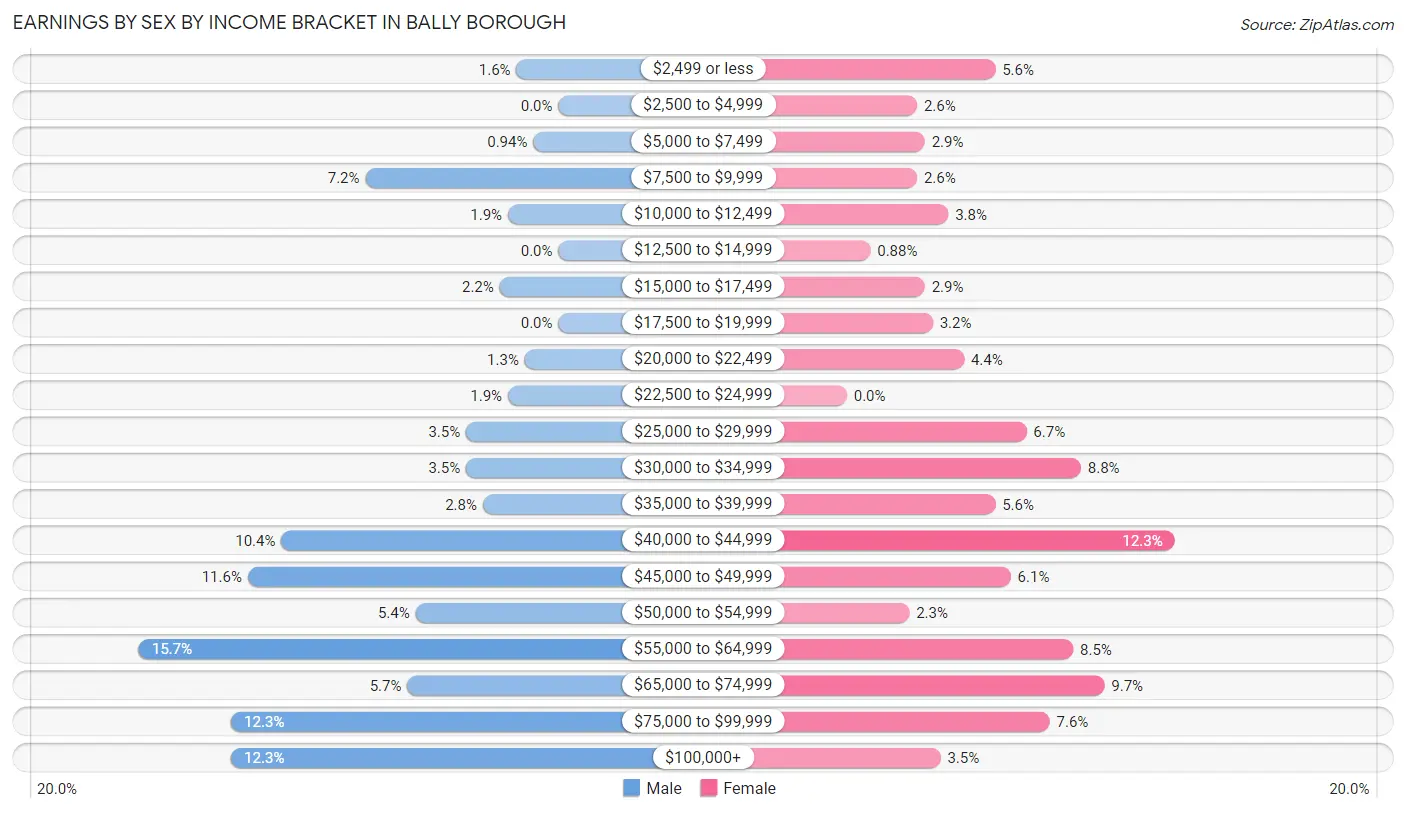
Earnings by Sex by Income Bracket in Bally borough
The most common earnings brackets in Bally borough are $55,000 to $64,999 for men (50 | 15.7%) and $40,000 to $44,999 for women (42 | 12.3%).
| Income | Male | Female |
| $2,499 or less | 5 (1.6%) | 19 (5.6%) |
| $2,500 to $4,999 | 0 (0.0%) | 9 (2.6%) |
| $5,000 to $7,499 | 3 (0.9%) | 10 (2.9%) |
| $7,500 to $9,999 | 23 (7.2%) | 9 (2.6%) |
| $10,000 to $12,499 | 6 (1.9%) | 13 (3.8%) |
| $12,500 to $14,999 | 0 (0.0%) | 3 (0.9%) |
| $15,000 to $17,499 | 7 (2.2%) | 10 (2.9%) |
| $17,500 to $19,999 | 0 (0.0%) | 11 (3.2%) |
| $20,000 to $22,499 | 4 (1.3%) | 15 (4.4%) |
| $22,500 to $24,999 | 6 (1.9%) | 0 (0.0%) |
| $25,000 to $29,999 | 11 (3.5%) | 23 (6.7%) |
| $30,000 to $34,999 | 11 (3.5%) | 30 (8.8%) |
| $35,000 to $39,999 | 9 (2.8%) | 19 (5.6%) |
| $40,000 to $44,999 | 33 (10.4%) | 42 (12.3%) |
| $45,000 to $49,999 | 37 (11.6%) | 21 (6.1%) |
| $50,000 to $54,999 | 17 (5.3%) | 8 (2.3%) |
| $55,000 to $64,999 | 50 (15.7%) | 29 (8.5%) |
| $65,000 to $74,999 | 18 (5.7%) | 33 (9.7%) |
| $75,000 to $99,999 | 39 (12.3%) | 26 (7.6%) |
| $100,000+ | 39 (12.3%) | 12 (3.5%) |
| Total | 318 (100.0%) | 342 (100.0%) |
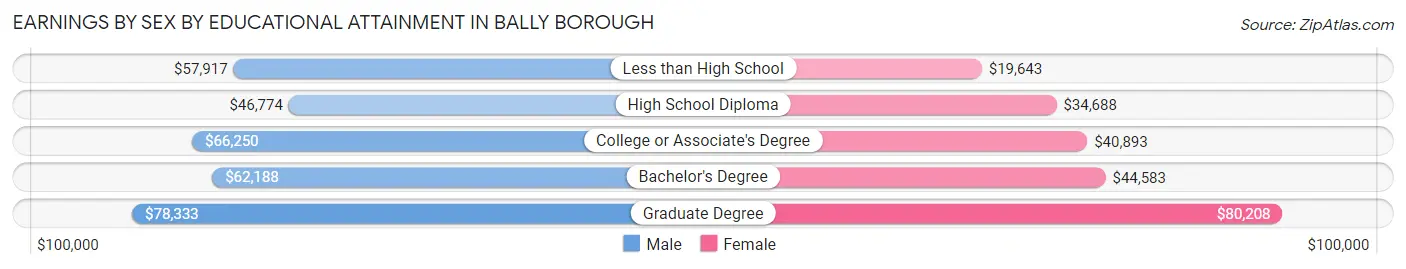
Earnings by Sex by Educational Attainment in Bally borough
Average earnings in Bally borough are $57,083 for men and $40,972 for women, a difference of 28.2%. Men with an educational attainment of graduate degree enjoy the highest average annual earnings of $78,333, while those with high school diploma education earn the least with $46,774. Women with an educational attainment of graduate degree earn the most with the average annual earnings of $80,208, while those with less than high school education have the smallest earnings of $19,643.
| Educational Attainment | Male Income | Female Income |
| Less than High School | $57,917 | $19,643 |
| High School Diploma | $46,774 | $34,688 |
| College or Associate's Degree | $66,250 | $40,893 |
| Bachelor's Degree | $62,188 | $44,583 |
| Graduate Degree | $78,333 | $80,208 |
| Total | $57,083 | $40,972 |
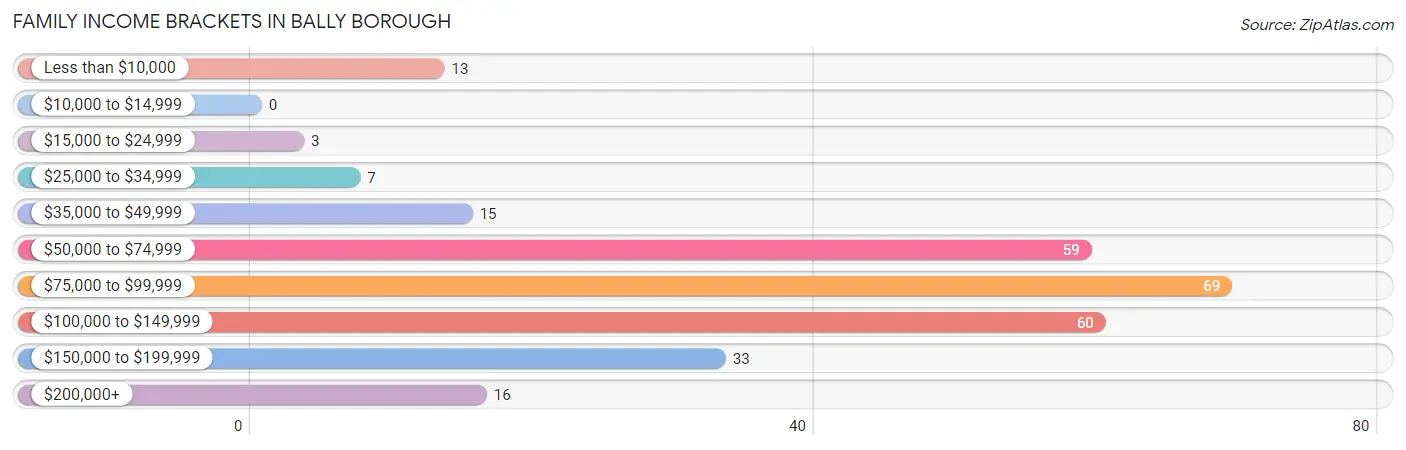
Family Income in Bally borough
Family Income Brackets in Bally borough
According to the Bally borough family income data, there are 69 families falling into the $75,000 to $99,999 income range, which is the most common income bracket and makes up 25.1% of all families.
| Income Bracket | # Families | % Families |
| Less than $10,000 | 13 | 4.7% |
| $10,000 to $14,999 | 0 | 0.0% |
| $15,000 to $24,999 | 3 | 1.1% |
| $25,000 to $34,999 | 7 | 2.5% |
| $35,000 to $49,999 | 15 | 5.5% |
| $50,000 to $74,999 | 59 | 21.5% |
| $75,000 to $99,999 | 69 | 25.1% |
| $100,000 to $149,999 | 60 | 21.8% |
| $150,000 to $199,999 | 33 | 12.0% |
| $200,000+ | 16 | 5.8% |
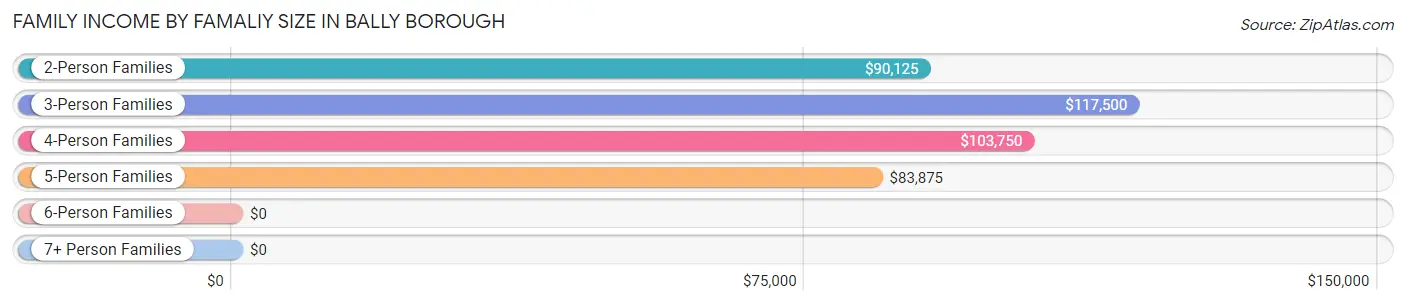
Family Income by Famaliy Size in Bally borough
3-person families (70 | 25.5%) account for the highest median family income in Bally borough with $117,500 per family, while 2-person families (145 | 52.7%) have the highest median income of $45,062 per family member.
| Income Bracket | # Families | Median Income |
| 2-Person Families | 145 (52.7%) | $90,125 |
| 3-Person Families | 70 (25.5%) | $117,500 |
| 4-Person Families | 32 (11.6%) | $103,750 |
| 5-Person Families | 21 (7.6%) | $83,875 |
| 6-Person Families | 7 (2.5%) | $0 |
| 7+ Person Families | 0 (0.0%) | $0 |
| Total | 275 (100.0%) | $92,578 |
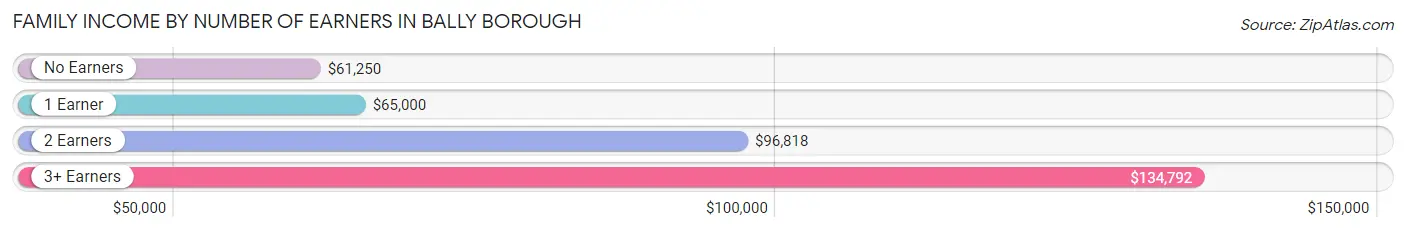
Family Income by Number of Earners in Bally borough
The median family income in Bally borough is $92,578, with families comprising 3+ earners (29) having the highest median family income of $134,792, while families with no earners (14) have the lowest median family income of $61,250, accounting for 10.5% and 5.1% of families, respectively.
| Number of Earners | # Families | Median Income |
| No Earners | 14 (5.1%) | $61,250 |
| 1 Earner | 80 (29.1%) | $65,000 |
| 2 Earners | 152 (55.3%) | $96,818 |
| 3+ Earners | 29 (10.5%) | $134,792 |
| Total | 275 (100.0%) | $92,578 |
Household Income in Bally borough
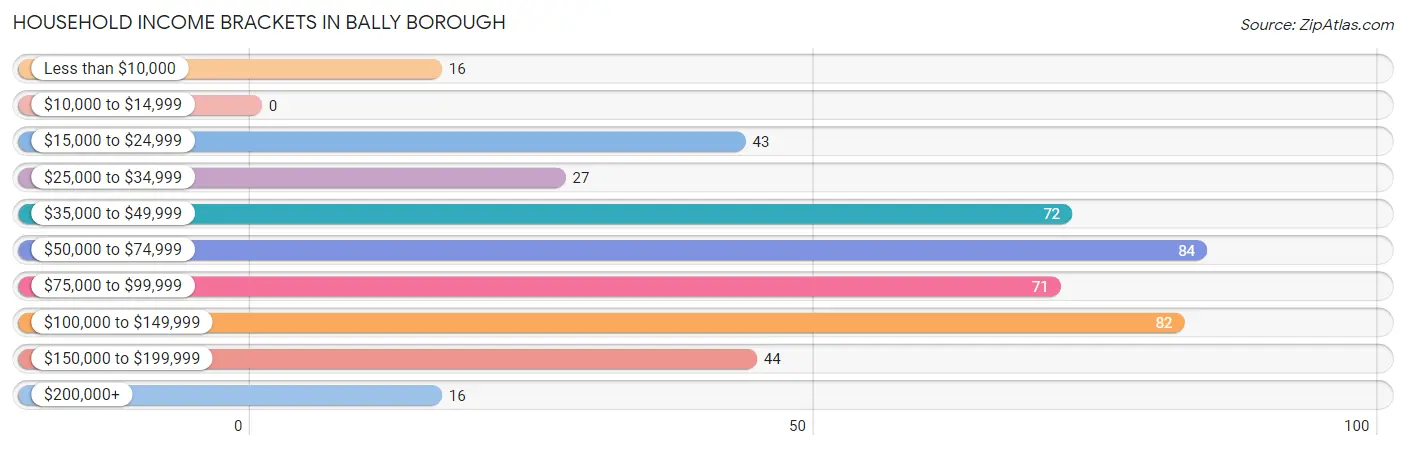
Household Income Brackets in Bally borough
With 84 households falling in the category, the $50,000 to $74,999 income range is the most frequent in Bally borough, accounting for 18.5% of all households.
| Income Bracket | # Households | % Households |
| Less than $10,000 | 16 | 3.5% |
| $10,000 to $14,999 | 0 | 0.0% |
| $15,000 to $24,999 | 43 | 9.5% |
| $25,000 to $34,999 | 27 | 5.9% |
| $35,000 to $49,999 | 72 | 15.8% |
| $50,000 to $74,999 | 84 | 18.5% |
| $75,000 to $99,999 | 71 | 15.6% |
| $100,000 to $149,999 | 82 | 18.0% |
| $150,000 to $199,999 | 44 | 9.7% |
| $200,000+ | 16 | 3.5% |
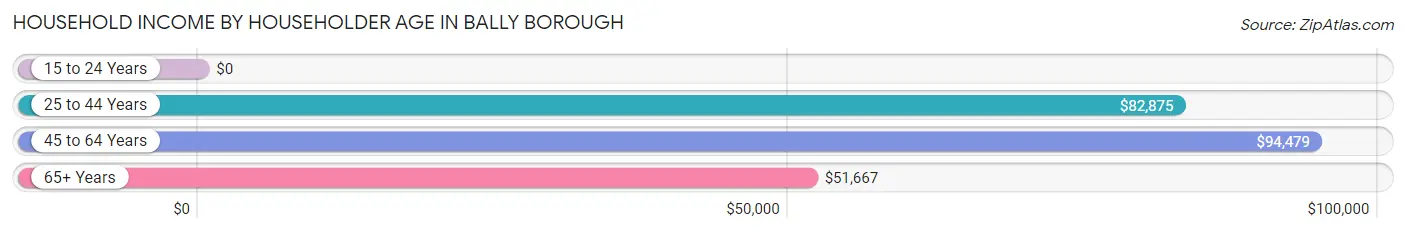
Household Income by Householder Age in Bally borough
The median household income in Bally borough is $71,827, with the highest median household income of $94,479 found in the 45 to 64 years age bracket for the primary householder. A total of 157 households (34.5%) fall into this category. Meanwhile, the 15 to 24 years age bracket for the primary householder has the lowest median household income of $0, with 11 households (2.4%) in this group.
| Income Bracket | # Households | Median Income |
| 15 to 24 Years | 11 (2.4%) | $0 |
| 25 to 44 Years | 149 (32.8%) | $82,875 |
| 45 to 64 Years | 157 (34.5%) | $94,479 |
| 65+ Years | 138 (30.3%) | $51,667 |
| Total | 455 (100.0%) | $71,827 |
Poverty in Bally borough
Income Below Poverty by Sex and Age in Bally borough
With 8.9% poverty level for males and 8.6% for females among the residents of Bally borough, 12 to 14 year old males and under 5 year old females are the most vulnerable to poverty, with 15 males (53.6%) and 4 females (25.0%) in their respective age groups living below the poverty level.
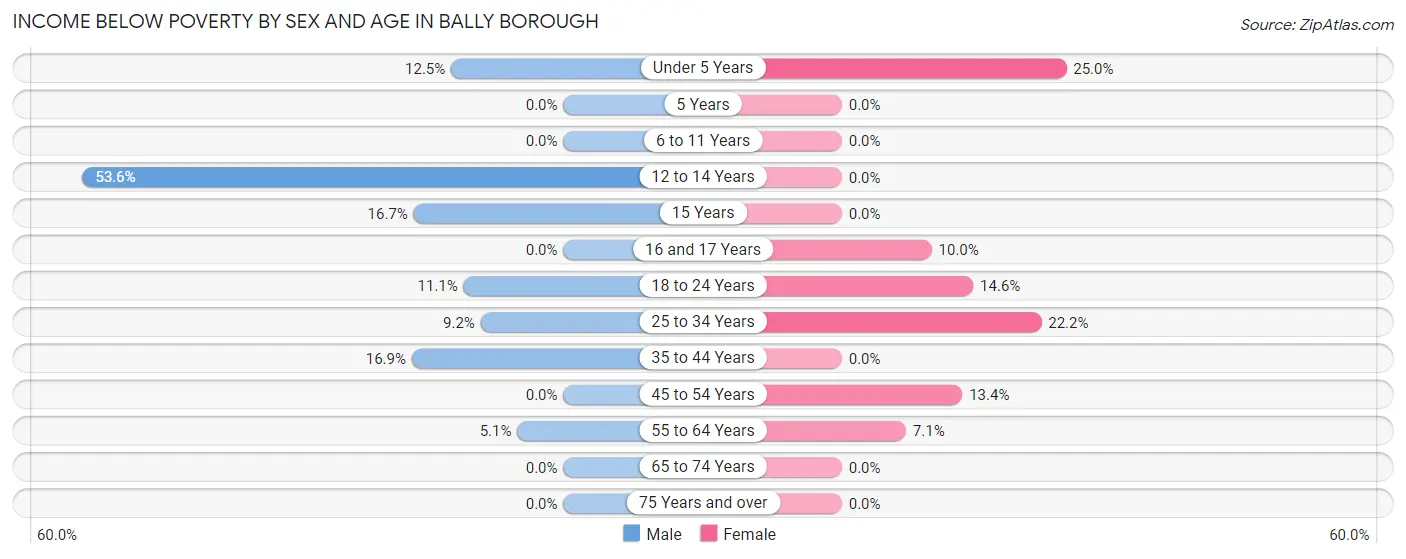
| Age Bracket | Male | Female |
| Under 5 Years | 3 (12.5%) | 4 (25.0%) |
| 5 Years | 0 (0.0%) | 0 (0.0%) |
| 6 to 11 Years | 0 (0.0%) | 0 (0.0%) |
| 12 to 14 Years | 15 (53.6%) | 0 (0.0%) |
| 15 Years | 2 (16.7%) | 0 (0.0%) |
| 16 and 17 Years | 0 (0.0%) | 2 (10.0%) |
| 18 to 24 Years | 3 (11.1%) | 6 (14.6%) |
| 25 to 34 Years | 7 (9.2%) | 22 (22.2%) |
| 35 to 44 Years | 13 (16.9%) | 0 (0.0%) |
| 45 to 54 Years | 0 (0.0%) | 11 (13.4%) |
| 55 to 64 Years | 4 (5.1%) | 3 (7.1%) |
| 65 to 74 Years | 0 (0.0%) | 0 (0.0%) |
| 75 Years and over | 0 (0.0%) | 0 (0.0%) |
| Total | 47 (8.9%) | 48 (8.6%) |
Income Above Poverty by Sex and Age in Bally borough
According to the poverty statistics in Bally borough, males aged 5 years and females aged 6 to 11 years are the age groups that are most secure financially, with 100.0% of males and 100.0% of females in these age groups living above the poverty line.
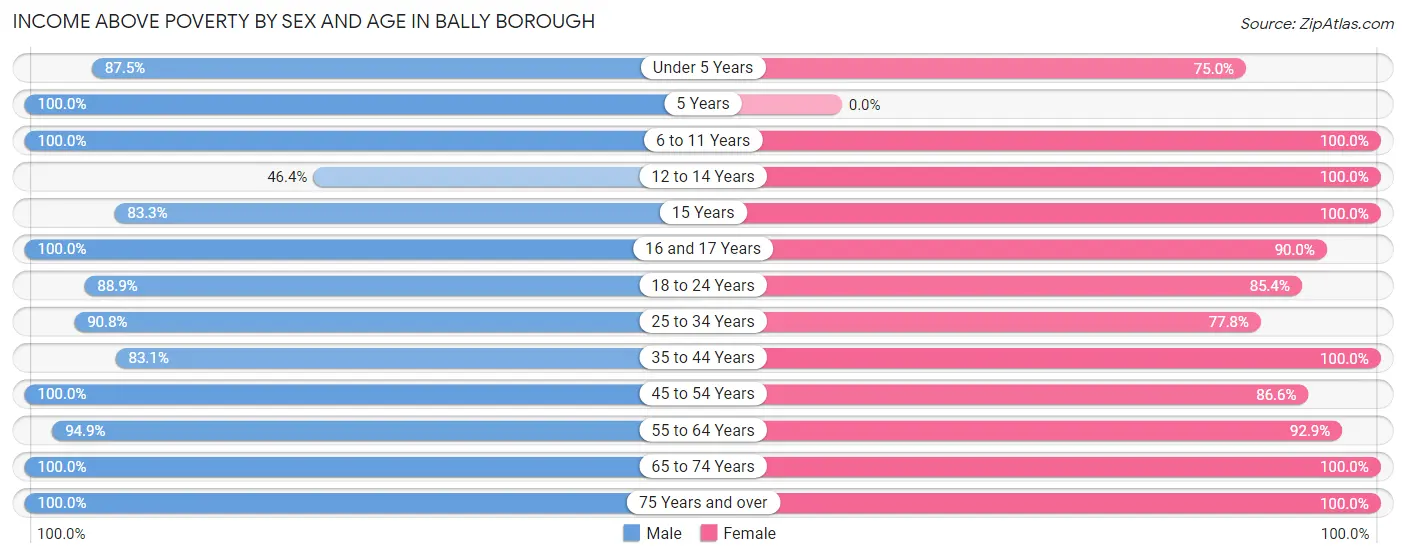
| Age Bracket | Male | Female |
| Under 5 Years | 21 (87.5%) | 12 (75.0%) |
| 5 Years | 13 (100.0%) | 0 (0.0%) |
| 6 to 11 Years | 38 (100.0%) | 35 (100.0%) |
| 12 to 14 Years | 13 (46.4%) | 8 (100.0%) |
| 15 Years | 10 (83.3%) | 3 (100.0%) |
| 16 and 17 Years | 14 (100.0%) | 18 (90.0%) |
| 18 to 24 Years | 24 (88.9%) | 35 (85.4%) |
| 25 to 34 Years | 69 (90.8%) | 77 (77.8%) |
| 35 to 44 Years | 64 (83.1%) | 75 (100.0%) |
| 45 to 54 Years | 64 (100.0%) | 71 (86.6%) |
| 55 to 64 Years | 74 (94.9%) | 39 (92.9%) |
| 65 to 74 Years | 41 (100.0%) | 64 (100.0%) |
| 75 Years and over | 38 (100.0%) | 75 (100.0%) |
| Total | 483 (91.1%) | 512 (91.4%) |
Income Below Poverty Among Married-Couple Families in Bally borough
The poverty statistics for married-couple families in Bally borough show that 1.6% or 3 of the total 190 families live below the poverty line. Families with 1 or 2 children have the highest poverty rate of 5.4%, comprising of 3 families. On the other hand, families with no children have the lowest poverty rate of 0.0%, which includes 0 families.
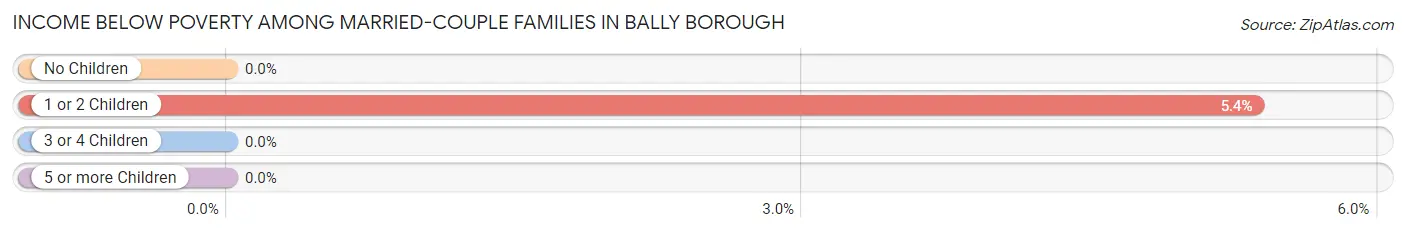
| Children | Above Poverty | Below Poverty |
| No Children | 118 (100.0%) | 0 (0.0%) |
| 1 or 2 Children | 53 (94.6%) | 3 (5.4%) |
| 3 or 4 Children | 16 (100.0%) | 0 (0.0%) |
| 5 or more Children | 0 (0.0%) | 0 (0.0%) |
| Total | 187 (98.4%) | 3 (1.6%) |
Income Below Poverty Among Single-Parent Households in Bally borough
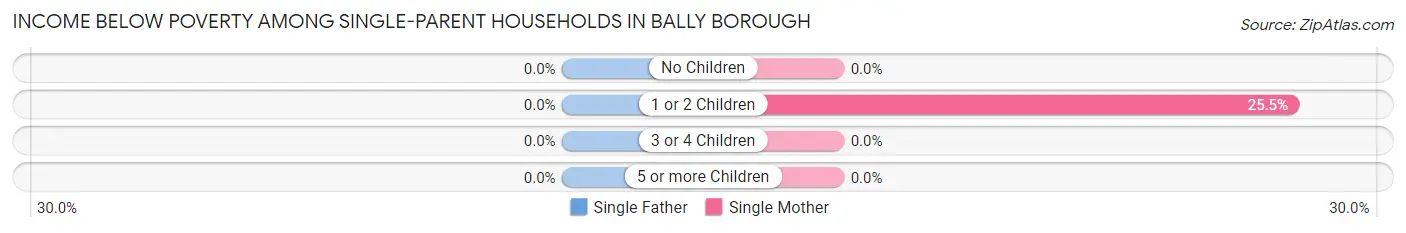
| Children | Single Father | Single Mother |
| No Children | 0 (0.0%) | 0 (0.0%) |
| 1 or 2 Children | 0 (0.0%) | 13 (25.5%) |
| 3 or 4 Children | 0 (0.0%) | 0 (0.0%) |
| 5 or more Children | 0 (0.0%) | 0 (0.0%) |
| Total | 0 (0.0%) | 13 (17.6%) |
Income Below Poverty Among Married-Couple vs Single-Parent Households in Bally borough
The poverty data for Bally borough shows that 3 of the married-couple family households (1.6%) and 13 of the single-parent households (15.3%) are living below the poverty level. Within the married-couple family households, those with 1 or 2 children have the highest poverty rate, with 3 households (5.4%) falling below the poverty line. Among the single-parent households, those with 1 or 2 children have the highest poverty rate, with 13 household (25.5%) living below poverty.
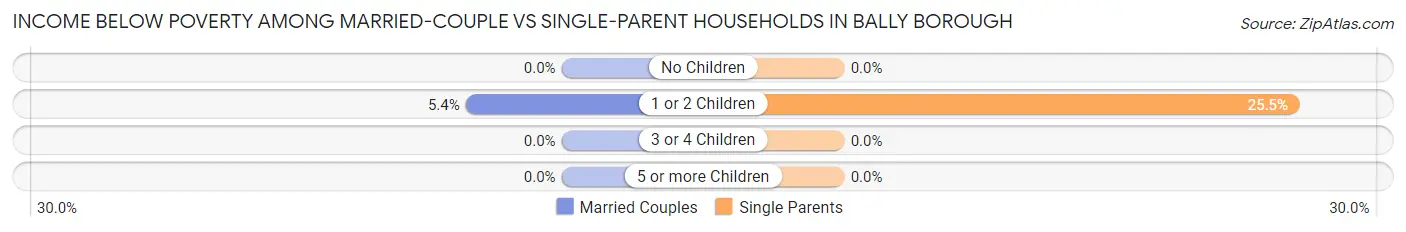
| Children | Married-Couple Families | Single-Parent Households |
| No Children | 0 (0.0%) | 0 (0.0%) |
| 1 or 2 Children | 3 (5.4%) | 13 (25.5%) |
| 3 or 4 Children | 0 (0.0%) | 0 (0.0%) |
| 5 or more Children | 0 (0.0%) | 0 (0.0%) |
| Total | 3 (1.6%) | 13 (15.3%) |
Race in Bally borough
The most populous races in Bally borough are White / Caucasian (983 | 87.7%), Hispanic or Latino (73 | 6.5%), and Two or more Races (64 | 5.7%).
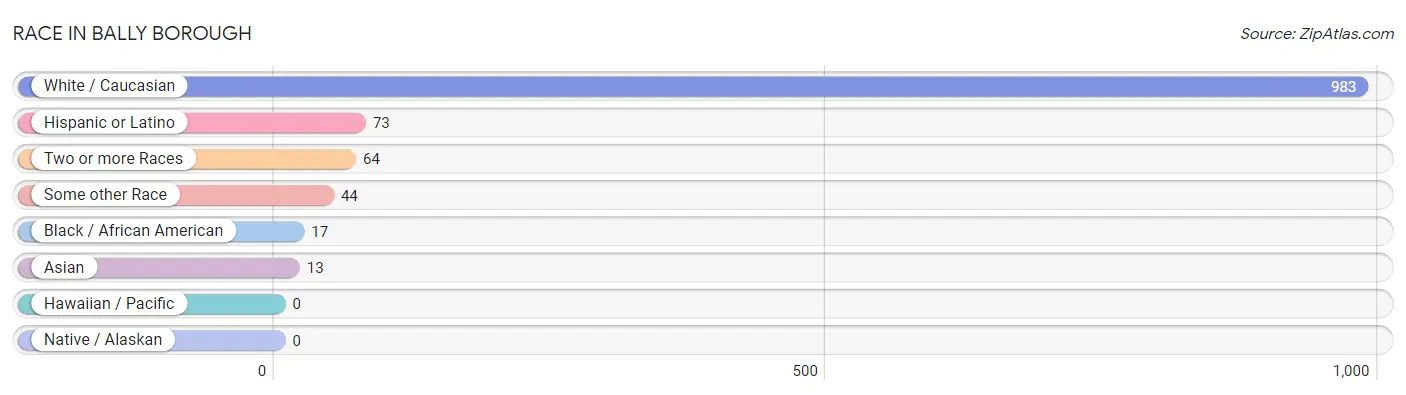
| Race | # Population | % Population |
| Asian | 13 | 1.2% |
| Black / African American | 17 | 1.5% |
| Hawaiian / Pacific | 0 | 0.0% |
| Hispanic or Latino | 73 | 6.5% |
| Native / Alaskan | 0 | 0.0% |
| White / Caucasian | 983 | 87.7% |
| Two or more Races | 64 | 5.7% |
| Some other Race | 44 | 3.9% |
| Total | 1,121 | 100.0% |
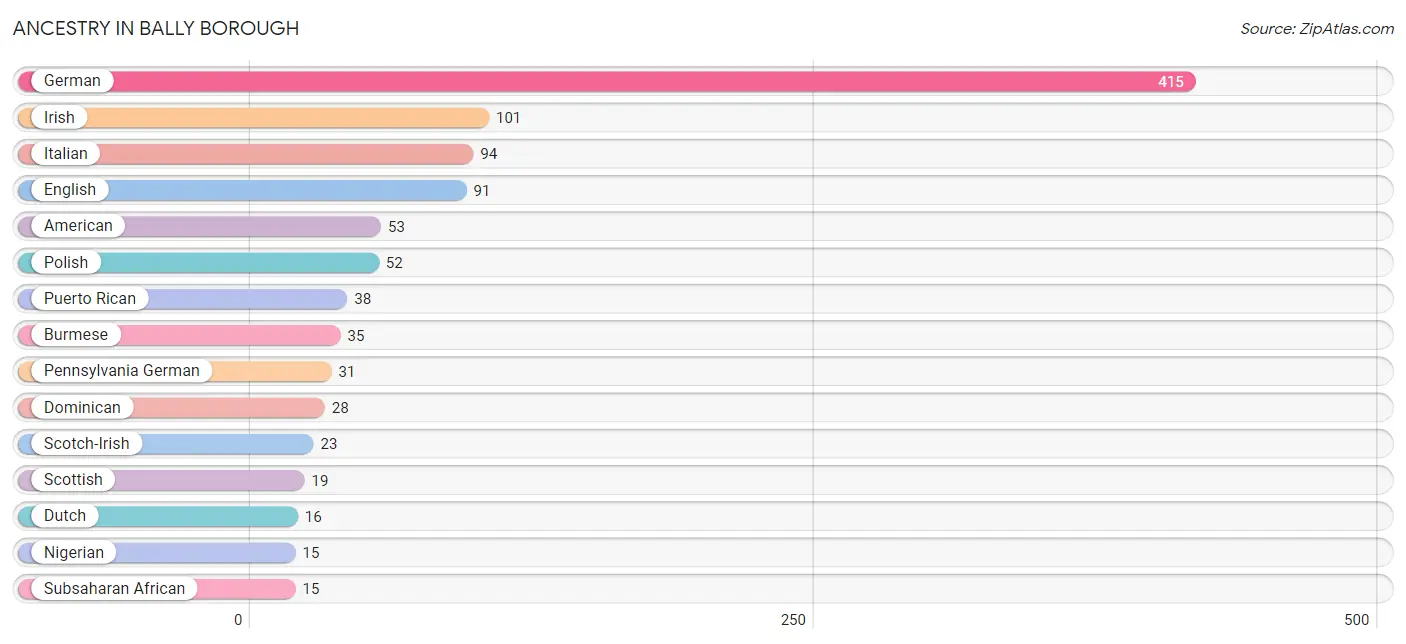
Ancestry in Bally borough
The most populous ancestries reported in Bally borough are German (415 | 37.0%), Irish (101 | 9.0%), Italian (94 | 8.4%), English (91 | 8.1%), and American (53 | 4.7%), together accounting for 67.3% of all Bally borough residents.
| Ancestry | # Population | % Population |
| American | 53 | 4.7% |
| Austrian | 7 | 0.6% |
| Burmese | 35 | 3.1% |
| Czech | 4 | 0.4% |
| Danish | 10 | 0.9% |
| Dominican | 28 | 2.5% |
| Dutch | 16 | 1.4% |
| Eastern European | 8 | 0.7% |
| English | 91 | 8.1% |
| European | 5 | 0.4% |
| French | 11 | 1.0% |
| French Canadian | 5 | 0.4% |
| German | 415 | 37.0% |
| Greek | 5 | 0.4% |
| Hungarian | 7 | 0.6% |
| Irish | 101 | 9.0% |
| Italian | 94 | 8.4% |
| Jamaican | 9 | 0.8% |
| Korean | 9 | 0.8% |
| Lithuanian | 2 | 0.2% |
| Mexican | 7 | 0.6% |
| Nigerian | 15 | 1.3% |
| Norwegian | 9 | 0.8% |
| Pennsylvania German | 31 | 2.8% |
| Polish | 52 | 4.6% |
| Puerto Rican | 38 | 3.4% |
| Russian | 3 | 0.3% |
| Scandinavian | 2 | 0.2% |
| Scotch-Irish | 23 | 2.1% |
| Scottish | 19 | 1.7% |
| Slovak | 3 | 0.3% |
| Subsaharan African | 15 | 1.3% |
| Swedish | 15 | 1.3% |
| Swiss | 5 | 0.4% |
| Ukrainian | 6 | 0.5% |
| Welsh | 11 | 1.0% | View All 36 Rows |
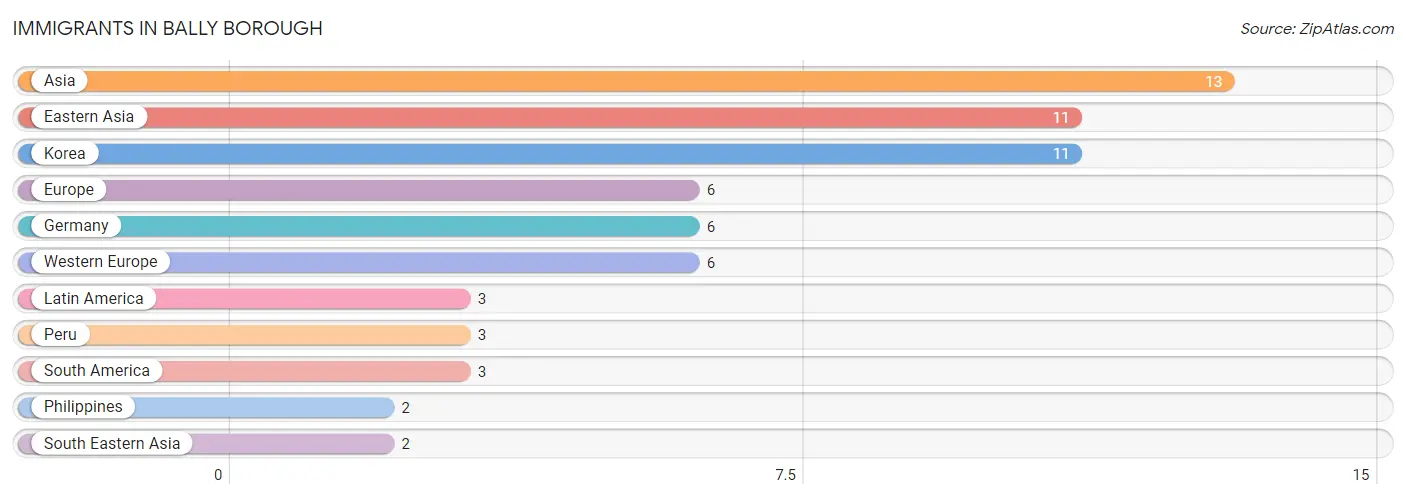
Immigrants in Bally borough
The most numerous immigrant groups reported in Bally borough came from Asia (13 | 1.2%), Eastern Asia (11 | 1.0%), Korea (11 | 1.0%), Europe (6 | 0.5%), and Germany (6 | 0.5%), together accounting for 4.2% of all Bally borough residents.
| Immigration Origin | # Population | % Population |
| Asia | 13 | 1.2% |
| Eastern Asia | 11 | 1.0% |
| Europe | 6 | 0.5% |
| Germany | 6 | 0.5% |
| Korea | 11 | 1.0% |
| Latin America | 3 | 0.3% |
| Peru | 3 | 0.3% |
| Philippines | 2 | 0.2% |
| South America | 3 | 0.3% |
| South Eastern Asia | 2 | 0.2% |
| Western Europe | 6 | 0.5% | View All 11 Rows |
Sex and Age in Bally borough
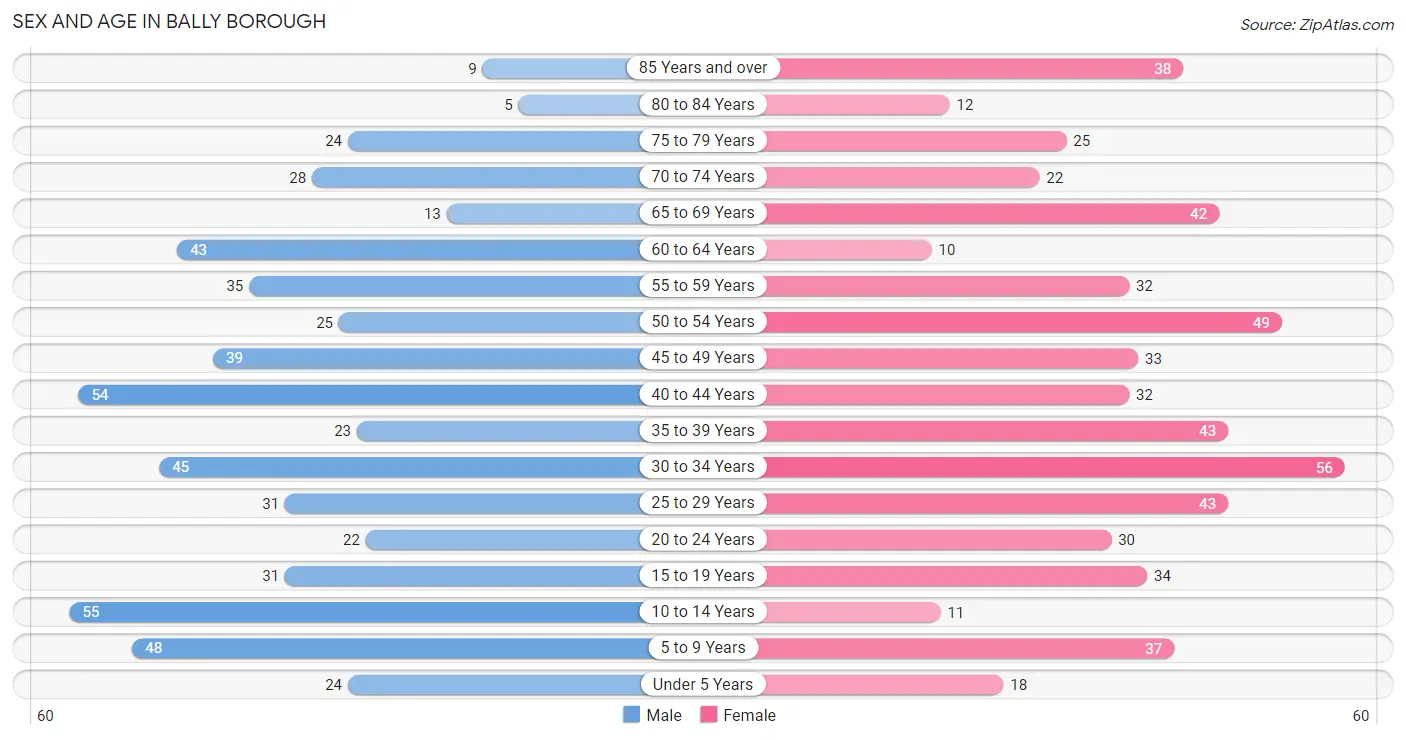
Sex and Age in Bally borough
The most populous age groups in Bally borough are 10 to 14 Years (55 | 9.9%) for men and 30 to 34 Years (56 | 9.9%) for women.
| Age Bracket | Male | Female |
| Under 5 Years | 24 (4.3%) | 18 (3.2%) |
| 5 to 9 Years | 48 (8.7%) | 37 (6.5%) |
| 10 to 14 Years | 55 (9.9%) | 11 (1.9%) |
| 15 to 19 Years | 31 (5.6%) | 34 (6.0%) |
| 20 to 24 Years | 22 (4.0%) | 30 (5.3%) |
| 25 to 29 Years | 31 (5.6%) | 43 (7.6%) |
| 30 to 34 Years | 45 (8.1%) | 56 (9.9%) |
| 35 to 39 Years | 23 (4.2%) | 43 (7.6%) |
| 40 to 44 Years | 54 (9.8%) | 32 (5.6%) |
| 45 to 49 Years | 39 (7.0%) | 33 (5.8%) |
| 50 to 54 Years | 25 (4.5%) | 49 (8.6%) |
| 55 to 59 Years | 35 (6.3%) | 32 (5.6%) |
| 60 to 64 Years | 43 (7.8%) | 10 (1.8%) |
| 65 to 69 Years | 13 (2.4%) | 42 (7.4%) |
| 70 to 74 Years | 28 (5.1%) | 22 (3.9%) |
| 75 to 79 Years | 24 (4.3%) | 25 (4.4%) |
| 80 to 84 Years | 5 (0.9%) | 12 (2.1%) |
| 85 Years and over | 9 (1.6%) | 38 (6.7%) |
| Total | 554 (100.0%) | 567 (100.0%) |
Families and Households in Bally borough
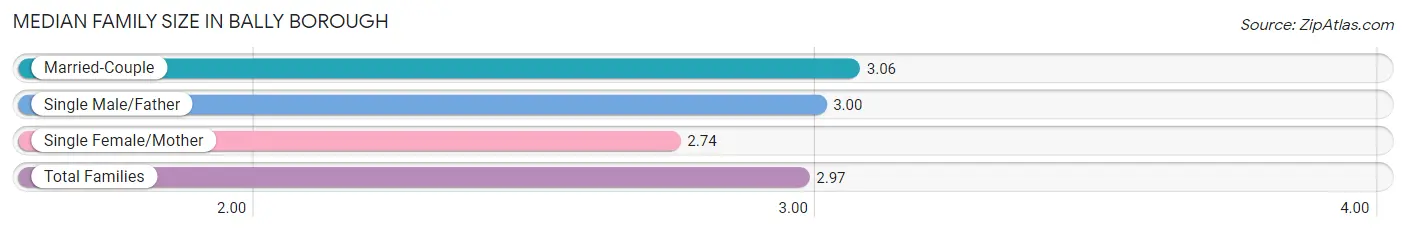
Median Family Size in Bally borough
The median family size in Bally borough is 2.97 persons per family, with married-couple families (190 | 69.1%) accounting for the largest median family size of 3.06 persons per family. On the other hand, single female/mother families (74 | 26.9%) represent the smallest median family size with 2.74 persons per family.
| Family Type | # Families | Family Size |
| Married-Couple | 190 (69.1%) | 3.06 |
| Single Male/Father | 11 (4.0%) | 3.00 |
| Single Female/Mother | 74 (26.9%) | 2.74 |
| Total Families | 275 (100.0%) | 2.97 |
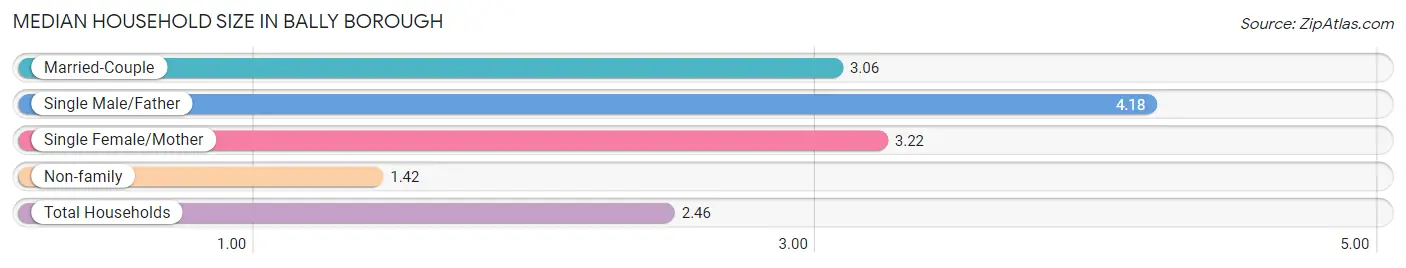
Median Household Size in Bally borough
The median household size in Bally borough is 2.46 persons per household, with single male/father households (11 | 2.4%) accounting for the largest median household size of 4.18 persons per household. non-family households (180 | 39.6%) represent the smallest median household size with 1.42 persons per household.
| Household Type | # Households | Household Size |
| Married-Couple | 190 (41.8%) | 3.06 |
| Single Male/Father | 11 (2.4%) | 4.18 |
| Single Female/Mother | 74 (16.3%) | 3.22 |
| Non-family | 180 (39.6%) | 1.42 |
| Total Households | 455 (100.0%) | 2.46 |
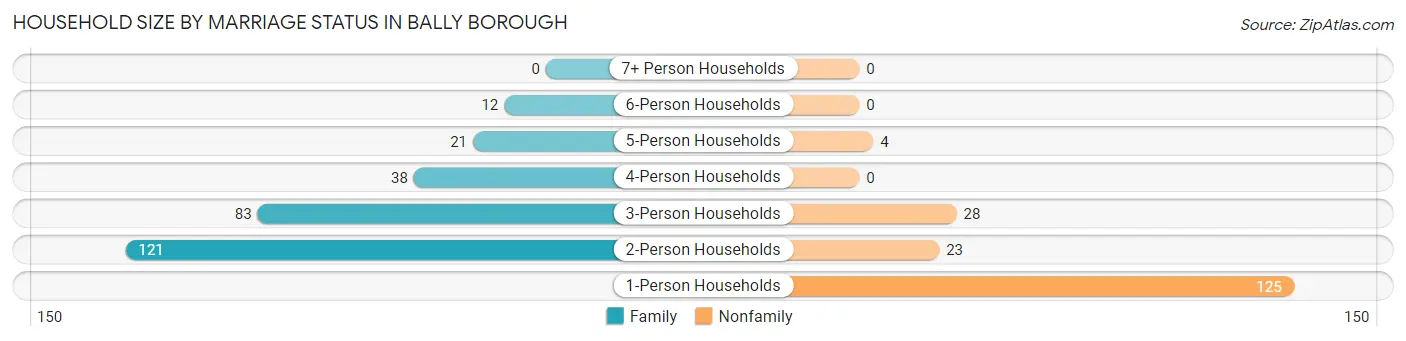
Household Size by Marriage Status in Bally borough
Out of a total of 455 households in Bally borough, 275 (60.4%) are family households, while 180 (39.6%) are nonfamily households. The most numerous type of family households are 2-person households, comprising 121, and the most common type of nonfamily households are 1-person households, comprising 125.
| Household Size | Family Households | Nonfamily Households |
| 1-Person Households | - | 125 (27.5%) |
| 2-Person Households | 121 (26.6%) | 23 (5.1%) |
| 3-Person Households | 83 (18.2%) | 28 (6.1%) |
| 4-Person Households | 38 (8.4%) | 0 (0.0%) |
| 5-Person Households | 21 (4.6%) | 4 (0.9%) |
| 6-Person Households | 12 (2.6%) | 0 (0.0%) |
| 7+ Person Households | 0 (0.0%) | 0 (0.0%) |
| Total | 275 (60.4%) | 180 (39.6%) |
Female Fertility in Bally borough
Fertility by Age in Bally borough
Average fertility rate in Bally borough is 18.0 births per 1,000 women. Women in the age bracket of 20 to 34 years have the highest fertility rate with 39.0 births per 1,000 women. Women in the age bracket of 20 to 34 years acount for 100.0% of all women with births.
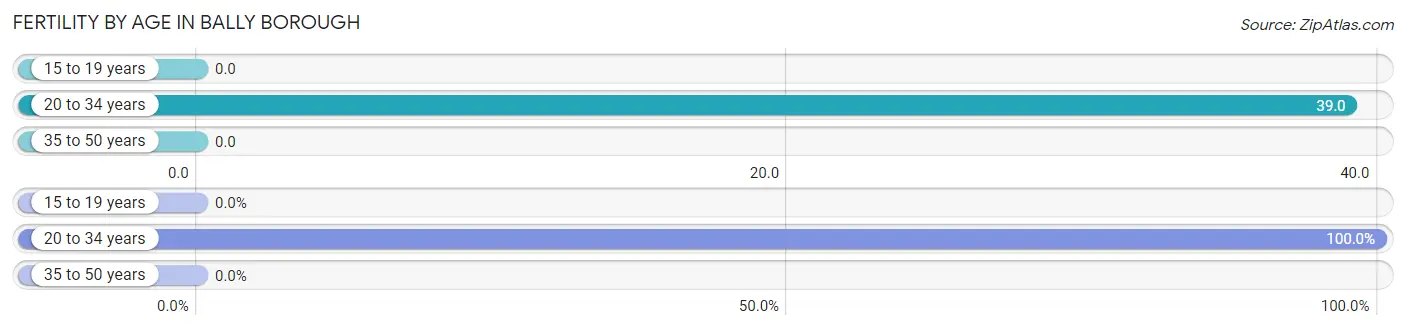
| Age Bracket | Women with Births | Births / 1,000 Women |
| 15 to 19 years | 0 (0.0%) | 0.0 |
| 20 to 34 years | 5 (100.0%) | 39.0 |
| 35 to 50 years | 0 (0.0%) | 0.0 |
| Total | 5 (100.0%) | 18.0 |
Fertility by Age by Marriage Status in Bally borough
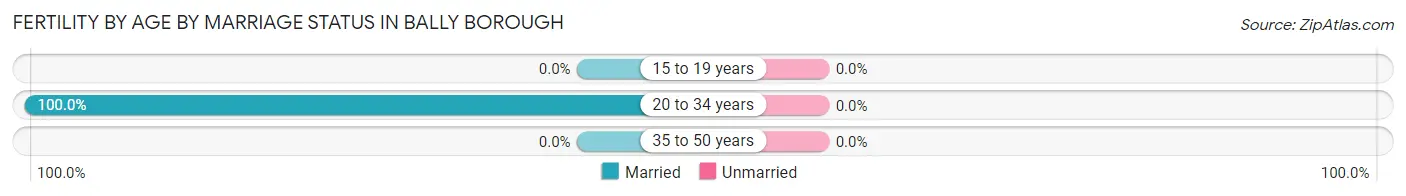
| Age Bracket | Married | Unmarried |
| 15 to 19 years | 0 (0.0%) | 0 (0.0%) |
| 20 to 34 years | 5 (100.0%) | 0 (0.0%) |
| 35 to 50 years | 0 (0.0%) | 0 (0.0%) |
| Total | 5 (100.0%) | 0 (0.0%) |
Fertility by Education in Bally borough
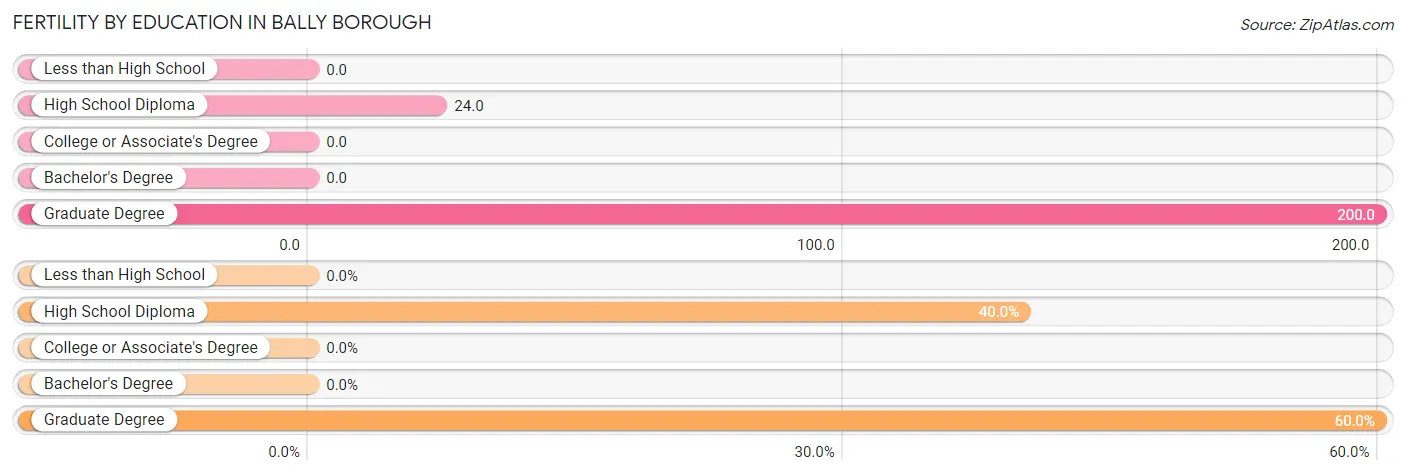
| Educational Attainment | Women with Births | Births / 1,000 Women |
| Less than High School | 0 (0.0%) | 0.0 |
| High School Diploma | 2 (40.0%) | 24.0 |
| College or Associate's Degree | 0 (0.0%) | 0.0 |
| Bachelor's Degree | 0 (0.0%) | 0.0 |
| Graduate Degree | 3 (60.0%) | 200.0 |
| Total | 5 (100.0%) | 18.0 |
Fertility by Education by Marriage Status in Bally borough
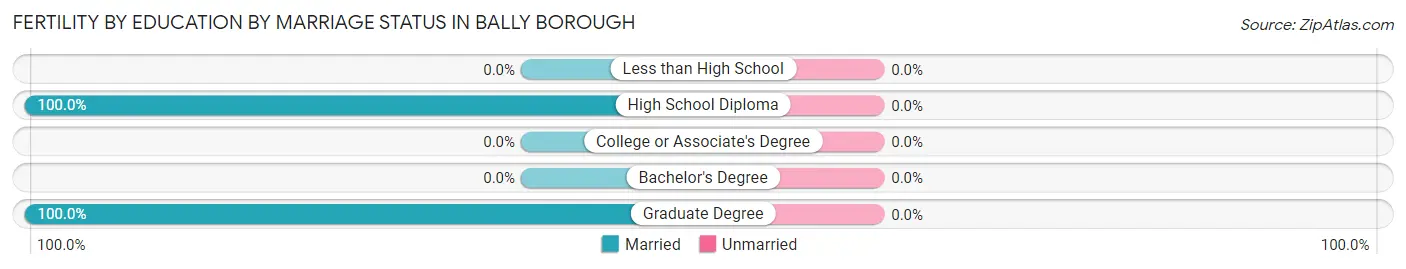
| Educational Attainment | Married | Unmarried |
| Less than High School | 0 (0.0%) | 0 (0.0%) |
| High School Diploma | 2 (100.0%) | 0 (0.0%) |
| College or Associate's Degree | 0 (0.0%) | 0 (0.0%) |
| Bachelor's Degree | 0 (0.0%) | 0 (0.0%) |
| Graduate Degree | 3 (100.0%) | 0 (0.0%) |
| Total | 5 (100.0%) | 0 (0.0%) |
Employment Characteristics in Bally borough
Employment by Class of Employer in Bally borough
Among the 610 employed individuals in Bally borough, private company employees (426 | 69.8%), not-for-profit organizations (98 | 16.1%), and local government employees (41 | 6.7%) make up the most common classes of employment.
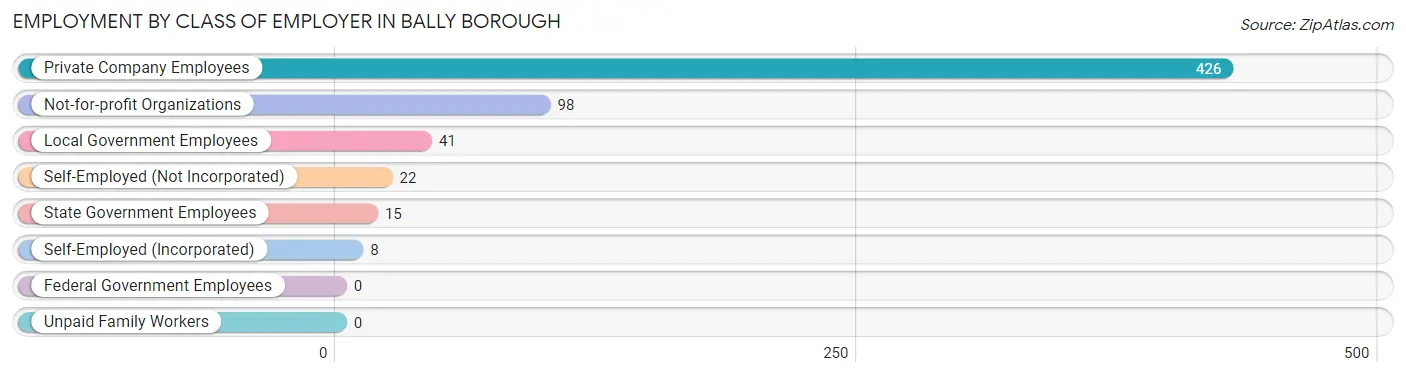
| Employer Class | # Employees | % Employees |
| Private Company Employees | 426 | 69.8% |
| Self-Employed (Incorporated) | 8 | 1.3% |
| Self-Employed (Not Incorporated) | 22 | 3.6% |
| Not-for-profit Organizations | 98 | 16.1% |
| Local Government Employees | 41 | 6.7% |
| State Government Employees | 15 | 2.5% |
| Federal Government Employees | 0 | 0.0% |
| Unpaid Family Workers | 0 | 0.0% |
| Total | 610 | 100.0% |
Employment Status by Age in Bally borough
According to the labor force statistics for Bally borough, out of the total population over 16 years of age (913), 70.2% or 641 individuals are in the labor force, with 1.6% or 10 of them unemployed. The age group with the highest labor force participation rate is 30 to 34 years, with 93.1% or 94 individuals in the labor force. Within the labor force, the 30 to 34 years age range has the highest percentage of unemployed individuals, with 4.3% or 4 of them being unemployed.
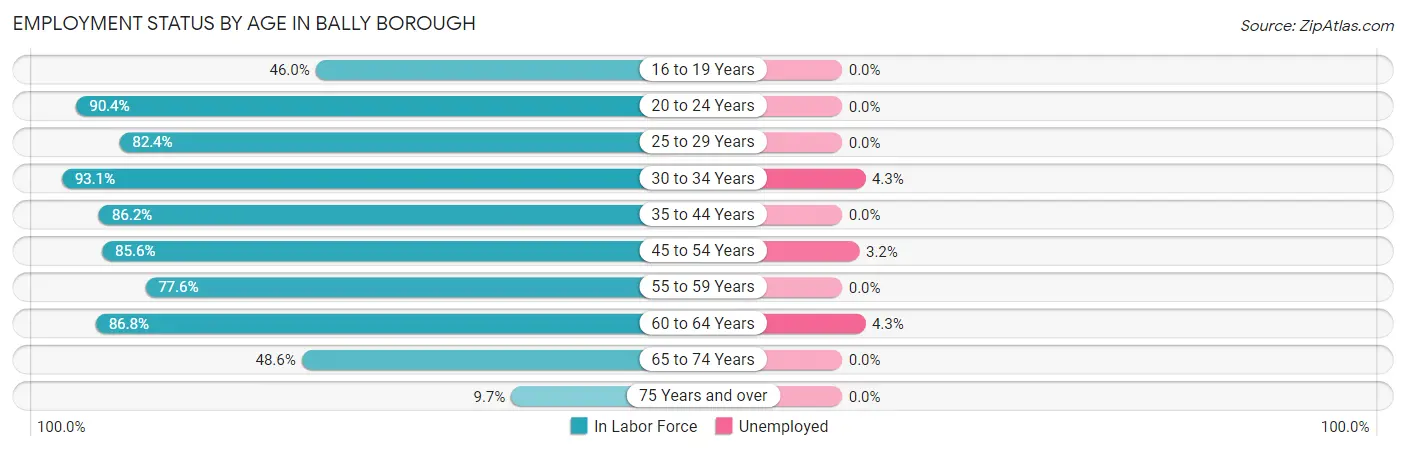
| Age Bracket | In Labor Force | Unemployed |
| 16 to 19 Years | 23 (46.0%) | 0 (0.0%) |
| 20 to 24 Years | 47 (90.4%) | 0 (0.0%) |
| 25 to 29 Years | 61 (82.4%) | 0 (0.0%) |
| 30 to 34 Years | 94 (93.1%) | 4 (4.3%) |
| 35 to 44 Years | 131 (86.2%) | 0 (0.0%) |
| 45 to 54 Years | 125 (85.6%) | 4 (3.2%) |
| 55 to 59 Years | 52 (77.6%) | 0 (0.0%) |
| 60 to 64 Years | 46 (86.8%) | 2 (4.3%) |
| 65 to 74 Years | 51 (48.6%) | 0 (0.0%) |
| 75 Years and over | 11 (9.7%) | 0 (0.0%) |
| Total | 641 (70.2%) | 10 (1.6%) |
Employment Status by Educational Attainment in Bally borough
According to labor force statistics for Bally borough, 85.8% of individuals (509) out of the total population between 25 and 64 years of age (593) are in the labor force, with 2.0% or 10 of them being unemployed. The group with the highest labor force participation rate are those with the educational attainment of bachelor's degree or higher, with 98.2% or 108 individuals in the labor force. Within the labor force, individuals with less than high school education have the highest percentage of unemployment, with 14.3% or 4 of them being unemployed.
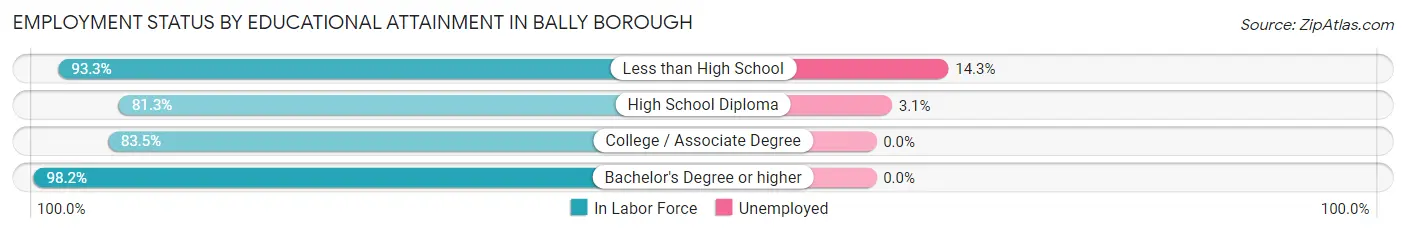
| Educational Attainment | In Labor Force | Unemployed |
| Less than High School | 28 (93.3%) | 4 (14.3%) |
| High School Diploma | 191 (81.3%) | 7 (3.1%) |
| College / Associate Degree | 182 (83.5%) | 0 (0.0%) |
| Bachelor's Degree or higher | 108 (98.2%) | 0 (0.0%) |
| Total | 509 (85.8%) | 12 (2.0%) |
Employment Occupations by Sex in Bally borough
Management, Business, Science and Arts Occupations
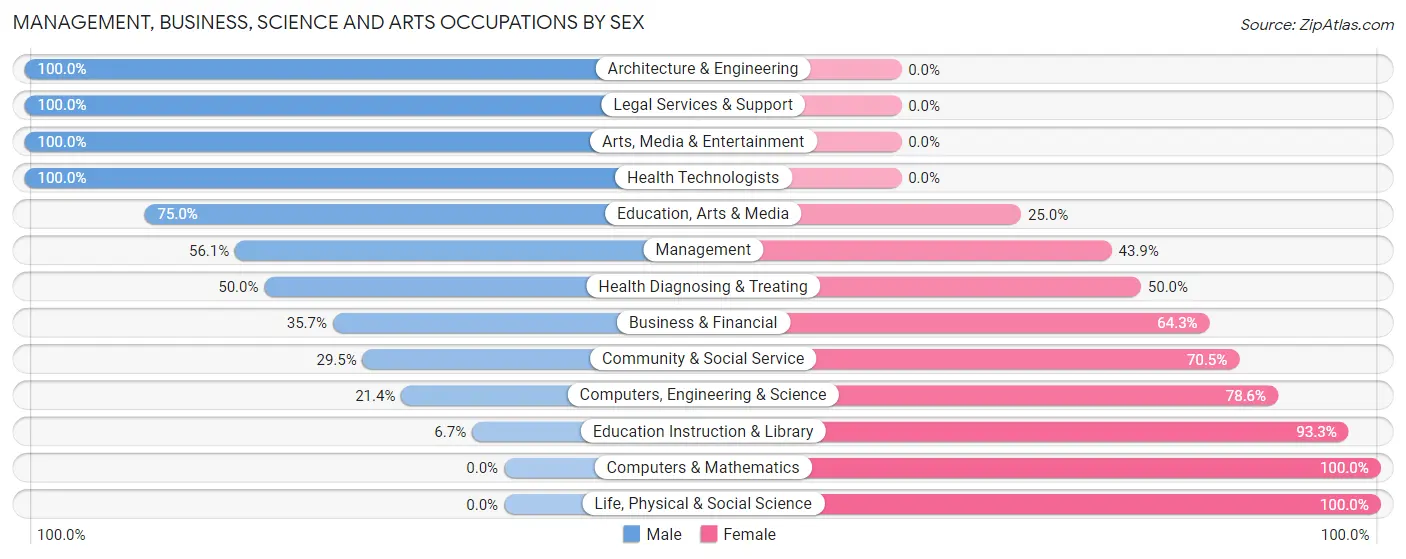
The most common Management, Business, Science and Arts occupations in Bally borough are Community & Social Service (61 | 9.7%), Education Instruction & Library (45 | 7.1%), Management (41 | 6.5%), Health Diagnosing & Treating (24 | 3.8%), and Business & Financial (14 | 2.2%).
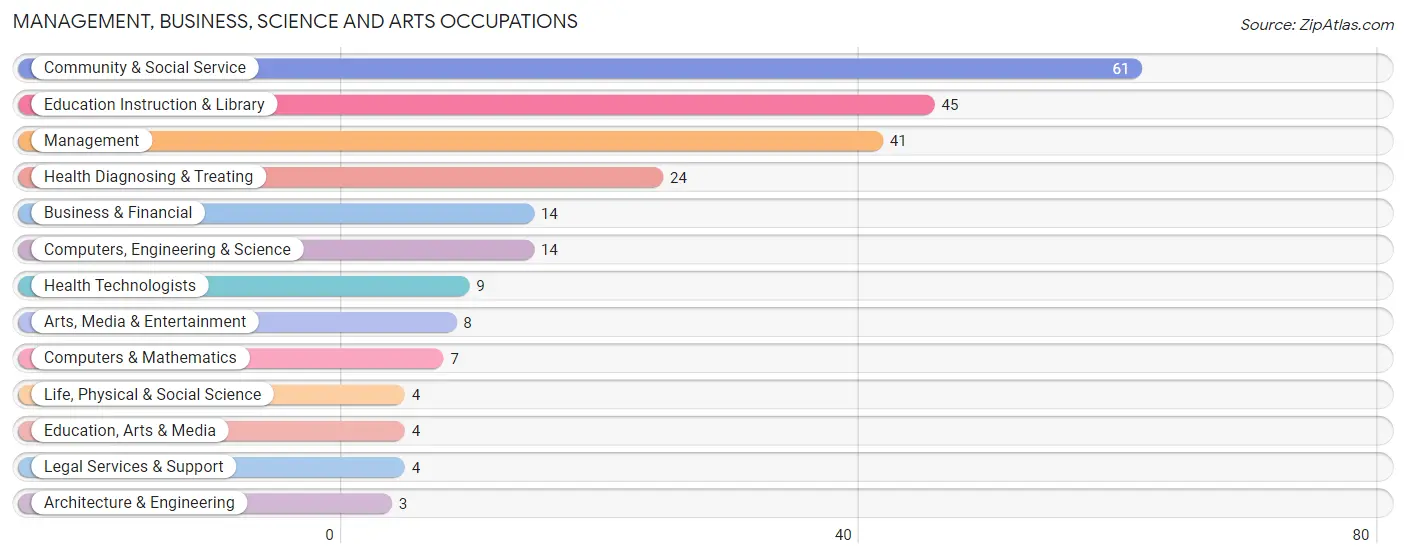
Management, Business, Science and Arts Occupations by Sex
Within the Management, Business, Science and Arts occupations in Bally borough, the most male-oriented occupations are Architecture & Engineering (100.0%), Legal Services & Support (100.0%), and Arts, Media & Entertainment (100.0%), while the most female-oriented occupations are Computers & Mathematics (100.0%), Life, Physical & Social Science (100.0%), and Education Instruction & Library (93.3%).
| Occupation | Male | Female |
| Management | 23 (56.1%) | 18 (43.9%) |
| Business & Financial | 5 (35.7%) | 9 (64.3%) |
| Computers, Engineering & Science | 3 (21.4%) | 11 (78.6%) |
| Computers & Mathematics | 0 (0.0%) | 7 (100.0%) |
| Architecture & Engineering | 3 (100.0%) | 0 (0.0%) |
| Life, Physical & Social Science | 0 (0.0%) | 4 (100.0%) |
| Community & Social Service | 18 (29.5%) | 43 (70.5%) |
| Education, Arts & Media | 3 (75.0%) | 1 (25.0%) |
| Legal Services & Support | 4 (100.0%) | 0 (0.0%) |
| Education Instruction & Library | 3 (6.7%) | 42 (93.3%) |
| Arts, Media & Entertainment | 8 (100.0%) | 0 (0.0%) |
| Health Diagnosing & Treating | 12 (50.0%) | 12 (50.0%) |
| Health Technologists | 9 (100.0%) | 0 (0.0%) |
| Total (Category) | 61 (39.6%) | 93 (60.4%) |
| Total (Overall) | 301 (47.7%) | 330 (52.3%) |
Services Occupations
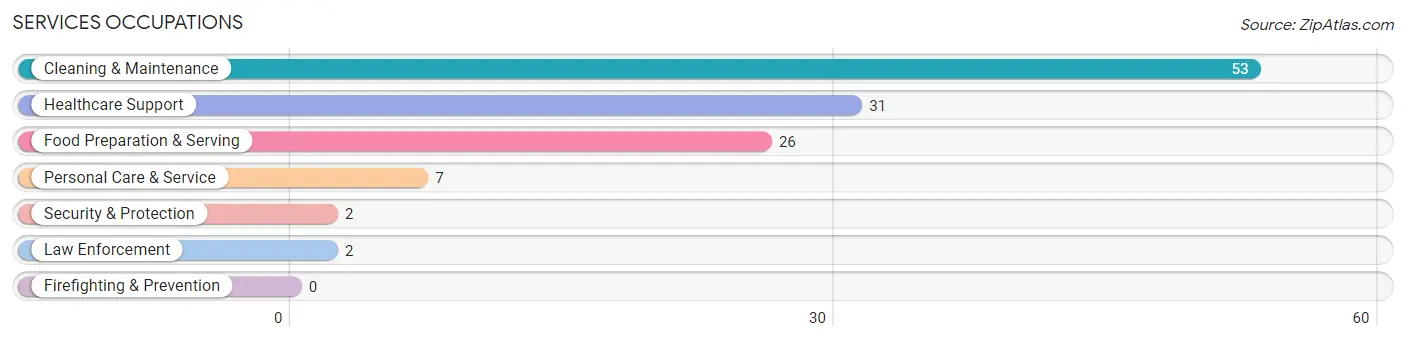
The most common Services occupations in Bally borough are Cleaning & Maintenance (53 | 8.4%), Healthcare Support (31 | 4.9%), Food Preparation & Serving (26 | 4.1%), Personal Care & Service (7 | 1.1%), and Security & Protection (2 | 0.3%).
Services Occupations by Sex
Within the Services occupations in Bally borough, the most male-oriented occupations are Security & Protection (100.0%), Law Enforcement (100.0%), and Cleaning & Maintenance (88.7%), while the most female-oriented occupations are Healthcare Support (100.0%), Personal Care & Service (100.0%), and Food Preparation & Serving (84.6%).
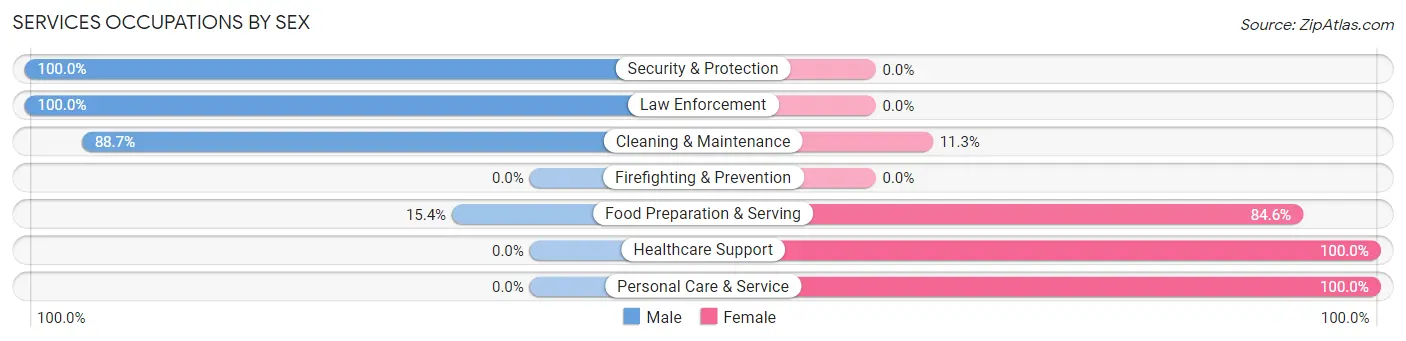
| Occupation | Male | Female |
| Healthcare Support | 0 (0.0%) | 31 (100.0%) |
| Security & Protection | 2 (100.0%) | 0 (0.0%) |
| Firefighting & Prevention | 0 (0.0%) | 0 (0.0%) |
| Law Enforcement | 2 (100.0%) | 0 (0.0%) |
| Food Preparation & Serving | 4 (15.4%) | 22 (84.6%) |
| Cleaning & Maintenance | 47 (88.7%) | 6 (11.3%) |
| Personal Care & Service | 0 (0.0%) | 7 (100.0%) |
| Total (Category) | 53 (44.5%) | 66 (55.5%) |
| Total (Overall) | 301 (47.7%) | 330 (52.3%) |
Sales and Office Occupations
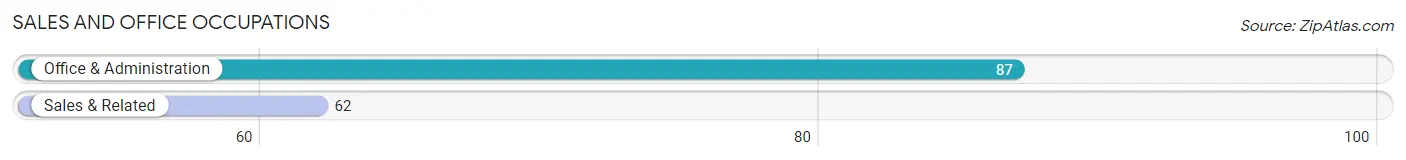
The most common Sales and Office occupations in Bally borough are Office & Administration (87 | 13.8%), and Sales & Related (62 | 9.8%).
Sales and Office Occupations by Sex
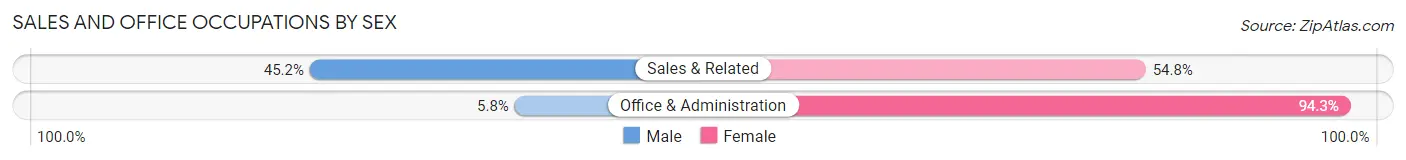
| Occupation | Male | Female |
| Sales & Related | 28 (45.2%) | 34 (54.8%) |
| Office & Administration | 5 (5.8%) | 82 (94.3%) |
| Total (Category) | 33 (22.2%) | 116 (77.8%) |
| Total (Overall) | 301 (47.7%) | 330 (52.3%) |
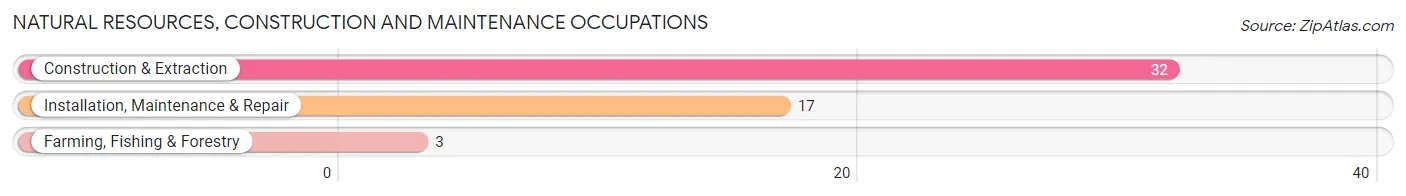
Natural Resources, Construction and Maintenance Occupations
The most common Natural Resources, Construction and Maintenance occupations in Bally borough are Construction & Extraction (32 | 5.1%), Installation, Maintenance & Repair (17 | 2.7%), and Farming, Fishing & Forestry (3 | 0.5%).
Natural Resources, Construction and Maintenance Occupations by Sex
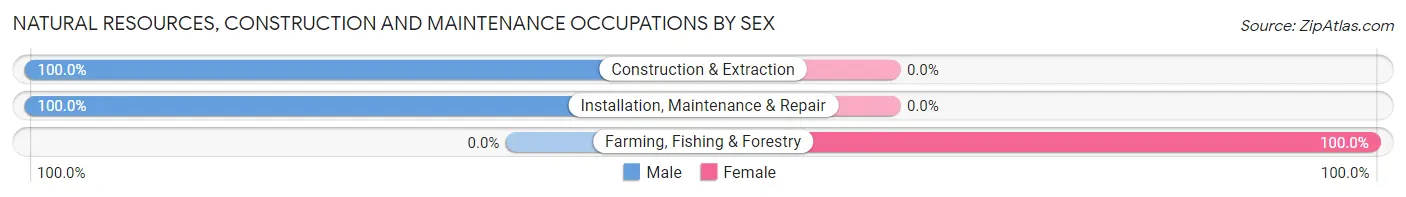
| Occupation | Male | Female |
| Farming, Fishing & Forestry | 0 (0.0%) | 3 (100.0%) |
| Construction & Extraction | 32 (100.0%) | 0 (0.0%) |
| Installation, Maintenance & Repair | 17 (100.0%) | 0 (0.0%) |
| Total (Category) | 49 (94.2%) | 3 (5.8%) |
| Total (Overall) | 301 (47.7%) | 330 (52.3%) |
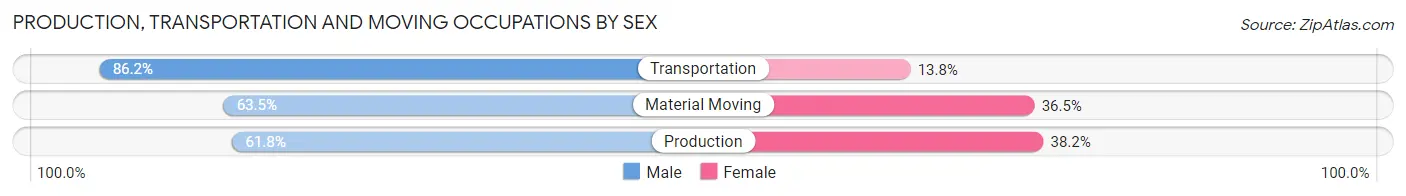
Production, Transportation and Moving Occupations
The most common Production, Transportation and Moving occupations in Bally borough are Production (76 | 12.0%), Material Moving (52 | 8.2%), and Transportation (29 | 4.6%).
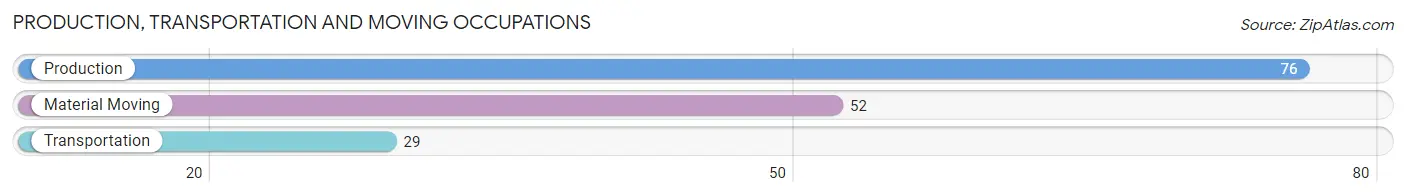
Production, Transportation and Moving Occupations by Sex
| Occupation | Male | Female |
| Production | 47 (61.8%) | 29 (38.2%) |
| Transportation | 25 (86.2%) | 4 (13.8%) |
| Material Moving | 33 (63.5%) | 19 (36.5%) |
| Total (Category) | 105 (66.9%) | 52 (33.1%) |
| Total (Overall) | 301 (47.7%) | 330 (52.3%) |
Employment Industries by Sex in Bally borough
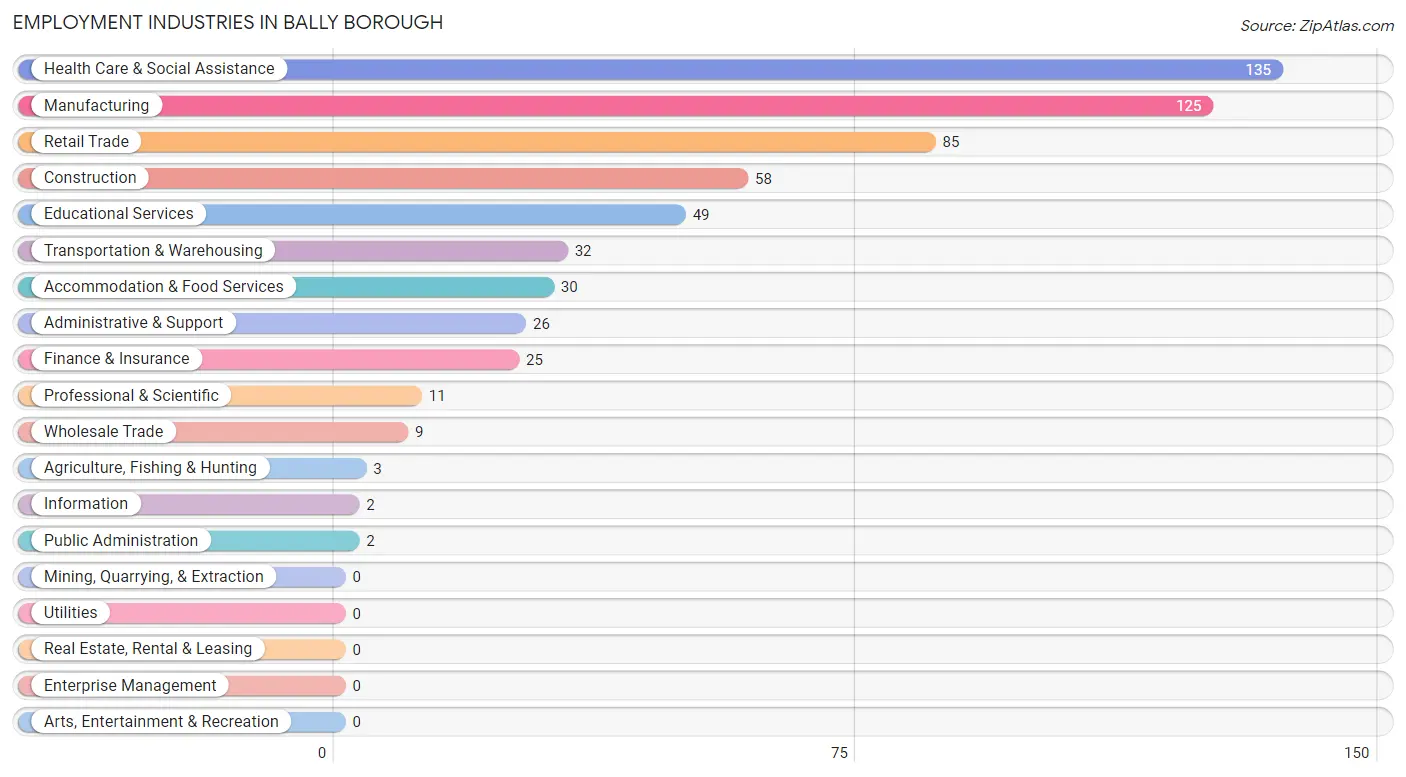
Employment Industries in Bally borough
The major employment industries in Bally borough include Health Care & Social Assistance (135 | 21.4%), Manufacturing (125 | 19.8%), Retail Trade (85 | 13.5%), Construction (58 | 9.2%), and Educational Services (49 | 7.8%).
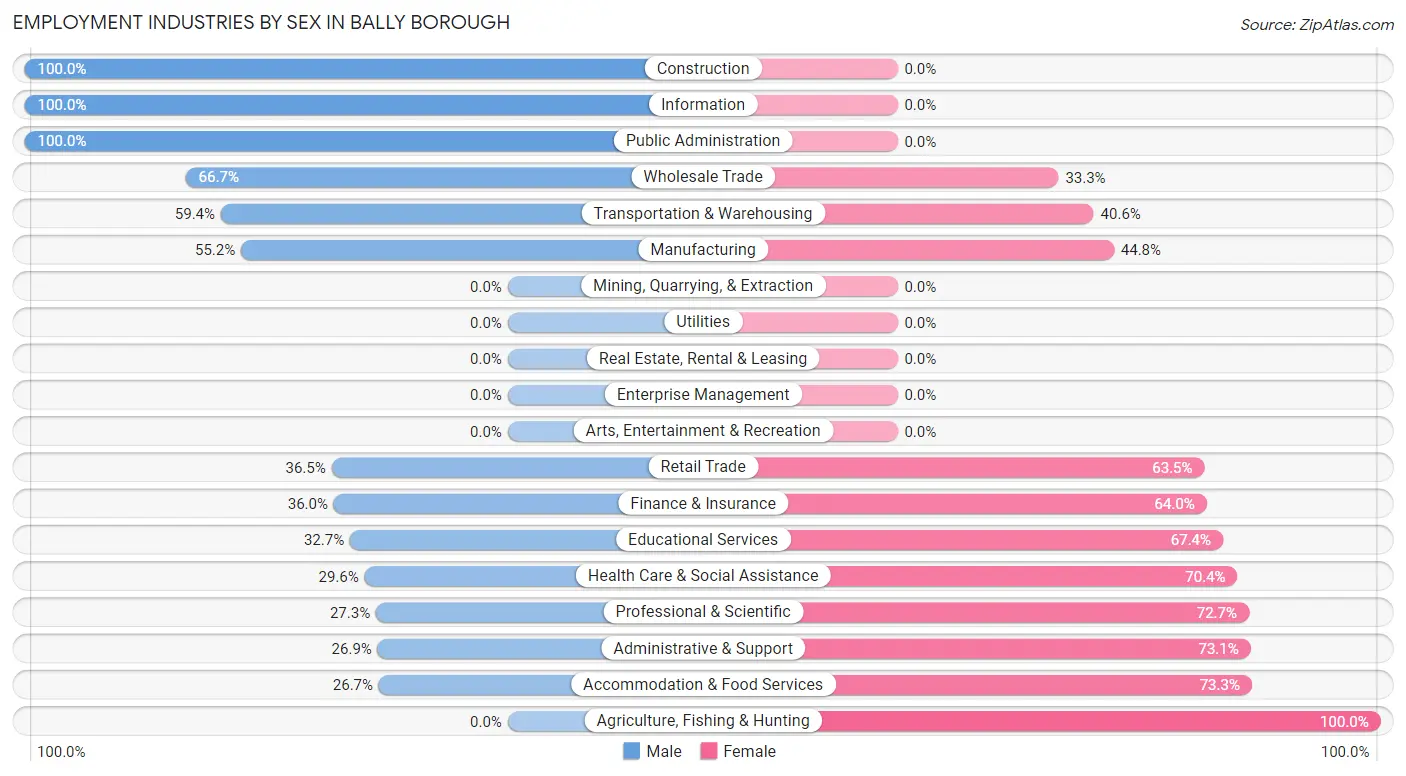
Employment Industries by Sex in Bally borough
The Bally borough industries that see more men than women are Construction (100.0%), Information (100.0%), and Public Administration (100.0%), whereas the industries that tend to have a higher number of women are Agriculture, Fishing & Hunting (100.0%), Accommodation & Food Services (73.3%), and Administrative & Support (73.1%).
| Industry | Male | Female |
| Agriculture, Fishing & Hunting | 0 (0.0%) | 3 (100.0%) |
| Mining, Quarrying, & Extraction | 0 (0.0%) | 0 (0.0%) |
| Construction | 58 (100.0%) | 0 (0.0%) |
| Manufacturing | 69 (55.2%) | 56 (44.8%) |
| Wholesale Trade | 6 (66.7%) | 3 (33.3%) |
| Retail Trade | 31 (36.5%) | 54 (63.5%) |
| Transportation & Warehousing | 19 (59.4%) | 13 (40.6%) |
| Utilities | 0 (0.0%) | 0 (0.0%) |
| Information | 2 (100.0%) | 0 (0.0%) |
| Finance & Insurance | 9 (36.0%) | 16 (64.0%) |
| Real Estate, Rental & Leasing | 0 (0.0%) | 0 (0.0%) |
| Professional & Scientific | 3 (27.3%) | 8 (72.7%) |
| Enterprise Management | 0 (0.0%) | 0 (0.0%) |
| Administrative & Support | 7 (26.9%) | 19 (73.1%) |
| Educational Services | 16 (32.7%) | 33 (67.3%) |
| Health Care & Social Assistance | 40 (29.6%) | 95 (70.4%) |
| Arts, Entertainment & Recreation | 0 (0.0%) | 0 (0.0%) |
| Accommodation & Food Services | 8 (26.7%) | 22 (73.3%) |
| Public Administration | 2 (100.0%) | 0 (0.0%) |
| Total | 301 (47.7%) | 330 (52.3%) |
Education in Bally borough
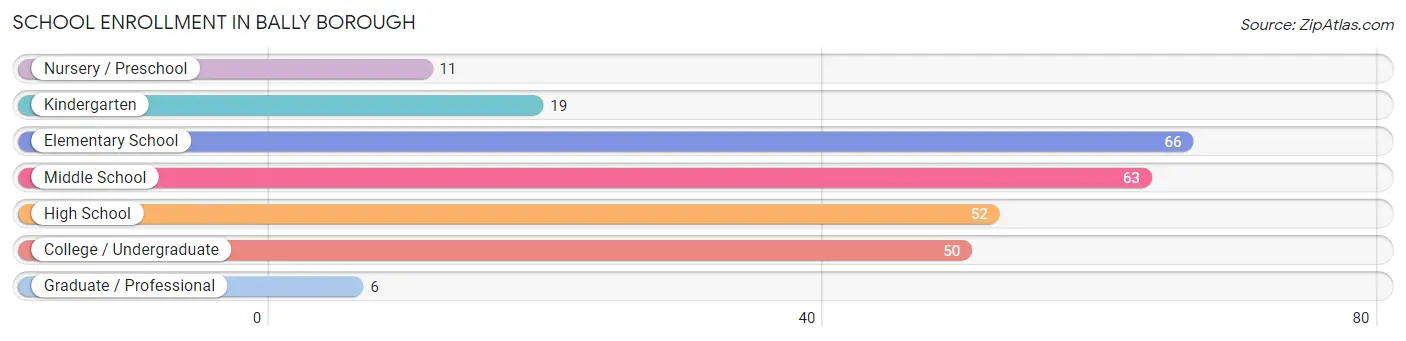
School Enrollment in Bally borough
The most common levels of schooling among the 267 students in Bally borough are elementary school (66 | 24.7%), middle school (63 | 23.6%), and high school (52 | 19.5%).
| School Level | # Students | % Students |
| Nursery / Preschool | 11 | 4.1% |
| Kindergarten | 19 | 7.1% |
| Elementary School | 66 | 24.7% |
| Middle School | 63 | 23.6% |
| High School | 52 | 19.5% |
| College / Undergraduate | 50 | 18.7% |
| Graduate / Professional | 6 | 2.2% |
| Total | 267 | 100.0% |
School Enrollment by Age by Funding Source in Bally borough
Out of a total of 267 students who are enrolled in schools in Bally borough, 48 (18.0%) attend a private institution, while the remaining 219 (82.0%) are enrolled in public schools. The age group of 3 to 4 year olds has the highest likelihood of being enrolled in private schools, with 10 (90.9% in the age bracket) enrolled. Conversely, the age group of 5 to 9 year old has the lowest likelihood of being enrolled in a private school, with 85 (100.0% in the age bracket) attending a public institution.
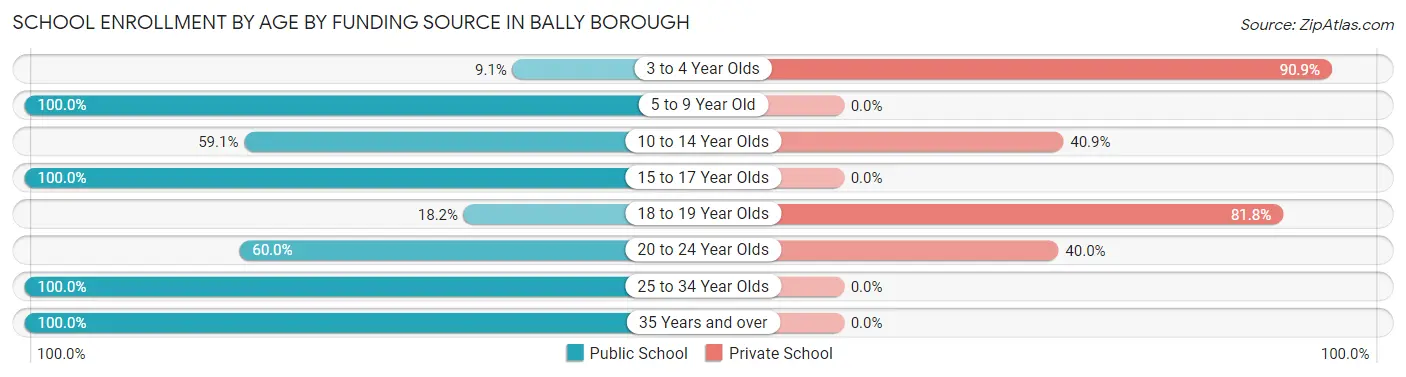
| Age Bracket | Public School | Private School |
| 3 to 4 Year Olds | 1 (9.1%) | 10 (90.9%) |
| 5 to 9 Year Old | 85 (100.0%) | 0 (0.0%) |
| 10 to 14 Year Olds | 39 (59.1%) | 27 (40.9%) |
| 15 to 17 Year Olds | 49 (100.0%) | 0 (0.0%) |
| 18 to 19 Year Olds | 2 (18.2%) | 9 (81.8%) |
| 20 to 24 Year Olds | 3 (60.0%) | 2 (40.0%) |
| 25 to 34 Year Olds | 23 (100.0%) | 0 (0.0%) |
| 35 Years and over | 17 (100.0%) | 0 (0.0%) |
| Total | 219 (82.0%) | 48 (18.0%) |
Educational Attainment by Field of Study in Bally borough
Education (30 | 16.5%), business (27 | 14.8%), science & technology (22 | 12.1%), psychology (16 | 8.8%), and social sciences (14 | 7.7%) are the most common fields of study among 182 individuals in Bally borough who have obtained a bachelor's degree or higher.
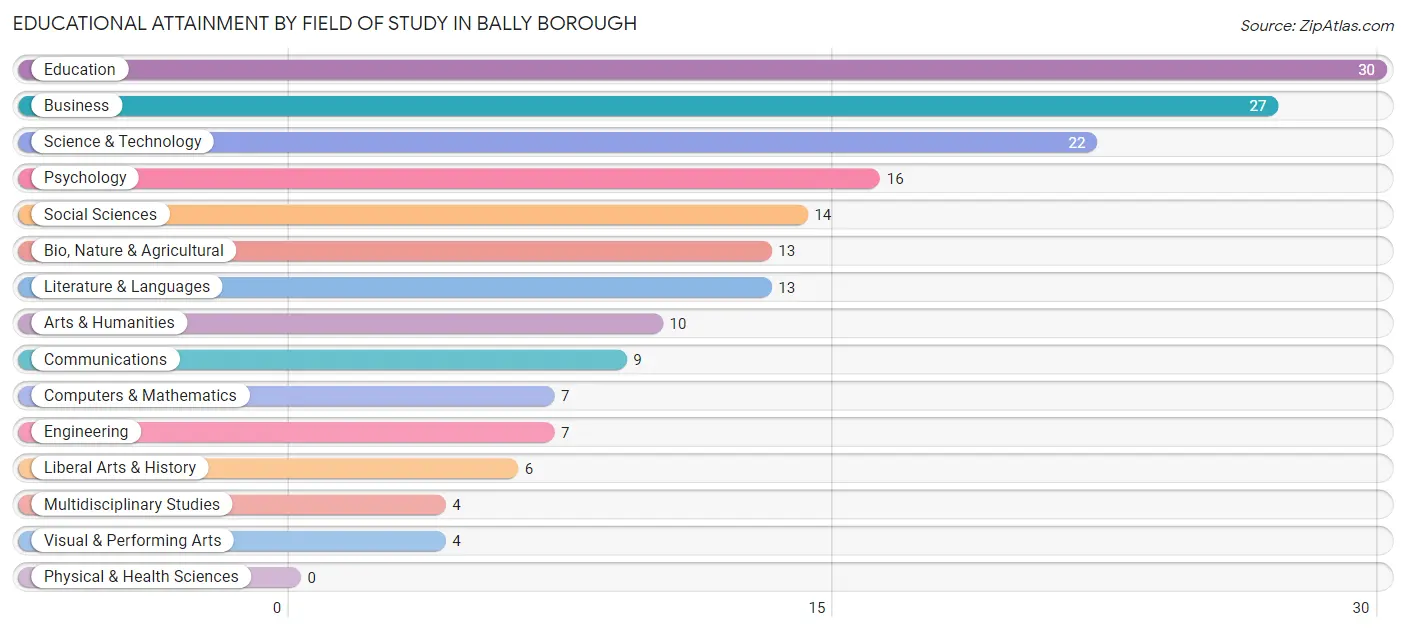
| Field of Study | # Graduates | % Graduates |
| Computers & Mathematics | 7 | 3.8% |
| Bio, Nature & Agricultural | 13 | 7.1% |
| Physical & Health Sciences | 0 | 0.0% |
| Psychology | 16 | 8.8% |
| Social Sciences | 14 | 7.7% |
| Engineering | 7 | 3.8% |
| Multidisciplinary Studies | 4 | 2.2% |
| Science & Technology | 22 | 12.1% |
| Business | 27 | 14.8% |
| Education | 30 | 16.5% |
| Literature & Languages | 13 | 7.1% |
| Liberal Arts & History | 6 | 3.3% |
| Visual & Performing Arts | 4 | 2.2% |
| Communications | 9 | 5.0% |
| Arts & Humanities | 10 | 5.5% |
| Total | 182 | 100.0% |
Transportation & Commute in Bally borough
Vehicle Availability by Sex in Bally borough
The most prevalent vehicle ownership categories in Bally borough are males with 2 vehicles (166, accounting for 55.7%) and females with 2 vehicles (117, making up 53.2%).
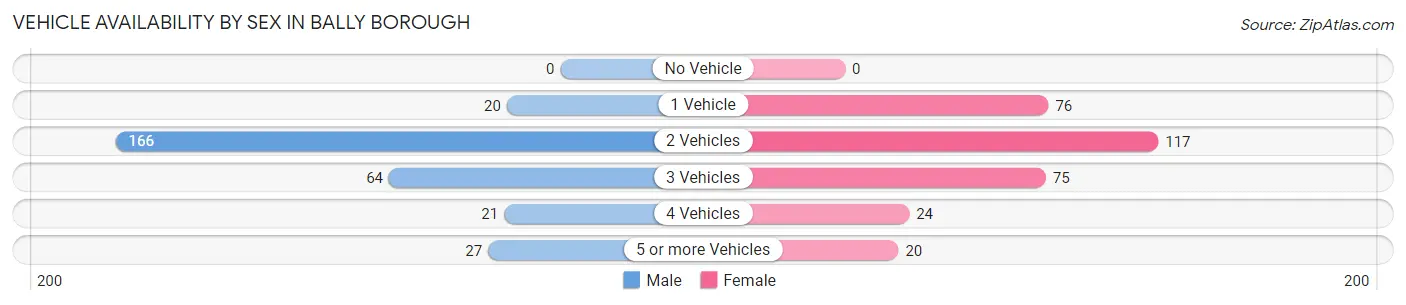
| Vehicles Available | Male | Female |
| No Vehicle | 0 (0.0%) | 0 (0.0%) |
| 1 Vehicle | 20 (6.7%) | 76 (24.4%) |
| 2 Vehicles | 166 (55.7%) | 117 (37.5%) |
| 3 Vehicles | 64 (21.5%) | 75 (24.0%) |
| 4 Vehicles | 21 (7.0%) | 24 (7.7%) |
| 5 or more Vehicles | 27 (9.1%) | 20 (6.4%) |
| Total | 298 (100.0%) | 312 (100.0%) |
Commute Time in Bally borough
The most frequently occuring commute durations in Bally borough are 15 to 19 minutes (86 commuters, 14.8%), 30 to 34 minutes (76 commuters, 13.1%), and 20 to 24 minutes (71 commuters, 12.2%).
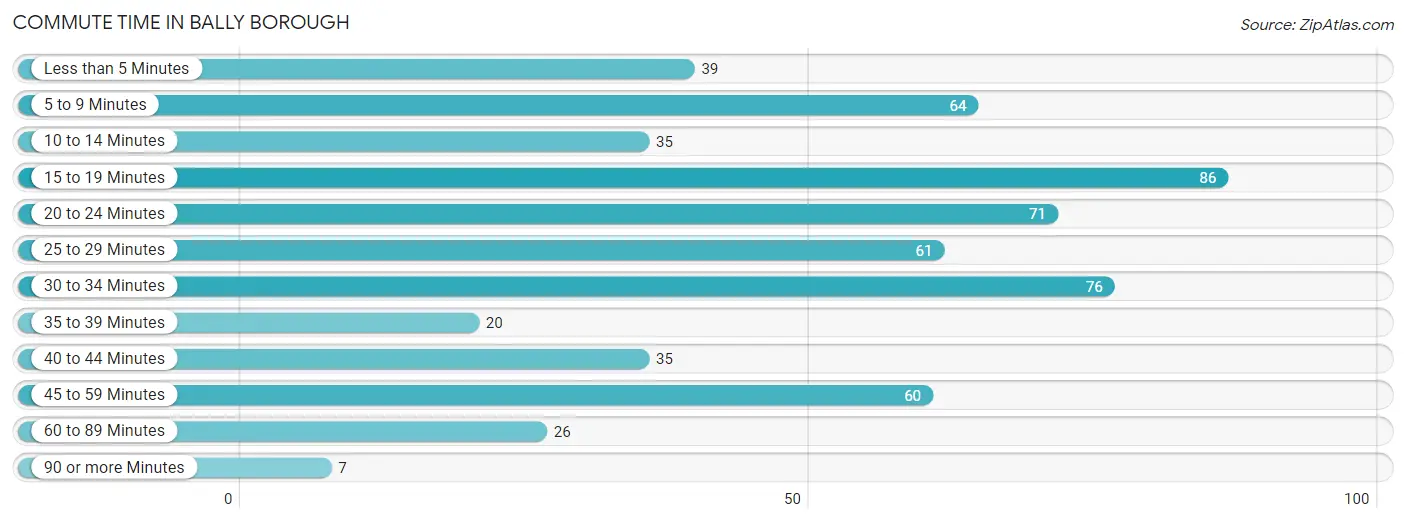
| Commute Time | # Commuters | % Commuters |
| Less than 5 Minutes | 39 | 6.7% |
| 5 to 9 Minutes | 64 | 11.0% |
| 10 to 14 Minutes | 35 | 6.0% |
| 15 to 19 Minutes | 86 | 14.8% |
| 20 to 24 Minutes | 71 | 12.2% |
| 25 to 29 Minutes | 61 | 10.5% |
| 30 to 34 Minutes | 76 | 13.1% |
| 35 to 39 Minutes | 20 | 3.5% |
| 40 to 44 Minutes | 35 | 6.0% |
| 45 to 59 Minutes | 60 | 10.3% |
| 60 to 89 Minutes | 26 | 4.5% |
| 90 or more Minutes | 7 | 1.2% |
Commute Time by Sex in Bally borough
The most common commute times in Bally borough are 30 to 34 minutes (45 commuters, 15.6%) for males and 15 to 19 minutes (64 commuters, 21.9%) for females.
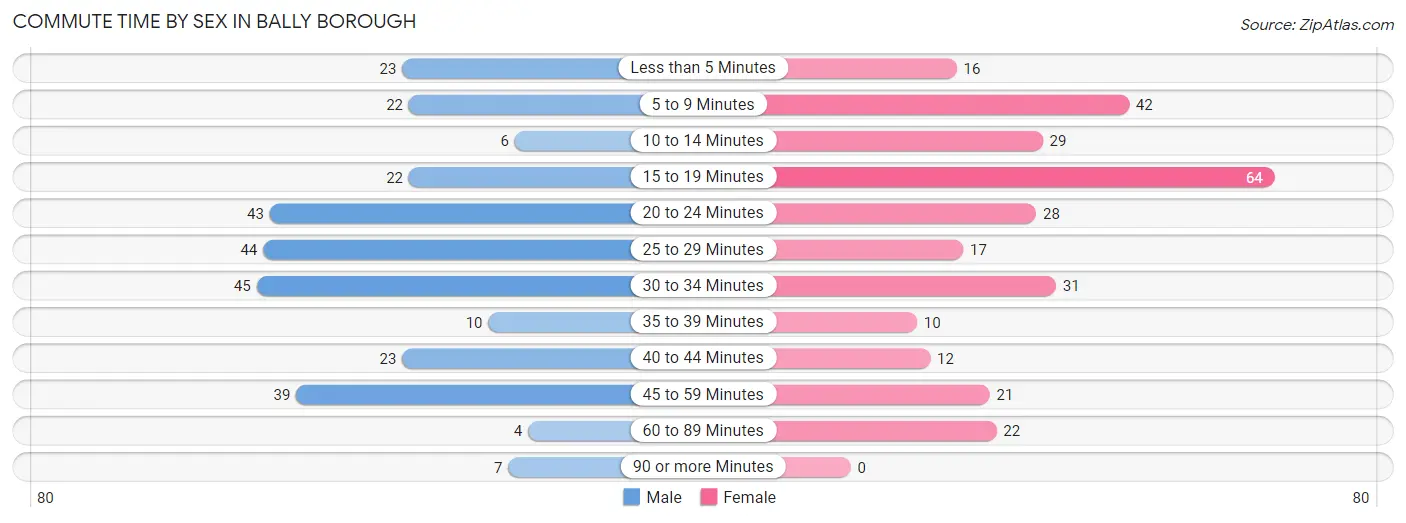
| Commute Time | Male | Female |
| Less than 5 Minutes | 23 (8.0%) | 16 (5.5%) |
| 5 to 9 Minutes | 22 (7.6%) | 42 (14.4%) |
| 10 to 14 Minutes | 6 (2.1%) | 29 (9.9%) |
| 15 to 19 Minutes | 22 (7.6%) | 64 (21.9%) |
| 20 to 24 Minutes | 43 (14.9%) | 28 (9.6%) |
| 25 to 29 Minutes | 44 (15.3%) | 17 (5.8%) |
| 30 to 34 Minutes | 45 (15.6%) | 31 (10.6%) |
| 35 to 39 Minutes | 10 (3.5%) | 10 (3.4%) |
| 40 to 44 Minutes | 23 (8.0%) | 12 (4.1%) |
| 45 to 59 Minutes | 39 (13.5%) | 21 (7.2%) |
| 60 to 89 Minutes | 4 (1.4%) | 22 (7.5%) |
| 90 or more Minutes | 7 (2.4%) | 0 (0.0%) |
Time of Departure to Work by Sex in Bally borough
The most frequent times of departure to work in Bally borough are 12:00 PM to 3:59 PM (58, 20.1%) for males and 7:00 AM to 7:29 AM (70, 24.0%) for females.
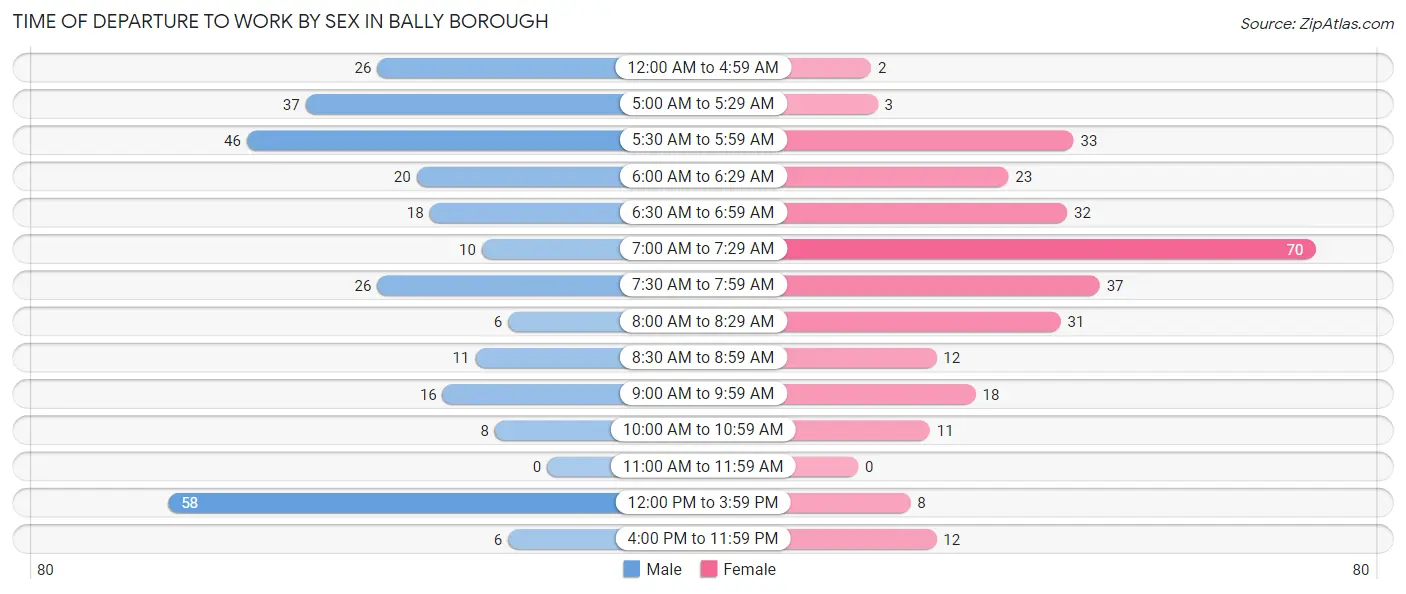
| Time of Departure | Male | Female |
| 12:00 AM to 4:59 AM | 26 (9.0%) | 2 (0.7%) |
| 5:00 AM to 5:29 AM | 37 (12.9%) | 3 (1.0%) |
| 5:30 AM to 5:59 AM | 46 (16.0%) | 33 (11.3%) |
| 6:00 AM to 6:29 AM | 20 (6.9%) | 23 (7.9%) |
| 6:30 AM to 6:59 AM | 18 (6.2%) | 32 (11.0%) |
| 7:00 AM to 7:29 AM | 10 (3.5%) | 70 (24.0%) |
| 7:30 AM to 7:59 AM | 26 (9.0%) | 37 (12.7%) |
| 8:00 AM to 8:29 AM | 6 (2.1%) | 31 (10.6%) |
| 8:30 AM to 8:59 AM | 11 (3.8%) | 12 (4.1%) |
| 9:00 AM to 9:59 AM | 16 (5.6%) | 18 (6.2%) |
| 10:00 AM to 10:59 AM | 8 (2.8%) | 11 (3.8%) |
| 11:00 AM to 11:59 AM | 0 (0.0%) | 0 (0.0%) |
| 12:00 PM to 3:59 PM | 58 (20.1%) | 8 (2.7%) |
| 4:00 PM to 11:59 PM | 6 (2.1%) | 12 (4.1%) |
| Total | 288 (100.0%) | 292 (100.0%) |
Housing Occupancy in Bally borough
Occupancy by Ownership in Bally borough
Of the total 455 dwellings in Bally borough, owner-occupied units account for 324 (71.2%), while renter-occupied units make up 131 (28.8%).
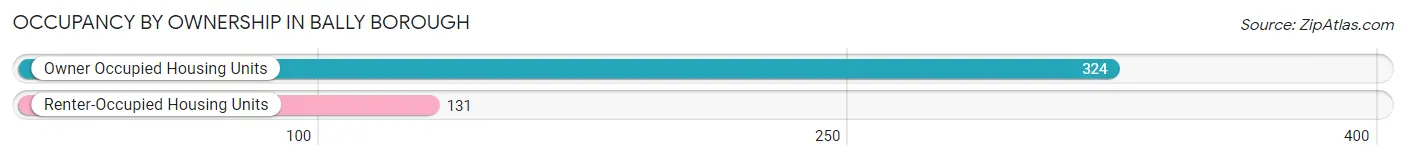
| Occupancy | # Housing Units | % Housing Units |
| Owner Occupied Housing Units | 324 | 71.2% |
| Renter-Occupied Housing Units | 131 | 28.8% |
| Total Occupied Housing Units | 455 | 100.0% |
Occupancy by Household Size in Bally borough
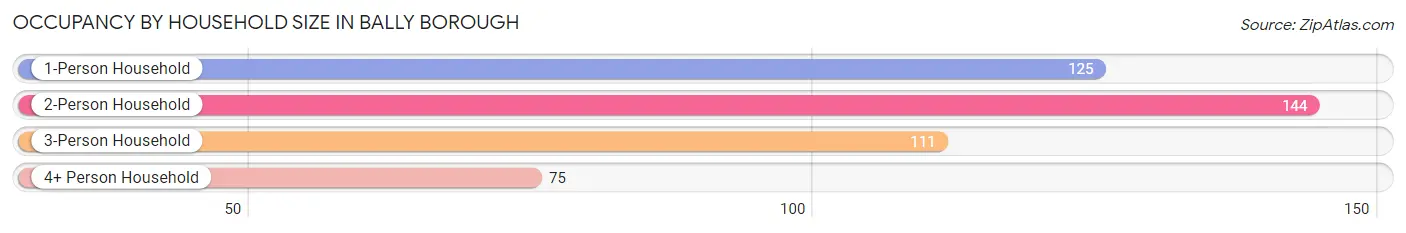
| Household Size | # Housing Units | % Housing Units |
| 1-Person Household | 125 | 27.5% |
| 2-Person Household | 144 | 31.7% |
| 3-Person Household | 111 | 24.4% |
| 4+ Person Household | 75 | 16.5% |
| Total Housing Units | 455 | 100.0% |
Occupancy by Ownership by Household Size in Bally borough
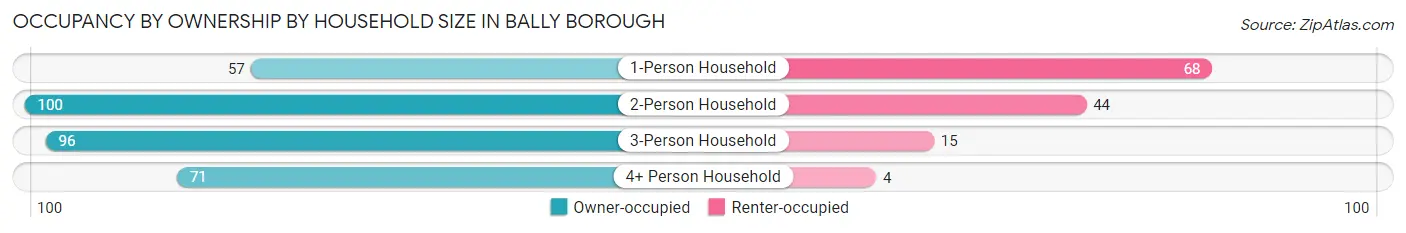
| Household Size | Owner-occupied | Renter-occupied |
| 1-Person Household | 57 (45.6%) | 68 (54.4%) |
| 2-Person Household | 100 (69.4%) | 44 (30.6%) |
| 3-Person Household | 96 (86.5%) | 15 (13.5%) |
| 4+ Person Household | 71 (94.7%) | 4 (5.3%) |
| Total Housing Units | 324 (71.2%) | 131 (28.8%) |
Occupancy by Educational Attainment in Bally borough
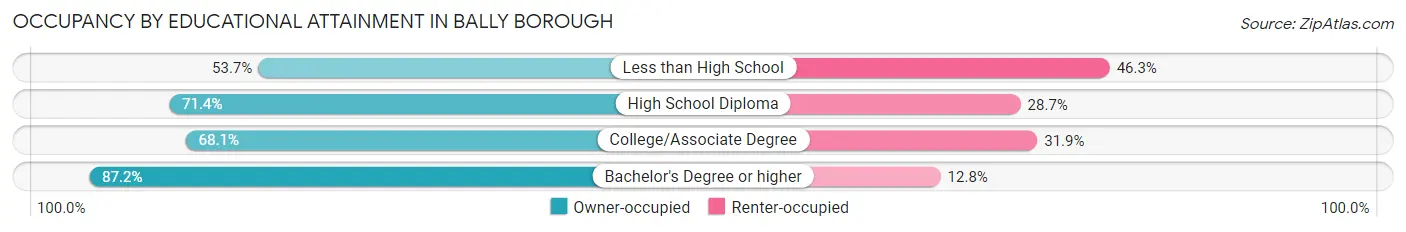
| Household Size | Owner-occupied | Renter-occupied |
| Less than High School | 29 (53.7%) | 25 (46.3%) |
| High School Diploma | 122 (71.4%) | 49 (28.6%) |
| College/Associate Degree | 98 (68.1%) | 46 (31.9%) |
| Bachelor's Degree or higher | 75 (87.2%) | 11 (12.8%) |
Occupancy by Age of Householder in Bally borough
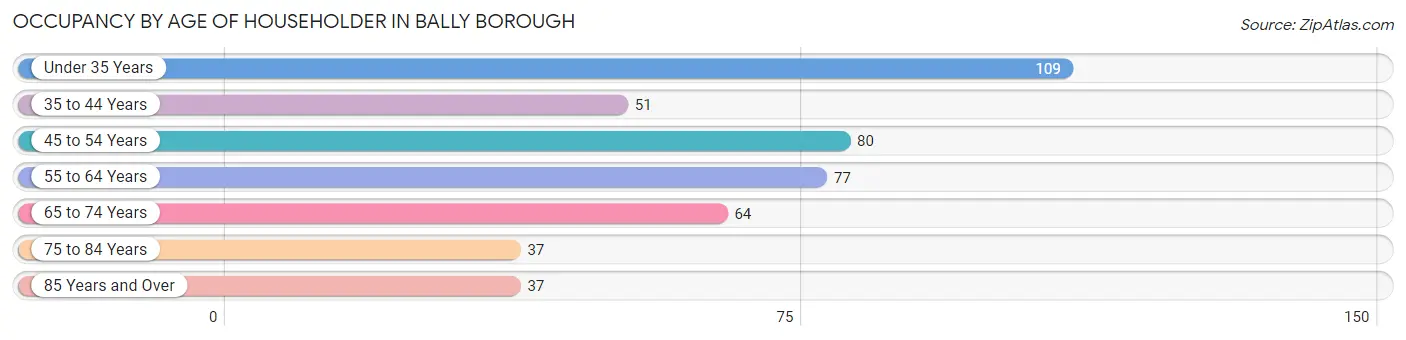
| Age Bracket | # Households | % Households |
| Under 35 Years | 109 | 24.0% |
| 35 to 44 Years | 51 | 11.2% |
| 45 to 54 Years | 80 | 17.6% |
| 55 to 64 Years | 77 | 16.9% |
| 65 to 74 Years | 64 | 14.1% |
| 75 to 84 Years | 37 | 8.1% |
| 85 Years and Over | 37 | 8.1% |
| Total | 455 | 100.0% |
Housing Finances in Bally borough
Median Income by Occupancy in Bally borough
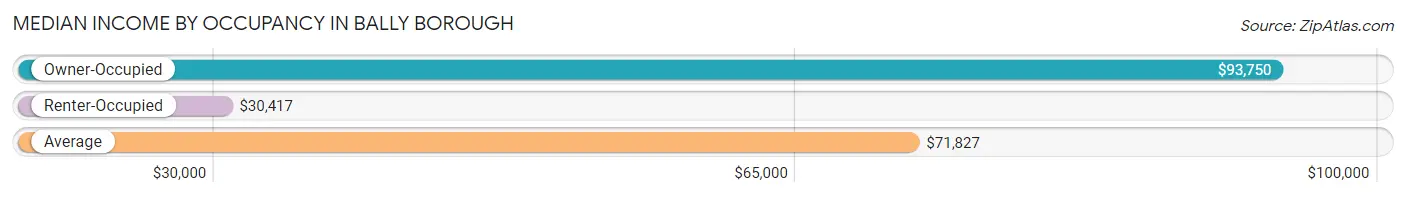
| Occupancy Type | # Households | Median Income |
| Owner-Occupied | 324 (71.2%) | $93,750 |
| Renter-Occupied | 131 (28.8%) | $30,417 |
| Average | 455 (100.0%) | $71,827 |
Occupancy by Householder Income Bracket in Bally borough
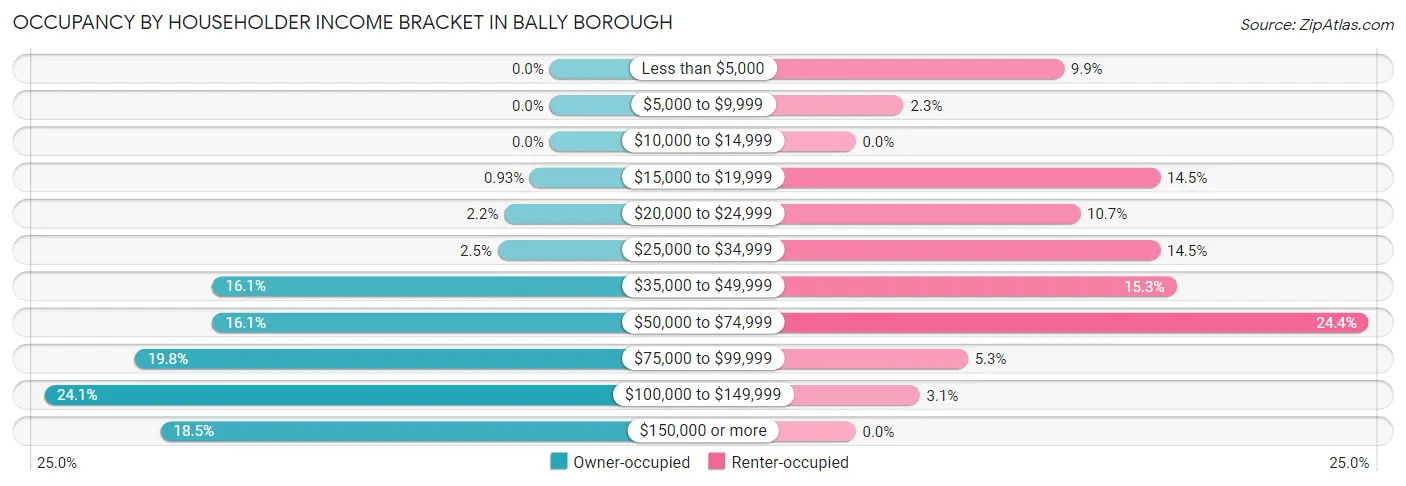
| Income Bracket | Owner-occupied | Renter-occupied |
| Less than $5,000 | 0 (0.0%) | 13 (9.9%) |
| $5,000 to $9,999 | 0 (0.0%) | 3 (2.3%) |
| $10,000 to $14,999 | 0 (0.0%) | 0 (0.0%) |
| $15,000 to $19,999 | 3 (0.9%) | 19 (14.5%) |
| $20,000 to $24,999 | 7 (2.2%) | 14 (10.7%) |
| $25,000 to $34,999 | 8 (2.5%) | 19 (14.5%) |
| $35,000 to $49,999 | 52 (16.1%) | 20 (15.3%) |
| $50,000 to $74,999 | 52 (16.1%) | 32 (24.4%) |
| $75,000 to $99,999 | 64 (19.8%) | 7 (5.3%) |
| $100,000 to $149,999 | 78 (24.1%) | 4 (3.0%) |
| $150,000 or more | 60 (18.5%) | 0 (0.0%) |
| Total | 324 (100.0%) | 131 (100.0%) |
Monthly Housing Cost Tiers in Bally borough
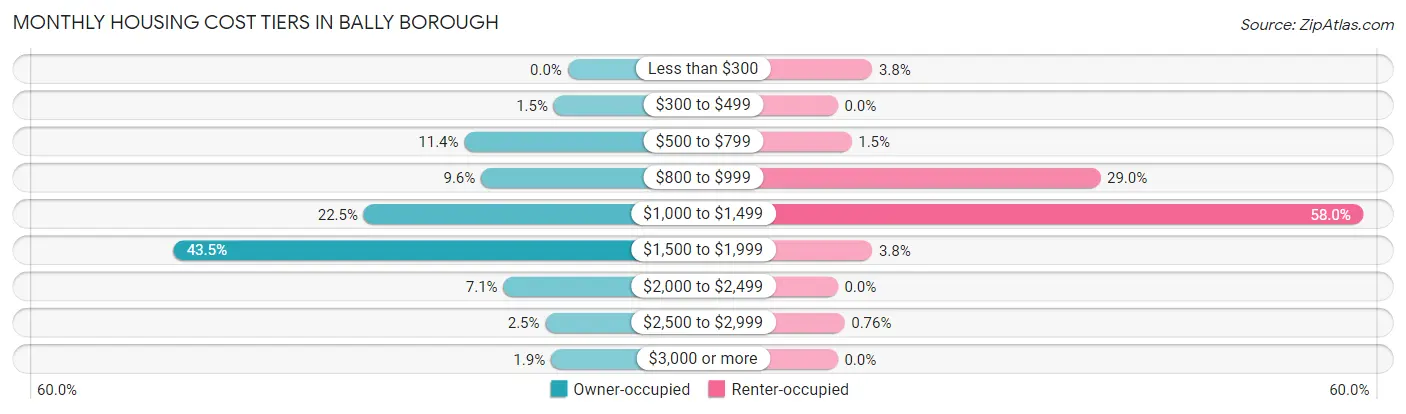
| Monthly Cost | Owner-occupied | Renter-occupied |
| Less than $300 | 0 (0.0%) | 5 (3.8%) |
| $300 to $499 | 5 (1.5%) | 0 (0.0%) |
| $500 to $799 | 37 (11.4%) | 2 (1.5%) |
| $800 to $999 | 31 (9.6%) | 38 (29.0%) |
| $1,000 to $1,499 | 73 (22.5%) | 76 (58.0%) |
| $1,500 to $1,999 | 141 (43.5%) | 5 (3.8%) |
| $2,000 to $2,499 | 23 (7.1%) | 0 (0.0%) |
| $2,500 to $2,999 | 8 (2.5%) | 1 (0.8%) |
| $3,000 or more | 6 (1.8%) | 0 (0.0%) |
| Total | 324 (100.0%) | 131 (100.0%) |
Physical Housing Characteristics in Bally borough
Housing Structures in Bally borough
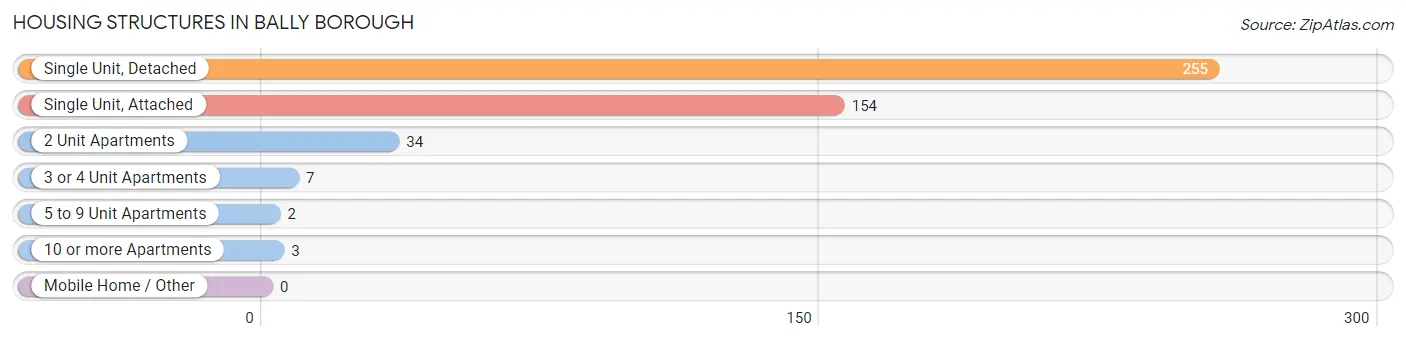
| Structure Type | # Housing Units | % Housing Units |
| Single Unit, Detached | 255 | 56.0% |
| Single Unit, Attached | 154 | 33.9% |
| 2 Unit Apartments | 34 | 7.5% |
| 3 or 4 Unit Apartments | 7 | 1.5% |
| 5 to 9 Unit Apartments | 2 | 0.4% |
| 10 or more Apartments | 3 | 0.7% |
| Mobile Home / Other | 0 | 0.0% |
| Total | 455 | 100.0% |
Housing Structures by Occupancy in Bally borough
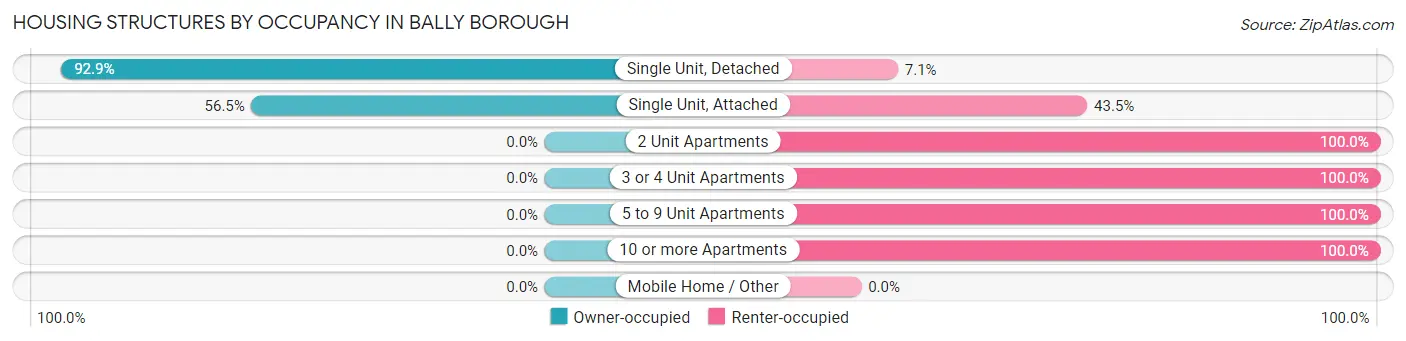
| Structure Type | Owner-occupied | Renter-occupied |
| Single Unit, Detached | 237 (92.9%) | 18 (7.1%) |
| Single Unit, Attached | 87 (56.5%) | 67 (43.5%) |
| 2 Unit Apartments | 0 (0.0%) | 34 (100.0%) |
| 3 or 4 Unit Apartments | 0 (0.0%) | 7 (100.0%) |
| 5 to 9 Unit Apartments | 0 (0.0%) | 2 (100.0%) |
| 10 or more Apartments | 0 (0.0%) | 3 (100.0%) |
| Mobile Home / Other | 0 (0.0%) | 0 (0.0%) |
| Total | 324 (71.2%) | 131 (28.8%) |
Housing Structures by Number of Rooms in Bally borough
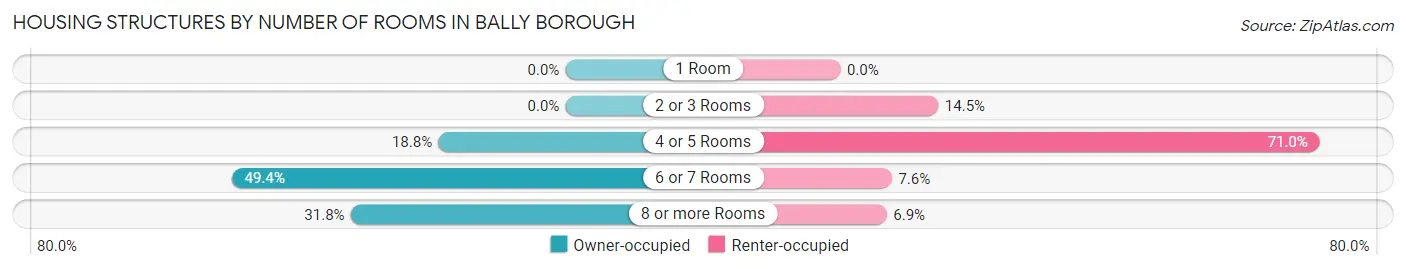
| Number of Rooms | Owner-occupied | Renter-occupied |
| 1 Room | 0 (0.0%) | 0 (0.0%) |
| 2 or 3 Rooms | 0 (0.0%) | 19 (14.5%) |
| 4 or 5 Rooms | 61 (18.8%) | 93 (71.0%) |
| 6 or 7 Rooms | 160 (49.4%) | 10 (7.6%) |
| 8 or more Rooms | 103 (31.8%) | 9 (6.9%) |
| Total | 324 (100.0%) | 131 (100.0%) |
Housing Structure by Heating Type in Bally borough
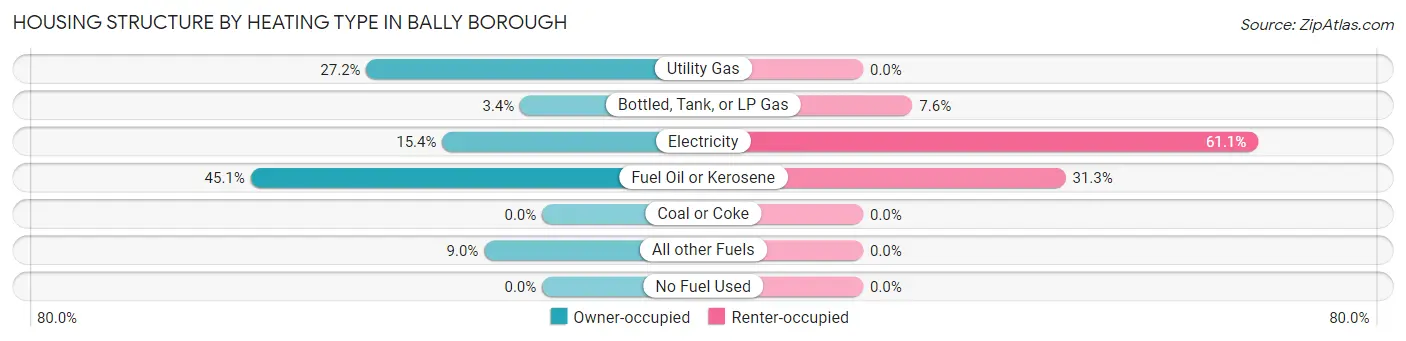
| Heating Type | Owner-occupied | Renter-occupied |
| Utility Gas | 88 (27.2%) | 0 (0.0%) |
| Bottled, Tank, or LP Gas | 11 (3.4%) | 10 (7.6%) |
| Electricity | 50 (15.4%) | 80 (61.1%) |
| Fuel Oil or Kerosene | 146 (45.1%) | 41 (31.3%) |
| Coal or Coke | 0 (0.0%) | 0 (0.0%) |
| All other Fuels | 29 (8.9%) | 0 (0.0%) |
| No Fuel Used | 0 (0.0%) | 0 (0.0%) |
| Total | 324 (100.0%) | 131 (100.0%) |
Household Vehicle Usage in Bally borough
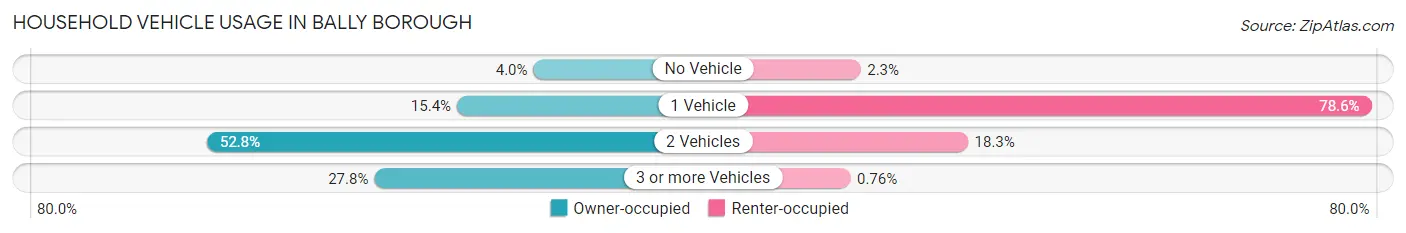
| Vehicles per Household | Owner-occupied | Renter-occupied |
| No Vehicle | 13 (4.0%) | 3 (2.3%) |
| 1 Vehicle | 50 (15.4%) | 103 (78.6%) |
| 2 Vehicles | 171 (52.8%) | 24 (18.3%) |
| 3 or more Vehicles | 90 (27.8%) | 1 (0.8%) |
| Total | 324 (100.0%) | 131 (100.0%) |
Real Estate & Mortgages in Bally borough
Real Estate and Mortgage Overview in Bally borough
| Characteristic | Without Mortgage | With Mortgage |
| Housing Units | 76 | 248 |
| Median Property Value | $218,000 | $218,500 |
| Median Household Income | $66,250 | $54 |
| Monthly Housing Costs | $767 | $6 |
| Real Estate Taxes | $4,600 | $0 |
Property Value by Mortgage Status in Bally borough
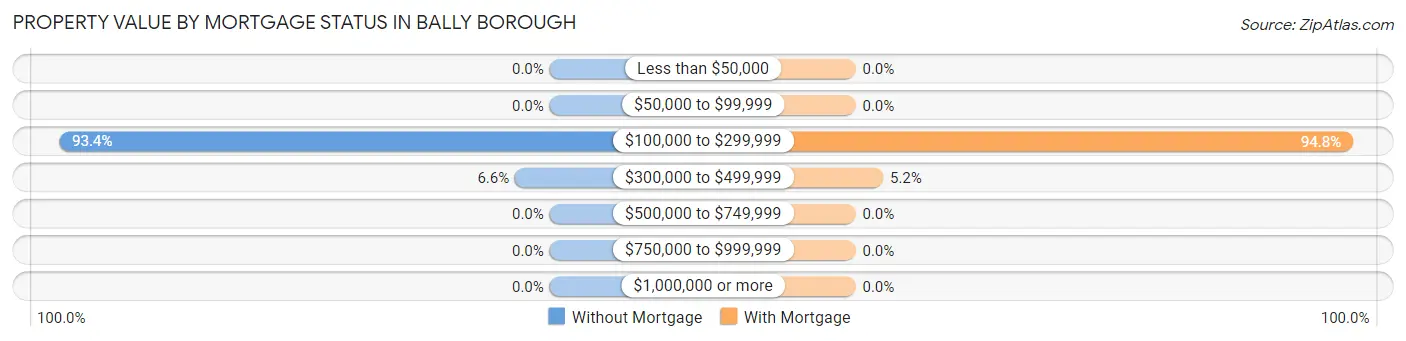
| Property Value | Without Mortgage | With Mortgage |
| Less than $50,000 | 0 (0.0%) | 0 (0.0%) |
| $50,000 to $99,999 | 0 (0.0%) | 0 (0.0%) |
| $100,000 to $299,999 | 71 (93.4%) | 235 (94.8%) |
| $300,000 to $499,999 | 5 (6.6%) | 13 (5.2%) |
| $500,000 to $749,999 | 0 (0.0%) | 0 (0.0%) |
| $750,000 to $999,999 | 0 (0.0%) | 0 (0.0%) |
| $1,000,000 or more | 0 (0.0%) | 0 (0.0%) |
| Total | 76 (100.0%) | 248 (100.0%) |
Household Income by Mortgage Status in Bally borough
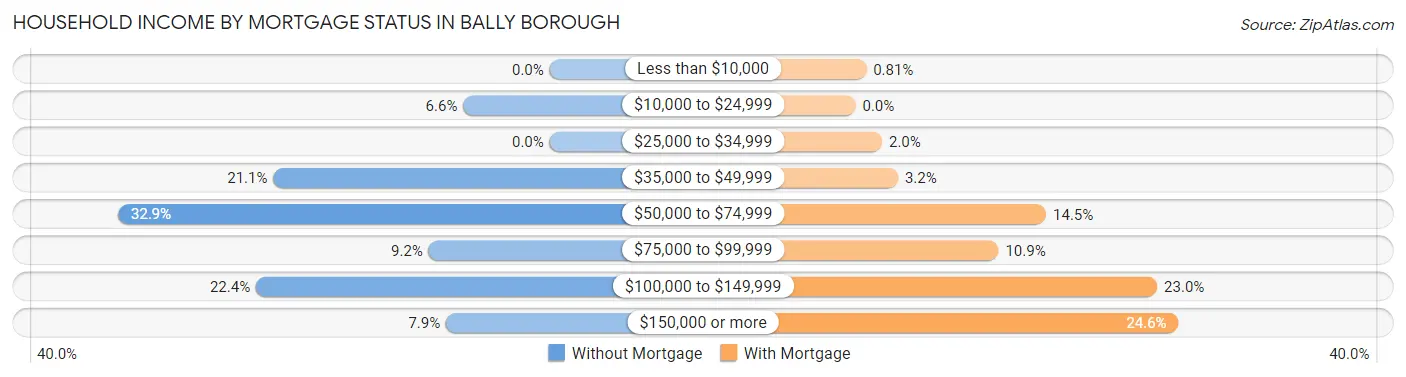
| Household Income | Without Mortgage | With Mortgage |
| Less than $10,000 | 0 (0.0%) | 2 (0.8%) |
| $10,000 to $24,999 | 5 (6.6%) | 0 (0.0%) |
| $25,000 to $34,999 | 0 (0.0%) | 5 (2.0%) |
| $35,000 to $49,999 | 16 (21.0%) | 8 (3.2%) |
| $50,000 to $74,999 | 25 (32.9%) | 36 (14.5%) |
| $75,000 to $99,999 | 7 (9.2%) | 27 (10.9%) |
| $100,000 to $149,999 | 17 (22.4%) | 57 (23.0%) |
| $150,000 or more | 6 (7.9%) | 61 (24.6%) |
| Total | 76 (100.0%) | 248 (100.0%) |
Property Value to Household Income Ratio in Bally borough
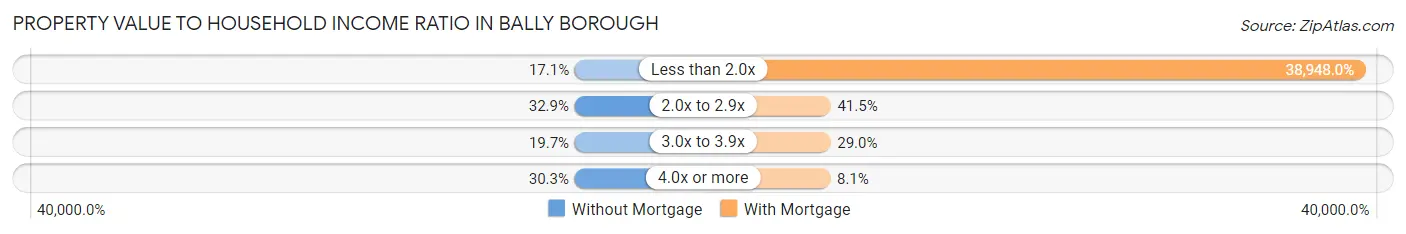
| Value-to-Income Ratio | Without Mortgage | With Mortgage |
| Less than 2.0x | 13 (17.1%) | 96,591 (38,948.0%) |
| 2.0x to 2.9x | 25 (32.9%) | 103 (41.5%) |
| 3.0x to 3.9x | 15 (19.7%) | 72 (29.0%) |
| 4.0x or more | 23 (30.3%) | 20 (8.1%) |
| Total | 76 (100.0%) | 248 (100.0%) |
Real Estate Taxes by Mortgage Status in Bally borough
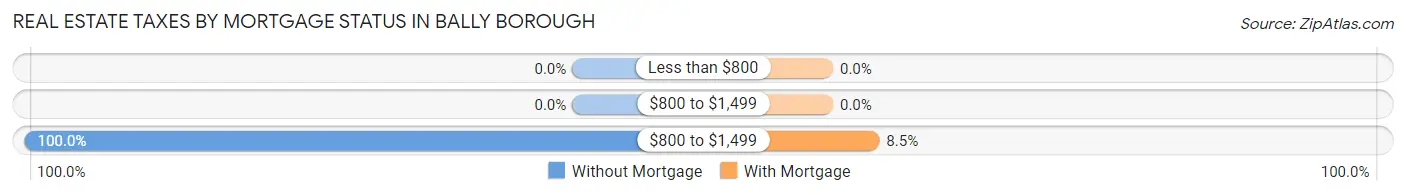
| Property Taxes | Without Mortgage | With Mortgage |
| Less than $800 | 0 (0.0%) | 0 (0.0%) |
| $800 to $1,499 | 0 (0.0%) | 0 (0.0%) |
| $800 to $1,499 | 76 (100.0%) | 21 (8.5%) |
| Total | 76 (100.0%) | 248 (100.0%) |
Health & Disability in Bally borough
Health Insurance Coverage by Age in Bally borough
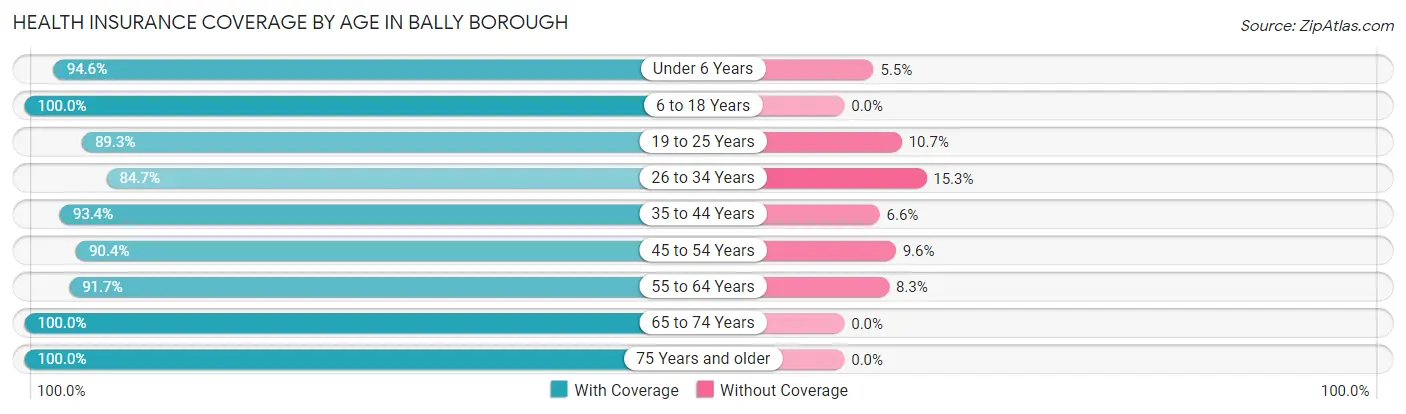
| Age Bracket | With Coverage | Without Coverage |
| Under 6 Years | 52 (94.6%) | 3 (5.4%) |
| 6 to 18 Years | 189 (100.0%) | 0 (0.0%) |
| 19 to 25 Years | 75 (89.3%) | 9 (10.7%) |
| 26 to 34 Years | 133 (84.7%) | 24 (15.3%) |
| 35 to 44 Years | 142 (93.4%) | 10 (6.6%) |
| 45 to 54 Years | 132 (90.4%) | 14 (9.6%) |
| 55 to 64 Years | 110 (91.7%) | 10 (8.3%) |
| 65 to 74 Years | 105 (100.0%) | 0 (0.0%) |
| 75 Years and older | 113 (100.0%) | 0 (0.0%) |
| Total | 1,051 (93.8%) | 70 (6.2%) |
Health Insurance Coverage by Citizenship Status in Bally borough
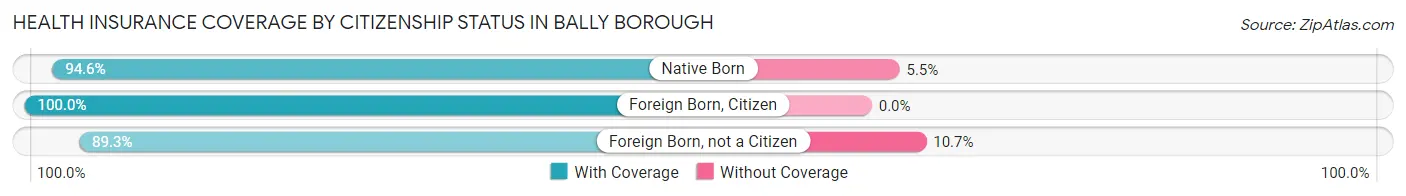
| Citizenship Status | With Coverage | Without Coverage |
| Native Born | 52 (94.6%) | 3 (5.4%) |
| Foreign Born, Citizen | 189 (100.0%) | 0 (0.0%) |
| Foreign Born, not a Citizen | 75 (89.3%) | 9 (10.7%) |
Health Insurance Coverage by Household Income in Bally borough
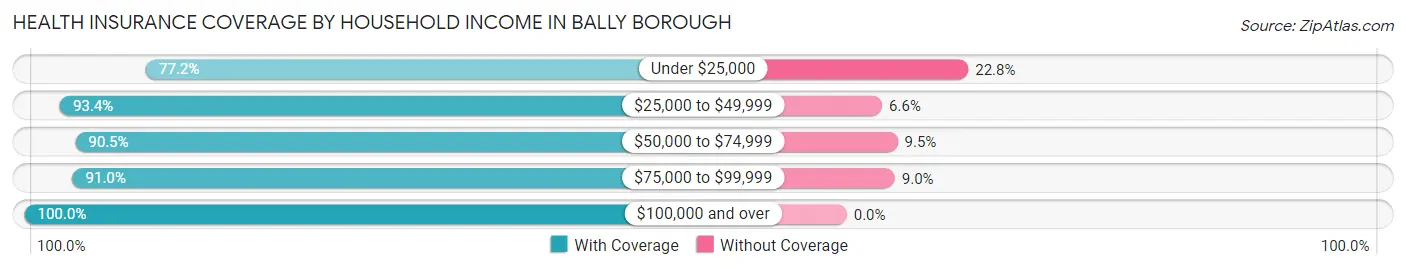
| Household Income | With Coverage | Without Coverage |
| Under $25,000 | 78 (77.2%) | 23 (22.8%) |
| $25,000 to $49,999 | 155 (93.4%) | 11 (6.6%) |
| $50,000 to $74,999 | 171 (90.5%) | 18 (9.5%) |
| $75,000 to $99,999 | 182 (91.0%) | 18 (9.0%) |
| $100,000 and over | 465 (100.0%) | 0 (0.0%) |
Public vs Private Health Insurance Coverage by Age in Bally borough
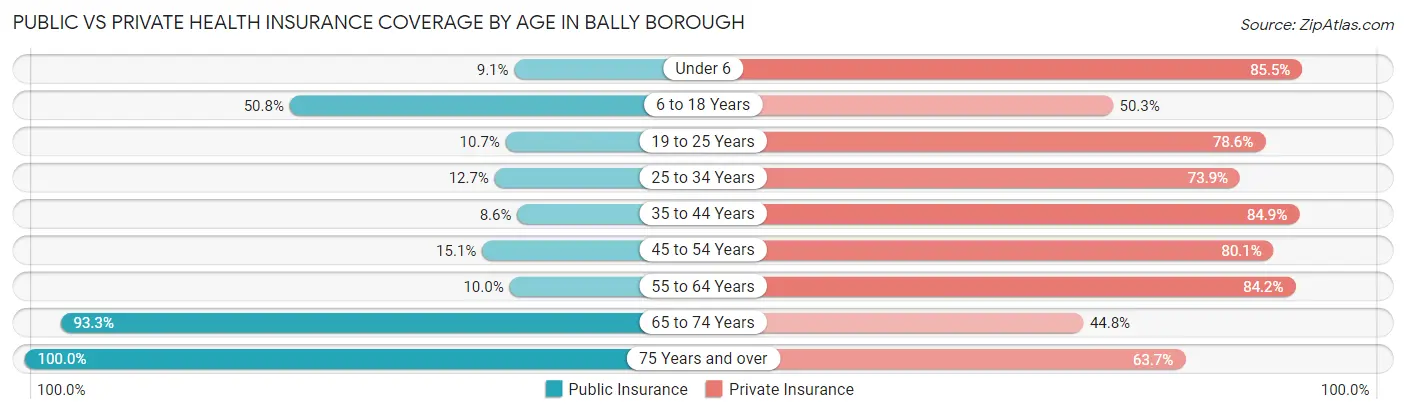
| Age Bracket | Public Insurance | Private Insurance |
| Under 6 | 5 (9.1%) | 47 (85.5%) |
| 6 to 18 Years | 96 (50.8%) | 95 (50.3%) |
| 19 to 25 Years | 9 (10.7%) | 66 (78.6%) |
| 25 to 34 Years | 20 (12.7%) | 116 (73.9%) |
| 35 to 44 Years | 13 (8.6%) | 129 (84.9%) |
| 45 to 54 Years | 22 (15.1%) | 117 (80.1%) |
| 55 to 64 Years | 12 (10.0%) | 101 (84.2%) |
| 65 to 74 Years | 98 (93.3%) | 47 (44.8%) |
| 75 Years and over | 113 (100.0%) | 72 (63.7%) |
| Total | 388 (34.6%) | 790 (70.5%) |
Disability Status by Sex by Age in Bally borough
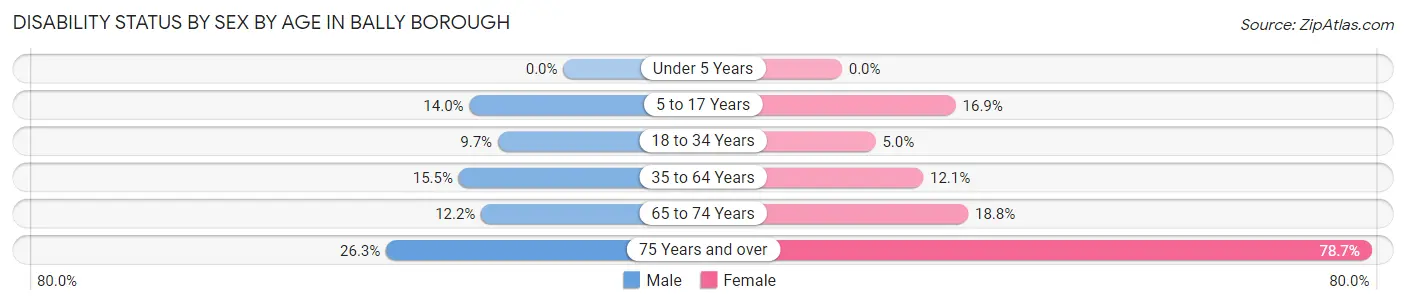
| Age Bracket | Male | Female |
| Under 5 Years | 0 (0.0%) | 0 (0.0%) |
| 5 to 17 Years | 18 (14.0%) | 12 (16.9%) |
| 18 to 34 Years | 10 (9.7%) | 7 (5.0%) |
| 35 to 64 Years | 34 (15.5%) | 24 (12.1%) |
| 65 to 74 Years | 5 (12.2%) | 12 (18.8%) |
| 75 Years and over | 10 (26.3%) | 59 (78.7%) |
Disability Class by Sex by Age in Bally borough
Disability Class: Hearing Difficulty
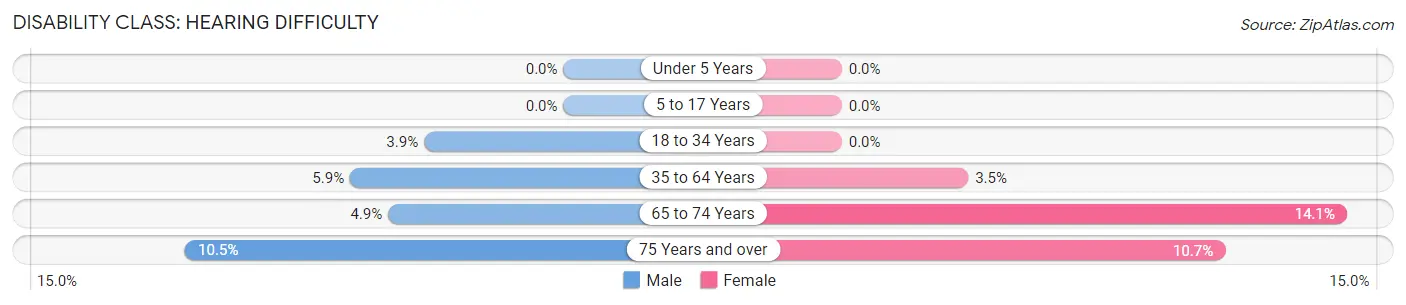
| Age Bracket | Male | Female |
| Under 5 Years | 0 (0.0%) | 0 (0.0%) |
| 5 to 17 Years | 0 (0.0%) | 0 (0.0%) |
| 18 to 34 Years | 4 (3.9%) | 0 (0.0%) |
| 35 to 64 Years | 13 (5.9%) | 7 (3.5%) |
| 65 to 74 Years | 2 (4.9%) | 9 (14.1%) |
| 75 Years and over | 4 (10.5%) | 8 (10.7%) |
Disability Class: Vision Difficulty
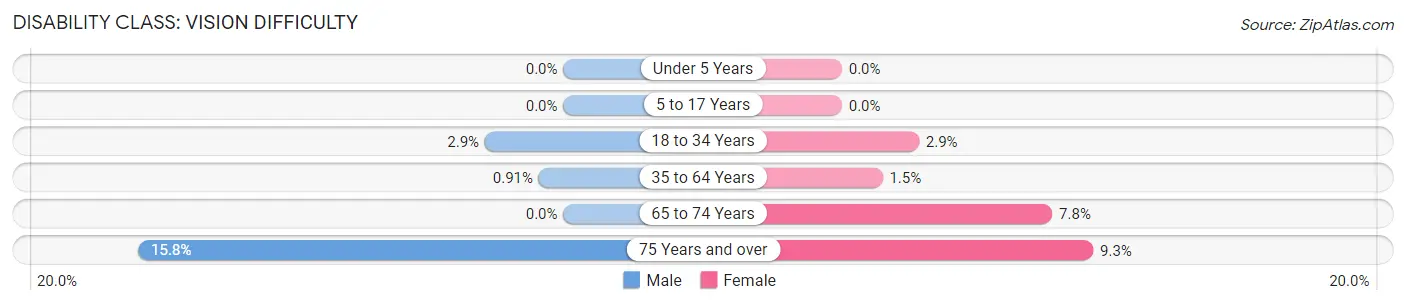
| Age Bracket | Male | Female |
| Under 5 Years | 0 (0.0%) | 0 (0.0%) |
| 5 to 17 Years | 0 (0.0%) | 0 (0.0%) |
| 18 to 34 Years | 3 (2.9%) | 4 (2.9%) |
| 35 to 64 Years | 2 (0.9%) | 3 (1.5%) |
| 65 to 74 Years | 0 (0.0%) | 5 (7.8%) |
| 75 Years and over | 6 (15.8%) | 7 (9.3%) |
Disability Class: Cognitive Difficulty
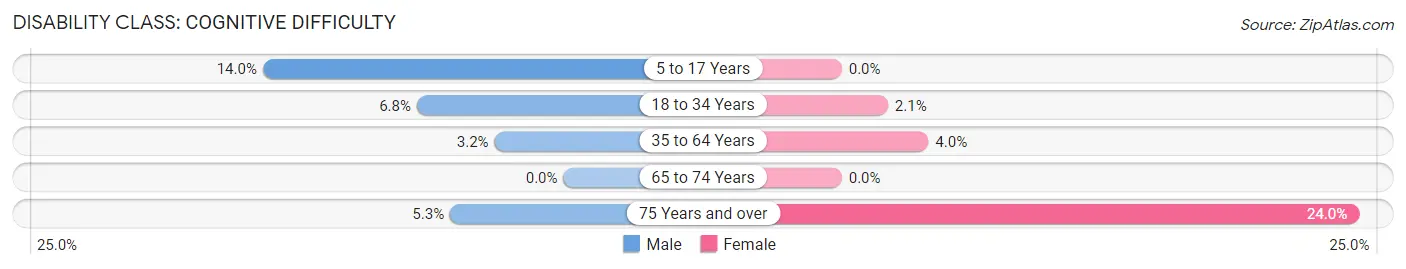
| Age Bracket | Male | Female |
| 5 to 17 Years | 18 (14.0%) | 0 (0.0%) |
| 18 to 34 Years | 7 (6.8%) | 3 (2.1%) |
| 35 to 64 Years | 7 (3.2%) | 8 (4.0%) |
| 65 to 74 Years | 0 (0.0%) | 0 (0.0%) |
| 75 Years and over | 2 (5.3%) | 18 (24.0%) |
Disability Class: Ambulatory Difficulty
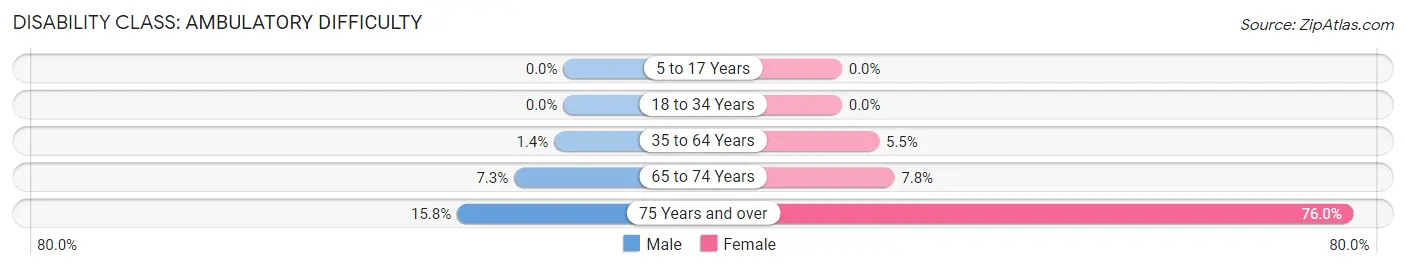
| Age Bracket | Male | Female |
| 5 to 17 Years | 0 (0.0%) | 0 (0.0%) |
| 18 to 34 Years | 0 (0.0%) | 0 (0.0%) |
| 35 to 64 Years | 3 (1.4%) | 11 (5.5%) |
| 65 to 74 Years | 3 (7.3%) | 5 (7.8%) |
| 75 Years and over | 6 (15.8%) | 57 (76.0%) |
Disability Class: Self-Care Difficulty
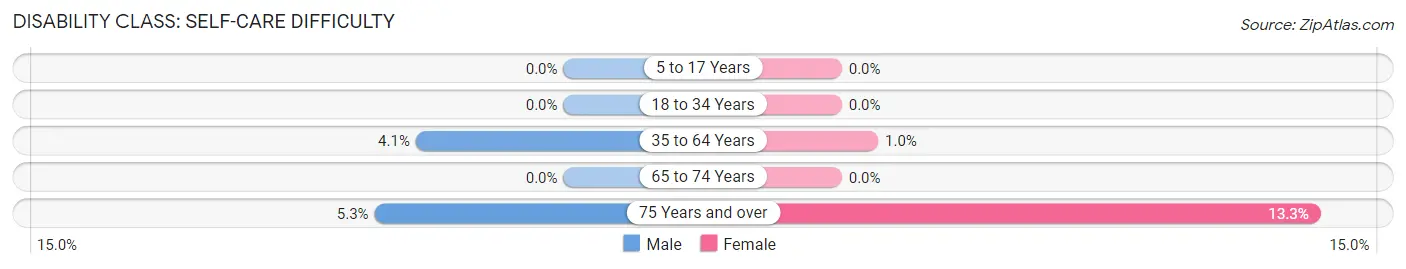
| Age Bracket | Male | Female |
| 5 to 17 Years | 0 (0.0%) | 0 (0.0%) |
| 18 to 34 Years | 0 (0.0%) | 0 (0.0%) |
| 35 to 64 Years | 9 (4.1%) | 2 (1.0%) |
| 65 to 74 Years | 0 (0.0%) | 0 (0.0%) |
| 75 Years and over | 2 (5.3%) | 10 (13.3%) |
Technology Access in Bally borough
Computing Device Access in Bally borough
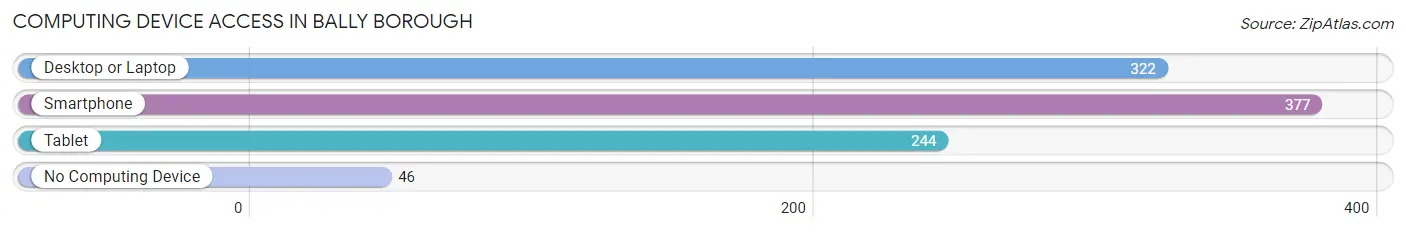
| Device Type | # Households | % Households |
| Desktop or Laptop | 322 | 70.8% |
| Smartphone | 377 | 82.9% |
| Tablet | 244 | 53.6% |
| No Computing Device | 46 | 10.1% |
| Total | 455 | 100.0% |
Internet Access in Bally borough
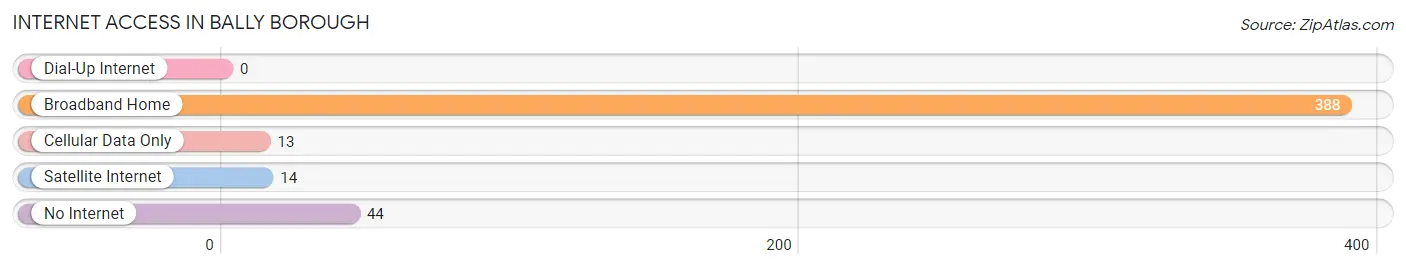
| Internet Type | # Households | % Households |
| Dial-Up Internet | 0 | 0.0% |
| Broadband Home | 388 | 85.3% |
| Cellular Data Only | 13 | 2.9% |
| Satellite Internet | 14 | 3.1% |
| No Internet | 44 | 9.7% |
| Total | 455 | 100.0% |
Bally borough Summary
Bally Borough is a small borough located in Berks County, Pennsylvania. It is situated in the southeastern corner of the county, approximately 10 miles northwest of Reading. The borough is home to a population of approximately 2,500 people, and is part of the Reading, PA Metropolitan Statistical Area.
History
Bally Borough was founded in 1845 by a group of German immigrants who had settled in the area. The borough was named after the town of Bally in Germany, and the name was chosen to honor the immigrants’ homeland. The first settlers in the area were farmers, and the town quickly grew to include a variety of businesses, including a blacksmith, a general store, and a post office.
In the late 19th century, the borough began to experience a period of growth and development. The Reading Railroad was extended to Bally in 1891, and the town soon became a popular destination for tourists and vacationers. The borough also became a popular spot for summer homes, and many wealthy families built large estates in the area.
Geography
Bally Borough is located in southeastern Berks County, approximately 10 miles northwest of Reading. The borough is situated in the Schuylkill River Valley, and is surrounded by rolling hills and farmland. The borough is bordered to the north by Upper Bern Township, to the east by Hereford Township, to the south by Lower Heidelberg Township, and to the west by Washington Township.
The borough covers an area of 1.2 square miles, and is home to a population of approximately 2,500 people. The borough is served by the Bally Area School District, and is home to several parks and recreational areas, including Bally Community Park and Bally Memorial Park.
Economy
The economy of Bally Borough is largely based on agriculture and tourism. The borough is home to several farms, and the surrounding area is known for its production of dairy products, fruits, and vegetables. The borough is also home to several small businesses, including restaurants, retail stores, and service providers.
The borough is also a popular destination for tourists and vacationers. The area is home to several historic sites, including the Bally Historic District, which is listed on the National Register of Historic Places. The borough is also home to several parks and recreational areas, including Bally Community Park and Bally Memorial Park.
Demographics
As of the 2010 census, the population of Bally Borough was 2,521. The racial makeup of the borough was 97.3% White, 0.9% African American, 0.2% Native American, 0.4% Asian, 0.1% Pacific Islander, 0.3% from other races, and 0.8% from two or more races. Hispanic or Latino of any race were 1.2% of the population.
The median household income in Bally Borough was $50,938, and the median family income was $60,938. The per capita income for the borough was $25,938. About 4.3% of families and 5.7% of the population were below the poverty line, including 8.2% of those under age 18 and 4.3% of those age 65 or over.
Common Questions
What is Per Capita Income in Bally borough?
Per Capita income in Bally borough is $35,593.
What is the Median Family Income in Bally borough?
Median Family Income in Bally borough is $92,578.
What is the Median Household income in Bally borough?
Median Household Income in Bally borough is $71,827.
What is Income or Wage Gap in Bally borough?
Income or Wage Gap in Bally borough is 21.1%.
Women in Bally borough earn 78.9 cents for every dollar earned by a man.
What is Inequality or Gini Index in Bally borough?
Inequality or Gini Index in Bally borough is 0.38.
What is the Total Population of Bally borough?
Total Population of Bally borough is 1,121.
What is the Total Male Population of Bally borough?
Total Male Population of Bally borough is 554.
What is the Total Female Population of Bally borough?
Total Female Population of Bally borough is 567.
What is the Ratio of Males per 100 Females in Bally borough?
There are 97.71 Males per 100 Females in Bally borough.
What is the Ratio of Females per 100 Males in Bally borough?
There are 102.35 Females per 100 Males in Bally borough.
What is the Median Population Age in Bally borough?
Median Population Age in Bally borough is 40.6 Years.
What is the Average Family Size in Bally borough
Average Family Size in Bally borough is 3.0 People.
What is the Average Household Size in Bally borough
Average Household Size in Bally borough is 2.5 People.
How Large is the Labor Force in Bally borough?
There are 641 People in the Labor Forcein in Bally borough.
What is the Percentage of People in the Labor Force in Bally borough?
70.2% of People are in the Labor Force in Bally borough.
What is the Unemployment Rate in Bally borough?
Unemployment Rate in Bally borough is 1.6%.