Ambridge borough, PA Map & Demographics
Ambridge borough Overview
$27,091
PER CAPITA INCOME
$70,500
AVG FAMILY INCOME
$46,059
AVG HOUSEHOLD INCOME
34.8%
WAGE / INCOME GAP [ % ]
65.2¢/ $1
WAGE / INCOME GAP [ $ ]
0.42
INEQUALITY / GINI INDEX
6,937
TOTAL POPULATION
3,505
MALE POPULATION
3,432
FEMALE POPULATION
102.13
MALES / 100 FEMALES
97.92
FEMALES / 100 MALES
40.7
MEDIAN AGE
3.2
AVG FAMILY SIZE
2.2
AVG HOUSEHOLD SIZE
3,872
LABOR FORCE [ PEOPLE ]
68.5%
PERCENT IN LABOR FORCE
10.5%
UNEMPLOYMENT RATE
Income in Ambridge borough
Income Overview in Ambridge borough
Per Capita Income in Ambridge borough is $27,091, while median incomes of families and households are $70,500 and $46,059 respectively.
| Characteristic | Number | Measure |
| Per Capita Income | 6,937 | $27,091 |
| Median Family Income | 1,464 | $70,500 |
| Mean Family Income | 1,464 | $81,161 |
| Median Household Income | 3,130 | $46,059 |
| Mean Household Income | 3,130 | $58,753 |
| Income Deficit | 1,464 | $0 |
| Wage / Income Gap (%) | 6,937 | 34.85% |
| Wage / Income Gap ($) | 6,937 | 65.15¢ per $1 |
| Gini / Inequality Index | 6,937 | 0.42 |
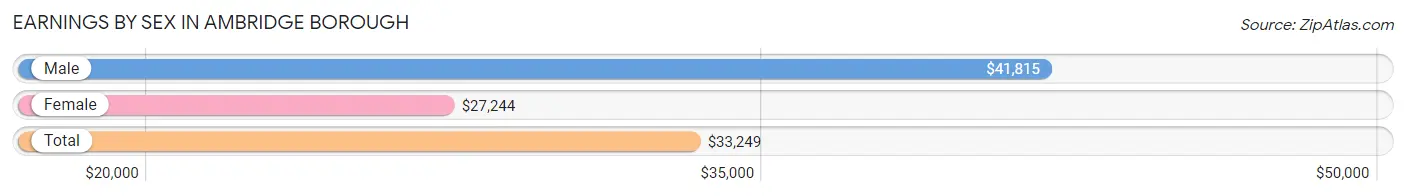
Earnings by Sex in Ambridge borough
Average Earnings in Ambridge borough are $33,249, $41,815 for men and $27,244 for women, a difference of 34.8%.
| Sex | Number | Average Earnings |
| Male | 1,797 (48.0%) | $41,815 |
| Female | 1,946 (52.0%) | $27,244 |
| Total | 3,743 (100.0%) | $33,249 |
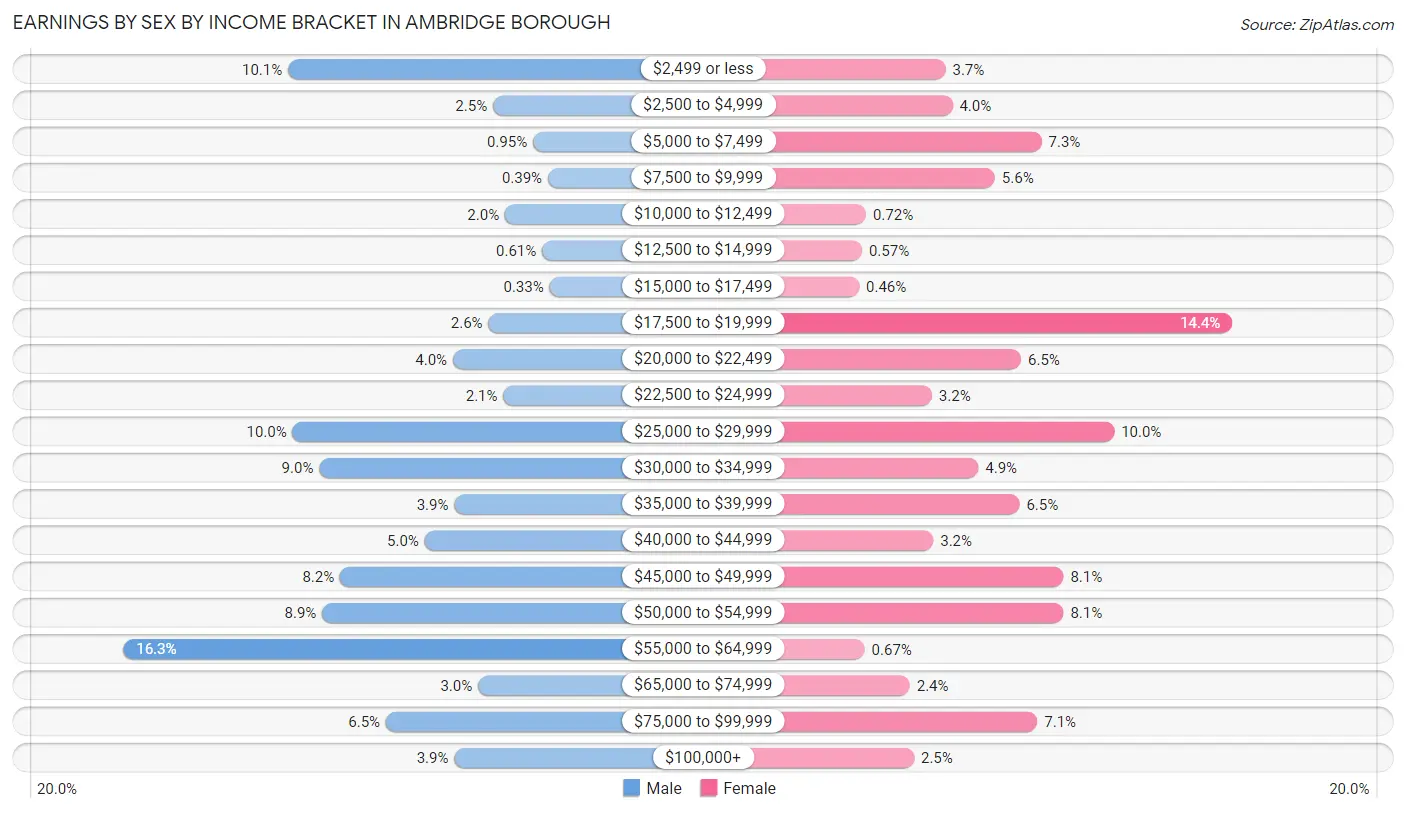
Earnings by Sex by Income Bracket in Ambridge borough
The most common earnings brackets in Ambridge borough are $55,000 to $64,999 for men (293 | 16.3%) and $17,500 to $19,999 for women (281 | 14.4%).
| Income | Male | Female |
| $2,499 or less | 182 (10.1%) | 72 (3.7%) |
| $2,500 to $4,999 | 44 (2.5%) | 77 (4.0%) |
| $5,000 to $7,499 | 17 (0.9%) | 142 (7.3%) |
| $7,500 to $9,999 | 7 (0.4%) | 108 (5.6%) |
| $10,000 to $12,499 | 36 (2.0%) | 14 (0.7%) |
| $12,500 to $14,999 | 11 (0.6%) | 11 (0.6%) |
| $15,000 to $17,499 | 6 (0.3%) | 9 (0.5%) |
| $17,500 to $19,999 | 47 (2.6%) | 281 (14.4%) |
| $20,000 to $22,499 | 71 (4.0%) | 127 (6.5%) |
| $22,500 to $24,999 | 37 (2.1%) | 62 (3.2%) |
| $25,000 to $29,999 | 179 (10.0%) | 195 (10.0%) |
| $30,000 to $34,999 | 161 (9.0%) | 96 (4.9%) |
| $35,000 to $39,999 | 70 (3.9%) | 126 (6.5%) |
| $40,000 to $44,999 | 90 (5.0%) | 63 (3.2%) |
| $45,000 to $49,999 | 147 (8.2%) | 158 (8.1%) |
| $50,000 to $54,999 | 159 (8.8%) | 158 (8.1%) |
| $55,000 to $64,999 | 293 (16.3%) | 13 (0.7%) |
| $65,000 to $74,999 | 54 (3.0%) | 46 (2.4%) |
| $75,000 to $99,999 | 116 (6.5%) | 139 (7.1%) |
| $100,000+ | 70 (3.9%) | 49 (2.5%) |
| Total | 1,797 (100.0%) | 1,946 (100.0%) |
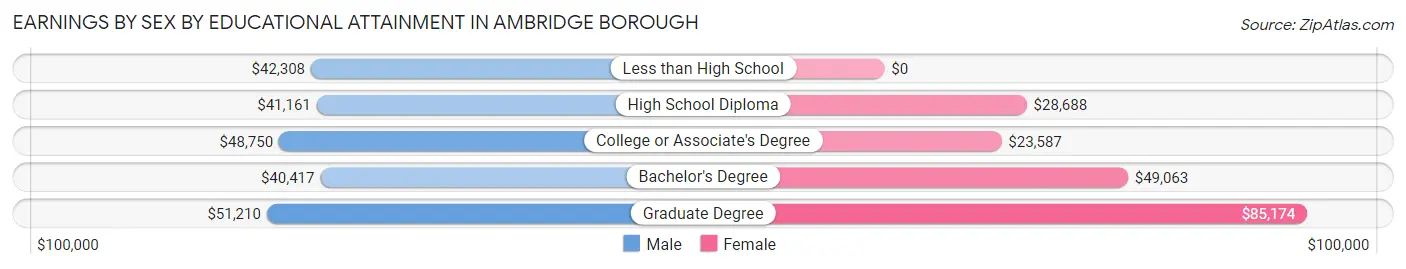
Earnings by Sex by Educational Attainment in Ambridge borough
Average earnings in Ambridge borough are $45,992 for men and $30,987 for women, a difference of 32.6%. Men with an educational attainment of graduate degree enjoy the highest average annual earnings of $51,210, while those with bachelor's degree education earn the least with $40,417. Women with an educational attainment of graduate degree earn the most with the average annual earnings of $85,174, while those with college or associate's degree education have the smallest earnings of $23,587.
| Educational Attainment | Male Income | Female Income |
| Less than High School | $42,308 | $0 |
| High School Diploma | $41,161 | $28,688 |
| College or Associate's Degree | $48,750 | $23,587 |
| Bachelor's Degree | $40,417 | $49,063 |
| Graduate Degree | $51,210 | $85,174 |
| Total | $45,992 | $30,987 |
Family Income in Ambridge borough
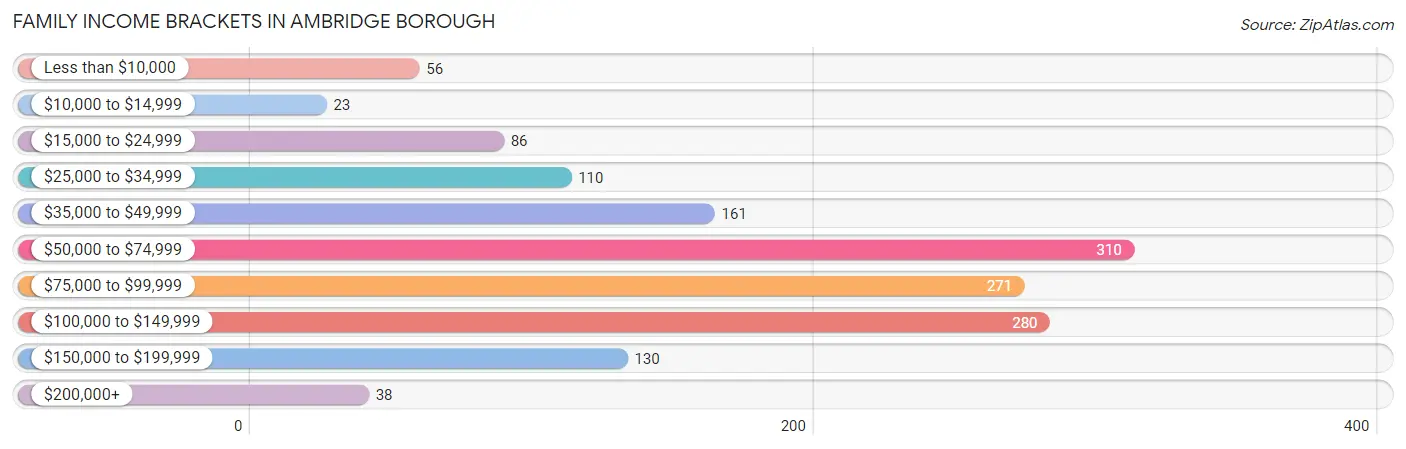
Family Income Brackets in Ambridge borough
According to the Ambridge borough family income data, there are 310 families falling into the $50,000 to $74,999 income range, which is the most common income bracket and makes up 21.2% of all families. Conversely, the $10,000 to $14,999 income bracket is the least frequent group with only 23 families (1.6%) belonging to this category.
| Income Bracket | # Families | % Families |
| Less than $10,000 | 56 | 3.8% |
| $10,000 to $14,999 | 23 | 1.6% |
| $15,000 to $24,999 | 86 | 5.9% |
| $25,000 to $34,999 | 110 | 7.5% |
| $35,000 to $49,999 | 161 | 11.0% |
| $50,000 to $74,999 | 310 | 21.2% |
| $75,000 to $99,999 | 271 | 18.5% |
| $100,000 to $149,999 | 280 | 19.1% |
| $150,000 to $199,999 | 130 | 8.9% |
| $200,000+ | 38 | 2.6% |
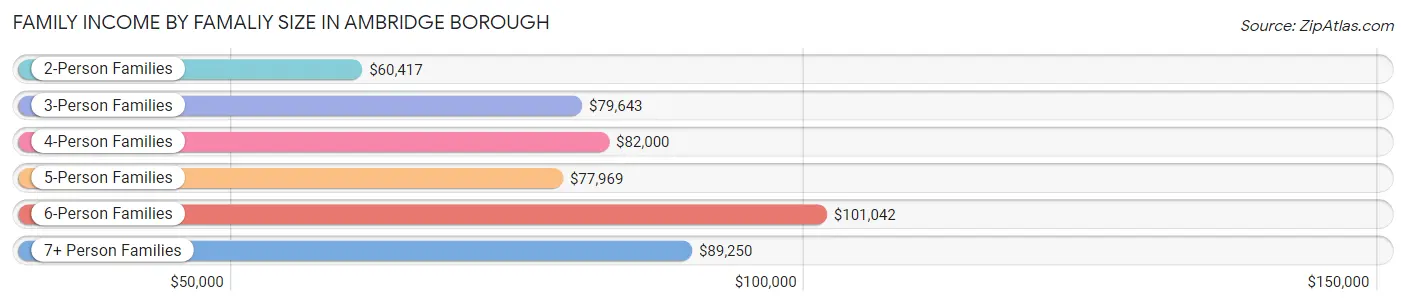
Family Income by Famaliy Size in Ambridge borough
6-person families (31 | 2.1%) account for the highest median family income in Ambridge borough with $101,042 per family, while 2-person families (588 | 40.2%) have the highest median income of $30,208 per family member.
| Income Bracket | # Families | Median Income |
| 2-Person Families | 588 (40.2%) | $60,417 |
| 3-Person Families | 558 (38.1%) | $79,643 |
| 4-Person Families | 150 (10.2%) | $82,000 |
| 5-Person Families | 111 (7.6%) | $77,969 |
| 6-Person Families | 31 (2.1%) | $101,042 |
| 7+ Person Families | 26 (1.8%) | $89,250 |
| Total | 1,464 (100.0%) | $70,500 |
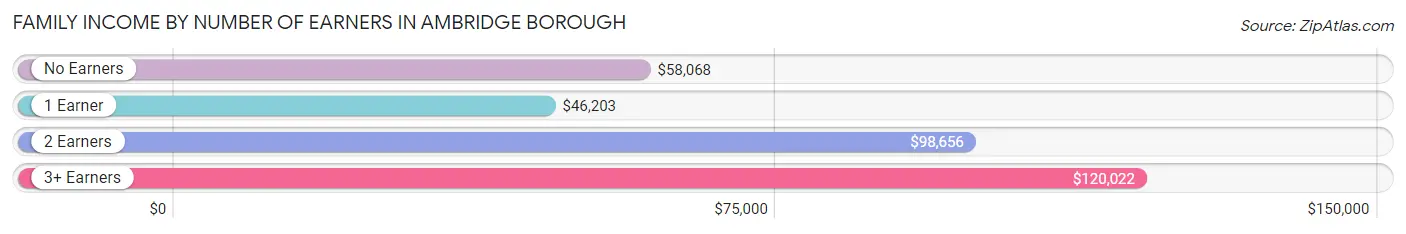
Family Income by Number of Earners in Ambridge borough
The median family income in Ambridge borough is $70,500, with families comprising 3+ earners (177) having the highest median family income of $120,022, while families with 1 earner (539) have the lowest median family income of $46,203, accounting for 12.1% and 36.8% of families, respectively.
| Number of Earners | # Families | Median Income |
| No Earners | 193 (13.2%) | $58,068 |
| 1 Earner | 539 (36.8%) | $46,203 |
| 2 Earners | 555 (37.9%) | $98,656 |
| 3+ Earners | 177 (12.1%) | $120,022 |
| Total | 1,464 (100.0%) | $70,500 |
Household Income in Ambridge borough
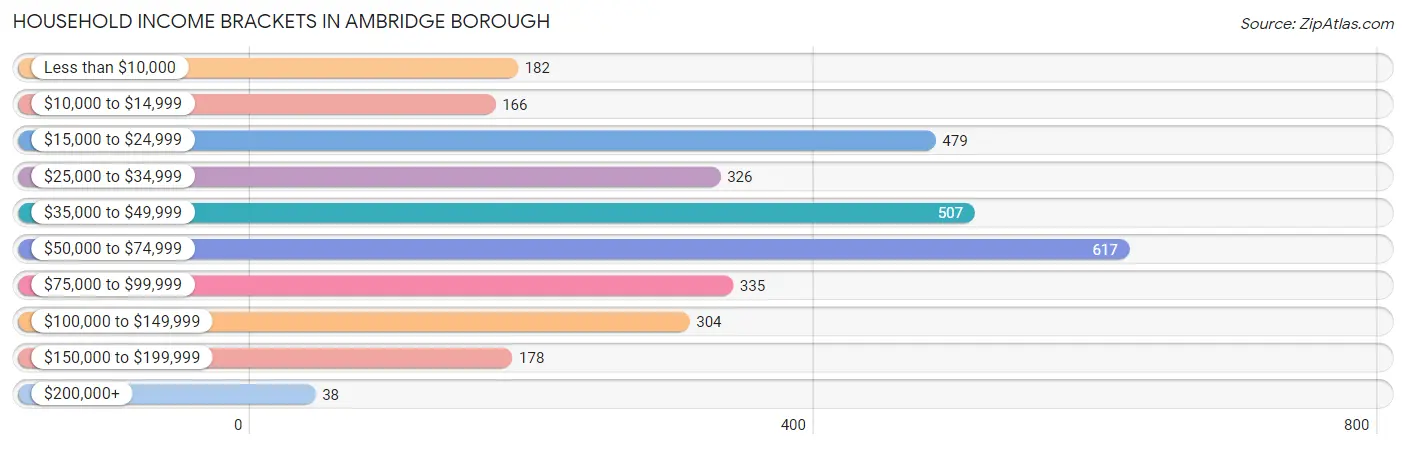
Household Income Brackets in Ambridge borough
With 617 households falling in the category, the $50,000 to $74,999 income range is the most frequent in Ambridge borough, accounting for 19.7% of all households. In contrast, only 38 households (1.2%) fall into the $200,000+ income bracket, making it the least populous group.
| Income Bracket | # Households | % Households |
| Less than $10,000 | 182 | 5.8% |
| $10,000 to $14,999 | 166 | 5.3% |
| $15,000 to $24,999 | 479 | 15.3% |
| $25,000 to $34,999 | 326 | 10.4% |
| $35,000 to $49,999 | 507 | 16.2% |
| $50,000 to $74,999 | 617 | 19.7% |
| $75,000 to $99,999 | 335 | 10.7% |
| $100,000 to $149,999 | 304 | 9.7% |
| $150,000 to $199,999 | 178 | 5.7% |
| $200,000+ | 38 | 1.2% |
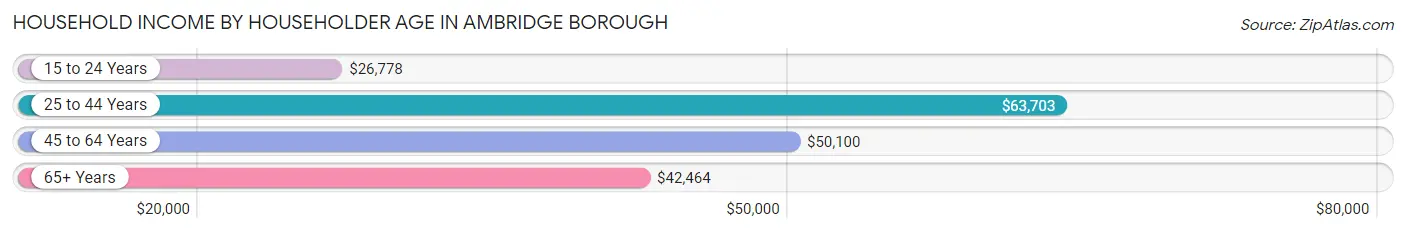
Household Income by Householder Age in Ambridge borough
The median household income in Ambridge borough is $46,059, with the highest median household income of $63,703 found in the 25 to 44 years age bracket for the primary householder. A total of 847 households (27.1%) fall into this category. Meanwhile, the 15 to 24 years age bracket for the primary householder has the lowest median household income of $26,778, with 199 households (6.4%) in this group.
| Income Bracket | # Households | Median Income |
| 15 to 24 Years | 199 (6.4%) | $26,778 |
| 25 to 44 Years | 847 (27.1%) | $63,703 |
| 45 to 64 Years | 1,348 (43.1%) | $50,100 |
| 65+ Years | 736 (23.5%) | $42,464 |
| Total | 3,130 (100.0%) | $46,059 |
Poverty in Ambridge borough
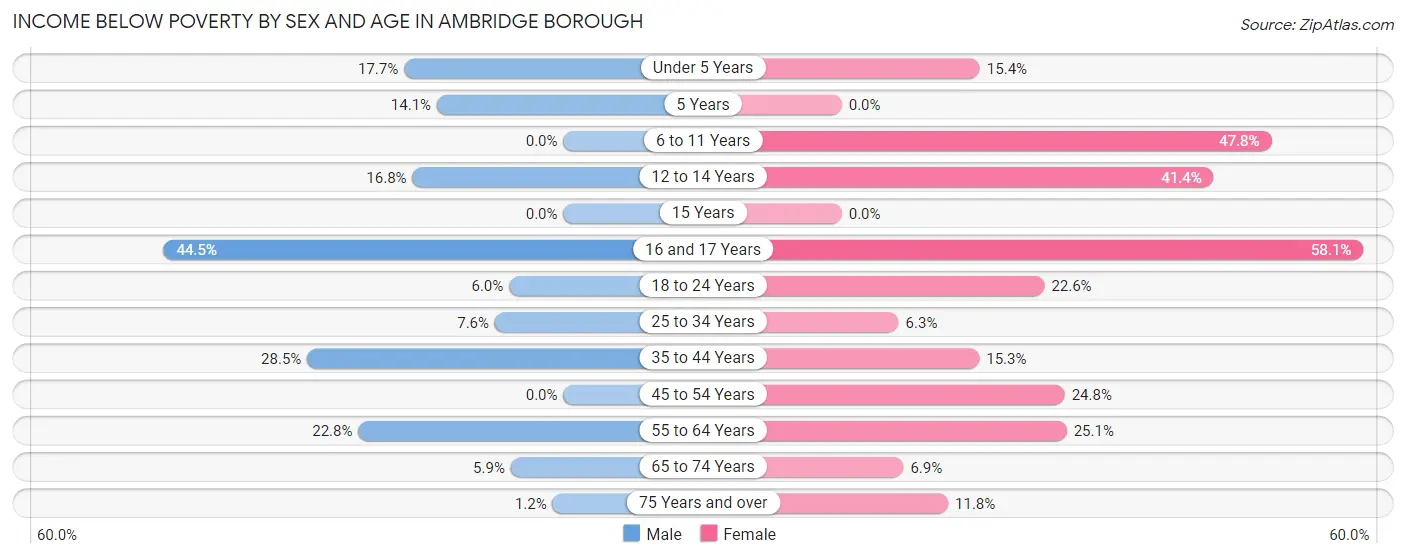
Income Below Poverty by Sex and Age in Ambridge borough
With 12.3% poverty level for males and 20.4% for females among the residents of Ambridge borough, 16 and 17 year old males and 16 and 17 year old females are the most vulnerable to poverty, with 69 males (44.5%) and 54 females (58.1%) in their respective age groups living below the poverty level.
| Age Bracket | Male | Female |
| Under 5 Years | 33 (17.7%) | 12 (15.4%) |
| 5 Years | 10 (14.1%) | 0 (0.0%) |
| 6 to 11 Years | 0 (0.0%) | 88 (47.8%) |
| 12 to 14 Years | 20 (16.8%) | 65 (41.4%) |
| 15 Years | 0 (0.0%) | 0 (0.0%) |
| 16 and 17 Years | 69 (44.5%) | 54 (58.1%) |
| 18 to 24 Years | 11 (6.0%) | 79 (22.6%) |
| 25 to 34 Years | 47 (7.6%) | 28 (6.3%) |
| 35 to 44 Years | 93 (28.5%) | 64 (15.3%) |
| 45 to 54 Years | 0 (0.0%) | 144 (24.8%) |
| 55 to 64 Years | 132 (22.8%) | 118 (25.1%) |
| 65 to 74 Years | 15 (5.9%) | 29 (6.9%) |
| 75 Years and over | 2 (1.2%) | 18 (11.8%) |
| Total | 432 (12.3%) | 699 (20.4%) |
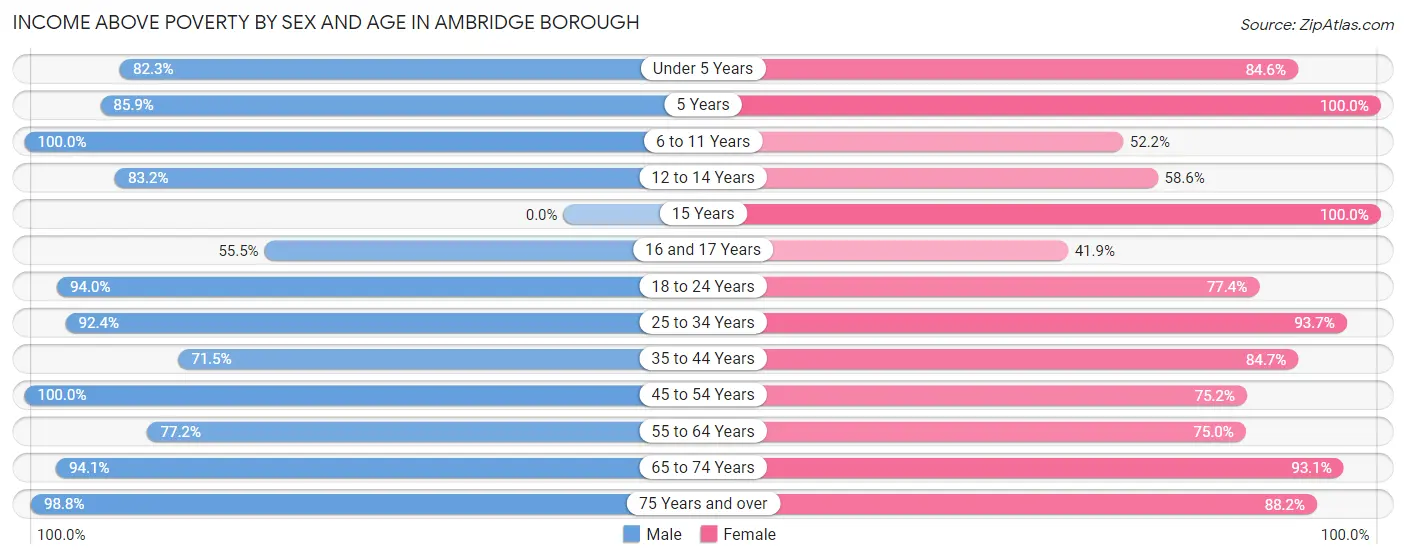
Income Above Poverty by Sex and Age in Ambridge borough
According to the poverty statistics in Ambridge borough, males aged 6 to 11 years and females aged 5 years are the age groups that are most secure financially, with 100.0% of males and 100.0% of females in these age groups living above the poverty line.
| Age Bracket | Male | Female |
| Under 5 Years | 153 (82.3%) | 66 (84.6%) |
| 5 Years | 61 (85.9%) | 51 (100.0%) |
| 6 to 11 Years | 405 (100.0%) | 96 (52.2%) |
| 12 to 14 Years | 99 (83.2%) | 92 (58.6%) |
| 15 Years | 0 (0.0%) | 27 (100.0%) |
| 16 and 17 Years | 86 (55.5%) | 39 (41.9%) |
| 18 to 24 Years | 171 (94.0%) | 271 (77.4%) |
| 25 to 34 Years | 569 (92.4%) | 414 (93.7%) |
| 35 to 44 Years | 233 (71.5%) | 354 (84.7%) |
| 45 to 54 Years | 440 (100.0%) | 436 (75.2%) |
| 55 to 64 Years | 446 (77.2%) | 353 (75.0%) |
| 65 to 74 Years | 241 (94.1%) | 393 (93.1%) |
| 75 Years and over | 165 (98.8%) | 134 (88.2%) |
| Total | 3,069 (87.7%) | 2,726 (79.6%) |
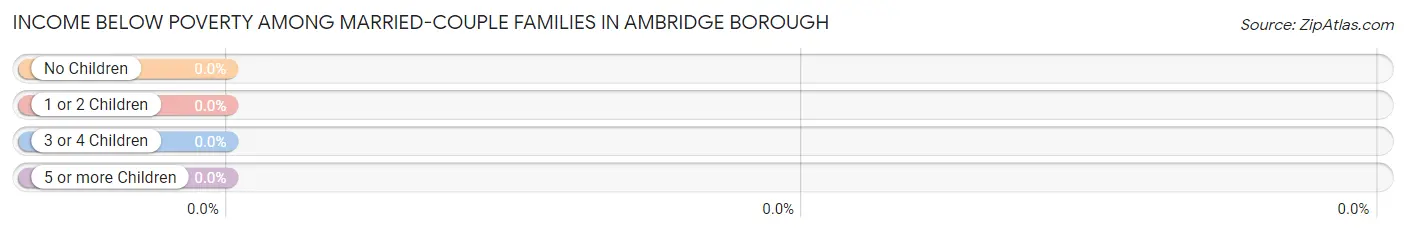
Income Below Poverty Among Married-Couple Families in Ambridge borough
| Children | Above Poverty | Below Poverty |
| No Children | 562 (100.0%) | 0 (0.0%) |
| 1 or 2 Children | 233 (100.0%) | 0 (0.0%) |
| 3 or 4 Children | 82 (100.0%) | 0 (0.0%) |
| 5 or more Children | 10 (100.0%) | 0 (0.0%) |
| Total | 887 (100.0%) | 0 (0.0%) |
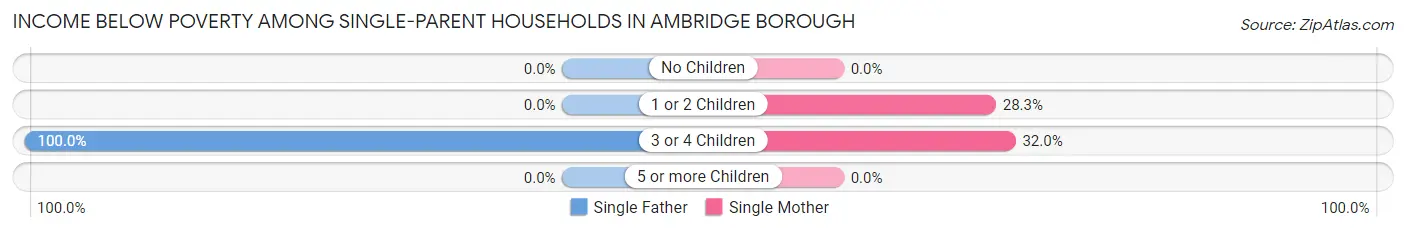
Income Below Poverty Among Single-Parent Households in Ambridge borough
According to the poverty data in Ambridge borough, 6.1% or 10 single-father households and 26.4% or 109 single-mother households are living below the poverty line. Among single-father households, those with 3 or 4 children have the highest poverty rate, with 10 households (100.0%) experiencing poverty. Likewise, among single-mother households, those with 3 or 4 children have the highest poverty rate, with 24 households (32.0%) falling below the poverty line.
| Children | Single Father | Single Mother |
| No Children | 0 (0.0%) | 0 (0.0%) |
| 1 or 2 Children | 0 (0.0%) | 85 (28.3%) |
| 3 or 4 Children | 10 (100.0%) | 24 (32.0%) |
| 5 or more Children | 0 (0.0%) | 0 (0.0%) |
| Total | 10 (6.1%) | 109 (26.4%) |
Income Below Poverty Among Married-Couple vs Single-Parent Households in Ambridge borough
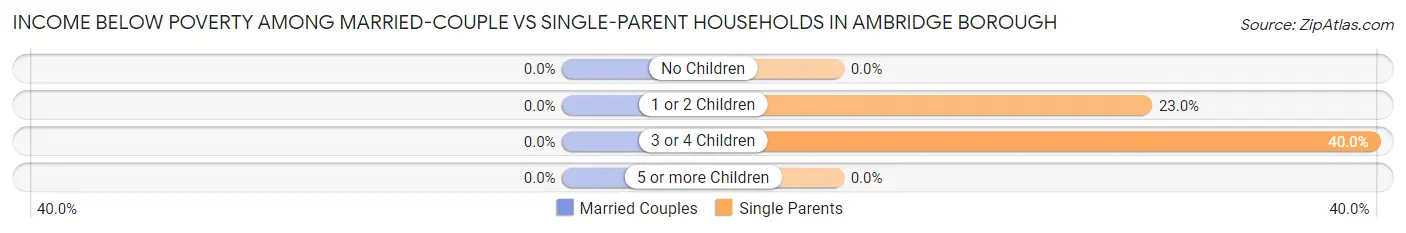
| Children | Married-Couple Families | Single-Parent Households |
| No Children | 0 (0.0%) | 0 (0.0%) |
| 1 or 2 Children | 0 (0.0%) | 85 (23.0%) |
| 3 or 4 Children | 0 (0.0%) | 34 (40.0%) |
| 5 or more Children | 0 (0.0%) | 0 (0.0%) |
| Total | 0 (0.0%) | 119 (20.6%) |
Race in Ambridge borough
The most populous races in Ambridge borough are White / Caucasian (5,330 | 76.8%), Black / African American (1,131 | 16.3%), and Two or more Races (394 | 5.7%).
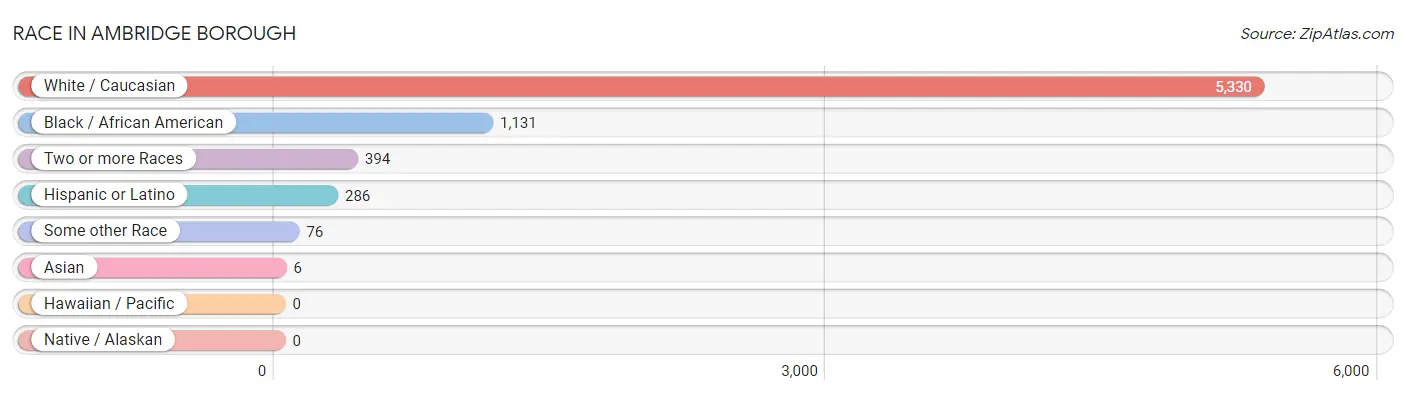
| Race | # Population | % Population |
| Asian | 6 | 0.1% |
| Black / African American | 1,131 | 16.3% |
| Hawaiian / Pacific | 0 | 0.0% |
| Hispanic or Latino | 286 | 4.1% |
| Native / Alaskan | 0 | 0.0% |
| White / Caucasian | 5,330 | 76.8% |
| Two or more Races | 394 | 5.7% |
| Some other Race | 76 | 1.1% |
| Total | 6,937 | 100.0% |
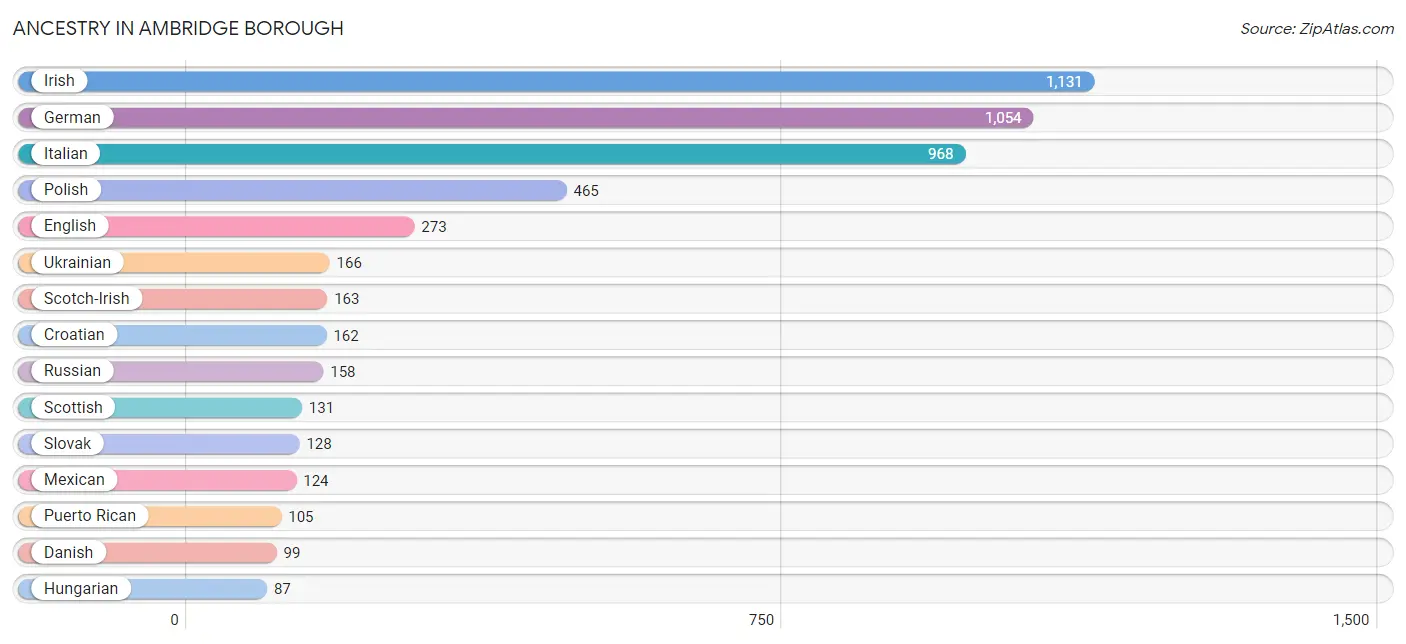
Ancestry in Ambridge borough
The most populous ancestries reported in Ambridge borough are Irish (1,131 | 16.3%), German (1,054 | 15.2%), Italian (968 | 14.0%), Polish (465 | 6.7%), and English (273 | 3.9%), together accounting for 56.1% of all Ambridge borough residents.
| Ancestry | # Population | % Population |
| American | 64 | 0.9% |
| Arab | 6 | 0.1% |
| Austrian | 42 | 0.6% |
| Bhutanese | 9 | 0.1% |
| Blackfeet | 22 | 0.3% |
| British | 8 | 0.1% |
| Central American | 36 | 0.5% |
| Cherokee | 1 | 0.0% |
| Croatian | 162 | 2.3% |
| Czech | 20 | 0.3% |
| Danish | 99 | 1.4% |
| Dominican | 21 | 0.3% |
| Dutch | 48 | 0.7% |
| Eastern European | 11 | 0.2% |
| English | 273 | 3.9% |
| European | 6 | 0.1% |
| Filipino | 14 | 0.2% |
| Finnish | 14 | 0.2% |
| French | 67 | 1.0% |
| French Canadian | 10 | 0.1% |
| German | 1,054 | 15.2% |
| Greek | 54 | 0.8% |
| Honduran | 36 | 0.5% |
| Hungarian | 87 | 1.3% |
| Irish | 1,131 | 16.3% |
| Italian | 968 | 14.0% |
| Jamaican | 3 | 0.0% |
| Kenyan | 2 | 0.0% |
| Korean | 64 | 0.9% |
| Lebanese | 6 | 0.1% |
| Lithuanian | 20 | 0.3% |
| Mexican | 124 | 1.8% |
| Mexican American Indian | 2 | 0.0% |
| Native Hawaiian | 80 | 1.1% |
| Pennsylvania German | 30 | 0.4% |
| Polish | 465 | 6.7% |
| Portuguese | 5 | 0.1% |
| Puerto Rican | 105 | 1.5% |
| Russian | 158 | 2.3% |
| Scotch-Irish | 163 | 2.4% |
| Scottish | 131 | 1.9% |
| Serbian | 41 | 0.6% |
| Slovak | 128 | 1.8% |
| Slovene | 11 | 0.2% |
| Subsaharan African | 2 | 0.0% |
| Ukrainian | 166 | 2.4% |
| Welsh | 21 | 0.3% |
| Yugoslavian | 8 | 0.1% | View All 48 Rows |
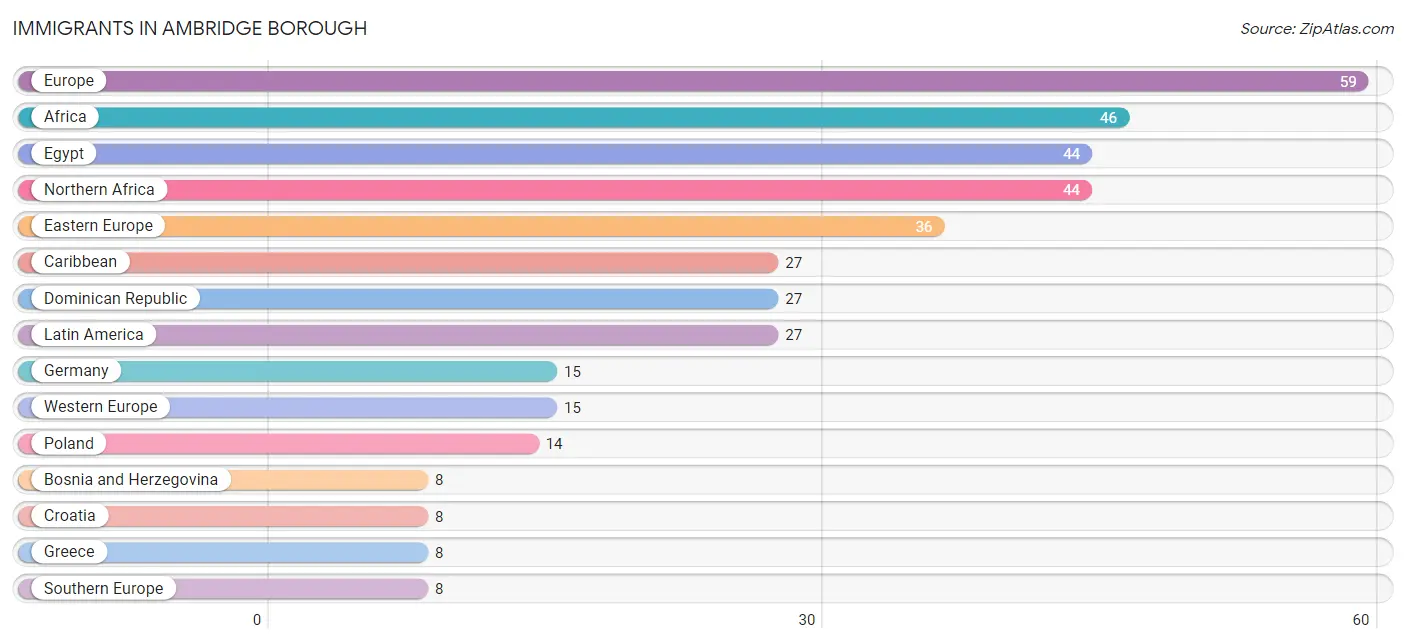
Immigrants in Ambridge borough
The most numerous immigrant groups reported in Ambridge borough came from Europe (59 | 0.9%), Africa (46 | 0.7%), Egypt (44 | 0.6%), Northern Africa (44 | 0.6%), and Eastern Europe (36 | 0.5%), together accounting for 3.3% of all Ambridge borough residents.
| Immigration Origin | # Population | % Population |
| Africa | 46 | 0.7% |
| Asia | 6 | 0.1% |
| Bosnia and Herzegovina | 8 | 0.1% |
| Canada | 5 | 0.1% |
| Caribbean | 27 | 0.4% |
| Croatia | 8 | 0.1% |
| Dominican Republic | 27 | 0.4% |
| Eastern Africa | 2 | 0.0% |
| Eastern Europe | 36 | 0.5% |
| Egypt | 44 | 0.6% |
| Europe | 59 | 0.9% |
| Germany | 15 | 0.2% |
| Greece | 8 | 0.1% |
| Kenya | 2 | 0.0% |
| Latin America | 27 | 0.4% |
| Northern Africa | 44 | 0.6% |
| Philippines | 6 | 0.1% |
| Poland | 14 | 0.2% |
| Russia | 6 | 0.1% |
| South Eastern Asia | 6 | 0.1% |
| Southern Europe | 8 | 0.1% |
| Western Europe | 15 | 0.2% | View All 22 Rows |
Sex and Age in Ambridge borough
Sex and Age in Ambridge borough
The most populous age groups in Ambridge borough are 25 to 29 Years (339 | 9.7%) for men and 45 to 49 Years (320 | 9.3%) for women.
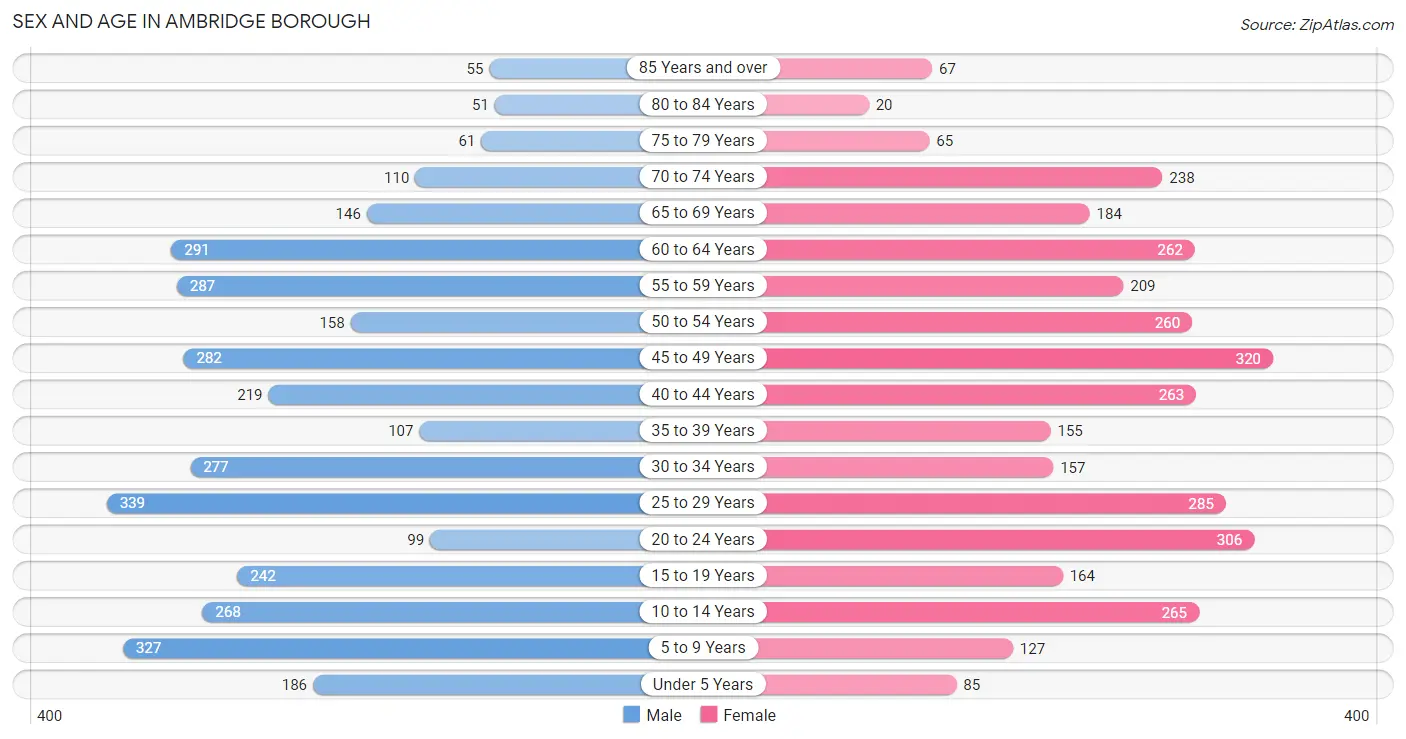
| Age Bracket | Male | Female |
| Under 5 Years | 186 (5.3%) | 85 (2.5%) |
| 5 to 9 Years | 327 (9.3%) | 127 (3.7%) |
| 10 to 14 Years | 268 (7.6%) | 265 (7.7%) |
| 15 to 19 Years | 242 (6.9%) | 164 (4.8%) |
| 20 to 24 Years | 99 (2.8%) | 306 (8.9%) |
| 25 to 29 Years | 339 (9.7%) | 285 (8.3%) |
| 30 to 34 Years | 277 (7.9%) | 157 (4.6%) |
| 35 to 39 Years | 107 (3.0%) | 155 (4.5%) |
| 40 to 44 Years | 219 (6.2%) | 263 (7.7%) |
| 45 to 49 Years | 282 (8.1%) | 320 (9.3%) |
| 50 to 54 Years | 158 (4.5%) | 260 (7.6%) |
| 55 to 59 Years | 287 (8.2%) | 209 (6.1%) |
| 60 to 64 Years | 291 (8.3%) | 262 (7.6%) |
| 65 to 69 Years | 146 (4.2%) | 184 (5.4%) |
| 70 to 74 Years | 110 (3.1%) | 238 (6.9%) |
| 75 to 79 Years | 61 (1.7%) | 65 (1.9%) |
| 80 to 84 Years | 51 (1.5%) | 20 (0.6%) |
| 85 Years and over | 55 (1.6%) | 67 (1.9%) |
| Total | 3,505 (100.0%) | 3,432 (100.0%) |
Families and Households in Ambridge borough
Median Family Size in Ambridge borough
The median family size in Ambridge borough is 3.18 persons per family, with single female/mother families (413 | 28.2%) accounting for the largest median family size of 3.33 persons per family. On the other hand, single male/father families (164 | 11.2%) represent the smallest median family size with 2.62 persons per family.
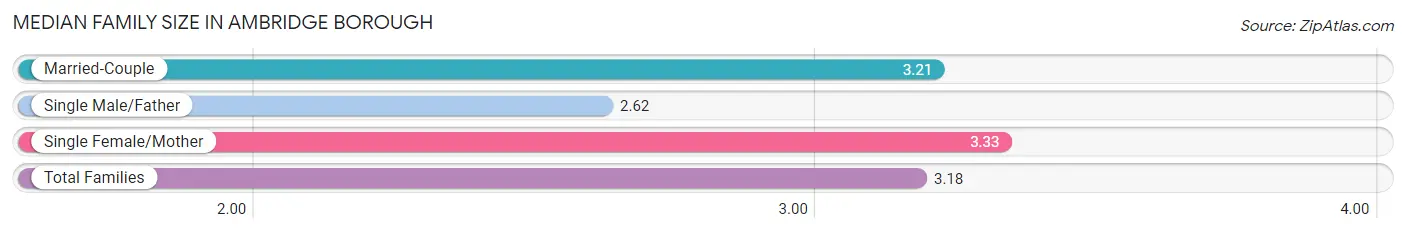
| Family Type | # Families | Family Size |
| Married-Couple | 887 (60.6%) | 3.21 |
| Single Male/Father | 164 (11.2%) | 2.62 |
| Single Female/Mother | 413 (28.2%) | 3.33 |
| Total Families | 1,464 (100.0%) | 3.18 |
Median Household Size in Ambridge borough
The median household size in Ambridge borough is 2.21 persons per household, with single female/mother households (413 | 13.2%) accounting for the largest median household size of 3.57 persons per household. non-family households (1,666 | 53.2%) represent the smallest median household size with 1.24 persons per household.
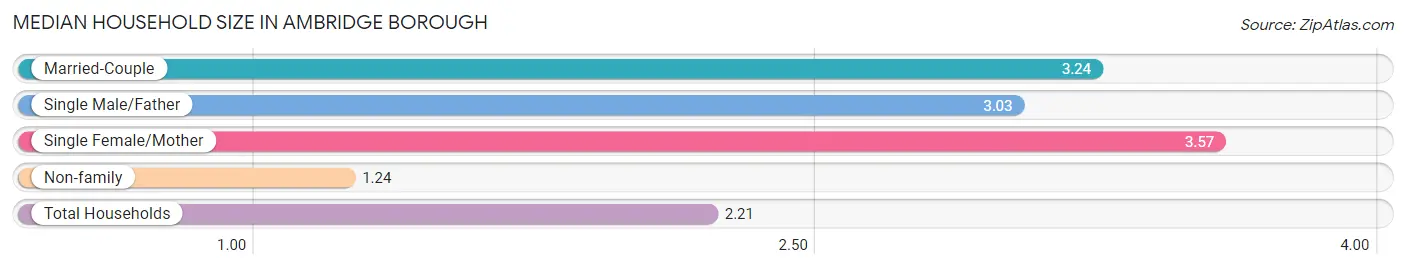
| Household Type | # Households | Household Size |
| Married-Couple | 887 (28.3%) | 3.24 |
| Single Male/Father | 164 (5.2%) | 3.03 |
| Single Female/Mother | 413 (13.2%) | 3.57 |
| Non-family | 1,666 (53.2%) | 1.24 |
| Total Households | 3,130 (100.0%) | 2.21 |
Household Size by Marriage Status in Ambridge borough
Out of a total of 3,130 households in Ambridge borough, 1,464 (46.8%) are family households, while 1,666 (53.2%) are nonfamily households. The most numerous type of family households are 3-person households, comprising 533, and the most common type of nonfamily households are 1-person households, comprising 1,319.
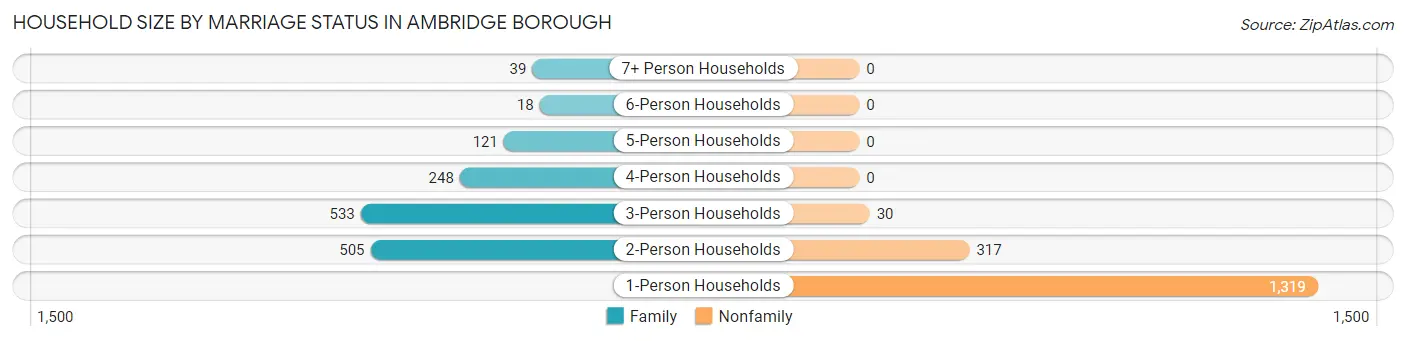
| Household Size | Family Households | Nonfamily Households |
| 1-Person Households | - | 1,319 (42.1%) |
| 2-Person Households | 505 (16.1%) | 317 (10.1%) |
| 3-Person Households | 533 (17.0%) | 30 (1.0%) |
| 4-Person Households | 248 (7.9%) | 0 (0.0%) |
| 5-Person Households | 121 (3.9%) | 0 (0.0%) |
| 6-Person Households | 18 (0.6%) | 0 (0.0%) |
| 7+ Person Households | 39 (1.3%) | 0 (0.0%) |
| Total | 1,464 (46.8%) | 1,666 (53.2%) |
Female Fertility in Ambridge borough
Fertility by Age in Ambridge borough
Average fertility rate in Ambridge borough is 42.0 births per 1,000 women. Women in the age bracket of 20 to 34 years have the highest fertility rate with 88.0 births per 1,000 women. Women in the age bracket of 20 to 34 years acount for 90.4% of all women with births.
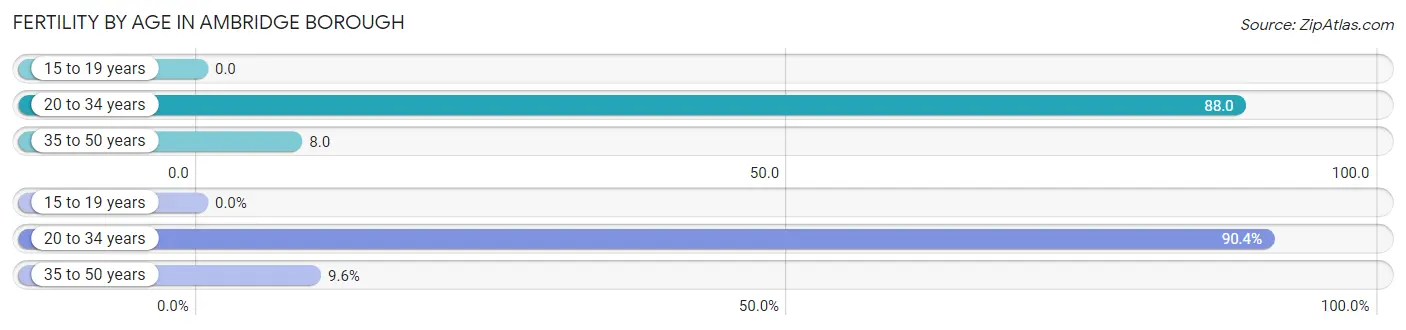
| Age Bracket | Women with Births | Births / 1,000 Women |
| 15 to 19 years | 0 (0.0%) | 0.0 |
| 20 to 34 years | 66 (90.4%) | 88.0 |
| 35 to 50 years | 7 (9.6%) | 8.0 |
| Total | 73 (100.0%) | 42.0 |
Fertility by Age by Marriage Status in Ambridge borough
47.9% of women with births (73) in Ambridge borough are married. The highest percentage of unmarried women with births falls into 35 to 50 years age bracket with 100.0% of them unmarried at the time of birth, while the lowest percentage of unmarried women with births belong to 20 to 34 years age bracket with 47.0% of them unmarried.
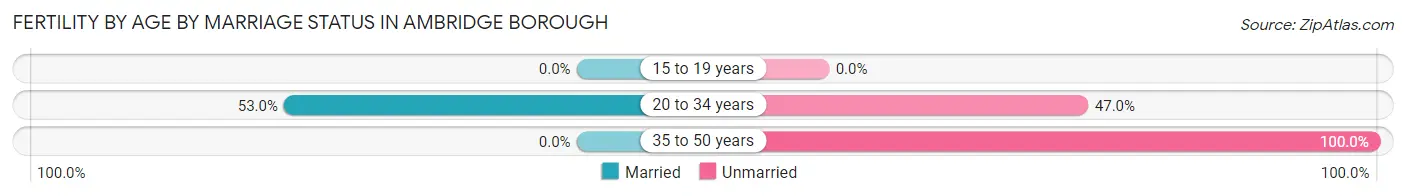
| Age Bracket | Married | Unmarried |
| 15 to 19 years | 0 (0.0%) | 0 (0.0%) |
| 20 to 34 years | 35 (53.0%) | 31 (47.0%) |
| 35 to 50 years | 0 (0.0%) | 7 (100.0%) |
| Total | 35 (47.9%) | 38 (52.0%) |
Fertility by Education in Ambridge borough
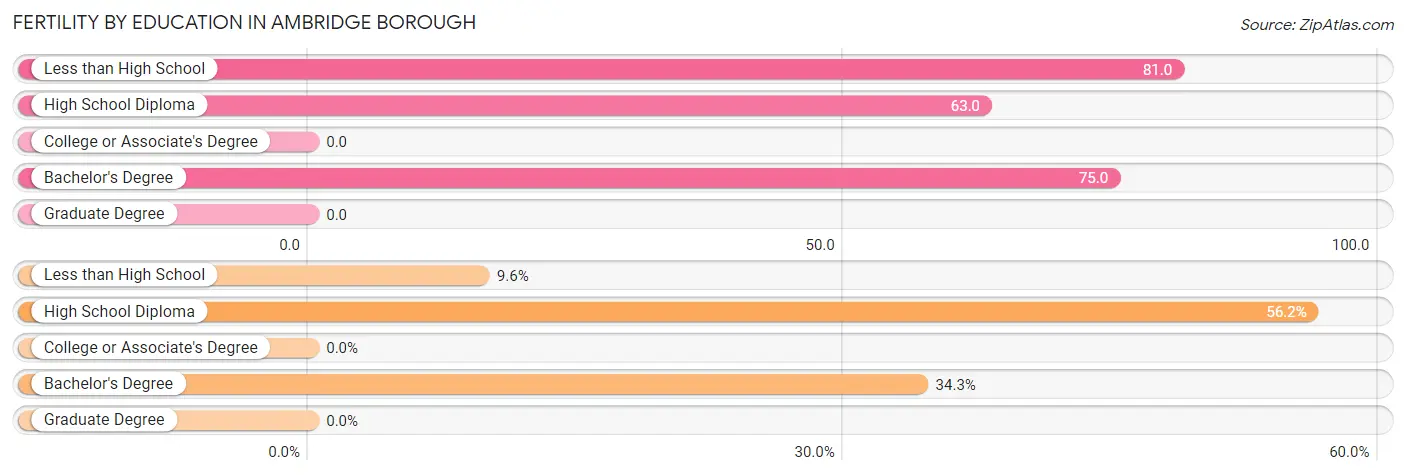
| Educational Attainment | Women with Births | Births / 1,000 Women |
| Less than High School | 7 (9.6%) | 81.0 |
| High School Diploma | 41 (56.2%) | 63.0 |
| College or Associate's Degree | 0 (0.0%) | 0.0 |
| Bachelor's Degree | 25 (34.3%) | 75.0 |
| Graduate Degree | 0 (0.0%) | 0.0 |
| Total | 73 (100.0%) | 42.0 |
Fertility by Education by Marriage Status in Ambridge borough
52.0% of women with births in Ambridge borough are unmarried. Women with the educational attainment of bachelor's degree are most likely to be married with 100.0% of them married at childbirth, while women with the educational attainment of less than high school are least likely to be married with 100.0% of them unmarried at childbirth.
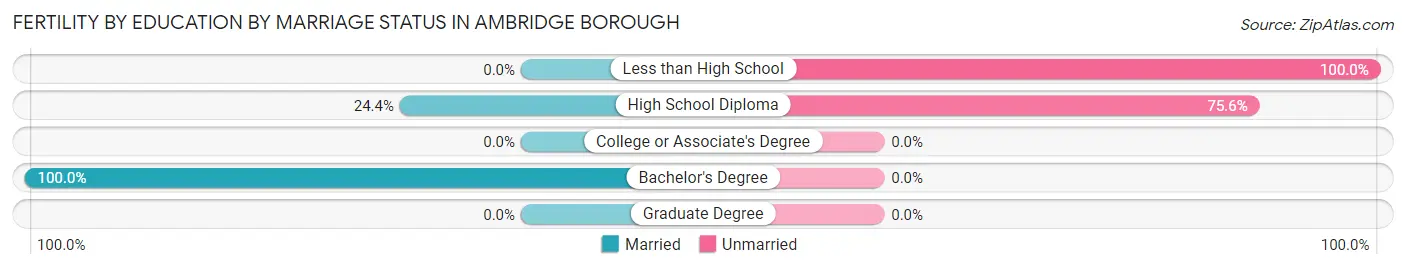
| Educational Attainment | Married | Unmarried |
| Less than High School | 0 (0.0%) | 7 (100.0%) |
| High School Diploma | 10 (24.4%) | 31 (75.6%) |
| College or Associate's Degree | 0 (0.0%) | 0 (0.0%) |
| Bachelor's Degree | 25 (100.0%) | 0 (0.0%) |
| Graduate Degree | 0 (0.0%) | 0 (0.0%) |
| Total | 35 (47.9%) | 38 (52.0%) |
Employment Characteristics in Ambridge borough
Employment by Class of Employer in Ambridge borough
Among the 3,375 employed individuals in Ambridge borough, private company employees (2,540 | 75.3%), not-for-profit organizations (317 | 9.4%), and self-employed (not incorporated) (176 | 5.2%) make up the most common classes of employment.
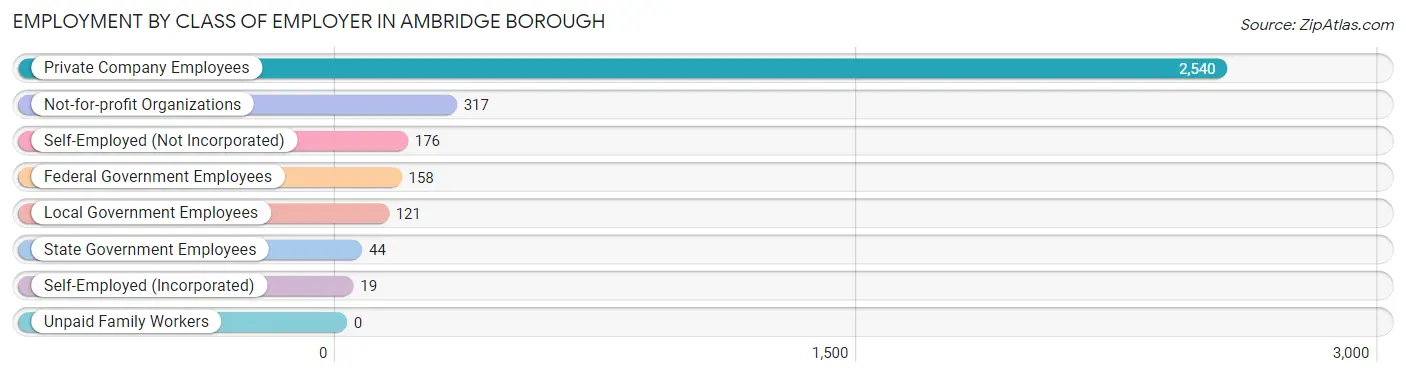
| Employer Class | # Employees | % Employees |
| Private Company Employees | 2,540 | 75.3% |
| Self-Employed (Incorporated) | 19 | 0.6% |
| Self-Employed (Not Incorporated) | 176 | 5.2% |
| Not-for-profit Organizations | 317 | 9.4% |
| Local Government Employees | 121 | 3.6% |
| State Government Employees | 44 | 1.3% |
| Federal Government Employees | 158 | 4.7% |
| Unpaid Family Workers | 0 | 0.0% |
| Total | 3,375 | 100.0% |
Employment Status by Age in Ambridge borough
According to the labor force statistics for Ambridge borough, out of the total population over 16 years of age (5,652), 68.5% or 3,872 individuals are in the labor force, with 10.5% or 407 of them unemployed. The age group with the highest labor force participation rate is 30 to 34 years, with 91.0% or 395 individuals in the labor force. Within the labor force, the 16 to 19 years age range has the highest percentage of unemployed individuals, with 50.2% or 116 of them being unemployed.
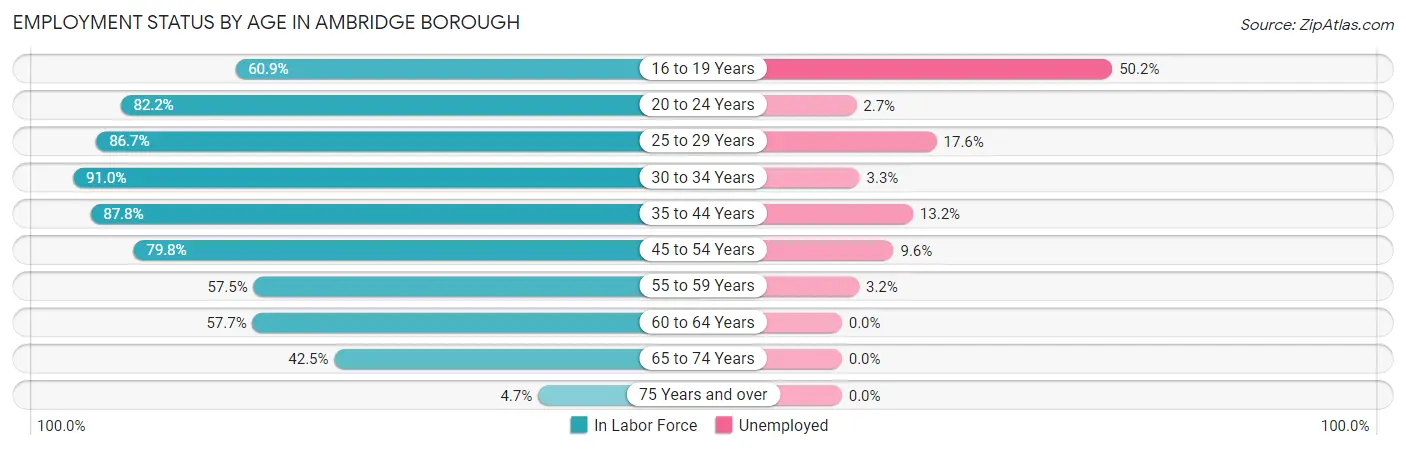
| Age Bracket | In Labor Force | Unemployed |
| 16 to 19 Years | 231 (60.9%) | 116 (50.2%) |
| 20 to 24 Years | 333 (82.2%) | 9 (2.7%) |
| 25 to 29 Years | 541 (86.7%) | 95 (17.6%) |
| 30 to 34 Years | 395 (91.0%) | 13 (3.3%) |
| 35 to 44 Years | 653 (87.8%) | 86 (13.2%) |
| 45 to 54 Years | 814 (79.8%) | 78 (9.6%) |
| 55 to 59 Years | 285 (57.5%) | 9 (3.2%) |
| 60 to 64 Years | 319 (57.7%) | 0 (0.0%) |
| 65 to 74 Years | 288 (42.5%) | 0 (0.0%) |
| 75 Years and over | 15 (4.7%) | 0 (0.0%) |
| Total | 3,872 (68.5%) | 407 (10.5%) |
Employment Status by Educational Attainment in Ambridge borough
According to labor force statistics for Ambridge borough, 77.7% of individuals (3,008) out of the total population between 25 and 64 years of age (3,871) are in the labor force, with 9.3% or 280 of them being unemployed. The group with the highest labor force participation rate are those with the educational attainment of bachelor's degree or higher, with 93.2% or 845 individuals in the labor force. Within the labor force, individuals with less than high school education have the highest percentage of unemployment, with 25.6% or 32 of them being unemployed.
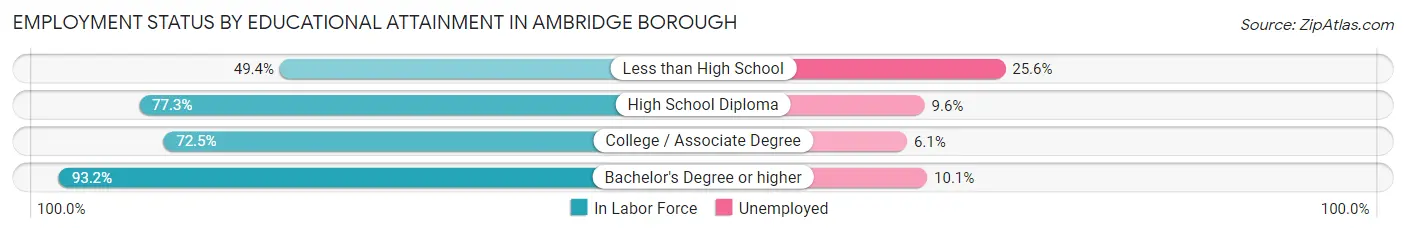
| Educational Attainment | In Labor Force | Unemployed |
| Less than High School | 125 (49.4%) | 65 (25.6%) |
| High School Diploma | 1,139 (77.3%) | 141 (9.6%) |
| College / Associate Degree | 898 (72.5%) | 76 (6.1%) |
| Bachelor's Degree or higher | 845 (93.2%) | 92 (10.1%) |
| Total | 3,008 (77.7%) | 360 (9.3%) |
Employment Occupations by Sex in Ambridge borough
Management, Business, Science and Arts Occupations
The most common Management, Business, Science and Arts occupations in Ambridge borough are Community & Social Service (279 | 8.0%), Computers, Engineering & Science (173 | 5.0%), Management (165 | 4.8%), Health Diagnosing & Treating (146 | 4.2%), and Computers & Mathematics (124 | 3.6%).
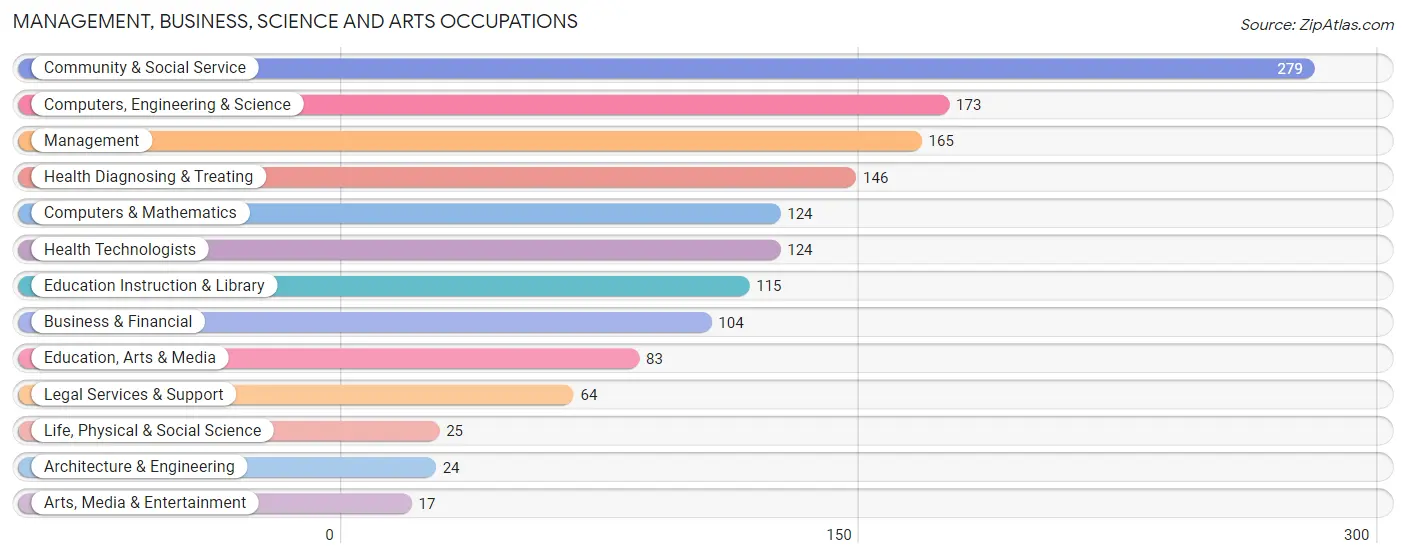
Management, Business, Science and Arts Occupations by Sex
Within the Management, Business, Science and Arts occupations in Ambridge borough, the most male-oriented occupations are Life, Physical & Social Science (100.0%), Education, Arts & Media (81.9%), and Computers & Mathematics (81.5%), while the most female-oriented occupations are Health Technologists (95.2%), Health Diagnosing & Treating (90.4%), and Arts, Media & Entertainment (76.5%).
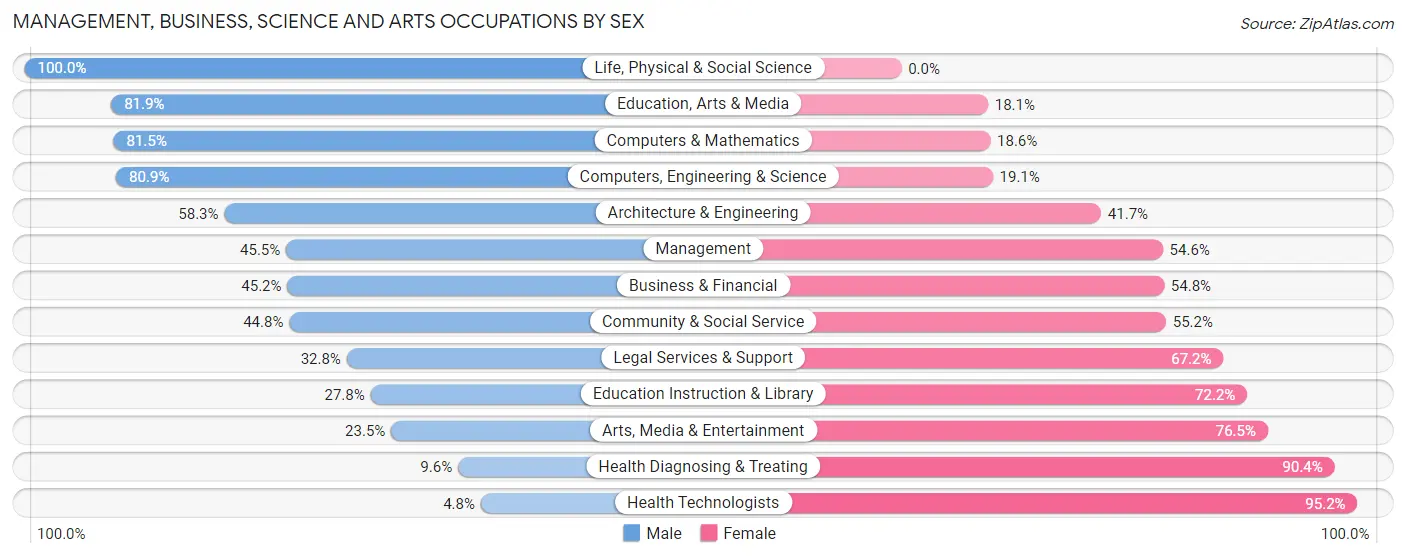
| Occupation | Male | Female |
| Management | 75 (45.5%) | 90 (54.5%) |
| Business & Financial | 47 (45.2%) | 57 (54.8%) |
| Computers, Engineering & Science | 140 (80.9%) | 33 (19.1%) |
| Computers & Mathematics | 101 (81.5%) | 23 (18.5%) |
| Architecture & Engineering | 14 (58.3%) | 10 (41.7%) |
| Life, Physical & Social Science | 25 (100.0%) | 0 (0.0%) |
| Community & Social Service | 125 (44.8%) | 154 (55.2%) |
| Education, Arts & Media | 68 (81.9%) | 15 (18.1%) |
| Legal Services & Support | 21 (32.8%) | 43 (67.2%) |
| Education Instruction & Library | 32 (27.8%) | 83 (72.2%) |
| Arts, Media & Entertainment | 4 (23.5%) | 13 (76.5%) |
| Health Diagnosing & Treating | 14 (9.6%) | 132 (90.4%) |
| Health Technologists | 6 (4.8%) | 118 (95.2%) |
| Total (Category) | 401 (46.3%) | 466 (53.7%) |
| Total (Overall) | 1,701 (49.0%) | 1,767 (50.9%) |
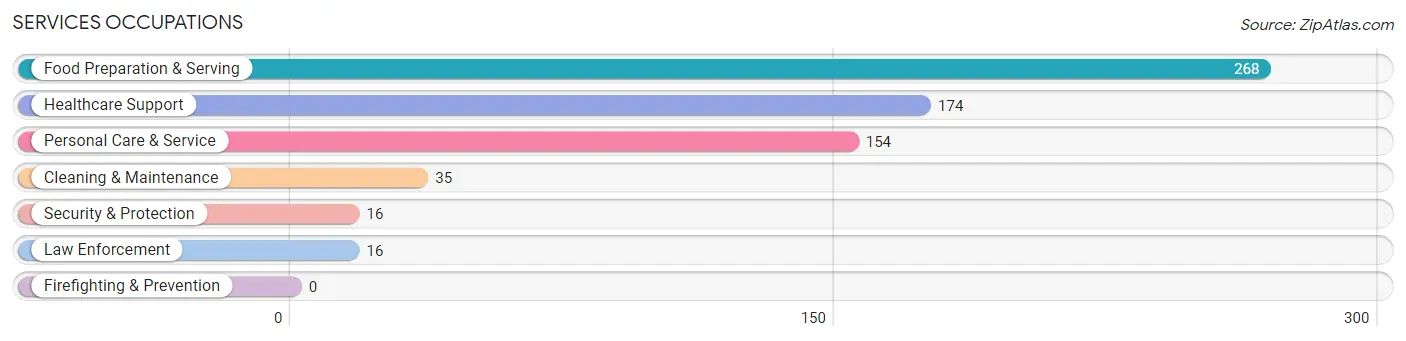
Services Occupations
The most common Services occupations in Ambridge borough are Food Preparation & Serving (268 | 7.7%), Healthcare Support (174 | 5.0%), Personal Care & Service (154 | 4.4%), Cleaning & Maintenance (35 | 1.0%), and Security & Protection (16 | 0.5%).
Services Occupations by Sex
Within the Services occupations in Ambridge borough, the most male-oriented occupations are Security & Protection (100.0%), Law Enforcement (100.0%), and Personal Care & Service (58.4%), while the most female-oriented occupations are Healthcare Support (93.7%), Cleaning & Maintenance (82.9%), and Food Preparation & Serving (50.0%).
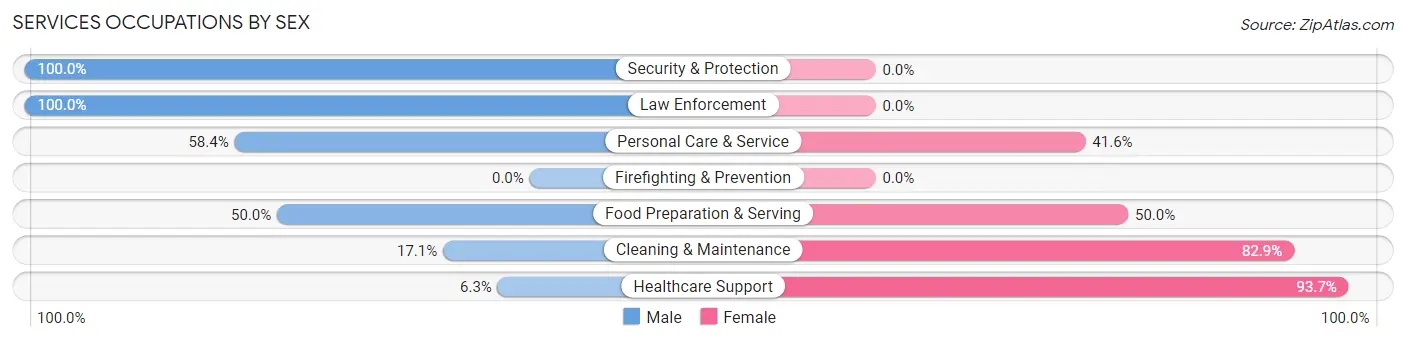
| Occupation | Male | Female |
| Healthcare Support | 11 (6.3%) | 163 (93.7%) |
| Security & Protection | 16 (100.0%) | 0 (0.0%) |
| Firefighting & Prevention | 0 (0.0%) | 0 (0.0%) |
| Law Enforcement | 16 (100.0%) | 0 (0.0%) |
| Food Preparation & Serving | 134 (50.0%) | 134 (50.0%) |
| Cleaning & Maintenance | 6 (17.1%) | 29 (82.9%) |
| Personal Care & Service | 90 (58.4%) | 64 (41.6%) |
| Total (Category) | 257 (39.7%) | 390 (60.3%) |
| Total (Overall) | 1,701 (49.0%) | 1,767 (50.9%) |
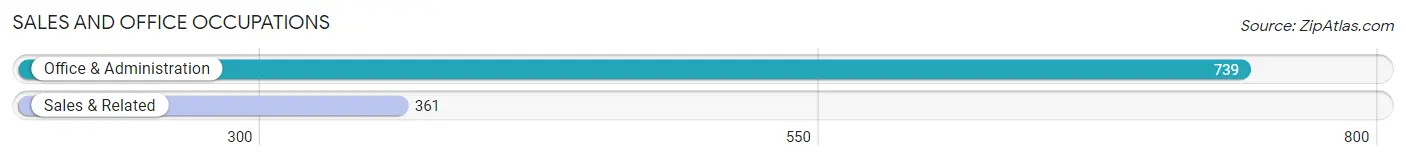
Sales and Office Occupations
The most common Sales and Office occupations in Ambridge borough are Office & Administration (739 | 21.3%), and Sales & Related (361 | 10.4%).
Sales and Office Occupations by Sex
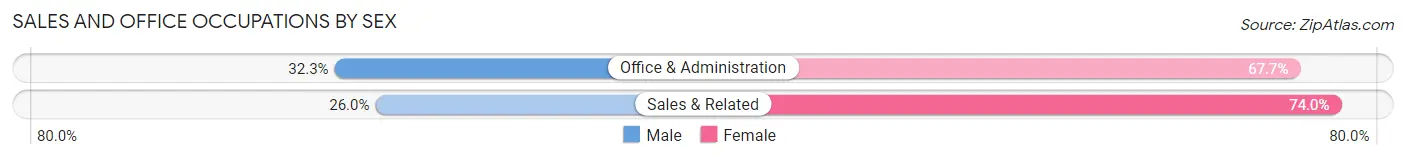
| Occupation | Male | Female |
| Sales & Related | 94 (26.0%) | 267 (74.0%) |
| Office & Administration | 239 (32.3%) | 500 (67.7%) |
| Total (Category) | 333 (30.3%) | 767 (69.7%) |
| Total (Overall) | 1,701 (49.0%) | 1,767 (50.9%) |
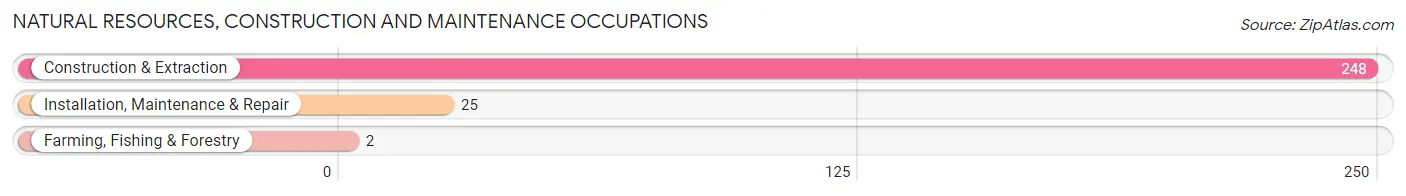
Natural Resources, Construction and Maintenance Occupations
The most common Natural Resources, Construction and Maintenance occupations in Ambridge borough are Construction & Extraction (248 | 7.1%), Installation, Maintenance & Repair (25 | 0.7%), and Farming, Fishing & Forestry (2 | 0.1%).
Natural Resources, Construction and Maintenance Occupations by Sex
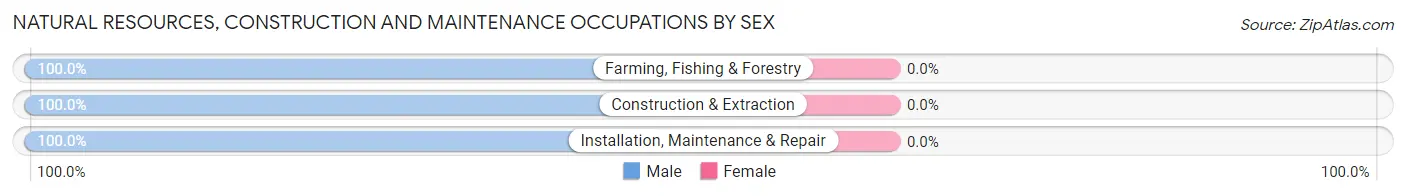
| Occupation | Male | Female |
| Farming, Fishing & Forestry | 2 (100.0%) | 0 (0.0%) |
| Construction & Extraction | 248 (100.0%) | 0 (0.0%) |
| Installation, Maintenance & Repair | 25 (100.0%) | 0 (0.0%) |
| Total (Category) | 275 (100.0%) | 0 (0.0%) |
| Total (Overall) | 1,701 (49.0%) | 1,767 (50.9%) |
Production, Transportation and Moving Occupations
The most common Production, Transportation and Moving occupations in Ambridge borough are Material Moving (280 | 8.1%), Production (180 | 5.2%), and Transportation (119 | 3.4%).
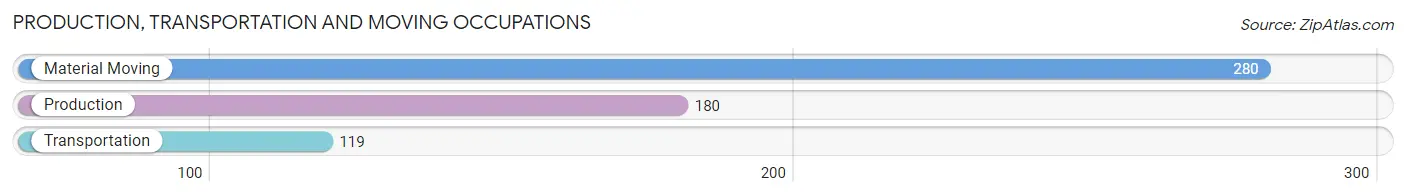
Production, Transportation and Moving Occupations by Sex
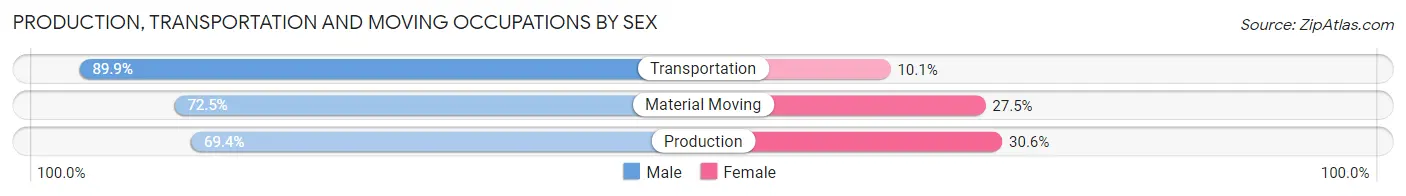
| Occupation | Male | Female |
| Production | 125 (69.4%) | 55 (30.6%) |
| Transportation | 107 (89.9%) | 12 (10.1%) |
| Material Moving | 203 (72.5%) | 77 (27.5%) |
| Total (Category) | 435 (75.1%) | 144 (24.9%) |
| Total (Overall) | 1,701 (49.0%) | 1,767 (50.9%) |
Employment Industries by Sex in Ambridge borough
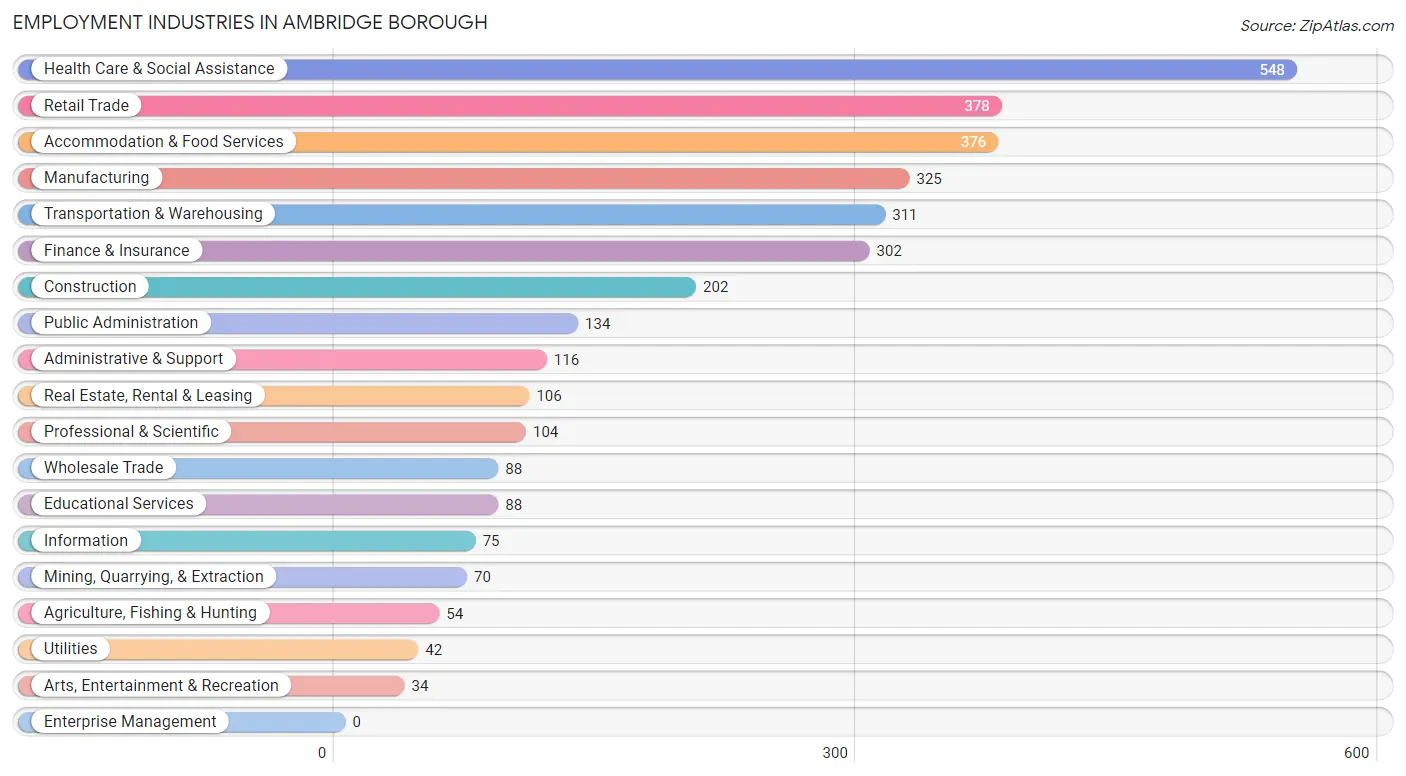
Employment Industries in Ambridge borough
The major employment industries in Ambridge borough include Health Care & Social Assistance (548 | 15.8%), Retail Trade (378 | 10.9%), Accommodation & Food Services (376 | 10.8%), Manufacturing (325 | 9.4%), and Transportation & Warehousing (311 | 9.0%).
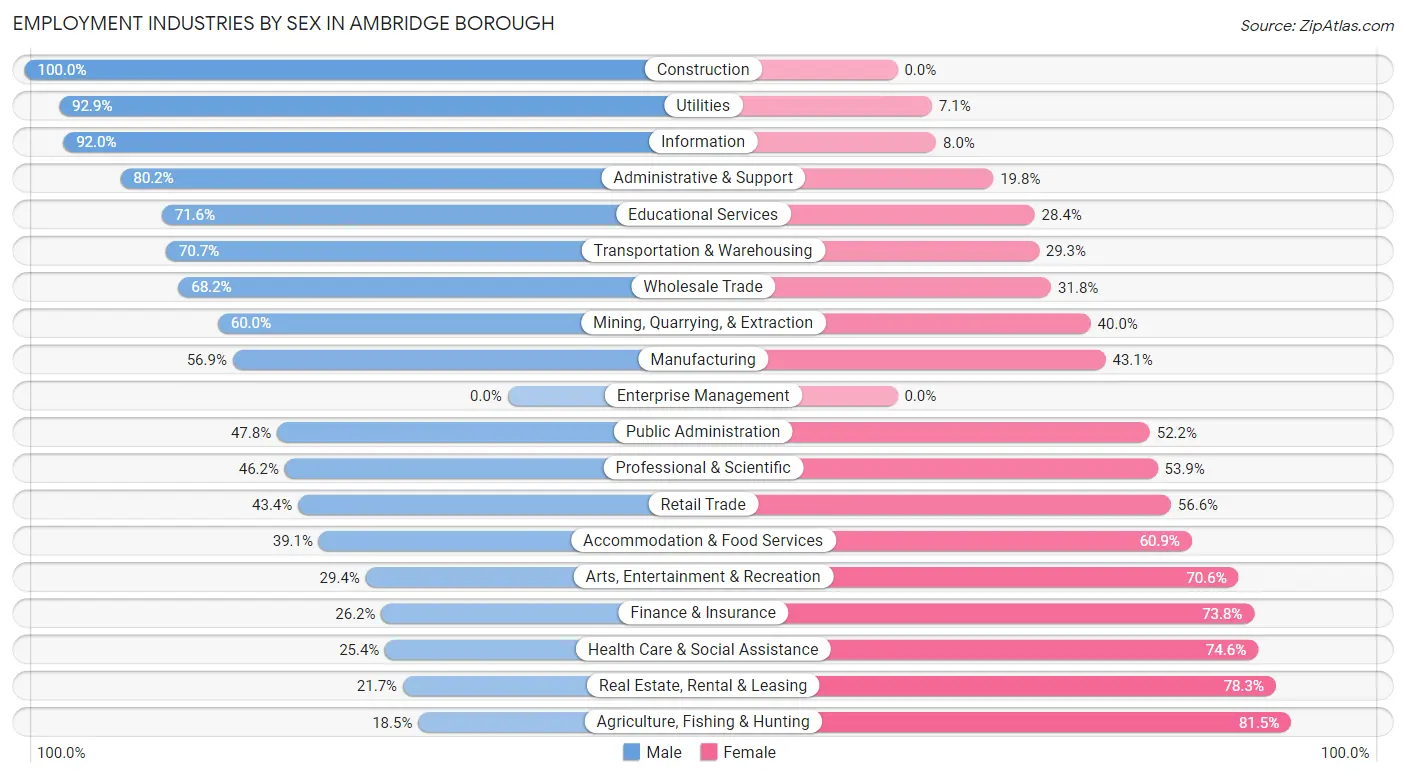
Employment Industries by Sex in Ambridge borough
The Ambridge borough industries that see more men than women are Construction (100.0%), Utilities (92.9%), and Information (92.0%), whereas the industries that tend to have a higher number of women are Agriculture, Fishing & Hunting (81.5%), Real Estate, Rental & Leasing (78.3%), and Health Care & Social Assistance (74.6%).
| Industry | Male | Female |
| Agriculture, Fishing & Hunting | 10 (18.5%) | 44 (81.5%) |
| Mining, Quarrying, & Extraction | 42 (60.0%) | 28 (40.0%) |
| Construction | 202 (100.0%) | 0 (0.0%) |
| Manufacturing | 185 (56.9%) | 140 (43.1%) |
| Wholesale Trade | 60 (68.2%) | 28 (31.8%) |
| Retail Trade | 164 (43.4%) | 214 (56.6%) |
| Transportation & Warehousing | 220 (70.7%) | 91 (29.3%) |
| Utilities | 39 (92.9%) | 3 (7.1%) |
| Information | 69 (92.0%) | 6 (8.0%) |
| Finance & Insurance | 79 (26.2%) | 223 (73.8%) |
| Real Estate, Rental & Leasing | 23 (21.7%) | 83 (78.3%) |
| Professional & Scientific | 48 (46.2%) | 56 (53.8%) |
| Enterprise Management | 0 (0.0%) | 0 (0.0%) |
| Administrative & Support | 93 (80.2%) | 23 (19.8%) |
| Educational Services | 63 (71.6%) | 25 (28.4%) |
| Health Care & Social Assistance | 139 (25.4%) | 409 (74.6%) |
| Arts, Entertainment & Recreation | 10 (29.4%) | 24 (70.6%) |
| Accommodation & Food Services | 147 (39.1%) | 229 (60.9%) |
| Public Administration | 64 (47.8%) | 70 (52.2%) |
| Total | 1,701 (49.0%) | 1,767 (50.9%) |
Education in Ambridge borough
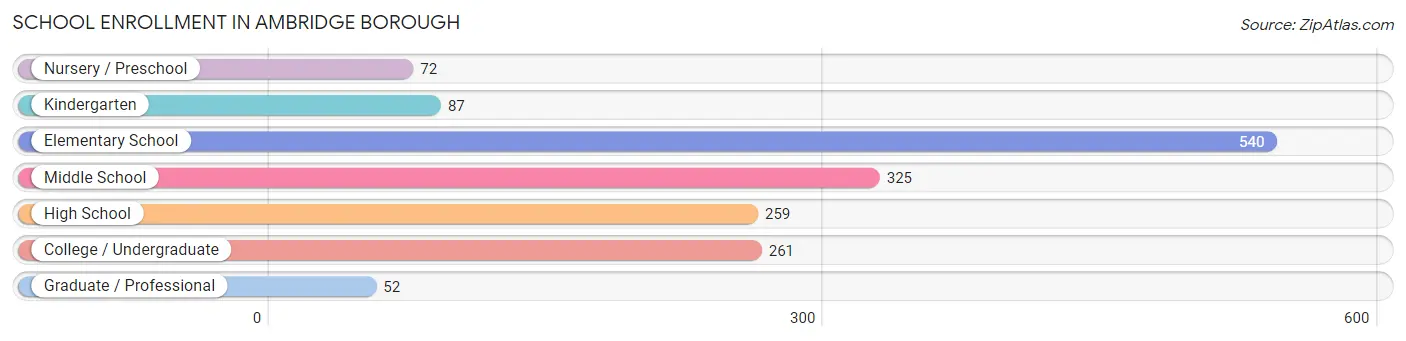
School Enrollment in Ambridge borough
The most common levels of schooling among the 1,596 students in Ambridge borough are elementary school (540 | 33.8%), middle school (325 | 20.4%), and college / undergraduate (261 | 16.4%).
| School Level | # Students | % Students |
| Nursery / Preschool | 72 | 4.5% |
| Kindergarten | 87 | 5.4% |
| Elementary School | 540 | 33.8% |
| Middle School | 325 | 20.4% |
| High School | 259 | 16.2% |
| College / Undergraduate | 261 | 16.4% |
| Graduate / Professional | 52 | 3.3% |
| Total | 1,596 | 100.0% |
School Enrollment by Age by Funding Source in Ambridge borough
Out of a total of 1,596 students who are enrolled in schools in Ambridge borough, 124 (7.8%) attend a private institution, while the remaining 1,472 (92.2%) are enrolled in public schools. The age group of 3 to 4 year olds has the highest likelihood of being enrolled in private schools, with 8 (19.1% in the age bracket) enrolled. Conversely, the age group of 35 years and over has the lowest likelihood of being enrolled in a private school, with 75 (100.0% in the age bracket) attending a public institution.
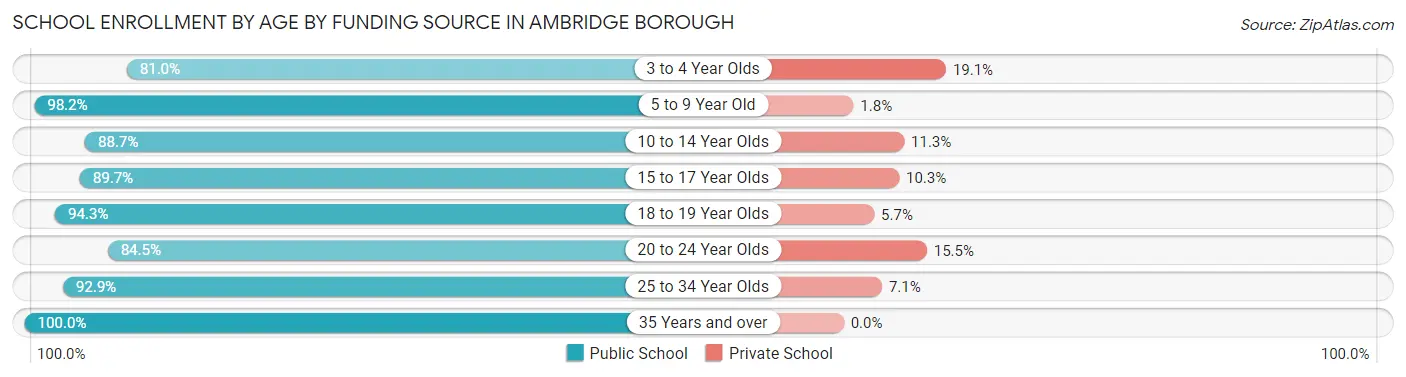
| Age Bracket | Public School | Private School |
| 3 to 4 Year Olds | 34 (80.9%) | 8 (19.1%) |
| 5 to 9 Year Old | 433 (98.2%) | 8 (1.8%) |
| 10 to 14 Year Olds | 473 (88.7%) | 60 (11.3%) |
| 15 to 17 Year Olds | 235 (89.7%) | 27 (10.3%) |
| 18 to 19 Year Olds | 83 (94.3%) | 5 (5.7%) |
| 20 to 24 Year Olds | 60 (84.5%) | 11 (15.5%) |
| 25 to 34 Year Olds | 78 (92.9%) | 6 (7.1%) |
| 35 Years and over | 75 (100.0%) | 0 (0.0%) |
| Total | 1,472 (92.2%) | 124 (7.8%) |
Educational Attainment by Field of Study in Ambridge borough
Business (275 | 23.7%), science & technology (173 | 14.9%), psychology (148 | 12.8%), liberal arts & history (134 | 11.6%), and communications (92 | 7.9%) are the most common fields of study among 1,158 individuals in Ambridge borough who have obtained a bachelor's degree or higher.
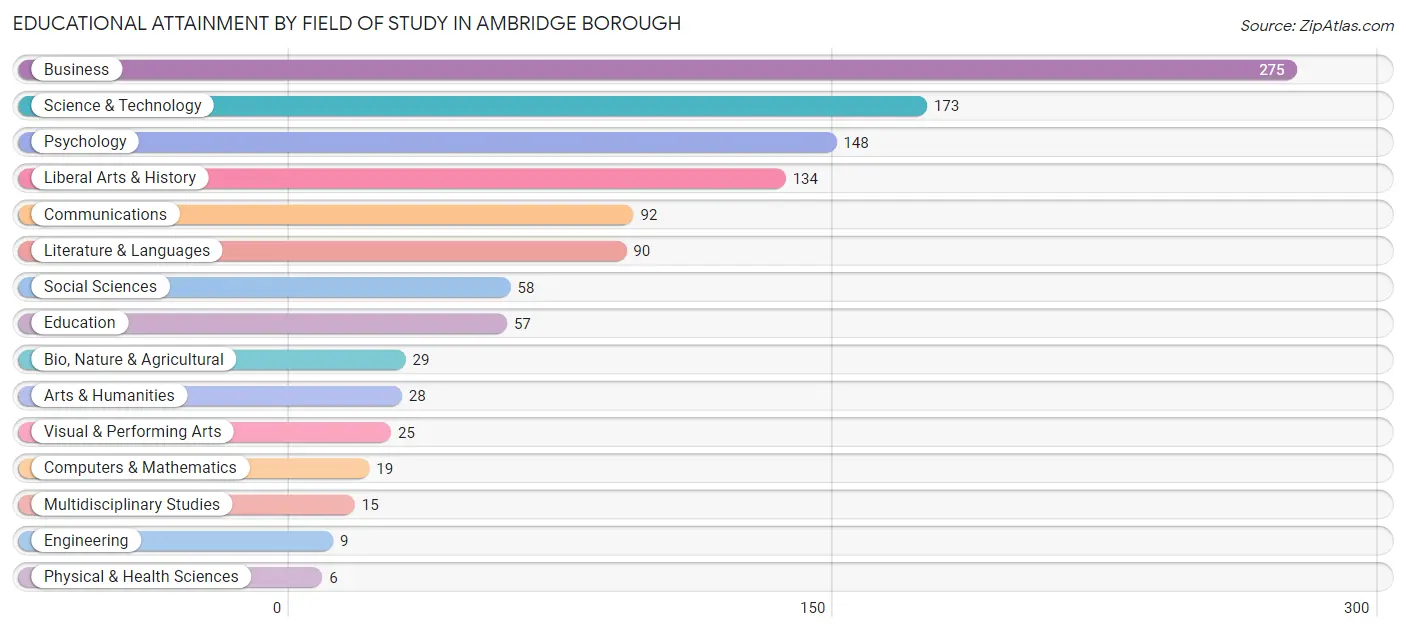
| Field of Study | # Graduates | % Graduates |
| Computers & Mathematics | 19 | 1.6% |
| Bio, Nature & Agricultural | 29 | 2.5% |
| Physical & Health Sciences | 6 | 0.5% |
| Psychology | 148 | 12.8% |
| Social Sciences | 58 | 5.0% |
| Engineering | 9 | 0.8% |
| Multidisciplinary Studies | 15 | 1.3% |
| Science & Technology | 173 | 14.9% |
| Business | 275 | 23.7% |
| Education | 57 | 4.9% |
| Literature & Languages | 90 | 7.8% |
| Liberal Arts & History | 134 | 11.6% |
| Visual & Performing Arts | 25 | 2.2% |
| Communications | 92 | 7.9% |
| Arts & Humanities | 28 | 2.4% |
| Total | 1,158 | 100.0% |
Transportation & Commute in Ambridge borough
Vehicle Availability by Sex in Ambridge borough
The most prevalent vehicle ownership categories in Ambridge borough are males with 2 vehicles (558, accounting for 33.8%) and females with 2 vehicles (668, making up 32.6%).
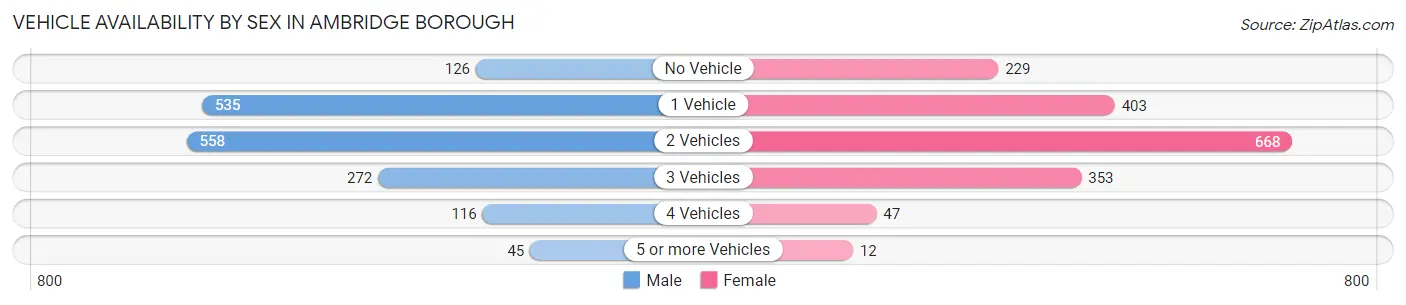
| Vehicles Available | Male | Female |
| No Vehicle | 126 (7.6%) | 229 (13.4%) |
| 1 Vehicle | 535 (32.4%) | 403 (23.5%) |
| 2 Vehicles | 558 (33.8%) | 668 (39.0%) |
| 3 Vehicles | 272 (16.5%) | 353 (20.6%) |
| 4 Vehicles | 116 (7.0%) | 47 (2.8%) |
| 5 or more Vehicles | 45 (2.7%) | 12 (0.7%) |
| Total | 1,652 (100.0%) | 1,712 (100.0%) |
Commute Time in Ambridge borough
The most frequently occuring commute durations in Ambridge borough are 30 to 34 minutes (485 commuters, 15.3%), 20 to 24 minutes (456 commuters, 14.4%), and 5 to 9 minutes (392 commuters, 12.4%).
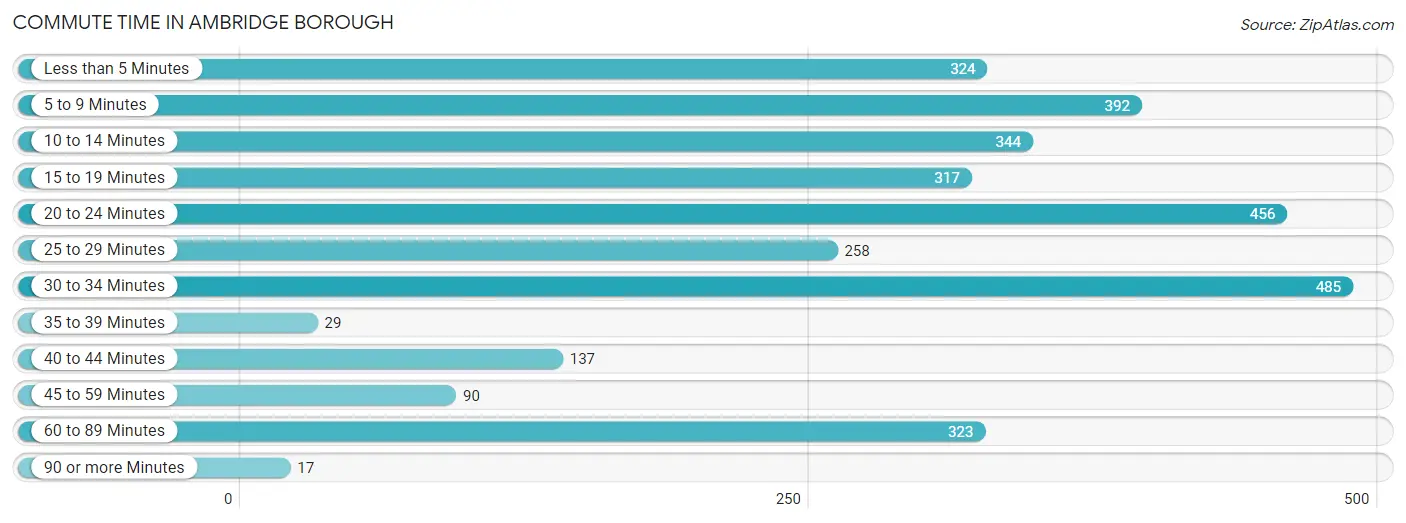
| Commute Time | # Commuters | % Commuters |
| Less than 5 Minutes | 324 | 10.2% |
| 5 to 9 Minutes | 392 | 12.4% |
| 10 to 14 Minutes | 344 | 10.8% |
| 15 to 19 Minutes | 317 | 10.0% |
| 20 to 24 Minutes | 456 | 14.4% |
| 25 to 29 Minutes | 258 | 8.1% |
| 30 to 34 Minutes | 485 | 15.3% |
| 35 to 39 Minutes | 29 | 0.9% |
| 40 to 44 Minutes | 137 | 4.3% |
| 45 to 59 Minutes | 90 | 2.8% |
| 60 to 89 Minutes | 323 | 10.2% |
| 90 or more Minutes | 17 | 0.5% |
Commute Time by Sex in Ambridge borough
The most common commute times in Ambridge borough are 10 to 14 minutes (239 commuters, 15.5%) for males and 30 to 34 minutes (350 commuters, 21.5%) for females.
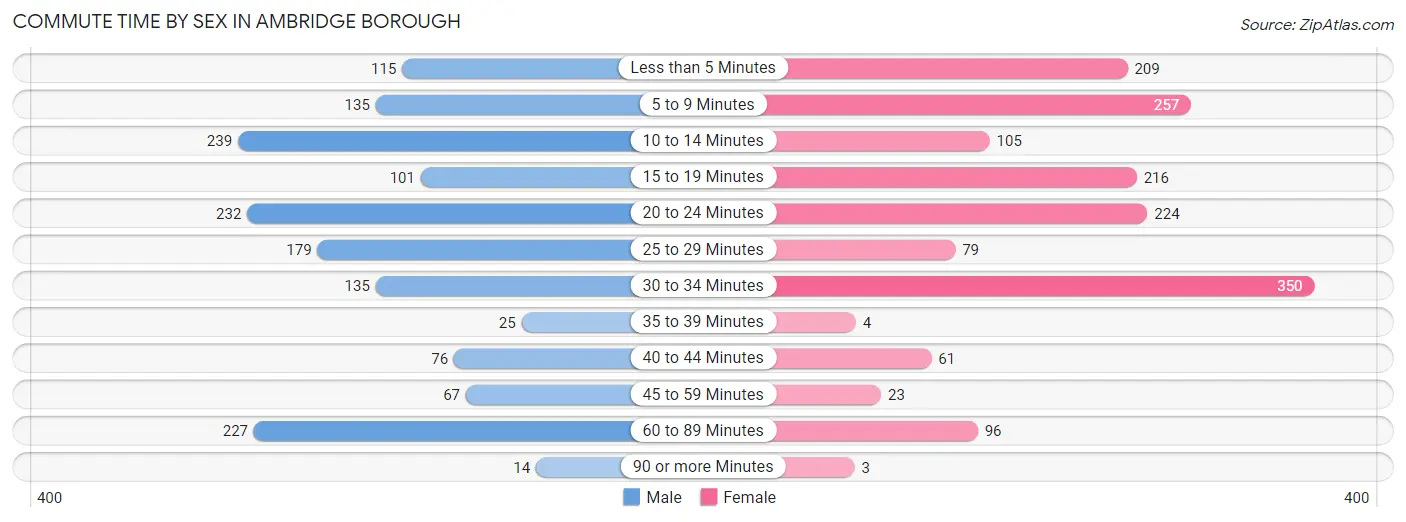
| Commute Time | Male | Female |
| Less than 5 Minutes | 115 (7.4%) | 209 (12.9%) |
| 5 to 9 Minutes | 135 (8.7%) | 257 (15.8%) |
| 10 to 14 Minutes | 239 (15.5%) | 105 (6.5%) |
| 15 to 19 Minutes | 101 (6.5%) | 216 (13.3%) |
| 20 to 24 Minutes | 232 (15.0%) | 224 (13.8%) |
| 25 to 29 Minutes | 179 (11.6%) | 79 (4.9%) |
| 30 to 34 Minutes | 135 (8.7%) | 350 (21.5%) |
| 35 to 39 Minutes | 25 (1.6%) | 4 (0.3%) |
| 40 to 44 Minutes | 76 (4.9%) | 61 (3.7%) |
| 45 to 59 Minutes | 67 (4.3%) | 23 (1.4%) |
| 60 to 89 Minutes | 227 (14.7%) | 96 (5.9%) |
| 90 or more Minutes | 14 (0.9%) | 3 (0.2%) |
Time of Departure to Work by Sex in Ambridge borough
The most frequent times of departure to work in Ambridge borough are 6:30 AM to 6:59 AM (266, 17.2%) for males and 7:00 AM to 7:29 AM (336, 20.6%) for females.
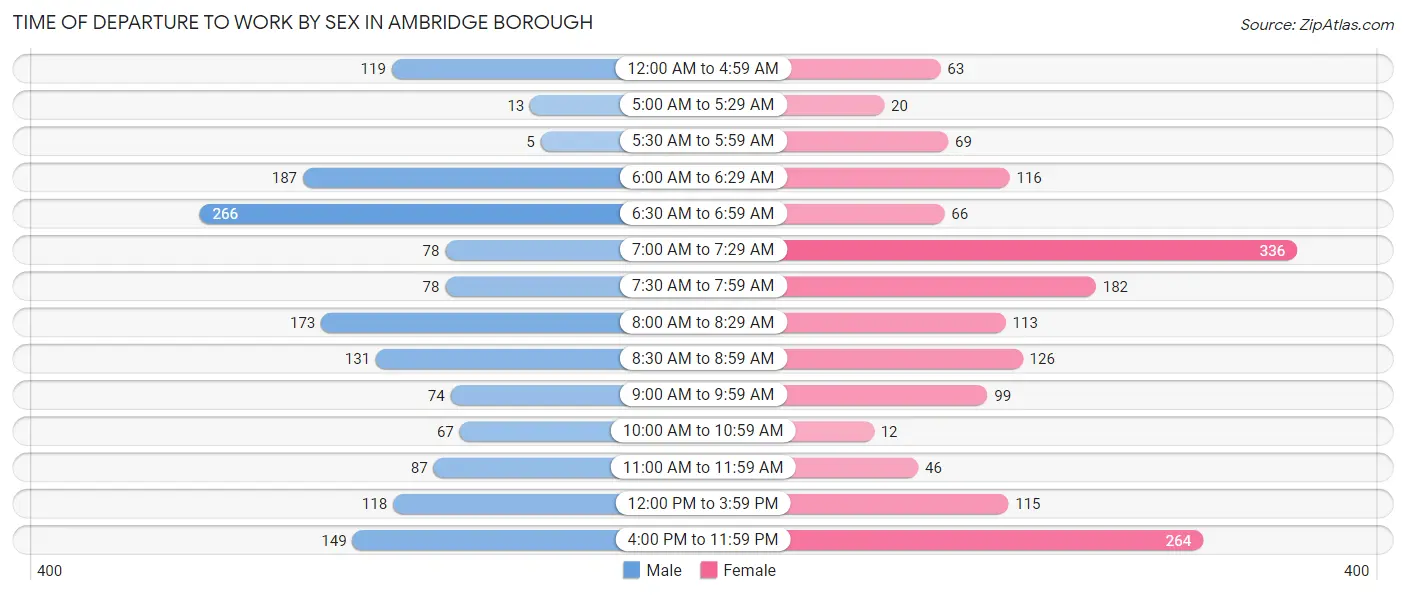
| Time of Departure | Male | Female |
| 12:00 AM to 4:59 AM | 119 (7.7%) | 63 (3.9%) |
| 5:00 AM to 5:29 AM | 13 (0.8%) | 20 (1.2%) |
| 5:30 AM to 5:59 AM | 5 (0.3%) | 69 (4.2%) |
| 6:00 AM to 6:29 AM | 187 (12.1%) | 116 (7.1%) |
| 6:30 AM to 6:59 AM | 266 (17.2%) | 66 (4.1%) |
| 7:00 AM to 7:29 AM | 78 (5.1%) | 336 (20.6%) |
| 7:30 AM to 7:59 AM | 78 (5.1%) | 182 (11.2%) |
| 8:00 AM to 8:29 AM | 173 (11.2%) | 113 (7.0%) |
| 8:30 AM to 8:59 AM | 131 (8.5%) | 126 (7.7%) |
| 9:00 AM to 9:59 AM | 74 (4.8%) | 99 (6.1%) |
| 10:00 AM to 10:59 AM | 67 (4.3%) | 12 (0.7%) |
| 11:00 AM to 11:59 AM | 87 (5.6%) | 46 (2.8%) |
| 12:00 PM to 3:59 PM | 118 (7.6%) | 115 (7.1%) |
| 4:00 PM to 11:59 PM | 149 (9.6%) | 264 (16.2%) |
| Total | 1,545 (100.0%) | 1,627 (100.0%) |
Housing Occupancy in Ambridge borough
Occupancy by Ownership in Ambridge borough
Of the total 3,130 dwellings in Ambridge borough, owner-occupied units account for 1,525 (48.7%), while renter-occupied units make up 1,605 (51.3%).
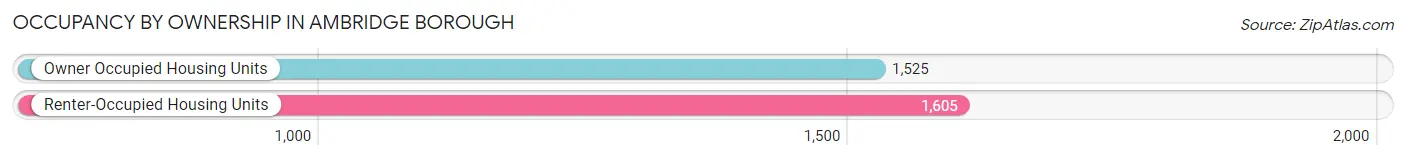
| Occupancy | # Housing Units | % Housing Units |
| Owner Occupied Housing Units | 1,525 | 48.7% |
| Renter-Occupied Housing Units | 1,605 | 51.3% |
| Total Occupied Housing Units | 3,130 | 100.0% |
Occupancy by Household Size in Ambridge borough
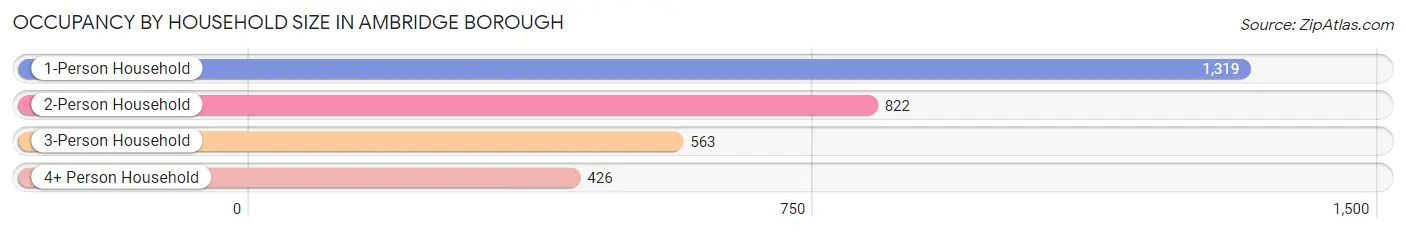
| Household Size | # Housing Units | % Housing Units |
| 1-Person Household | 1,319 | 42.1% |
| 2-Person Household | 822 | 26.3% |
| 3-Person Household | 563 | 18.0% |
| 4+ Person Household | 426 | 13.6% |
| Total Housing Units | 3,130 | 100.0% |
Occupancy by Ownership by Household Size in Ambridge borough
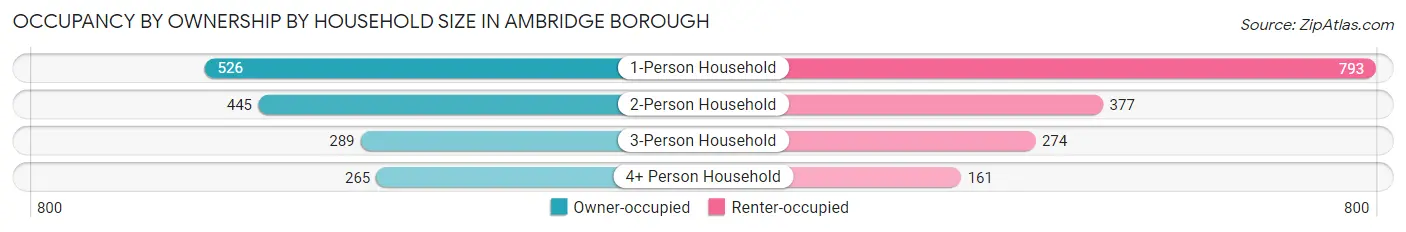
| Household Size | Owner-occupied | Renter-occupied |
| 1-Person Household | 526 (39.9%) | 793 (60.1%) |
| 2-Person Household | 445 (54.1%) | 377 (45.9%) |
| 3-Person Household | 289 (51.3%) | 274 (48.7%) |
| 4+ Person Household | 265 (62.2%) | 161 (37.8%) |
| Total Housing Units | 1,525 (48.7%) | 1,605 (51.3%) |
Occupancy by Educational Attainment in Ambridge borough
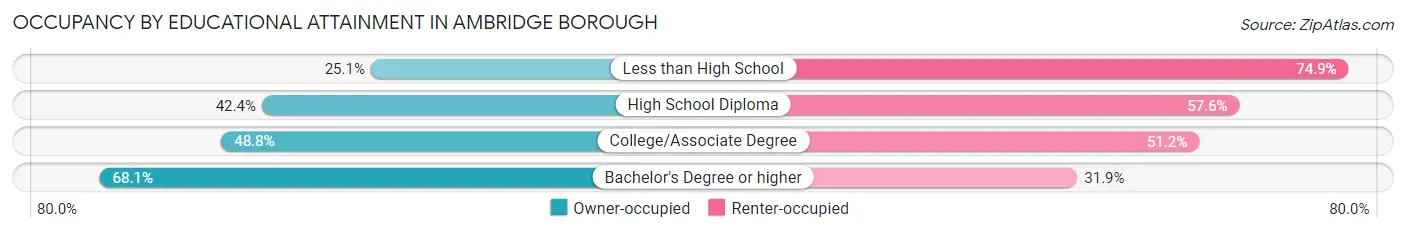
| Household Size | Owner-occupied | Renter-occupied |
| Less than High School | 62 (25.1%) | 185 (74.9%) |
| High School Diploma | 468 (42.4%) | 636 (57.6%) |
| College/Associate Degree | 547 (48.8%) | 574 (51.2%) |
| Bachelor's Degree or higher | 448 (68.1%) | 210 (31.9%) |
Occupancy by Age of Householder in Ambridge borough
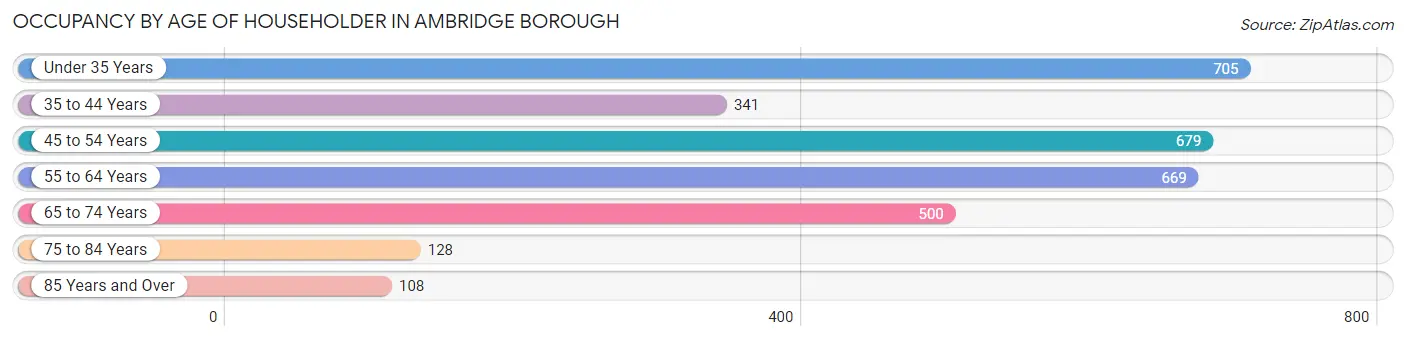
| Age Bracket | # Households | % Households |
| Under 35 Years | 705 | 22.5% |
| 35 to 44 Years | 341 | 10.9% |
| 45 to 54 Years | 679 | 21.7% |
| 55 to 64 Years | 669 | 21.4% |
| 65 to 74 Years | 500 | 16.0% |
| 75 to 84 Years | 128 | 4.1% |
| 85 Years and Over | 108 | 3.5% |
| Total | 3,130 | 100.0% |
Housing Finances in Ambridge borough
Median Income by Occupancy in Ambridge borough
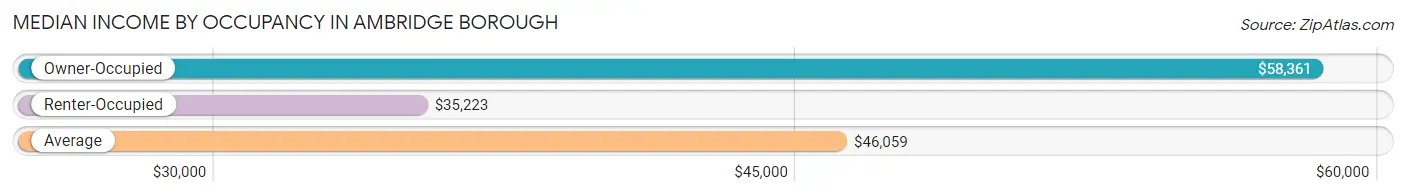
| Occupancy Type | # Households | Median Income |
| Owner-Occupied | 1,525 (48.7%) | $58,361 |
| Renter-Occupied | 1,605 (51.3%) | $35,223 |
| Average | 3,130 (100.0%) | $46,059 |
Occupancy by Householder Income Bracket in Ambridge borough
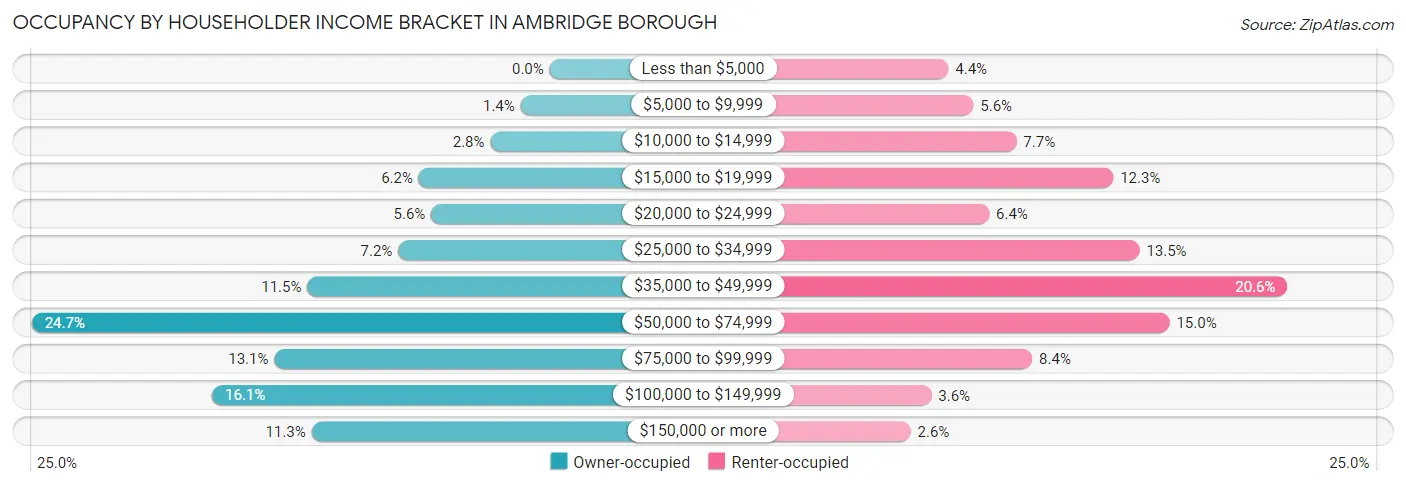
| Income Bracket | Owner-occupied | Renter-occupied |
| Less than $5,000 | 0 (0.0%) | 71 (4.4%) |
| $5,000 to $9,999 | 21 (1.4%) | 90 (5.6%) |
| $10,000 to $14,999 | 43 (2.8%) | 123 (7.7%) |
| $15,000 to $19,999 | 95 (6.2%) | 197 (12.3%) |
| $20,000 to $24,999 | 86 (5.6%) | 102 (6.4%) |
| $25,000 to $34,999 | 110 (7.2%) | 217 (13.5%) |
| $35,000 to $49,999 | 176 (11.5%) | 330 (20.6%) |
| $50,000 to $74,999 | 376 (24.7%) | 240 (14.9%) |
| $75,000 to $99,999 | 200 (13.1%) | 135 (8.4%) |
| $100,000 to $149,999 | 245 (16.1%) | 58 (3.6%) |
| $150,000 or more | 173 (11.3%) | 42 (2.6%) |
| Total | 1,525 (100.0%) | 1,605 (100.0%) |
Monthly Housing Cost Tiers in Ambridge borough
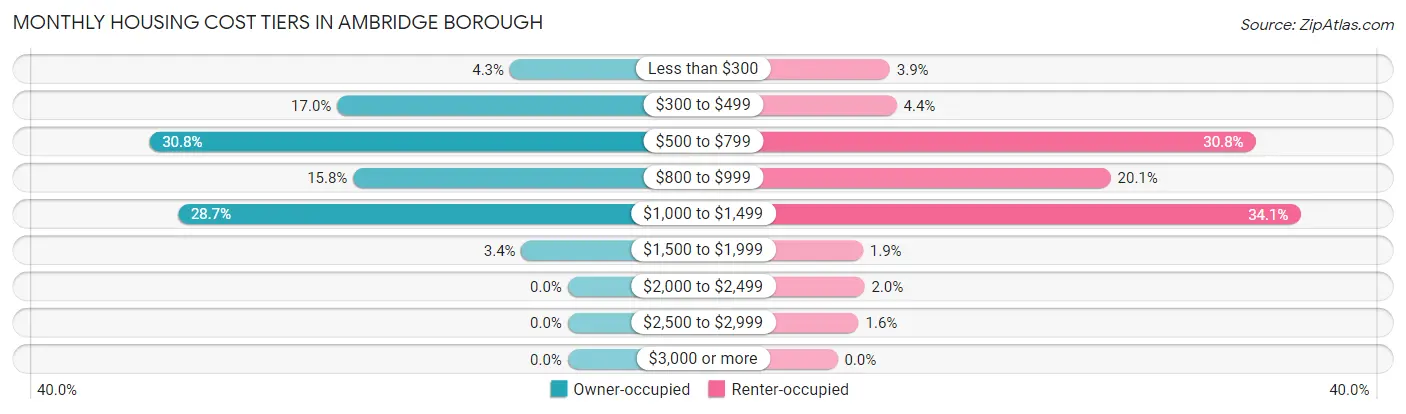
| Monthly Cost | Owner-occupied | Renter-occupied |
| Less than $300 | 65 (4.3%) | 62 (3.9%) |
| $300 to $499 | 259 (17.0%) | 70 (4.4%) |
| $500 to $799 | 470 (30.8%) | 494 (30.8%) |
| $800 to $999 | 241 (15.8%) | 323 (20.1%) |
| $1,000 to $1,499 | 438 (28.7%) | 547 (34.1%) |
| $1,500 to $1,999 | 52 (3.4%) | 30 (1.9%) |
| $2,000 to $2,499 | 0 (0.0%) | 32 (2.0%) |
| $2,500 to $2,999 | 0 (0.0%) | 25 (1.6%) |
| $3,000 or more | 0 (0.0%) | 0 (0.0%) |
| Total | 1,525 (100.0%) | 1,605 (100.0%) |
Physical Housing Characteristics in Ambridge borough
Housing Structures in Ambridge borough
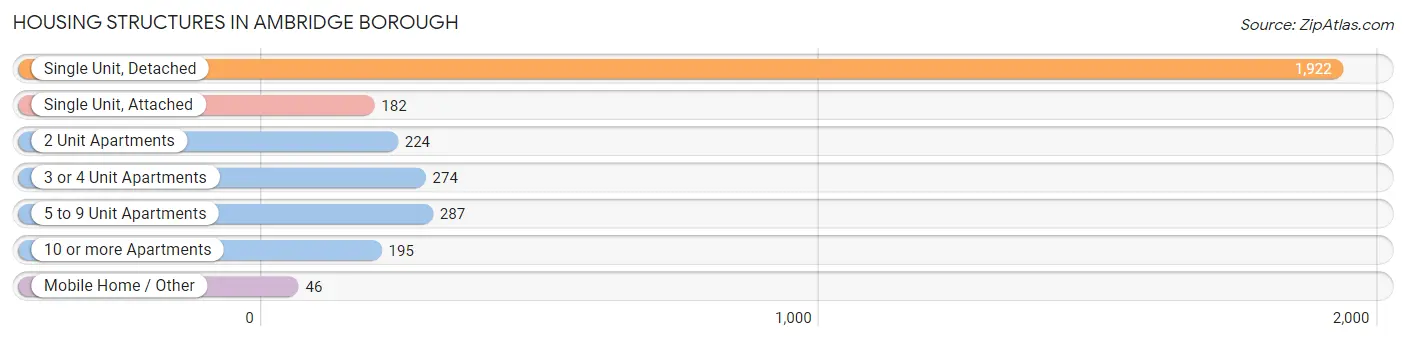
| Structure Type | # Housing Units | % Housing Units |
| Single Unit, Detached | 1,922 | 61.4% |
| Single Unit, Attached | 182 | 5.8% |
| 2 Unit Apartments | 224 | 7.2% |
| 3 or 4 Unit Apartments | 274 | 8.7% |
| 5 to 9 Unit Apartments | 287 | 9.2% |
| 10 or more Apartments | 195 | 6.2% |
| Mobile Home / Other | 46 | 1.5% |
| Total | 3,130 | 100.0% |
Housing Structures by Occupancy in Ambridge borough
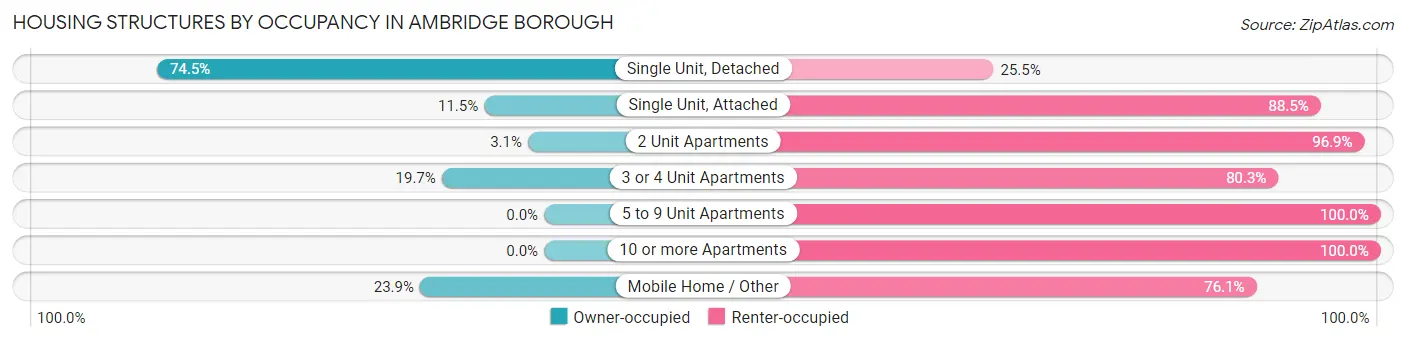
| Structure Type | Owner-occupied | Renter-occupied |
| Single Unit, Detached | 1,432 (74.5%) | 490 (25.5%) |
| Single Unit, Attached | 21 (11.5%) | 161 (88.5%) |
| 2 Unit Apartments | 7 (3.1%) | 217 (96.9%) |
| 3 or 4 Unit Apartments | 54 (19.7%) | 220 (80.3%) |
| 5 to 9 Unit Apartments | 0 (0.0%) | 287 (100.0%) |
| 10 or more Apartments | 0 (0.0%) | 195 (100.0%) |
| Mobile Home / Other | 11 (23.9%) | 35 (76.1%) |
| Total | 1,525 (48.7%) | 1,605 (51.3%) |
Housing Structures by Number of Rooms in Ambridge borough
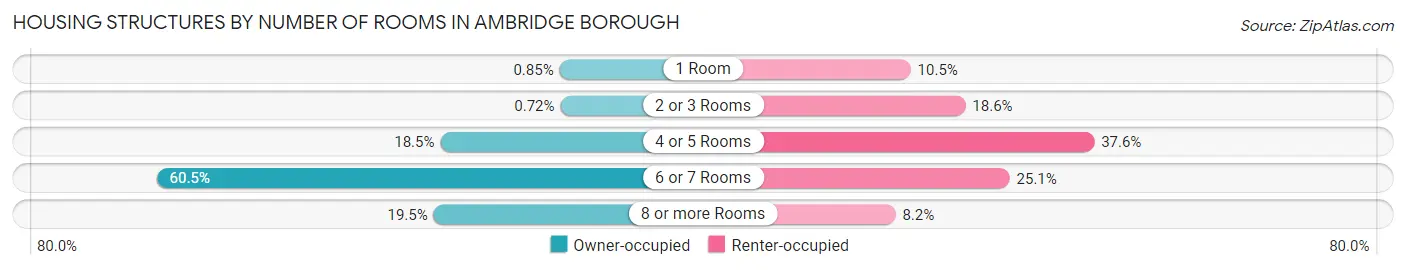
| Number of Rooms | Owner-occupied | Renter-occupied |
| 1 Room | 13 (0.9%) | 168 (10.5%) |
| 2 or 3 Rooms | 11 (0.7%) | 298 (18.6%) |
| 4 or 5 Rooms | 282 (18.5%) | 604 (37.6%) |
| 6 or 7 Rooms | 922 (60.5%) | 403 (25.1%) |
| 8 or more Rooms | 297 (19.5%) | 132 (8.2%) |
| Total | 1,525 (100.0%) | 1,605 (100.0%) |
Housing Structure by Heating Type in Ambridge borough
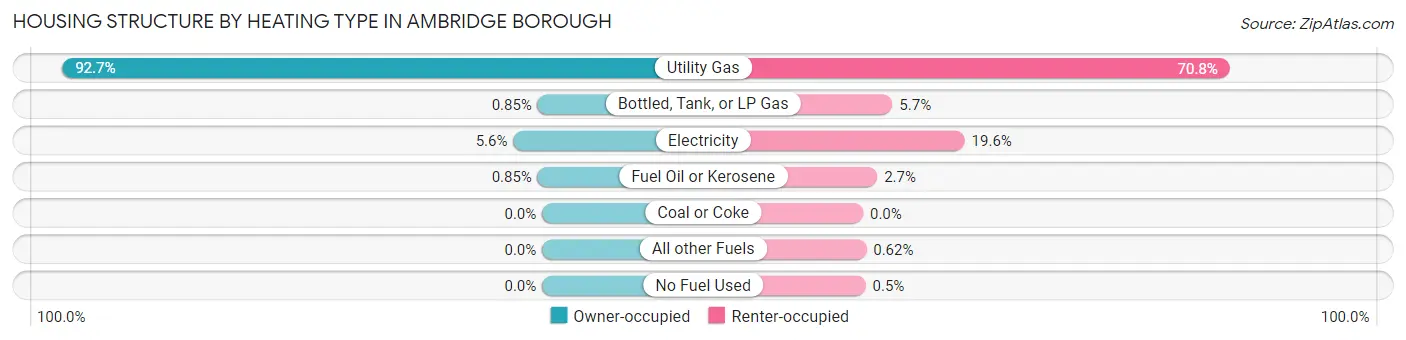
| Heating Type | Owner-occupied | Renter-occupied |
| Utility Gas | 1,414 (92.7%) | 1,137 (70.8%) |
| Bottled, Tank, or LP Gas | 13 (0.9%) | 91 (5.7%) |
| Electricity | 85 (5.6%) | 315 (19.6%) |
| Fuel Oil or Kerosene | 13 (0.9%) | 44 (2.7%) |
| Coal or Coke | 0 (0.0%) | 0 (0.0%) |
| All other Fuels | 0 (0.0%) | 10 (0.6%) |
| No Fuel Used | 0 (0.0%) | 8 (0.5%) |
| Total | 1,525 (100.0%) | 1,605 (100.0%) |
Household Vehicle Usage in Ambridge borough
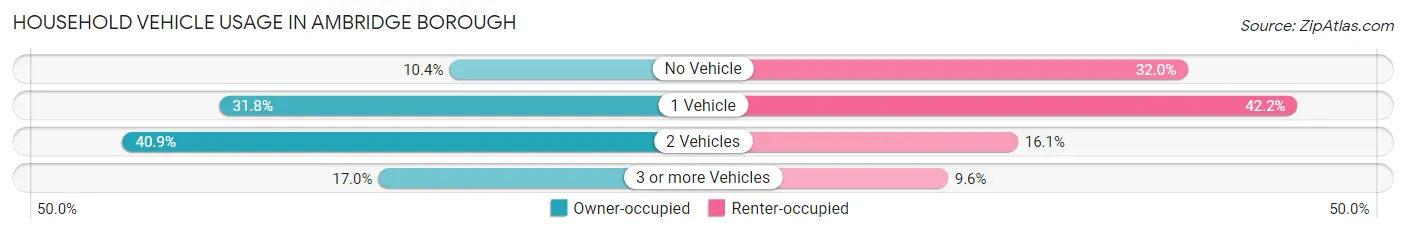
| Vehicles per Household | Owner-occupied | Renter-occupied |
| No Vehicle | 158 (10.4%) | 514 (32.0%) |
| 1 Vehicle | 485 (31.8%) | 678 (42.2%) |
| 2 Vehicles | 623 (40.8%) | 259 (16.1%) |
| 3 or more Vehicles | 259 (17.0%) | 154 (9.6%) |
| Total | 1,525 (100.0%) | 1,605 (100.0%) |
Real Estate & Mortgages in Ambridge borough
Real Estate and Mortgage Overview in Ambridge borough
| Characteristic | Without Mortgage | With Mortgage |
| Housing Units | 806 | 719 |
| Median Property Value | $81,800 | $94,300 |
| Median Household Income | $56,000 | $131 |
| Monthly Housing Costs | $548 | $0 |
| Real Estate Taxes | $1,798 | $36 |
Property Value by Mortgage Status in Ambridge borough
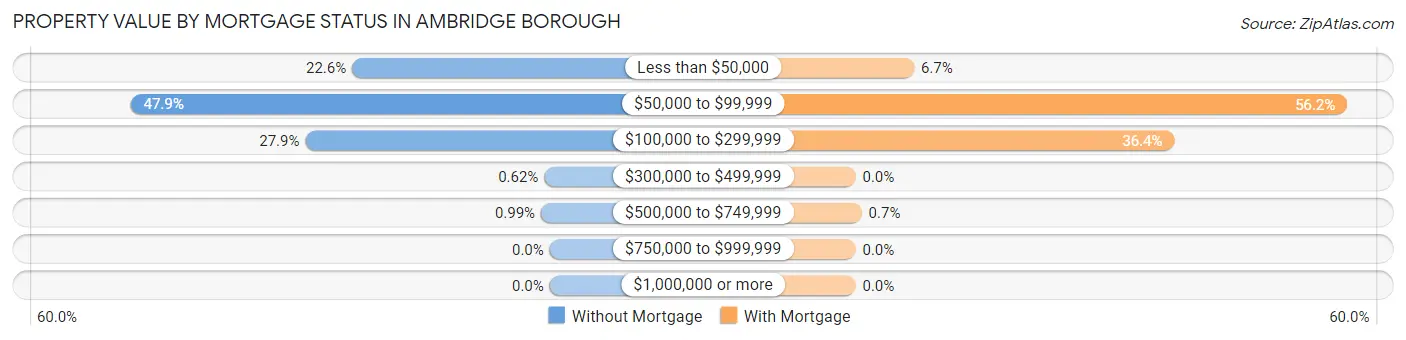
| Property Value | Without Mortgage | With Mortgage |
| Less than $50,000 | 182 (22.6%) | 48 (6.7%) |
| $50,000 to $99,999 | 386 (47.9%) | 404 (56.2%) |
| $100,000 to $299,999 | 225 (27.9%) | 262 (36.4%) |
| $300,000 to $499,999 | 5 (0.6%) | 0 (0.0%) |
| $500,000 to $749,999 | 8 (1.0%) | 5 (0.7%) |
| $750,000 to $999,999 | 0 (0.0%) | 0 (0.0%) |
| $1,000,000 or more | 0 (0.0%) | 0 (0.0%) |
| Total | 806 (100.0%) | 719 (100.0%) |
Household Income by Mortgage Status in Ambridge borough
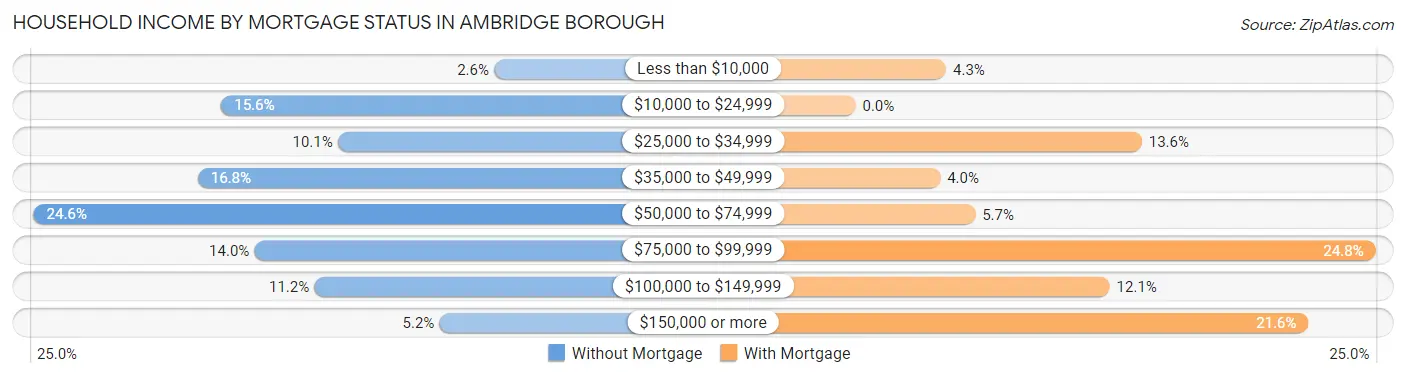
| Household Income | Without Mortgage | With Mortgage |
| Less than $10,000 | 21 (2.6%) | 31 (4.3%) |
| $10,000 to $24,999 | 126 (15.6%) | 0 (0.0%) |
| $25,000 to $34,999 | 81 (10.1%) | 98 (13.6%) |
| $35,000 to $49,999 | 135 (16.8%) | 29 (4.0%) |
| $50,000 to $74,999 | 198 (24.6%) | 41 (5.7%) |
| $75,000 to $99,999 | 113 (14.0%) | 178 (24.8%) |
| $100,000 to $149,999 | 90 (11.2%) | 87 (12.1%) |
| $150,000 or more | 42 (5.2%) | 155 (21.6%) |
| Total | 806 (100.0%) | 719 (100.0%) |
Property Value to Household Income Ratio in Ambridge borough
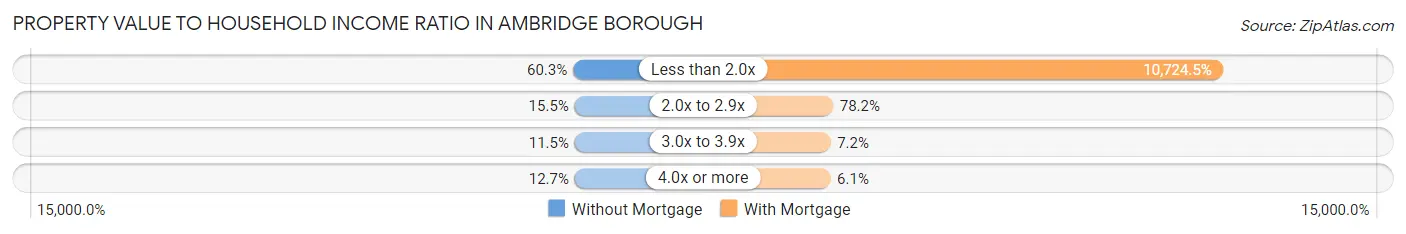
| Value-to-Income Ratio | Without Mortgage | With Mortgage |
| Less than 2.0x | 486 (60.3%) | 77,109 (10,724.5%) |
| 2.0x to 2.9x | 125 (15.5%) | 562 (78.2%) |
| 3.0x to 3.9x | 93 (11.5%) | 52 (7.2%) |
| 4.0x or more | 102 (12.7%) | 44 (6.1%) |
| Total | 806 (100.0%) | 719 (100.0%) |
Real Estate Taxes by Mortgage Status in Ambridge borough
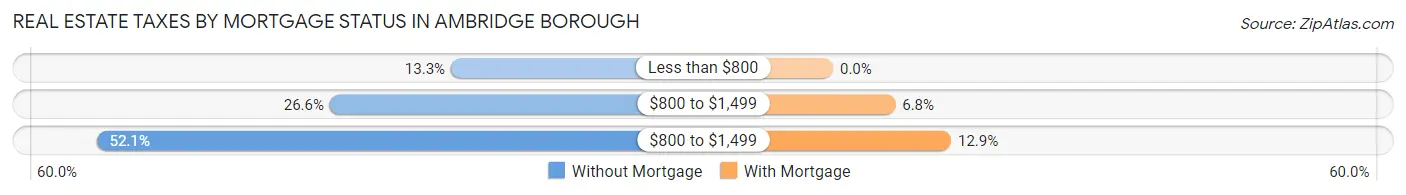
| Property Taxes | Without Mortgage | With Mortgage |
| Less than $800 | 107 (13.3%) | 0 (0.0%) |
| $800 to $1,499 | 214 (26.6%) | 49 (6.8%) |
| $800 to $1,499 | 420 (52.1%) | 93 (12.9%) |
| Total | 806 (100.0%) | 719 (100.0%) |
Health & Disability in Ambridge borough
Health Insurance Coverage by Age in Ambridge borough
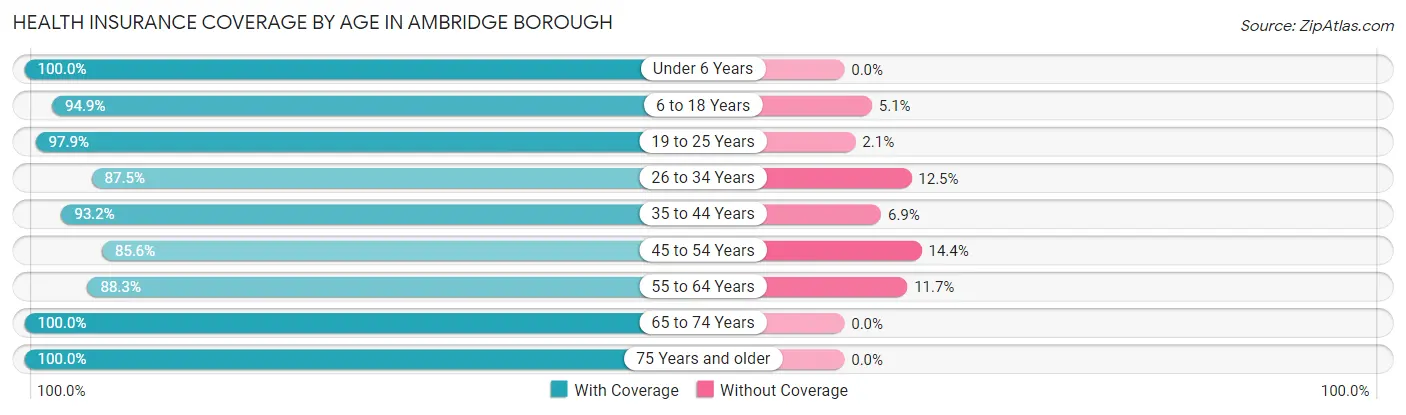
| Age Bracket | With Coverage | Without Coverage |
| Under 6 Years | 393 (100.0%) | 0 (0.0%) |
| 6 to 18 Years | 1,126 (94.9%) | 61 (5.1%) |
| 19 to 25 Years | 520 (97.9%) | 11 (2.1%) |
| 26 to 34 Years | 889 (87.5%) | 127 (12.5%) |
| 35 to 44 Years | 693 (93.1%) | 51 (6.9%) |
| 45 to 54 Years | 873 (85.6%) | 147 (14.4%) |
| 55 to 64 Years | 926 (88.3%) | 123 (11.7%) |
| 65 to 74 Years | 678 (100.0%) | 0 (0.0%) |
| 75 Years and older | 319 (100.0%) | 0 (0.0%) |
| Total | 6,417 (92.5%) | 520 (7.5%) |
Health Insurance Coverage by Citizenship Status in Ambridge borough
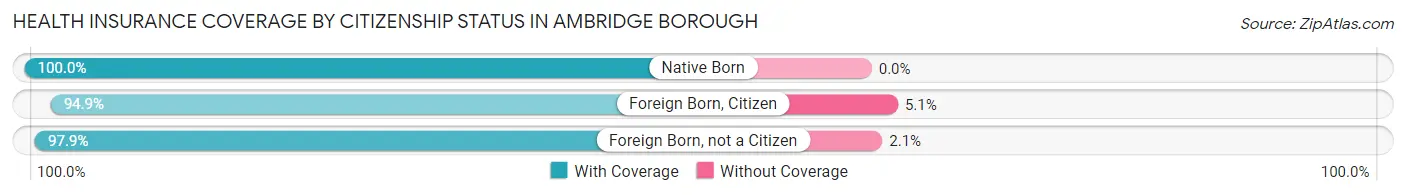
| Citizenship Status | With Coverage | Without Coverage |
| Native Born | 393 (100.0%) | 0 (0.0%) |
| Foreign Born, Citizen | 1,126 (94.9%) | 61 (5.1%) |
| Foreign Born, not a Citizen | 520 (97.9%) | 11 (2.1%) |
Health Insurance Coverage by Household Income in Ambridge borough
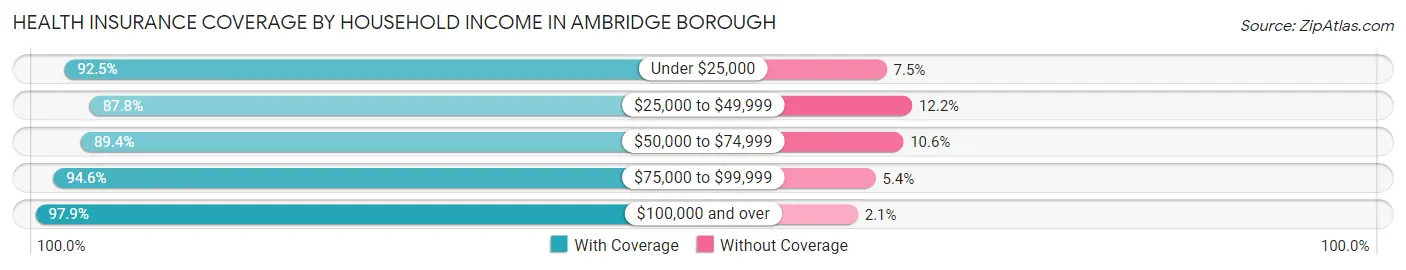
| Household Income | With Coverage | Without Coverage |
| Under $25,000 | 1,154 (92.5%) | 93 (7.5%) |
| $25,000 to $49,999 | 1,308 (87.8%) | 182 (12.2%) |
| $50,000 to $74,999 | 1,303 (89.4%) | 154 (10.6%) |
| $75,000 to $99,999 | 968 (94.6%) | 55 (5.4%) |
| $100,000 and over | 1,662 (97.9%) | 35 (2.1%) |
Public vs Private Health Insurance Coverage by Age in Ambridge borough
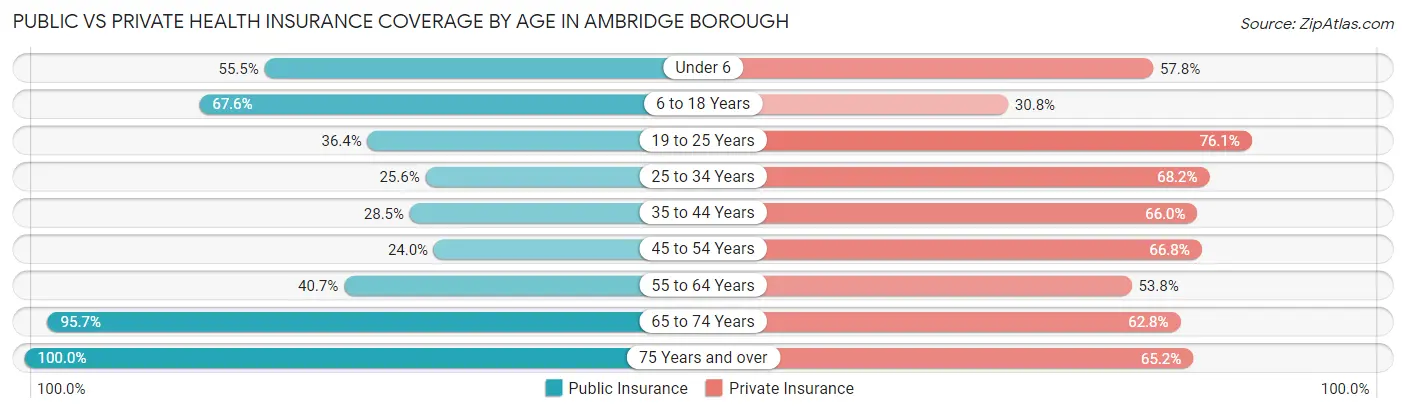
| Age Bracket | Public Insurance | Private Insurance |
| Under 6 | 218 (55.5%) | 227 (57.8%) |
| 6 to 18 Years | 802 (67.6%) | 366 (30.8%) |
| 19 to 25 Years | 193 (36.3%) | 404 (76.1%) |
| 25 to 34 Years | 260 (25.6%) | 693 (68.2%) |
| 35 to 44 Years | 212 (28.5%) | 491 (66.0%) |
| 45 to 54 Years | 245 (24.0%) | 681 (66.8%) |
| 55 to 64 Years | 427 (40.7%) | 564 (53.8%) |
| 65 to 74 Years | 649 (95.7%) | 426 (62.8%) |
| 75 Years and over | 319 (100.0%) | 208 (65.2%) |
| Total | 3,325 (47.9%) | 4,060 (58.5%) |
Disability Status by Sex by Age in Ambridge borough
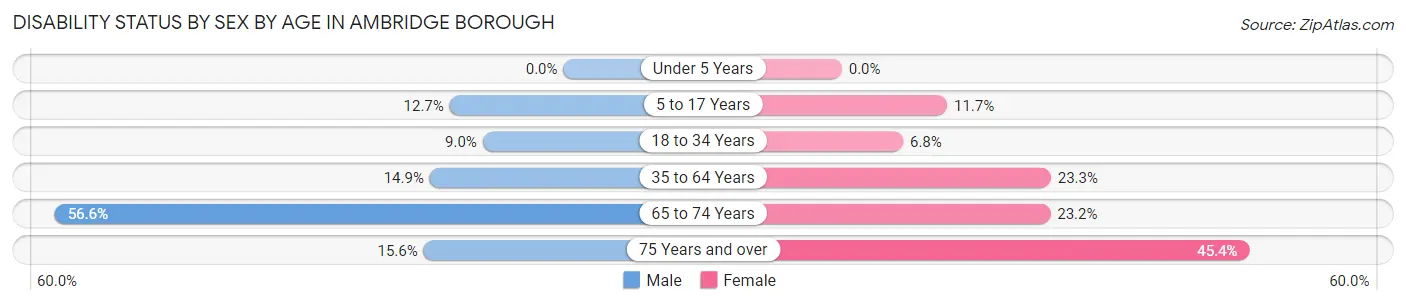
| Age Bracket | Male | Female |
| Under 5 Years | 0 (0.0%) | 0 (0.0%) |
| 5 to 17 Years | 95 (12.7%) | 60 (11.7%) |
| 18 to 34 Years | 72 (9.0%) | 54 (6.8%) |
| 35 to 64 Years | 200 (14.9%) | 342 (23.3%) |
| 65 to 74 Years | 145 (56.6%) | 98 (23.2%) |
| 75 Years and over | 26 (15.6%) | 69 (45.4%) |
Disability Class by Sex by Age in Ambridge borough
Disability Class: Hearing Difficulty
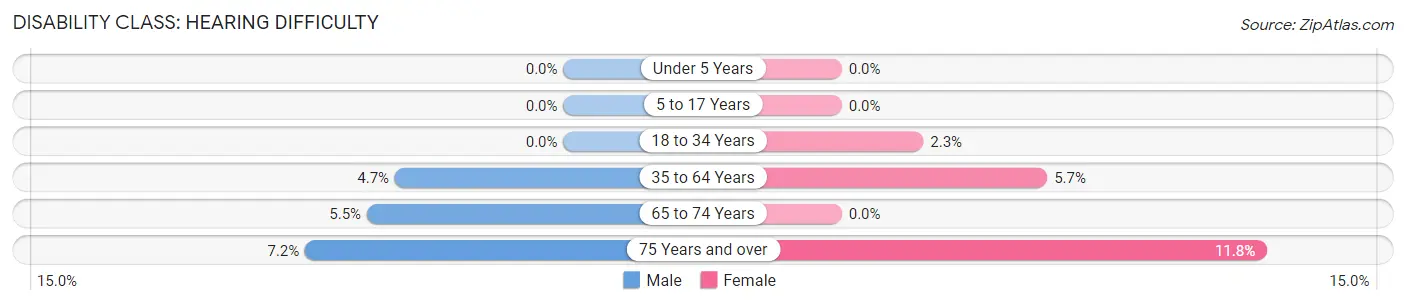
| Age Bracket | Male | Female |
| Under 5 Years | 0 (0.0%) | 0 (0.0%) |
| 5 to 17 Years | 0 (0.0%) | 0 (0.0%) |
| 18 to 34 Years | 0 (0.0%) | 18 (2.3%) |
| 35 to 64 Years | 63 (4.7%) | 84 (5.7%) |
| 65 to 74 Years | 14 (5.5%) | 0 (0.0%) |
| 75 Years and over | 12 (7.2%) | 18 (11.8%) |
Disability Class: Vision Difficulty
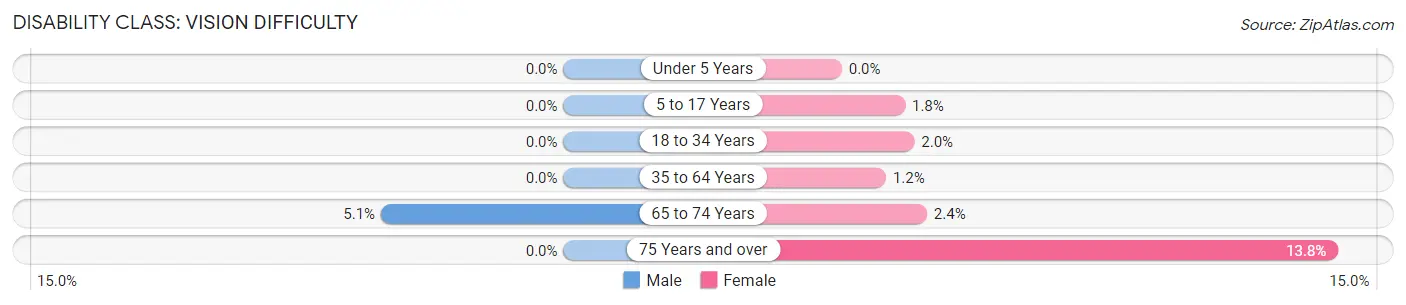
| Age Bracket | Male | Female |
| Under 5 Years | 0 (0.0%) | 0 (0.0%) |
| 5 to 17 Years | 0 (0.0%) | 9 (1.8%) |
| 18 to 34 Years | 0 (0.0%) | 16 (2.0%) |
| 35 to 64 Years | 0 (0.0%) | 18 (1.2%) |
| 65 to 74 Years | 13 (5.1%) | 10 (2.4%) |
| 75 Years and over | 0 (0.0%) | 21 (13.8%) |
Disability Class: Cognitive Difficulty
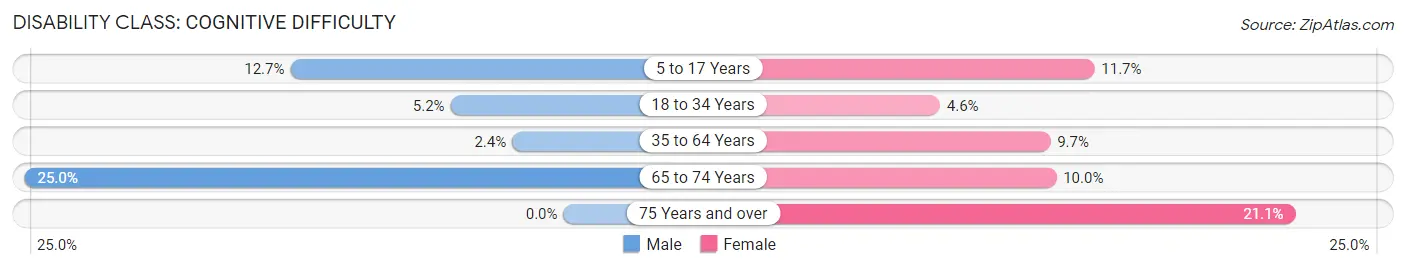
| Age Bracket | Male | Female |
| 5 to 17 Years | 95 (12.7%) | 60 (11.7%) |
| 18 to 34 Years | 42 (5.2%) | 36 (4.5%) |
| 35 to 64 Years | 32 (2.4%) | 142 (9.7%) |
| 65 to 74 Years | 64 (25.0%) | 42 (10.0%) |
| 75 Years and over | 0 (0.0%) | 32 (21.0%) |
Disability Class: Ambulatory Difficulty
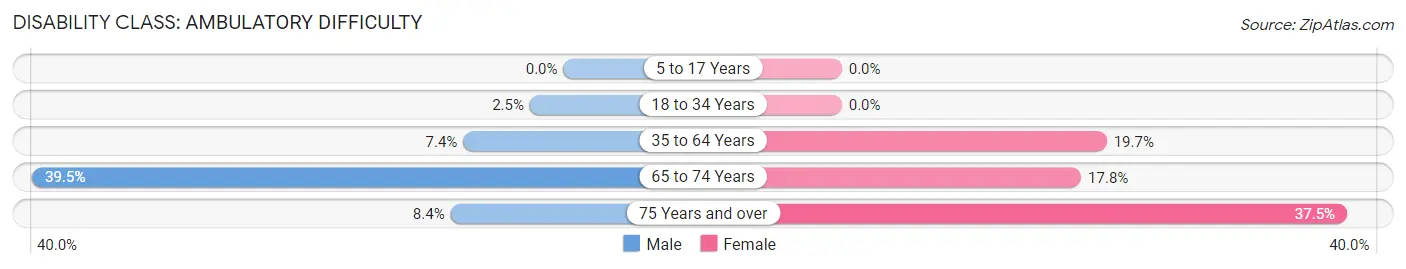
| Age Bracket | Male | Female |
| 5 to 17 Years | 0 (0.0%) | 0 (0.0%) |
| 18 to 34 Years | 20 (2.5%) | 0 (0.0%) |
| 35 to 64 Years | 100 (7.4%) | 289 (19.7%) |
| 65 to 74 Years | 101 (39.5%) | 75 (17.8%) |
| 75 Years and over | 14 (8.4%) | 57 (37.5%) |
Disability Class: Self-Care Difficulty
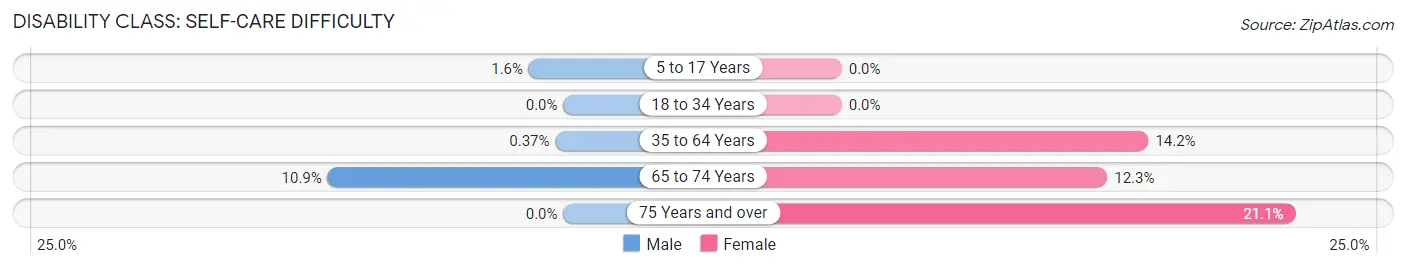
| Age Bracket | Male | Female |
| 5 to 17 Years | 12 (1.6%) | 0 (0.0%) |
| 18 to 34 Years | 0 (0.0%) | 0 (0.0%) |
| 35 to 64 Years | 5 (0.4%) | 209 (14.2%) |
| 65 to 74 Years | 28 (10.9%) | 52 (12.3%) |
| 75 Years and over | 0 (0.0%) | 32 (21.0%) |
Technology Access in Ambridge borough
Computing Device Access in Ambridge borough
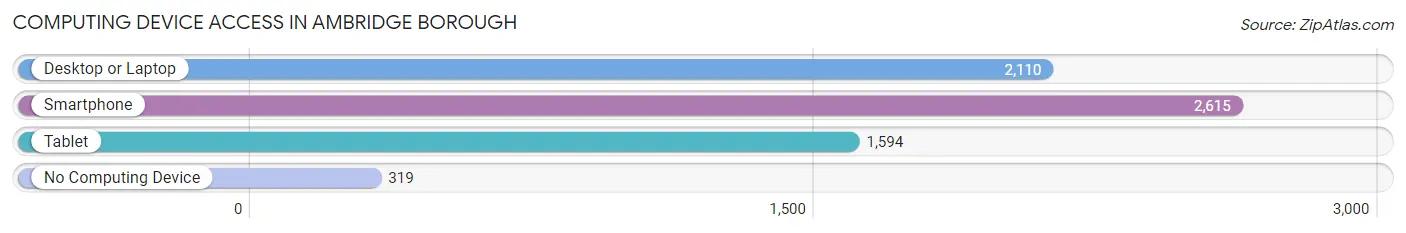
| Device Type | # Households | % Households |
| Desktop or Laptop | 2,110 | 67.4% |
| Smartphone | 2,615 | 83.6% |
| Tablet | 1,594 | 50.9% |
| No Computing Device | 319 | 10.2% |
| Total | 3,130 | 100.0% |
Internet Access in Ambridge borough
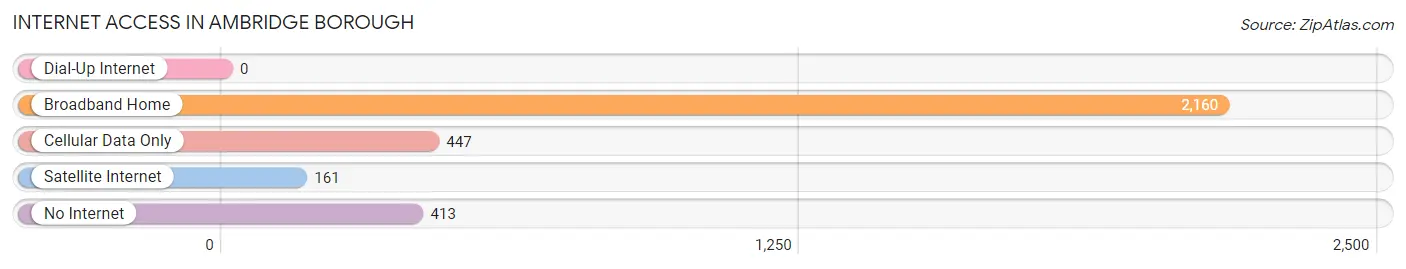
| Internet Type | # Households | % Households |
| Dial-Up Internet | 0 | 0.0% |
| Broadband Home | 2,160 | 69.0% |
| Cellular Data Only | 447 | 14.3% |
| Satellite Internet | 161 | 5.1% |
| No Internet | 413 | 13.2% |
| Total | 3,130 | 100.0% |
Ambridge borough Summary
Ambridge Borough is a small borough located in Beaver County, Pennsylvania. It is situated along the Ohio River, approximately 25 miles northwest of Pittsburgh. The borough has a population of 7,050, according to the 2010 census.
History
The area that is now Ambridge Borough was first settled in 1795 by John and William Montour, two brothers of French-Canadian descent. The Montours named the area “Ambridge” after their father, Ambrose Montour. The area was officially incorporated as a borough in 1905.
In the late 19th century, Ambridge became a major industrial center. The American Bridge Company, which was founded in 1900, was the largest employer in the area. The company manufactured steel bridges and other steel products. The company’s success helped to spur the growth of the borough.
Geography
Ambridge Borough is located in western Pennsylvania, along the Ohio River. It is bordered by Baden to the north, Economy to the east, and Harmony Township to the south. The borough covers an area of 1.3 square miles, all of which is land.
The terrain of Ambridge is mostly flat, with some rolling hills. The borough is located in the Appalachian Plateau region of Pennsylvania. The climate is humid continental, with cold winters and hot, humid summers.
Economy
Ambridge Borough’s economy is largely based on manufacturing. The American Bridge Company is still the largest employer in the area, although it has been in decline since the 1980s. Other major employers include the Ambridge Area School District, the Ambridge Area Public Library, and the Ambridge Area Senior Center.
The borough also has a number of small businesses, including restaurants, retail stores, and professional services. The median household income in Ambridge is $37,845, and the median home value is $90,000.
Demographics
As of the 2010 census, Ambridge Borough had a population of 7,050. The racial makeup of the borough was 94.3% White, 2.7% African American, 0.3% Native American, 0.7% Asian, 0.1% Pacific Islander, and 1.9% from other races. Hispanic or Latino of any race were 2.2% of the population.
The median age in Ambridge is 43.5 years, and the median household income is $37,845. The median home value is $90,000. The borough has a poverty rate of 16.3%.
Conclusion
Ambridge Borough is a small borough located in Beaver County, Pennsylvania. It has a population of 7,050, and its economy is largely based on manufacturing. The borough has a diverse population, with a median age of 43.5 years and a median household income of $37,845. Ambridge is a great place to live, work, and raise a family.
Common Questions
What is Per Capita Income in Ambridge borough?
Per Capita income in Ambridge borough is $27,091.
What is the Median Family Income in Ambridge borough?
Median Family Income in Ambridge borough is $70,500.
What is the Median Household income in Ambridge borough?
Median Household Income in Ambridge borough is $46,059.
What is Income or Wage Gap in Ambridge borough?
Income or Wage Gap in Ambridge borough is 34.8%.
Women in Ambridge borough earn 65.2 cents for every dollar earned by a man.
What is Inequality or Gini Index in Ambridge borough?
Inequality or Gini Index in Ambridge borough is 0.42.
What is the Total Population of Ambridge borough?
Total Population of Ambridge borough is 6,937.
What is the Total Male Population of Ambridge borough?
Total Male Population of Ambridge borough is 3,505.
What is the Total Female Population of Ambridge borough?
Total Female Population of Ambridge borough is 3,432.
What is the Ratio of Males per 100 Females in Ambridge borough?
There are 102.13 Males per 100 Females in Ambridge borough.
What is the Ratio of Females per 100 Males in Ambridge borough?
There are 97.92 Females per 100 Males in Ambridge borough.
What is the Median Population Age in Ambridge borough?
Median Population Age in Ambridge borough is 40.7 Years.
What is the Average Family Size in Ambridge borough
Average Family Size in Ambridge borough is 3.2 People.
What is the Average Household Size in Ambridge borough
Average Household Size in Ambridge borough is 2.2 People.
How Large is the Labor Force in Ambridge borough?
There are 3,872 People in the Labor Forcein in Ambridge borough.
What is the Percentage of People in the Labor Force in Ambridge borough?
68.5% of People are in the Labor Force in Ambridge borough.
What is the Unemployment Rate in Ambridge borough?
Unemployment Rate in Ambridge borough is 10.5%.