Zip Codes with the Highest Percentage of White / Caucasian Population in Oklahoma City, OK

RELATED REPORTS & OPTIONS

White / Caucasian
Population
Families and Households
Female Fertility
Female Fertility (Unmarried)
Race (Community Size)
Race (Percentage)
Ancestry (Community Size)
AfricanAlaska NativeAlbanianAmericanApacheArabArapahoArgentineanArmenianAustralianAustrianBahamianBangladeshiBarbadianBasqueBelgianBhutaneseBlackfeetBolivianBrazilianBritishBritish West IndianBulgarianBurmeseCajunCambodianCanadianCelticCentral AmericanCentral American IndianCherokeeCheyenneChickasawChileanChippewaChoctawColombianComancheCreeCreekCroatianCubanCzechCzechoslovakianDanishDelawareDominicanDutchDutch West IndianEastern EuropeanEcuadorianEgyptianEnglishEstonianEthiopianEuropeanFijianFilipinoFinnishFrenchFrench American IndianFrench CanadianGermanGerman RussianGhanaianGreekGuamanian / ChamorroGuatemalanGuyaneseHaitianHonduranHopiHungarianIcelanderIndian (Asian)IndonesianInupiatIranianIraqiIrishIroquoisIsraeliItalianJamaicanJapaneseJordanianKenyanKiowaKoreanLaotianLatvianLebaneseLiberianLithuanianLuxembourgerMalaysianMexicanMexican American IndianMongolianMoroccanNative HawaiianNavajoNew ZealanderNicaraguanNigerianNorthern EuropeanNorwegianOkinawanOsagePakistaniPalestinianPanamanianPennsylvania GermanPeruvianPimaPolishPortuguesePotawatomiPuebloPuerto RicanRomanianRussianSalvadoranSamoanScandinavianScotch-IrishScottishSeminoleSerbianSiouxSlavicSlovakSloveneSouth AfricanSouth AmericanSouth American IndianSpaniardSpanishSpanish American IndianSri LankanSubsaharan AfricanSudaneseSwedishSwissSyrianThaiTlingit-HaidaTonganTrinidadian and TobagonianTurkishU.S. Virgin IslanderUkrainianUruguayanVenezuelanVietnameseWelshWest IndianYugoslavianZimbabwean
Ancestry (Percentage)
AfricanAlaska NativeAlbanianAmericanApacheArabArapahoArgentineanArmenianAustralianAustrianBahamianBangladeshiBarbadianBasqueBelgianBhutaneseBlackfeetBolivianBrazilianBritishBritish West IndianBulgarianBurmeseCajunCambodianCanadianCelticCentral AmericanCentral American IndianCherokeeCheyenneChickasawChileanChippewaChoctawColombianComancheCreeCreekCroatianCubanCzechCzechoslovakianDanishDelawareDominicanDutchDutch West IndianEastern EuropeanEcuadorianEgyptianEnglishEstonianEthiopianEuropeanFijianFilipinoFinnishFrenchFrench American IndianFrench CanadianGermanGerman RussianGhanaianGreekGuamanian / ChamorroGuatemalanGuyaneseHaitianHonduranHopiHungarianIcelanderIndian (Asian)IndonesianInupiatIranianIraqiIrishIroquoisIsraeliItalianJamaicanJapaneseJordanianKenyanKiowaKoreanLaotianLatvianLebaneseLiberianLithuanianLuxembourgerMalaysianMexicanMexican American IndianMongolianMoroccanNative HawaiianNavajoNew ZealanderNicaraguanNigerianNorthern EuropeanNorwegianOkinawanOsagePakistaniPalestinianPanamanianPennsylvania GermanPeruvianPimaPolishPortuguesePotawatomiPuebloPuerto RicanRomanianRussianSalvadoranSamoanScandinavianScotch-IrishScottishSeminoleSerbianSiouxSlavicSlovakSloveneSouth AfricanSouth AmericanSouth American IndianSpaniardSpanishSpanish American IndianSri LankanSubsaharan AfricanSudaneseSwedishSwissSyrianThaiTlingit-HaidaTonganTrinidadian and TobagonianTurkishU.S. Virgin IslanderUkrainianUruguayanVenezuelanVietnameseWelshWest IndianYugoslavianZimbabwean
Immigrant Origin (Total)
AfricaArgentinaAsiaAustraliaAustriaBahamasBangladeshBosnia and HerzegovinaBrazilBulgariaBurma / MyanmarCambodiaCameroonCanadaCaribbeanCentral AmericaChileChinaColombiaCubaDominican RepublicEastern AfricaEastern AsiaEastern EuropeEcuadorEgyptEl SalvadorEnglandEritreaEthiopiaEuropeFranceGermanyGhanaGreeceGuatemalaHondurasHong KongIndiaIndonesiaIranIraqIrelandItalyJamaicaJapanJordanKazakhstanKenyaKoreaKuwaitLaosLatin AmericaLebanonLiberiaMalaysiaMexicoMiddle AfricaMoroccoNepalNetherlandsNicaraguaNigeriaNorthern AfricaNorthern EuropeNorwayOceaniaPakistanPanamaPeruPhilippinesPolandPortugalRussiaSaudi ArabiaScotlandSingaporeSouth AfricaSouth AmericaSouth Central AsiaSouth Eastern AsiaSouthern EuropeSpainSudanSyriaTaiwanThailandTrinidad and TobagoTurkeyUkraineVenezuelaVietnamWestern AfricaWestern AsiaWestern EuropeZaireZimbabwe
Immigrant Origin (Percentage)
AfricaArgentinaAsiaAustraliaAustriaBahamasBangladeshBosnia and HerzegovinaBrazilBulgariaBurma / MyanmarCambodiaCameroonCanadaCaribbeanCentral AmericaChileChinaColombiaCubaDominican RepublicEastern AfricaEastern AsiaEastern EuropeEcuadorEgyptEl SalvadorEnglandEritreaEthiopiaEuropeFranceGermanyGhanaGreeceGuatemalaHondurasHong KongIndiaIndonesiaIranIraqIrelandItalyJamaicaJapanJordanKazakhstanKenyaKoreaKuwaitLaosLatin AmericaLebanonLiberiaMalaysiaMexicoMiddle AfricaMoroccoNepalNetherlandsNicaraguaNigeriaNorthern AfricaNorthern EuropeNorwayOceaniaPakistanPanamaPeruPhilippinesPolandPortugalRussiaSaudi ArabiaScotlandSingaporeSouth AfricaSouth AmericaSouth Central AsiaSouth Eastern AsiaSouthern EuropeSpainSudanSyriaTaiwanThailandTrinidad and TobagoTurkeyUkraineVenezuelaVietnamWestern AfricaWestern AsiaWestern EuropeZaireZimbabwe
Income
Income (Families)
Income (Households)
Poverty
Poverty (Families)
Unemployment
Employment Occupations
Employment Industries
Employer Class
Commute Time
Commute Means
School Enrollment
Education by Degree Field
Occupancy
Finances
Physical Characteristics
Oklahoma City
Compare Zip Codes
Comparison Subject

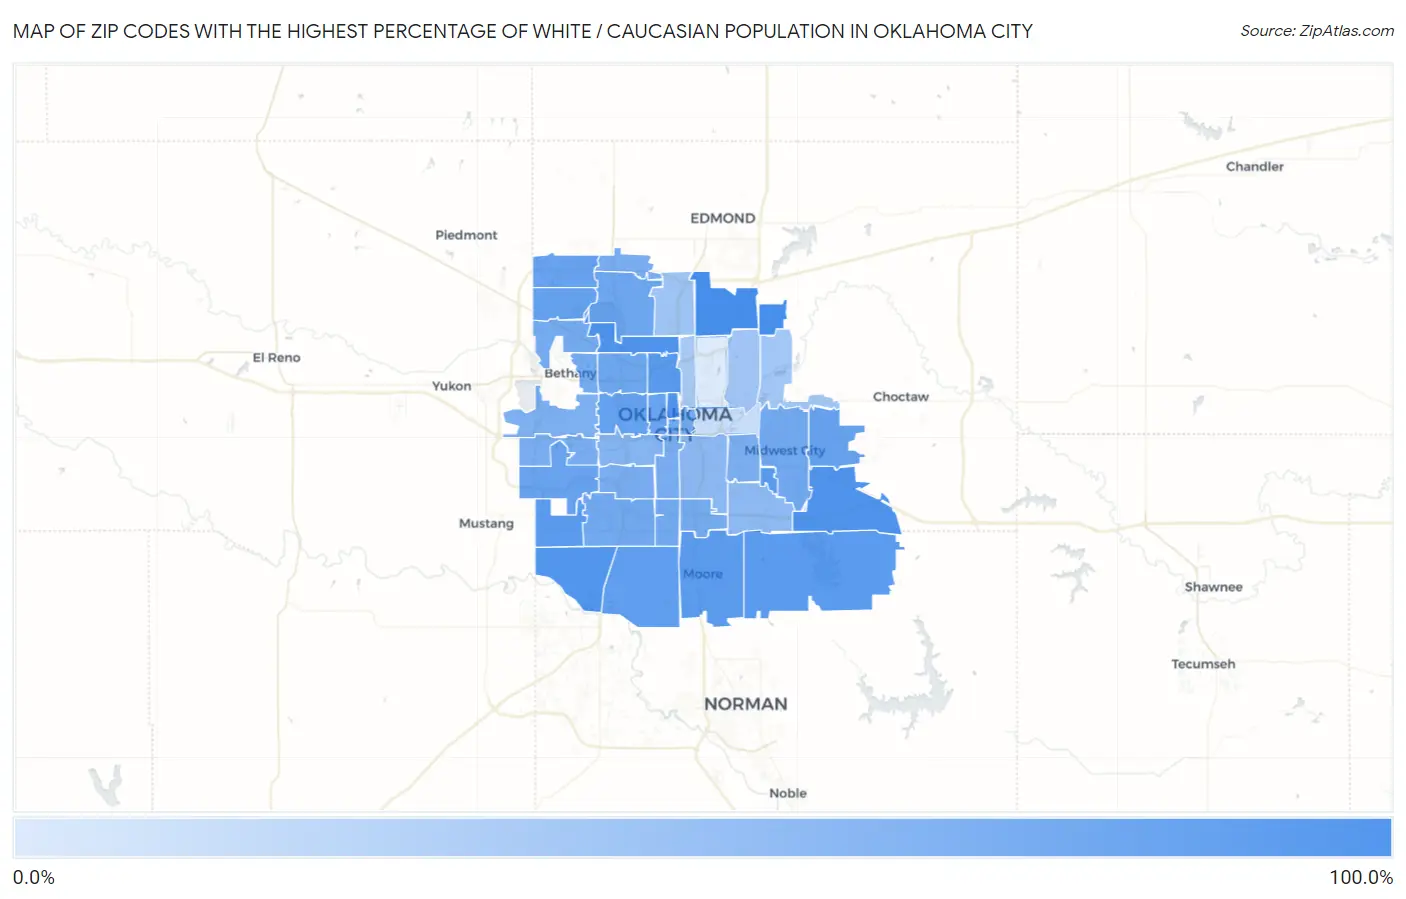
Map of Zip Codes with the Highest Percentage of White / Caucasian Population in Oklahoma City

0.0%
100.0%
Zip Codes with the Highest Percentage of White / Caucasian Population in Oklahoma City Map

Zip Codes with the Highest Percentage of White / Caucasian Population in Oklahoma City, OK

Zip Code White / Caucasian vs State vs National
1.7315183.4%68.4%(+15.0)#15365.9%(+17.6)#19,269
2.7313183.4%68.4%(+15.0)#15565.9%(+17.5)#19,300
3.7310379.6%68.4%(+11.2)#22965.9%(+13.7)#21,173
4.7315078.2%68.4%(+9.76)#25465.9%(+12.3)#21,790
5.7311677.6%68.4%(+9.18)#26665.9%(+11.7)#22,023
6.7317376.6%68.4%(+8.16)#28065.9%(+10.7)#22,431
7.7311874.5%68.4%(+6.10)#32065.9%(+8.64)#23,228
8.7314574.3%68.4%(+5.84)#32865.9%(+8.39)#23,305
9.7316073.2%68.4%(+4.79)#34165.9%(+7.33)#23,690
10.7316572.7%68.4%(+4.24)#34965.9%(+6.78)#23,889
11.7316971.6%68.4%(+3.15)#36865.9%(+5.69)#24,248
12.7317069.4%68.4%(+1.01)#41165.9%(+3.55)#24,874
13.7310766.2%68.4%(-2.21)#45965.9%(+0.336)#25,783
14.7316265.8%68.4%(-2.62)#46365.9%(-0.079)#25,890
15.7314265.6%68.4%(-2.80)#46765.9%(-0.258)#25,943
16.7313065.2%68.4%(-3.19)#47865.9%(-0.644)#26,059
17.7317965.0%68.4%(-3.38)#48165.9%(-0.842)#26,110
18.7310663.8%68.4%(-4.66)#50265.9%(-2.11)#26,443
19.7312061.7%68.4%(-6.69)#52065.9%(-4.15)#26,892
20.7311261.6%68.4%(-6.80)#52265.9%(-4.25)#26,920
21.7310259.7%68.4%(-8.74)#54765.9%(-6.20)#27,372
22.7315959.6%68.4%(-8.86)#55165.9%(-6.31)#27,392
23.7313958.6%68.4%(-9.86)#55765.9%(-7.32)#27,580
24.7311058.5%68.4%(-9.89)#55965.9%(-7.35)#27,589
25.7313258.4%68.4%(-10.1)#56065.9%(-7.53)#27,619
26.7310458.0%68.4%(-10.4)#56665.9%(-7.85)#27,684
27.7314958.0%68.4%(-10.4)#56765.9%(-7.86)#27,686
28.7312257.7%68.4%(-10.7)#57165.9%(-8.18)#27,760
29.7312856.0%68.4%(-12.4)#58365.9%(-9.90)#28,114
30.7313455.7%68.4%(-12.7)#58865.9%(-10.1)#28,162
31.7311955.3%68.4%(-13.1)#59065.9%(-10.5)#28,242
32.7310955.2%68.4%(-13.2)#59365.9%(-10.7)#28,271
33.7311554.5%68.4%(-13.9)#59465.9%(-11.4)#28,378
34.7312753.4%68.4%(-15.0)#60065.9%(-12.5)#28,605
35.7310850.3%68.4%(-18.1)#61365.9%(-15.6)#29,132
36.7312946.9%68.4%(-21.5)#62365.9%(-18.9)#29,650
37.7313545.3%68.4%(-23.1)#63165.9%(-20.6)#29,875
38.7311438.0%68.4%(-30.4)#64265.9%(-27.8)#30,750
39.7312137.2%68.4%(-31.2)#64465.9%(-28.7)#30,853
40.7314136.2%68.4%(-32.2)#64565.9%(-29.7)#30,948
41.7310534.1%68.4%(-34.4)#64765.9%(-31.8)#31,138
42.7311720.5%68.4%(-47.9)#65765.9%(-45.3)#32,100
43.7311112.7%68.4%(-55.8)#65965.9%(-53.2)#32,501

Common Questions

What are the Top 10 Zip Codes with the Highest Percentage of White / Caucasian Population in Oklahoma City, OK?
Top 10 Zip Codes with the Highest Percentage of White / Caucasian Population in Oklahoma City, OK are:
#1
83.4%
#2
83.4%
#3
79.6%
#4
78.2%
#5
77.6%
#6
76.6%
#7
74.5%
#8
74.3%
#9
73.2%
#10
72.7%
What zip code has the Highest Percentage of White / Caucasian Population in Oklahoma City, OK?
73151 has the Highest Percentage of White / Caucasian Population in Oklahoma City, OK with 83.4%.
What is the Percentage of White / Caucasian Population in Oklahoma City, OK?
Percentage of White / Caucasian Population in Oklahoma City is 61.4%.
What is the Percentage of White / Caucasian Population in Oklahoma?
Percentage of White / Caucasian Population in Oklahoma is 68.4%.
What is the Percentage of White / Caucasian Population in the United States?
Percentage of White / Caucasian Population in the United States is 65.9%.