Zip Codes with the Highest Percentage of Population Employed in Professional & Scientific Services in Oklahoma City, OK

RELATED REPORTS & OPTIONS

Professional & Scientific Services
Population
Families and Households
Female Fertility
Female Fertility (Unmarried)
Race (Community Size)
Race (Percentage)
Ancestry (Community Size)
AfricanAlaska NativeAlbanianAmericanApacheArabArapahoArgentineanArmenianAustralianAustrianBahamianBangladeshiBarbadianBasqueBelgianBhutaneseBlackfeetBolivianBrazilianBritishBritish West IndianBulgarianBurmeseCajunCambodianCanadianCelticCentral AmericanCentral American IndianCherokeeCheyenneChickasawChileanChippewaChoctawColombianComancheCreeCreekCroatianCubanCzechCzechoslovakianDanishDelawareDominicanDutchDutch West IndianEastern EuropeanEcuadorianEgyptianEnglishEstonianEthiopianEuropeanFijianFilipinoFinnishFrenchFrench American IndianFrench CanadianGermanGerman RussianGhanaianGreekGuamanian / ChamorroGuatemalanGuyaneseHaitianHonduranHopiHungarianIcelanderIndian (Asian)IndonesianInupiatIranianIraqiIrishIroquoisIsraeliItalianJamaicanJapaneseJordanianKenyanKiowaKoreanLaotianLatvianLebaneseLiberianLithuanianLuxembourgerMalaysianMexicanMexican American IndianMongolianMoroccanNative HawaiianNavajoNew ZealanderNicaraguanNigerianNorthern EuropeanNorwegianOkinawanOsagePakistaniPalestinianPanamanianPennsylvania GermanPeruvianPimaPolishPortuguesePotawatomiPuebloPuerto RicanRomanianRussianSalvadoranSamoanScandinavianScotch-IrishScottishSeminoleSerbianSiouxSlavicSlovakSloveneSouth AfricanSouth AmericanSouth American IndianSpaniardSpanishSpanish American IndianSri LankanSubsaharan AfricanSudaneseSwedishSwissSyrianThaiTlingit-HaidaTonganTrinidadian and TobagonianTurkishU.S. Virgin IslanderUkrainianUruguayanVenezuelanVietnameseWelshWest IndianYugoslavianZimbabwean
Ancestry (Percentage)
AfricanAlaska NativeAlbanianAmericanApacheArabArapahoArgentineanArmenianAustralianAustrianBahamianBangladeshiBarbadianBasqueBelgianBhutaneseBlackfeetBolivianBrazilianBritishBritish West IndianBulgarianBurmeseCajunCambodianCanadianCelticCentral AmericanCentral American IndianCherokeeCheyenneChickasawChileanChippewaChoctawColombianComancheCreeCreekCroatianCubanCzechCzechoslovakianDanishDelawareDominicanDutchDutch West IndianEastern EuropeanEcuadorianEgyptianEnglishEstonianEthiopianEuropeanFijianFilipinoFinnishFrenchFrench American IndianFrench CanadianGermanGerman RussianGhanaianGreekGuamanian / ChamorroGuatemalanGuyaneseHaitianHonduranHopiHungarianIcelanderIndian (Asian)IndonesianInupiatIranianIraqiIrishIroquoisIsraeliItalianJamaicanJapaneseJordanianKenyanKiowaKoreanLaotianLatvianLebaneseLiberianLithuanianLuxembourgerMalaysianMexicanMexican American IndianMongolianMoroccanNative HawaiianNavajoNew ZealanderNicaraguanNigerianNorthern EuropeanNorwegianOkinawanOsagePakistaniPalestinianPanamanianPennsylvania GermanPeruvianPimaPolishPortuguesePotawatomiPuebloPuerto RicanRomanianRussianSalvadoranSamoanScandinavianScotch-IrishScottishSeminoleSerbianSiouxSlavicSlovakSloveneSouth AfricanSouth AmericanSouth American IndianSpaniardSpanishSpanish American IndianSri LankanSubsaharan AfricanSudaneseSwedishSwissSyrianThaiTlingit-HaidaTonganTrinidadian and TobagonianTurkishU.S. Virgin IslanderUkrainianUruguayanVenezuelanVietnameseWelshWest IndianYugoslavianZimbabwean
Immigrant Origin (Total)
AfricaArgentinaAsiaAustraliaAustriaBahamasBangladeshBosnia and HerzegovinaBrazilBulgariaBurma / MyanmarCambodiaCameroonCanadaCaribbeanCentral AmericaChileChinaColombiaCubaDominican RepublicEastern AfricaEastern AsiaEastern EuropeEcuadorEgyptEl SalvadorEnglandEritreaEthiopiaEuropeFranceGermanyGhanaGreeceGuatemalaHondurasHong KongIndiaIndonesiaIranIraqIrelandItalyJamaicaJapanJordanKazakhstanKenyaKoreaKuwaitLaosLatin AmericaLebanonLiberiaMalaysiaMexicoMiddle AfricaMoroccoNepalNetherlandsNicaraguaNigeriaNorthern AfricaNorthern EuropeNorwayOceaniaPakistanPanamaPeruPhilippinesPolandPortugalRussiaSaudi ArabiaScotlandSingaporeSouth AfricaSouth AmericaSouth Central AsiaSouth Eastern AsiaSouthern EuropeSpainSudanSyriaTaiwanThailandTrinidad and TobagoTurkeyUkraineVenezuelaVietnamWestern AfricaWestern AsiaWestern EuropeZaireZimbabwe
Immigrant Origin (Percentage)
AfricaArgentinaAsiaAustraliaAustriaBahamasBangladeshBosnia and HerzegovinaBrazilBulgariaBurma / MyanmarCambodiaCameroonCanadaCaribbeanCentral AmericaChileChinaColombiaCubaDominican RepublicEastern AfricaEastern AsiaEastern EuropeEcuadorEgyptEl SalvadorEnglandEritreaEthiopiaEuropeFranceGermanyGhanaGreeceGuatemalaHondurasHong KongIndiaIndonesiaIranIraqIrelandItalyJamaicaJapanJordanKazakhstanKenyaKoreaKuwaitLaosLatin AmericaLebanonLiberiaMalaysiaMexicoMiddle AfricaMoroccoNepalNetherlandsNicaraguaNigeriaNorthern AfricaNorthern EuropeNorwayOceaniaPakistanPanamaPeruPhilippinesPolandPortugalRussiaSaudi ArabiaScotlandSingaporeSouth AfricaSouth AmericaSouth Central AsiaSouth Eastern AsiaSouthern EuropeSpainSudanSyriaTaiwanThailandTrinidad and TobagoTurkeyUkraineVenezuelaVietnamWestern AfricaWestern AsiaWestern EuropeZaireZimbabwe
Income
Income (Families)
Income (Households)
Poverty
Poverty (Families)
Unemployment
Employment Occupations
Employment Industries
Employer Class
Commute Time
Commute Means
School Enrollment
Education by Degree Field
Occupancy
Finances
Physical Characteristics
Oklahoma City
Compare Zip Codes
Comparison Subject

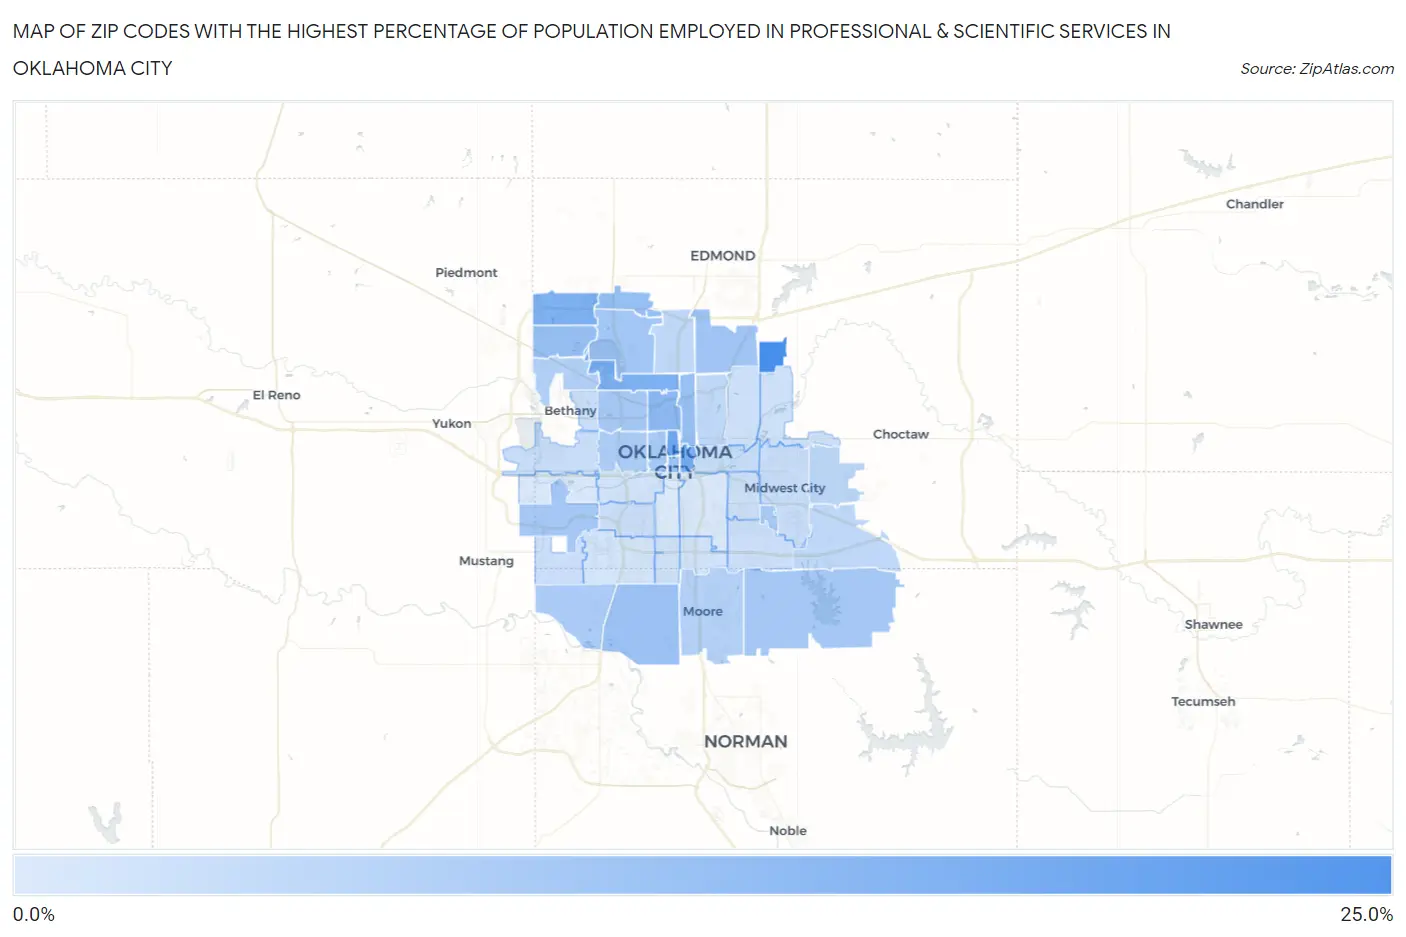
Map of Zip Codes with the Highest Percentage of Population Employed in Professional & Scientific Services in Oklahoma City

0.0%
25.0%
Zip Codes with the Highest Percentage of Population Employed in Professional & Scientific Services in Oklahoma City Map

Zip Codes with the Highest Percentage of Population Employed in Professional & Scientific Services in Oklahoma City, OK

Zip Code % Employed vs State vs National
1.7315120.8%5.3%(+15.5)#67.8%(+12.9)#804
2.7310315.8%5.3%(+10.5)#107.8%(+7.95)#1,661
3.7310414.2%5.3%(+8.94)#147.8%(+6.37)#2,192
4.7311613.4%5.3%(+8.15)#177.8%(+5.58)#2,527
5.7314213.0%5.3%(+7.75)#187.8%(+5.19)#2,701
6.7311811.4%5.3%(+6.08)#267.8%(+3.52)#3,594
7.7313410.2%5.3%(+4.88)#317.8%(+2.32)#4,456
8.7316210.0%5.3%(+4.68)#337.8%(+2.12)#4,602
9.731059.9%5.3%(+4.62)#367.8%(+2.06)#4,658
10.731029.2%5.3%(+3.97)#397.8%(+1.40)#5,240
11.731709.1%5.3%(+3.84)#417.8%(+1.27)#5,382
12.731318.5%5.3%(+3.22)#457.8%(+0.654)#6,024
13.731208.4%5.3%(+3.13)#467.8%(+0.563)#6,125
14.731458.2%5.3%(+2.89)#507.8%(+0.326)#6,440
15.731128.2%5.3%(+2.88)#517.8%(+0.315)#6,455
16.731658.0%5.3%(+2.74)#567.8%(+0.177)#6,626
17.731798.0%5.3%(+2.69)#577.8%(+0.127)#6,699
18.731067.9%5.3%(+2.60)#597.8%(+0.039)#6,825
19.731737.6%5.3%(+2.28)#637.8%(-0.282)#7,259
20.731077.2%5.3%(+1.89)#687.8%(-0.678)#7,863
21.731606.4%5.3%(+1.15)#877.8%(-1.41)#9,150
22.731326.3%5.3%(+1.01)#897.8%(-1.56)#9,420
23.731305.2%5.3%(-0.101)#1227.8%(-2.67)#11,864
24.731145.0%5.3%(-0.285)#1387.8%(-2.85)#12,336
25.731114.9%5.3%(-0.418)#1457.8%(-2.98)#12,673
26.731504.7%5.3%(-0.540)#1597.8%(-3.11)#13,002
27.731174.0%5.3%(-1.25)#2127.8%(-3.82)#15,028
28.731103.7%5.3%(-1.57)#2357.8%(-4.13)#16,004
29.731273.7%5.3%(-1.60)#2407.8%(-4.17)#16,116
30.731693.6%5.3%(-1.71)#2527.8%(-4.27)#16,461
31.731223.5%5.3%(-1.75)#2587.8%(-4.31)#16,612
32.731193.5%5.3%(-1.82)#2667.8%(-4.38)#16,853
33.731353.4%5.3%(-1.84)#2697.8%(-4.40)#16,924
34.731153.3%5.3%(-2.03)#2807.8%(-4.59)#17,554
35.731213.2%5.3%(-2.04)#2827.8%(-4.61)#17,598
36.731393.0%5.3%(-2.28)#3077.8%(-4.85)#18,451
37.731412.9%5.3%(-2.36)#3187.8%(-4.93)#18,709
38.731082.7%5.3%(-2.59)#3377.8%(-5.16)#19,545
39.731492.5%5.3%(-2.78)#3477.8%(-5.35)#20,183
40.731592.5%5.3%(-2.81)#3527.8%(-5.38)#20,294
41.731281.9%5.3%(-3.36)#3997.8%(-5.93)#22,151
42.731291.7%5.3%(-3.60)#4277.8%(-6.16)#22,948
43.731091.2%5.3%(-4.05)#4757.8%(-6.61)#24,381

Common Questions

What are the Top 10 Zip Codes with the Highest Percentage of Population Employed in Professional & Scientific Services in Oklahoma City, OK?
Top 10 Zip Codes with the Highest Percentage of Population Employed in Professional & Scientific Services in Oklahoma City, OK are:
#1
20.8%
#2
15.8%
#3
14.2%
#4
13.4%
#5
13.0%
#6
11.4%
#7
10.2%
#8
10.0%
#9
9.9%
#10
9.2%
What zip code has the Highest Percentage of Population Employed in Professional & Scientific Services in Oklahoma City, OK?
73151 has the Highest Percentage of Population Employed in Professional & Scientific Services in Oklahoma City, OK with 20.8%.
What is the Percentage of Population Employed in Professional & Scientific Services in Oklahoma City, OK?
Percentage of Population Employed in Professional & Scientific Services in Oklahoma City is 7.3%.
What is the Percentage of Population Employed in Professional & Scientific Services in Oklahoma?
Percentage of Population Employed in Professional & Scientific Services in Oklahoma is 5.3%.
What is the Percentage of Population Employed in Professional & Scientific Services in the United States?
Percentage of Population Employed in Professional & Scientific Services in the United States is 7.8%.