Zip Codes with the Highest Percentage of Population Employed in Construction & Extraction in Oklahoma City, OK

RELATED REPORTS & OPTIONS

Construction & Extraction
Population
Families and Households
Female Fertility
Female Fertility (Unmarried)
Race (Community Size)
Race (Percentage)
Ancestry (Community Size)
AfricanAlaska NativeAlbanianAmericanApacheArabArapahoArgentineanArmenianAustralianAustrianBahamianBangladeshiBarbadianBasqueBelgianBhutaneseBlackfeetBolivianBrazilianBritishBritish West IndianBulgarianBurmeseCajunCambodianCanadianCelticCentral AmericanCentral American IndianCherokeeCheyenneChickasawChileanChippewaChoctawColombianComancheCreeCreekCroatianCubanCzechCzechoslovakianDanishDelawareDominicanDutchDutch West IndianEastern EuropeanEcuadorianEgyptianEnglishEstonianEthiopianEuropeanFijianFilipinoFinnishFrenchFrench American IndianFrench CanadianGermanGerman RussianGhanaianGreekGuamanian / ChamorroGuatemalanGuyaneseHaitianHonduranHopiHungarianIcelanderIndian (Asian)IndonesianInupiatIranianIraqiIrishIroquoisIsraeliItalianJamaicanJapaneseJordanianKenyanKiowaKoreanLaotianLatvianLebaneseLiberianLithuanianLuxembourgerMalaysianMexicanMexican American IndianMongolianMoroccanNative HawaiianNavajoNew ZealanderNicaraguanNigerianNorthern EuropeanNorwegianOkinawanOsagePakistaniPalestinianPanamanianPennsylvania GermanPeruvianPimaPolishPortuguesePotawatomiPuebloPuerto RicanRomanianRussianSalvadoranSamoanScandinavianScotch-IrishScottishSeminoleSerbianSiouxSlavicSlovakSloveneSouth AfricanSouth AmericanSouth American IndianSpaniardSpanishSpanish American IndianSri LankanSubsaharan AfricanSudaneseSwedishSwissSyrianThaiTlingit-HaidaTonganTrinidadian and TobagonianTurkishU.S. Virgin IslanderUkrainianUruguayanVenezuelanVietnameseWelshWest IndianYugoslavianZimbabwean
Ancestry (Percentage)
AfricanAlaska NativeAlbanianAmericanApacheArabArapahoArgentineanArmenianAustralianAustrianBahamianBangladeshiBarbadianBasqueBelgianBhutaneseBlackfeetBolivianBrazilianBritishBritish West IndianBulgarianBurmeseCajunCambodianCanadianCelticCentral AmericanCentral American IndianCherokeeCheyenneChickasawChileanChippewaChoctawColombianComancheCreeCreekCroatianCubanCzechCzechoslovakianDanishDelawareDominicanDutchDutch West IndianEastern EuropeanEcuadorianEgyptianEnglishEstonianEthiopianEuropeanFijianFilipinoFinnishFrenchFrench American IndianFrench CanadianGermanGerman RussianGhanaianGreekGuamanian / ChamorroGuatemalanGuyaneseHaitianHonduranHopiHungarianIcelanderIndian (Asian)IndonesianInupiatIranianIraqiIrishIroquoisIsraeliItalianJamaicanJapaneseJordanianKenyanKiowaKoreanLaotianLatvianLebaneseLiberianLithuanianLuxembourgerMalaysianMexicanMexican American IndianMongolianMoroccanNative HawaiianNavajoNew ZealanderNicaraguanNigerianNorthern EuropeanNorwegianOkinawanOsagePakistaniPalestinianPanamanianPennsylvania GermanPeruvianPimaPolishPortuguesePotawatomiPuebloPuerto RicanRomanianRussianSalvadoranSamoanScandinavianScotch-IrishScottishSeminoleSerbianSiouxSlavicSlovakSloveneSouth AfricanSouth AmericanSouth American IndianSpaniardSpanishSpanish American IndianSri LankanSubsaharan AfricanSudaneseSwedishSwissSyrianThaiTlingit-HaidaTonganTrinidadian and TobagonianTurkishU.S. Virgin IslanderUkrainianUruguayanVenezuelanVietnameseWelshWest IndianYugoslavianZimbabwean
Immigrant Origin (Total)
AfricaArgentinaAsiaAustraliaAustriaBahamasBangladeshBosnia and HerzegovinaBrazilBulgariaBurma / MyanmarCambodiaCameroonCanadaCaribbeanCentral AmericaChileChinaColombiaCubaDominican RepublicEastern AfricaEastern AsiaEastern EuropeEcuadorEgyptEl SalvadorEnglandEritreaEthiopiaEuropeFranceGermanyGhanaGreeceGuatemalaHondurasHong KongIndiaIndonesiaIranIraqIrelandItalyJamaicaJapanJordanKazakhstanKenyaKoreaKuwaitLaosLatin AmericaLebanonLiberiaMalaysiaMexicoMiddle AfricaMoroccoNepalNetherlandsNicaraguaNigeriaNorthern AfricaNorthern EuropeNorwayOceaniaPakistanPanamaPeruPhilippinesPolandPortugalRussiaSaudi ArabiaScotlandSingaporeSouth AfricaSouth AmericaSouth Central AsiaSouth Eastern AsiaSouthern EuropeSpainSudanSyriaTaiwanThailandTrinidad and TobagoTurkeyUkraineVenezuelaVietnamWestern AfricaWestern AsiaWestern EuropeZaireZimbabwe
Immigrant Origin (Percentage)
AfricaArgentinaAsiaAustraliaAustriaBahamasBangladeshBosnia and HerzegovinaBrazilBulgariaBurma / MyanmarCambodiaCameroonCanadaCaribbeanCentral AmericaChileChinaColombiaCubaDominican RepublicEastern AfricaEastern AsiaEastern EuropeEcuadorEgyptEl SalvadorEnglandEritreaEthiopiaEuropeFranceGermanyGhanaGreeceGuatemalaHondurasHong KongIndiaIndonesiaIranIraqIrelandItalyJamaicaJapanJordanKazakhstanKenyaKoreaKuwaitLaosLatin AmericaLebanonLiberiaMalaysiaMexicoMiddle AfricaMoroccoNepalNetherlandsNicaraguaNigeriaNorthern AfricaNorthern EuropeNorwayOceaniaPakistanPanamaPeruPhilippinesPolandPortugalRussiaSaudi ArabiaScotlandSingaporeSouth AfricaSouth AmericaSouth Central AsiaSouth Eastern AsiaSouthern EuropeSpainSudanSyriaTaiwanThailandTrinidad and TobagoTurkeyUkraineVenezuelaVietnamWestern AfricaWestern AsiaWestern EuropeZaireZimbabwe
Income
Income (Families)
Income (Households)
Poverty
Poverty (Families)
Unemployment
Employment Occupations
Employment Industries
Employer Class
Commute Time
Commute Means
School Enrollment
Education by Degree Field
Occupancy
Finances
Physical Characteristics
Oklahoma City
Compare Zip Codes
Comparison Subject

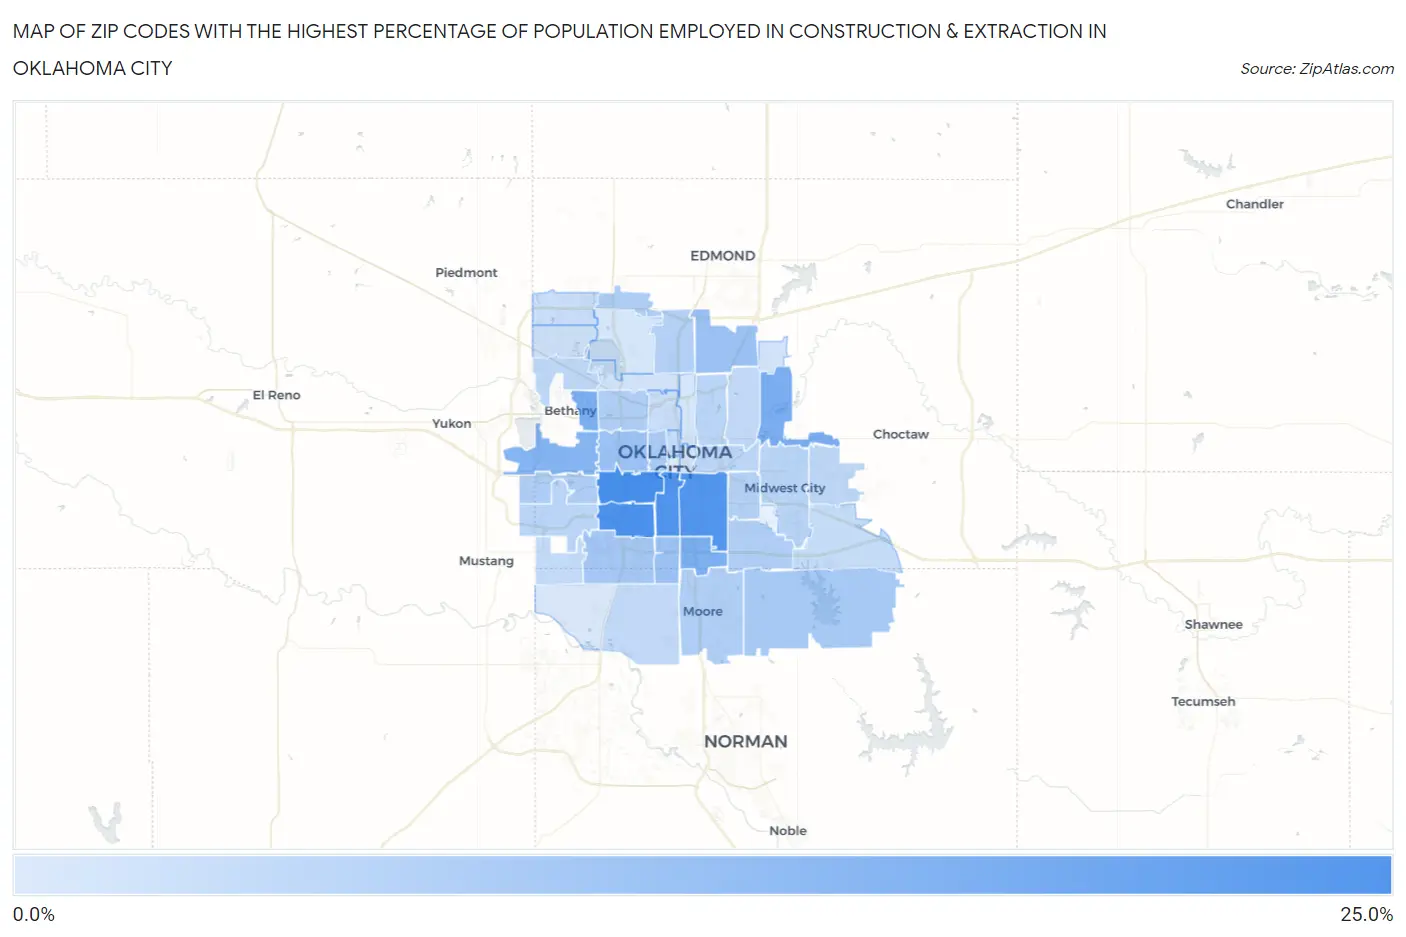
Map of Zip Codes with the Highest Percentage of Population Employed in Construction & Extraction in Oklahoma City

0.0%
25.0%
Zip Codes with the Highest Percentage of Population Employed in Construction & Extraction in Oklahoma City Map

Zip Codes with the Highest Percentage of Population Employed in Construction & Extraction in Oklahoma City, OK

Zip Code % Employed vs State vs National
1.7310820.4%6.1%(+14.3)#245.0%(+15.4)#950
2.7311919.5%6.1%(+13.4)#285.0%(+14.5)#1,061
3.7310919.0%6.1%(+12.9)#305.0%(+14.0)#1,130
4.7312918.6%6.1%(+12.5)#345.0%(+13.6)#1,201
5.7314113.3%6.1%(+7.21)#885.0%(+8.30)#2,801
6.7312213.0%6.1%(+6.89)#905.0%(+7.98)#2,952
7.7314912.8%6.1%(+6.68)#915.0%(+7.76)#3,077
8.7312711.6%6.1%(+5.54)#1245.0%(+6.62)#3,875
9.731078.8%6.1%(+2.70)#2175.0%(+3.78)#7,125
10.731398.6%6.1%(+2.47)#2235.0%(+3.56)#7,501
11.731318.4%6.1%(+2.31)#2295.0%(+3.40)#7,767
12.731597.2%6.1%(+1.09)#3025.0%(+2.18)#10,299
13.731657.0%6.1%(+0.883)#3155.0%(+1.97)#10,821
14.731066.6%6.1%(+0.503)#3385.0%(+1.59)#11,808
15.731346.3%6.1%(+0.178)#3705.0%(+1.26)#12,705
16.731286.0%6.1%(-0.105)#3895.0%(+0.982)#13,575
17.731125.8%6.1%(-0.259)#4015.0%(+0.828)#14,016
18.731355.7%6.1%(-0.331)#4035.0%(+0.756)#14,224
19.731605.7%6.1%(-0.394)#4095.0%(+0.692)#14,431
20.731145.4%6.1%(-0.633)#4235.0%(+0.453)#15,227
21.731155.3%6.1%(-0.760)#4315.0%(+0.327)#15,659
22.731104.7%6.1%(-1.42)#4785.0%(-0.334)#17,920
23.731794.6%6.1%(-1.50)#4825.0%(-0.415)#18,226
24.731114.5%6.1%(-1.55)#4845.0%(-0.467)#18,403
25.731174.5%6.1%(-1.61)#4875.0%(-0.519)#18,603
26.731324.1%6.1%(-2.00)#5055.0%(-0.910)#20,008
27.731304.1%6.1%(-2.03)#5105.0%(-0.941)#20,144
28.731213.8%6.1%(-2.24)#5215.0%(-1.16)#20,898
29.731703.6%6.1%(-2.45)#5275.0%(-1.36)#21,573
30.731693.4%6.1%(-2.69)#5395.0%(-1.61)#22,364
31.731503.2%6.1%(-2.83)#5445.0%(-1.75)#22,817
32.731033.1%6.1%(-3.00)#5545.0%(-1.91)#23,330
33.731183.0%6.1%(-3.12)#5605.0%(-2.03)#23,694
34.731422.8%6.1%(-3.29)#5655.0%(-2.20)#24,216
35.731622.2%6.1%(-3.85)#5815.0%(-2.76)#25,750
36.731161.7%6.1%(-4.37)#5945.0%(-3.28)#26,970
37.731511.6%6.1%(-4.45)#5955.0%(-3.36)#27,138
38.731041.6%6.1%(-4.51)#5995.0%(-3.42)#27,279
39.731051.2%6.1%(-4.91)#6065.0%(-3.82)#28,032
40.731201.1%6.1%(-4.95)#6075.0%(-3.86)#28,084
41.731730.80%6.1%(-5.28)#6105.0%(-4.19)#28,597
42.731020.33%6.1%(-5.75)#6165.0%(-4.66)#29,050

Common Questions

What are the Top 10 Zip Codes with the Highest Percentage of Population Employed in Construction & Extraction in Oklahoma City, OK?
Top 10 Zip Codes with the Highest Percentage of Population Employed in Construction & Extraction in Oklahoma City, OK are:
#1
20.4%
#2
19.5%
#3
19.0%
#4
18.6%
#5
13.3%
#6
13.0%
#7
12.8%
#8
11.6%
#9
8.8%
#10
8.6%
What zip code has the Highest Percentage of Population Employed in Construction & Extraction in Oklahoma City, OK?
73108 has the Highest Percentage of Population Employed in Construction & Extraction in Oklahoma City, OK with 20.4%.
What is the Percentage of Population Employed in Construction & Extraction in Oklahoma City, OK?
Percentage of Population Employed in Construction & Extraction in Oklahoma City is 6.0%.
What is the Percentage of Population Employed in Construction & Extraction in Oklahoma?
Percentage of Population Employed in Construction & Extraction in Oklahoma is 6.1%.
What is the Percentage of Population Employed in Construction & Extraction in the United States?
Percentage of Population Employed in Construction & Extraction in the United States is 5.0%.