Zip Codes with the Highest Percentage of Population Employed in Health Care & Social Assistance in Youngstown, OH
RELATED REPORTS & OPTIONS
Health Care & Social Assistance
Youngstown
Compare Zip Codes
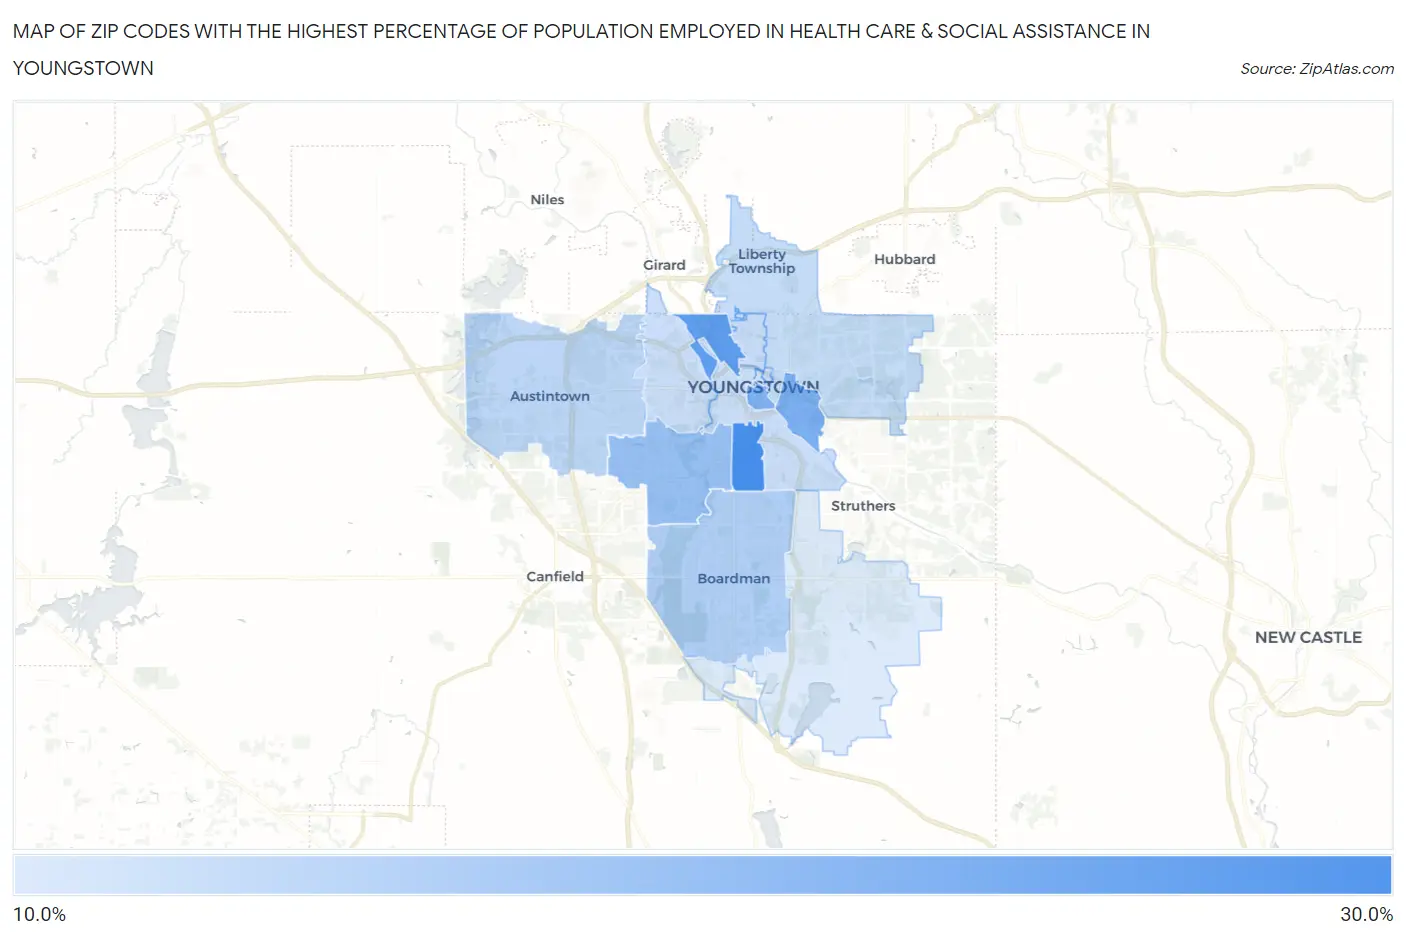
Map of Zip Codes with the Highest Percentage of Population Employed in Health Care & Social Assistance in Youngstown
0.0%
30.0%
Zip Codes with the Highest Percentage of Population Employed in Health Care & Social Assistance in Youngstown, OH
| Zip Code | % Employed | vs State | vs National | |
| 1. | 44507 | 27.6% | 15.7%(+11.9)#50 | 13.9%(+13.7)#1,241 |
| 2. | 44510 | 25.7% | 15.7%(+9.99)#65 | 13.9%(+11.7)#1,584 |
| 3. | 44506 | 23.4% | 15.7%(+7.73)#91 | 13.9%(+9.47)#2,175 |
| 4. | 44503 | 23.4% | 15.7%(+7.69)#92 | 13.9%(+9.42)#2,195 |
| 5. | 44511 | 21.3% | 15.7%(+5.65)#147 | 13.9%(+7.38)#3,158 |
| 6. | 44512 | 19.5% | 15.7%(+3.81)#207 | 13.9%(+5.54)#4,523 |
| 7. | 44515 | 18.7% | 15.7%(+3.03)#253 | 13.9%(+4.76)#5,314 |
| 8. | 44505 | 17.9% | 15.7%(+2.20)#303 | 13.9%(+3.94)#6,353 |
| 9. | 44504 | 17.7% | 15.7%(+2.07)#316 | 13.9%(+3.81)#6,557 |
| 10. | 44509 | 17.7% | 15.7%(+2.01)#323 | 13.9%(+3.75)#6,651 |
| 11. | 44502 | 17.5% | 15.7%(+1.87)#336 | 13.9%(+3.61)#6,865 |
| 12. | 44555 | 17.5% | 15.7%(+1.85)#339 | 13.9%(+3.59)#6,896 |
| 13. | 44514 | 16.3% | 15.7%(+0.606)#457 | 13.9%(+2.34)#8,981 |
1
Common Questions
What are the Top 10 Zip Codes with the Highest Percentage of Population Employed in Health Care & Social Assistance in Youngstown, OH?
Top 10 Zip Codes with the Highest Percentage of Population Employed in Health Care & Social Assistance in Youngstown, OH are:
What zip code has the Highest Percentage of Population Employed in Health Care & Social Assistance in Youngstown, OH?
44507 has the Highest Percentage of Population Employed in Health Care & Social Assistance in Youngstown, OH with 27.6%.
What is the Percentage of Population Employed in Health Care & Social Assistance in Youngstown, OH?
Percentage of Population Employed in Health Care & Social Assistance in Youngstown is 20.3%.
What is the Percentage of Population Employed in Health Care & Social Assistance in Ohio?
Percentage of Population Employed in Health Care & Social Assistance in Ohio is 15.7%.
What is the Percentage of Population Employed in Health Care & Social Assistance in the United States?
Percentage of Population Employed in Health Care & Social Assistance in the United States is 13.9%.