Zip Codes with the Highest Percentage of Population Employed in Professional & Scientific Services in Cincinnati, OH
RELATED REPORTS & OPTIONS
Professional & Scientific Services
Cincinnati
Compare Zip Codes
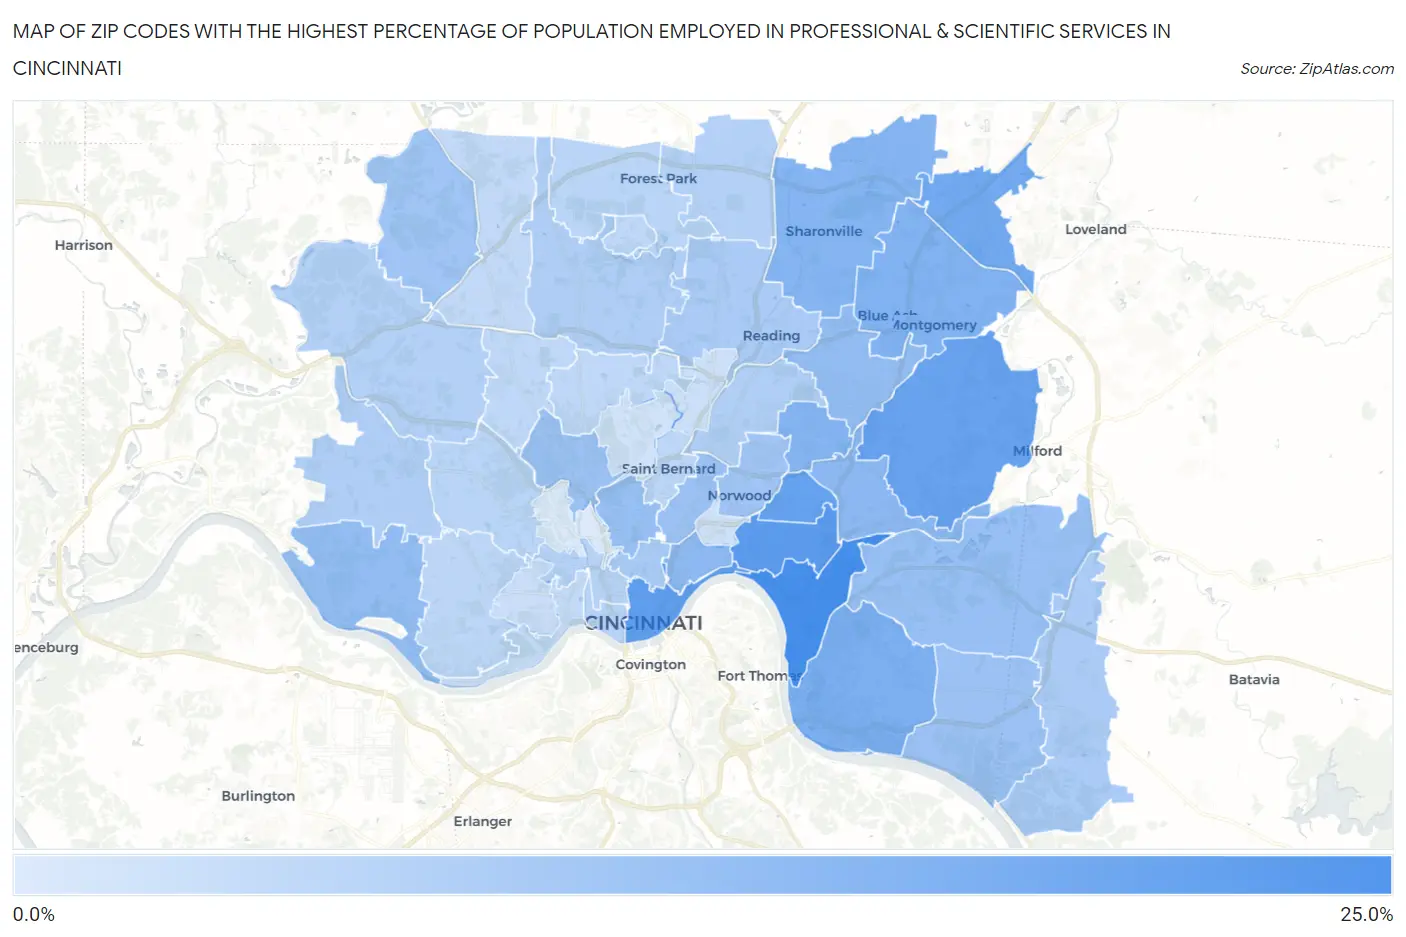
Map of Zip Codes with the Highest Percentage of Population Employed in Professional & Scientific Services in Cincinnati
1.4%
21.2%
Zip Codes with the Highest Percentage of Population Employed in Professional & Scientific Services in Cincinnati, OH
| Zip Code | % Employed | vs State | vs National | |
| 1. | 45226 | 21.2% | 6.1%(+15.1)#9 | 7.8%(+13.3)#753 |
| 2. | 45208 | 18.3% | 6.1%(+12.3)#11 | 7.8%(+10.5)#1,099 |
| 3. | 45202 | 17.4% | 6.1%(+11.4)#13 | 7.8%(+9.59)#1,267 |
| 4. | 45209 | 16.9% | 6.1%(+10.9)#15 | 7.8%(+9.06)#1,383 |
| 5. | 45243 | 16.6% | 6.1%(+10.5)#19 | 7.8%(+8.74)#1,461 |
| 6. | 45249 | 14.9% | 6.1%(+8.85)#26 | 7.8%(+7.06)#1,941 |
| 7. | 45230 | 13.8% | 6.1%(+7.78)#30 | 7.8%(+5.99)#2,338 |
| 8. | 45242 | 13.0% | 6.1%(+6.96)#39 | 7.8%(+5.17)#2,704 |
| 9. | 45241 | 12.7% | 6.1%(+6.62)#44 | 7.8%(+4.83)#2,844 |
| 10. | 45213 | 12.5% | 6.1%(+6.44)#48 | 7.8%(+4.65)#2,947 |
| 11. | 45227 | 11.5% | 6.1%(+5.41)#67 | 7.8%(+3.62)#3,524 |
| 12. | 45206 | 11.2% | 6.1%(+5.17)#72 | 7.8%(+3.38)#3,688 |
| 13. | 45233 | 10.8% | 6.1%(+4.76)#83 | 7.8%(+2.96)#3,974 |
| 14. | 45236 | 10.6% | 6.1%(+4.54)#89 | 7.8%(+2.75)#4,112 |
| 15. | 45220 | 10.2% | 6.1%(+4.16)#104 | 7.8%(+2.37)#4,416 |
| 16. | 45244 | 10.1% | 6.1%(+4.06)#108 | 7.8%(+2.27)#4,495 |
| 17. | 45223 | 9.7% | 6.1%(+3.69)#114 | 7.8%(+1.90)#4,790 |
| 18. | 45255 | 9.7% | 6.1%(+3.61)#120 | 7.8%(+1.82)#4,872 |
| 19. | 45229 | 9.6% | 6.1%(+3.57)#122 | 7.8%(+1.78)#4,904 |
| 20. | 45252 | 8.8% | 6.1%(+2.73)#143 | 7.8%(+0.940)#5,715 |
| 21. | 45212 | 8.8% | 6.1%(+2.72)#144 | 7.8%(+0.929)#5,731 |
| 22. | 45219 | 8.0% | 6.1%(+1.90)#178 | 7.8%(+0.113)#6,712 |
| 23. | 45245 | 7.8% | 6.1%(+1.77)#182 | 7.8%(-0.018)#6,888 |
| 24. | 45215 | 7.8% | 6.1%(+1.71)#185 | 7.8%(-0.082)#6,977 |
| 25. | 45248 | 7.2% | 6.1%(+1.10)#209 | 7.8%(-0.691)#7,884 |
| 26. | 45231 | 7.0% | 6.1%(+0.919)#222 | 7.8%(-0.872)#8,222 |
| 27. | 45237 | 6.7% | 6.1%(+0.688)#235 | 7.8%(-1.10)#8,584 |
| 28. | 45246 | 6.6% | 6.1%(+0.586)#244 | 7.8%(-1.20)#8,766 |
| 29. | 45247 | 6.5% | 6.1%(+0.435)#249 | 7.8%(-1.36)#9,059 |
| 30. | 45214 | 6.4% | 6.1%(+0.300)#258 | 7.8%(-1.49)#9,286 |
| 31. | 45203 | 5.9% | 6.1%(-0.137)#289 | 7.8%(-1.93)#10,129 |
| 32. | 45240 | 5.7% | 6.1%(-0.340)#302 | 7.8%(-2.13)#10,536 |
| 33. | 45211 | 5.6% | 6.1%(-0.426)#312 | 7.8%(-2.22)#10,758 |
| 34. | 45217 | 5.4% | 6.1%(-0.641)#328 | 7.8%(-2.43)#11,278 |
| 35. | 45238 | 5.2% | 6.1%(-0.816)#346 | 7.8%(-2.61)#11,705 |
| 36. | 45239 | 5.2% | 6.1%(-0.899)#357 | 7.8%(-2.69)#11,922 |
| 37. | 45224 | 5.1% | 6.1%(-0.972)#369 | 7.8%(-2.76)#12,108 |
| 38. | 45218 | 5.0% | 6.1%(-1.05)#380 | 7.8%(-2.84)#12,300 |
| 39. | 45251 | 4.7% | 6.1%(-1.37)#415 | 7.8%(-3.16)#13,148 |
| 40. | 45204 | 4.6% | 6.1%(-1.46)#428 | 7.8%(-3.25)#13,370 |
| 41. | 45205 | 3.8% | 6.1%(-2.30)#528 | 7.8%(-4.09)#15,864 |
| 42. | 45216 | 3.4% | 6.1%(-2.61)#571 | 7.8%(-4.40)#16,919 |
| 43. | 45207 | 2.9% | 6.1%(-3.13)#641 | 7.8%(-4.92)#18,686 |
| 44. | 45232 | 2.7% | 6.1%(-3.32)#682 | 7.8%(-5.11)#19,392 |
| 45. | 45225 | 1.4% | 6.1%(-4.68)#902 | 7.8%(-6.47)#23,910 |
1
Common Questions
What are the Top 10 Zip Codes with the Highest Percentage of Population Employed in Professional & Scientific Services in Cincinnati, OH?
Top 10 Zip Codes with the Highest Percentage of Population Employed in Professional & Scientific Services in Cincinnati, OH are:
What zip code has the Highest Percentage of Population Employed in Professional & Scientific Services in Cincinnati, OH?
45226 has the Highest Percentage of Population Employed in Professional & Scientific Services in Cincinnati, OH with 21.2%.
What is the Percentage of Population Employed in Professional & Scientific Services in Cincinnati, OH?
Percentage of Population Employed in Professional & Scientific Services in Cincinnati is 9.3%.
What is the Percentage of Population Employed in Professional & Scientific Services in Ohio?
Percentage of Population Employed in Professional & Scientific Services in Ohio is 6.1%.
What is the Percentage of Population Employed in Professional & Scientific Services in the United States?
Percentage of Population Employed in Professional & Scientific Services in the United States is 7.8%.