Zip Codes with the Highest Percentage of Population Employed in Finance & Insurance in Cincinnati, OH
RELATED REPORTS & OPTIONS
Finance & Insurance
Cincinnati
Compare Zip Codes
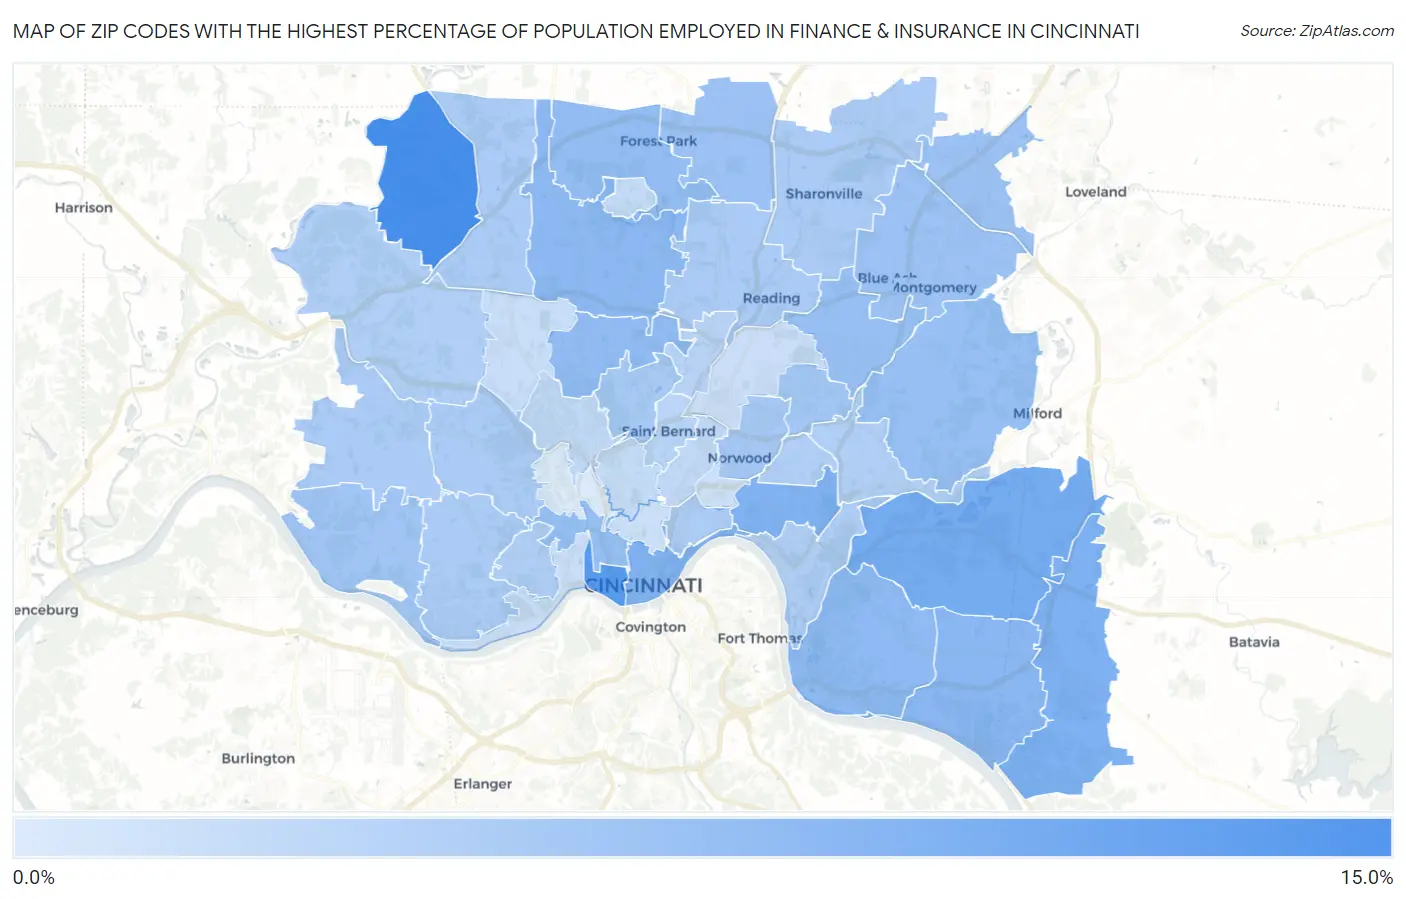
Map of Zip Codes with the Highest Percentage of Population Employed in Finance & Insurance in Cincinnati
0.0%
15.0%
Zip Codes with the Highest Percentage of Population Employed in Finance & Insurance in Cincinnati, OH
| Zip Code | % Employed | vs State | vs National | |
| 1. | 45252 | 13.3% | 5.0%(+8.27)#16 | 4.8%(+8.54)#775 |
| 2. | 45203 | 12.0% | 5.0%(+6.99)#22 | 4.8%(+7.25)#1,009 |
| 3. | 45244 | 9.6% | 5.0%(+4.54)#55 | 4.8%(+4.81)#1,932 |
| 4. | 45245 | 8.9% | 5.0%(+3.82)#69 | 4.8%(+4.09)#2,355 |
| 5. | 45208 | 8.8% | 5.0%(+3.80)#70 | 4.8%(+4.06)#2,371 |
| 6. | 45202 | 8.8% | 5.0%(+3.78)#71 | 4.8%(+4.05)#2,379 |
| 7. | 45255 | 8.0% | 5.0%(+2.97)#92 | 4.8%(+3.24)#3,069 |
| 8. | 45231 | 7.9% | 5.0%(+2.84)#100 | 4.8%(+3.11)#3,203 |
| 9. | 45230 | 7.6% | 5.0%(+2.59)#112 | 4.8%(+2.86)#3,470 |
| 10. | 45224 | 7.6% | 5.0%(+2.51)#117 | 4.8%(+2.78)#3,545 |
| 11. | 45240 | 7.4% | 5.0%(+2.37)#124 | 4.8%(+2.64)#3,711 |
| 12. | 45214 | 7.2% | 5.0%(+2.19)#136 | 4.8%(+2.46)#3,929 |
| 13. | 45236 | 6.9% | 5.0%(+1.89)#147 | 4.8%(+2.16)#4,333 |
| 14. | 45243 | 6.9% | 5.0%(+1.86)#148 | 4.8%(+2.13)#4,393 |
| 15. | 45246 | 6.8% | 5.0%(+1.78)#153 | 4.8%(+2.05)#4,503 |
| 16. | 45249 | 6.7% | 5.0%(+1.65)#160 | 4.8%(+1.92)#4,682 |
| 17. | 45242 | 6.6% | 5.0%(+1.60)#165 | 4.8%(+1.87)#4,761 |
| 18. | 45233 | 6.3% | 5.0%(+1.30)#183 | 4.8%(+1.57)#5,235 |
| 19. | 45213 | 6.1% | 5.0%(+1.04)#196 | 4.8%(+1.31)#5,697 |
| 20. | 45212 | 5.9% | 5.0%(+0.828)#213 | 4.8%(+1.10)#6,151 |
| 21. | 45232 | 5.8% | 5.0%(+0.751)#219 | 4.8%(+1.02)#6,304 |
| 22. | 45241 | 5.6% | 5.0%(+0.608)#235 | 4.8%(+0.877)#6,605 |
| 23. | 45215 | 5.6% | 5.0%(+0.605)#236 | 4.8%(+0.874)#6,610 |
| 24. | 45251 | 5.6% | 5.0%(+0.571)#239 | 4.8%(+0.840)#6,709 |
| 25. | 45238 | 5.6% | 5.0%(+0.546)#241 | 4.8%(+0.815)#6,765 |
| 26. | 45248 | 5.6% | 5.0%(+0.534)#243 | 4.8%(+0.803)#6,801 |
| 27. | 45211 | 5.6% | 5.0%(+0.524)#244 | 4.8%(+0.793)#6,829 |
| 28. | 45206 | 5.4% | 5.0%(+0.377)#256 | 4.8%(+0.646)#7,191 |
| 29. | 45226 | 5.2% | 5.0%(+0.182)#275 | 4.8%(+0.451)#7,666 |
| 30. | 45205 | 5.2% | 5.0%(+0.167)#279 | 4.8%(+0.436)#7,714 |
| 31. | 45247 | 5.0% | 5.0%(-0.046)#297 | 4.8%(+0.223)#8,315 |
| 32. | 45209 | 5.0% | 5.0%(-0.057)#298 | 4.8%(+0.212)#8,343 |
| 33. | 45227 | 5.0% | 5.0%(-0.062)#299 | 4.8%(+0.207)#8,362 |
| 34. | 45216 | 4.6% | 5.0%(-0.457)#338 | 4.8%(-0.188)#9,588 |
| 35. | 45217 | 4.4% | 5.0%(-0.608)#352 | 4.8%(-0.339)#10,089 |
| 36. | 45229 | 3.9% | 5.0%(-1.12)#426 | 4.8%(-0.855)#11,934 |
| 37. | 45223 | 3.9% | 5.0%(-1.14)#432 | 4.8%(-0.874)#12,006 |
| 38. | 45218 | 3.7% | 5.0%(-1.34)#459 | 4.8%(-1.08)#12,797 |
| 39. | 45220 | 3.6% | 5.0%(-1.46)#472 | 4.8%(-1.19)#13,251 |
| 40. | 45239 | 3.4% | 5.0%(-1.67)#509 | 4.8%(-1.40)#14,172 |
| 41. | 45204 | 3.2% | 5.0%(-1.83)#537 | 4.8%(-1.56)#14,872 |
| 42. | 45237 | 3.2% | 5.0%(-1.88)#545 | 4.8%(-1.61)#15,098 |
| 43. | 45219 | 3.0% | 5.0%(-2.03)#566 | 4.8%(-1.77)#15,829 |
| 44. | 45207 | 2.8% | 5.0%(-2.21)#600 | 4.8%(-1.94)#16,601 |
| 45. | 45225 | 1.8% | 5.0%(-3.21)#799 | 4.8%(-2.94)#21,200 |
1
Common Questions
What are the Top 10 Zip Codes with the Highest Percentage of Population Employed in Finance & Insurance in Cincinnati, OH?
Top 10 Zip Codes with the Highest Percentage of Population Employed in Finance & Insurance in Cincinnati, OH are:
What zip code has the Highest Percentage of Population Employed in Finance & Insurance in Cincinnati, OH?
45252 has the Highest Percentage of Population Employed in Finance & Insurance in Cincinnati, OH with 13.3%.
What is the Percentage of Population Employed in Finance & Insurance in Cincinnati, OH?
Percentage of Population Employed in Finance & Insurance in Cincinnati is 5.2%.
What is the Percentage of Population Employed in Finance & Insurance in Ohio?
Percentage of Population Employed in Finance & Insurance in Ohio is 5.0%.
What is the Percentage of Population Employed in Finance & Insurance in the United States?
Percentage of Population Employed in Finance & Insurance in the United States is 4.8%.