Zip Codes with the Highest Percentage of Renter-Occupied Units in Cincinnati, OH
RELATED REPORTS & OPTIONS
Highest Renter-Occupied
Cincinnati
Compare Zip Codes
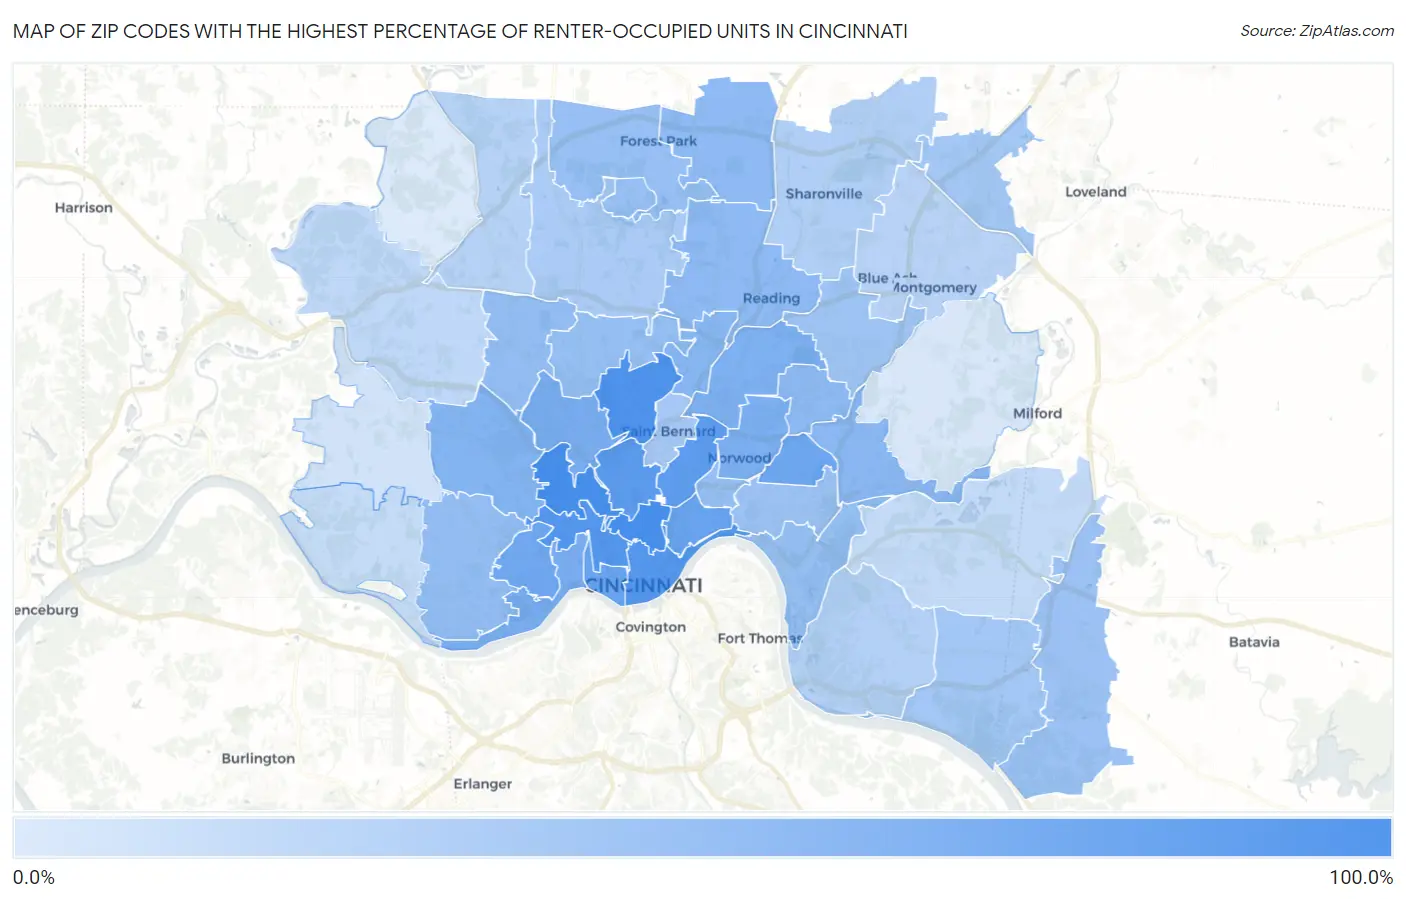
Map of Zip Codes with the Highest Percentage of Renter-Occupied Units in Cincinnati
0.0%
100.0%
Zip Codes with the Highest Percentage of Renter-Occupied Units in Cincinnati, OH
| Zip Code | % Renter-Occupied | vs State | vs National | |
| 1. | 45225 | 86.0% | 33.2%(+52.9)#18 | 35.2%(+50.9)#533 |
| 2. | 45219 | 85.3% | 33.2%(+52.1)#19 | 35.2%(+50.1)#547 |
| 3. | 45232 | 81.9% | 33.2%(+48.7)#22 | 35.2%(+46.7)#624 |
| 4. | 45214 | 77.3% | 33.2%(+44.1)#25 | 35.2%(+42.1)#765 |
| 5. | 45202 | 76.1% | 33.2%(+43.0)#27 | 35.2%(+41.0)#799 |
| 6. | 45220 | 72.4% | 33.2%(+39.2)#32 | 35.2%(+37.2)#942 |
| 7. | 45229 | 70.7% | 33.2%(+37.6)#35 | 35.2%(+35.6)#1,026 |
| 8. | 45203 | 64.5% | 33.2%(+31.4)#50 | 35.2%(+29.3)#1,408 |
| 9. | 45206 | 64.3% | 33.2%(+31.1)#51 | 35.2%(+29.1)#1,429 |
| 10. | 45209 | 60.6% | 33.2%(+27.4)#58 | 35.2%(+25.4)#1,749 |
| 11. | 45205 | 59.6% | 33.2%(+26.4)#63 | 35.2%(+24.4)#1,845 |
| 12. | 45223 | 55.2% | 33.2%(+22.0)#78 | 35.2%(+20.0)#2,314 |
| 13. | 45204 | 54.5% | 33.2%(+21.3)#83 | 35.2%(+19.3)#2,403 |
| 14. | 45212 | 52.7% | 33.2%(+19.5)#87 | 35.2%(+17.5)#2,664 |
| 15. | 45237 | 52.6% | 33.2%(+19.4)#90 | 35.2%(+17.4)#2,683 |
| 16. | 45211 | 49.3% | 33.2%(+16.1)#112 | 35.2%(+14.1)#3,211 |
| 17. | 45216 | 46.8% | 33.2%(+13.6)#134 | 35.2%(+11.6)#3,669 |
| 18. | 45227 | 45.8% | 33.2%(+12.6)#143 | 35.2%(+10.6)#3,884 |
| 19. | 45215 | 43.7% | 33.2%(+10.5)#164 | 35.2%(+8.47)#4,407 |
| 20. | 45246 | 43.1% | 33.2%(+9.90)#170 | 35.2%(+7.90)#4,556 |
| 21. | 45213 | 42.9% | 33.2%(+9.75)#171 | 35.2%(+7.75)#4,591 |
| 22. | 45238 | 41.5% | 33.2%(+8.29)#178 | 35.2%(+6.29)#4,969 |
| 23. | 45239 | 40.8% | 33.2%(+7.61)#188 | 35.2%(+5.60)#5,175 |
| 24. | 45207 | 39.9% | 33.2%(+6.70)#195 | 35.2%(+4.70)#5,442 |
| 25. | 45224 | 39.3% | 33.2%(+6.16)#199 | 35.2%(+4.15)#5,607 |
| 26. | 45226 | 39.2% | 33.2%(+5.98)#201 | 35.2%(+3.98)#5,667 |
| 27. | 45240 | 39.1% | 33.2%(+5.94)#202 | 35.2%(+3.94)#5,681 |
| 28. | 45218 | 38.3% | 33.2%(+5.11)#217 | 35.2%(+3.10)#5,991 |
| 29. | 45245 | 37.3% | 33.2%(+4.08)#233 | 35.2%(+2.08)#6,362 |
| 30. | 45208 | 36.4% | 33.2%(+3.22)#250 | 35.2%(+1.22)#6,756 |
| 31. | 45236 | 35.7% | 33.2%(+2.48)#257 | 35.2%(+0.474)#7,044 |
| 32. | 45255 | 32.9% | 33.2%(-0.291)#293 | 35.2%(-2.30)#8,382 |
| 33. | 45249 | 32.9% | 33.2%(-0.322)#294 | 35.2%(-2.33)#8,401 |
| 34. | 45217 | 31.9% | 33.2%(-1.23)#308 | 35.2%(-3.24)#8,887 |
| 35. | 45231 | 29.4% | 33.2%(-3.81)#378 | 35.2%(-5.82)#10,470 |
| 36. | 45241 | 26.5% | 33.2%(-6.70)#459 | 35.2%(-8.71)#12,481 |
| 37. | 45230 | 25.1% | 33.2%(-8.07)#496 | 35.2%(-10.1)#13,529 |
| 38. | 45251 | 23.9% | 33.2%(-9.30)#544 | 35.2%(-11.3)#14,615 |
| 39. | 45242 | 22.6% | 33.2%(-10.5)#593 | 35.2%(-12.5)#15,761 |
| 40. | 45247 | 20.1% | 33.2%(-13.1)#688 | 35.2%(-15.1)#18,086 |
| 41. | 45244 | 18.4% | 33.2%(-14.8)#760 | 35.2%(-16.8)#19,780 |
| 42. | 45233 | 17.6% | 33.2%(-15.6)#789 | 35.2%(-17.6)#20,593 |
| 43. | 45248 | 12.6% | 33.2%(-20.5)#969 | 35.2%(-22.5)#25,246 |
| 44. | 45243 | 9.4% | 33.2%(-23.7)#1,050 | 35.2%(-25.8)#27,723 |
| 45. | 45252 | 7.6% | 33.2%(-25.5)#1,087 | 35.2%(-27.5)#28,816 |
1
Common Questions
What are the Top 10 Zip Codes with the Highest Percentage of Renter-Occupied Units in Cincinnati, OH?
Top 10 Zip Codes with the Highest Percentage of Renter-Occupied Units in Cincinnati, OH are:
What zip code has the Highest Percentage of Renter-Occupied Units in Cincinnati, OH?
45225 has the Highest Percentage of Renter-Occupied Units in Cincinnati, OH with 86.0%.
What is the Percentage of Renter-Occupied Units in Cincinnati, OH?
Percentage of Renter-Occupied Units in Cincinnati is 60.7%.
What is the Percentage of Renter-Occupied Units in Ohio?
Percentage of Renter-Occupied Units in Ohio is 33.2%.
What is the Percentage of Renter-Occupied Units in the United States?
Percentage of Renter-Occupied Units in the United States is 35.2%.