Zip Codes with the Highest Percentage of Population Employed in Professional & Scientific Services in Sparks, NV
RELATED REPORTS & OPTIONS
Professional & Scientific Services
Sparks
Compare Zip Codes
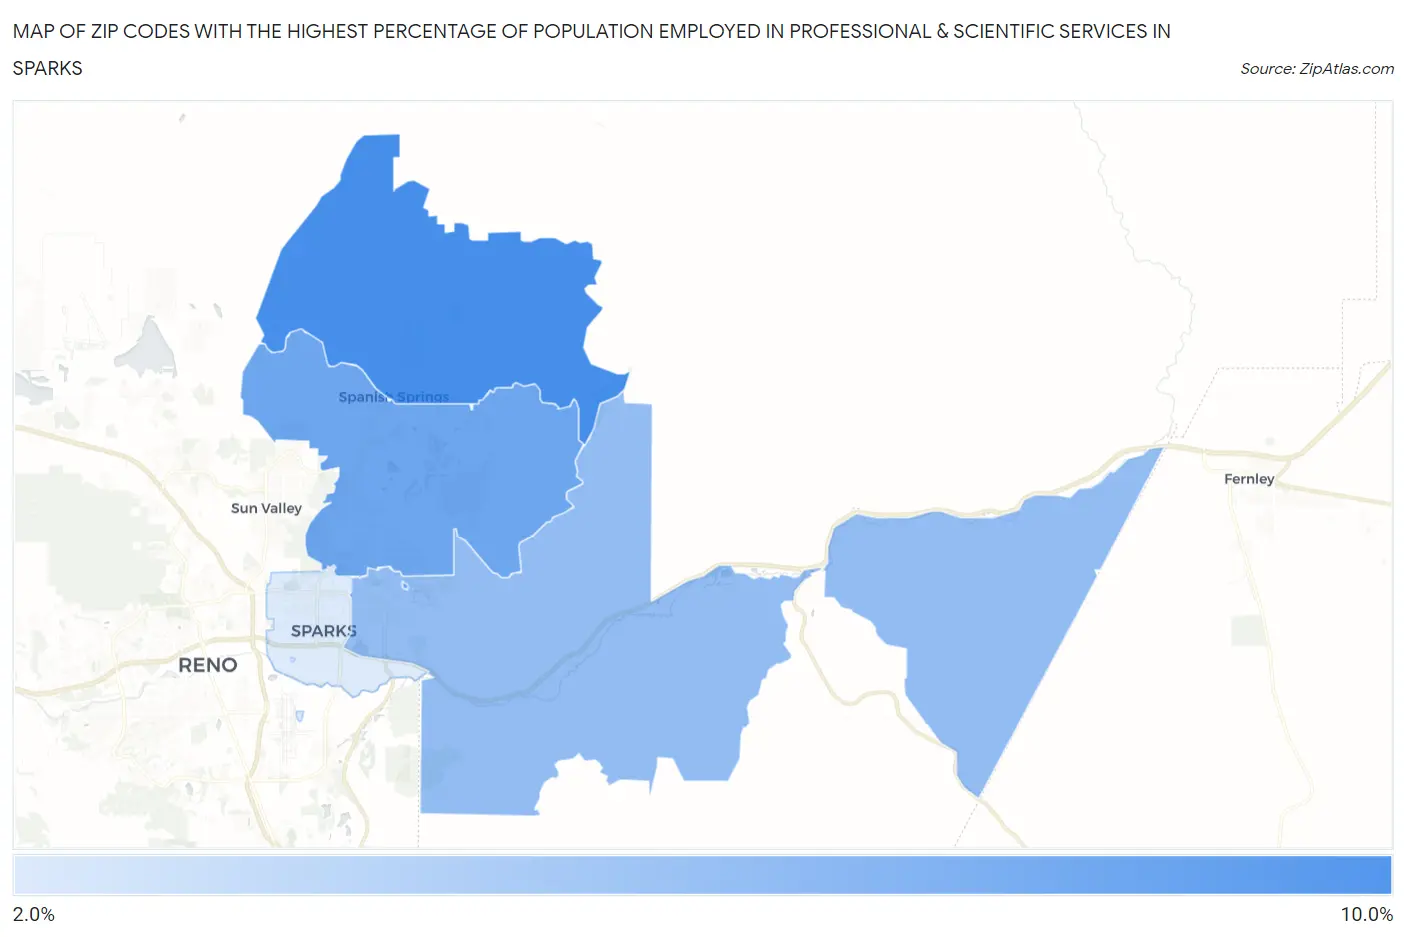
Map of Zip Codes with the Highest Percentage of Population Employed in Professional & Scientific Services in Sparks
0.0%
10.0%
Zip Codes with the Highest Percentage of Population Employed in Professional & Scientific Services in Sparks, NV
| Zip Code | % Employed | vs State | vs National | |
| 1. | 89441 | 8.6% | 6.3%(+2.32)#32 | 7.8%(+0.795)#5,876 |
| 2. | 89436 | 7.0% | 6.3%(+0.660)#51 | 7.8%(-0.863)#8,206 |
| 3. | 89434 | 5.5% | 6.3%(-0.807)#73 | 7.8%(-2.33)#11,046 |
| 4. | 89431 | 2.5% | 6.3%(-3.82)#118 | 7.8%(-5.34)#20,151 |
1
Common Questions
What are the Top 3 Zip Codes with the Highest Percentage of Population Employed in Professional & Scientific Services in Sparks, NV?
Top 3 Zip Codes with the Highest Percentage of Population Employed in Professional & Scientific Services in Sparks, NV are:
What zip code has the Highest Percentage of Population Employed in Professional & Scientific Services in Sparks, NV?
89441 has the Highest Percentage of Population Employed in Professional & Scientific Services in Sparks, NV with 8.6%.
What is the Percentage of Population Employed in Professional & Scientific Services in Sparks, NV?
Percentage of Population Employed in Professional & Scientific Services in Sparks is 4.8%.
What is the Percentage of Population Employed in Professional & Scientific Services in Nevada?
Percentage of Population Employed in Professional & Scientific Services in Nevada is 6.3%.
What is the Percentage of Population Employed in Professional & Scientific Services in the United States?
Percentage of Population Employed in Professional & Scientific Services in the United States is 7.8%.