Zip Codes with the Most Immigrants from South Eastern Asia in Gardnerville, NV
RELATED REPORTS & OPTIONS
South Eastern Asia
Gardnerville
Compare Zip Codes
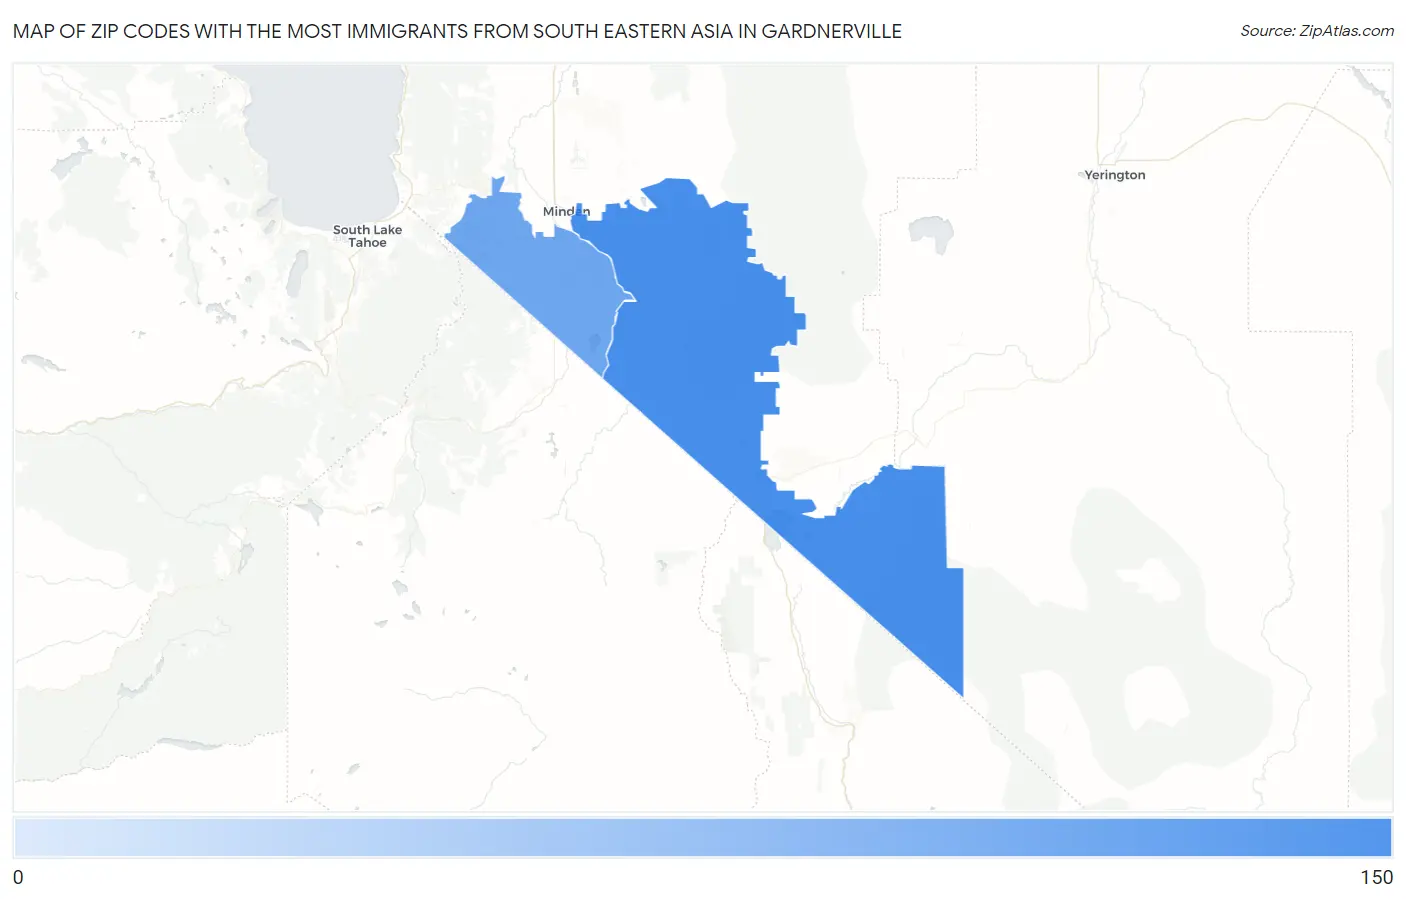
Map of Zip Codes with the Most Immigrants from South Eastern Asia in Gardnerville
35
125
Zip Codes with the Most Immigrants from South Eastern Asia in Gardnerville, NV
| Zip Code | South Eastern Asia | vs State | vs National | |
| 1. | 89410 | 125 | 114,749(0.11%)#77 | 4,292,058(0.00%)#5,327 |
| 2. | 89460 | 35 | 114,749(0.03%)#89 | 4,292,058(0.00%)#8,762 |
1
Common Questions
What are the Top Zip Codes with the Most Immigrants from South Eastern Asia in Gardnerville, NV?
Top Zip Codes with the Most Immigrants from South Eastern Asia in Gardnerville, NV are:
What zip code has the Most Immigrants from South Eastern Asia in Gardnerville, NV?
89410 has the Most Immigrants from South Eastern Asia in Gardnerville, NV with 125.
What is the Total Immigrants from South Eastern Asia in Gardnerville, NV?
Total Immigrants from South Eastern Asia in Gardnerville is 78.
What is the Total Immigrants from South Eastern Asia in Nevada?
Total Immigrants from South Eastern Asia in Nevada is 114,749.
What is the Total Immigrants from South Eastern Asia in the United States?
Total Immigrants from South Eastern Asia in the United States is 4,292,058.