Zip Codes with the Lowest Percentage of Renter-Occupied Units in Gardnerville, NV
RELATED REPORTS & OPTIONS
Lowest Renter-Occupied
Gardnerville
Compare Zip Codes
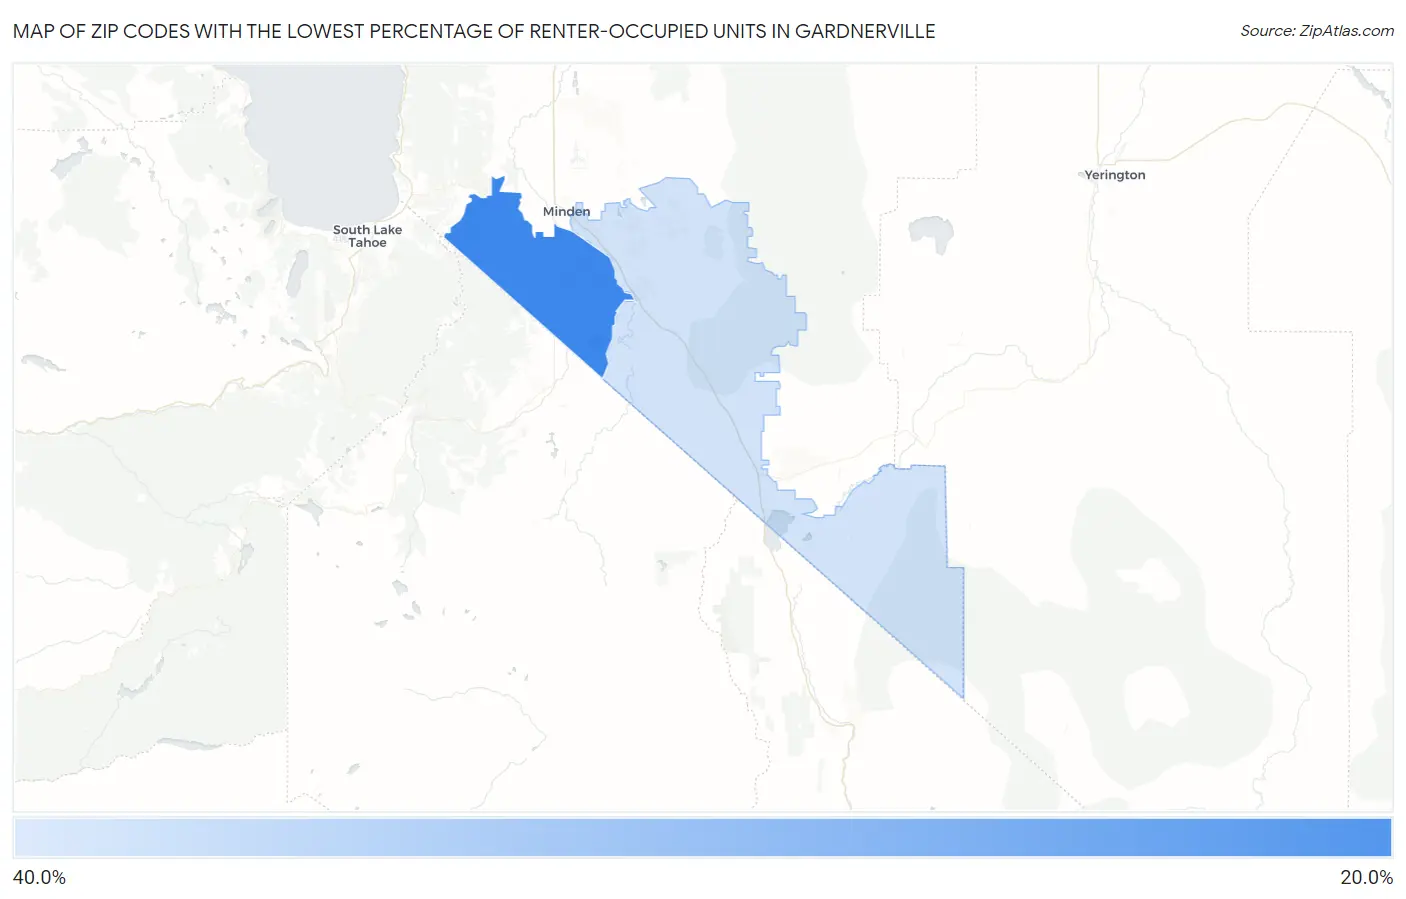
Map of Zip Codes with the Lowest Percentage of Renter-Occupied Units in Gardnerville
31.2%
23.0%
Zip Codes with the Lowest Percentage of Renter-Occupied Units in Gardnerville, NV
| Zip Code | % Renter-Occupied | vs State | vs National | |
| 1. | 89460 | 23.0% | 41.6%(-18.5)#42 | 35.2%(-12.2)#15,703 |
| 2. | 89410 | 31.2% | 41.6%(-10.3)#76 | 35.2%(-3.95)#21,794 |
1
Common Questions
What are the Top Zip Codes with the Lowest Percentage of Renter-Occupied Units in Gardnerville, NV?
Top Zip Codes with the Lowest Percentage of Renter-Occupied Units in Gardnerville, NV are:
What zip code has the Lowest Percentage of Renter-Occupied Units in Gardnerville, NV?
89460 has the Lowest Percentage of Renter-Occupied Units in Gardnerville, NV with 23.0%.
What is the Percentage of Renter-Occupied Units in Gardnerville, NV?
Percentage of Renter-Occupied Units in Gardnerville is 47.2%.
What is the Percentage of Renter-Occupied Units in Nevada?
Percentage of Renter-Occupied Units in Nevada is 41.6%.
What is the Percentage of Renter-Occupied Units in the United States?
Percentage of Renter-Occupied Units in the United States is 35.2%.