Zip Codes with the Highest Percentage of Population with a Degree in Visual and Performing Arts in Matthews, NC
RELATED REPORTS & OPTIONS
Visual and Performing Arts
Matthews
Compare Zip Codes
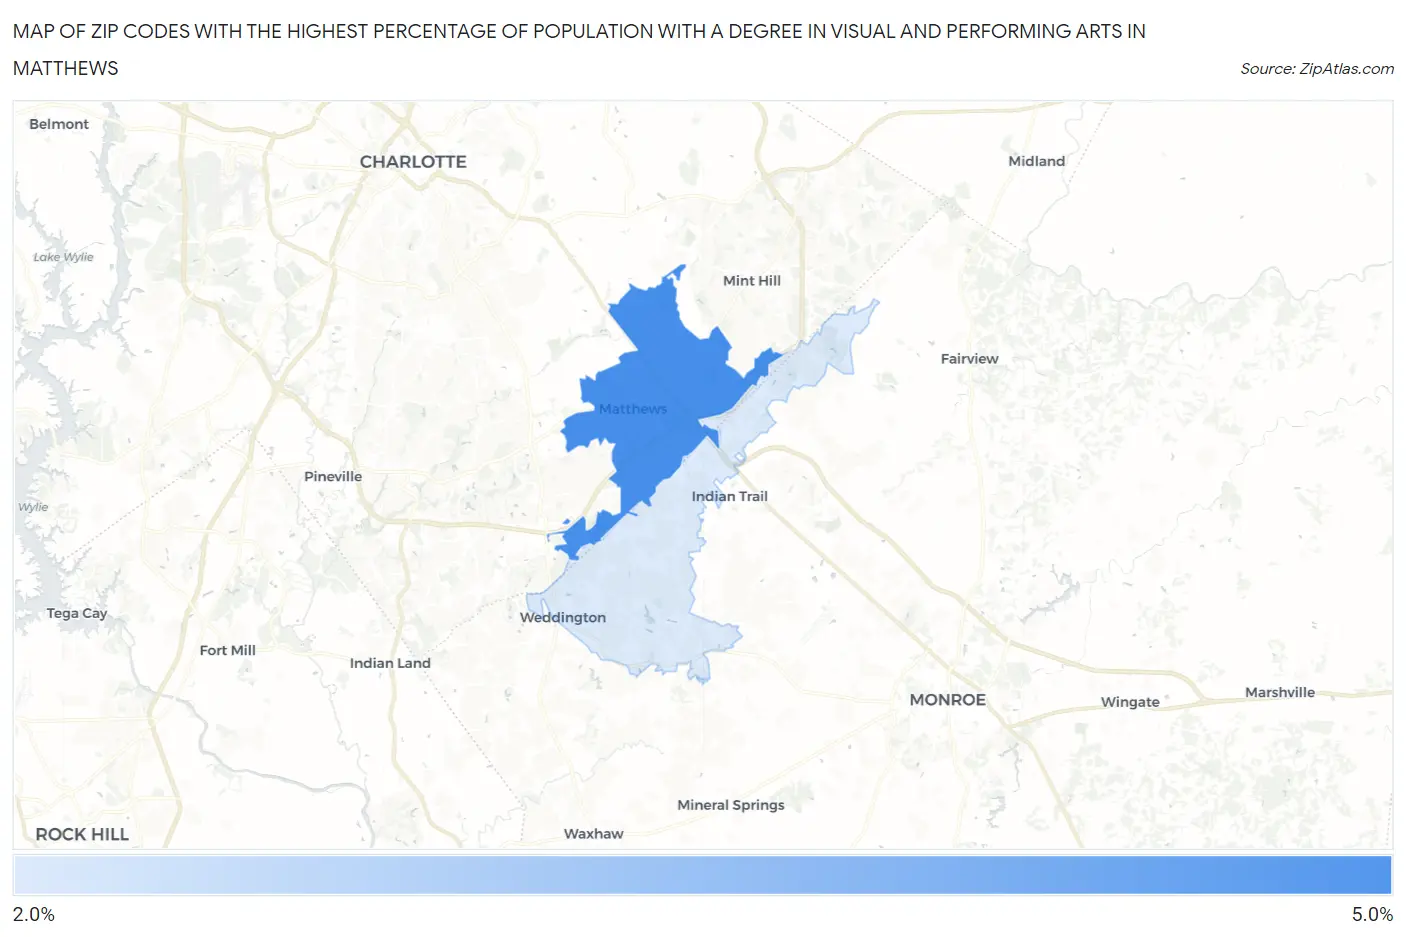
Map of Zip Codes with the Highest Percentage of Population with a Degree in Visual and Performing Arts in Matthews
2.1%
5.0%
Zip Codes with the Highest Percentage of Population with a Degree in Visual and Performing Arts in Matthews, NC
| Zip Code | % Graduates | vs State | vs National | |
| 1. | 28105 | 5.0% | 3.6%(+1.36)#166 | 4.3%(+0.731)#6,686 |
| 2. | 28104 | 2.1% | 3.6%(-1.47)#410 | 4.3%(-2.10)#15,891 |
1
Common Questions
What are the Top Zip Codes with the Highest Percentage of Population with a Degree in Visual and Performing Arts in Matthews, NC?
Top Zip Codes with the Highest Percentage of Population with a Degree in Visual and Performing Arts in Matthews, NC are:
What zip code has the Highest Percentage of Population with a Degree in Visual and Performing Arts in Matthews, NC?
28105 has the Highest Percentage of Population with a Degree in Visual and Performing Arts in Matthews, NC with 5.0%.
What is the Percentage of Population with a Degree in Visual and Performing Arts in Matthews, NC?
Percentage of Population with a Degree in Visual and Performing Arts in Matthews is 6.7%.
What is the Percentage of Population with a Degree in Visual and Performing Arts in North Carolina?
Percentage of Population with a Degree in Visual and Performing Arts in North Carolina is 3.6%.
What is the Percentage of Population with a Degree in Visual and Performing Arts in the United States?
Percentage of Population with a Degree in Visual and Performing Arts in the United States is 4.3%.