Zip Codes with the Highest Percentage of Population with a Degree in Liberal Arts and History in Matthews, NC
RELATED REPORTS & OPTIONS
Liberal Arts and History
Matthews
Compare Zip Codes
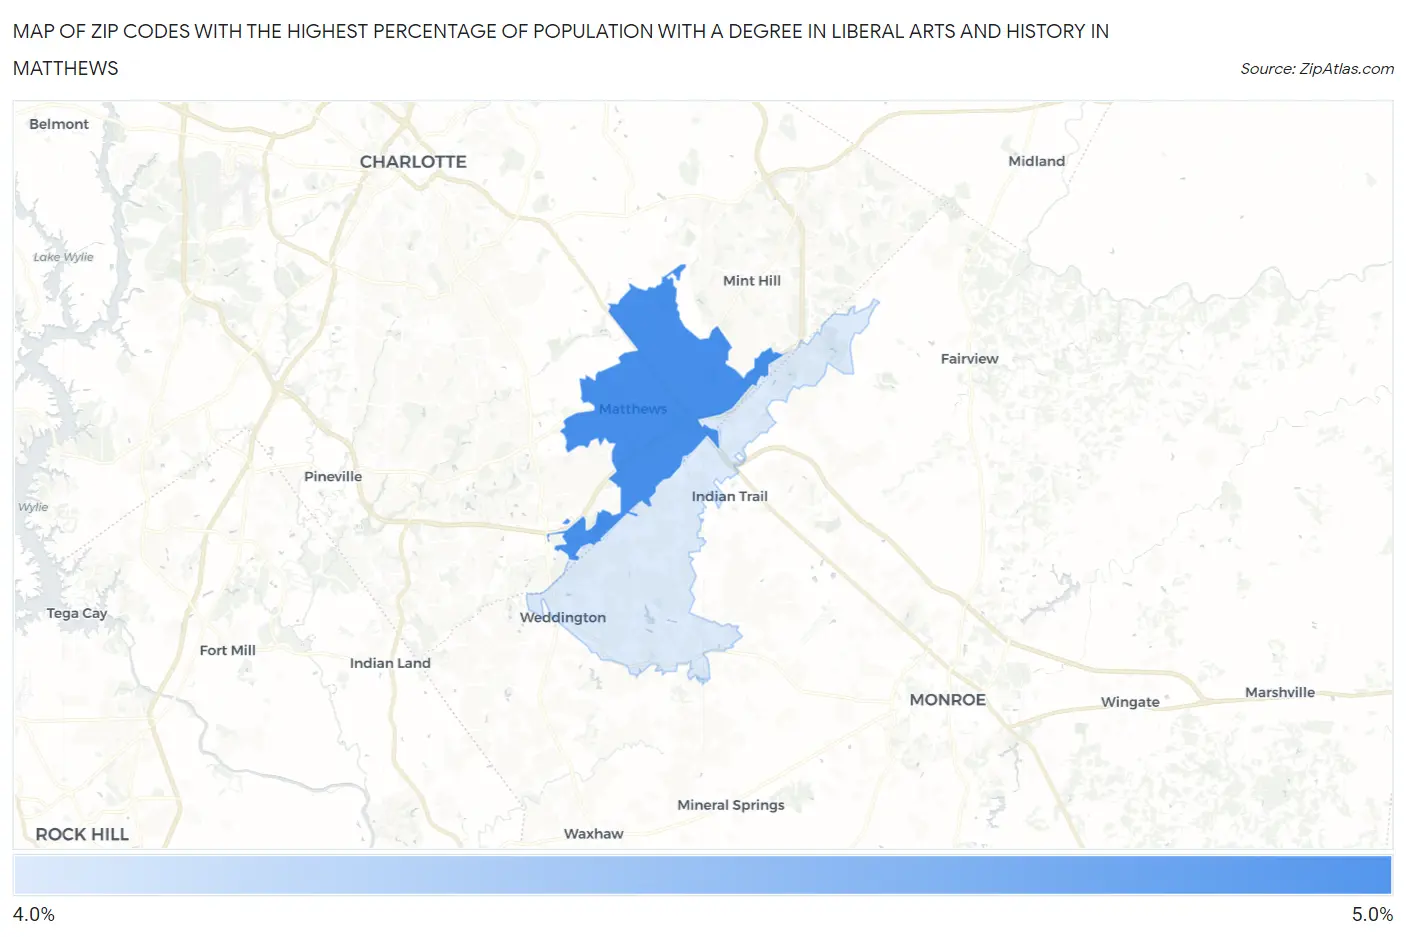
Map of Zip Codes with the Highest Percentage of Population with a Degree in Liberal Arts and History in Matthews
4.4%
4.6%
Zip Codes with the Highest Percentage of Population with a Degree in Liberal Arts and History in Matthews, NC
| Zip Code | % Graduates | vs State | vs National | |
| 1. | 28105 | 4.6% | 4.9%(-0.329)#383 | 4.9%(-0.301)#12,727 |
| 2. | 28104 | 4.4% | 4.9%(-0.461)#394 | 4.9%(-0.433)#13,161 |
1
Common Questions
What are the Top Zip Codes with the Highest Percentage of Population with a Degree in Liberal Arts and History in Matthews, NC?
Top Zip Codes with the Highest Percentage of Population with a Degree in Liberal Arts and History in Matthews, NC are:
What zip code has the Highest Percentage of Population with a Degree in Liberal Arts and History in Matthews, NC?
28105 has the Highest Percentage of Population with a Degree in Liberal Arts and History in Matthews, NC with 4.6%.
What is the Percentage of Population with a Degree in Liberal Arts and History in Matthews, NC?
Percentage of Population with a Degree in Liberal Arts and History in Matthews is 4.1%.
What is the Percentage of Population with a Degree in Liberal Arts and History in North Carolina?
Percentage of Population with a Degree in Liberal Arts and History in North Carolina is 4.9%.
What is the Percentage of Population with a Degree in Liberal Arts and History in the United States?
Percentage of Population with a Degree in Liberal Arts and History in the United States is 4.9%.