Zip Codes with the Highest Percentage of Population Employed in Health Diagnosing & Treating in Matthews, NC
RELATED REPORTS & OPTIONS
Health Diagnosing & Treating
Matthews
Compare Zip Codes
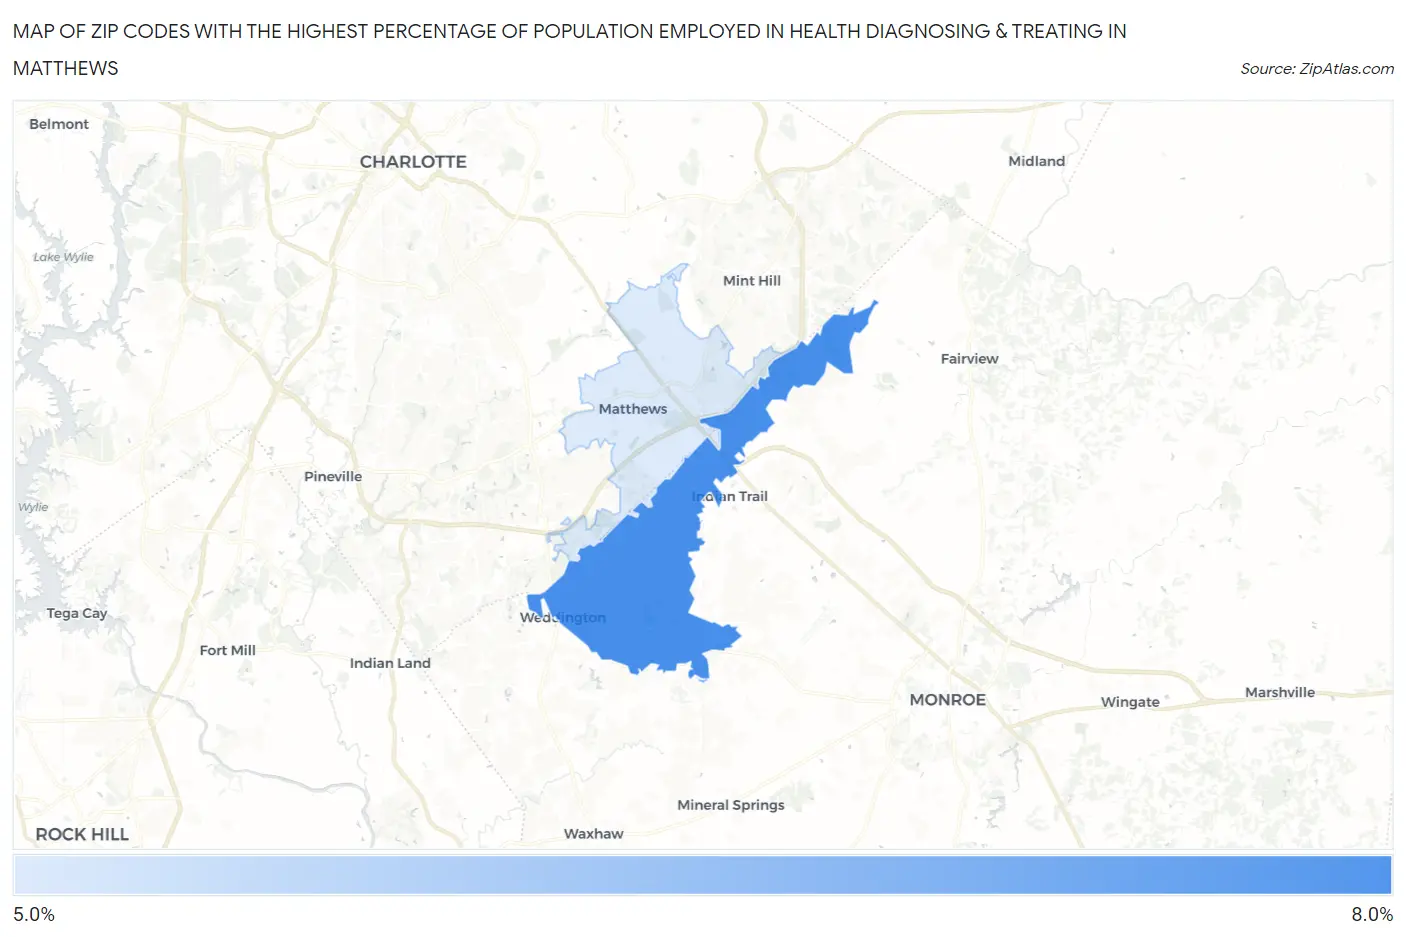
Map of Zip Codes with the Highest Percentage of Population Employed in Health Diagnosing & Treating in Matthews
5.9%
7.5%
Zip Codes with the Highest Percentage of Population Employed in Health Diagnosing & Treating in Matthews, NC
| Zip Code | % Employed | vs State | vs National | |
| 1. | 28104 | 7.5% | 6.4%(+1.11)#225 | 6.2%(+1.28)#8,729 |
| 2. | 28105 | 5.9% | 6.4%(-0.533)#379 | 6.2%(-0.356)#14,267 |
1
Common Questions
What are the Top Zip Codes with the Highest Percentage of Population Employed in Health Diagnosing & Treating in Matthews, NC?
Top Zip Codes with the Highest Percentage of Population Employed in Health Diagnosing & Treating in Matthews, NC are:
What zip code has the Highest Percentage of Population Employed in Health Diagnosing & Treating in Matthews, NC?
28104 has the Highest Percentage of Population Employed in Health Diagnosing & Treating in Matthews, NC with 7.5%.
What is the Percentage of Population Employed in Health Diagnosing & Treating in Matthews, NC?
Percentage of Population Employed in Health Diagnosing & Treating in Matthews is 5.7%.
What is the Percentage of Population Employed in Health Diagnosing & Treating in North Carolina?
Percentage of Population Employed in Health Diagnosing & Treating in North Carolina is 6.4%.
What is the Percentage of Population Employed in Health Diagnosing & Treating in the United States?
Percentage of Population Employed in Health Diagnosing & Treating in the United States is 6.2%.