Zip Codes with the Highest Percentage of Population with a Degree in Liberal Arts and History in Lexington, NC
RELATED REPORTS & OPTIONS
Liberal Arts and History
Lexington
Compare Zip Codes
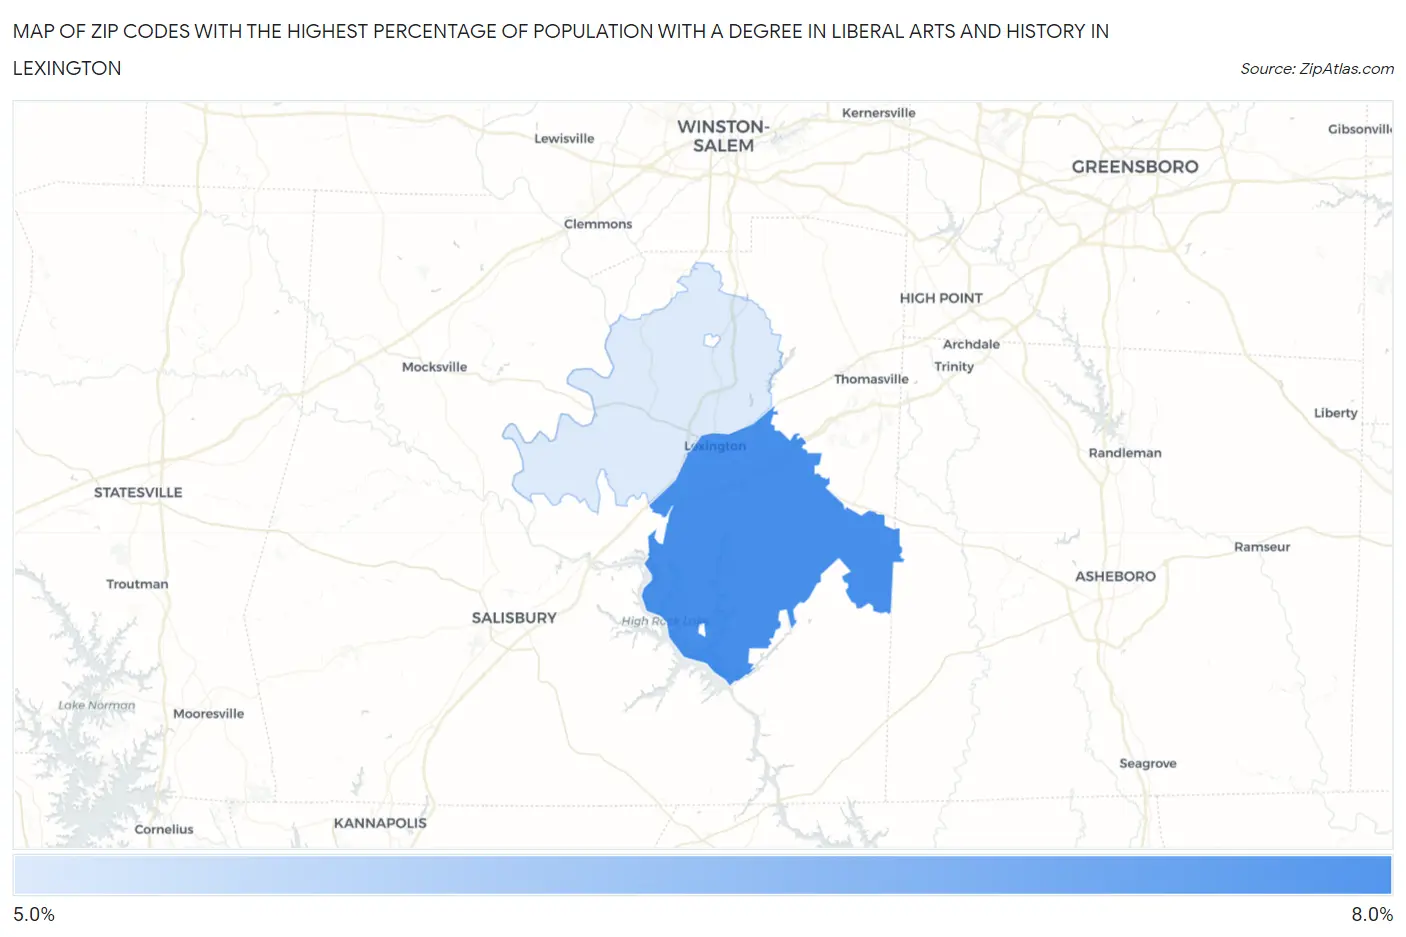
Map of Zip Codes with the Highest Percentage of Population with a Degree in Liberal Arts and History in Lexington
5.4%
7.4%
Zip Codes with the Highest Percentage of Population with a Degree in Liberal Arts and History in Lexington, NC
| Zip Code | % Graduates | vs State | vs National | |
| 1. | 27292 | 7.4% | 4.9%(+2.51)#156 | 4.9%(+2.54)#5,717 |
| 2. | 27295 | 5.4% | 4.9%(+0.541)#291 | 4.9%(+0.569)#10,030 |
1
Common Questions
What are the Top Zip Codes with the Highest Percentage of Population with a Degree in Liberal Arts and History in Lexington, NC?
Top Zip Codes with the Highest Percentage of Population with a Degree in Liberal Arts and History in Lexington, NC are:
What zip code has the Highest Percentage of Population with a Degree in Liberal Arts and History in Lexington, NC?
27292 has the Highest Percentage of Population with a Degree in Liberal Arts and History in Lexington, NC with 7.4%.
What is the Percentage of Population with a Degree in Liberal Arts and History in Lexington, NC?
Percentage of Population with a Degree in Liberal Arts and History in Lexington is 4.7%.
What is the Percentage of Population with a Degree in Liberal Arts and History in North Carolina?
Percentage of Population with a Degree in Liberal Arts and History in North Carolina is 4.9%.
What is the Percentage of Population with a Degree in Liberal Arts and History in the United States?
Percentage of Population with a Degree in Liberal Arts and History in the United States is 4.9%.