Zip Codes with the Highest Percentage of Population Employed in Sales & Related in Independence, MO
RELATED REPORTS & OPTIONS
Sales & Related
Independence
Compare Zip Codes
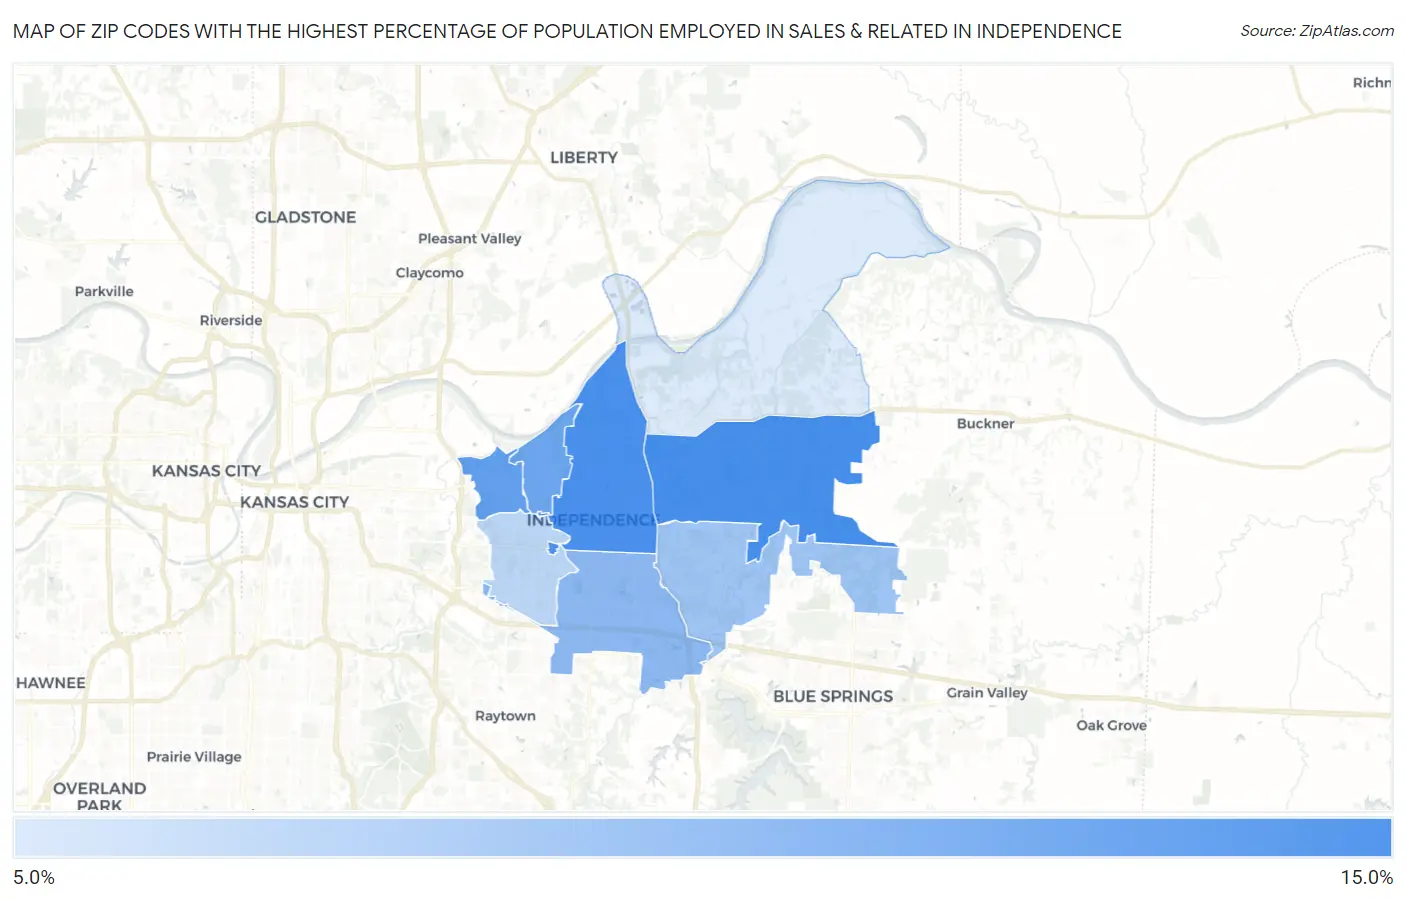
Map of Zip Codes with the Highest Percentage of Population Employed in Sales & Related in Independence
5.4%
10.3%
Zip Codes with the Highest Percentage of Population Employed in Sales & Related in Independence, MO
| Zip Code | % Employed | vs State | vs National | |
| 1. | 64056 | 10.3% | 9.7%(+0.659)#307 | 9.6%(+0.747)#9,989 |
| 2. | 64050 | 10.2% | 9.7%(+0.549)#317 | 9.6%(+0.638)#10,310 |
| 3. | 64053 | 9.4% | 9.7%(-0.252)#386 | 9.6%(-0.164)#12,983 |
| 4. | 64054 | 9.0% | 9.7%(-0.638)#415 | 9.6%(-0.550)#14,357 |
| 5. | 64055 | 8.0% | 9.7%(-1.64)#519 | 9.6%(-1.55)#17,900 |
| 6. | 64057 | 7.4% | 9.7%(-2.29)#580 | 9.6%(-2.20)#20,001 |
| 7. | 64052 | 6.4% | 9.7%(-3.26)#659 | 9.6%(-3.17)#22,628 |
| 8. | 64058 | 5.4% | 9.7%(-4.33)#739 | 9.6%(-4.24)#24,942 |
1
Common Questions
What are the Top 5 Zip Codes with the Highest Percentage of Population Employed in Sales & Related in Independence, MO?
Top 5 Zip Codes with the Highest Percentage of Population Employed in Sales & Related in Independence, MO are:
What zip code has the Highest Percentage of Population Employed in Sales & Related in Independence, MO?
64056 has the Highest Percentage of Population Employed in Sales & Related in Independence, MO with 10.3%.
What is the Percentage of Population Employed in Sales & Related in Independence, MO?
Percentage of Population Employed in Sales & Related in Independence is 8.6%.
What is the Percentage of Population Employed in Sales & Related in Missouri?
Percentage of Population Employed in Sales & Related in Missouri is 9.7%.
What is the Percentage of Population Employed in Sales & Related in the United States?
Percentage of Population Employed in Sales & Related in the United States is 9.6%.