Zip Codes with the Highest Percentage of Population Employed in Arts, Entertainment & Recreation in Independence, MO
RELATED REPORTS & OPTIONS
Arts, Entertainment & Recreation
Independence
Compare Zip Codes
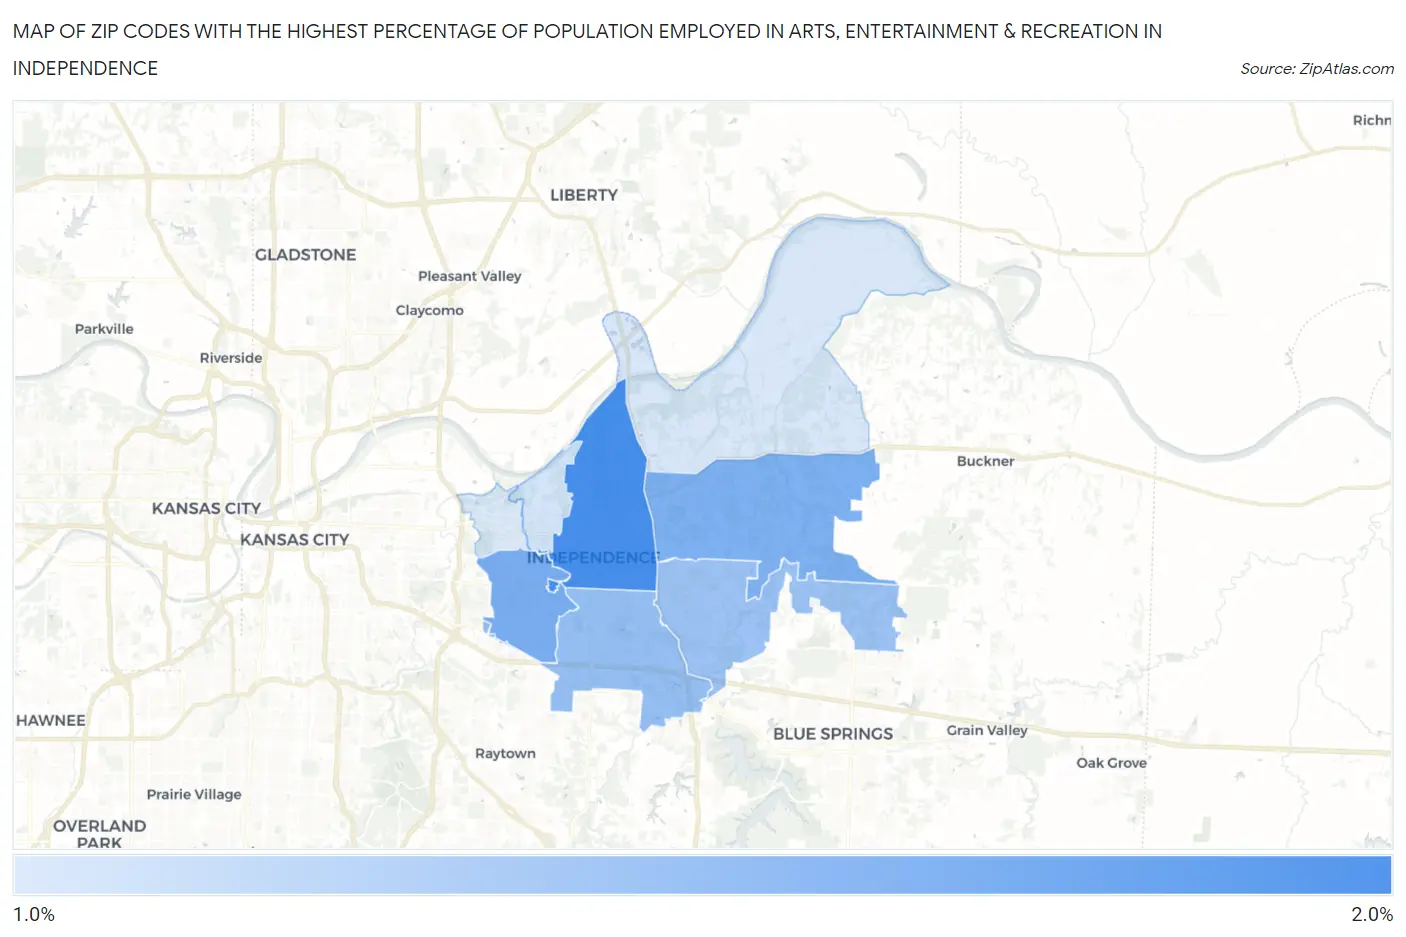
Map of Zip Codes with the Highest Percentage of Population Employed in Arts, Entertainment & Recreation in Independence
0.0%
2.0%
Zip Codes with the Highest Percentage of Population Employed in Arts, Entertainment & Recreation in Independence, MO
| Zip Code | % Employed | vs State | vs National | |
| 1. | 64050 | 1.8% | 1.8%(+0.009)#231 | 2.1%(-0.240)#10,733 |
| 2. | 64052 | 1.6% | 1.8%(-0.240)#267 | 2.1%(-0.488)#12,501 |
| 3. | 64056 | 1.6% | 1.8%(-0.266)#276 | 2.1%(-0.515)#12,725 |
| 4. | 64055 | 1.5% | 1.8%(-0.379)#300 | 2.1%(-0.628)#13,559 |
| 5. | 64057 | 1.4% | 1.8%(-0.411)#306 | 2.1%(-0.659)#13,793 |
| 6. | 64054 | 1.1% | 1.8%(-0.685)#357 | 2.1%(-0.934)#15,881 |
| 7. | 64058 | 1.1% | 1.8%(-0.705)#362 | 2.1%(-0.954)#16,018 |
| 8. | 64053 | 1.1% | 1.8%(-0.727)#365 | 2.1%(-0.975)#16,182 |
1
Common Questions
What are the Top 5 Zip Codes with the Highest Percentage of Population Employed in Arts, Entertainment & Recreation in Independence, MO?
Top 5 Zip Codes with the Highest Percentage of Population Employed in Arts, Entertainment & Recreation in Independence, MO are:
What zip code has the Highest Percentage of Population Employed in Arts, Entertainment & Recreation in Independence, MO?
64050 has the Highest Percentage of Population Employed in Arts, Entertainment & Recreation in Independence, MO with 1.8%.
What is the Percentage of Population Employed in Arts, Entertainment & Recreation in Independence, MO?
Percentage of Population Employed in Arts, Entertainment & Recreation in Independence is 1.6%.
What is the Percentage of Population Employed in Arts, Entertainment & Recreation in Missouri?
Percentage of Population Employed in Arts, Entertainment & Recreation in Missouri is 1.8%.
What is the Percentage of Population Employed in Arts, Entertainment & Recreation in the United States?
Percentage of Population Employed in Arts, Entertainment & Recreation in the United States is 2.1%.