Zip Codes with the Highest Percentage of Population Employed in Farming, Fishing & Forestry in Florissant, MO
RELATED REPORTS & OPTIONS
Farming, Fishing & Forestry
Florissant
Compare Zip Codes
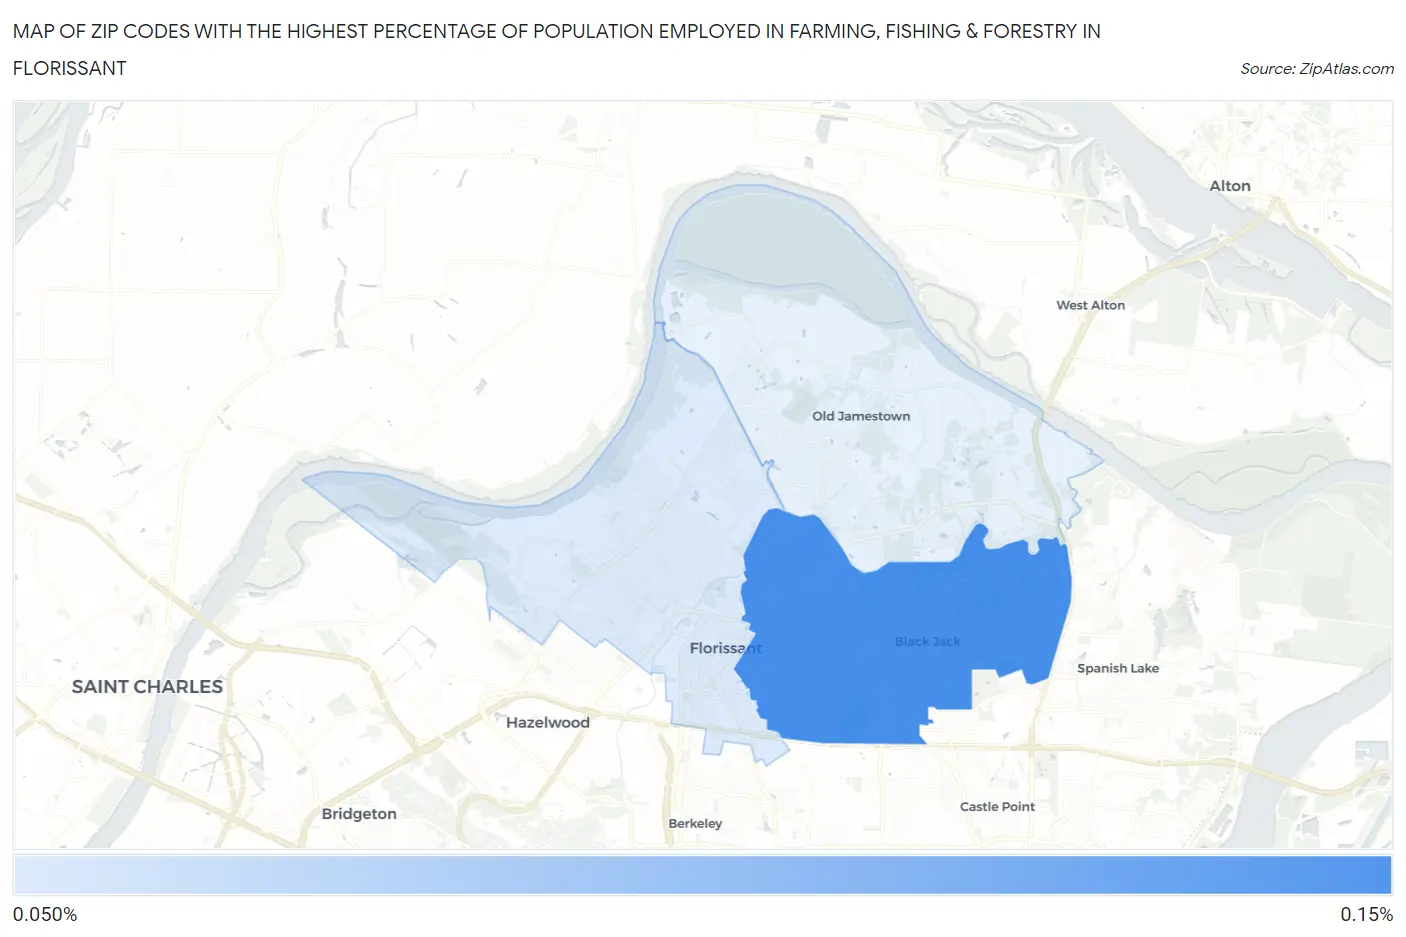
Map of Zip Codes with the Highest Percentage of Population Employed in Farming, Fishing & Forestry in Florissant
0.0%
0.15%
Zip Codes with the Highest Percentage of Population Employed in Farming, Fishing & Forestry in Florissant, MO
| Zip Code | % Employed | vs State | vs National | |
| 1. | 63033 | 0.14% | 0.49%(-0.354)#552 | 0.61%(-0.470)#17,180 |
| 2. | 63031 | 0.11% | 0.49%(-0.378)#563 | 0.61%(-0.494)#17,572 |
1
Common Questions
What are the Top Zip Codes with the Highest Percentage of Population Employed in Farming, Fishing & Forestry in Florissant, MO?
Top Zip Codes with the Highest Percentage of Population Employed in Farming, Fishing & Forestry in Florissant, MO are:
What zip code has the Highest Percentage of Population Employed in Farming, Fishing & Forestry in Florissant, MO?
63033 has the Highest Percentage of Population Employed in Farming, Fishing & Forestry in Florissant, MO with 0.14%.
What is the Percentage of Population Employed in Farming, Fishing & Forestry in Florissant, MO?
Percentage of Population Employed in Farming, Fishing & Forestry in Florissant is 0.10%.
What is the Percentage of Population Employed in Farming, Fishing & Forestry in Missouri?
Percentage of Population Employed in Farming, Fishing & Forestry in Missouri is 0.49%.
What is the Percentage of Population Employed in Farming, Fishing & Forestry in the United States?
Percentage of Population Employed in Farming, Fishing & Forestry in the United States is 0.61%.