Zip Codes with the Highest Percentage of Population Employed in Architecture & Engineering in Cape Girardeau, MO
RELATED REPORTS & OPTIONS
Architecture & Engineering
Cape Girardeau
Compare Zip Codes
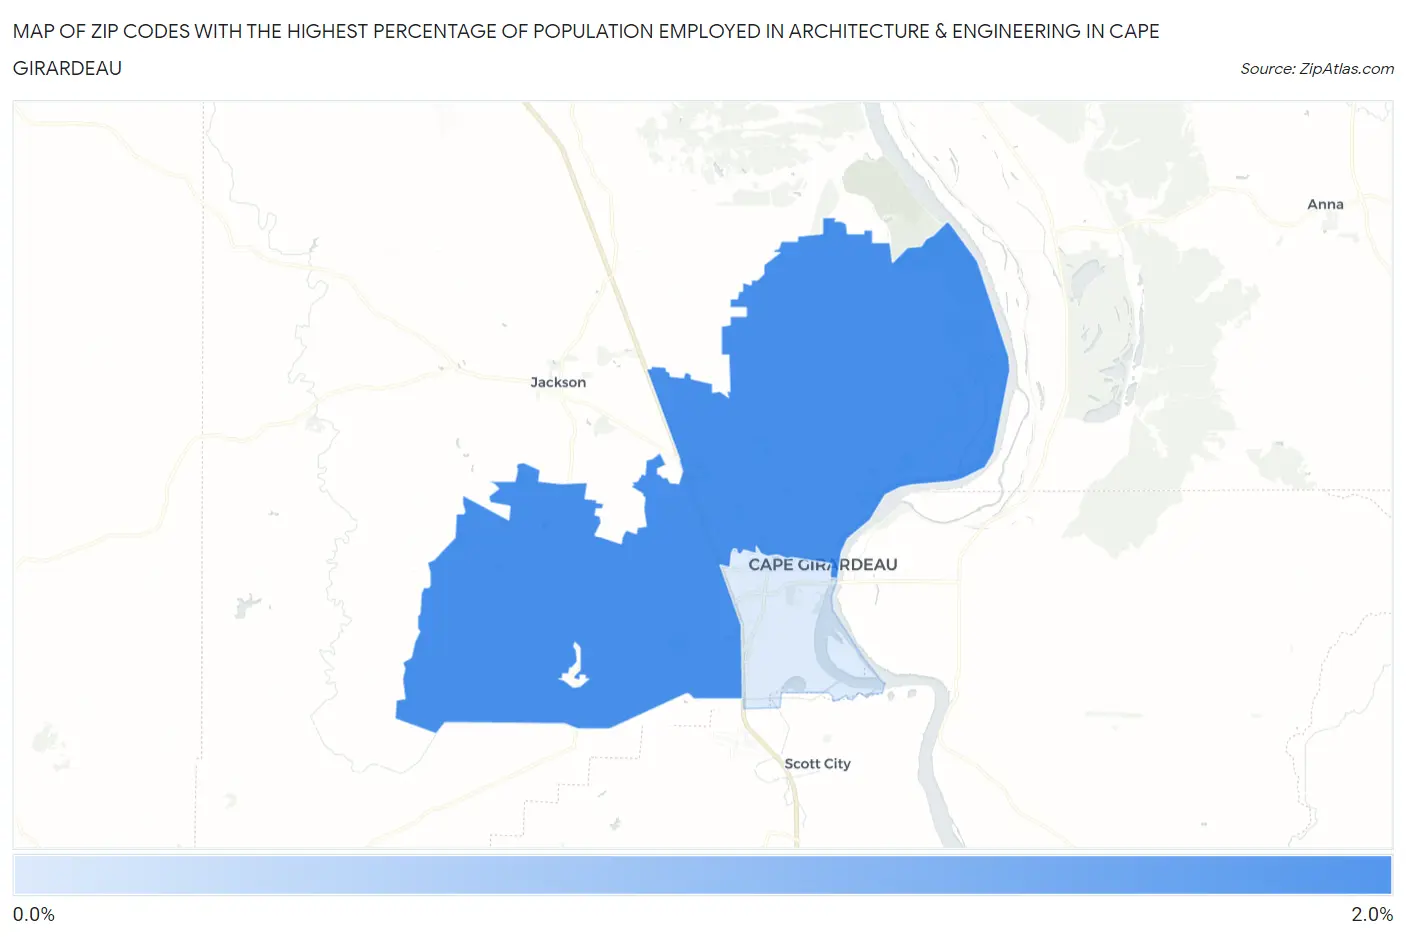
Map of Zip Codes with the Highest Percentage of Population Employed in Architecture & Engineering in Cape Girardeau
0.80%
1.6%
Zip Codes with the Highest Percentage of Population Employed in Architecture & Engineering in Cape Girardeau, MO
| Zip Code | % Employed | vs State | vs National | |
| 1. | 63701 | 1.6% | 1.7%(-0.137)#246 | 2.1%(-0.582)#12,394 |
| 2. | 63703 | 0.80% | 1.7%(-0.906)#403 | 2.1%(-1.35)#18,153 |
1
Common Questions
What are the Top Zip Codes with the Highest Percentage of Population Employed in Architecture & Engineering in Cape Girardeau, MO?
Top Zip Codes with the Highest Percentage of Population Employed in Architecture & Engineering in Cape Girardeau, MO are:
What zip code has the Highest Percentage of Population Employed in Architecture & Engineering in Cape Girardeau, MO?
63701 has the Highest Percentage of Population Employed in Architecture & Engineering in Cape Girardeau, MO with 1.6%.
What is the Percentage of Population Employed in Architecture & Engineering in Cape Girardeau, MO?
Percentage of Population Employed in Architecture & Engineering in Cape Girardeau is 1.6%.
What is the Percentage of Population Employed in Architecture & Engineering in Missouri?
Percentage of Population Employed in Architecture & Engineering in Missouri is 1.7%.
What is the Percentage of Population Employed in Architecture & Engineering in the United States?
Percentage of Population Employed in Architecture & Engineering in the United States is 2.1%.