Wayland, MI Map & Demographics
Wayland Map
Wayland Overview
$31,748
PER CAPITA INCOME
$78,490
AVG FAMILY INCOME
$63,500
AVG HOUSEHOLD INCOME
34.0%
WAGE / INCOME GAP [ % ]
66.0¢/ $1
WAGE / INCOME GAP [ $ ]
0.35
INEQUALITY / GINI INDEX
4,411
TOTAL POPULATION
2,177
MALE POPULATION
2,234
FEMALE POPULATION
97.45
MALES / 100 FEMALES
102.62
FEMALES / 100 MALES
33.5
MEDIAN AGE
2.8
AVG FAMILY SIZE
2.4
AVG HOUSEHOLD SIZE
2,531
LABOR FORCE [ PEOPLE ]
73.1%
PERCENT IN LABOR FORCE
3.0%
UNEMPLOYMENT RATE
Wayland Zip Codes
Income in Wayland
Income Overview in Wayland
Per Capita Income in Wayland is $31,748, while median incomes of families and households are $78,490 and $63,500 respectively.
| Characteristic | Number | Measure |
| Per Capita Income | 4,411 | $31,748 |
| Median Family Income | 1,181 | $78,490 |
| Mean Family Income | 1,181 | $82,841 |
| Median Household Income | 1,784 | $63,500 |
| Mean Household Income | 1,784 | $75,359 |
| Income Deficit | 1,181 | $0 |
| Wage / Income Gap (%) | 4,411 | 34.02% |
| Wage / Income Gap ($) | 4,411 | 65.98¢ per $1 |
| Gini / Inequality Index | 4,411 | 0.35 |
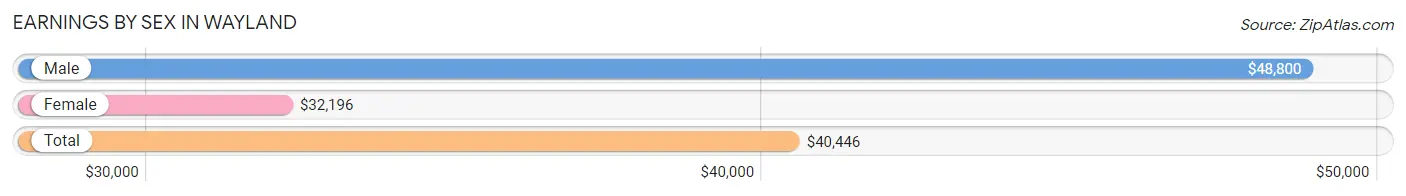
Earnings by Sex in Wayland
Average Earnings in Wayland are $40,446, $48,800 for men and $32,196 for women, a difference of 34.0%.
| Sex | Number | Average Earnings |
| Male | 1,406 (53.3%) | $48,800 |
| Female | 1,232 (46.7%) | $32,196 |
| Total | 2,638 (100.0%) | $40,446 |
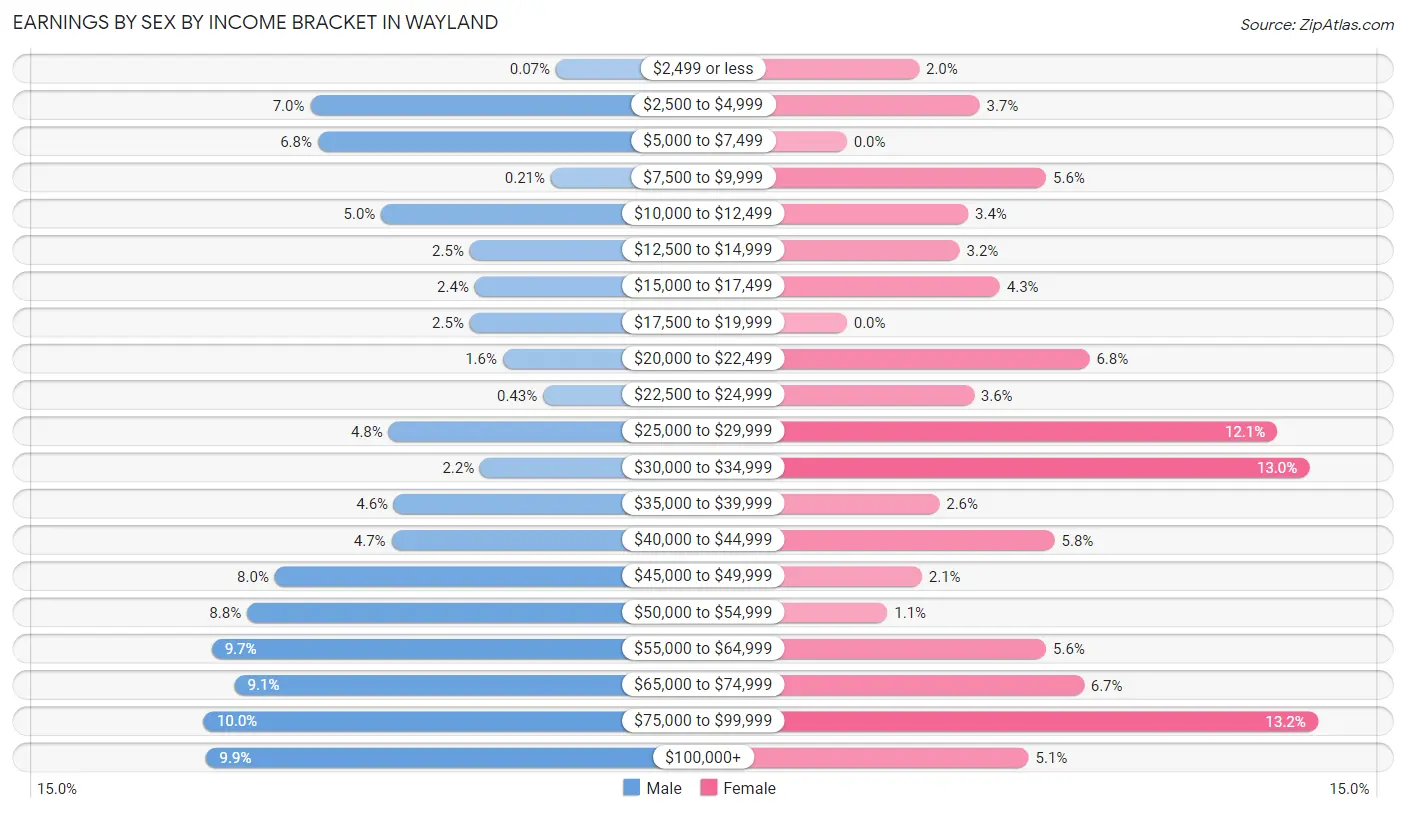
Earnings by Sex by Income Bracket in Wayland
The most common earnings brackets in Wayland are $75,000 to $99,999 for men (140 | 10.0%) and $75,000 to $99,999 for women (163 | 13.2%).
| Income | Male | Female |
| $2,499 or less | 1 (0.1%) | 25 (2.0%) |
| $2,500 to $4,999 | 98 (7.0%) | 46 (3.7%) |
| $5,000 to $7,499 | 95 (6.8%) | 0 (0.0%) |
| $7,500 to $9,999 | 3 (0.2%) | 69 (5.6%) |
| $10,000 to $12,499 | 70 (5.0%) | 42 (3.4%) |
| $12,500 to $14,999 | 35 (2.5%) | 39 (3.2%) |
| $15,000 to $17,499 | 33 (2.4%) | 53 (4.3%) |
| $17,500 to $19,999 | 35 (2.5%) | 0 (0.0%) |
| $20,000 to $22,499 | 22 (1.6%) | 84 (6.8%) |
| $22,500 to $24,999 | 6 (0.4%) | 44 (3.6%) |
| $25,000 to $29,999 | 67 (4.8%) | 149 (12.1%) |
| $30,000 to $34,999 | 31 (2.2%) | 160 (13.0%) |
| $35,000 to $39,999 | 65 (4.6%) | 32 (2.6%) |
| $40,000 to $44,999 | 66 (4.7%) | 72 (5.8%) |
| $45,000 to $49,999 | 112 (8.0%) | 26 (2.1%) |
| $50,000 to $54,999 | 123 (8.7%) | 14 (1.1%) |
| $55,000 to $64,999 | 137 (9.7%) | 69 (5.6%) |
| $65,000 to $74,999 | 128 (9.1%) | 82 (6.7%) |
| $75,000 to $99,999 | 140 (10.0%) | 163 (13.2%) |
| $100,000+ | 139 (9.9%) | 63 (5.1%) |
| Total | 1,406 (100.0%) | 1,232 (100.0%) |
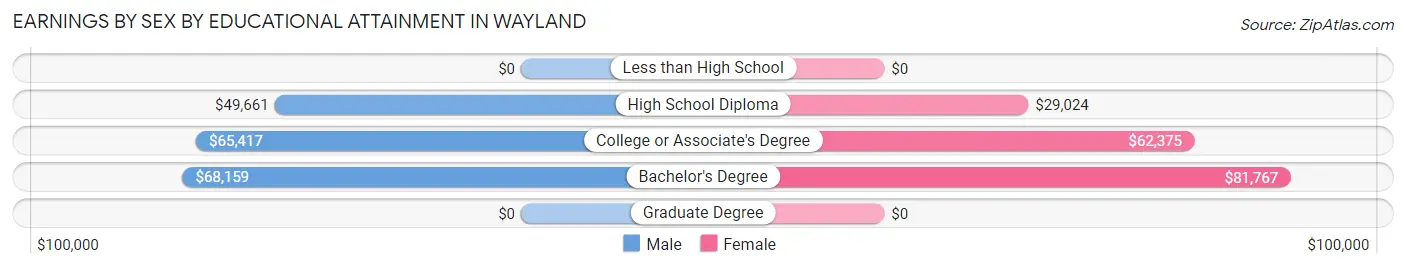
Earnings by Sex by Educational Attainment in Wayland
Average earnings in Wayland are $52,578 for men and $40,684 for women, a difference of 22.6%. Men with an educational attainment of bachelor's degree enjoy the highest average annual earnings of $68,159, while those with high school diploma education earn the least with $49,661. Women with an educational attainment of bachelor's degree earn the most with the average annual earnings of $81,767, while those with high school diploma education have the smallest earnings of $29,024.
| Educational Attainment | Male Income | Female Income |
| Less than High School | - | - |
| High School Diploma | $49,661 | $29,024 |
| College or Associate's Degree | $65,417 | $62,375 |
| Bachelor's Degree | $68,159 | $81,767 |
| Graduate Degree | - | - |
| Total | $52,578 | $40,684 |
Family Income in Wayland
Family Income Brackets in Wayland
According to the Wayland family income data, there are 283 families falling into the $100,000 to $149,999 income range, which is the most common income bracket and makes up 24.0% of all families.
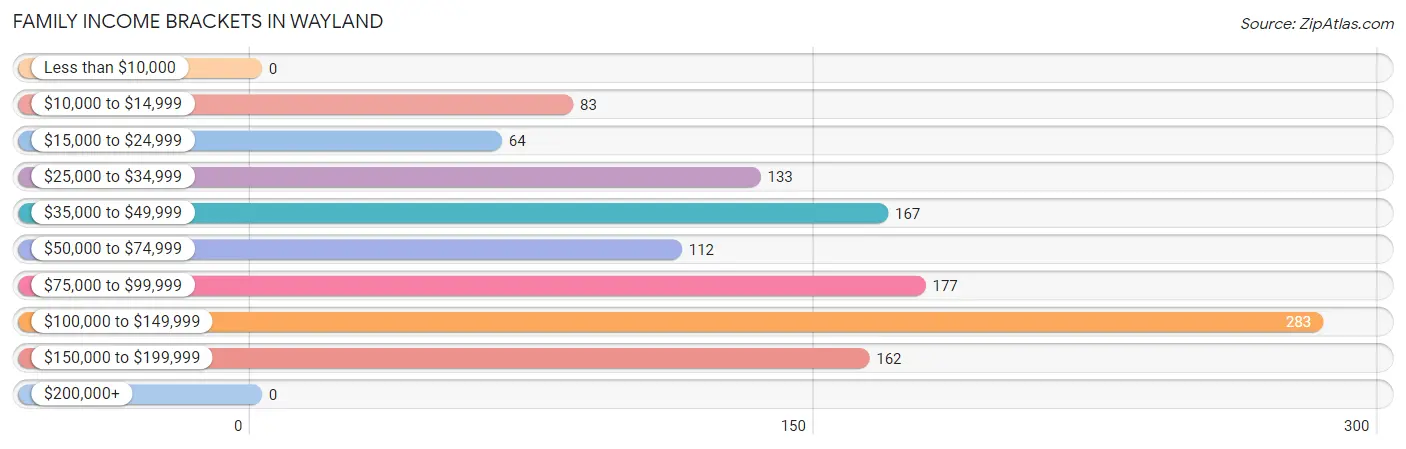
| Income Bracket | # Families | % Families |
| Less than $10,000 | 0 | 0.0% |
| $10,000 to $14,999 | 83 | 7.0% |
| $15,000 to $24,999 | 64 | 5.4% |
| $25,000 to $34,999 | 133 | 11.3% |
| $35,000 to $49,999 | 167 | 14.1% |
| $50,000 to $74,999 | 112 | 9.5% |
| $75,000 to $99,999 | 177 | 15.0% |
| $100,000 to $149,999 | 283 | 24.0% |
| $150,000 to $199,999 | 162 | 13.7% |
| $200,000+ | 0 | 0.0% |
Family Income by Famaliy Size in Wayland
3-person families (204 | 17.3%) account for the highest median family income in Wayland with $95,676 per family, while 2-person families (654 | 55.4%) have the highest median income of $34,970 per family member.
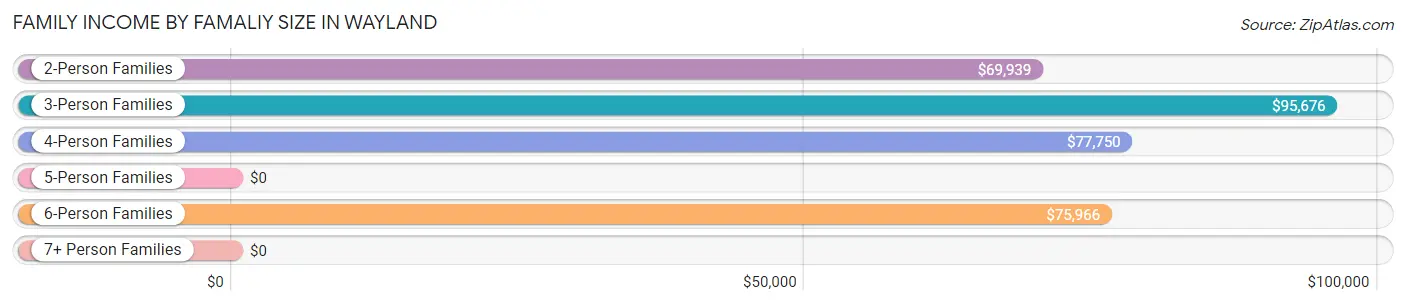
| Income Bracket | # Families | Median Income |
| 2-Person Families | 654 (55.4%) | $69,939 |
| 3-Person Families | 204 (17.3%) | $95,676 |
| 4-Person Families | 219 (18.5%) | $77,750 |
| 5-Person Families | 47 (4.0%) | $0 |
| 6-Person Families | 57 (4.8%) | $75,966 |
| 7+ Person Families | 0 (0.0%) | $0 |
| Total | 1,181 (100.0%) | $78,490 |
Family Income by Number of Earners in Wayland
The median family income in Wayland is $78,490, with families comprising 3+ earners (153) having the highest median family income of $104,125, while families with no earners (173) have the lowest median family income of $22,637, accounting for 13.0% and 14.6% of families, respectively.
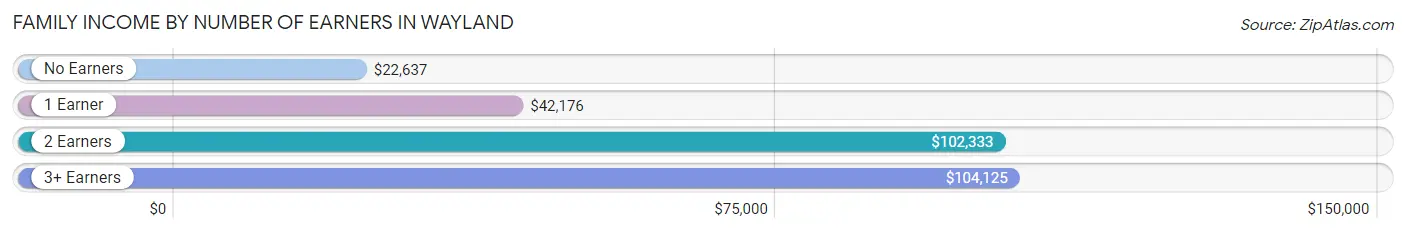
| Number of Earners | # Families | Median Income |
| No Earners | 173 (14.6%) | $22,637 |
| 1 Earner | 377 (31.9%) | $42,176 |
| 2 Earners | 478 (40.5%) | $102,333 |
| 3+ Earners | 153 (13.0%) | $104,125 |
| Total | 1,181 (100.0%) | $78,490 |
Household Income in Wayland
Household Income Brackets in Wayland
With 368 households falling in the category, the $100,000 to $149,999 income range is the most frequent in Wayland, accounting for 20.6% of all households.
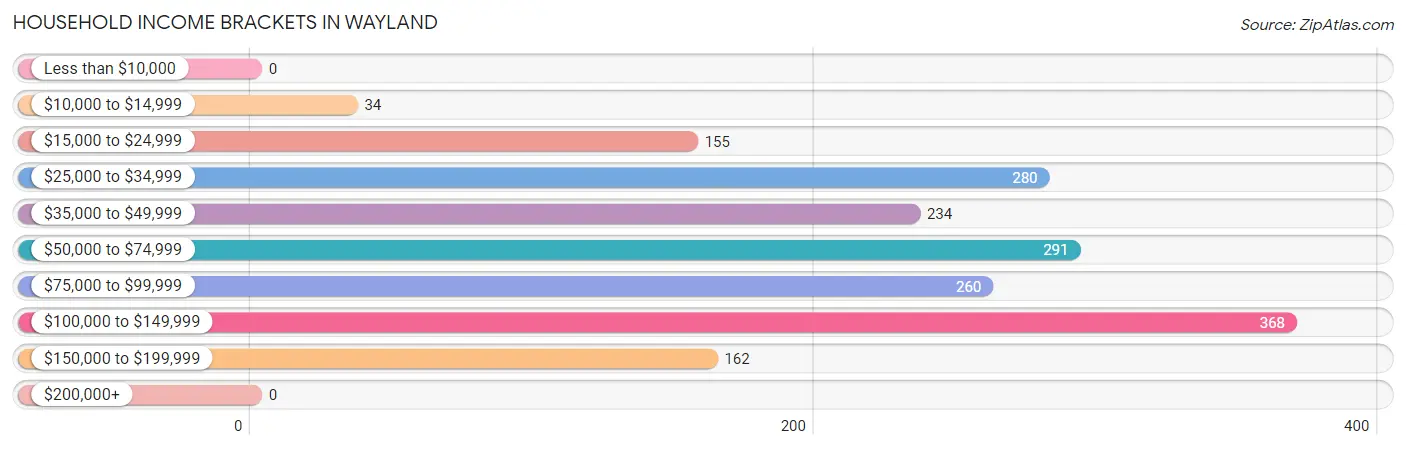
| Income Bracket | # Households | % Households |
| Less than $10,000 | 0 | 0.0% |
| $10,000 to $14,999 | 34 | 1.9% |
| $15,000 to $24,999 | 155 | 8.7% |
| $25,000 to $34,999 | 280 | 15.7% |
| $35,000 to $49,999 | 234 | 13.1% |
| $50,000 to $74,999 | 291 | 16.3% |
| $75,000 to $99,999 | 260 | 14.6% |
| $100,000 to $149,999 | 368 | 20.6% |
| $150,000 to $199,999 | 162 | 9.1% |
| $200,000+ | 0 | 0.0% |
Household Income by Householder Age in Wayland
The median household income in Wayland is $63,500, with the highest median household income of $86,106 found in the 45 to 64 years age bracket for the primary householder. A total of 675 households (37.8%) fall into this category. Meanwhile, the 15 to 24 years age bracket for the primary householder has the lowest median household income of $34,934, with 148 households (8.3%) in this group.
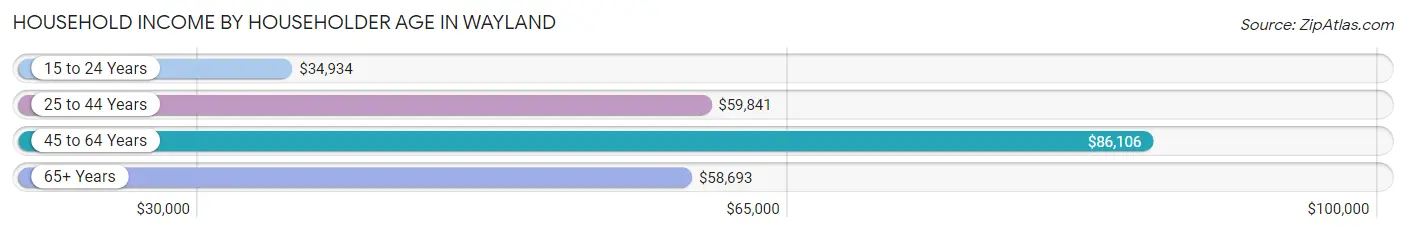
| Income Bracket | # Households | Median Income |
| 15 to 24 Years | 148 (8.3%) | $34,934 |
| 25 to 44 Years | 676 (37.9%) | $59,841 |
| 45 to 64 Years | 675 (37.8%) | $86,106 |
| 65+ Years | 285 (16.0%) | $58,693 |
| Total | 1,784 (100.0%) | $63,500 |
Poverty in Wayland
Income Below Poverty by Sex and Age in Wayland
With 8.1% poverty level for males and 6.5% for females among the residents of Wayland, 18 to 24 year old males and 75 year old and over females are the most vulnerable to poverty, with 98 males (43.6%) and 14 females (70.0%) in their respective age groups living below the poverty level.
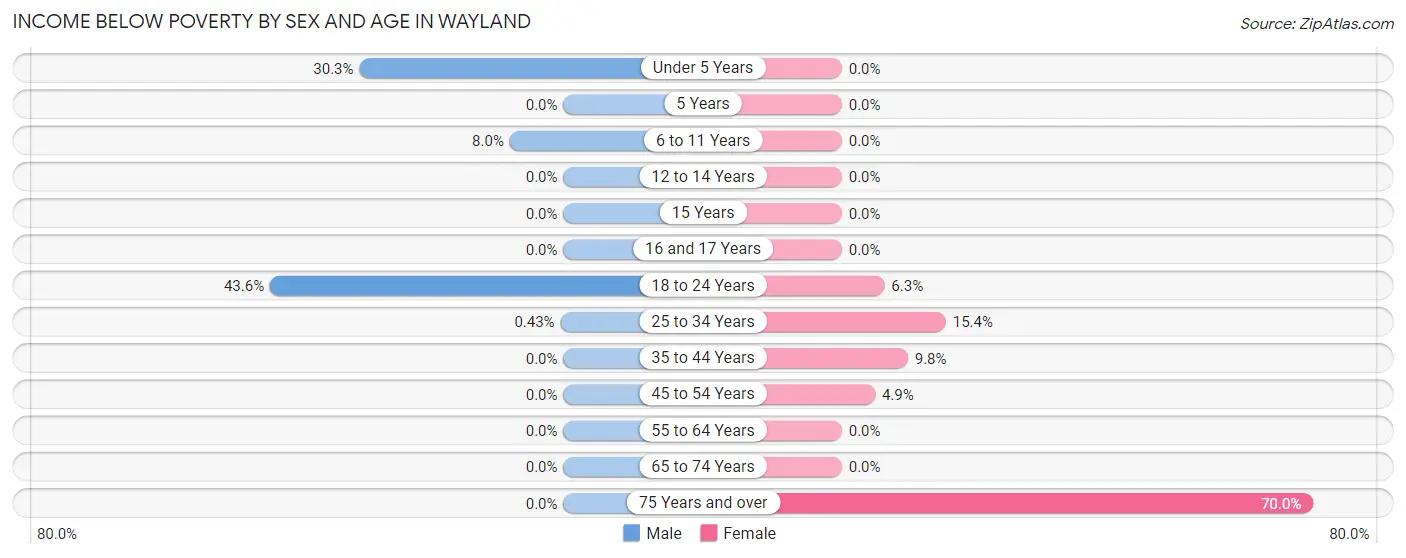
| Age Bracket | Male | Female |
| Under 5 Years | 53 (30.3%) | 0 (0.0%) |
| 5 Years | 0 (0.0%) | 0 (0.0%) |
| 6 to 11 Years | 18 (8.0%) | 0 (0.0%) |
| 12 to 14 Years | 0 (0.0%) | 0 (0.0%) |
| 15 Years | 0 (0.0%) | 0 (0.0%) |
| 16 and 17 Years | 0 (0.0%) | 0 (0.0%) |
| 18 to 24 Years | 98 (43.6%) | 26 (6.3%) |
| 25 to 34 Years | 1 (0.4%) | 63 (15.4%) |
| 35 to 44 Years | 0 (0.0%) | 20 (9.8%) |
| 45 to 54 Years | 0 (0.0%) | 17 (4.9%) |
| 55 to 64 Years | 0 (0.0%) | 0 (0.0%) |
| 65 to 74 Years | 0 (0.0%) | 0 (0.0%) |
| 75 Years and over | 0 (0.0%) | 14 (70.0%) |
| Total | 170 (8.1%) | 140 (6.5%) |
Income Above Poverty by Sex and Age in Wayland
According to the poverty statistics in Wayland, males aged 5 years and females aged under 5 years are the age groups that are most secure financially, with 100.0% of males and 100.0% of females in these age groups living above the poverty line.
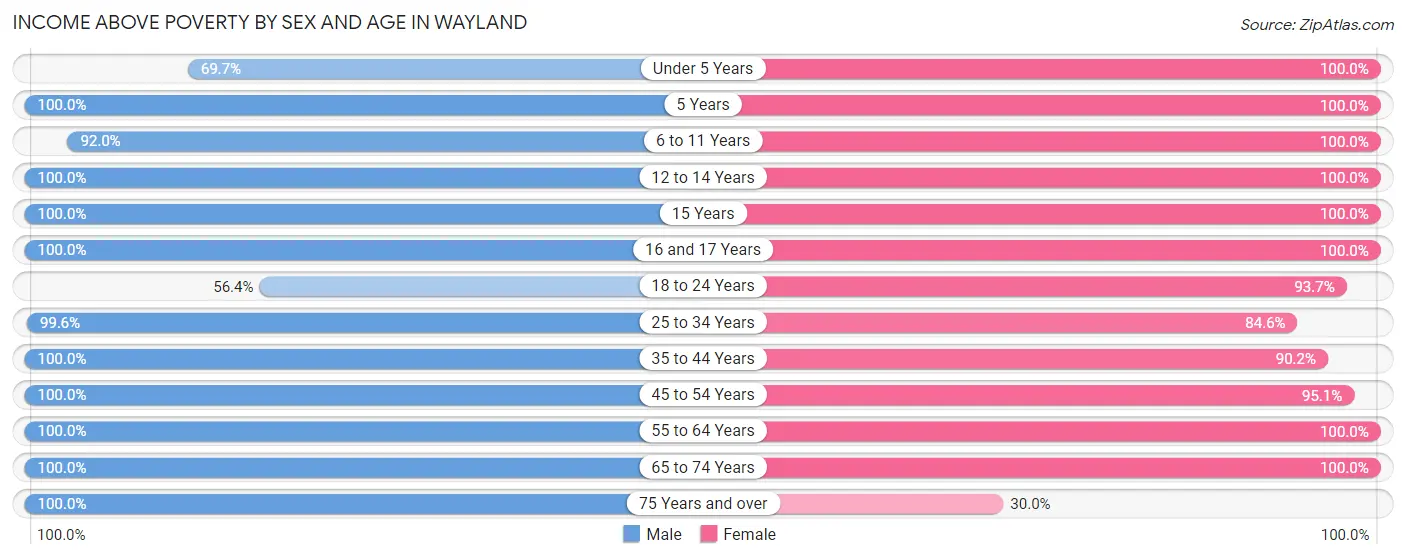
| Age Bracket | Male | Female |
| Under 5 Years | 122 (69.7%) | 207 (100.0%) |
| 5 Years | 30 (100.0%) | 25 (100.0%) |
| 6 to 11 Years | 208 (92.0%) | 102 (100.0%) |
| 12 to 14 Years | 60 (100.0%) | 21 (100.0%) |
| 15 Years | 21 (100.0%) | 13 (100.0%) |
| 16 and 17 Years | 57 (100.0%) | 68 (100.0%) |
| 18 to 24 Years | 127 (56.4%) | 385 (93.7%) |
| 25 to 34 Years | 229 (99.6%) | 345 (84.6%) |
| 35 to 44 Years | 225 (100.0%) | 184 (90.2%) |
| 45 to 54 Years | 361 (100.0%) | 328 (95.1%) |
| 55 to 64 Years | 290 (100.0%) | 132 (100.0%) |
| 65 to 74 Years | 149 (100.0%) | 194 (100.0%) |
| 75 Years and over | 63 (100.0%) | 6 (30.0%) |
| Total | 1,942 (91.9%) | 2,010 (93.5%) |
Income Below Poverty Among Married-Couple Families in Wayland
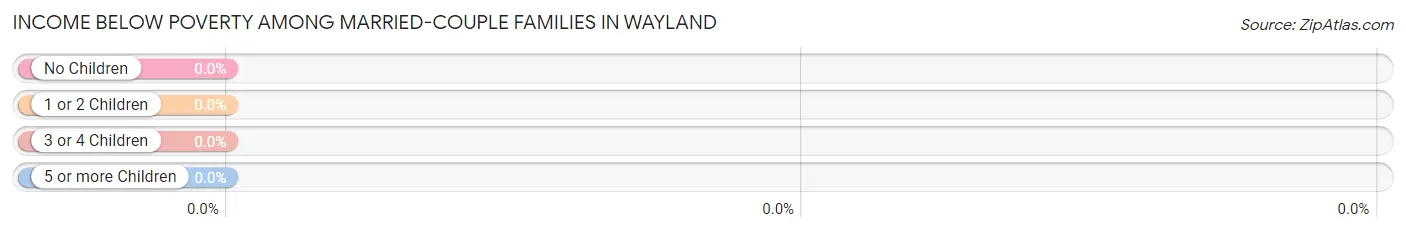
| Children | Above Poverty | Below Poverty |
| No Children | 416 (100.0%) | 0 (0.0%) |
| 1 or 2 Children | 181 (100.0%) | 0 (0.0%) |
| 3 or 4 Children | 75 (100.0%) | 0 (0.0%) |
| 5 or more Children | 0 (0.0%) | 0 (0.0%) |
| Total | 672 (100.0%) | 0 (0.0%) |
Income Below Poverty Among Single-Parent Households in Wayland
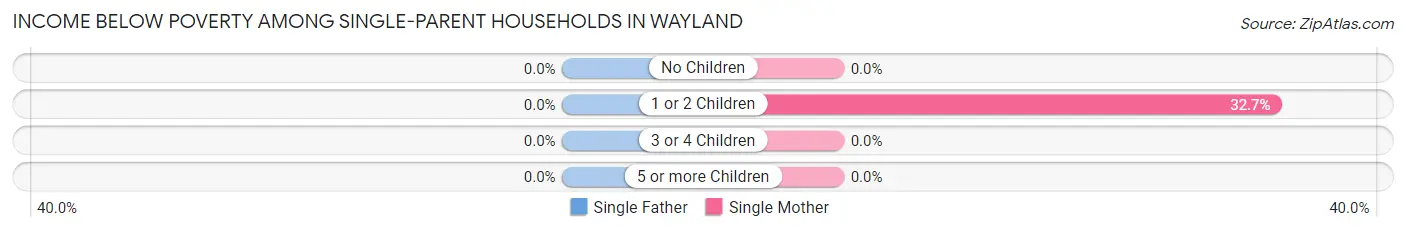
| Children | Single Father | Single Mother |
| No Children | 0 (0.0%) | 0 (0.0%) |
| 1 or 2 Children | 0 (0.0%) | 83 (32.7%) |
| 3 or 4 Children | 0 (0.0%) | 0 (0.0%) |
| 5 or more Children | 0 (0.0%) | 0 (0.0%) |
| Total | 0 (0.0%) | 83 (20.0%) |
Income Below Poverty Among Married-Couple vs Single-Parent Households in Wayland
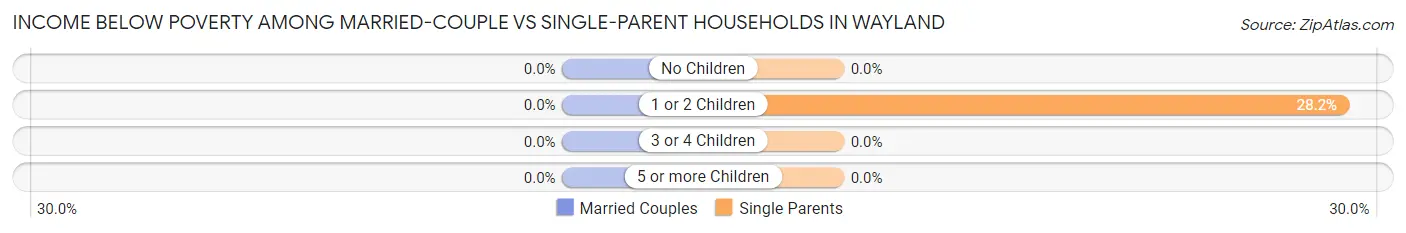
| Children | Married-Couple Families | Single-Parent Households |
| No Children | 0 (0.0%) | 0 (0.0%) |
| 1 or 2 Children | 0 (0.0%) | 83 (28.2%) |
| 3 or 4 Children | 0 (0.0%) | 0 (0.0%) |
| 5 or more Children | 0 (0.0%) | 0 (0.0%) |
| Total | 0 (0.0%) | 83 (16.3%) |
Race in Wayland
The most populous races in Wayland are White / Caucasian (3,870 | 87.7%), Black / African American (222 | 5.0%), and Two or more Races (219 | 5.0%).
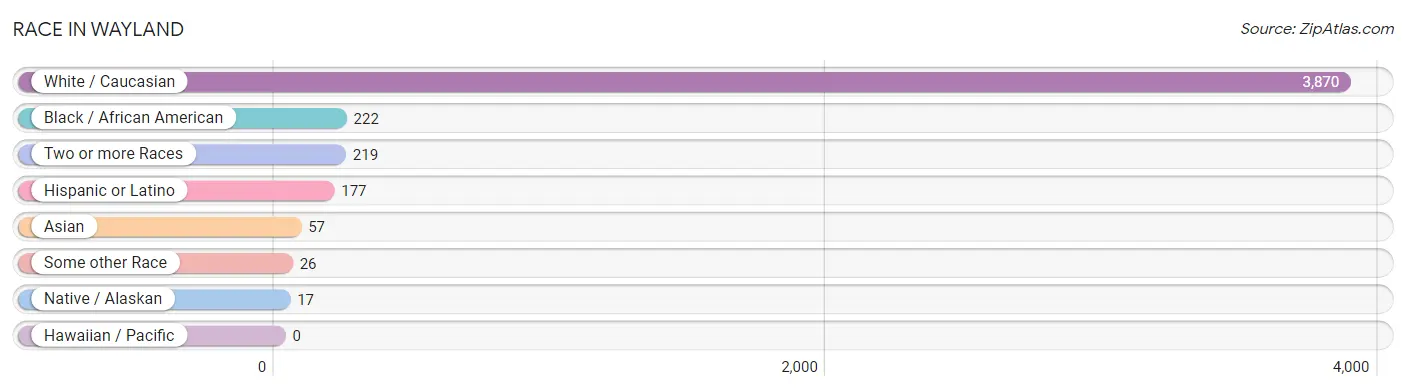
| Race | # Population | % Population |
| Asian | 57 | 1.3% |
| Black / African American | 222 | 5.0% |
| Hawaiian / Pacific | 0 | 0.0% |
| Hispanic or Latino | 177 | 4.0% |
| Native / Alaskan | 17 | 0.4% |
| White / Caucasian | 3,870 | 87.7% |
| Two or more Races | 219 | 5.0% |
| Some other Race | 26 | 0.6% |
| Total | 4,411 | 100.0% |
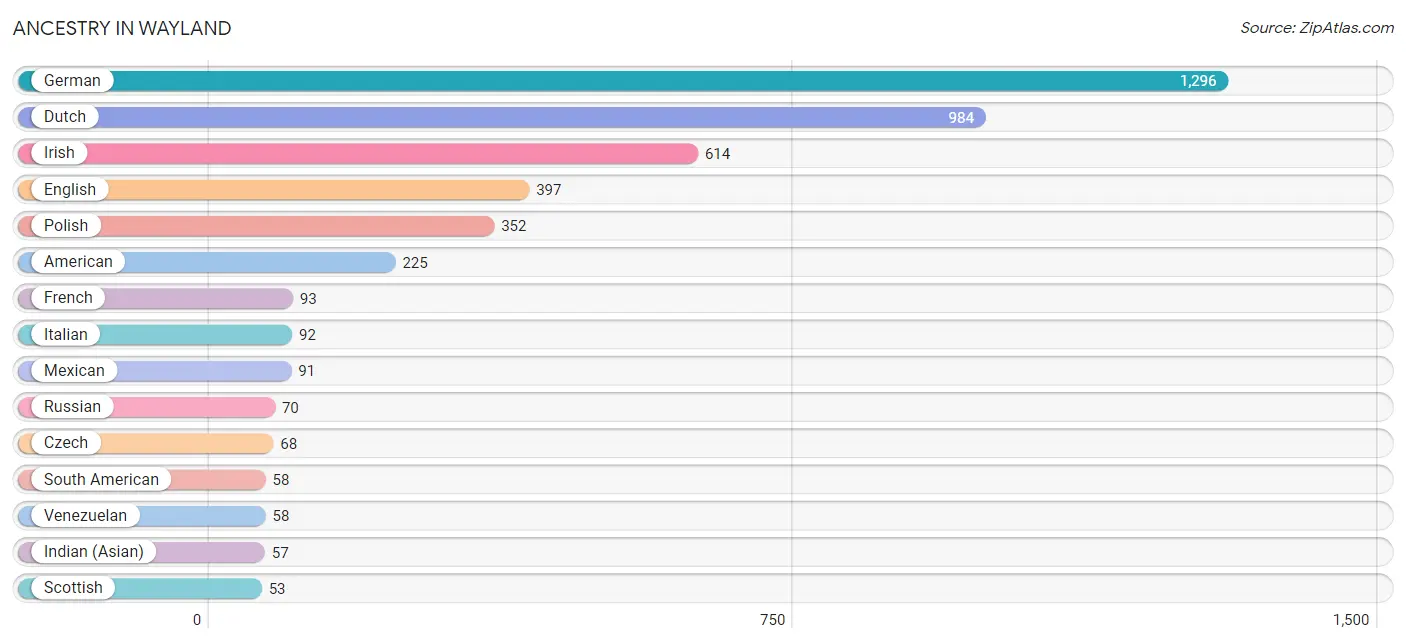
Ancestry in Wayland
The most populous ancestries reported in Wayland are German (1,296 | 29.4%), Dutch (984 | 22.3%), Irish (614 | 13.9%), English (397 | 9.0%), and Polish (352 | 8.0%), together accounting for 82.6% of all Wayland residents.
| Ancestry | # Population | % Population |
| American | 225 | 5.1% |
| Arab | 7 | 0.2% |
| Chippewa | 32 | 0.7% |
| Cuban | 13 | 0.3% |
| Czech | 68 | 1.5% |
| Danish | 8 | 0.2% |
| Dutch | 984 | 22.3% |
| English | 397 | 9.0% |
| Finnish | 27 | 0.6% |
| French | 93 | 2.1% |
| French Canadian | 8 | 0.2% |
| German | 1,296 | 29.4% |
| Greek | 12 | 0.3% |
| Indian (Asian) | 57 | 1.3% |
| Irish | 614 | 13.9% |
| Israeli | 9 | 0.2% |
| Italian | 92 | 2.1% |
| Korean | 14 | 0.3% |
| Lebanese | 7 | 0.2% |
| Mexican | 91 | 2.1% |
| Mexican American Indian | 36 | 0.8% |
| Polish | 352 | 8.0% |
| Puerto Rican | 15 | 0.3% |
| Russian | 70 | 1.6% |
| Scottish | 53 | 1.2% |
| South American | 58 | 1.3% |
| Subsaharan African | 9 | 0.2% |
| Swedish | 12 | 0.3% |
| Ugandan | 9 | 0.2% |
| Venezuelan | 58 | 1.3% | View All 30 Rows |
Immigrants in Wayland
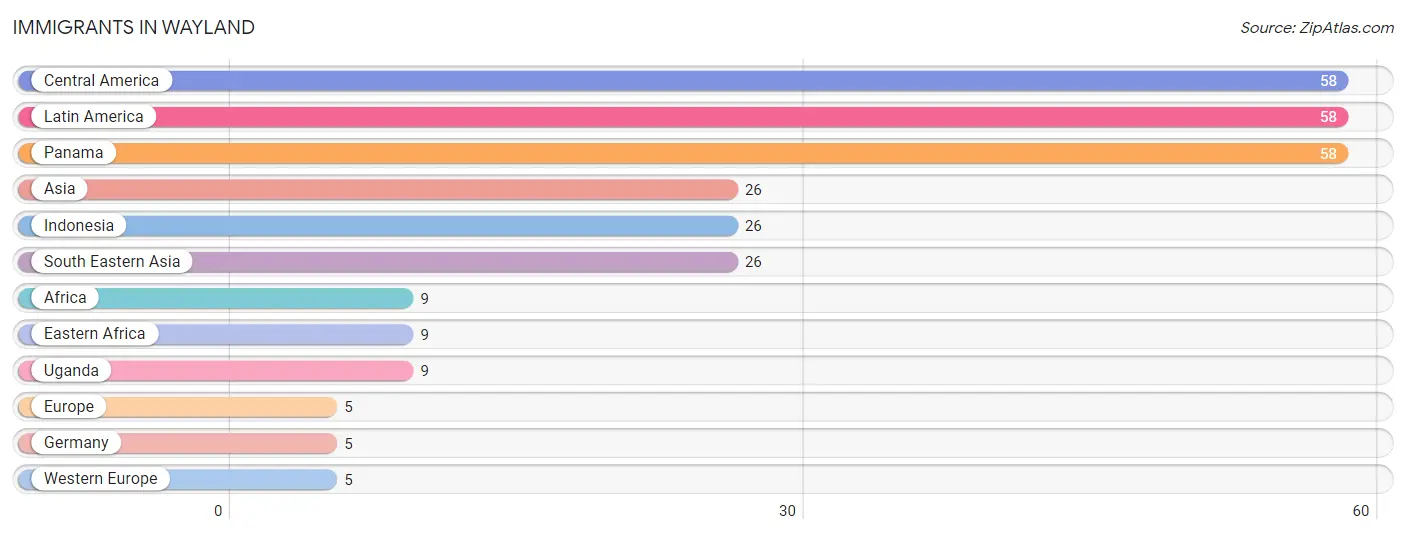
The most numerous immigrant groups reported in Wayland came from Central America (58 | 1.3%), Latin America (58 | 1.3%), Panama (58 | 1.3%), Asia (26 | 0.6%), and Indonesia (26 | 0.6%), together accounting for 5.1% of all Wayland residents.
| Immigration Origin | # Population | % Population |
| Africa | 9 | 0.2% |
| Asia | 26 | 0.6% |
| Central America | 58 | 1.3% |
| Eastern Africa | 9 | 0.2% |
| Europe | 5 | 0.1% |
| Germany | 5 | 0.1% |
| Indonesia | 26 | 0.6% |
| Latin America | 58 | 1.3% |
| Panama | 58 | 1.3% |
| South Eastern Asia | 26 | 0.6% |
| Uganda | 9 | 0.2% |
| Western Europe | 5 | 0.1% | View All 12 Rows |
Sex and Age in Wayland
Sex and Age in Wayland
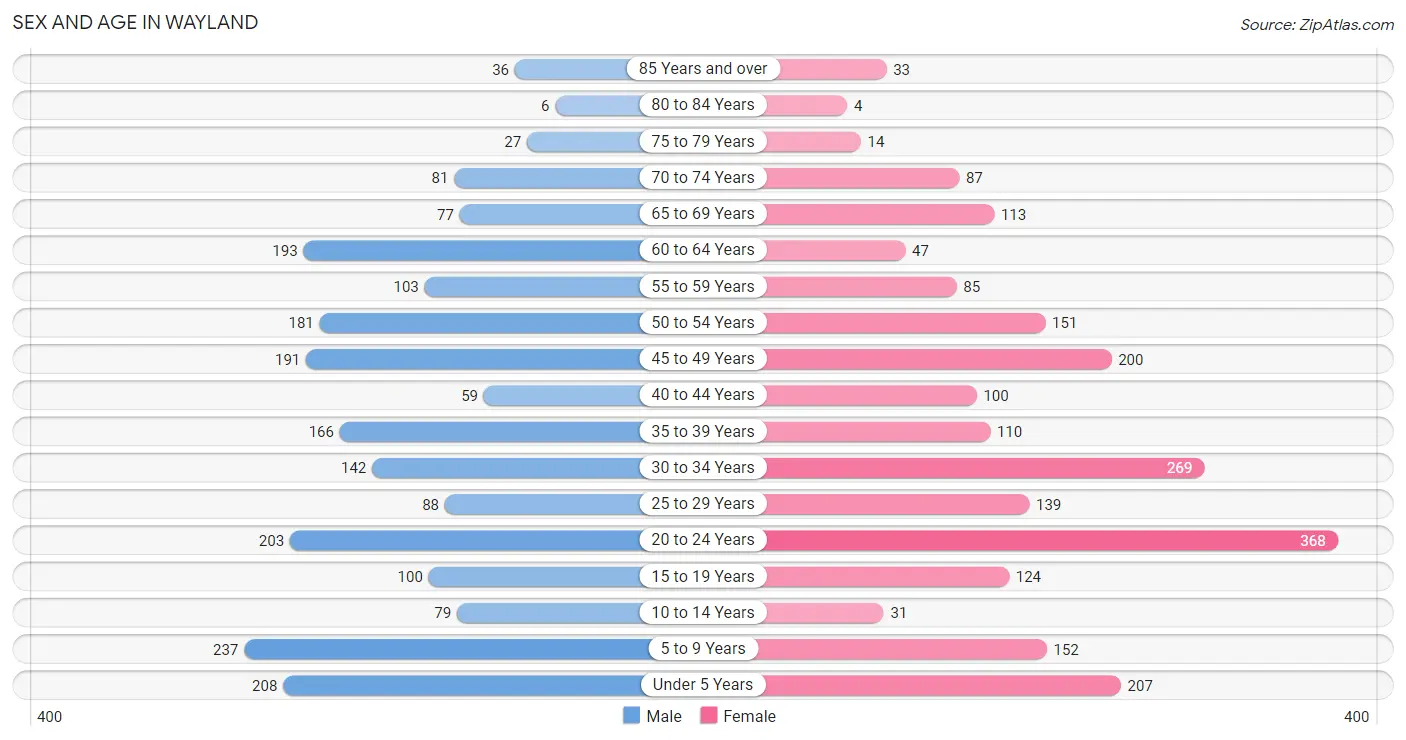
The most populous age groups in Wayland are 5 to 9 Years (237 | 10.9%) for men and 20 to 24 Years (368 | 16.5%) for women.
| Age Bracket | Male | Female |
| Under 5 Years | 208 (9.6%) | 207 (9.3%) |
| 5 to 9 Years | 237 (10.9%) | 152 (6.8%) |
| 10 to 14 Years | 79 (3.6%) | 31 (1.4%) |
| 15 to 19 Years | 100 (4.6%) | 124 (5.6%) |
| 20 to 24 Years | 203 (9.3%) | 368 (16.5%) |
| 25 to 29 Years | 88 (4.0%) | 139 (6.2%) |
| 30 to 34 Years | 142 (6.5%) | 269 (12.0%) |
| 35 to 39 Years | 166 (7.6%) | 110 (4.9%) |
| 40 to 44 Years | 59 (2.7%) | 100 (4.5%) |
| 45 to 49 Years | 191 (8.8%) | 200 (8.9%) |
| 50 to 54 Years | 181 (8.3%) | 151 (6.8%) |
| 55 to 59 Years | 103 (4.7%) | 85 (3.8%) |
| 60 to 64 Years | 193 (8.9%) | 47 (2.1%) |
| 65 to 69 Years | 77 (3.5%) | 113 (5.1%) |
| 70 to 74 Years | 81 (3.7%) | 87 (3.9%) |
| 75 to 79 Years | 27 (1.2%) | 14 (0.6%) |
| 80 to 84 Years | 6 (0.3%) | 4 (0.2%) |
| 85 Years and over | 36 (1.7%) | 33 (1.5%) |
| Total | 2,177 (100.0%) | 2,234 (100.0%) |
Families and Households in Wayland
Median Family Size in Wayland
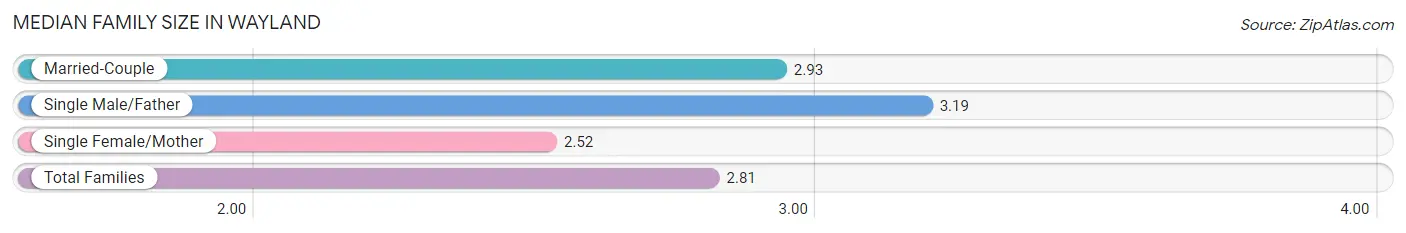
The median family size in Wayland is 2.81 persons per family, with single male/father families (94 | 8.0%) accounting for the largest median family size of 3.19 persons per family. On the other hand, single female/mother families (415 | 35.1%) represent the smallest median family size with 2.52 persons per family.
| Family Type | # Families | Family Size |
| Married-Couple | 672 (56.9%) | 2.93 |
| Single Male/Father | 94 (8.0%) | 3.19 |
| Single Female/Mother | 415 (35.1%) | 2.52 |
| Total Families | 1,181 (100.0%) | 2.81 |
Median Household Size in Wayland
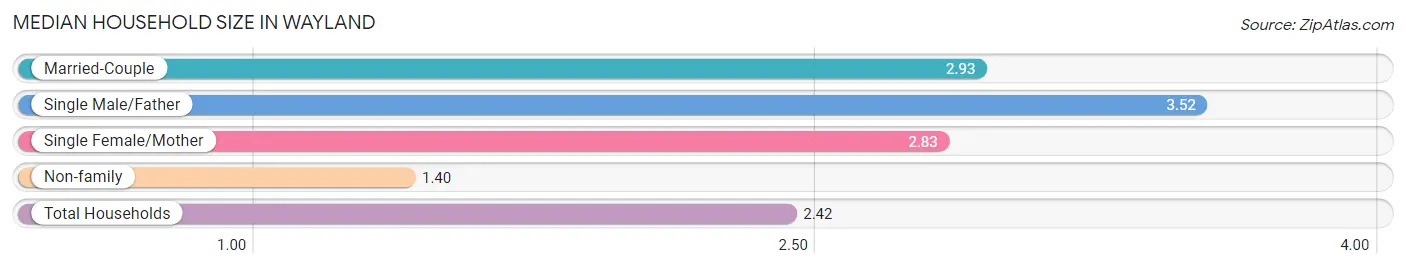
The median household size in Wayland is 2.42 persons per household, with single male/father households (94 | 5.3%) accounting for the largest median household size of 3.52 persons per household. non-family households (603 | 33.8%) represent the smallest median household size with 1.40 persons per household.
| Household Type | # Households | Household Size |
| Married-Couple | 672 (37.7%) | 2.93 |
| Single Male/Father | 94 (5.3%) | 3.52 |
| Single Female/Mother | 415 (23.3%) | 2.83 |
| Non-family | 603 (33.8%) | 1.40 |
| Total Households | 1,784 (100.0%) | 2.42 |
Household Size by Marriage Status in Wayland
Out of a total of 1,784 households in Wayland, 1,181 (66.2%) are family households, while 603 (33.8%) are nonfamily households. The most numerous type of family households are 2-person households, comprising 557, and the most common type of nonfamily households are 1-person households, comprising 415.
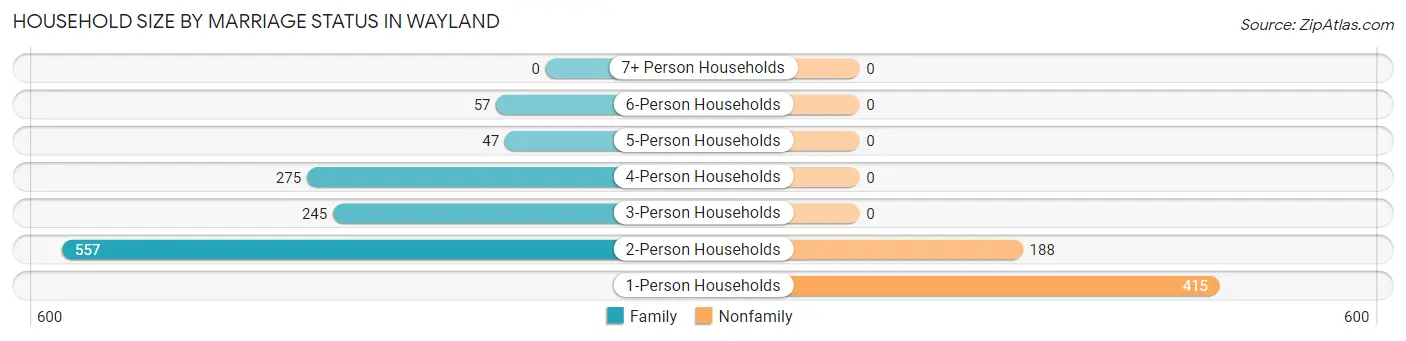
| Household Size | Family Households | Nonfamily Households |
| 1-Person Households | - | 415 (23.3%) |
| 2-Person Households | 557 (31.2%) | 188 (10.5%) |
| 3-Person Households | 245 (13.7%) | 0 (0.0%) |
| 4-Person Households | 275 (15.4%) | 0 (0.0%) |
| 5-Person Households | 47 (2.6%) | 0 (0.0%) |
| 6-Person Households | 57 (3.2%) | 0 (0.0%) |
| 7+ Person Households | 0 (0.0%) | 0 (0.0%) |
| Total | 1,181 (66.2%) | 603 (33.8%) |
Female Fertility in Wayland
Fertility by Age in Wayland
Average fertility rate in Wayland is 65.0 births per 1,000 women. Women in the age bracket of 20 to 34 years have the highest fertility rate with 93.0 births per 1,000 women. Women in the age bracket of 20 to 34 years acount for 81.8% of all women with births.
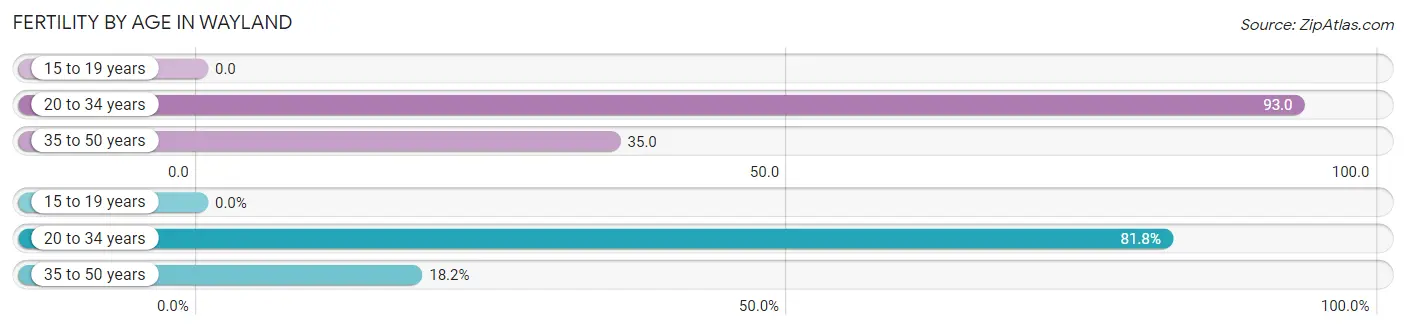
| Age Bracket | Women with Births | Births / 1,000 Women |
| 15 to 19 years | 0 (0.0%) | 0.0 |
| 20 to 34 years | 72 (81.8%) | 93.0 |
| 35 to 50 years | 16 (18.2%) | 35.0 |
| Total | 88 (100.0%) | 65.0 |
Fertility by Age by Marriage Status in Wayland
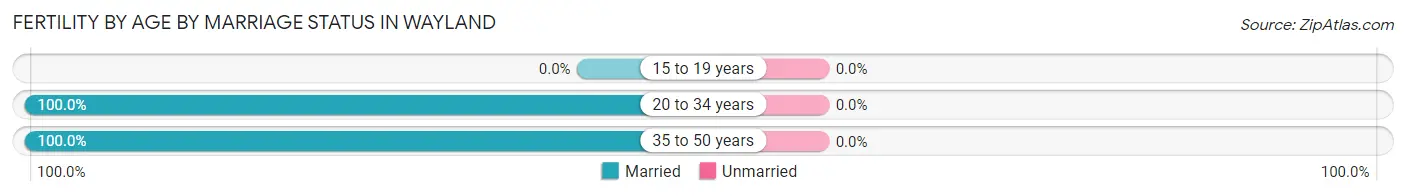
| Age Bracket | Married | Unmarried |
| 15 to 19 years | 0 (0.0%) | 0 (0.0%) |
| 20 to 34 years | 72 (100.0%) | 0 (0.0%) |
| 35 to 50 years | 16 (100.0%) | 0 (0.0%) |
| Total | 88 (100.0%) | 0 (0.0%) |
Fertility by Education in Wayland
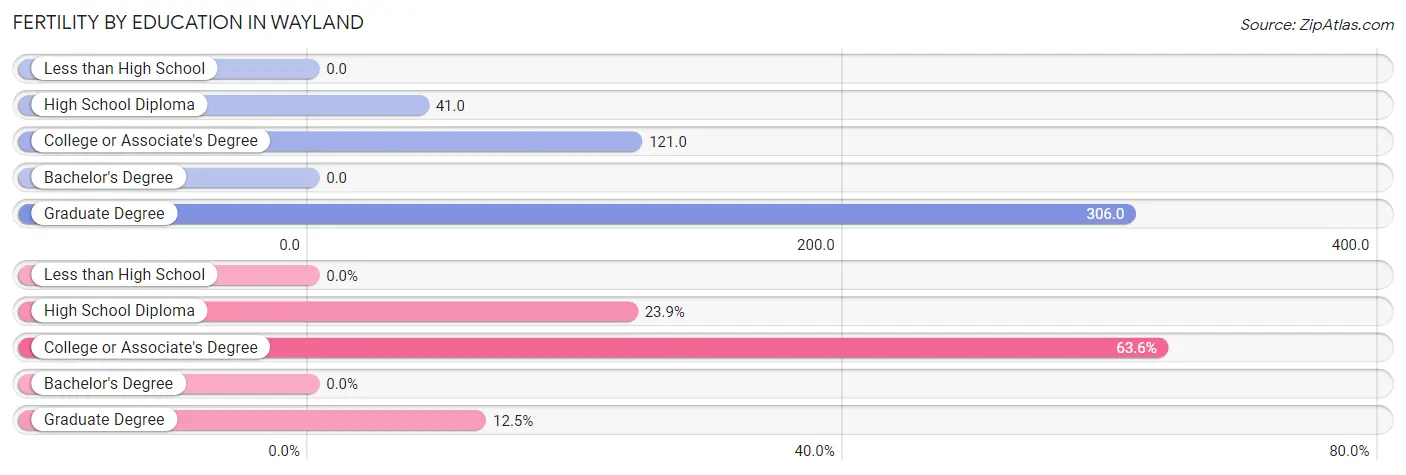
| Educational Attainment | Women with Births | Births / 1,000 Women |
| Less than High School | 0 (0.0%) | 0.0 |
| High School Diploma | 21 (23.9%) | 41.0 |
| College or Associate's Degree | 56 (63.6%) | 121.0 |
| Bachelor's Degree | 0 (0.0%) | 0.0 |
| Graduate Degree | 11 (12.5%) | 306.0 |
| Total | 88 (100.0%) | 65.0 |
Fertility by Education by Marriage Status in Wayland
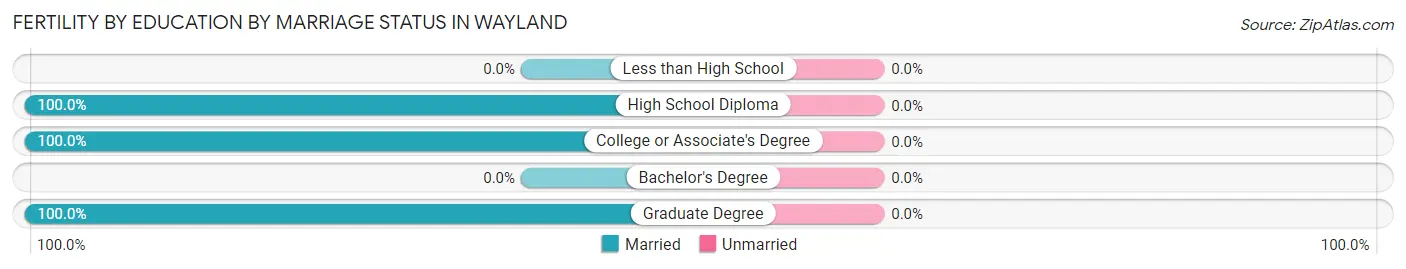
| Educational Attainment | Married | Unmarried |
| Less than High School | 0 (0.0%) | 0 (0.0%) |
| High School Diploma | 21 (100.0%) | 0 (0.0%) |
| College or Associate's Degree | 56 (100.0%) | 0 (0.0%) |
| Bachelor's Degree | 0 (0.0%) | 0 (0.0%) |
| Graduate Degree | 11 (100.0%) | 0 (0.0%) |
| Total | 88 (100.0%) | 0 (0.0%) |
Employment Characteristics in Wayland
Employment by Class of Employer in Wayland
Among the 2,434 employed individuals in Wayland, private company employees (1,954 | 80.3%), not-for-profit organizations (297 | 12.2%), and self-employed (not incorporated) (91 | 3.7%) make up the most common classes of employment.
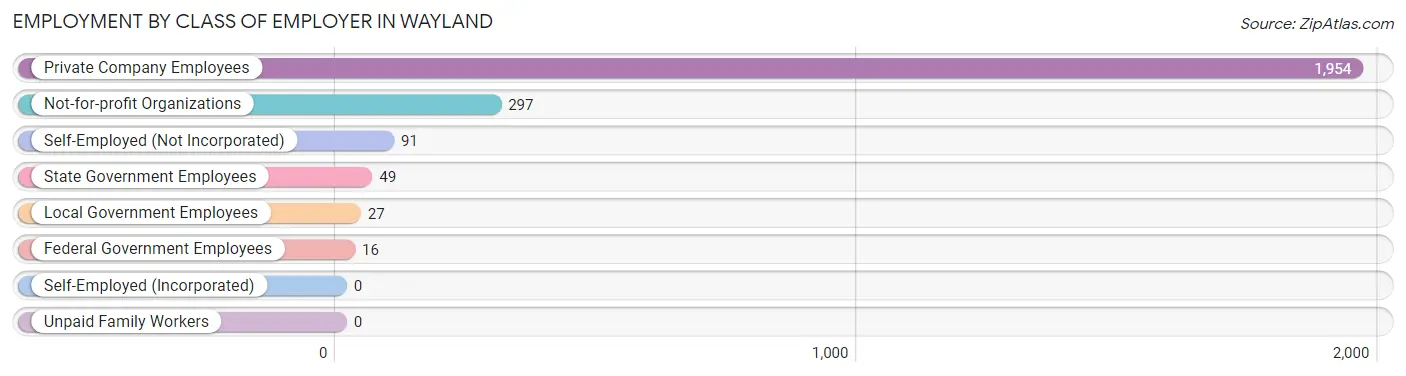
| Employer Class | # Employees | % Employees |
| Private Company Employees | 1,954 | 80.3% |
| Self-Employed (Incorporated) | 0 | 0.0% |
| Self-Employed (Not Incorporated) | 91 | 3.7% |
| Not-for-profit Organizations | 297 | 12.2% |
| Local Government Employees | 27 | 1.1% |
| State Government Employees | 49 | 2.0% |
| Federal Government Employees | 16 | 0.7% |
| Unpaid Family Workers | 0 | 0.0% |
| Total | 2,434 | 100.0% |
Employment Status by Age in Wayland
According to the labor force statistics for Wayland, out of the total population over 16 years of age (3,463), 73.1% or 2,531 individuals are in the labor force, with 3.0% or 76 of them unemployed. The age group with the highest labor force participation rate is 25 to 29 years, with 97.4% or 221 individuals in the labor force. Within the labor force, the 60 to 64 years age range has the highest percentage of unemployed individuals, with 21.9% or 50 of them being unemployed.
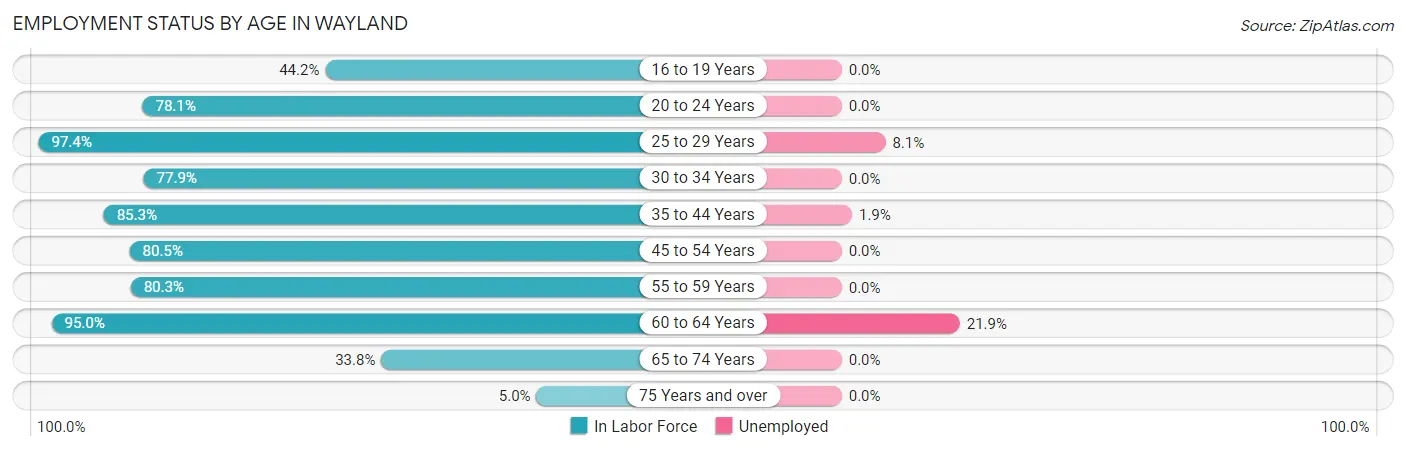
| Age Bracket | In Labor Force | Unemployed |
| 16 to 19 Years | 84 (44.2%) | 0 (0.0%) |
| 20 to 24 Years | 446 (78.1%) | 0 (0.0%) |
| 25 to 29 Years | 221 (97.4%) | 18 (8.1%) |
| 30 to 34 Years | 320 (77.9%) | 0 (0.0%) |
| 35 to 44 Years | 371 (85.3%) | 7 (1.9%) |
| 45 to 54 Years | 582 (80.5%) | 0 (0.0%) |
| 55 to 59 Years | 151 (80.3%) | 0 (0.0%) |
| 60 to 64 Years | 228 (95.0%) | 50 (21.9%) |
| 65 to 74 Years | 121 (33.8%) | 0 (0.0%) |
| 75 Years and over | 6 (5.0%) | 0 (0.0%) |
| Total | 2,531 (73.1%) | 76 (3.0%) |
Employment Status by Educational Attainment in Wayland
According to labor force statistics for Wayland, 84.2% of individuals (1,873) out of the total population between 25 and 64 years of age (2,224) are in the labor force, with 4.0% or 75 of them being unemployed. The group with the highest labor force participation rate are those with the educational attainment of high school diploma, with 87.9% or 777 individuals in the labor force. Within the labor force, individuals with high school diploma education have the highest percentage of unemployment, with 7.3% or 57 of them being unemployed.
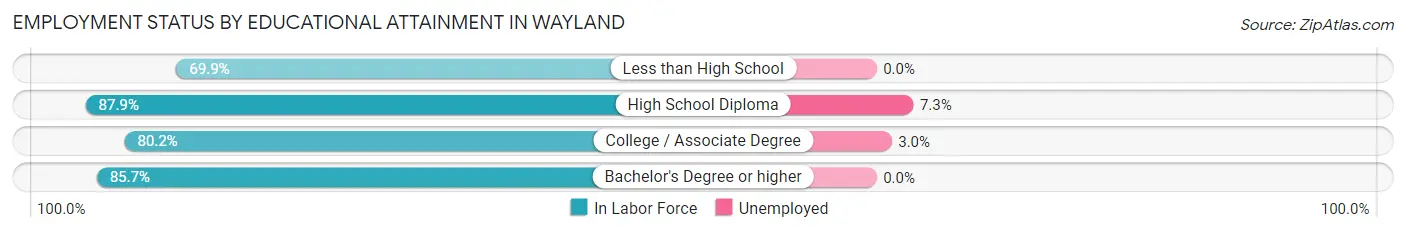
| Educational Attainment | In Labor Force | Unemployed |
| Less than High School | 51 (69.9%) | 0 (0.0%) |
| High School Diploma | 777 (87.9%) | 65 (7.3%) |
| College / Associate Degree | 595 (80.2%) | 22 (3.0%) |
| Bachelor's Degree or higher | 450 (85.7%) | 0 (0.0%) |
| Total | 1,873 (84.2%) | 89 (4.0%) |
Employment Occupations by Sex in Wayland
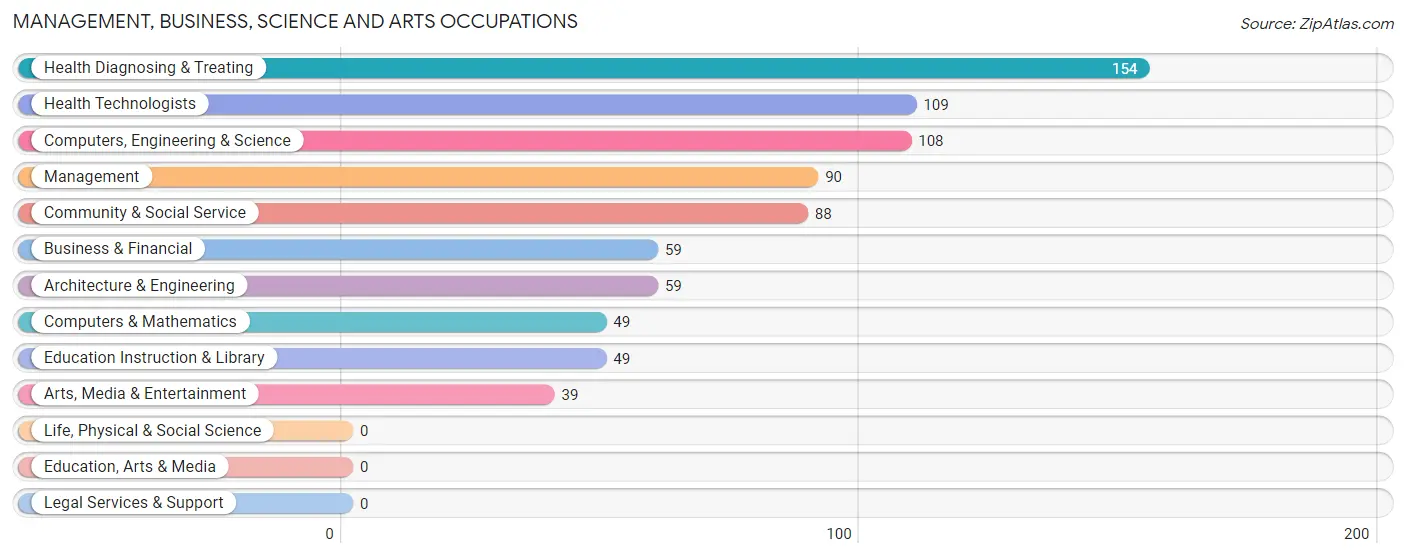
Management, Business, Science and Arts Occupations
The most common Management, Business, Science and Arts occupations in Wayland are Health Diagnosing & Treating (154 | 6.3%), Health Technologists (109 | 4.4%), Computers, Engineering & Science (108 | 4.4%), Management (90 | 3.7%), and Community & Social Service (88 | 3.6%).
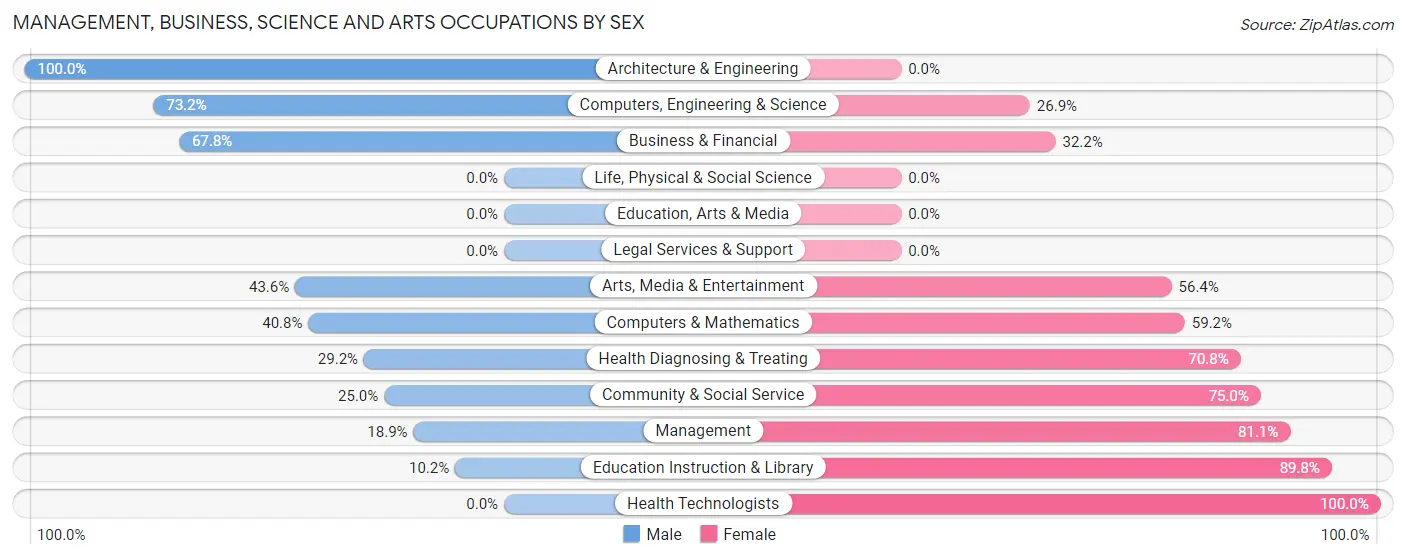
Management, Business, Science and Arts Occupations by Sex
Within the Management, Business, Science and Arts occupations in Wayland, the most male-oriented occupations are Architecture & Engineering (100.0%), Computers, Engineering & Science (73.2%), and Business & Financial (67.8%), while the most female-oriented occupations are Health Technologists (100.0%), Education Instruction & Library (89.8%), and Management (81.1%).
| Occupation | Male | Female |
| Management | 17 (18.9%) | 73 (81.1%) |
| Business & Financial | 40 (67.8%) | 19 (32.2%) |
| Computers, Engineering & Science | 79 (73.2%) | 29 (26.9%) |
| Computers & Mathematics | 20 (40.8%) | 29 (59.2%) |
| Architecture & Engineering | 59 (100.0%) | 0 (0.0%) |
| Life, Physical & Social Science | 0 (0.0%) | 0 (0.0%) |
| Community & Social Service | 22 (25.0%) | 66 (75.0%) |
| Education, Arts & Media | 0 (0.0%) | 0 (0.0%) |
| Legal Services & Support | 0 (0.0%) | 0 (0.0%) |
| Education Instruction & Library | 5 (10.2%) | 44 (89.8%) |
| Arts, Media & Entertainment | 17 (43.6%) | 22 (56.4%) |
| Health Diagnosing & Treating | 45 (29.2%) | 109 (70.8%) |
| Health Technologists | 0 (0.0%) | 109 (100.0%) |
| Total (Category) | 203 (40.7%) | 296 (59.3%) |
| Total (Overall) | 1,277 (52.1%) | 1,173 (47.9%) |
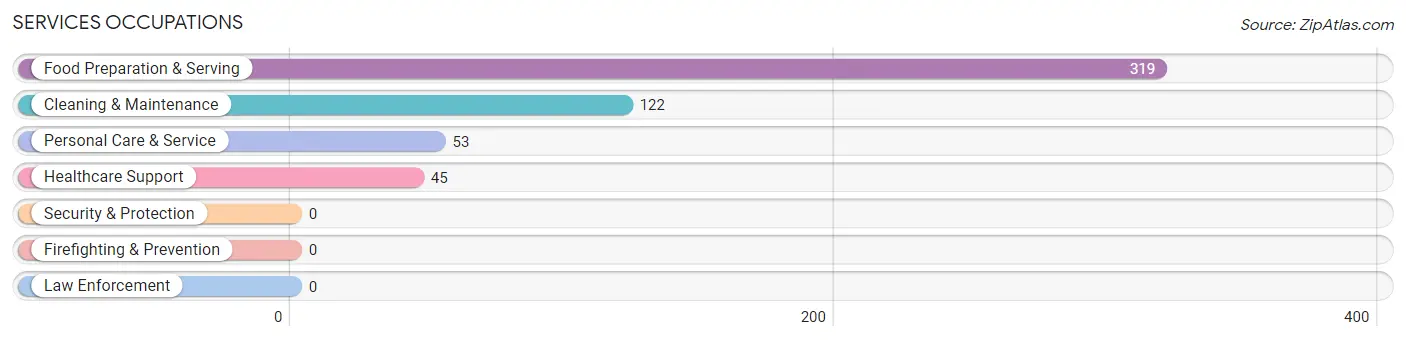
Services Occupations
The most common Services occupations in Wayland are Food Preparation & Serving (319 | 13.0%), Cleaning & Maintenance (122 | 5.0%), Personal Care & Service (53 | 2.2%), and Healthcare Support (45 | 1.8%).
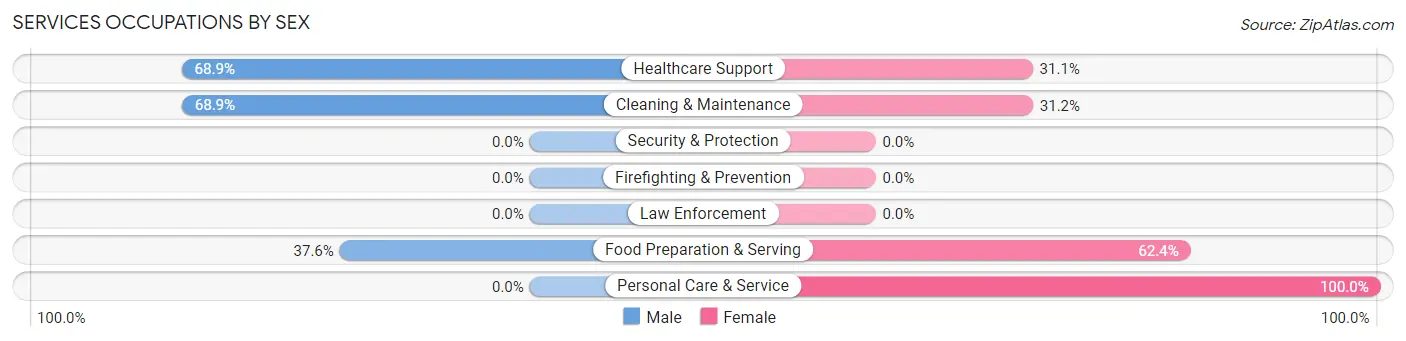
Services Occupations by Sex
Within the Services occupations in Wayland, the most male-oriented occupations are Healthcare Support (68.9%), Cleaning & Maintenance (68.9%), and Food Preparation & Serving (37.6%), while the most female-oriented occupations are Personal Care & Service (100.0%), Food Preparation & Serving (62.4%), and Cleaning & Maintenance (31.1%).
| Occupation | Male | Female |
| Healthcare Support | 31 (68.9%) | 14 (31.1%) |
| Security & Protection | 0 (0.0%) | 0 (0.0%) |
| Firefighting & Prevention | 0 (0.0%) | 0 (0.0%) |
| Law Enforcement | 0 (0.0%) | 0 (0.0%) |
| Food Preparation & Serving | 120 (37.6%) | 199 (62.4%) |
| Cleaning & Maintenance | 84 (68.9%) | 38 (31.1%) |
| Personal Care & Service | 0 (0.0%) | 53 (100.0%) |
| Total (Category) | 235 (43.6%) | 304 (56.4%) |
| Total (Overall) | 1,277 (52.1%) | 1,173 (47.9%) |
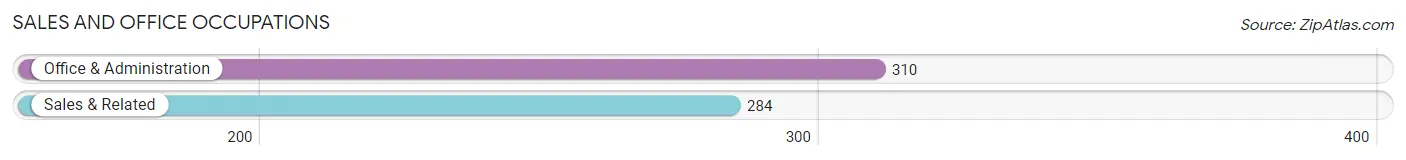
Sales and Office Occupations
The most common Sales and Office occupations in Wayland are Office & Administration (310 | 12.7%), and Sales & Related (284 | 11.6%).
Sales and Office Occupations by Sex
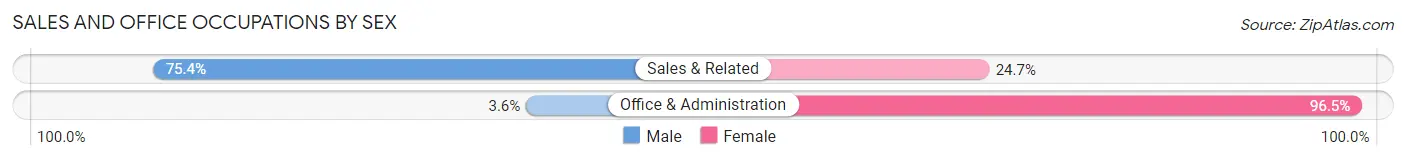
| Occupation | Male | Female |
| Sales & Related | 214 (75.3%) | 70 (24.6%) |
| Office & Administration | 11 (3.5%) | 299 (96.5%) |
| Total (Category) | 225 (37.9%) | 369 (62.1%) |
| Total (Overall) | 1,277 (52.1%) | 1,173 (47.9%) |
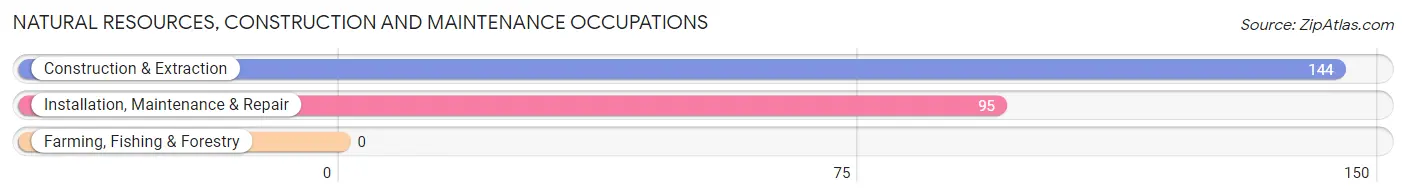
Natural Resources, Construction and Maintenance Occupations
The most common Natural Resources, Construction and Maintenance occupations in Wayland are Construction & Extraction (144 | 5.9%), and Installation, Maintenance & Repair (95 | 3.9%).
Natural Resources, Construction and Maintenance Occupations by Sex
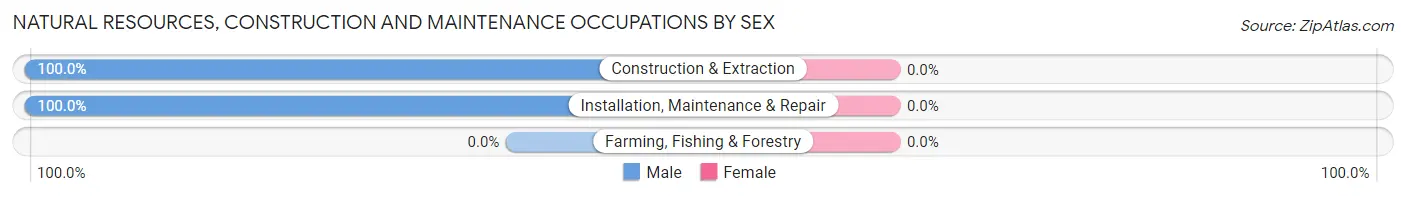
| Occupation | Male | Female |
| Farming, Fishing & Forestry | 0 (0.0%) | 0 (0.0%) |
| Construction & Extraction | 144 (100.0%) | 0 (0.0%) |
| Installation, Maintenance & Repair | 95 (100.0%) | 0 (0.0%) |
| Total (Category) | 239 (100.0%) | 0 (0.0%) |
| Total (Overall) | 1,277 (52.1%) | 1,173 (47.9%) |
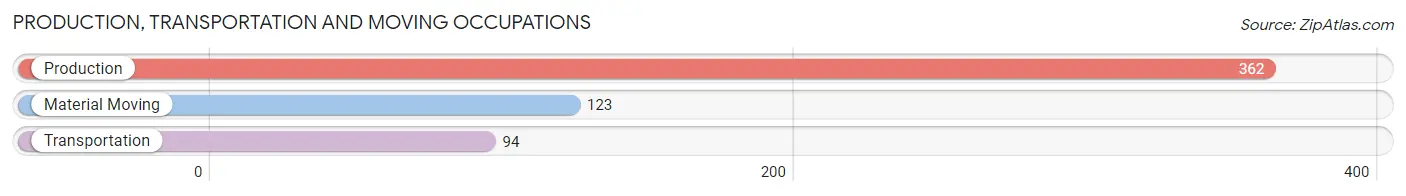
Production, Transportation and Moving Occupations
The most common Production, Transportation and Moving occupations in Wayland are Production (362 | 14.8%), Material Moving (123 | 5.0%), and Transportation (94 | 3.8%).
Production, Transportation and Moving Occupations by Sex
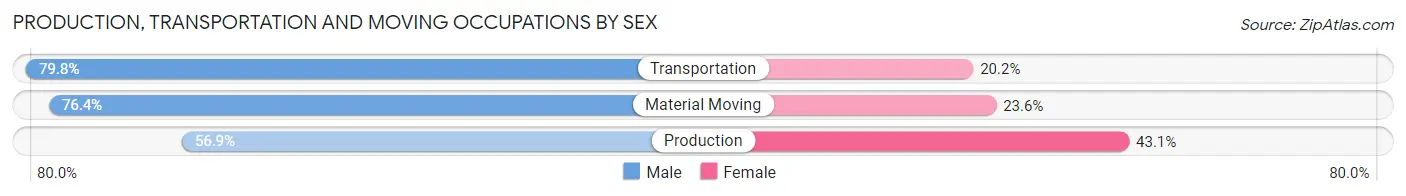
| Occupation | Male | Female |
| Production | 206 (56.9%) | 156 (43.1%) |
| Transportation | 75 (79.8%) | 19 (20.2%) |
| Material Moving | 94 (76.4%) | 29 (23.6%) |
| Total (Category) | 375 (64.8%) | 204 (35.2%) |
| Total (Overall) | 1,277 (52.1%) | 1,173 (47.9%) |
Employment Industries by Sex in Wayland
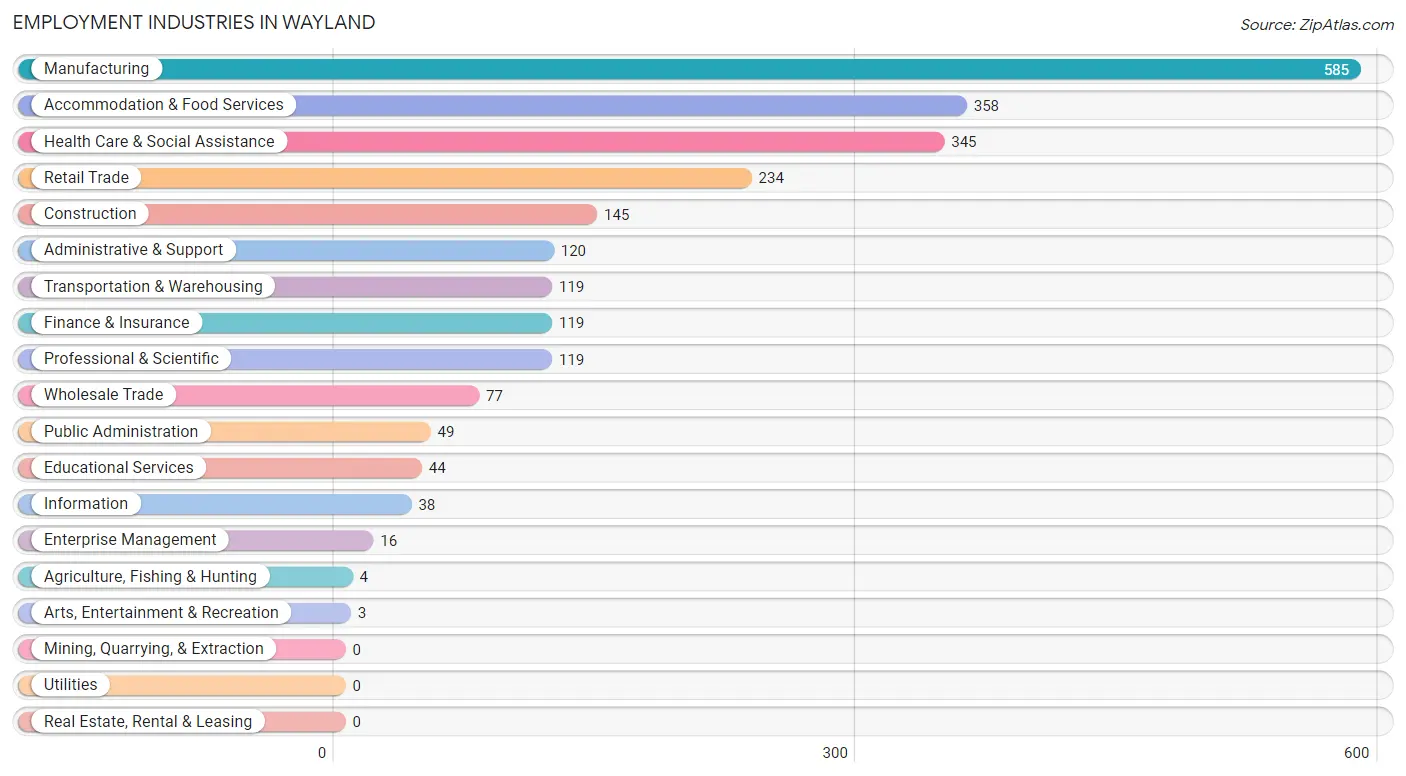
Employment Industries in Wayland
The major employment industries in Wayland include Manufacturing (585 | 23.9%), Accommodation & Food Services (358 | 14.6%), Health Care & Social Assistance (345 | 14.1%), Retail Trade (234 | 9.6%), and Construction (145 | 5.9%).
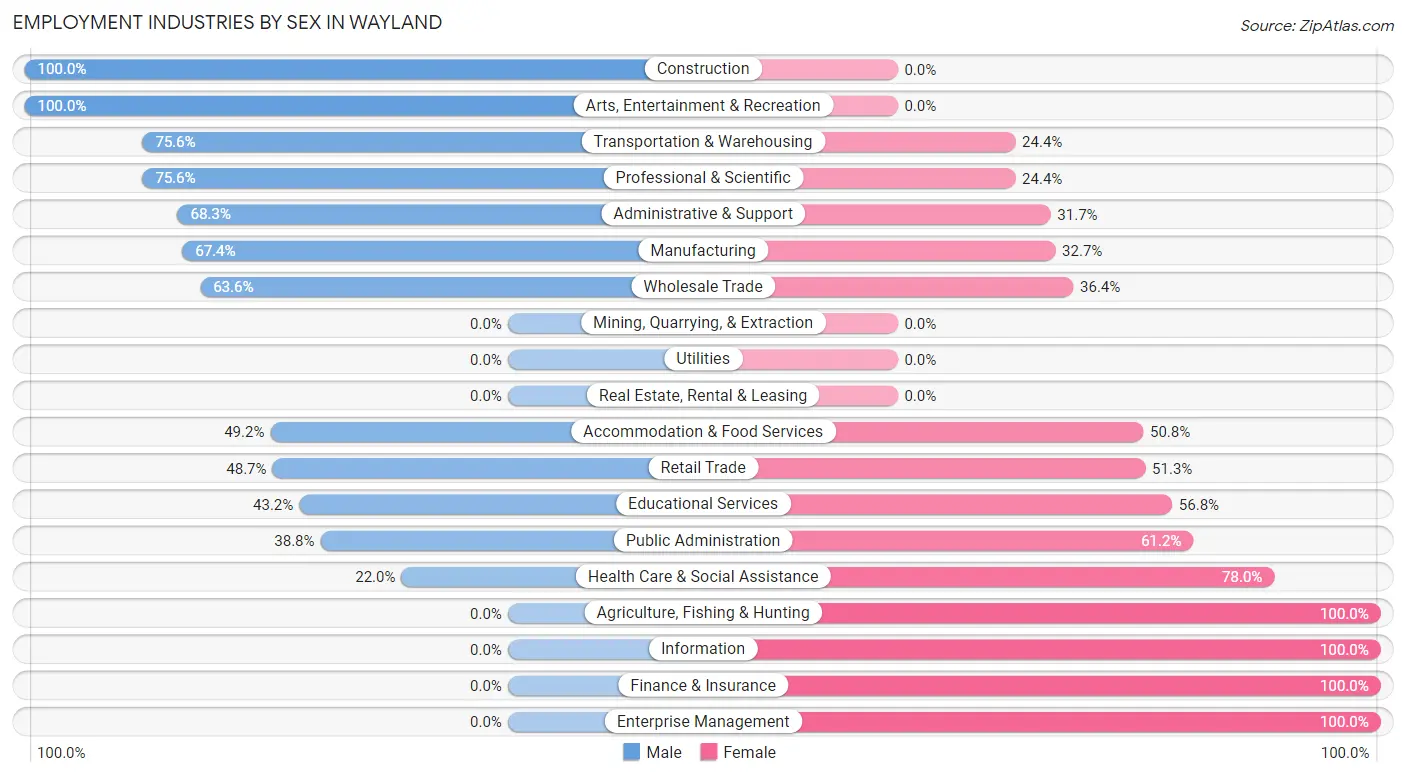
Employment Industries by Sex in Wayland
The Wayland industries that see more men than women are Construction (100.0%), Arts, Entertainment & Recreation (100.0%), and Transportation & Warehousing (75.6%), whereas the industries that tend to have a higher number of women are Agriculture, Fishing & Hunting (100.0%), Information (100.0%), and Finance & Insurance (100.0%).
| Industry | Male | Female |
| Agriculture, Fishing & Hunting | 0 (0.0%) | 4 (100.0%) |
| Mining, Quarrying, & Extraction | 0 (0.0%) | 0 (0.0%) |
| Construction | 145 (100.0%) | 0 (0.0%) |
| Manufacturing | 394 (67.3%) | 191 (32.7%) |
| Wholesale Trade | 49 (63.6%) | 28 (36.4%) |
| Retail Trade | 114 (48.7%) | 120 (51.3%) |
| Transportation & Warehousing | 90 (75.6%) | 29 (24.4%) |
| Utilities | 0 (0.0%) | 0 (0.0%) |
| Information | 0 (0.0%) | 38 (100.0%) |
| Finance & Insurance | 0 (0.0%) | 119 (100.0%) |
| Real Estate, Rental & Leasing | 0 (0.0%) | 0 (0.0%) |
| Professional & Scientific | 90 (75.6%) | 29 (24.4%) |
| Enterprise Management | 0 (0.0%) | 16 (100.0%) |
| Administrative & Support | 82 (68.3%) | 38 (31.7%) |
| Educational Services | 19 (43.2%) | 25 (56.8%) |
| Health Care & Social Assistance | 76 (22.0%) | 269 (78.0%) |
| Arts, Entertainment & Recreation | 3 (100.0%) | 0 (0.0%) |
| Accommodation & Food Services | 176 (49.2%) | 182 (50.8%) |
| Public Administration | 19 (38.8%) | 30 (61.2%) |
| Total | 1,277 (52.1%) | 1,173 (47.9%) |
Education in Wayland
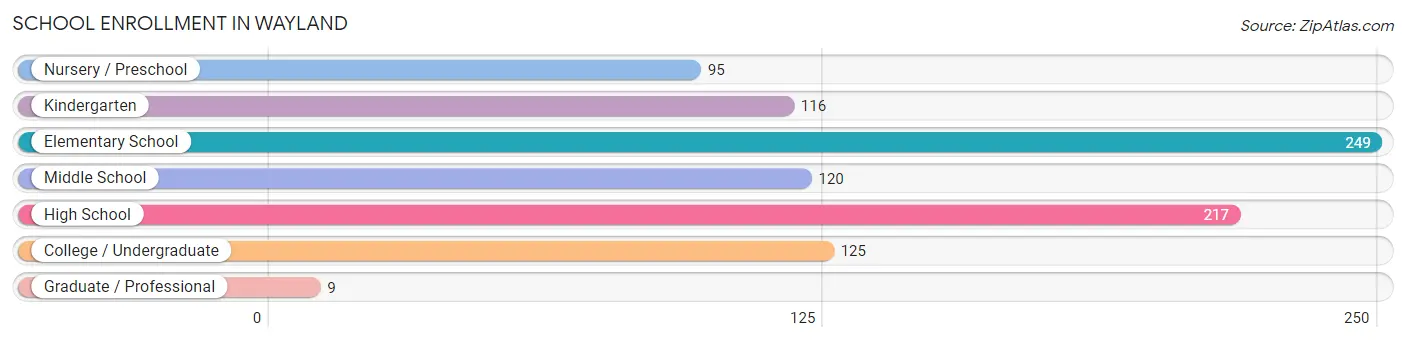
School Enrollment in Wayland
The most common levels of schooling among the 931 students in Wayland are elementary school (249 | 26.8%), high school (217 | 23.3%), and college / undergraduate (125 | 13.4%).
| School Level | # Students | % Students |
| Nursery / Preschool | 95 | 10.2% |
| Kindergarten | 116 | 12.5% |
| Elementary School | 249 | 26.8% |
| Middle School | 120 | 12.9% |
| High School | 217 | 23.3% |
| College / Undergraduate | 125 | 13.4% |
| Graduate / Professional | 9 | 1.0% |
| Total | 931 | 100.0% |
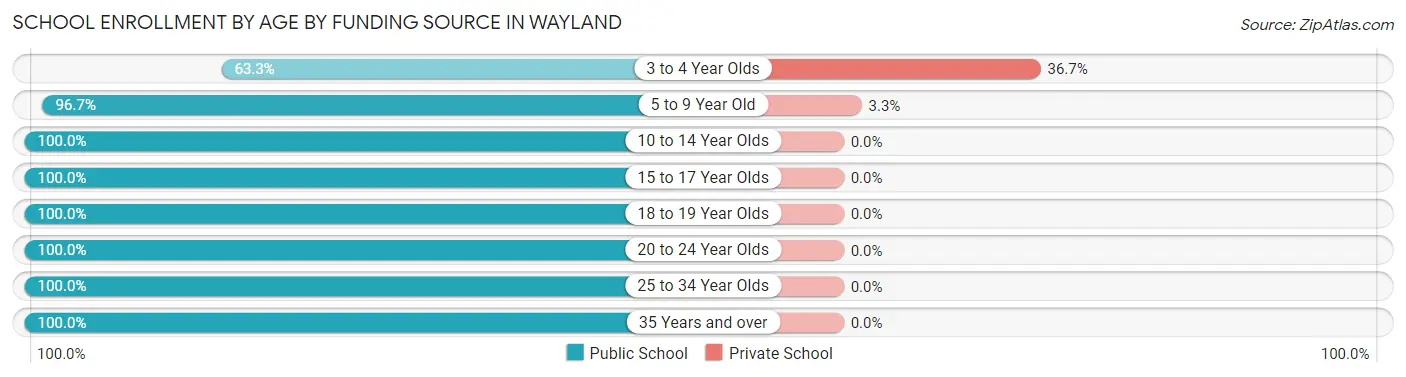
School Enrollment by Age by Funding Source in Wayland
Out of a total of 931 students who are enrolled in schools in Wayland, 46 (4.9%) attend a private institution, while the remaining 885 (95.1%) are enrolled in public schools. The age group of 3 to 4 year olds has the highest likelihood of being enrolled in private schools, with 33 (36.7% in the age bracket) enrolled. Conversely, the age group of 10 to 14 year olds has the lowest likelihood of being enrolled in a private school, with 110 (100.0% in the age bracket) attending a public institution.
| Age Bracket | Public School | Private School |
| 3 to 4 Year Olds | 57 (63.3%) | 33 (36.7%) |
| 5 to 9 Year Old | 376 (96.7%) | 13 (3.3%) |
| 10 to 14 Year Olds | 110 (100.0%) | 0 (0.0%) |
| 15 to 17 Year Olds | 159 (100.0%) | 0 (0.0%) |
| 18 to 19 Year Olds | 49 (100.0%) | 0 (0.0%) |
| 20 to 24 Year Olds | 94 (100.0%) | 0 (0.0%) |
| 25 to 34 Year Olds | 21 (100.0%) | 0 (0.0%) |
| 35 Years and over | 19 (100.0%) | 0 (0.0%) |
| Total | 885 (95.1%) | 46 (4.9%) |
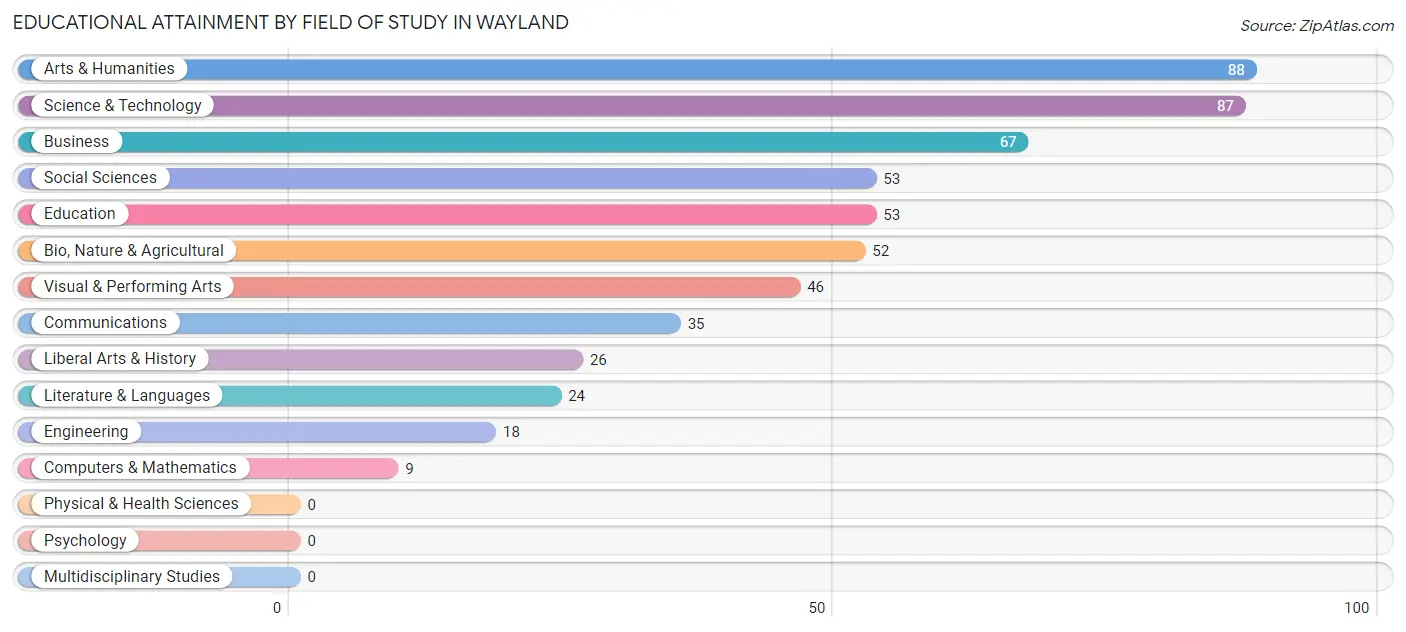
Educational Attainment by Field of Study in Wayland
Arts & humanities (88 | 15.8%), science & technology (87 | 15.6%), business (67 | 12.0%), social sciences (53 | 9.5%), and education (53 | 9.5%) are the most common fields of study among 558 individuals in Wayland who have obtained a bachelor's degree or higher.
| Field of Study | # Graduates | % Graduates |
| Computers & Mathematics | 9 | 1.6% |
| Bio, Nature & Agricultural | 52 | 9.3% |
| Physical & Health Sciences | 0 | 0.0% |
| Psychology | 0 | 0.0% |
| Social Sciences | 53 | 9.5% |
| Engineering | 18 | 3.2% |
| Multidisciplinary Studies | 0 | 0.0% |
| Science & Technology | 87 | 15.6% |
| Business | 67 | 12.0% |
| Education | 53 | 9.5% |
| Literature & Languages | 24 | 4.3% |
| Liberal Arts & History | 26 | 4.7% |
| Visual & Performing Arts | 46 | 8.2% |
| Communications | 35 | 6.3% |
| Arts & Humanities | 88 | 15.8% |
| Total | 558 | 100.0% |
Transportation & Commute in Wayland
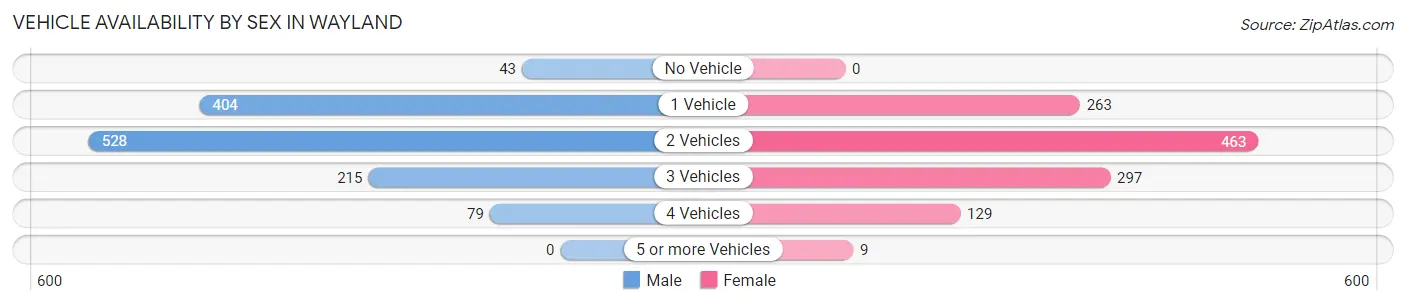
Vehicle Availability by Sex in Wayland
The most prevalent vehicle ownership categories in Wayland are males with 2 vehicles (528, accounting for 41.6%) and females with 2 vehicles (463, making up 45.5%).
| Vehicles Available | Male | Female |
| No Vehicle | 43 (3.4%) | 0 (0.0%) |
| 1 Vehicle | 404 (31.8%) | 263 (22.7%) |
| 2 Vehicles | 528 (41.6%) | 463 (39.9%) |
| 3 Vehicles | 215 (16.9%) | 297 (25.6%) |
| 4 Vehicles | 79 (6.2%) | 129 (11.1%) |
| 5 or more Vehicles | 0 (0.0%) | 9 (0.8%) |
| Total | 1,269 (100.0%) | 1,161 (100.0%) |
Commute Time in Wayland
The most frequently occuring commute durations in Wayland are 5 to 9 minutes (521 commuters, 23.3%), 20 to 24 minutes (417 commuters, 18.6%), and 30 to 34 minutes (370 commuters, 16.5%).
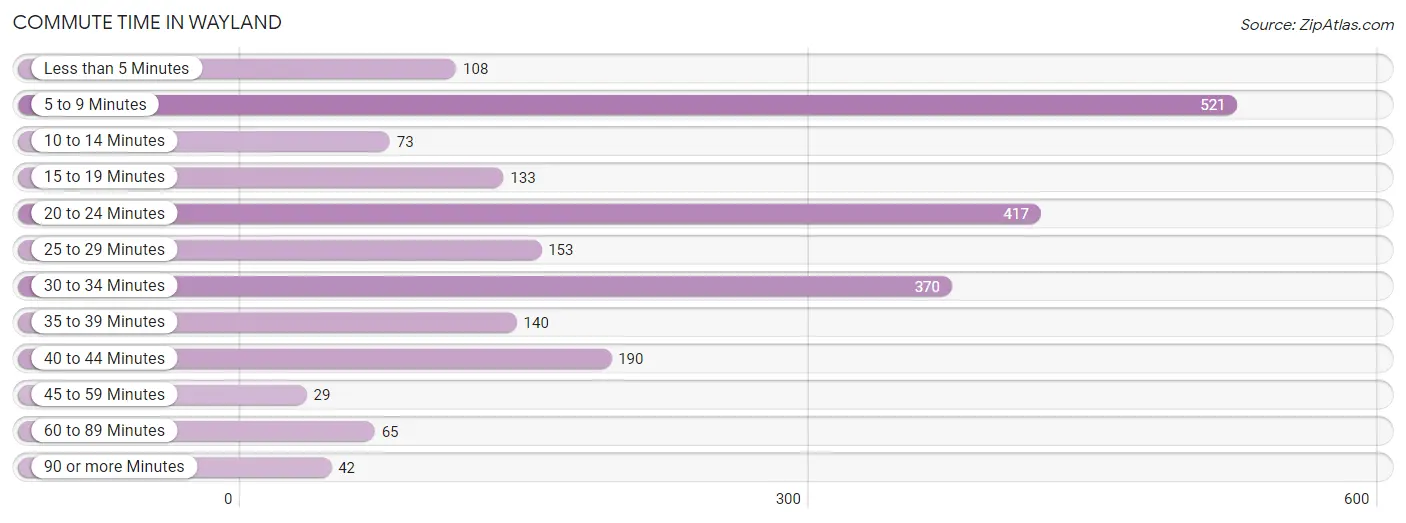
| Commute Time | # Commuters | % Commuters |
| Less than 5 Minutes | 108 | 4.8% |
| 5 to 9 Minutes | 521 | 23.3% |
| 10 to 14 Minutes | 73 | 3.3% |
| 15 to 19 Minutes | 133 | 5.9% |
| 20 to 24 Minutes | 417 | 18.6% |
| 25 to 29 Minutes | 153 | 6.8% |
| 30 to 34 Minutes | 370 | 16.5% |
| 35 to 39 Minutes | 140 | 6.2% |
| 40 to 44 Minutes | 190 | 8.5% |
| 45 to 59 Minutes | 29 | 1.3% |
| 60 to 89 Minutes | 65 | 2.9% |
| 90 or more Minutes | 42 | 1.9% |
Commute Time by Sex in Wayland
The most common commute times in Wayland are 30 to 34 minutes (240 commuters, 19.9%) for males and 5 to 9 minutes (319 commuters, 30.8%) for females.
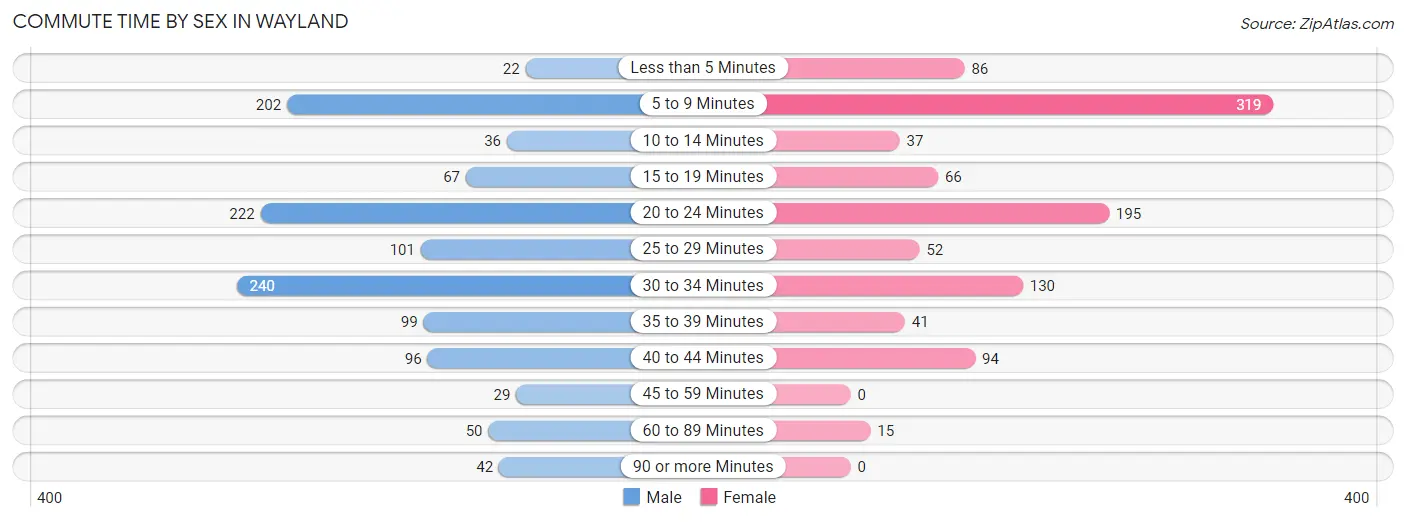
| Commute Time | Male | Female |
| Less than 5 Minutes | 22 (1.8%) | 86 (8.3%) |
| 5 to 9 Minutes | 202 (16.8%) | 319 (30.8%) |
| 10 to 14 Minutes | 36 (3.0%) | 37 (3.6%) |
| 15 to 19 Minutes | 67 (5.6%) | 66 (6.4%) |
| 20 to 24 Minutes | 222 (18.4%) | 195 (18.8%) |
| 25 to 29 Minutes | 101 (8.4%) | 52 (5.0%) |
| 30 to 34 Minutes | 240 (19.9%) | 130 (12.6%) |
| 35 to 39 Minutes | 99 (8.2%) | 41 (4.0%) |
| 40 to 44 Minutes | 96 (8.0%) | 94 (9.1%) |
| 45 to 59 Minutes | 29 (2.4%) | 0 (0.0%) |
| 60 to 89 Minutes | 50 (4.2%) | 15 (1.5%) |
| 90 or more Minutes | 42 (3.5%) | 0 (0.0%) |
Time of Departure to Work by Sex in Wayland
The most frequent times of departure to work in Wayland are 12:00 AM to 4:59 AM (244, 20.2%) for males and 8:00 AM to 8:29 AM (205, 19.8%) for females.
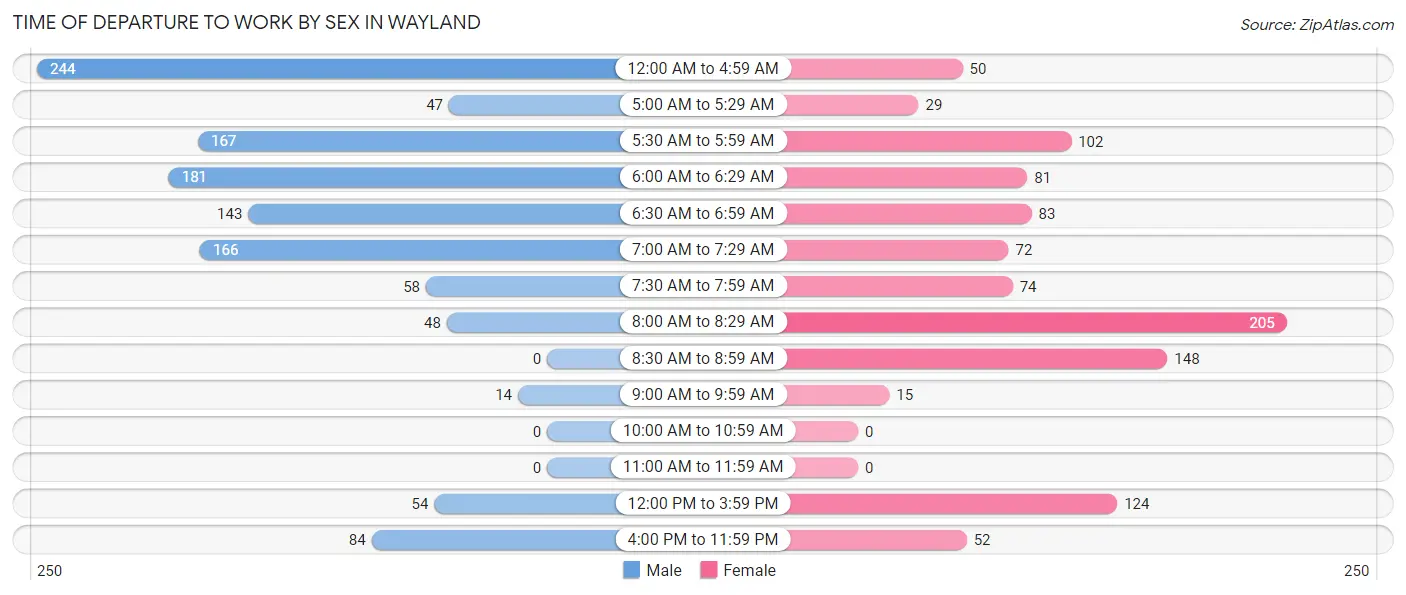
| Time of Departure | Male | Female |
| 12:00 AM to 4:59 AM | 244 (20.2%) | 50 (4.8%) |
| 5:00 AM to 5:29 AM | 47 (3.9%) | 29 (2.8%) |
| 5:30 AM to 5:59 AM | 167 (13.9%) | 102 (9.9%) |
| 6:00 AM to 6:29 AM | 181 (15.0%) | 81 (7.8%) |
| 6:30 AM to 6:59 AM | 143 (11.9%) | 83 (8.0%) |
| 7:00 AM to 7:29 AM | 166 (13.8%) | 72 (7.0%) |
| 7:30 AM to 7:59 AM | 58 (4.8%) | 74 (7.1%) |
| 8:00 AM to 8:29 AM | 48 (4.0%) | 205 (19.8%) |
| 8:30 AM to 8:59 AM | 0 (0.0%) | 148 (14.3%) |
| 9:00 AM to 9:59 AM | 14 (1.2%) | 15 (1.5%) |
| 10:00 AM to 10:59 AM | 0 (0.0%) | 0 (0.0%) |
| 11:00 AM to 11:59 AM | 0 (0.0%) | 0 (0.0%) |
| 12:00 PM to 3:59 PM | 54 (4.5%) | 124 (12.0%) |
| 4:00 PM to 11:59 PM | 84 (7.0%) | 52 (5.0%) |
| Total | 1,206 (100.0%) | 1,035 (100.0%) |
Housing Occupancy in Wayland
Occupancy by Ownership in Wayland
Of the total 1,784 dwellings in Wayland, owner-occupied units account for 1,200 (67.3%), while renter-occupied units make up 584 (32.7%).
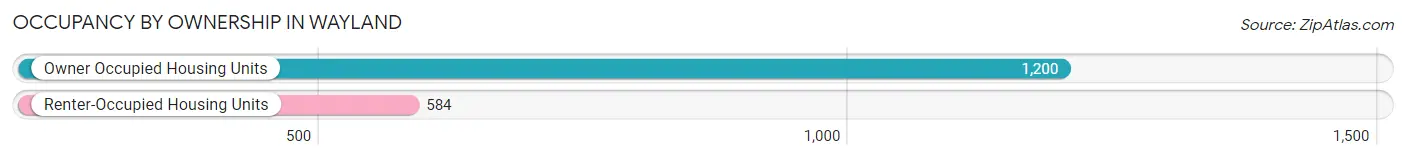
| Occupancy | # Housing Units | % Housing Units |
| Owner Occupied Housing Units | 1,200 | 67.3% |
| Renter-Occupied Housing Units | 584 | 32.7% |
| Total Occupied Housing Units | 1,784 | 100.0% |
Occupancy by Household Size in Wayland
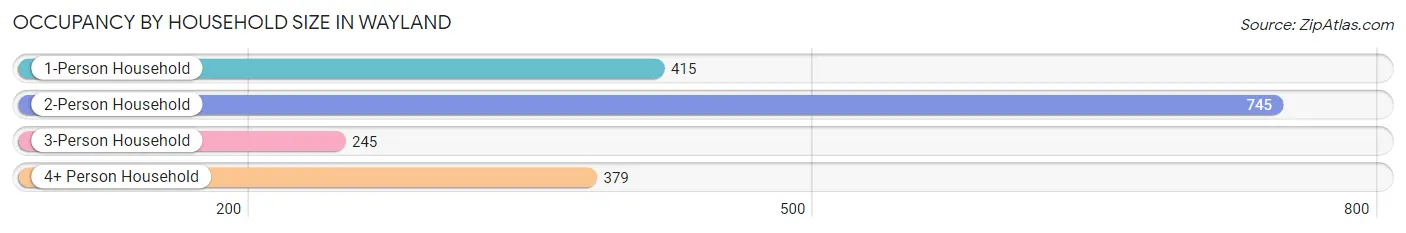
| Household Size | # Housing Units | % Housing Units |
| 1-Person Household | 415 | 23.3% |
| 2-Person Household | 745 | 41.8% |
| 3-Person Household | 245 | 13.7% |
| 4+ Person Household | 379 | 21.2% |
| Total Housing Units | 1,784 | 100.0% |
Occupancy by Ownership by Household Size in Wayland
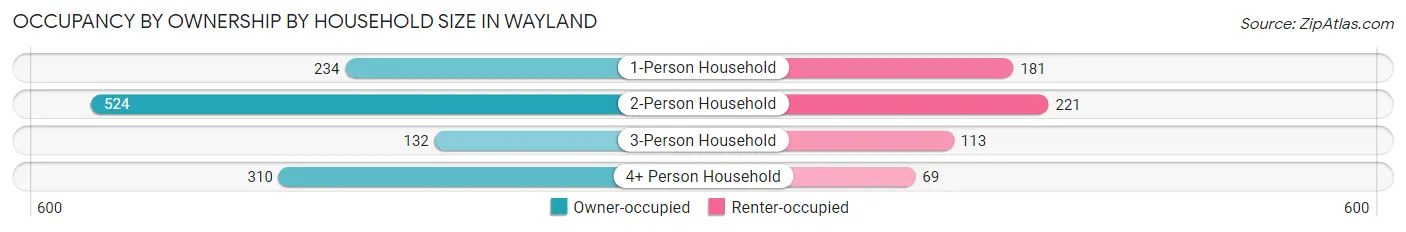
| Household Size | Owner-occupied | Renter-occupied |
| 1-Person Household | 234 (56.4%) | 181 (43.6%) |
| 2-Person Household | 524 (70.3%) | 221 (29.7%) |
| 3-Person Household | 132 (53.9%) | 113 (46.1%) |
| 4+ Person Household | 310 (81.8%) | 69 (18.2%) |
| Total Housing Units | 1,200 (67.3%) | 584 (32.7%) |
Occupancy by Educational Attainment in Wayland
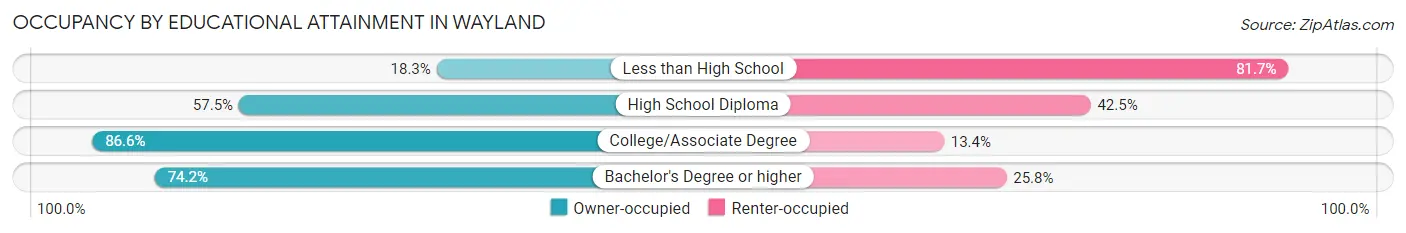
| Household Size | Owner-occupied | Renter-occupied |
| Less than High School | 26 (18.3%) | 116 (81.7%) |
| High School Diploma | 398 (57.5%) | 294 (42.5%) |
| College/Associate Degree | 497 (86.6%) | 77 (13.4%) |
| Bachelor's Degree or higher | 279 (74.2%) | 97 (25.8%) |
Occupancy by Age of Householder in Wayland
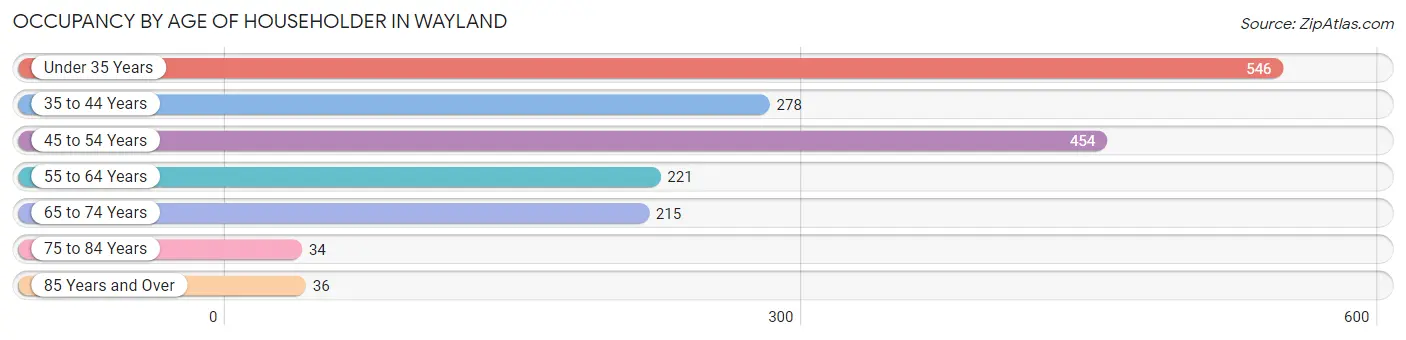
| Age Bracket | # Households | % Households |
| Under 35 Years | 546 | 30.6% |
| 35 to 44 Years | 278 | 15.6% |
| 45 to 54 Years | 454 | 25.5% |
| 55 to 64 Years | 221 | 12.4% |
| 65 to 74 Years | 215 | 12.0% |
| 75 to 84 Years | 34 | 1.9% |
| 85 Years and Over | 36 | 2.0% |
| Total | 1,784 | 100.0% |
Housing Finances in Wayland
Median Income by Occupancy in Wayland
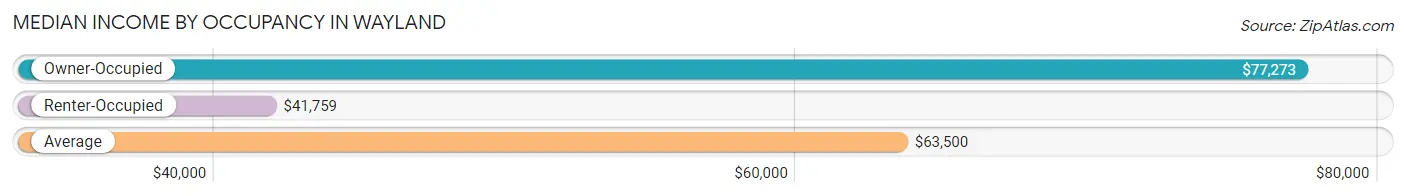
| Occupancy Type | # Households | Median Income |
| Owner-Occupied | 1,200 (67.3%) | $77,273 |
| Renter-Occupied | 584 (32.7%) | $41,759 |
| Average | 1,784 (100.0%) | $63,500 |
Occupancy by Householder Income Bracket in Wayland
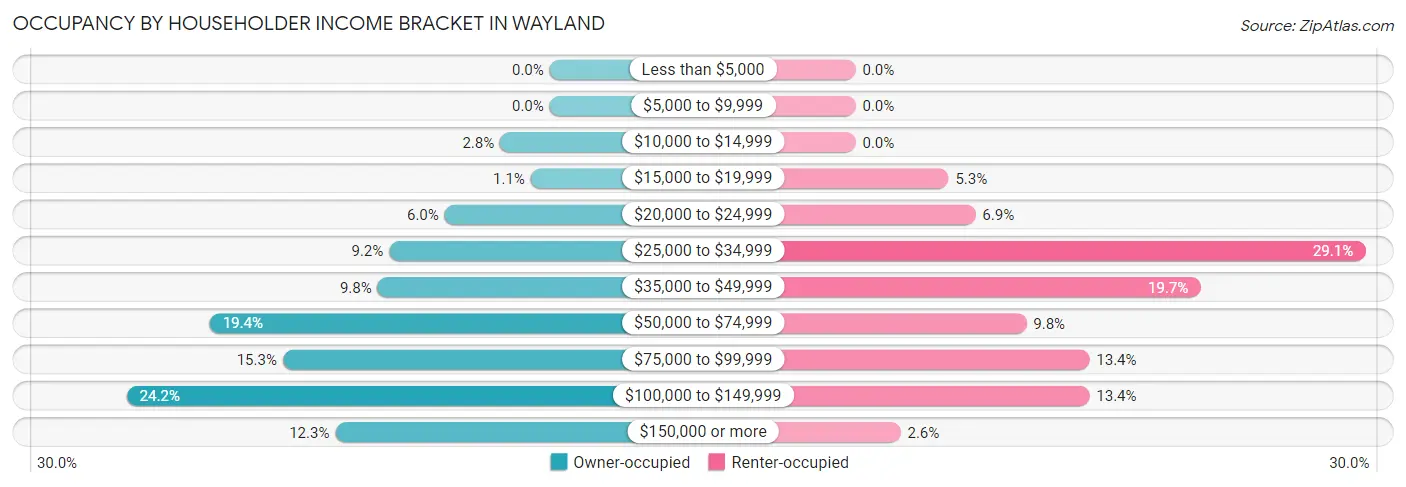
| Income Bracket | Owner-occupied | Renter-occupied |
| Less than $5,000 | 0 (0.0%) | 0 (0.0%) |
| $5,000 to $9,999 | 0 (0.0%) | 0 (0.0%) |
| $10,000 to $14,999 | 34 (2.8%) | 0 (0.0%) |
| $15,000 to $19,999 | 13 (1.1%) | 31 (5.3%) |
| $20,000 to $24,999 | 72 (6.0%) | 40 (6.9%) |
| $25,000 to $34,999 | 110 (9.2%) | 170 (29.1%) |
| $35,000 to $49,999 | 118 (9.8%) | 115 (19.7%) |
| $50,000 to $74,999 | 233 (19.4%) | 57 (9.8%) |
| $75,000 to $99,999 | 183 (15.2%) | 78 (13.4%) |
| $100,000 to $149,999 | 290 (24.2%) | 78 (13.4%) |
| $150,000 or more | 147 (12.2%) | 15 (2.6%) |
| Total | 1,200 (100.0%) | 584 (100.0%) |
Monthly Housing Cost Tiers in Wayland
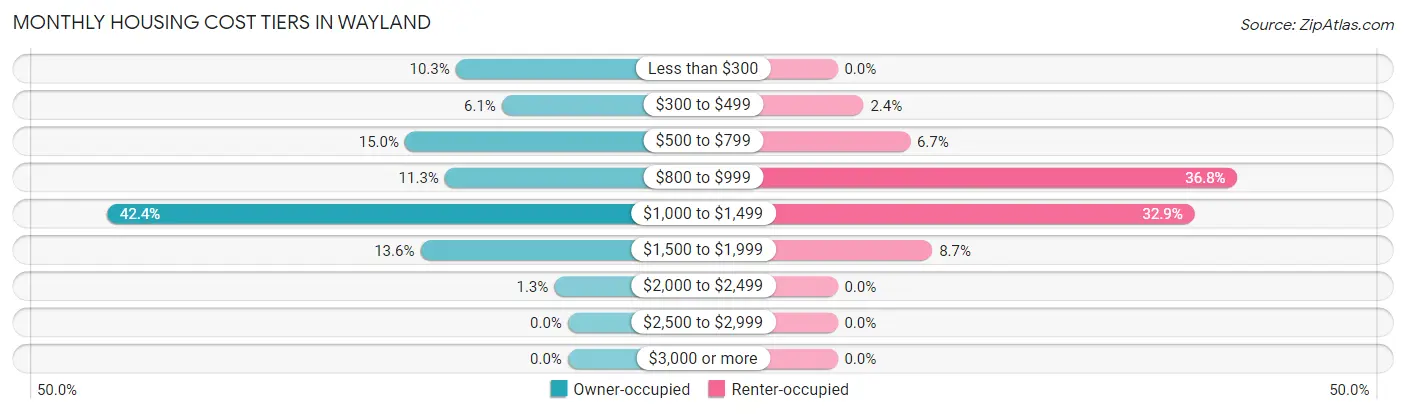
| Monthly Cost | Owner-occupied | Renter-occupied |
| Less than $300 | 124 (10.3%) | 0 (0.0%) |
| $300 to $499 | 73 (6.1%) | 14 (2.4%) |
| $500 to $799 | 180 (15.0%) | 39 (6.7%) |
| $800 to $999 | 136 (11.3%) | 215 (36.8%) |
| $1,000 to $1,499 | 509 (42.4%) | 192 (32.9%) |
| $1,500 to $1,999 | 163 (13.6%) | 51 (8.7%) |
| $2,000 to $2,499 | 15 (1.3%) | 0 (0.0%) |
| $2,500 to $2,999 | 0 (0.0%) | 0 (0.0%) |
| $3,000 or more | 0 (0.0%) | 0 (0.0%) |
| Total | 1,200 (100.0%) | 584 (100.0%) |
Physical Housing Characteristics in Wayland
Housing Structures in Wayland
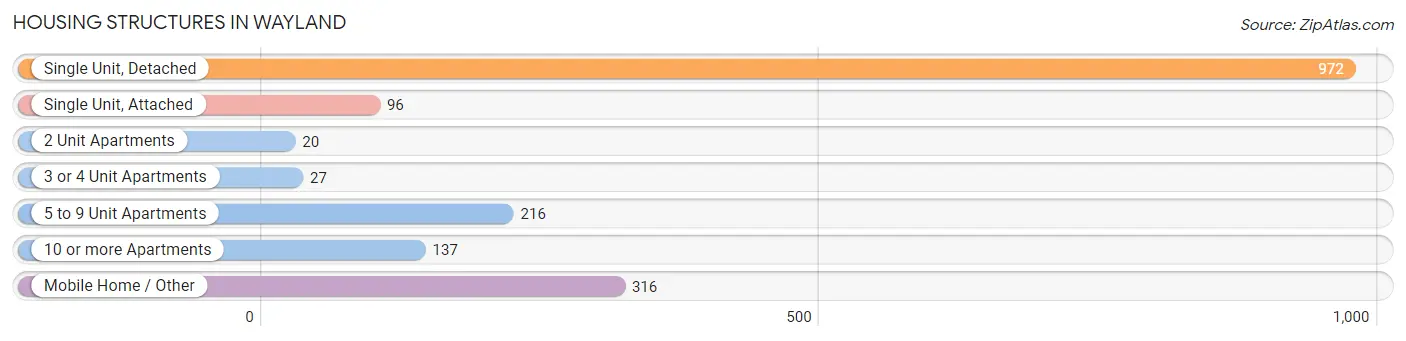
| Structure Type | # Housing Units | % Housing Units |
| Single Unit, Detached | 972 | 54.5% |
| Single Unit, Attached | 96 | 5.4% |
| 2 Unit Apartments | 20 | 1.1% |
| 3 or 4 Unit Apartments | 27 | 1.5% |
| 5 to 9 Unit Apartments | 216 | 12.1% |
| 10 or more Apartments | 137 | 7.7% |
| Mobile Home / Other | 316 | 17.7% |
| Total | 1,784 | 100.0% |
Housing Structures by Occupancy in Wayland
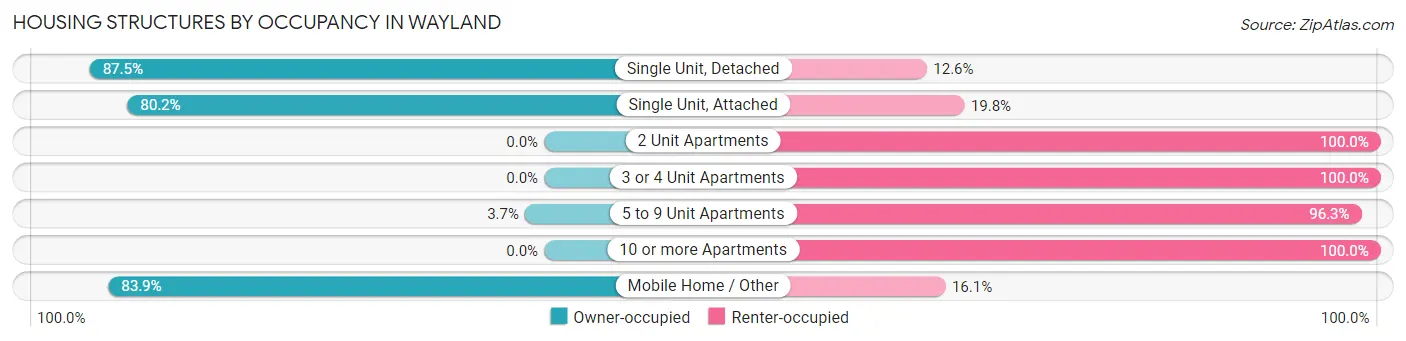
| Structure Type | Owner-occupied | Renter-occupied |
| Single Unit, Detached | 850 (87.5%) | 122 (12.6%) |
| Single Unit, Attached | 77 (80.2%) | 19 (19.8%) |
| 2 Unit Apartments | 0 (0.0%) | 20 (100.0%) |
| 3 or 4 Unit Apartments | 0 (0.0%) | 27 (100.0%) |
| 5 to 9 Unit Apartments | 8 (3.7%) | 208 (96.3%) |
| 10 or more Apartments | 0 (0.0%) | 137 (100.0%) |
| Mobile Home / Other | 265 (83.9%) | 51 (16.1%) |
| Total | 1,200 (67.3%) | 584 (32.7%) |
Housing Structures by Number of Rooms in Wayland
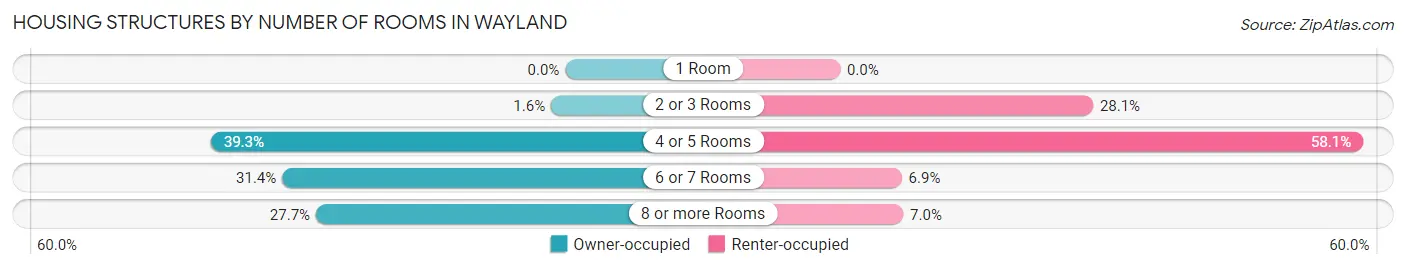
| Number of Rooms | Owner-occupied | Renter-occupied |
| 1 Room | 0 (0.0%) | 0 (0.0%) |
| 2 or 3 Rooms | 19 (1.6%) | 164 (28.1%) |
| 4 or 5 Rooms | 472 (39.3%) | 339 (58.1%) |
| 6 or 7 Rooms | 377 (31.4%) | 40 (6.9%) |
| 8 or more Rooms | 332 (27.7%) | 41 (7.0%) |
| Total | 1,200 (100.0%) | 584 (100.0%) |
Housing Structure by Heating Type in Wayland
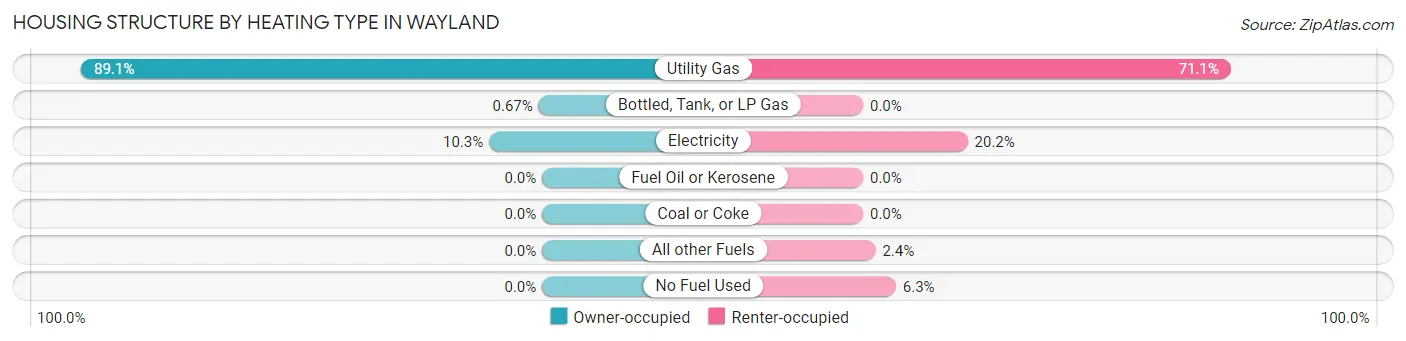
| Heating Type | Owner-occupied | Renter-occupied |
| Utility Gas | 1,069 (89.1%) | 415 (71.1%) |
| Bottled, Tank, or LP Gas | 8 (0.7%) | 0 (0.0%) |
| Electricity | 123 (10.2%) | 118 (20.2%) |
| Fuel Oil or Kerosene | 0 (0.0%) | 0 (0.0%) |
| Coal or Coke | 0 (0.0%) | 0 (0.0%) |
| All other Fuels | 0 (0.0%) | 14 (2.4%) |
| No Fuel Used | 0 (0.0%) | 37 (6.3%) |
| Total | 1,200 (100.0%) | 584 (100.0%) |
Household Vehicle Usage in Wayland
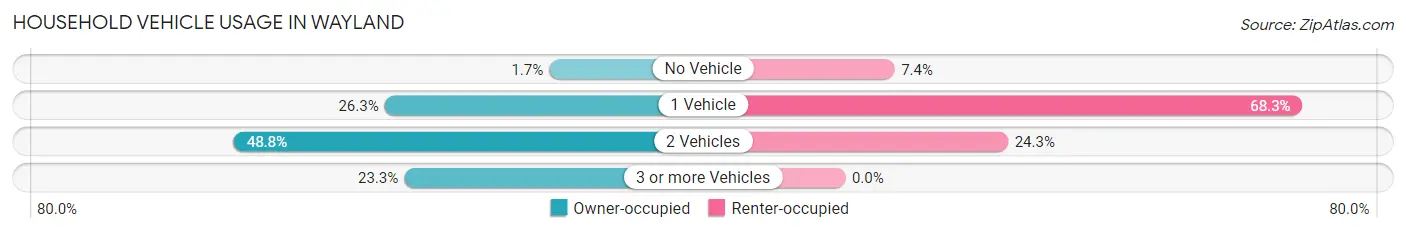
| Vehicles per Household | Owner-occupied | Renter-occupied |
| No Vehicle | 20 (1.7%) | 43 (7.4%) |
| 1 Vehicle | 315 (26.3%) | 399 (68.3%) |
| 2 Vehicles | 585 (48.7%) | 142 (24.3%) |
| 3 or more Vehicles | 280 (23.3%) | 0 (0.0%) |
| Total | 1,200 (100.0%) | 584 (100.0%) |
Real Estate & Mortgages in Wayland
Real Estate and Mortgage Overview in Wayland
| Characteristic | Without Mortgage | With Mortgage |
| Housing Units | 421 | 779 |
| Median Property Value | - | - |
| Median Household Income | $51,932 | $129 |
| Monthly Housing Costs | $579 | $0 |
| Real Estate Taxes | $2,505 | $61 |
Property Value by Mortgage Status in Wayland
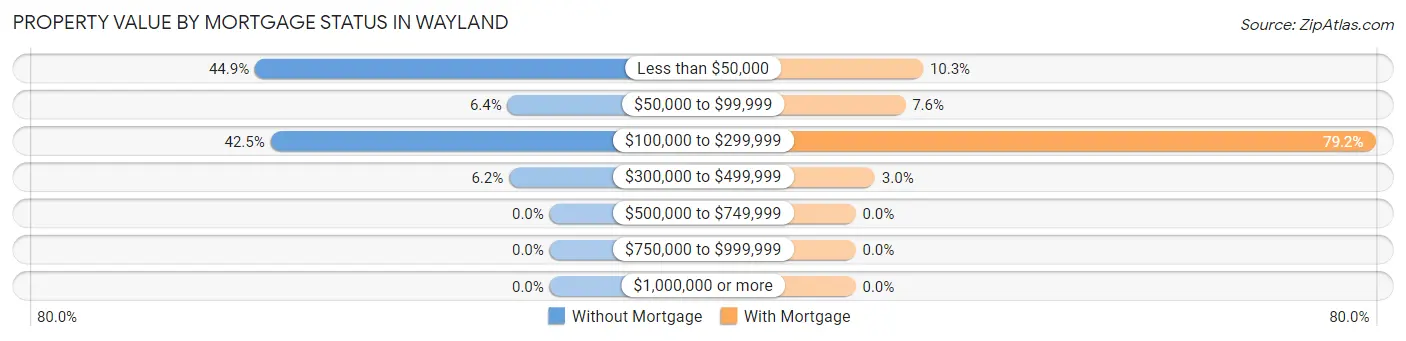
| Property Value | Without Mortgage | With Mortgage |
| Less than $50,000 | 189 (44.9%) | 80 (10.3%) |
| $50,000 to $99,999 | 27 (6.4%) | 59 (7.6%) |
| $100,000 to $299,999 | 179 (42.5%) | 617 (79.2%) |
| $300,000 to $499,999 | 26 (6.2%) | 23 (2.9%) |
| $500,000 to $749,999 | 0 (0.0%) | 0 (0.0%) |
| $750,000 to $999,999 | 0 (0.0%) | 0 (0.0%) |
| $1,000,000 or more | 0 (0.0%) | 0 (0.0%) |
| Total | 421 (100.0%) | 779 (100.0%) |
Household Income by Mortgage Status in Wayland
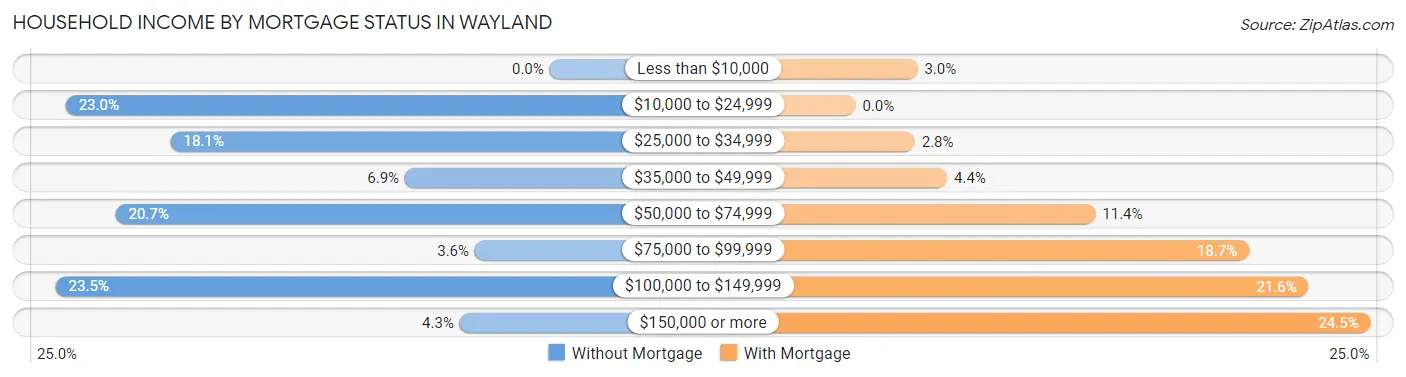
| Household Income | Without Mortgage | With Mortgage |
| Less than $10,000 | 0 (0.0%) | 23 (2.9%) |
| $10,000 to $24,999 | 97 (23.0%) | 0 (0.0%) |
| $25,000 to $34,999 | 76 (18.0%) | 22 (2.8%) |
| $35,000 to $49,999 | 29 (6.9%) | 34 (4.4%) |
| $50,000 to $74,999 | 87 (20.7%) | 89 (11.4%) |
| $75,000 to $99,999 | 15 (3.6%) | 146 (18.7%) |
| $100,000 to $149,999 | 99 (23.5%) | 168 (21.6%) |
| $150,000 or more | 18 (4.3%) | 191 (24.5%) |
| Total | 421 (100.0%) | 779 (100.0%) |
Property Value to Household Income Ratio in Wayland
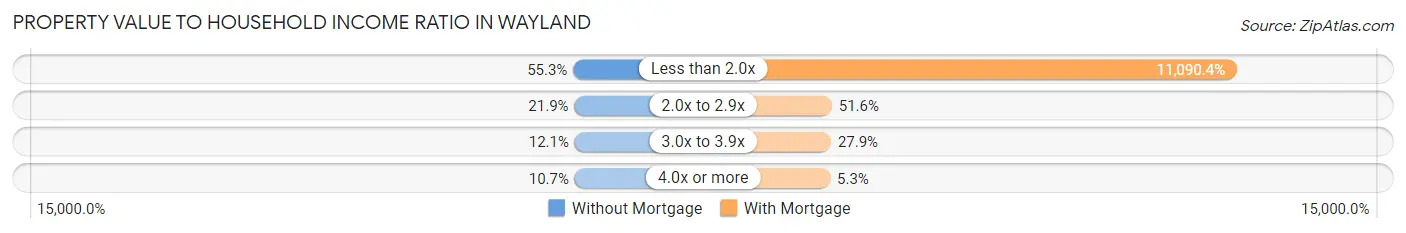
| Value-to-Income Ratio | Without Mortgage | With Mortgage |
| Less than 2.0x | 233 (55.3%) | 86,394 (11,090.4%) |
| 2.0x to 2.9x | 92 (21.8%) | 402 (51.6%) |
| 3.0x to 3.9x | 51 (12.1%) | 217 (27.9%) |
| 4.0x or more | 45 (10.7%) | 41 (5.3%) |
| Total | 421 (100.0%) | 779 (100.0%) |
Real Estate Taxes by Mortgage Status in Wayland
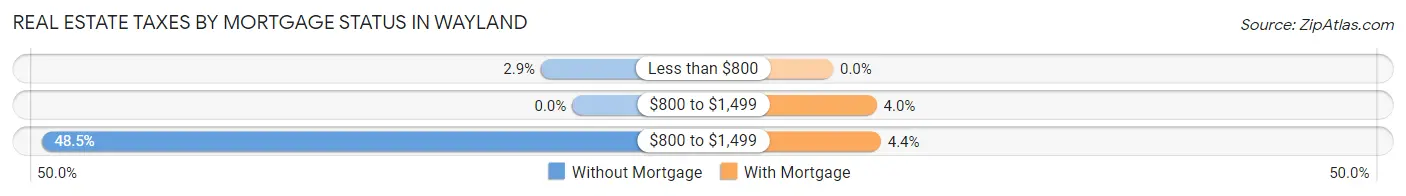
| Property Taxes | Without Mortgage | With Mortgage |
| Less than $800 | 12 (2.9%) | 0 (0.0%) |
| $800 to $1,499 | 0 (0.0%) | 31 (4.0%) |
| $800 to $1,499 | 204 (48.5%) | 34 (4.4%) |
| Total | 421 (100.0%) | 779 (100.0%) |
Health & Disability in Wayland
Health Insurance Coverage by Age in Wayland
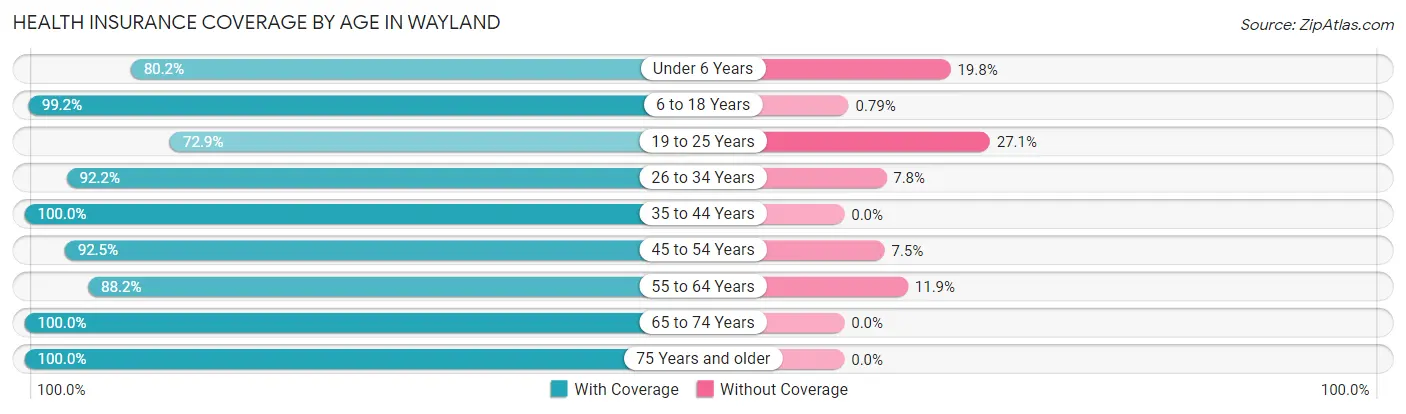
| Age Bracket | With Coverage | Without Coverage |
| Under 6 Years | 405 (80.2%) | 100 (19.8%) |
| 6 to 18 Years | 628 (99.2%) | 5 (0.8%) |
| 19 to 25 Years | 462 (72.9%) | 172 (27.1%) |
| 26 to 34 Years | 530 (92.2%) | 45 (7.8%) |
| 35 to 44 Years | 424 (100.0%) | 0 (0.0%) |
| 45 to 54 Years | 653 (92.5%) | 53 (7.5%) |
| 55 to 64 Years | 372 (88.1%) | 50 (11.8%) |
| 65 to 74 Years | 343 (100.0%) | 0 (0.0%) |
| 75 Years and older | 83 (100.0%) | 0 (0.0%) |
| Total | 3,900 (90.2%) | 425 (9.8%) |
Health Insurance Coverage by Citizenship Status in Wayland
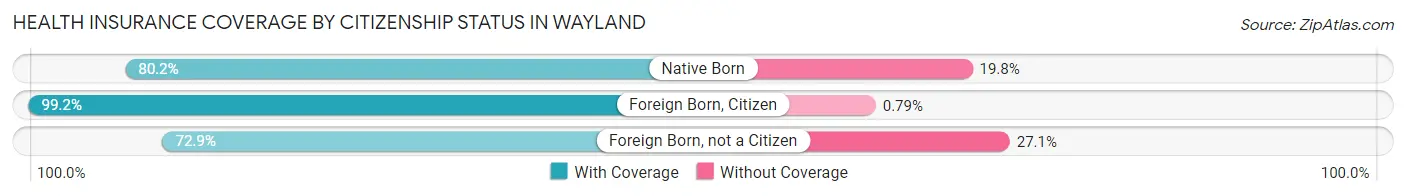
| Citizenship Status | With Coverage | Without Coverage |
| Native Born | 405 (80.2%) | 100 (19.8%) |
| Foreign Born, Citizen | 628 (99.2%) | 5 (0.8%) |
| Foreign Born, not a Citizen | 462 (72.9%) | 172 (27.1%) |
Health Insurance Coverage by Household Income in Wayland
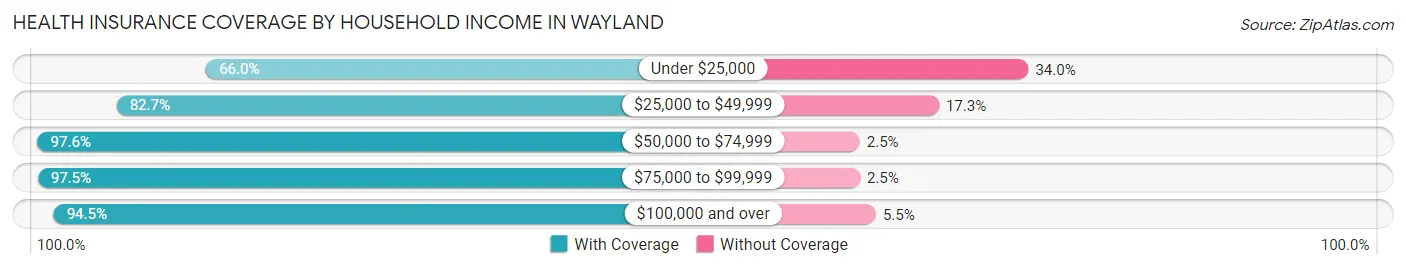
| Household Income | With Coverage | Without Coverage |
| Under $25,000 | 186 (66.0%) | 96 (34.0%) |
| $25,000 to $49,999 | 1,025 (82.7%) | 214 (17.3%) |
| $50,000 to $74,999 | 638 (97.6%) | 16 (2.5%) |
| $75,000 to $99,999 | 589 (97.5%) | 15 (2.5%) |
| $100,000 and over | 1,451 (94.5%) | 84 (5.5%) |
Public vs Private Health Insurance Coverage by Age in Wayland
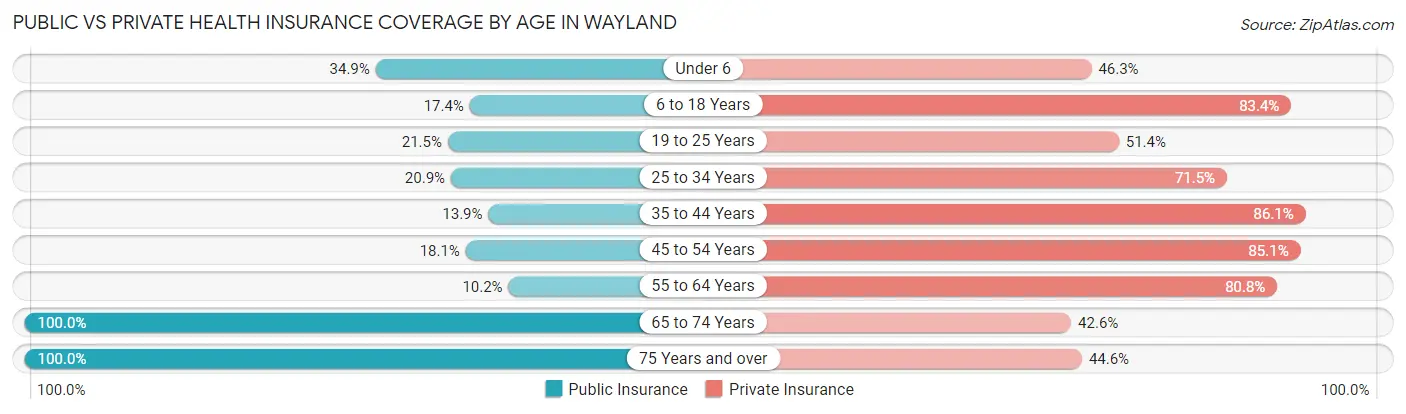
| Age Bracket | Public Insurance | Private Insurance |
| Under 6 | 176 (34.8%) | 234 (46.3%) |
| 6 to 18 Years | 110 (17.4%) | 528 (83.4%) |
| 19 to 25 Years | 136 (21.4%) | 326 (51.4%) |
| 25 to 34 Years | 120 (20.9%) | 411 (71.5%) |
| 35 to 44 Years | 59 (13.9%) | 365 (86.1%) |
| 45 to 54 Years | 128 (18.1%) | 601 (85.1%) |
| 55 to 64 Years | 43 (10.2%) | 341 (80.8%) |
| 65 to 74 Years | 343 (100.0%) | 146 (42.6%) |
| 75 Years and over | 83 (100.0%) | 37 (44.6%) |
| Total | 1,198 (27.7%) | 2,989 (69.1%) |
Disability Status by Sex by Age in Wayland
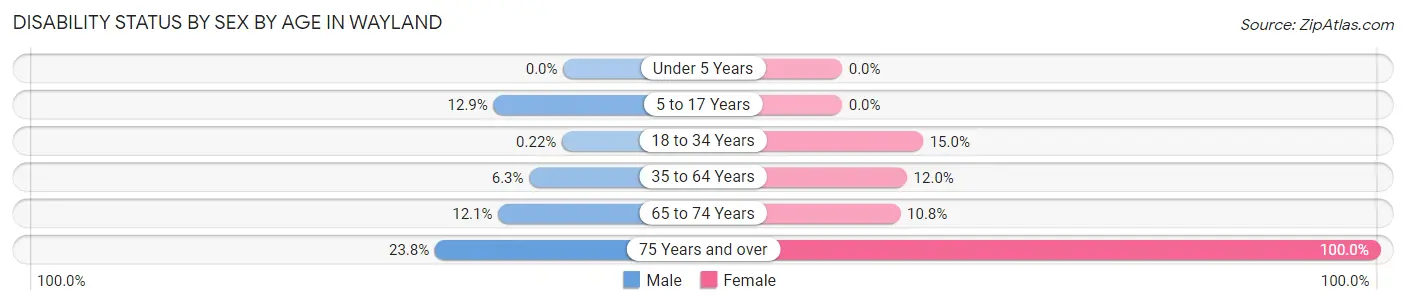
| Age Bracket | Male | Female |
| Under 5 Years | 0 (0.0%) | 0 (0.0%) |
| 5 to 17 Years | 51 (12.9%) | 0 (0.0%) |
| 18 to 34 Years | 1 (0.2%) | 123 (15.0%) |
| 35 to 64 Years | 55 (6.3%) | 82 (12.0%) |
| 65 to 74 Years | 18 (12.1%) | 21 (10.8%) |
| 75 Years and over | 15 (23.8%) | 20 (100.0%) |
Disability Class by Sex by Age in Wayland
Disability Class: Hearing Difficulty
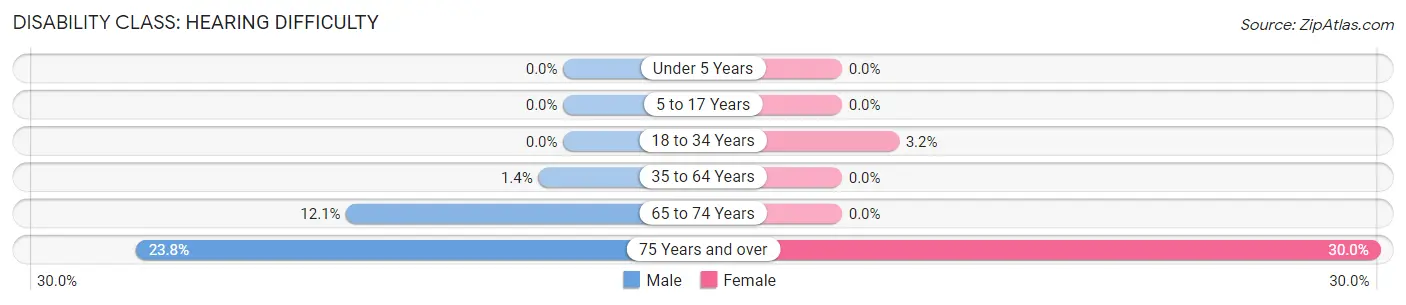
| Age Bracket | Male | Female |
| Under 5 Years | 0 (0.0%) | 0 (0.0%) |
| 5 to 17 Years | 0 (0.0%) | 0 (0.0%) |
| 18 to 34 Years | 0 (0.0%) | 26 (3.2%) |
| 35 to 64 Years | 12 (1.4%) | 0 (0.0%) |
| 65 to 74 Years | 18 (12.1%) | 0 (0.0%) |
| 75 Years and over | 15 (23.8%) | 6 (30.0%) |
Disability Class: Vision Difficulty
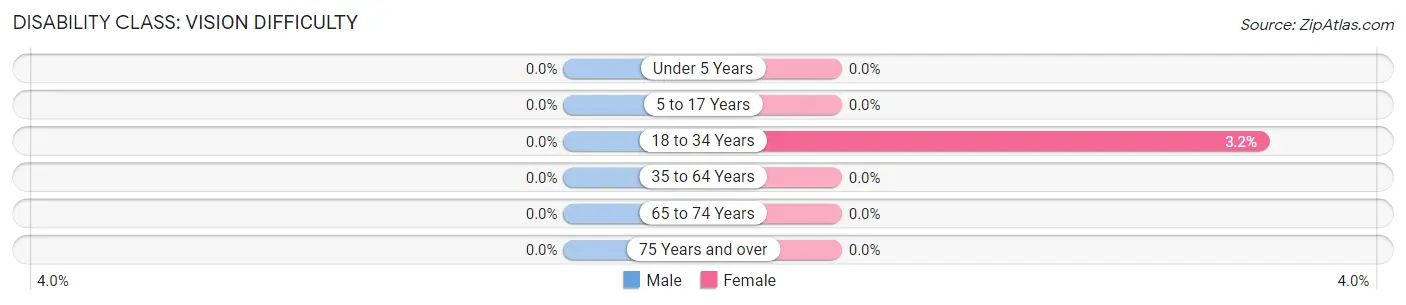
| Age Bracket | Male | Female |
| Under 5 Years | 0 (0.0%) | 0 (0.0%) |
| 5 to 17 Years | 0 (0.0%) | 0 (0.0%) |
| 18 to 34 Years | 0 (0.0%) | 26 (3.2%) |
| 35 to 64 Years | 0 (0.0%) | 0 (0.0%) |
| 65 to 74 Years | 0 (0.0%) | 0 (0.0%) |
| 75 Years and over | 0 (0.0%) | 0 (0.0%) |
Disability Class: Cognitive Difficulty
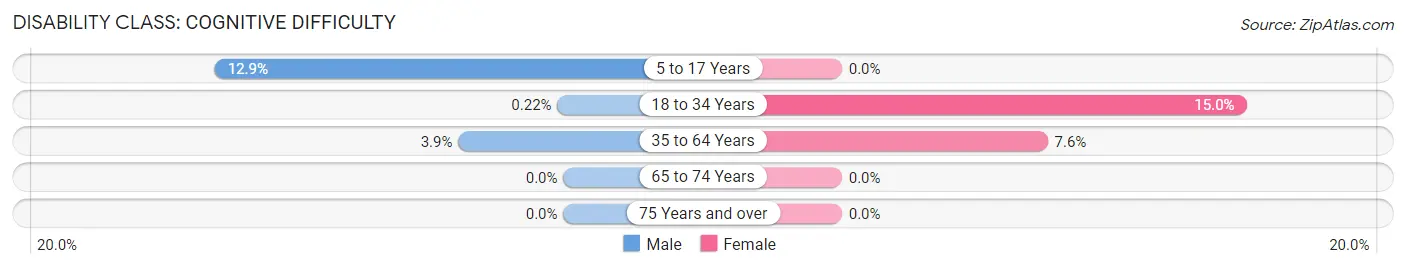
| Age Bracket | Male | Female |
| 5 to 17 Years | 51 (12.9%) | 0 (0.0%) |
| 18 to 34 Years | 1 (0.2%) | 123 (15.0%) |
| 35 to 64 Years | 34 (3.9%) | 52 (7.6%) |
| 65 to 74 Years | 0 (0.0%) | 0 (0.0%) |
| 75 Years and over | 0 (0.0%) | 0 (0.0%) |
Disability Class: Ambulatory Difficulty
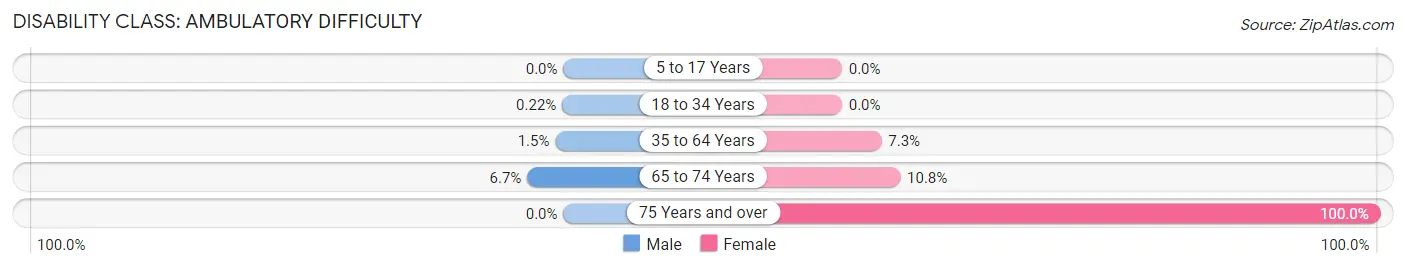
| Age Bracket | Male | Female |
| 5 to 17 Years | 0 (0.0%) | 0 (0.0%) |
| 18 to 34 Years | 1 (0.2%) | 0 (0.0%) |
| 35 to 64 Years | 13 (1.5%) | 50 (7.3%) |
| 65 to 74 Years | 10 (6.7%) | 21 (10.8%) |
| 75 Years and over | 0 (0.0%) | 20 (100.0%) |
Disability Class: Self-Care Difficulty
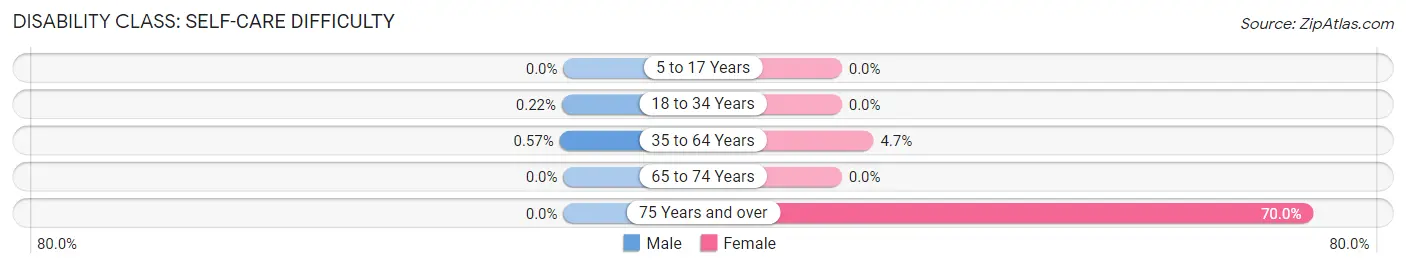
| Age Bracket | Male | Female |
| 5 to 17 Years | 0 (0.0%) | 0 (0.0%) |
| 18 to 34 Years | 1 (0.2%) | 0 (0.0%) |
| 35 to 64 Years | 5 (0.6%) | 32 (4.7%) |
| 65 to 74 Years | 0 (0.0%) | 0 (0.0%) |
| 75 Years and over | 0 (0.0%) | 14 (70.0%) |
Technology Access in Wayland
Computing Device Access in Wayland
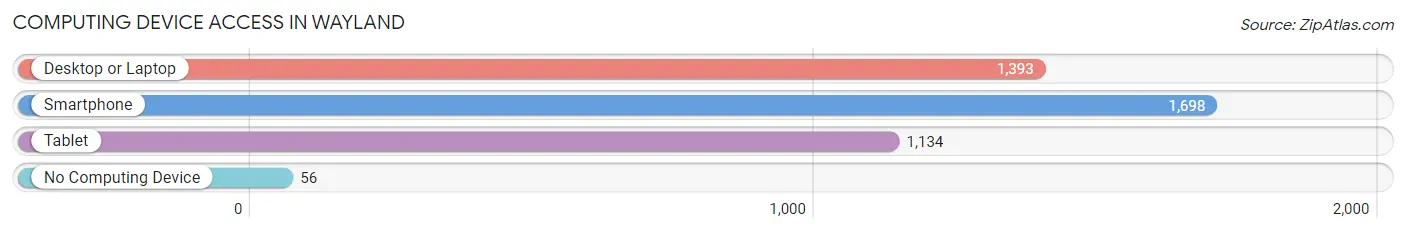
| Device Type | # Households | % Households |
| Desktop or Laptop | 1,393 | 78.1% |
| Smartphone | 1,698 | 95.2% |
| Tablet | 1,134 | 63.6% |
| No Computing Device | 56 | 3.1% |
| Total | 1,784 | 100.0% |
Internet Access in Wayland

| Internet Type | # Households | % Households |
| Dial-Up Internet | 0 | 0.0% |
| Broadband Home | 1,095 | 61.4% |
| Cellular Data Only | 477 | 26.7% |
| Satellite Internet | 132 | 7.4% |
| No Internet | 138 | 7.7% |
| Total | 1,784 | 100.0% |
Wayland Summary
History
The area now known as Wayland, Michigan was first inhabited by the Potawatomi Native Americans. The first white settlers arrived in the area in 1837, and the first permanent settler was John Wayland, who arrived in 1844. Wayland was a veteran of the War of 1812 and was granted a land patent for the area in 1845. The area was originally known as Wayland’s Grove, and the first post office was established in 1848.
In 1867, the village of Wayland was incorporated, and the first mayor was elected. The village grew slowly, and by the turn of the century, it had a population of just over 500. The village was primarily an agricultural community, and the main crops were wheat, corn, and potatoes.
In the early 1900s, the village began to expand and the population grew to over 1,000. The village was connected to the Grand Rapids and Indiana Railroad in 1906, and this helped to spur economic growth. The village was also home to several small businesses, including a sawmill, a grist mill, and a creamery.
In the 1920s, the village began to experience a population boom, and by 1930, the population had grown to over 2,000. The village was also home to several small industries, including a furniture factory, a canning factory, and a brickyard.
In the 1950s, the village experienced another population boom, and by 1960, the population had grown to over 4,000. The village was also home to several larger industries, including a paper mill, a steel mill, and a plastics factory.
In the 1970s, the village began to experience a decline in population, and by 1980, the population had dropped to just over 3,000. The village was also home to several smaller industries, including a printing company, a machine shop, and a plastics factory.
In the 1990s, the village experienced a resurgence in population, and by 2000, the population had grown to over 4,000. The village is now home to several small businesses, including a grocery store, a hardware store, and a restaurant.
Geography
Wayland is located in Allegan County, Michigan, in the southwestern part of the state. The village is situated on the banks of the Kalamazoo River, and is surrounded by rolling hills and farmland. The village is located approximately 25 miles south of Grand Rapids and 40 miles east of Kalamazoo.
The village covers an area of 2.2 square miles, and has a population of 4,092 (as of the 2010 census). The village is located at an elevation of 845 feet above sea level.
Economy
The economy of Wayland is primarily based on agriculture and manufacturing. The village is home to several small businesses, including a grocery store, a hardware store, and a restaurant. The village is also home to several larger industries, including a paper mill, a steel mill, and a plastics factory.
The village is also home to several educational institutions, including a community college and a technical school. The village is also home to several parks and recreational facilities, including a golf course, a swimming pool, and a skate park.
Demographics
As of the 2010 census, the population of Wayland was 4,092. The racial makeup of the village was 94.3% White, 1.2% African American, 0.3% Native American, 0.7% Asian, 0.1% Pacific Islander, 1.2% from other races, and 2.3% from two or more races. Hispanic or Latino of any race were 3.2% of the population.
The median income for a household in the village was $41,944, and the median income for a family was $50,917. The per capita income for the village was $20,845. About 8.3% of families and 11.2% of the population were below the poverty line, including 16.2% of those under age 18 and 6.2% of those age 65 or over.
Common Questions
What is Per Capita Income in Wayland?
Per Capita income in Wayland is $31,748.
What is the Median Family Income in Wayland?
Median Family Income in Wayland is $78,490.
What is the Median Household income in Wayland?
Median Household Income in Wayland is $63,500.
What is Income or Wage Gap in Wayland?
Income or Wage Gap in Wayland is 34.0%.
Women in Wayland earn 66.0 cents for every dollar earned by a man.
What is Inequality or Gini Index in Wayland?
Inequality or Gini Index in Wayland is 0.35.
What is the Total Population of Wayland?
Total Population of Wayland is 4,411.
What is the Total Male Population of Wayland?
Total Male Population of Wayland is 2,177.
What is the Total Female Population of Wayland?
Total Female Population of Wayland is 2,234.
What is the Ratio of Males per 100 Females in Wayland?
There are 97.45 Males per 100 Females in Wayland.
What is the Ratio of Females per 100 Males in Wayland?
There are 102.62 Females per 100 Males in Wayland.
What is the Median Population Age in Wayland?
Median Population Age in Wayland is 33.5 Years.
What is the Average Family Size in Wayland
Average Family Size in Wayland is 2.8 People.
What is the Average Household Size in Wayland
Average Household Size in Wayland is 2.4 People.
How Large is the Labor Force in Wayland?
There are 2,531 People in the Labor Forcein in Wayland.
What is the Percentage of People in the Labor Force in Wayland?
73.1% of People are in the Labor Force in Wayland.
What is the Unemployment Rate in Wayland?
Unemployment Rate in Wayland is 3.0%.