Tekonsha, MI Map & Demographics
Tekonsha Map
Tekonsha Overview
$26,267
PER CAPITA INCOME
$73,750
AVG FAMILY INCOME
$59,063
AVG HOUSEHOLD INCOME
10.7%
WAGE / INCOME GAP [ % ]
89.3¢/ $1
WAGE / INCOME GAP [ $ ]
0.38
INEQUALITY / GINI INDEX
685
TOTAL POPULATION
338
MALE POPULATION
347
FEMALE POPULATION
97.41
MALES / 100 FEMALES
102.66
FEMALES / 100 MALES
40.2
MEDIAN AGE
3.1
AVG FAMILY SIZE
2.6
AVG HOUSEHOLD SIZE
324
LABOR FORCE [ PEOPLE ]
58.2%
PERCENT IN LABOR FORCE
10.5%
UNEMPLOYMENT RATE
Tekonsha Zip Codes
Tekonsha Area Codes
Income in Tekonsha
Income Overview in Tekonsha
Per Capita Income in Tekonsha is $26,267, while median incomes of families and households are $73,750 and $59,063 respectively.
| Characteristic | Number | Measure |
| Per Capita Income | 685 | $26,267 |
| Median Family Income | 166 | $73,750 |
| Mean Family Income | 166 | $76,093 |
| Median Household Income | 267 | $59,063 |
| Mean Household Income | 267 | $64,766 |
| Income Deficit | 166 | $0 |
| Wage / Income Gap (%) | 685 | 10.73% |
| Wage / Income Gap ($) | 685 | 89.27¢ per $1 |
| Gini / Inequality Index | 685 | 0.38 |
Earnings by Sex in Tekonsha
Average Earnings in Tekonsha are $36,786, $38,594 for men and $34,453 for women, a difference of 10.7%.
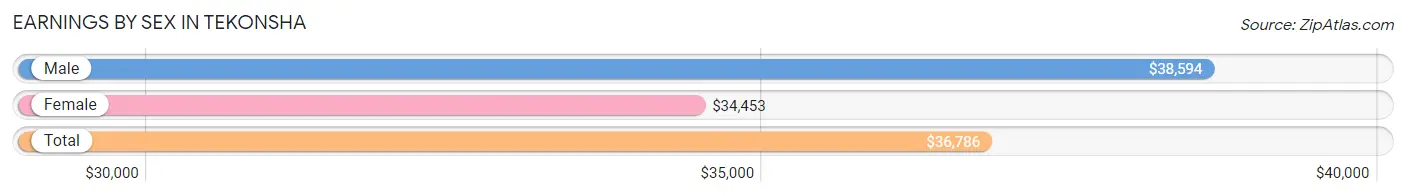
| Sex | Number | Average Earnings |
| Male | 175 (53.3%) | $38,594 |
| Female | 153 (46.7%) | $34,453 |
| Total | 328 (100.0%) | $36,786 |
Earnings by Sex by Income Bracket in Tekonsha
The most common earnings brackets in Tekonsha are $25,000 to $29,999 for men (33 | 18.9%) and $35,000 to $39,999 for women (21 | 13.7%).
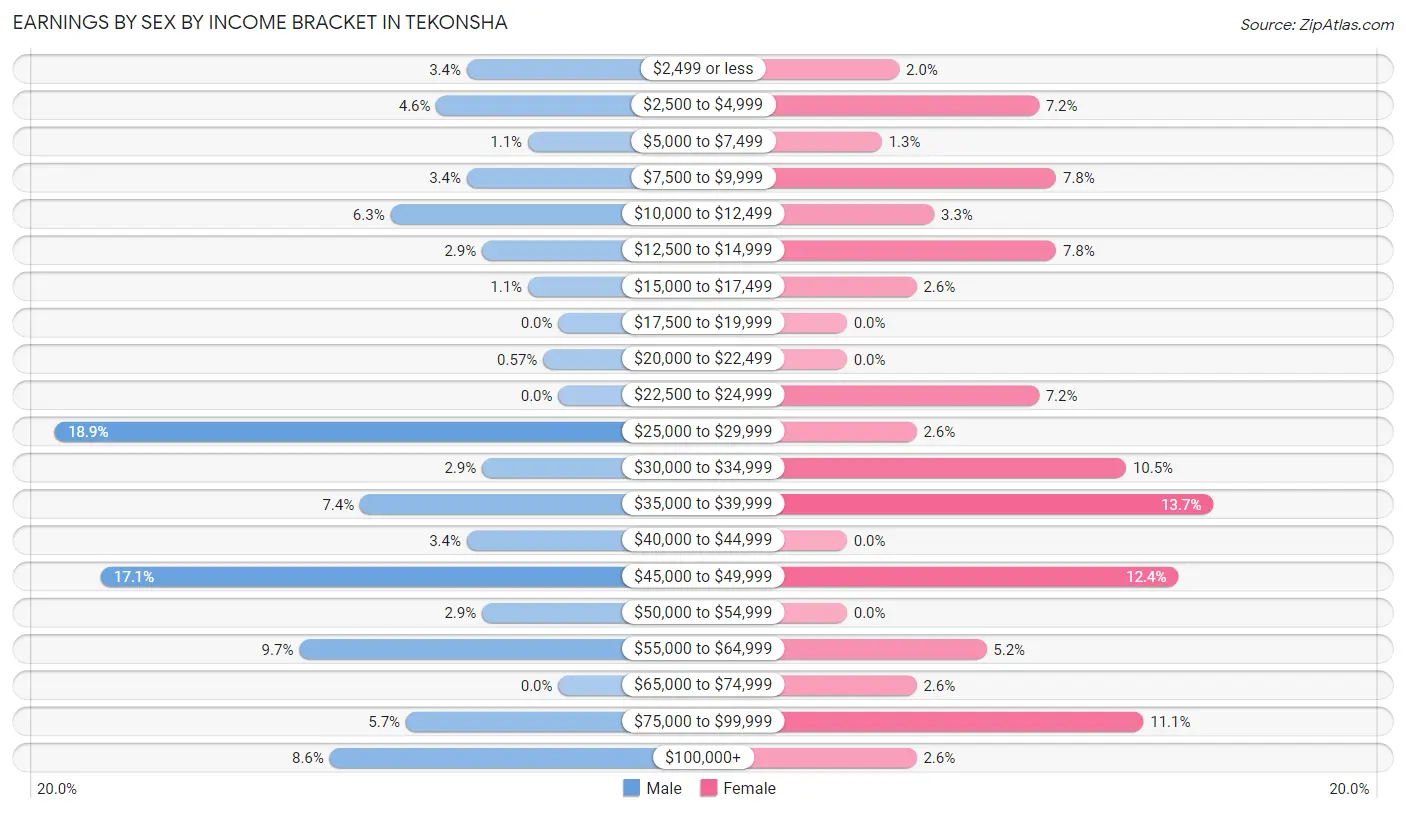
| Income | Male | Female |
| $2,499 or less | 6 (3.4%) | 3 (2.0%) |
| $2,500 to $4,999 | 8 (4.6%) | 11 (7.2%) |
| $5,000 to $7,499 | 2 (1.1%) | 2 (1.3%) |
| $7,500 to $9,999 | 6 (3.4%) | 12 (7.8%) |
| $10,000 to $12,499 | 11 (6.3%) | 5 (3.3%) |
| $12,500 to $14,999 | 5 (2.9%) | 12 (7.8%) |
| $15,000 to $17,499 | 2 (1.1%) | 4 (2.6%) |
| $17,500 to $19,999 | 0 (0.0%) | 0 (0.0%) |
| $20,000 to $22,499 | 1 (0.6%) | 0 (0.0%) |
| $22,500 to $24,999 | 0 (0.0%) | 11 (7.2%) |
| $25,000 to $29,999 | 33 (18.9%) | 4 (2.6%) |
| $30,000 to $34,999 | 5 (2.9%) | 16 (10.5%) |
| $35,000 to $39,999 | 13 (7.4%) | 21 (13.7%) |
| $40,000 to $44,999 | 6 (3.4%) | 0 (0.0%) |
| $45,000 to $49,999 | 30 (17.1%) | 19 (12.4%) |
| $50,000 to $54,999 | 5 (2.9%) | 0 (0.0%) |
| $55,000 to $64,999 | 17 (9.7%) | 8 (5.2%) |
| $65,000 to $74,999 | 0 (0.0%) | 4 (2.6%) |
| $75,000 to $99,999 | 10 (5.7%) | 17 (11.1%) |
| $100,000+ | 15 (8.6%) | 4 (2.6%) |
| Total | 175 (100.0%) | 153 (100.0%) |
Earnings by Sex by Educational Attainment in Tekonsha
Average earnings in Tekonsha are $40,625 for men and $37,734 for women, a difference of 7.1%. Men with an educational attainment of bachelor's degree enjoy the highest average annual earnings of $57,679, while those with high school diploma education earn the least with $37,000. Women with an educational attainment of college or associate's degree earn the most with the average annual earnings of $45,313, while those with high school diploma education have the smallest earnings of $24,167.
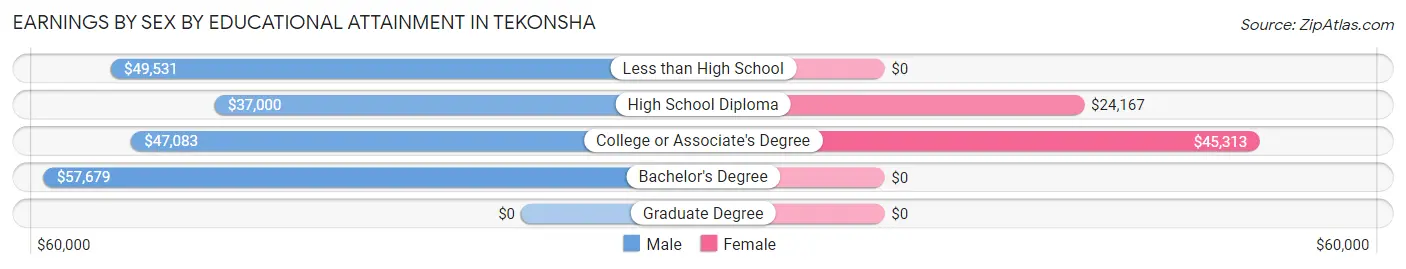
| Educational Attainment | Male Income | Female Income |
| Less than High School | $49,531 | $0 |
| High School Diploma | $37,000 | $24,167 |
| College or Associate's Degree | $47,083 | $45,313 |
| Bachelor's Degree | $57,679 | $0 |
| Graduate Degree | - | - |
| Total | $40,625 | $37,734 |
Family Income in Tekonsha
Family Income Brackets in Tekonsha
According to the Tekonsha family income data, there are 35 families falling into the $100,000 to $149,999 income range, which is the most common income bracket and makes up 21.1% of all families.
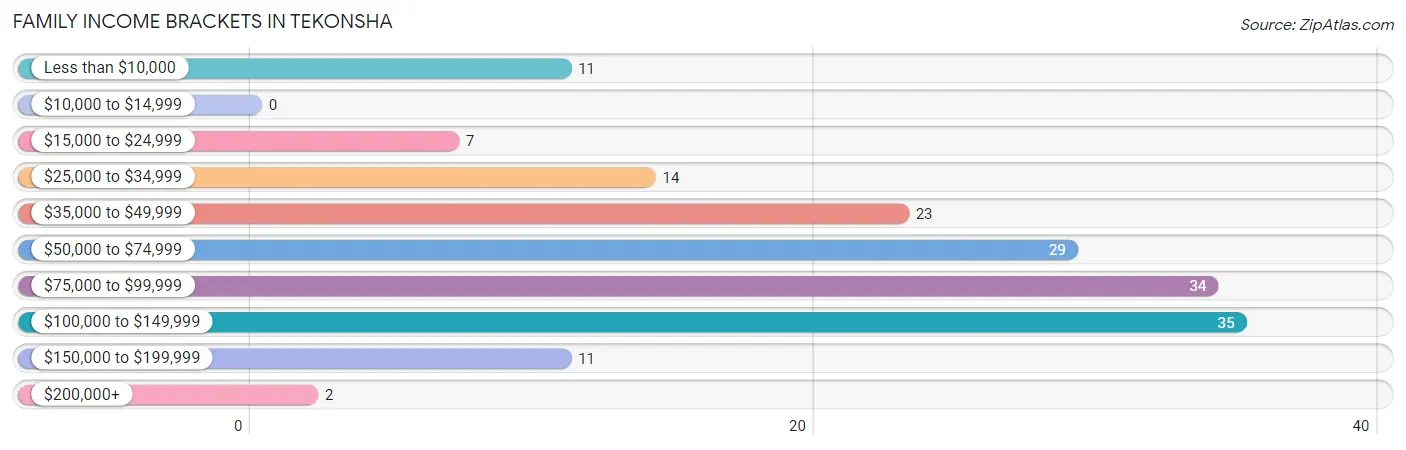
| Income Bracket | # Families | % Families |
| Less than $10,000 | 11 | 6.6% |
| $10,000 to $14,999 | 0 | 0.0% |
| $15,000 to $24,999 | 7 | 4.2% |
| $25,000 to $34,999 | 14 | 8.4% |
| $35,000 to $49,999 | 23 | 13.9% |
| $50,000 to $74,999 | 29 | 17.5% |
| $75,000 to $99,999 | 34 | 20.5% |
| $100,000 to $149,999 | 35 | 21.1% |
| $150,000 to $199,999 | 11 | 6.6% |
| $200,000+ | 2 | 1.2% |
Family Income by Famaliy Size in Tekonsha
5-person families (13 | 7.8%) account for the highest median family income in Tekonsha with $76,477 per family, while 2-person families (83 | 50.0%) have the highest median income of $34,271 per family member.
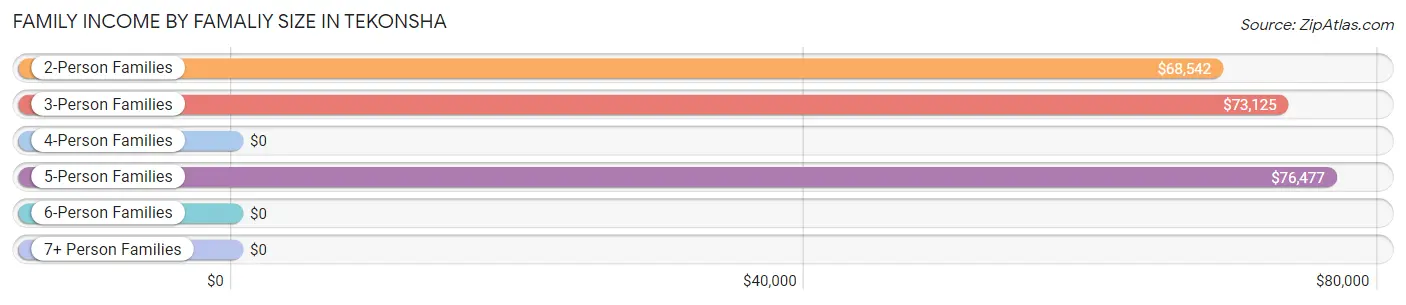
| Income Bracket | # Families | Median Income |
| 2-Person Families | 83 (50.0%) | $68,542 |
| 3-Person Families | 31 (18.7%) | $73,125 |
| 4-Person Families | 36 (21.7%) | $0 |
| 5-Person Families | 13 (7.8%) | $76,477 |
| 6-Person Families | 3 (1.8%) | $0 |
| 7+ Person Families | 0 (0.0%) | $0 |
| Total | 166 (100.0%) | $73,750 |
Family Income by Number of Earners in Tekonsha
The median family income in Tekonsha is $73,750, with families comprising 3+ earners (9) having the highest median family income of $160,417, while families with no earners (46) have the lowest median family income of $41,250, accounting for 5.4% and 27.7% of families, respectively.
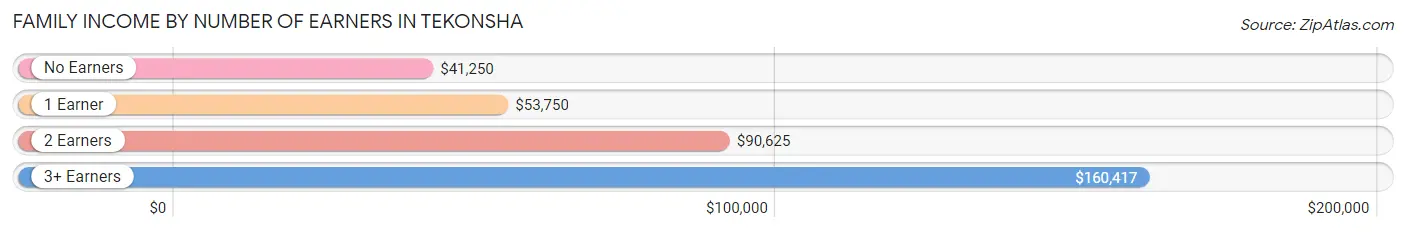
| Number of Earners | # Families | Median Income |
| No Earners | 46 (27.7%) | $41,250 |
| 1 Earner | 50 (30.1%) | $53,750 |
| 2 Earners | 61 (36.7%) | $90,625 |
| 3+ Earners | 9 (5.4%) | $160,417 |
| Total | 166 (100.0%) | $73,750 |
Household Income in Tekonsha
Household Income Brackets in Tekonsha
With 52 households falling in the category, the $75,000 to $99,999 income range is the most frequent in Tekonsha, accounting for 19.5% of all households. In contrast, only 2 households (0.7%) fall into the $200,000+ income bracket, making it the least populous group.
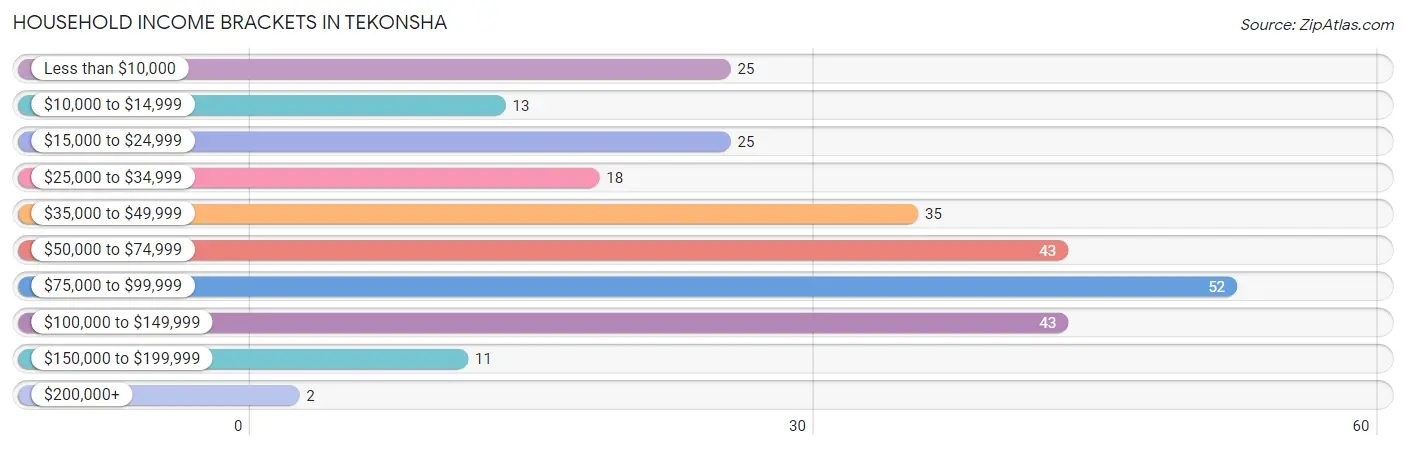
| Income Bracket | # Households | % Households |
| Less than $10,000 | 25 | 9.4% |
| $10,000 to $14,999 | 13 | 4.9% |
| $15,000 to $24,999 | 25 | 9.4% |
| $25,000 to $34,999 | 18 | 6.7% |
| $35,000 to $49,999 | 35 | 13.1% |
| $50,000 to $74,999 | 43 | 16.1% |
| $75,000 to $99,999 | 52 | 19.5% |
| $100,000 to $149,999 | 43 | 16.1% |
| $150,000 to $199,999 | 11 | 4.1% |
| $200,000+ | 2 | 0.7% |
Household Income by Householder Age in Tekonsha
The median household income in Tekonsha is $59,063, with the highest median household income of $75,455 found in the 45 to 64 years age bracket for the primary householder. A total of 100 households (37.4%) fall into this category. Meanwhile, the 15 to 24 years age bracket for the primary householder has the lowest median household income of $0, with 1 households (0.4%) in this group.
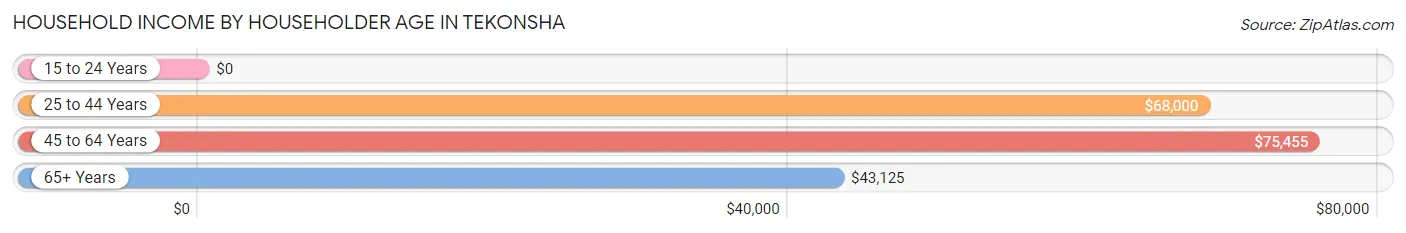
| Income Bracket | # Households | Median Income |
| 15 to 24 Years | 1 (0.4%) | $0 |
| 25 to 44 Years | 92 (34.5%) | $68,000 |
| 45 to 64 Years | 100 (37.4%) | $75,455 |
| 65+ Years | 74 (27.7%) | $43,125 |
| Total | 267 (100.0%) | $59,063 |
Poverty in Tekonsha
Income Below Poverty by Sex and Age in Tekonsha
With 22.2% poverty level for males and 23.9% for females among the residents of Tekonsha, 16 and 17 year old males and 12 to 14 year old females are the most vulnerable to poverty, with 13 males (76.5%) and 19 females (76.0%) in their respective age groups living below the poverty level.
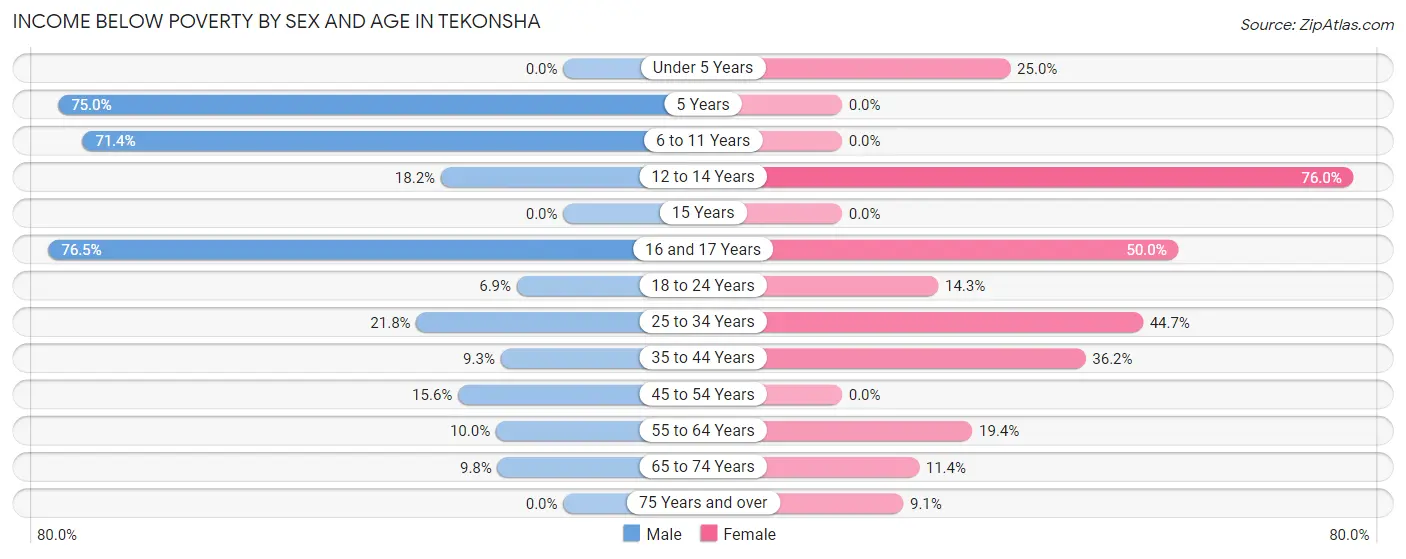
| Age Bracket | Male | Female |
| Under 5 Years | 0 (0.0%) | 2 (25.0%) |
| 5 Years | 6 (75.0%) | 0 (0.0%) |
| 6 to 11 Years | 20 (71.4%) | 0 (0.0%) |
| 12 to 14 Years | 2 (18.2%) | 19 (76.0%) |
| 15 Years | 0 (0.0%) | 0 (0.0%) |
| 16 and 17 Years | 13 (76.5%) | 3 (50.0%) |
| 18 to 24 Years | 2 (6.9%) | 3 (14.3%) |
| 25 to 34 Years | 12 (21.8%) | 21 (44.7%) |
| 35 to 44 Years | 4 (9.3%) | 17 (36.2%) |
| 45 to 54 Years | 10 (15.6%) | 0 (0.0%) |
| 55 to 64 Years | 2 (10.0%) | 12 (19.4%) |
| 65 to 74 Years | 4 (9.8%) | 4 (11.4%) |
| 75 Years and over | 0 (0.0%) | 2 (9.1%) |
| Total | 75 (22.2%) | 83 (23.9%) |
Income Above Poverty by Sex and Age in Tekonsha
According to the poverty statistics in Tekonsha, males aged under 5 years and females aged 6 to 11 years are the age groups that are most secure financially, with 100.0% of males and 100.0% of females in these age groups living above the poverty line.
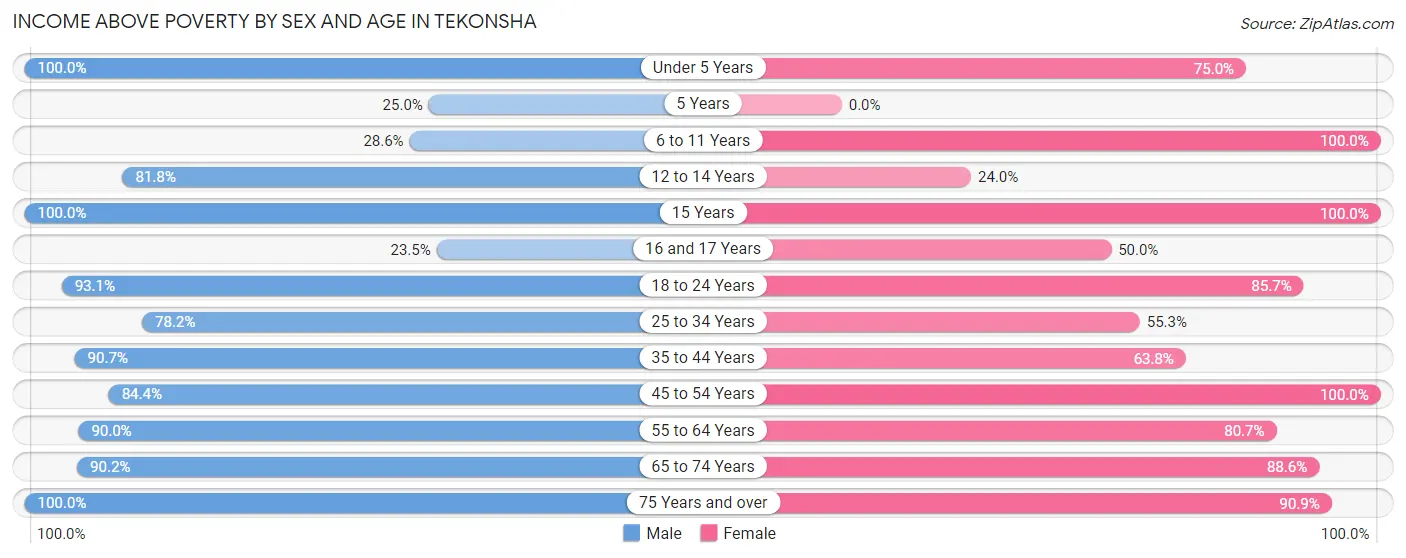
| Age Bracket | Male | Female |
| Under 5 Years | 2 (100.0%) | 6 (75.0%) |
| 5 Years | 2 (25.0%) | 0 (0.0%) |
| 6 to 11 Years | 8 (28.6%) | 24 (100.0%) |
| 12 to 14 Years | 9 (81.8%) | 6 (24.0%) |
| 15 Years | 6 (100.0%) | 16 (100.0%) |
| 16 and 17 Years | 4 (23.5%) | 3 (50.0%) |
| 18 to 24 Years | 27 (93.1%) | 18 (85.7%) |
| 25 to 34 Years | 43 (78.2%) | 26 (55.3%) |
| 35 to 44 Years | 39 (90.7%) | 30 (63.8%) |
| 45 to 54 Years | 54 (84.4%) | 34 (100.0%) |
| 55 to 64 Years | 18 (90.0%) | 50 (80.6%) |
| 65 to 74 Years | 37 (90.2%) | 31 (88.6%) |
| 75 Years and over | 14 (100.0%) | 20 (90.9%) |
| Total | 263 (77.8%) | 264 (76.1%) |
Income Below Poverty Among Married-Couple Families in Tekonsha
The poverty statistics for married-couple families in Tekonsha show that 5.1% or 5 of the total 98 families live below the poverty line. Families with 3 or 4 children have the highest poverty rate of 25.0%, comprising of 3 families. On the other hand, families with no children have the lowest poverty rate of 0.0%, which includes 0 families.
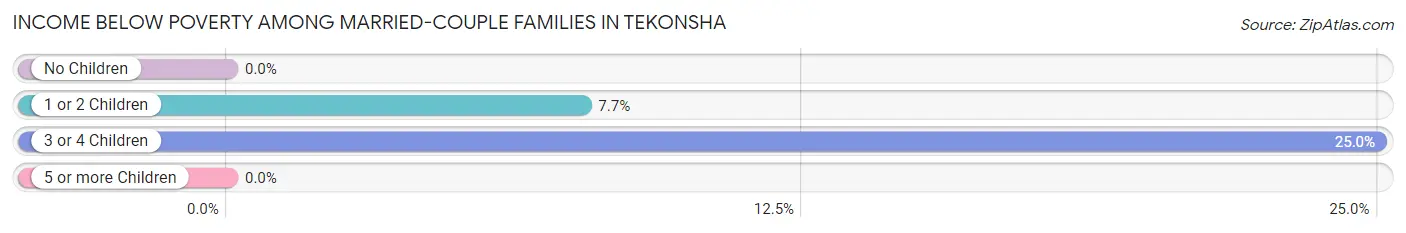
| Children | Above Poverty | Below Poverty |
| No Children | 60 (100.0%) | 0 (0.0%) |
| 1 or 2 Children | 24 (92.3%) | 2 (7.7%) |
| 3 or 4 Children | 9 (75.0%) | 3 (25.0%) |
| 5 or more Children | 0 (0.0%) | 0 (0.0%) |
| Total | 93 (94.9%) | 5 (5.1%) |
Income Below Poverty Among Single-Parent Households in Tekonsha
According to the poverty data in Tekonsha, 23.5% or 4 single-father households and 19.6% or 10 single-mother households are living below the poverty line. Among single-father households, those with 1 or 2 children have the highest poverty rate, with 3 households (100.0%) experiencing poverty. Likewise, among single-mother households, those with 3 or 4 children have the highest poverty rate, with 10 households (100.0%) falling below the poverty line.
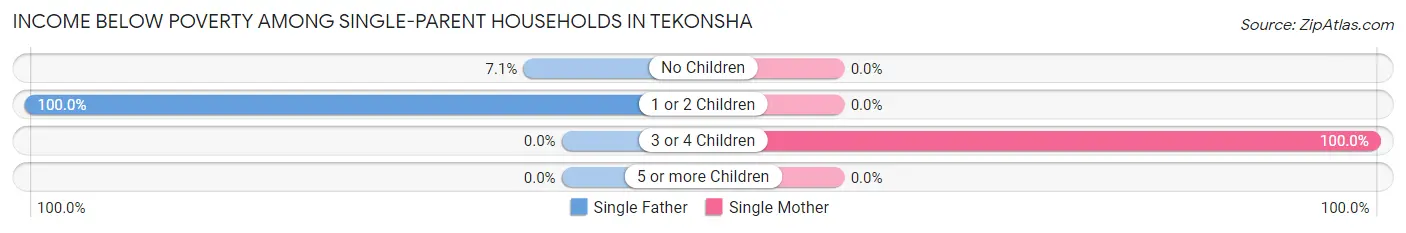
| Children | Single Father | Single Mother |
| No Children | 1 (7.1%) | 0 (0.0%) |
| 1 or 2 Children | 3 (100.0%) | 0 (0.0%) |
| 3 or 4 Children | 0 (0.0%) | 10 (100.0%) |
| 5 or more Children | 0 (0.0%) | 0 (0.0%) |
| Total | 4 (23.5%) | 10 (19.6%) |
Income Below Poverty Among Married-Couple vs Single-Parent Households in Tekonsha
The poverty data for Tekonsha shows that 5 of the married-couple family households (5.1%) and 14 of the single-parent households (20.6%) are living below the poverty level. Within the married-couple family households, those with 3 or 4 children have the highest poverty rate, with 3 households (25.0%) falling below the poverty line. Among the single-parent households, those with 3 or 4 children have the highest poverty rate, with 10 household (100.0%) living below poverty.
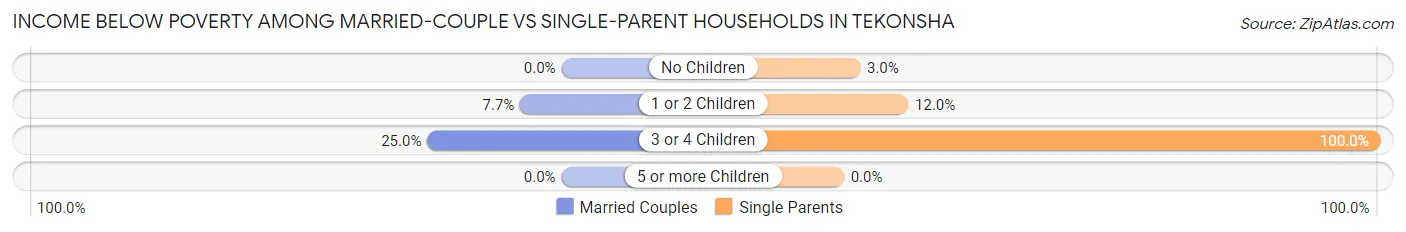
| Children | Married-Couple Families | Single-Parent Households |
| No Children | 0 (0.0%) | 1 (3.0%) |
| 1 or 2 Children | 2 (7.7%) | 3 (12.0%) |
| 3 or 4 Children | 3 (25.0%) | 10 (100.0%) |
| 5 or more Children | 0 (0.0%) | 0 (0.0%) |
| Total | 5 (5.1%) | 14 (20.6%) |
Race in Tekonsha
The most populous races in Tekonsha are White / Caucasian (654 | 95.5%), Two or more Races (31 | 4.5%), and Hispanic or Latino (17 | 2.5%).
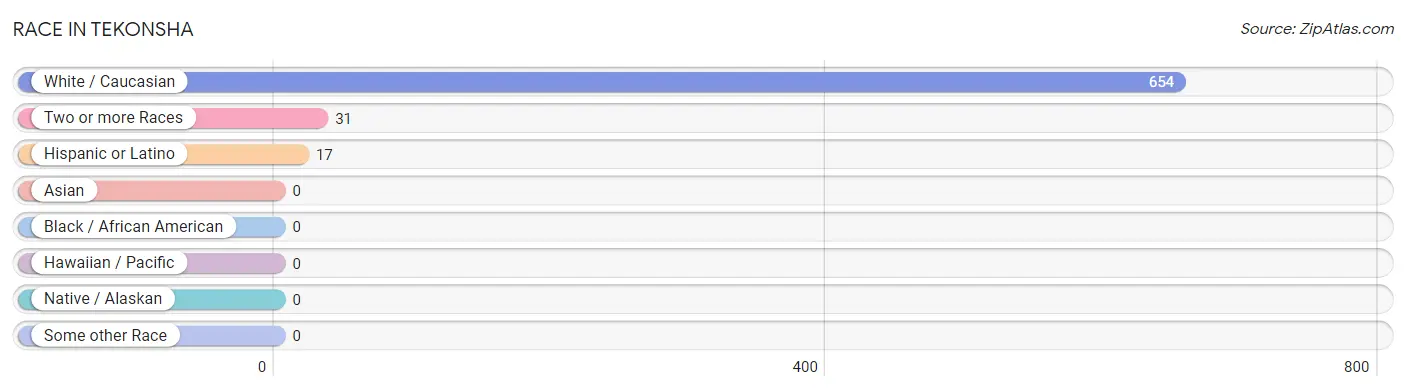
| Race | # Population | % Population |
| Asian | 0 | 0.0% |
| Black / African American | 0 | 0.0% |
| Hawaiian / Pacific | 0 | 0.0% |
| Hispanic or Latino | 17 | 2.5% |
| Native / Alaskan | 0 | 0.0% |
| White / Caucasian | 654 | 95.5% |
| Two or more Races | 31 | 4.5% |
| Some other Race | 0 | 0.0% |
| Total | 685 | 100.0% |
Ancestry in Tekonsha
The most populous ancestries reported in Tekonsha are German (134 | 19.6%), English (82 | 12.0%), Irish (55 | 8.0%), French (32 | 4.7%), and Polish (27 | 3.9%), together accounting for 48.2% of all Tekonsha residents.
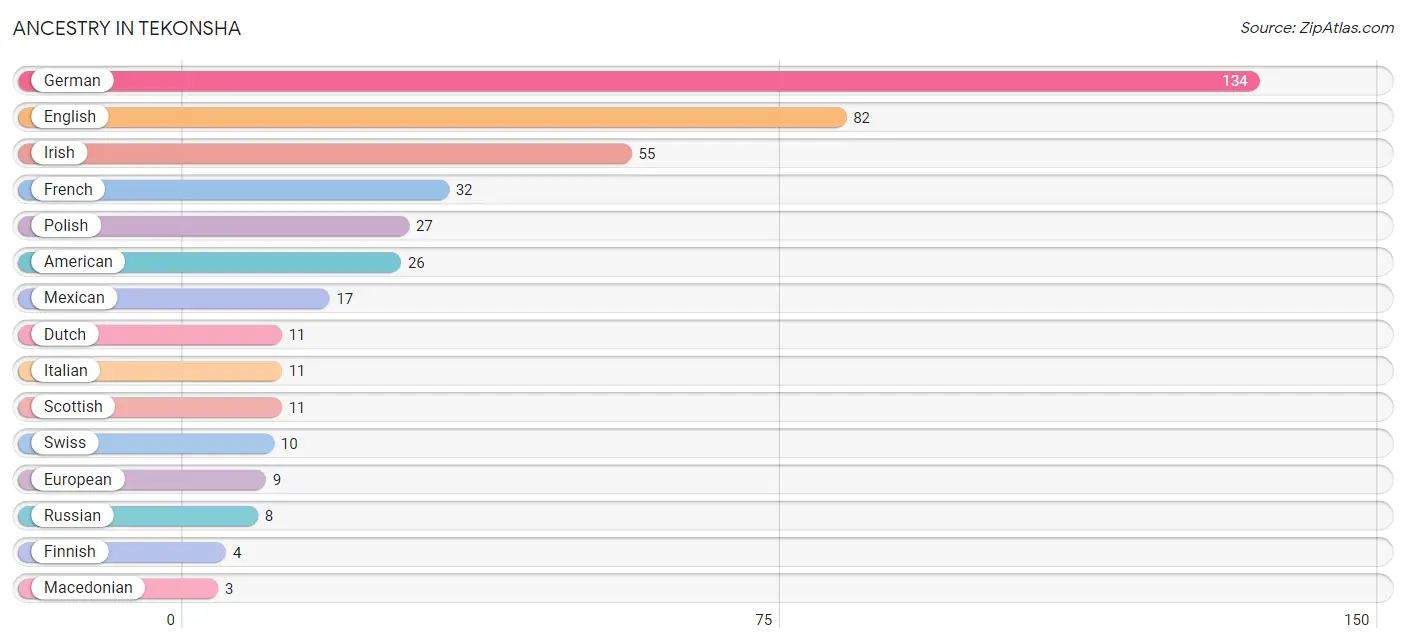
| Ancestry | # Population | % Population |
| American | 26 | 3.8% |
| British | 2 | 0.3% |
| Croatian | 2 | 0.3% |
| Danish | 2 | 0.3% |
| Dutch | 11 | 1.6% |
| English | 82 | 12.0% |
| European | 9 | 1.3% |
| Finnish | 4 | 0.6% |
| French | 32 | 4.7% |
| French Canadian | 1 | 0.2% |
| German | 134 | 19.6% |
| Irish | 55 | 8.0% |
| Italian | 11 | 1.6% |
| Macedonian | 3 | 0.4% |
| Mexican | 17 | 2.5% |
| Norwegian | 3 | 0.4% |
| Polish | 27 | 3.9% |
| Potawatomi | 3 | 0.4% |
| Russian | 8 | 1.2% |
| Scottish | 11 | 1.6% |
| Swiss | 10 | 1.5% |
| Ukrainian | 2 | 0.3% | View All 22 Rows |
Immigrants in Tekonsha

| Immigration Origin | # Population | % Population | View All 0 Rows |
Sex and Age in Tekonsha
Sex and Age in Tekonsha
The most populous age groups in Tekonsha are 50 to 54 Years (46 | 13.6%) for men and 55 to 59 Years (35 | 10.1%) for women.
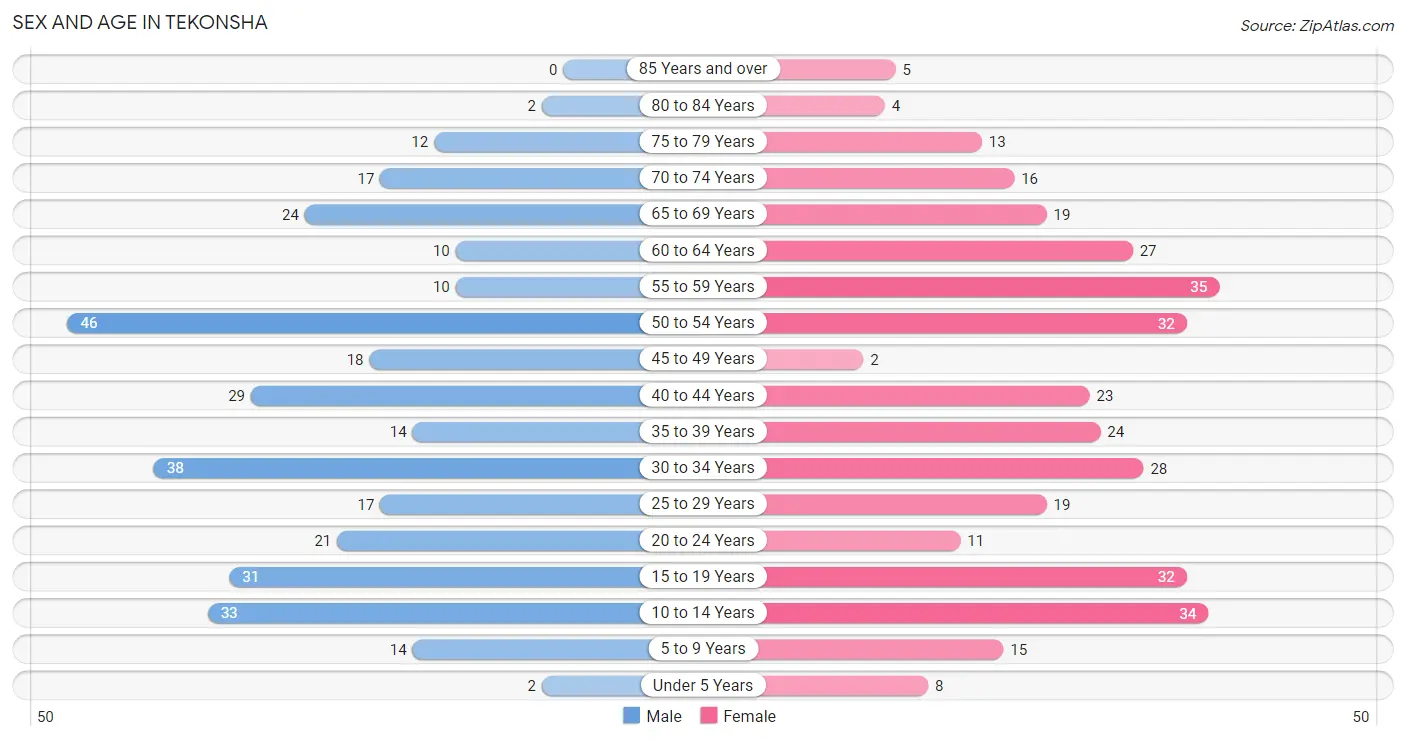
| Age Bracket | Male | Female |
| Under 5 Years | 2 (0.6%) | 8 (2.3%) |
| 5 to 9 Years | 14 (4.1%) | 15 (4.3%) |
| 10 to 14 Years | 33 (9.8%) | 34 (9.8%) |
| 15 to 19 Years | 31 (9.2%) | 32 (9.2%) |
| 20 to 24 Years | 21 (6.2%) | 11 (3.2%) |
| 25 to 29 Years | 17 (5.0%) | 19 (5.5%) |
| 30 to 34 Years | 38 (11.2%) | 28 (8.1%) |
| 35 to 39 Years | 14 (4.1%) | 24 (6.9%) |
| 40 to 44 Years | 29 (8.6%) | 23 (6.6%) |
| 45 to 49 Years | 18 (5.3%) | 2 (0.6%) |
| 50 to 54 Years | 46 (13.6%) | 32 (9.2%) |
| 55 to 59 Years | 10 (3.0%) | 35 (10.1%) |
| 60 to 64 Years | 10 (3.0%) | 27 (7.8%) |
| 65 to 69 Years | 24 (7.1%) | 19 (5.5%) |
| 70 to 74 Years | 17 (5.0%) | 16 (4.6%) |
| 75 to 79 Years | 12 (3.5%) | 13 (3.7%) |
| 80 to 84 Years | 2 (0.6%) | 4 (1.1%) |
| 85 Years and over | 0 (0.0%) | 5 (1.4%) |
| Total | 338 (100.0%) | 347 (100.0%) |
Families and Households in Tekonsha
Median Family Size in Tekonsha
The median family size in Tekonsha is 3.07 persons per family, with single female/mother families (51 | 30.7%) accounting for the largest median family size of 3.41 persons per family. On the other hand, single male/father families (17 | 10.2%) represent the smallest median family size with 2.29 persons per family.
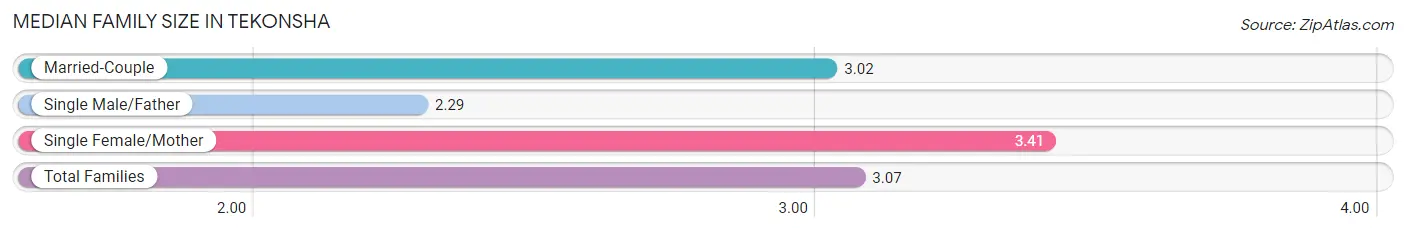
| Family Type | # Families | Family Size |
| Married-Couple | 98 (59.0%) | 3.02 |
| Single Male/Father | 17 (10.2%) | 2.29 |
| Single Female/Mother | 51 (30.7%) | 3.41 |
| Total Families | 166 (100.0%) | 3.07 |
Median Household Size in Tekonsha
The median household size in Tekonsha is 2.57 persons per household, with single female/mother households (51 | 19.1%) accounting for the largest median household size of 3.78 persons per household. non-family households (101 | 37.8%) represent the smallest median household size with 1.32 persons per household.
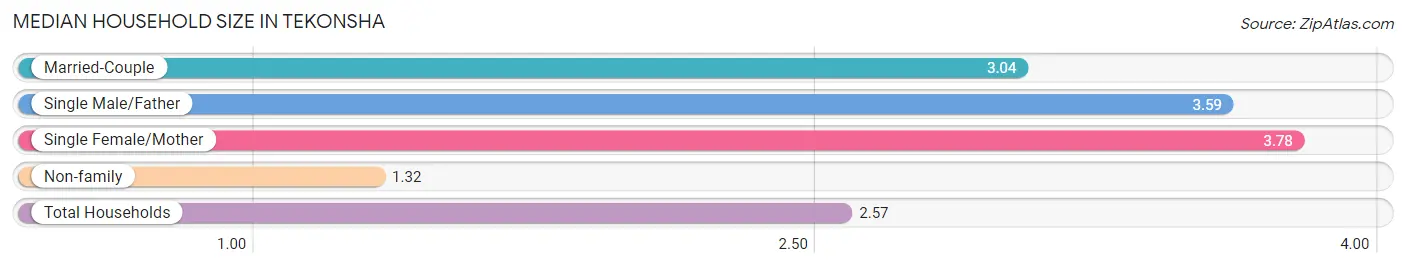
| Household Type | # Households | Household Size |
| Married-Couple | 98 (36.7%) | 3.04 |
| Single Male/Father | 17 (6.4%) | 3.59 |
| Single Female/Mother | 51 (19.1%) | 3.78 |
| Non-family | 101 (37.8%) | 1.32 |
| Total Households | 267 (100.0%) | 2.57 |
Household Size by Marriage Status in Tekonsha
Out of a total of 267 households in Tekonsha, 166 (62.2%) are family households, while 101 (37.8%) are nonfamily households. The most numerous type of family households are 2-person households, comprising 68, and the most common type of nonfamily households are 1-person households, comprising 78.
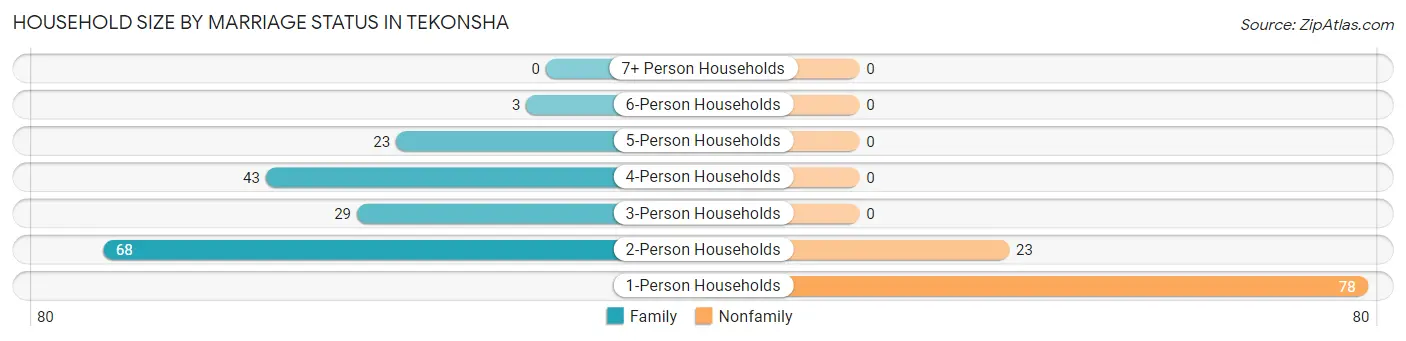
| Household Size | Family Households | Nonfamily Households |
| 1-Person Households | - | 78 (29.2%) |
| 2-Person Households | 68 (25.5%) | 23 (8.6%) |
| 3-Person Households | 29 (10.9%) | 0 (0.0%) |
| 4-Person Households | 43 (16.1%) | 0 (0.0%) |
| 5-Person Households | 23 (8.6%) | 0 (0.0%) |
| 6-Person Households | 3 (1.1%) | 0 (0.0%) |
| 7+ Person Households | 0 (0.0%) | 0 (0.0%) |
| Total | 166 (62.2%) | 101 (37.8%) |
Female Fertility in Tekonsha
Fertility by Age in Tekonsha
Average fertility rate in Tekonsha is 76.0 births per 1,000 women. Women in the age bracket of 20 to 34 years have the highest fertility rate with 190.0 births per 1,000 women. Women in the age bracket of 20 to 34 years acount for 100.0% of all women with births.
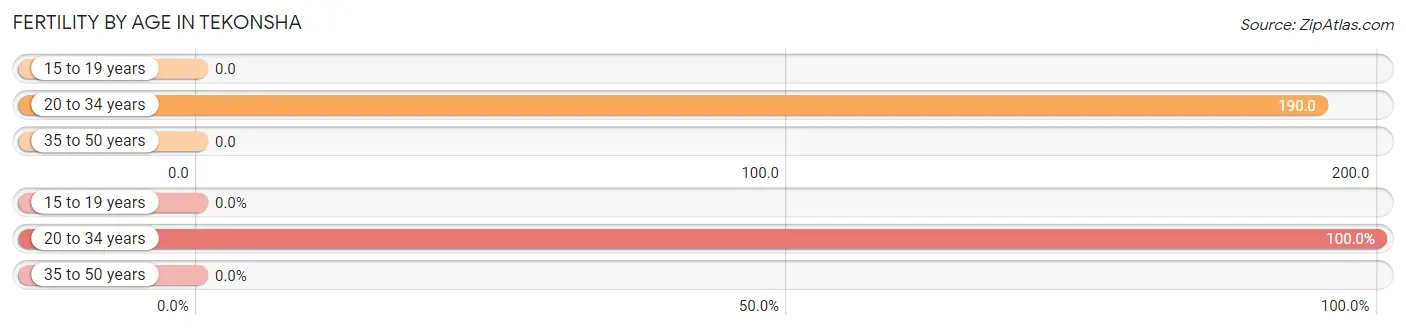
| Age Bracket | Women with Births | Births / 1,000 Women |
| 15 to 19 years | 0 (0.0%) | 0.0 |
| 20 to 34 years | 11 (100.0%) | 190.0 |
| 35 to 50 years | 0 (0.0%) | 0.0 |
| Total | 11 (100.0%) | 76.0 |
Fertility by Age by Marriage Status in Tekonsha
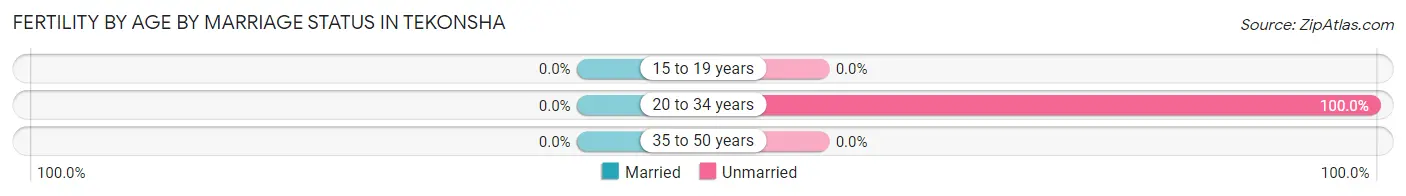
| Age Bracket | Married | Unmarried |
| 15 to 19 years | 0 (0.0%) | 0 (0.0%) |
| 20 to 34 years | 0 (0.0%) | 11 (100.0%) |
| 35 to 50 years | 0 (0.0%) | 0 (0.0%) |
| Total | 0 (0.0%) | 11 (100.0%) |
Fertility by Education in Tekonsha
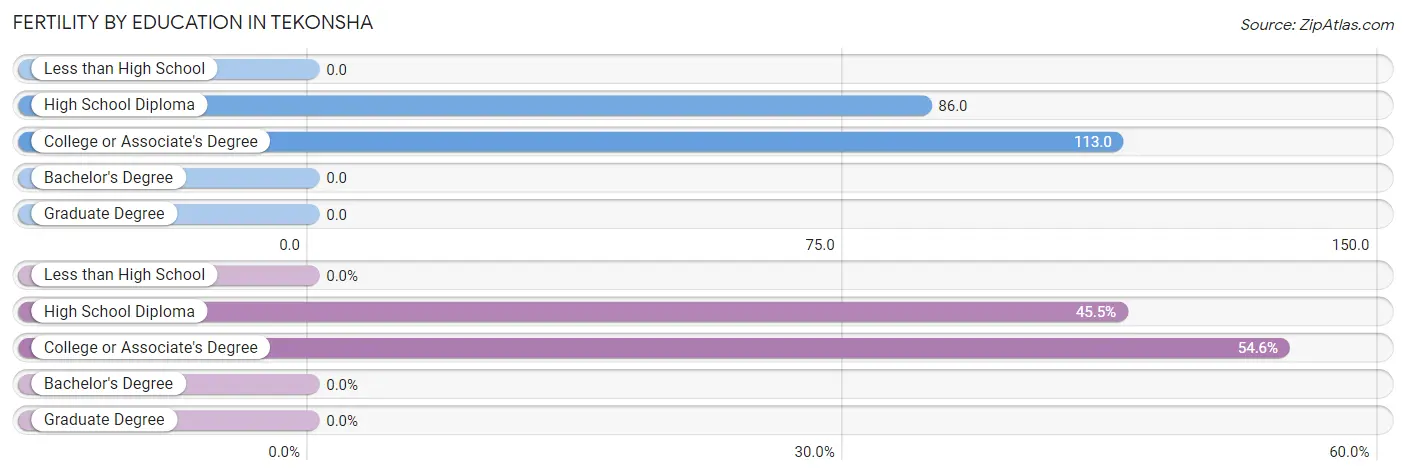
| Educational Attainment | Women with Births | Births / 1,000 Women |
| Less than High School | 0 (0.0%) | 0.0 |
| High School Diploma | 5 (45.5%) | 86.0 |
| College or Associate's Degree | 6 (54.5%) | 113.0 |
| Bachelor's Degree | 0 (0.0%) | 0.0 |
| Graduate Degree | 0 (0.0%) | 0.0 |
| Total | 11 (100.0%) | 76.0 |
Fertility by Education by Marriage Status in Tekonsha
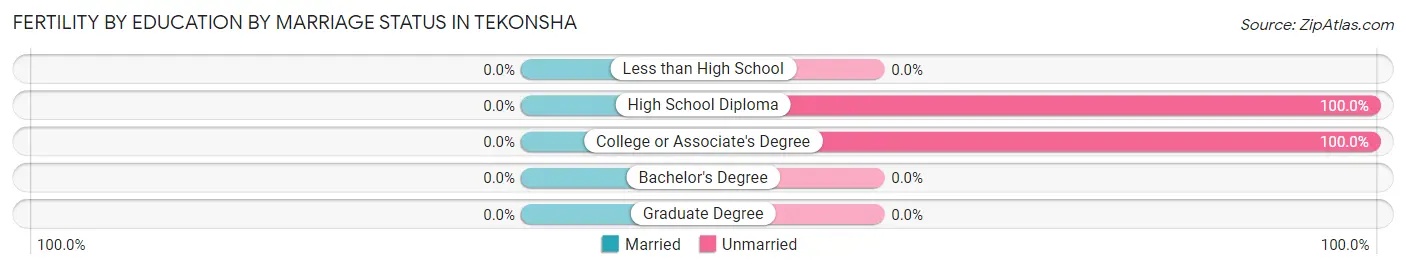
| Educational Attainment | Married | Unmarried |
| Less than High School | 0 (0.0%) | 0 (0.0%) |
| High School Diploma | 0 (0.0%) | 5 (100.0%) |
| College or Associate's Degree | 0 (0.0%) | 6 (100.0%) |
| Bachelor's Degree | 0 (0.0%) | 0 (0.0%) |
| Graduate Degree | 0 (0.0%) | 0 (0.0%) |
| Total | 0 (0.0%) | 11 (100.0%) |
Employment Characteristics in Tekonsha
Employment by Class of Employer in Tekonsha
Among the 283 employed individuals in Tekonsha, private company employees (206 | 72.8%), local government employees (45 | 15.9%), and not-for-profit organizations (14 | 5.0%) make up the most common classes of employment.
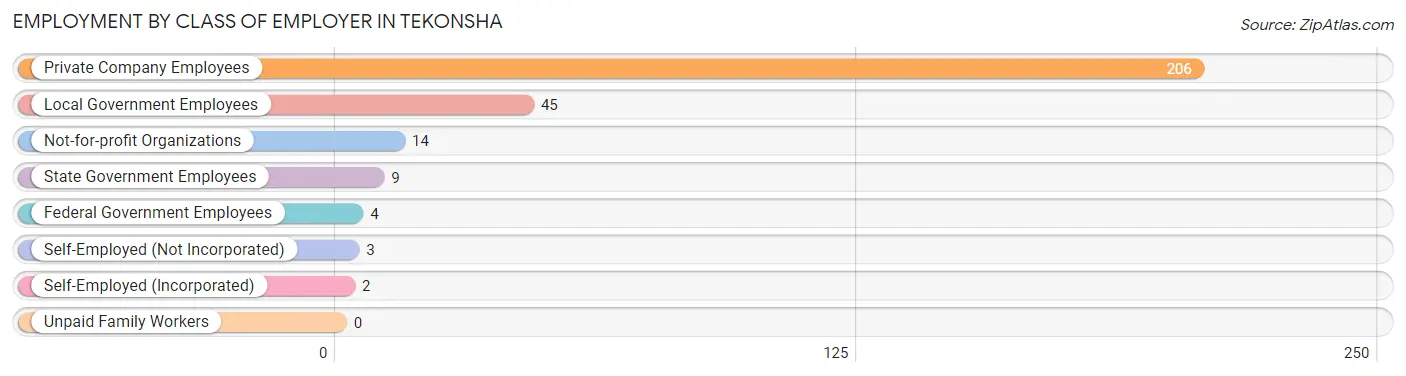
| Employer Class | # Employees | % Employees |
| Private Company Employees | 206 | 72.8% |
| Self-Employed (Incorporated) | 2 | 0.7% |
| Self-Employed (Not Incorporated) | 3 | 1.1% |
| Not-for-profit Organizations | 14 | 5.0% |
| Local Government Employees | 45 | 15.9% |
| State Government Employees | 9 | 3.2% |
| Federal Government Employees | 4 | 1.4% |
| Unpaid Family Workers | 0 | 0.0% |
| Total | 283 | 100.0% |
Employment Status by Age in Tekonsha
According to the labor force statistics for Tekonsha, out of the total population over 16 years of age (557), 58.2% or 324 individuals are in the labor force, with 10.5% or 34 of them unemployed. The age group with the highest labor force participation rate is 25 to 29 years, with 88.9% or 32 individuals in the labor force. Within the labor force, the 65 to 74 years age range has the highest percentage of unemployed individuals, with 29.4% or 5 of them being unemployed.
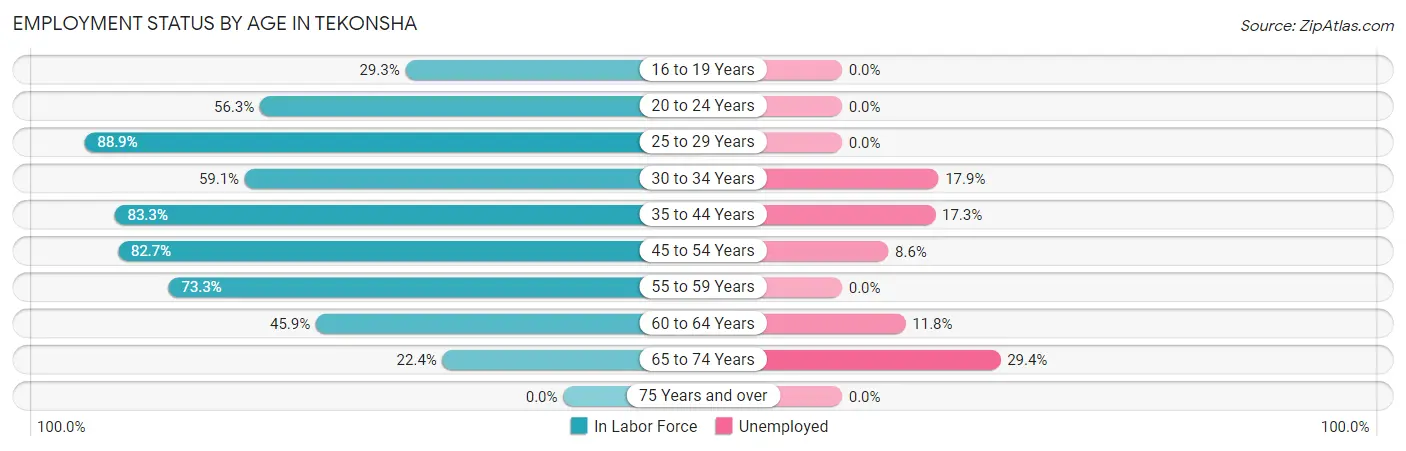
| Age Bracket | In Labor Force | Unemployed |
| 16 to 19 Years | 12 (29.3%) | 0 (0.0%) |
| 20 to 24 Years | 18 (56.3%) | 0 (0.0%) |
| 25 to 29 Years | 32 (88.9%) | 0 (0.0%) |
| 30 to 34 Years | 39 (59.1%) | 7 (17.9%) |
| 35 to 44 Years | 75 (83.3%) | 13 (17.3%) |
| 45 to 54 Years | 81 (82.7%) | 7 (8.6%) |
| 55 to 59 Years | 33 (73.3%) | 0 (0.0%) |
| 60 to 64 Years | 17 (45.9%) | 2 (11.8%) |
| 65 to 74 Years | 17 (22.4%) | 5 (29.4%) |
| 75 Years and over | 0 (0.0%) | 0 (0.0%) |
| Total | 324 (58.2%) | 34 (10.5%) |
Employment Status by Educational Attainment in Tekonsha
According to labor force statistics for Tekonsha, 74.5% of individuals (277) out of the total population between 25 and 64 years of age (372) are in the labor force, with 10.5% or 29 of them being unemployed. The group with the highest labor force participation rate are those with the educational attainment of bachelor's degree or higher, with 88.4% or 38 individuals in the labor force. Within the labor force, individuals with high school diploma education have the highest percentage of unemployment, with 15.8% or 21 of them being unemployed.
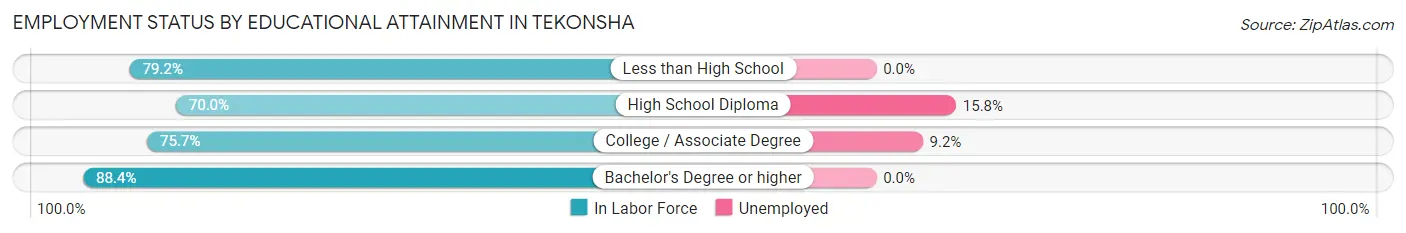
| Educational Attainment | In Labor Force | Unemployed |
| Less than High School | 19 (79.2%) | 0 (0.0%) |
| High School Diploma | 133 (70.0%) | 30 (15.8%) |
| College / Associate Degree | 87 (75.7%) | 11 (9.2%) |
| Bachelor's Degree or higher | 38 (88.4%) | 0 (0.0%) |
| Total | 277 (74.5%) | 39 (10.5%) |
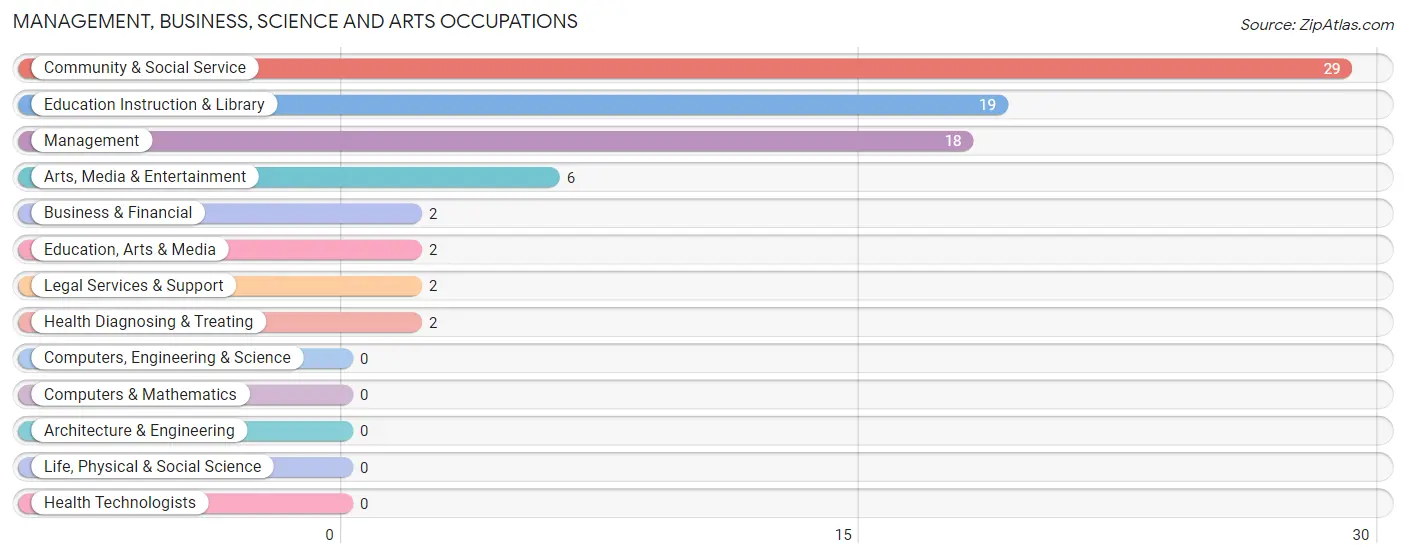
Employment Occupations by Sex in Tekonsha
Management, Business, Science and Arts Occupations
The most common Management, Business, Science and Arts occupations in Tekonsha are Community & Social Service (29 | 10.0%), Education Instruction & Library (19 | 6.6%), Management (18 | 6.2%), Arts, Media & Entertainment (6 | 2.1%), and Business & Financial (2 | 0.7%).
Management, Business, Science and Arts Occupations by Sex
Within the Management, Business, Science and Arts occupations in Tekonsha, the most male-oriented occupations are Education, Arts & Media (100.0%), Arts, Media & Entertainment (50.0%), and Management (33.3%), while the most female-oriented occupations are Business & Financial (100.0%), Legal Services & Support (100.0%), and Education Instruction & Library (100.0%).
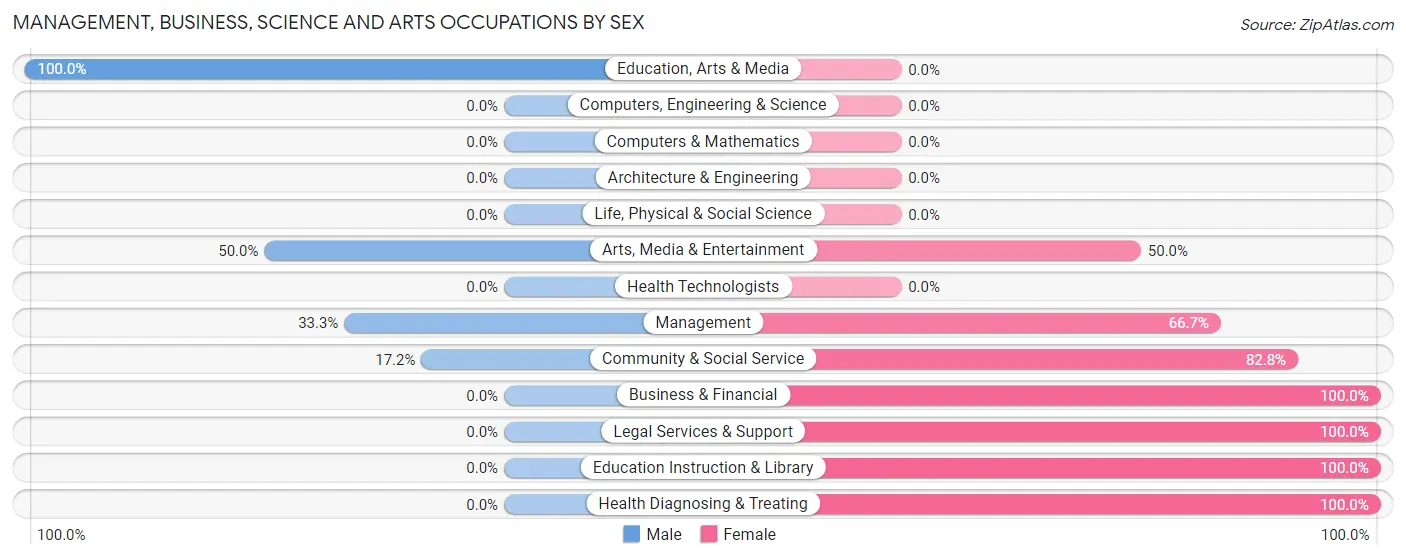
| Occupation | Male | Female |
| Management | 6 (33.3%) | 12 (66.7%) |
| Business & Financial | 0 (0.0%) | 2 (100.0%) |
| Computers, Engineering & Science | 0 (0.0%) | 0 (0.0%) |
| Computers & Mathematics | 0 (0.0%) | 0 (0.0%) |
| Architecture & Engineering | 0 (0.0%) | 0 (0.0%) |
| Life, Physical & Social Science | 0 (0.0%) | 0 (0.0%) |
| Community & Social Service | 5 (17.2%) | 24 (82.8%) |
| Education, Arts & Media | 2 (100.0%) | 0 (0.0%) |
| Legal Services & Support | 0 (0.0%) | 2 (100.0%) |
| Education Instruction & Library | 0 (0.0%) | 19 (100.0%) |
| Arts, Media & Entertainment | 3 (50.0%) | 3 (50.0%) |
| Health Diagnosing & Treating | 0 (0.0%) | 2 (100.0%) |
| Health Technologists | 0 (0.0%) | 0 (0.0%) |
| Total (Category) | 11 (21.6%) | 40 (78.4%) |
| Total (Overall) | 154 (53.1%) | 136 (46.9%) |
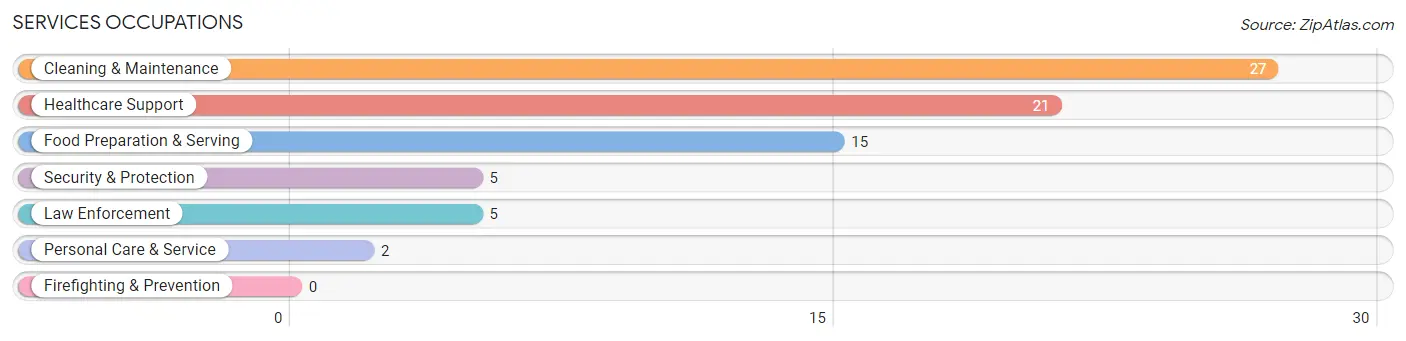
Services Occupations
The most common Services occupations in Tekonsha are Cleaning & Maintenance (27 | 9.3%), Healthcare Support (21 | 7.2%), Food Preparation & Serving (15 | 5.2%), Security & Protection (5 | 1.7%), and Law Enforcement (5 | 1.7%).
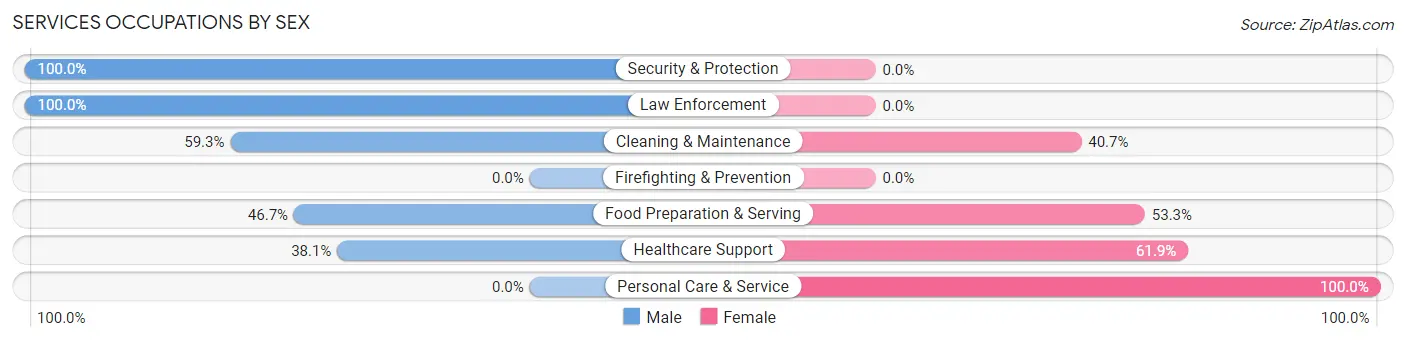
Services Occupations by Sex
Within the Services occupations in Tekonsha, the most male-oriented occupations are Security & Protection (100.0%), Law Enforcement (100.0%), and Cleaning & Maintenance (59.3%), while the most female-oriented occupations are Personal Care & Service (100.0%), Healthcare Support (61.9%), and Food Preparation & Serving (53.3%).
| Occupation | Male | Female |
| Healthcare Support | 8 (38.1%) | 13 (61.9%) |
| Security & Protection | 5 (100.0%) | 0 (0.0%) |
| Firefighting & Prevention | 0 (0.0%) | 0 (0.0%) |
| Law Enforcement | 5 (100.0%) | 0 (0.0%) |
| Food Preparation & Serving | 7 (46.7%) | 8 (53.3%) |
| Cleaning & Maintenance | 16 (59.3%) | 11 (40.7%) |
| Personal Care & Service | 0 (0.0%) | 2 (100.0%) |
| Total (Category) | 36 (51.4%) | 34 (48.6%) |
| Total (Overall) | 154 (53.1%) | 136 (46.9%) |
Sales and Office Occupations
The most common Sales and Office occupations in Tekonsha are Office & Administration (39 | 13.5%), and Sales & Related (15 | 5.2%).
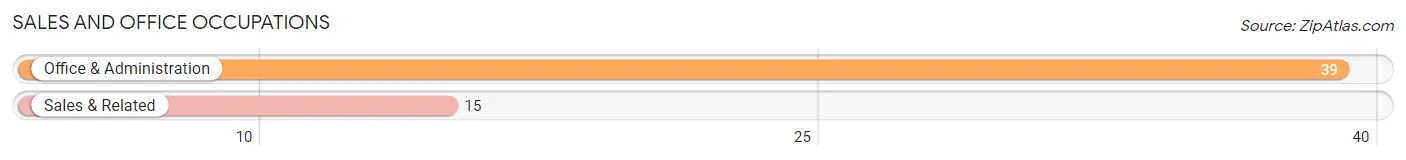
Sales and Office Occupations by Sex
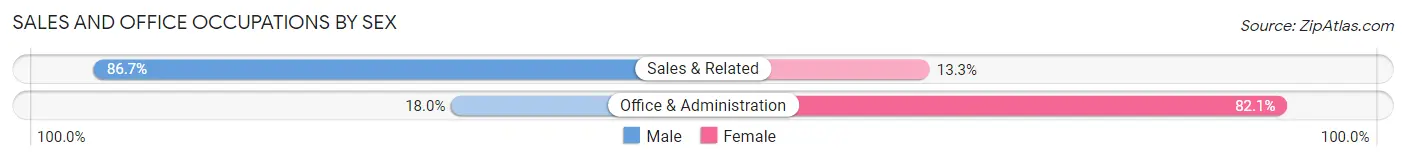
| Occupation | Male | Female |
| Sales & Related | 13 (86.7%) | 2 (13.3%) |
| Office & Administration | 7 (17.9%) | 32 (82.1%) |
| Total (Category) | 20 (37.0%) | 34 (63.0%) |
| Total (Overall) | 154 (53.1%) | 136 (46.9%) |
Natural Resources, Construction and Maintenance Occupations
The most common Natural Resources, Construction and Maintenance occupations in Tekonsha are Installation, Maintenance & Repair (13 | 4.5%), Farming, Fishing & Forestry (9 | 3.1%), and Construction & Extraction (1 | 0.3%).
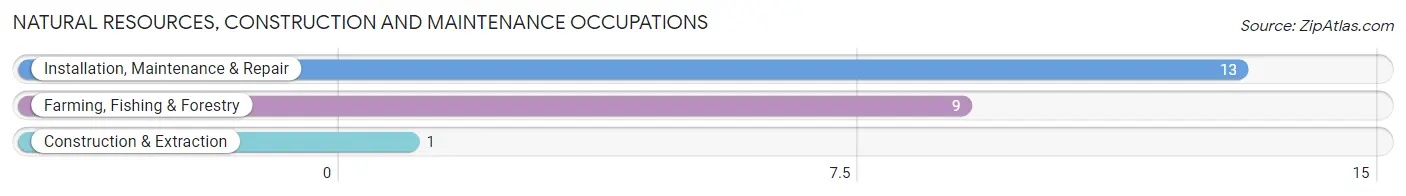
Natural Resources, Construction and Maintenance Occupations by Sex
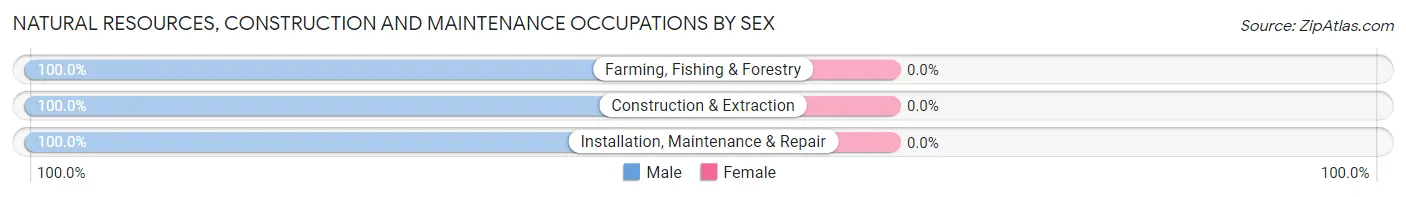
| Occupation | Male | Female |
| Farming, Fishing & Forestry | 9 (100.0%) | 0 (0.0%) |
| Construction & Extraction | 1 (100.0%) | 0 (0.0%) |
| Installation, Maintenance & Repair | 13 (100.0%) | 0 (0.0%) |
| Total (Category) | 23 (100.0%) | 0 (0.0%) |
| Total (Overall) | 154 (53.1%) | 136 (46.9%) |
Production, Transportation and Moving Occupations
The most common Production, Transportation and Moving occupations in Tekonsha are Production (48 | 16.6%), Transportation (25 | 8.6%), and Material Moving (19 | 6.6%).
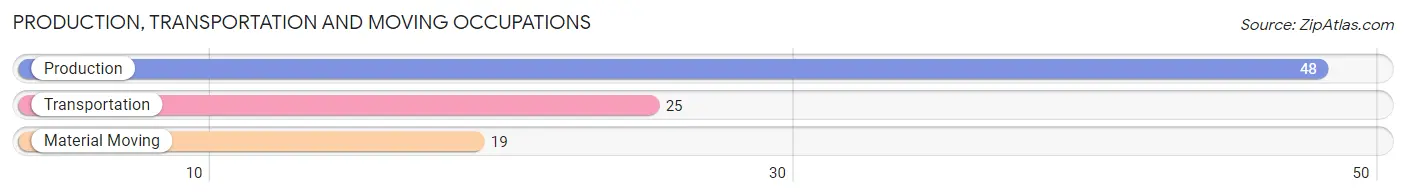
Production, Transportation and Moving Occupations by Sex
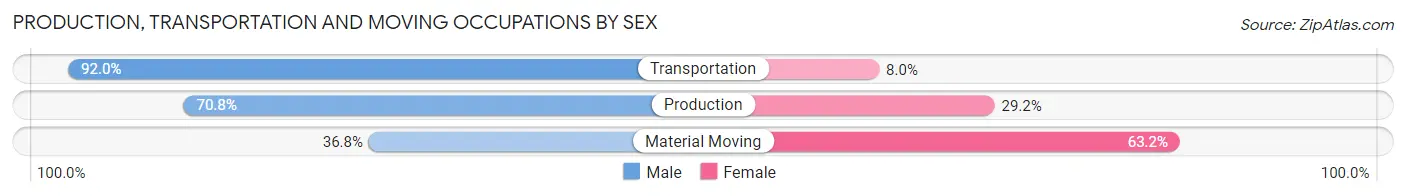
| Occupation | Male | Female |
| Production | 34 (70.8%) | 14 (29.2%) |
| Transportation | 23 (92.0%) | 2 (8.0%) |
| Material Moving | 7 (36.8%) | 12 (63.2%) |
| Total (Category) | 64 (69.6%) | 28 (30.4%) |
| Total (Overall) | 154 (53.1%) | 136 (46.9%) |
Employment Industries by Sex in Tekonsha
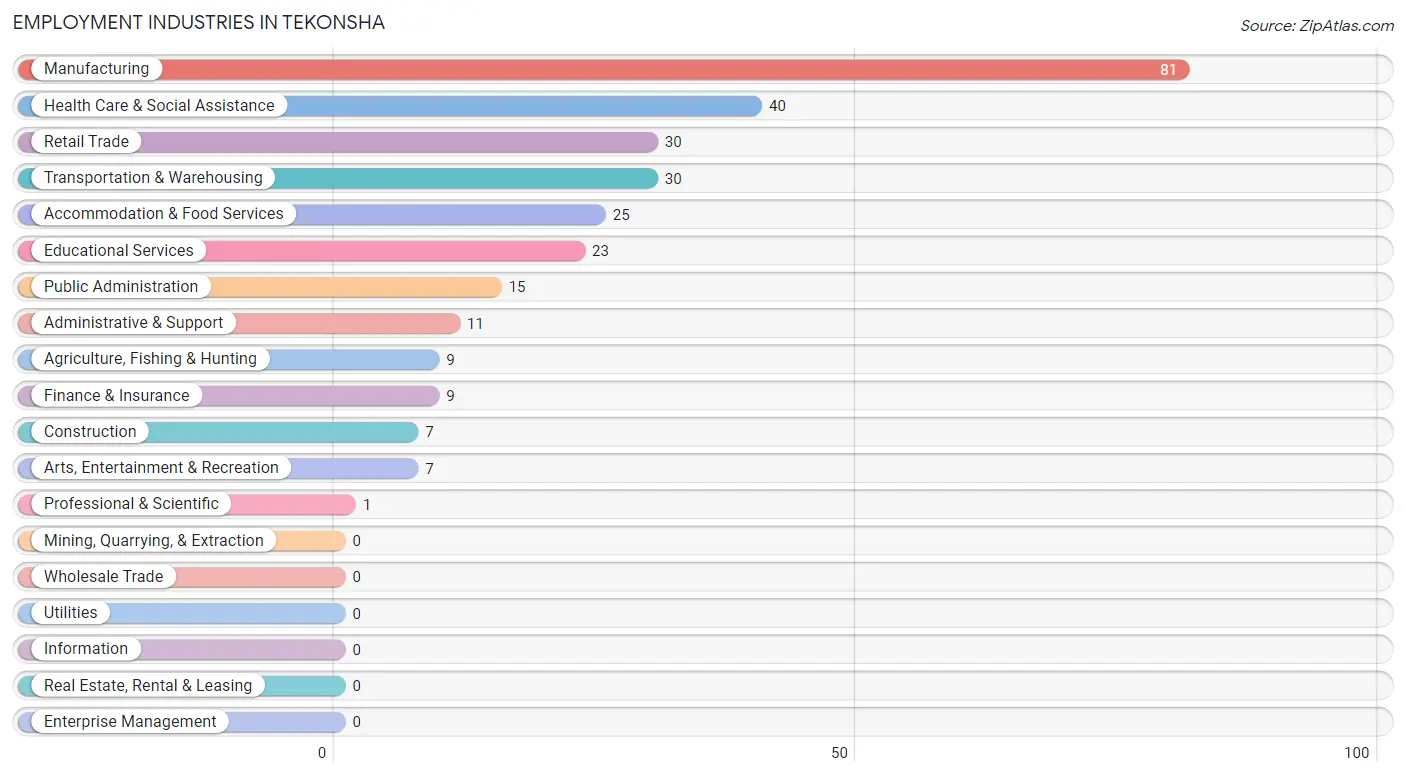
Employment Industries in Tekonsha
The major employment industries in Tekonsha include Manufacturing (81 | 27.9%), Health Care & Social Assistance (40 | 13.8%), Retail Trade (30 | 10.3%), Transportation & Warehousing (30 | 10.3%), and Accommodation & Food Services (25 | 8.6%).
Employment Industries by Sex in Tekonsha
The Tekonsha industries that see more men than women are Agriculture, Fishing & Hunting (100.0%), Transportation & Warehousing (100.0%), and Professional & Scientific (100.0%), whereas the industries that tend to have a higher number of women are Finance & Insurance (100.0%), Educational Services (91.3%), and Health Care & Social Assistance (80.0%).
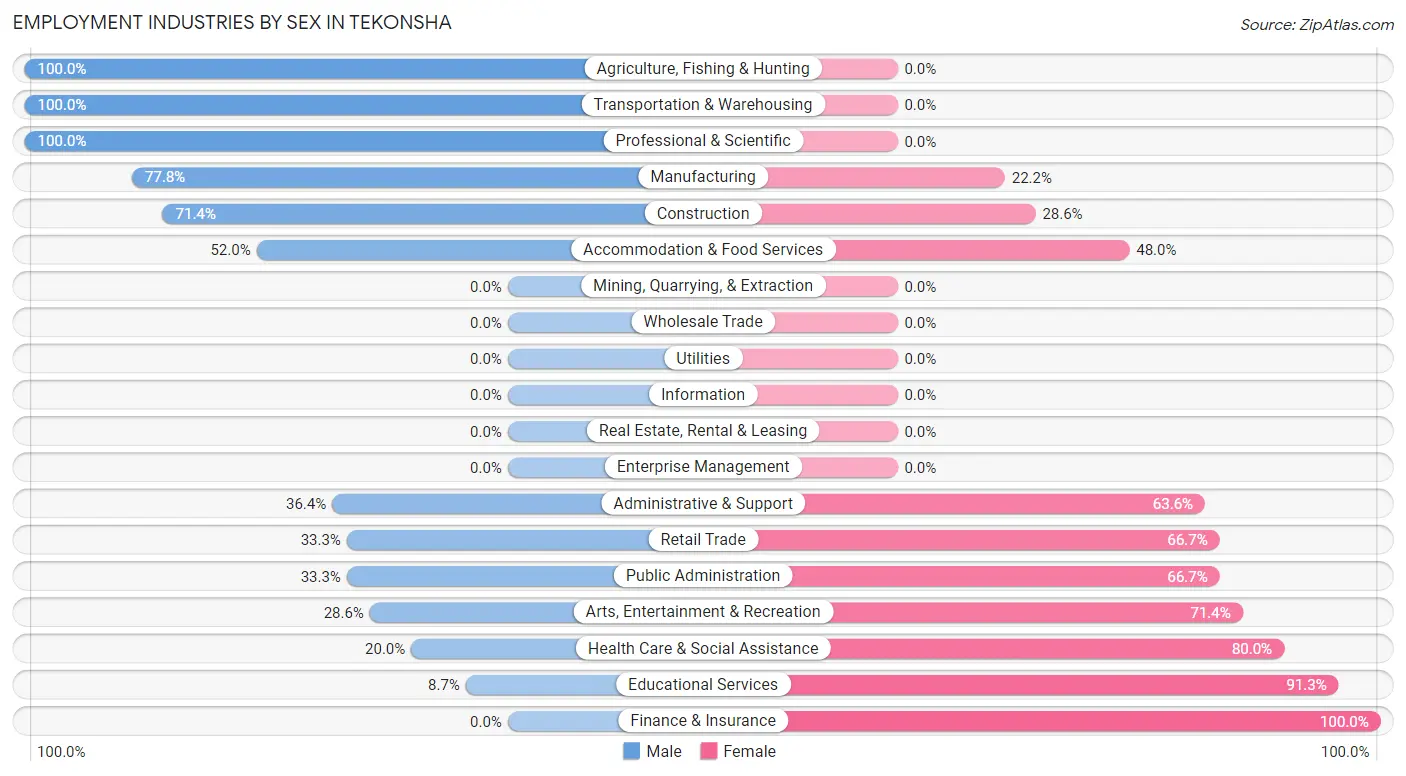
| Industry | Male | Female |
| Agriculture, Fishing & Hunting | 9 (100.0%) | 0 (0.0%) |
| Mining, Quarrying, & Extraction | 0 (0.0%) | 0 (0.0%) |
| Construction | 5 (71.4%) | 2 (28.6%) |
| Manufacturing | 63 (77.8%) | 18 (22.2%) |
| Wholesale Trade | 0 (0.0%) | 0 (0.0%) |
| Retail Trade | 10 (33.3%) | 20 (66.7%) |
| Transportation & Warehousing | 30 (100.0%) | 0 (0.0%) |
| Utilities | 0 (0.0%) | 0 (0.0%) |
| Information | 0 (0.0%) | 0 (0.0%) |
| Finance & Insurance | 0 (0.0%) | 9 (100.0%) |
| Real Estate, Rental & Leasing | 0 (0.0%) | 0 (0.0%) |
| Professional & Scientific | 1 (100.0%) | 0 (0.0%) |
| Enterprise Management | 0 (0.0%) | 0 (0.0%) |
| Administrative & Support | 4 (36.4%) | 7 (63.6%) |
| Educational Services | 2 (8.7%) | 21 (91.3%) |
| Health Care & Social Assistance | 8 (20.0%) | 32 (80.0%) |
| Arts, Entertainment & Recreation | 2 (28.6%) | 5 (71.4%) |
| Accommodation & Food Services | 13 (52.0%) | 12 (48.0%) |
| Public Administration | 5 (33.3%) | 10 (66.7%) |
| Total | 154 (53.1%) | 136 (46.9%) |
Education in Tekonsha
School Enrollment in Tekonsha
The most common levels of schooling among the 163 students in Tekonsha are middle school (58 | 35.6%), high school (57 | 35.0%), and elementary school (23 | 14.1%).
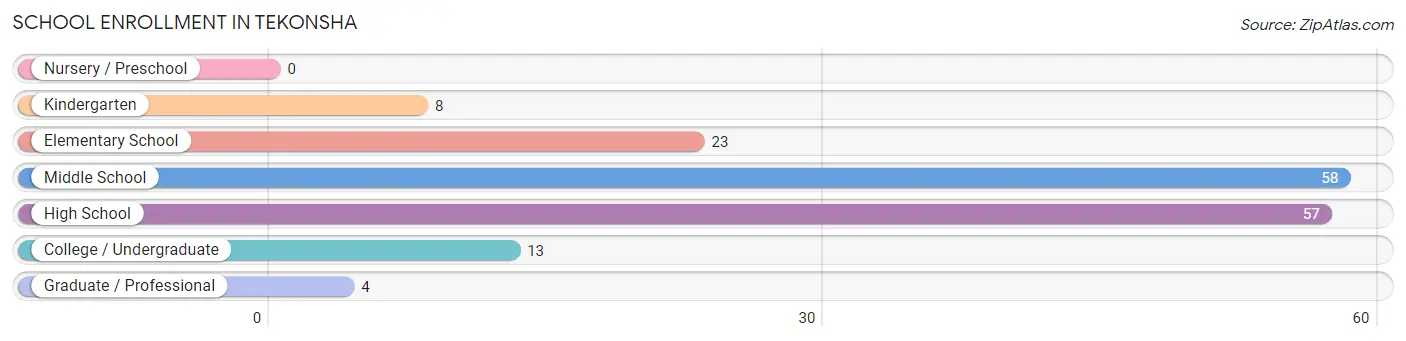
| School Level | # Students | % Students |
| Nursery / Preschool | 0 | 0.0% |
| Kindergarten | 8 | 4.9% |
| Elementary School | 23 | 14.1% |
| Middle School | 58 | 35.6% |
| High School | 57 | 35.0% |
| College / Undergraduate | 13 | 8.0% |
| Graduate / Professional | 4 | 2.5% |
| Total | 163 | 100.0% |
School Enrollment by Age by Funding Source in Tekonsha
Out of a total of 163 students who are enrolled in schools in Tekonsha, 12 (7.4%) attend a private institution, while the remaining 151 (92.6%) are enrolled in public schools. The age group of 35 years and over has the highest likelihood of being enrolled in private schools, with 4 (66.7% in the age bracket) enrolled. Conversely, the age group of 5 to 9 year old has the lowest likelihood of being enrolled in a private school, with 29 (100.0% in the age bracket) attending a public institution.
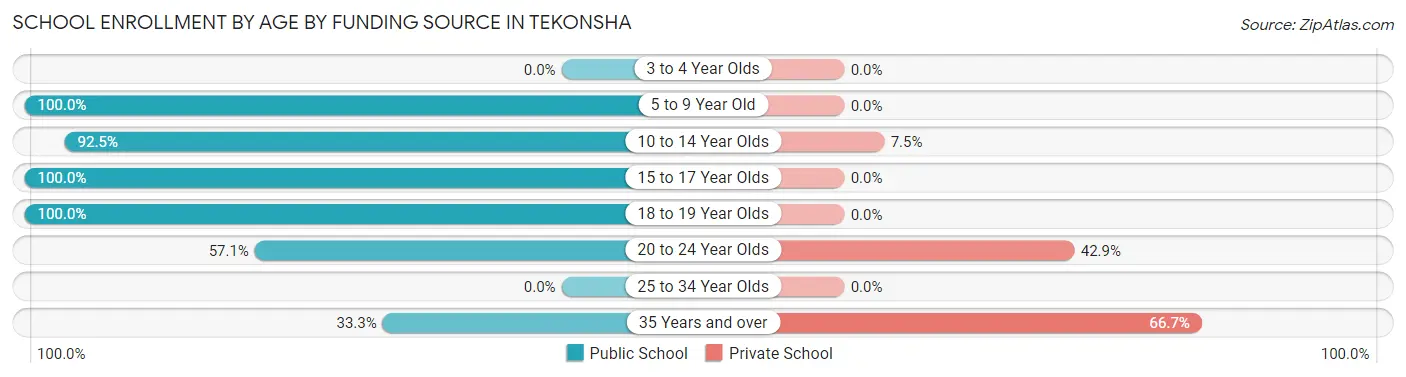
| Age Bracket | Public School | Private School |
| 3 to 4 Year Olds | 0 (0.0%) | 0 (0.0%) |
| 5 to 9 Year Old | 29 (100.0%) | 0 (0.0%) |
| 10 to 14 Year Olds | 62 (92.5%) | 5 (7.5%) |
| 15 to 17 Year Olds | 43 (100.0%) | 0 (0.0%) |
| 18 to 19 Year Olds | 11 (100.0%) | 0 (0.0%) |
| 20 to 24 Year Olds | 4 (57.1%) | 3 (42.9%) |
| 25 to 34 Year Olds | 0 (0.0%) | 0 (0.0%) |
| 35 Years and over | 2 (33.3%) | 4 (66.7%) |
| Total | 151 (92.6%) | 12 (7.4%) |
Educational Attainment by Field of Study in Tekonsha
Education (20 | 32.8%), literature & languages (11 | 18.0%), liberal arts & history (5 | 8.2%), bio, nature & agricultural (4 | 6.6%), and social sciences (4 | 6.6%) are the most common fields of study among 61 individuals in Tekonsha who have obtained a bachelor's degree or higher.
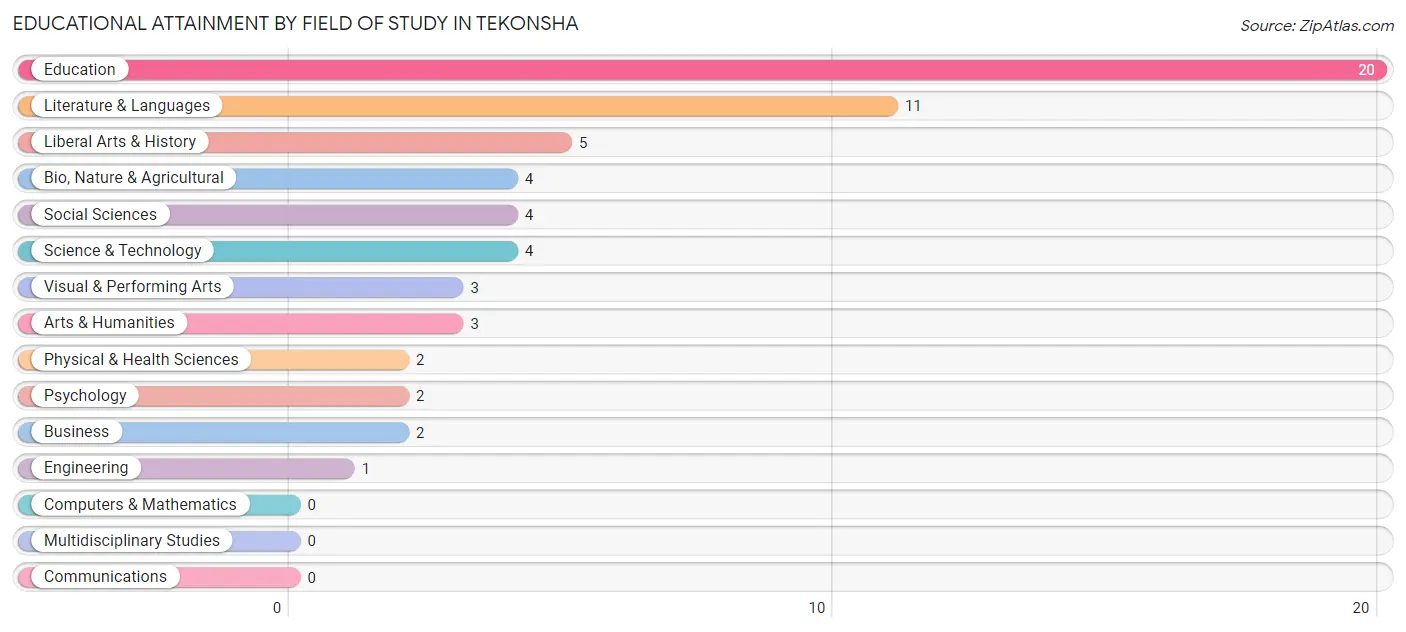
| Field of Study | # Graduates | % Graduates |
| Computers & Mathematics | 0 | 0.0% |
| Bio, Nature & Agricultural | 4 | 6.6% |
| Physical & Health Sciences | 2 | 3.3% |
| Psychology | 2 | 3.3% |
| Social Sciences | 4 | 6.6% |
| Engineering | 1 | 1.6% |
| Multidisciplinary Studies | 0 | 0.0% |
| Science & Technology | 4 | 6.6% |
| Business | 2 | 3.3% |
| Education | 20 | 32.8% |
| Literature & Languages | 11 | 18.0% |
| Liberal Arts & History | 5 | 8.2% |
| Visual & Performing Arts | 3 | 4.9% |
| Communications | 0 | 0.0% |
| Arts & Humanities | 3 | 4.9% |
| Total | 61 | 100.0% |
Transportation & Commute in Tekonsha
Vehicle Availability by Sex in Tekonsha
The most prevalent vehicle ownership categories in Tekonsha are males with 2 vehicles (70, accounting for 46.7%) and females with 2 vehicles (62, making up 52.6%).
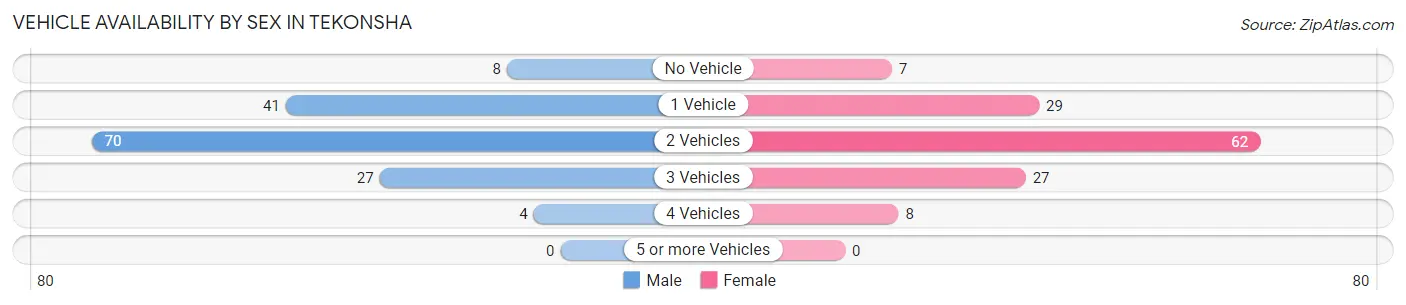
| Vehicles Available | Male | Female |
| No Vehicle | 8 (5.3%) | 7 (5.3%) |
| 1 Vehicle | 41 (27.3%) | 29 (21.8%) |
| 2 Vehicles | 70 (46.7%) | 62 (46.6%) |
| 3 Vehicles | 27 (18.0%) | 27 (20.3%) |
| 4 Vehicles | 4 (2.7%) | 8 (6.0%) |
| 5 or more Vehicles | 0 (0.0%) | 0 (0.0%) |
| Total | 150 (100.0%) | 133 (100.0%) |
Commute Time in Tekonsha
The most frequently occuring commute durations in Tekonsha are 15 to 19 minutes (74 commuters, 26.2%), 20 to 24 minutes (71 commuters, 25.2%), and 5 to 9 minutes (32 commuters, 11.4%).
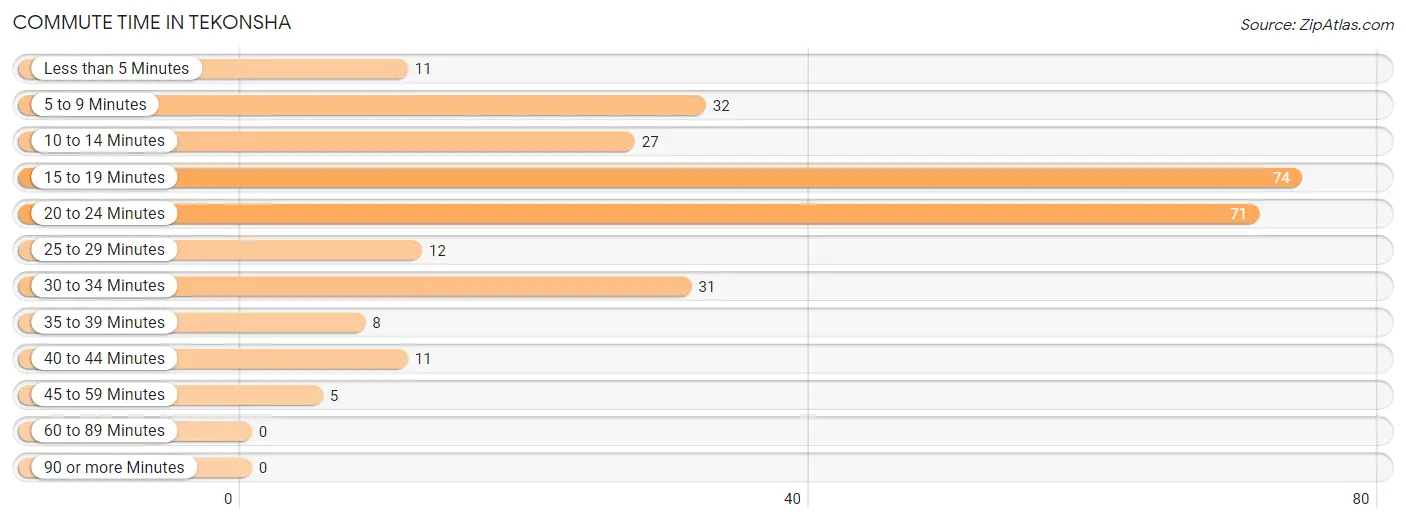
| Commute Time | # Commuters | % Commuters |
| Less than 5 Minutes | 11 | 3.9% |
| 5 to 9 Minutes | 32 | 11.4% |
| 10 to 14 Minutes | 27 | 9.6% |
| 15 to 19 Minutes | 74 | 26.2% |
| 20 to 24 Minutes | 71 | 25.2% |
| 25 to 29 Minutes | 12 | 4.3% |
| 30 to 34 Minutes | 31 | 11.0% |
| 35 to 39 Minutes | 8 | 2.8% |
| 40 to 44 Minutes | 11 | 3.9% |
| 45 to 59 Minutes | 5 | 1.8% |
| 60 to 89 Minutes | 0 | 0.0% |
| 90 or more Minutes | 0 | 0.0% |
Commute Time by Sex in Tekonsha
The most common commute times in Tekonsha are 15 to 19 minutes (44 commuters, 29.5%) for males and 20 to 24 minutes (48 commuters, 36.1%) for females.
| Commute Time | Male | Female |
| Less than 5 Minutes | 0 (0.0%) | 11 (8.3%) |
| 5 to 9 Minutes | 13 (8.7%) | 19 (14.3%) |
| 10 to 14 Minutes | 23 (15.4%) | 4 (3.0%) |
| 15 to 19 Minutes | 44 (29.5%) | 30 (22.6%) |
| 20 to 24 Minutes | 23 (15.4%) | 48 (36.1%) |
| 25 to 29 Minutes | 10 (6.7%) | 2 (1.5%) |
| 30 to 34 Minutes | 23 (15.4%) | 8 (6.0%) |
| 35 to 39 Minutes | 6 (4.0%) | 2 (1.5%) |
| 40 to 44 Minutes | 5 (3.4%) | 6 (4.5%) |
| 45 to 59 Minutes | 2 (1.3%) | 3 (2.3%) |
| 60 to 89 Minutes | 0 (0.0%) | 0 (0.0%) |
| 90 or more Minutes | 0 (0.0%) | 0 (0.0%) |
Time of Departure to Work by Sex in Tekonsha
The most frequent times of departure to work in Tekonsha are 5:00 AM to 5:29 AM (44, 29.5%) for males and 4:00 PM to 11:59 PM (29, 21.8%) for females.
| Time of Departure | Male | Female |
| 12:00 AM to 4:59 AM | 20 (13.4%) | 12 (9.0%) |
| 5:00 AM to 5:29 AM | 44 (29.5%) | 2 (1.5%) |
| 5:30 AM to 5:59 AM | 7 (4.7%) | 3 (2.3%) |
| 6:00 AM to 6:29 AM | 7 (4.7%) | 8 (6.0%) |
| 6:30 AM to 6:59 AM | 15 (10.1%) | 16 (12.0%) |
| 7:00 AM to 7:29 AM | 2 (1.3%) | 21 (15.8%) |
| 7:30 AM to 7:59 AM | 18 (12.1%) | 21 (15.8%) |
| 8:00 AM to 8:29 AM | 5 (3.4%) | 2 (1.5%) |
| 8:30 AM to 8:59 AM | 2 (1.3%) | 10 (7.5%) |
| 9:00 AM to 9:59 AM | 2 (1.3%) | 5 (3.8%) |
| 10:00 AM to 10:59 AM | 12 (8.1%) | 0 (0.0%) |
| 11:00 AM to 11:59 AM | 0 (0.0%) | 0 (0.0%) |
| 12:00 PM to 3:59 PM | 9 (6.0%) | 4 (3.0%) |
| 4:00 PM to 11:59 PM | 6 (4.0%) | 29 (21.8%) |
| Total | 149 (100.0%) | 133 (100.0%) |
Housing Occupancy in Tekonsha
Occupancy by Ownership in Tekonsha
Of the total 267 dwellings in Tekonsha, owner-occupied units account for 214 (80.1%), while renter-occupied units make up 53 (19.9%).
| Occupancy | # Housing Units | % Housing Units |
| Owner Occupied Housing Units | 214 | 80.1% |
| Renter-Occupied Housing Units | 53 | 19.9% |
| Total Occupied Housing Units | 267 | 100.0% |
Occupancy by Household Size in Tekonsha
| Household Size | # Housing Units | % Housing Units |
| 1-Person Household | 78 | 29.2% |
| 2-Person Household | 91 | 34.1% |
| 3-Person Household | 29 | 10.9% |
| 4+ Person Household | 69 | 25.8% |
| Total Housing Units | 267 | 100.0% |
Occupancy by Ownership by Household Size in Tekonsha
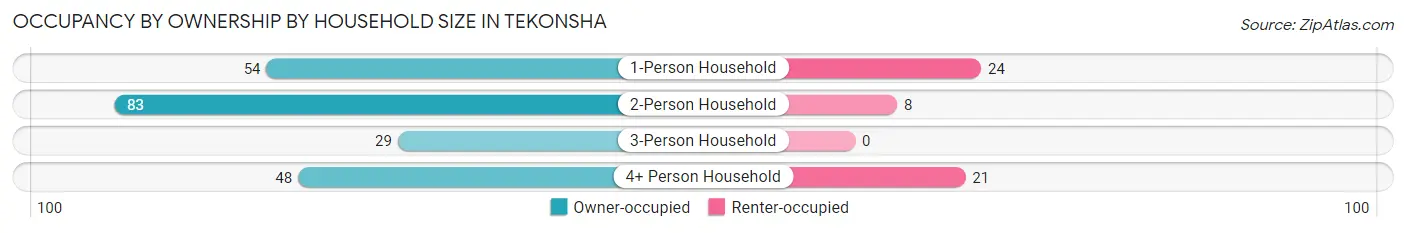
| Household Size | Owner-occupied | Renter-occupied |
| 1-Person Household | 54 (69.2%) | 24 (30.8%) |
| 2-Person Household | 83 (91.2%) | 8 (8.8%) |
| 3-Person Household | 29 (100.0%) | 0 (0.0%) |
| 4+ Person Household | 48 (69.6%) | 21 (30.4%) |
| Total Housing Units | 214 (80.1%) | 53 (19.9%) |
Occupancy by Educational Attainment in Tekonsha
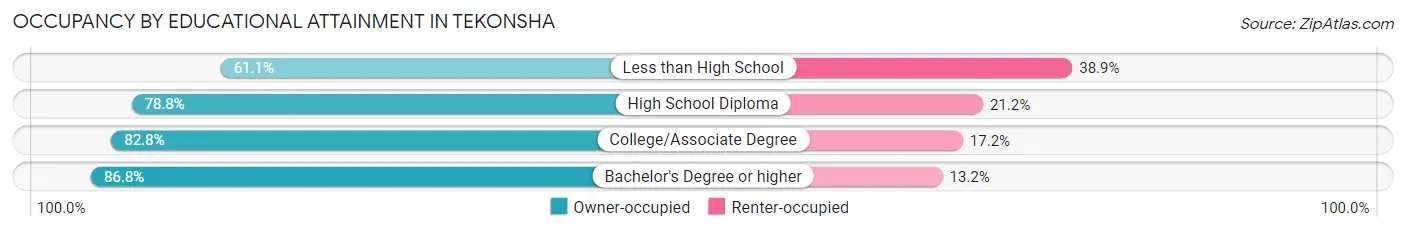
| Household Size | Owner-occupied | Renter-occupied |
| Less than High School | 11 (61.1%) | 7 (38.9%) |
| High School Diploma | 93 (78.8%) | 25 (21.2%) |
| College/Associate Degree | 77 (82.8%) | 16 (17.2%) |
| Bachelor's Degree or higher | 33 (86.8%) | 5 (13.2%) |
Occupancy by Age of Householder in Tekonsha
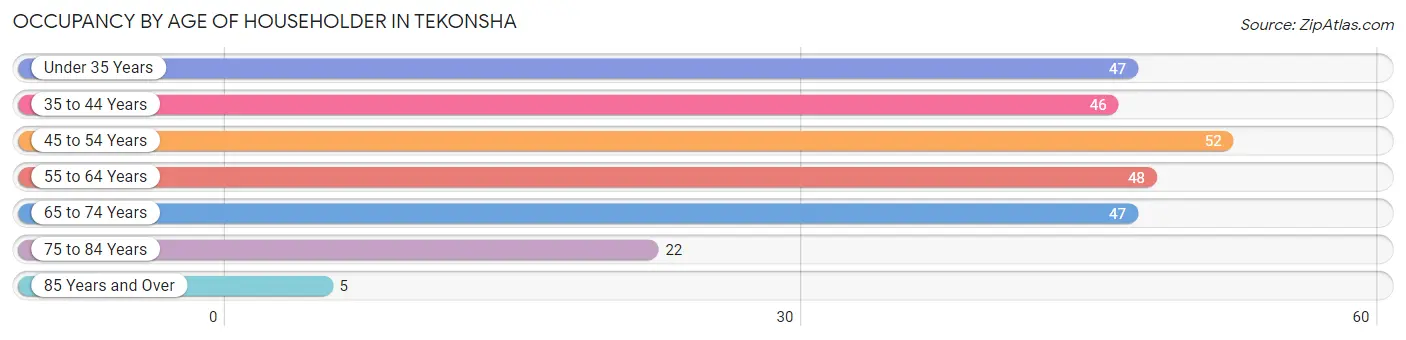
| Age Bracket | # Households | % Households |
| Under 35 Years | 47 | 17.6% |
| 35 to 44 Years | 46 | 17.2% |
| 45 to 54 Years | 52 | 19.5% |
| 55 to 64 Years | 48 | 18.0% |
| 65 to 74 Years | 47 | 17.6% |
| 75 to 84 Years | 22 | 8.2% |
| 85 Years and Over | 5 | 1.9% |
| Total | 267 | 100.0% |
Housing Finances in Tekonsha
Median Income by Occupancy in Tekonsha
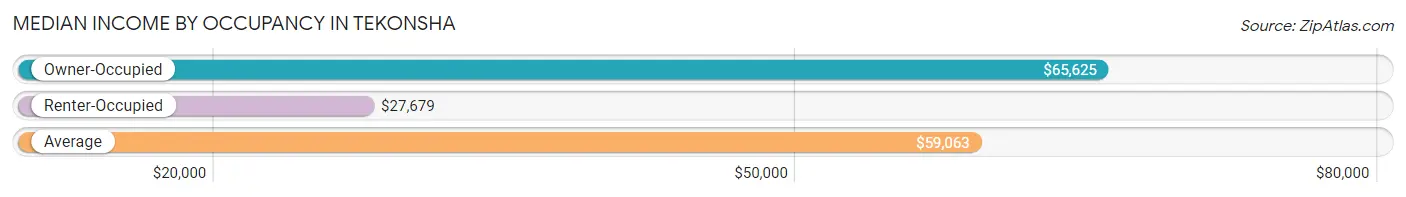
| Occupancy Type | # Households | Median Income |
| Owner-Occupied | 214 (80.1%) | $65,625 |
| Renter-Occupied | 53 (19.9%) | $27,679 |
| Average | 267 (100.0%) | $59,063 |
Occupancy by Householder Income Bracket in Tekonsha
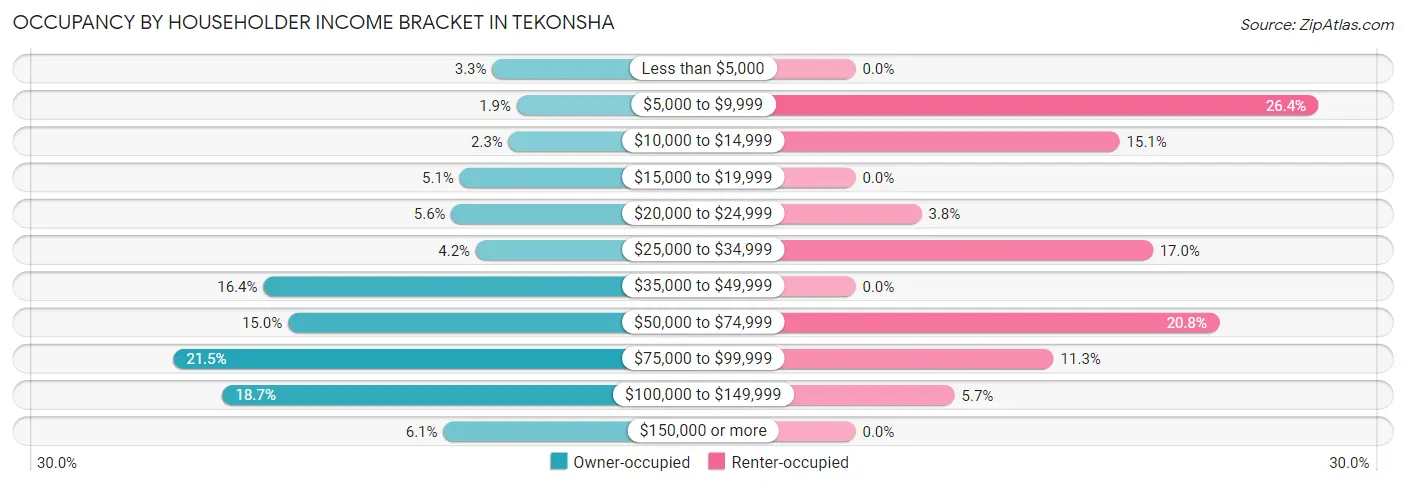
| Income Bracket | Owner-occupied | Renter-occupied |
| Less than $5,000 | 7 (3.3%) | 0 (0.0%) |
| $5,000 to $9,999 | 4 (1.9%) | 14 (26.4%) |
| $10,000 to $14,999 | 5 (2.3%) | 8 (15.1%) |
| $15,000 to $19,999 | 11 (5.1%) | 0 (0.0%) |
| $20,000 to $24,999 | 12 (5.6%) | 2 (3.8%) |
| $25,000 to $34,999 | 9 (4.2%) | 9 (17.0%) |
| $35,000 to $49,999 | 35 (16.4%) | 0 (0.0%) |
| $50,000 to $74,999 | 32 (14.9%) | 11 (20.7%) |
| $75,000 to $99,999 | 46 (21.5%) | 6 (11.3%) |
| $100,000 to $149,999 | 40 (18.7%) | 3 (5.7%) |
| $150,000 or more | 13 (6.1%) | 0 (0.0%) |
| Total | 214 (100.0%) | 53 (100.0%) |
Monthly Housing Cost Tiers in Tekonsha
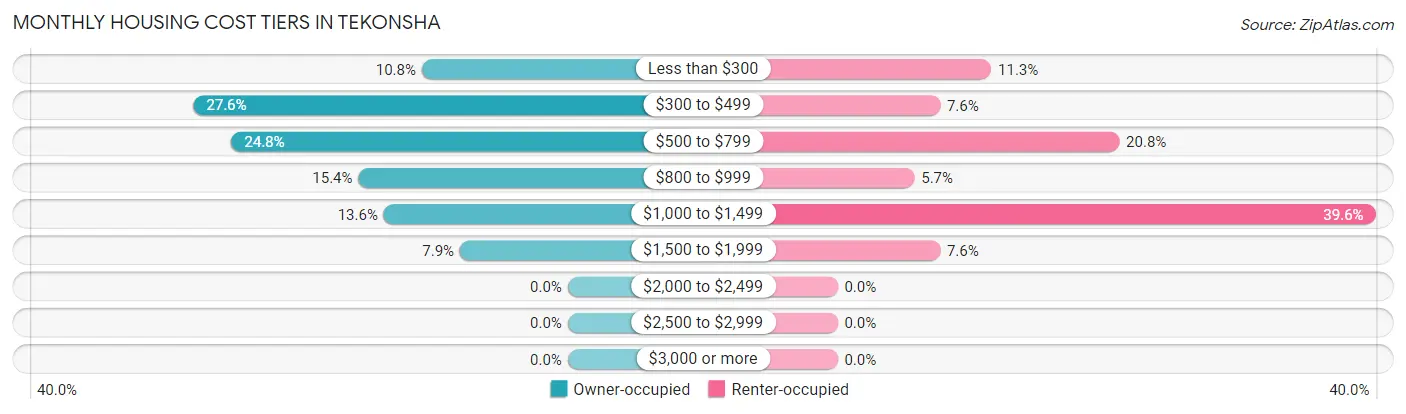
| Monthly Cost | Owner-occupied | Renter-occupied |
| Less than $300 | 23 (10.7%) | 6 (11.3%) |
| $300 to $499 | 59 (27.6%) | 4 (7.5%) |
| $500 to $799 | 53 (24.8%) | 11 (20.7%) |
| $800 to $999 | 33 (15.4%) | 3 (5.7%) |
| $1,000 to $1,499 | 29 (13.6%) | 21 (39.6%) |
| $1,500 to $1,999 | 17 (7.9%) | 4 (7.5%) |
| $2,000 to $2,499 | 0 (0.0%) | 0 (0.0%) |
| $2,500 to $2,999 | 0 (0.0%) | 0 (0.0%) |
| $3,000 or more | 0 (0.0%) | 0 (0.0%) |
| Total | 214 (100.0%) | 53 (100.0%) |
Physical Housing Characteristics in Tekonsha
Housing Structures in Tekonsha
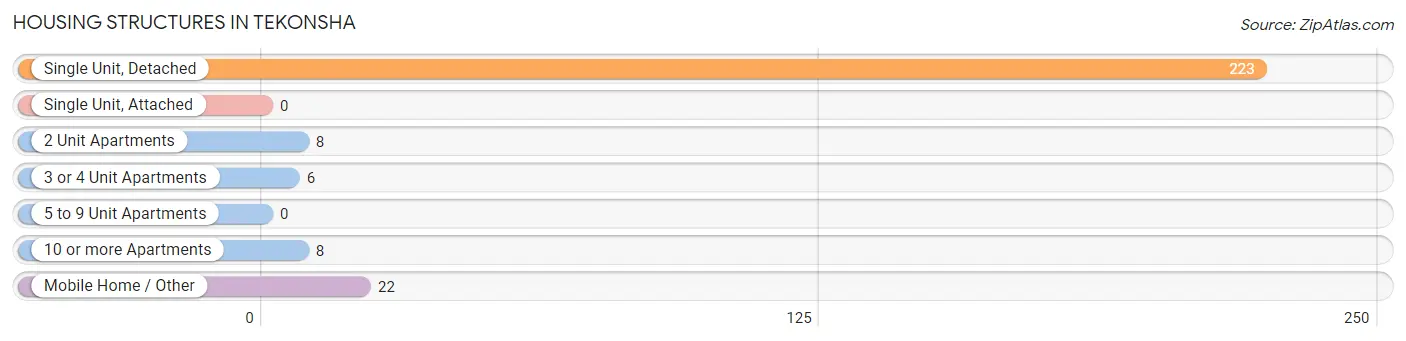
| Structure Type | # Housing Units | % Housing Units |
| Single Unit, Detached | 223 | 83.5% |
| Single Unit, Attached | 0 | 0.0% |
| 2 Unit Apartments | 8 | 3.0% |
| 3 or 4 Unit Apartments | 6 | 2.2% |
| 5 to 9 Unit Apartments | 0 | 0.0% |
| 10 or more Apartments | 8 | 3.0% |
| Mobile Home / Other | 22 | 8.2% |
| Total | 267 | 100.0% |
Housing Structures by Occupancy in Tekonsha
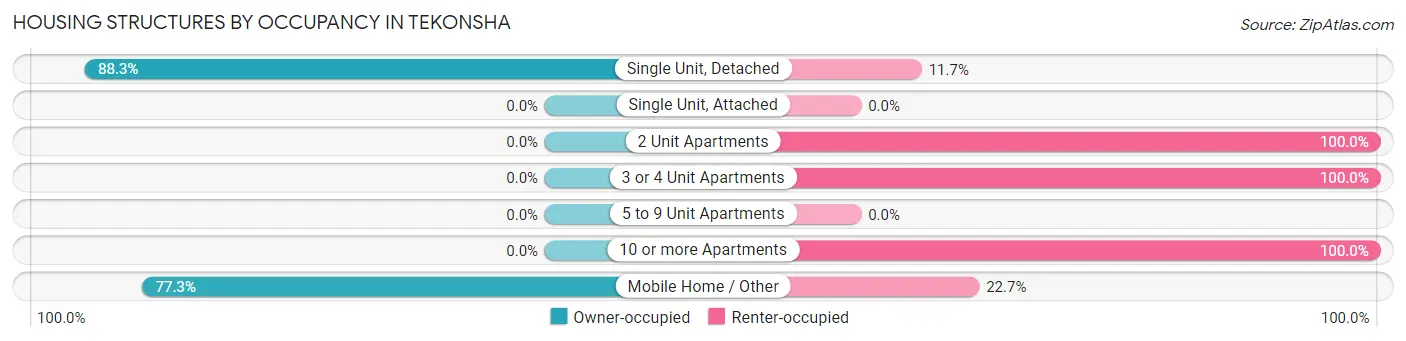
| Structure Type | Owner-occupied | Renter-occupied |
| Single Unit, Detached | 197 (88.3%) | 26 (11.7%) |
| Single Unit, Attached | 0 (0.0%) | 0 (0.0%) |
| 2 Unit Apartments | 0 (0.0%) | 8 (100.0%) |
| 3 or 4 Unit Apartments | 0 (0.0%) | 6 (100.0%) |
| 5 to 9 Unit Apartments | 0 (0.0%) | 0 (0.0%) |
| 10 or more Apartments | 0 (0.0%) | 8 (100.0%) |
| Mobile Home / Other | 17 (77.3%) | 5 (22.7%) |
| Total | 214 (80.1%) | 53 (19.9%) |
Housing Structures by Number of Rooms in Tekonsha
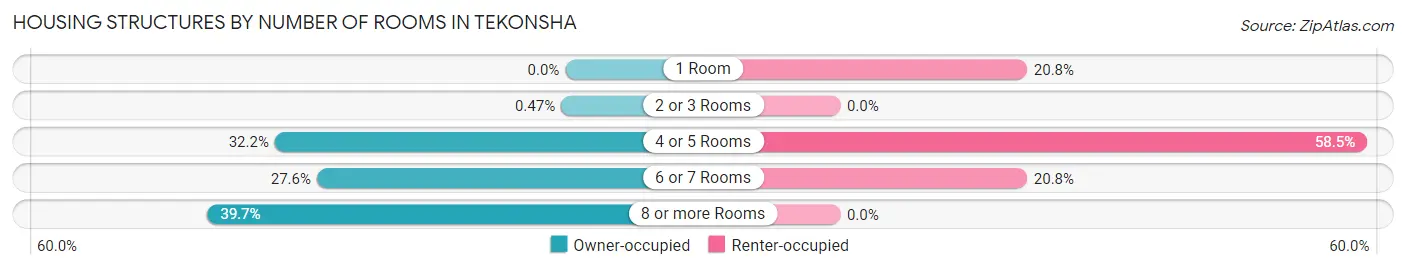
| Number of Rooms | Owner-occupied | Renter-occupied |
| 1 Room | 0 (0.0%) | 11 (20.7%) |
| 2 or 3 Rooms | 1 (0.5%) | 0 (0.0%) |
| 4 or 5 Rooms | 69 (32.2%) | 31 (58.5%) |
| 6 or 7 Rooms | 59 (27.6%) | 11 (20.7%) |
| 8 or more Rooms | 85 (39.7%) | 0 (0.0%) |
| Total | 214 (100.0%) | 53 (100.0%) |
Housing Structure by Heating Type in Tekonsha
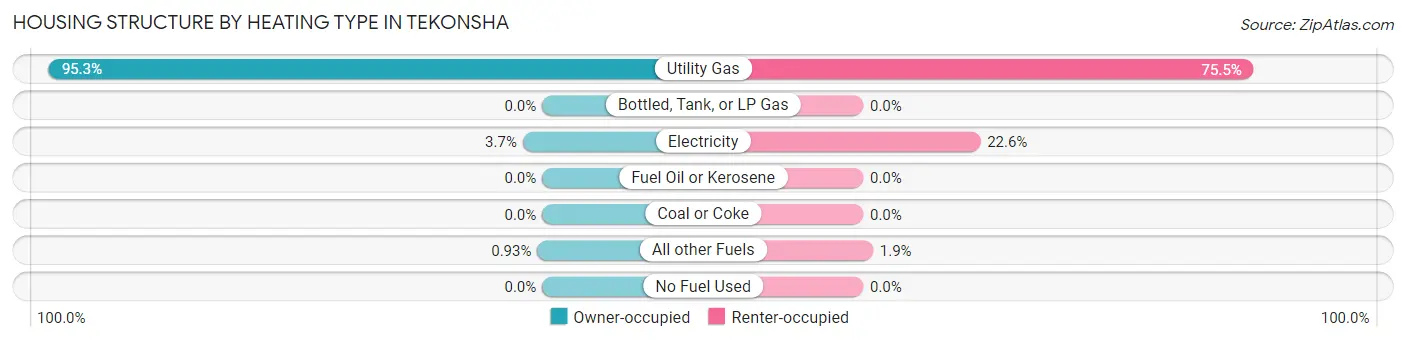
| Heating Type | Owner-occupied | Renter-occupied |
| Utility Gas | 204 (95.3%) | 40 (75.5%) |
| Bottled, Tank, or LP Gas | 0 (0.0%) | 0 (0.0%) |
| Electricity | 8 (3.7%) | 12 (22.6%) |
| Fuel Oil or Kerosene | 0 (0.0%) | 0 (0.0%) |
| Coal or Coke | 0 (0.0%) | 0 (0.0%) |
| All other Fuels | 2 (0.9%) | 1 (1.9%) |
| No Fuel Used | 0 (0.0%) | 0 (0.0%) |
| Total | 214 (100.0%) | 53 (100.0%) |
Household Vehicle Usage in Tekonsha
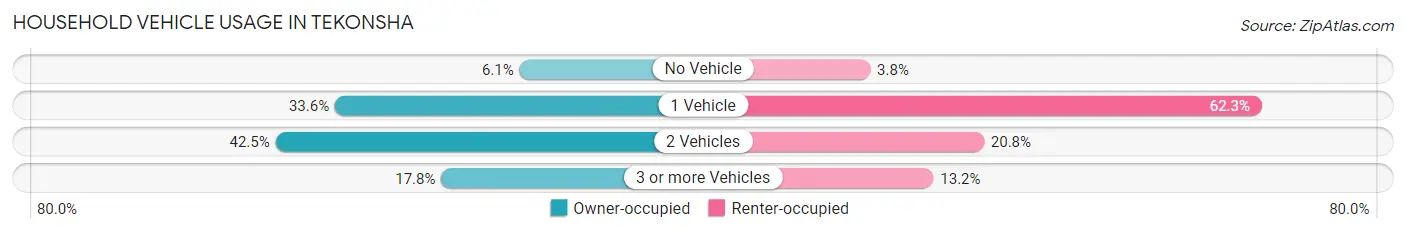
| Vehicles per Household | Owner-occupied | Renter-occupied |
| No Vehicle | 13 (6.1%) | 2 (3.8%) |
| 1 Vehicle | 72 (33.6%) | 33 (62.3%) |
| 2 Vehicles | 91 (42.5%) | 11 (20.7%) |
| 3 or more Vehicles | 38 (17.8%) | 7 (13.2%) |
| Total | 214 (100.0%) | 53 (100.0%) |
Real Estate & Mortgages in Tekonsha
Real Estate and Mortgage Overview in Tekonsha
| Characteristic | Without Mortgage | With Mortgage |
| Housing Units | 115 | 99 |
| Median Property Value | $74,100 | $108,000 |
| Median Household Income | $64,375 | $4 |
| Monthly Housing Costs | $456 | $0 |
| Real Estate Taxes | $1,108 | $0 |
Property Value by Mortgage Status in Tekonsha
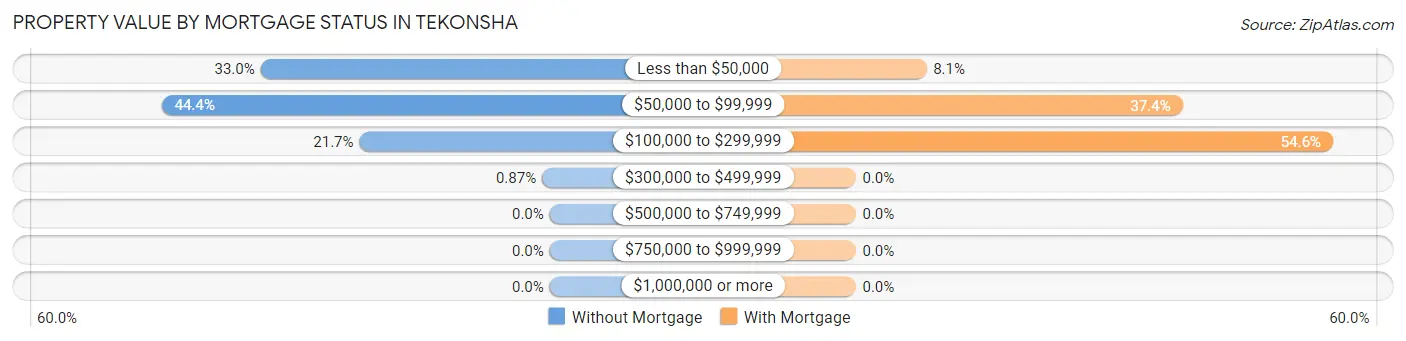
| Property Value | Without Mortgage | With Mortgage |
| Less than $50,000 | 38 (33.0%) | 8 (8.1%) |
| $50,000 to $99,999 | 51 (44.4%) | 37 (37.4%) |
| $100,000 to $299,999 | 25 (21.7%) | 54 (54.5%) |
| $300,000 to $499,999 | 1 (0.9%) | 0 (0.0%) |
| $500,000 to $749,999 | 0 (0.0%) | 0 (0.0%) |
| $750,000 to $999,999 | 0 (0.0%) | 0 (0.0%) |
| $1,000,000 or more | 0 (0.0%) | 0 (0.0%) |
| Total | 115 (100.0%) | 99 (100.0%) |
Household Income by Mortgage Status in Tekonsha
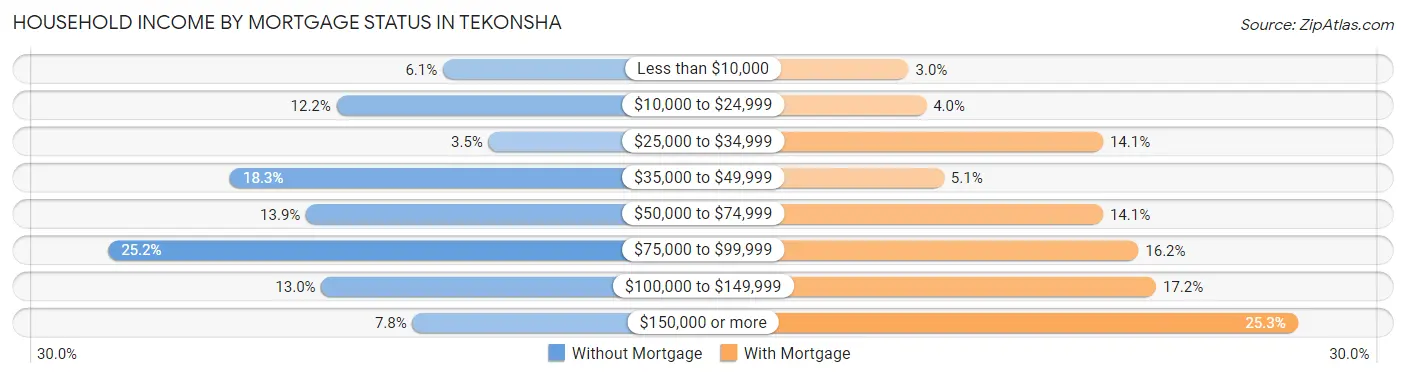
| Household Income | Without Mortgage | With Mortgage |
| Less than $10,000 | 7 (6.1%) | 3 (3.0%) |
| $10,000 to $24,999 | 14 (12.2%) | 4 (4.0%) |
| $25,000 to $34,999 | 4 (3.5%) | 14 (14.1%) |
| $35,000 to $49,999 | 21 (18.3%) | 5 (5.1%) |
| $50,000 to $74,999 | 16 (13.9%) | 14 (14.1%) |
| $75,000 to $99,999 | 29 (25.2%) | 16 (16.2%) |
| $100,000 to $149,999 | 15 (13.0%) | 17 (17.2%) |
| $150,000 or more | 9 (7.8%) | 25 (25.3%) |
| Total | 115 (100.0%) | 99 (100.0%) |
Property Value to Household Income Ratio in Tekonsha
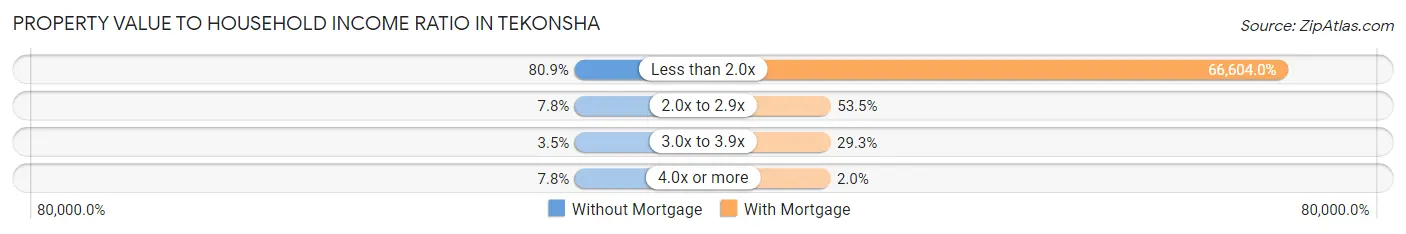
| Value-to-Income Ratio | Without Mortgage | With Mortgage |
| Less than 2.0x | 93 (80.9%) | 65,938 (66,604.0%) |
| 2.0x to 2.9x | 9 (7.8%) | 53 (53.5%) |
| 3.0x to 3.9x | 4 (3.5%) | 29 (29.3%) |
| 4.0x or more | 9 (7.8%) | 2 (2.0%) |
| Total | 115 (100.0%) | 99 (100.0%) |
Real Estate Taxes by Mortgage Status in Tekonsha
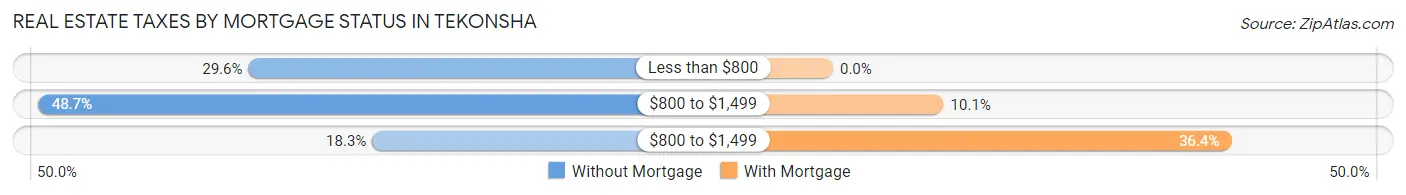
| Property Taxes | Without Mortgage | With Mortgage |
| Less than $800 | 34 (29.6%) | 0 (0.0%) |
| $800 to $1,499 | 56 (48.7%) | 10 (10.1%) |
| $800 to $1,499 | 21 (18.3%) | 36 (36.4%) |
| Total | 115 (100.0%) | 99 (100.0%) |
Health & Disability in Tekonsha
Health Insurance Coverage by Age in Tekonsha
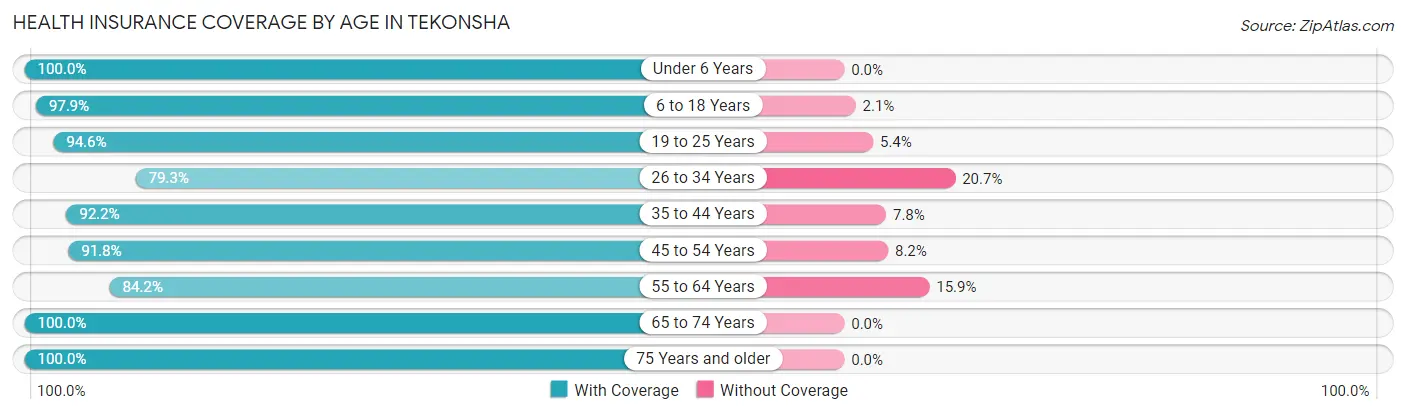
| Age Bracket | With Coverage | Without Coverage |
| Under 6 Years | 18 (100.0%) | 0 (0.0%) |
| 6 to 18 Years | 139 (97.9%) | 3 (2.1%) |
| 19 to 25 Years | 53 (94.6%) | 3 (5.4%) |
| 26 to 34 Years | 69 (79.3%) | 18 (20.7%) |
| 35 to 44 Years | 83 (92.2%) | 7 (7.8%) |
| 45 to 54 Years | 90 (91.8%) | 8 (8.2%) |
| 55 to 64 Years | 69 (84.2%) | 13 (15.9%) |
| 65 to 74 Years | 76 (100.0%) | 0 (0.0%) |
| 75 Years and older | 36 (100.0%) | 0 (0.0%) |
| Total | 633 (92.4%) | 52 (7.6%) |
Health Insurance Coverage by Citizenship Status in Tekonsha
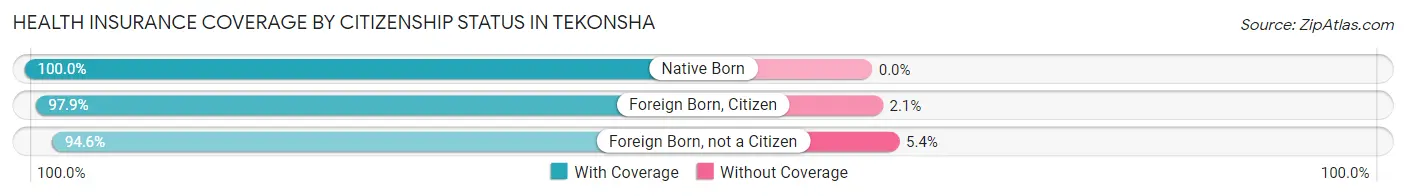
| Citizenship Status | With Coverage | Without Coverage |
| Native Born | 18 (100.0%) | 0 (0.0%) |
| Foreign Born, Citizen | 139 (97.9%) | 3 (2.1%) |
| Foreign Born, not a Citizen | 53 (94.6%) | 3 (5.4%) |
Health Insurance Coverage by Household Income in Tekonsha
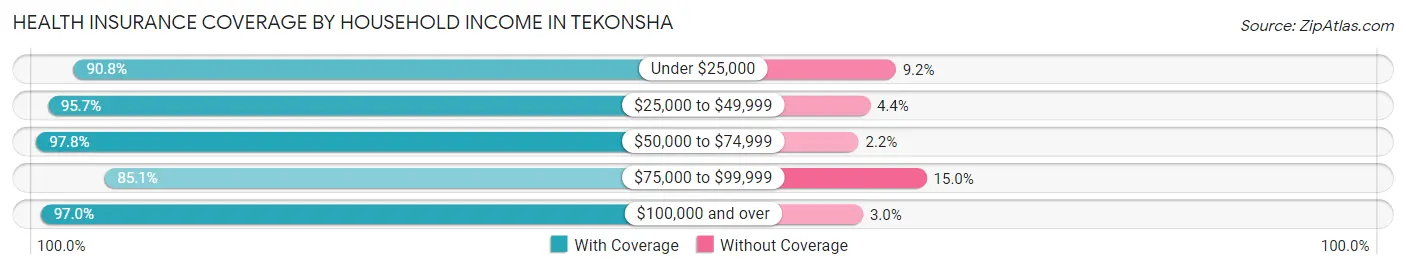
| Household Income | With Coverage | Without Coverage |
| Under $25,000 | 109 (90.8%) | 11 (9.2%) |
| $25,000 to $49,999 | 110 (95.7%) | 5 (4.3%) |
| $50,000 to $74,999 | 89 (97.8%) | 2 (2.2%) |
| $75,000 to $99,999 | 165 (85.1%) | 29 (14.9%) |
| $100,000 and over | 160 (97.0%) | 5 (3.0%) |
Public vs Private Health Insurance Coverage by Age in Tekonsha
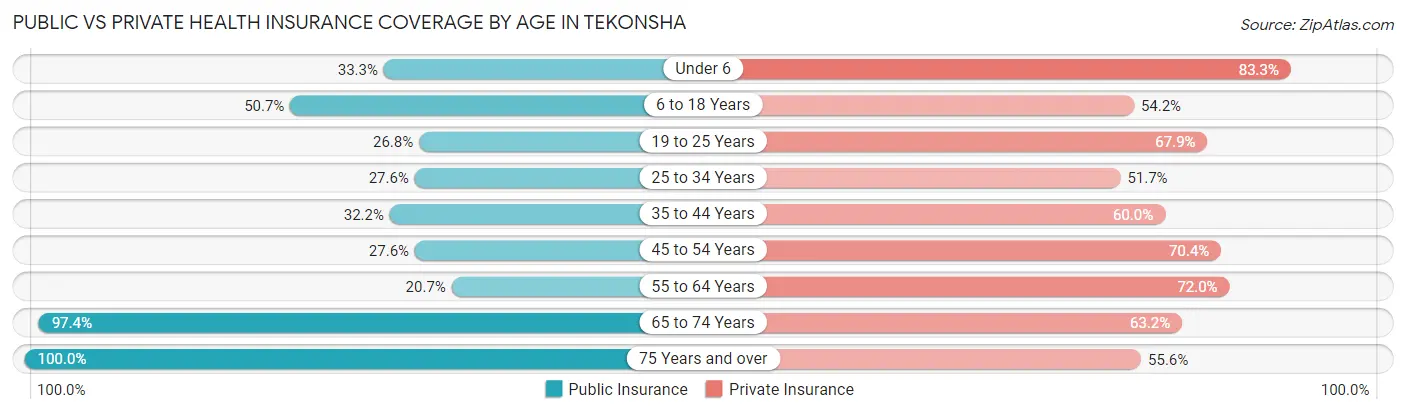
| Age Bracket | Public Insurance | Private Insurance |
| Under 6 | 6 (33.3%) | 15 (83.3%) |
| 6 to 18 Years | 72 (50.7%) | 77 (54.2%) |
| 19 to 25 Years | 15 (26.8%) | 38 (67.9%) |
| 25 to 34 Years | 24 (27.6%) | 45 (51.7%) |
| 35 to 44 Years | 29 (32.2%) | 54 (60.0%) |
| 45 to 54 Years | 27 (27.6%) | 69 (70.4%) |
| 55 to 64 Years | 17 (20.7%) | 59 (72.0%) |
| 65 to 74 Years | 74 (97.4%) | 48 (63.2%) |
| 75 Years and over | 36 (100.0%) | 20 (55.6%) |
| Total | 300 (43.8%) | 425 (62.0%) |
Disability Status by Sex by Age in Tekonsha
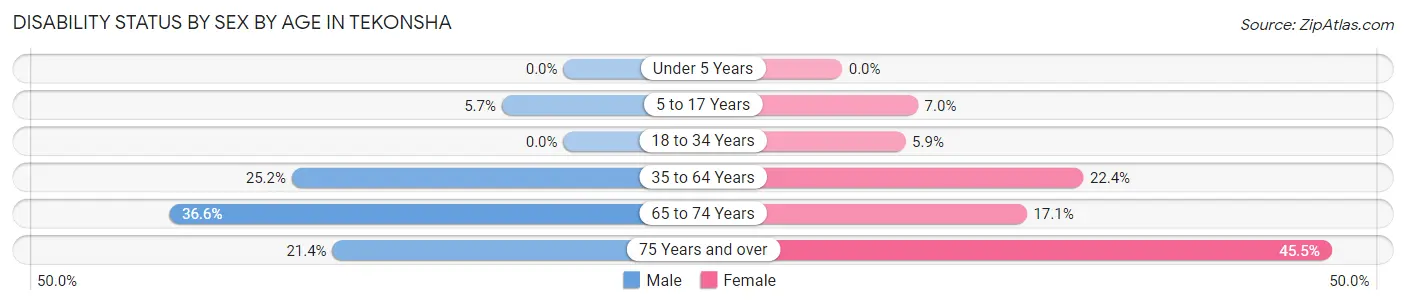
| Age Bracket | Male | Female |
| Under 5 Years | 0 (0.0%) | 0 (0.0%) |
| 5 to 17 Years | 4 (5.7%) | 5 (7.0%) |
| 18 to 34 Years | 0 (0.0%) | 4 (5.9%) |
| 35 to 64 Years | 32 (25.2%) | 32 (22.4%) |
| 65 to 74 Years | 15 (36.6%) | 6 (17.1%) |
| 75 Years and over | 3 (21.4%) | 10 (45.5%) |
Disability Class by Sex by Age in Tekonsha
Disability Class: Hearing Difficulty
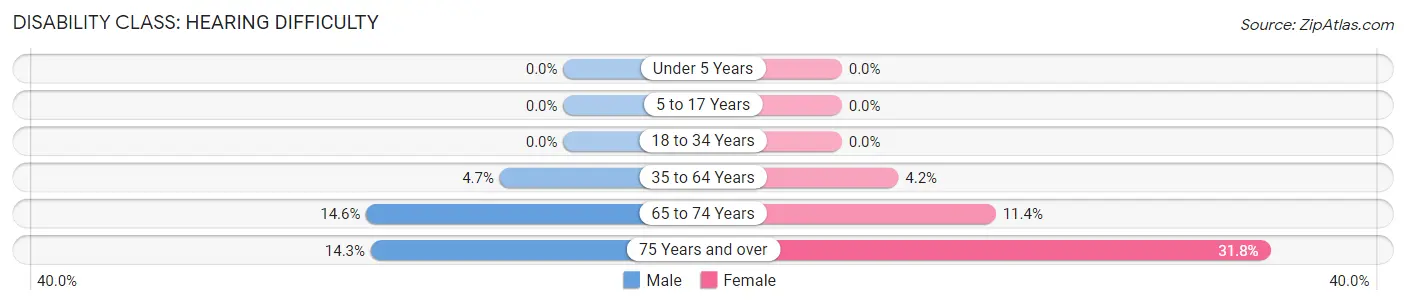
| Age Bracket | Male | Female |
| Under 5 Years | 0 (0.0%) | 0 (0.0%) |
| 5 to 17 Years | 0 (0.0%) | 0 (0.0%) |
| 18 to 34 Years | 0 (0.0%) | 0 (0.0%) |
| 35 to 64 Years | 6 (4.7%) | 6 (4.2%) |
| 65 to 74 Years | 6 (14.6%) | 4 (11.4%) |
| 75 Years and over | 2 (14.3%) | 7 (31.8%) |
Disability Class: Vision Difficulty
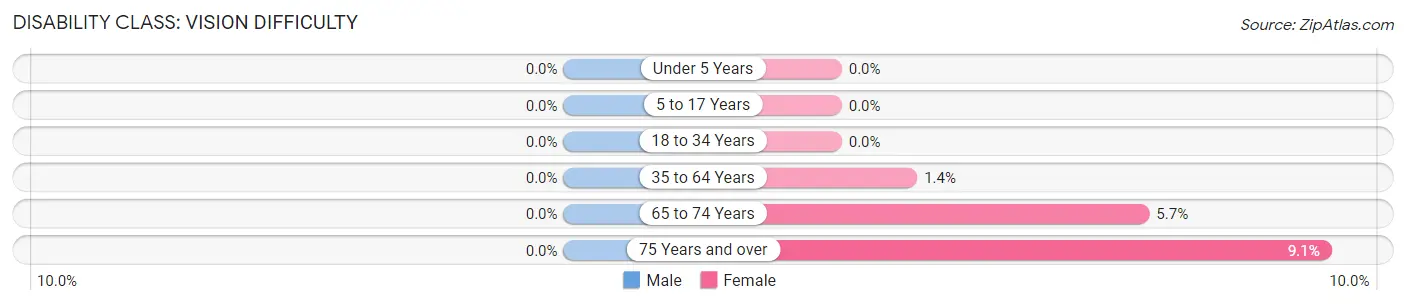
| Age Bracket | Male | Female |
| Under 5 Years | 0 (0.0%) | 0 (0.0%) |
| 5 to 17 Years | 0 (0.0%) | 0 (0.0%) |
| 18 to 34 Years | 0 (0.0%) | 0 (0.0%) |
| 35 to 64 Years | 0 (0.0%) | 2 (1.4%) |
| 65 to 74 Years | 0 (0.0%) | 2 (5.7%) |
| 75 Years and over | 0 (0.0%) | 2 (9.1%) |
Disability Class: Cognitive Difficulty
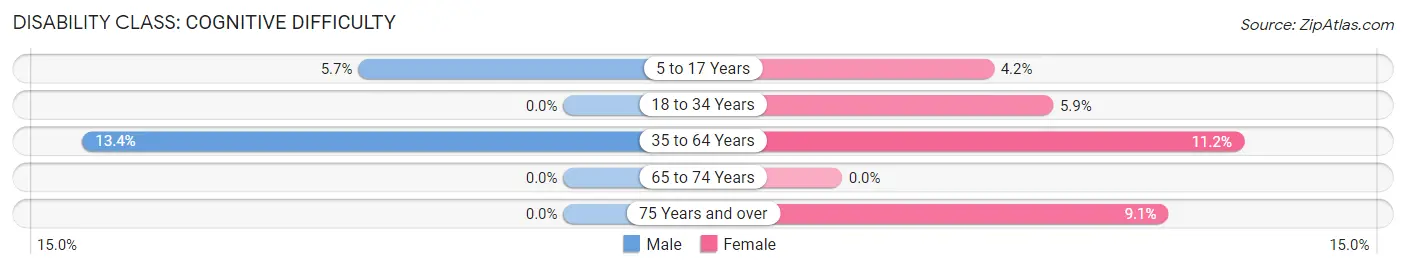
| Age Bracket | Male | Female |
| 5 to 17 Years | 4 (5.7%) | 3 (4.2%) |
| 18 to 34 Years | 0 (0.0%) | 4 (5.9%) |
| 35 to 64 Years | 17 (13.4%) | 16 (11.2%) |
| 65 to 74 Years | 0 (0.0%) | 0 (0.0%) |
| 75 Years and over | 0 (0.0%) | 2 (9.1%) |
Disability Class: Ambulatory Difficulty
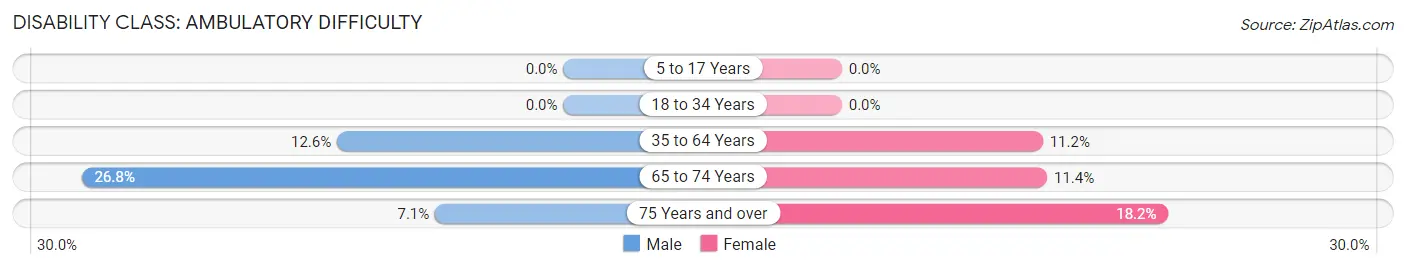
| Age Bracket | Male | Female |
| 5 to 17 Years | 0 (0.0%) | 0 (0.0%) |
| 18 to 34 Years | 0 (0.0%) | 0 (0.0%) |
| 35 to 64 Years | 16 (12.6%) | 16 (11.2%) |
| 65 to 74 Years | 11 (26.8%) | 4 (11.4%) |
| 75 Years and over | 1 (7.1%) | 4 (18.2%) |
Disability Class: Self-Care Difficulty
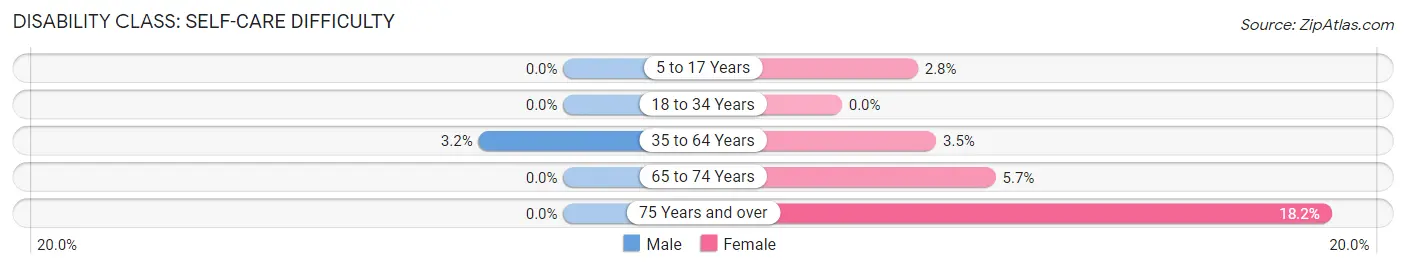
| Age Bracket | Male | Female |
| 5 to 17 Years | 0 (0.0%) | 2 (2.8%) |
| 18 to 34 Years | 0 (0.0%) | 0 (0.0%) |
| 35 to 64 Years | 4 (3.2%) | 5 (3.5%) |
| 65 to 74 Years | 0 (0.0%) | 2 (5.7%) |
| 75 Years and over | 0 (0.0%) | 4 (18.2%) |
Technology Access in Tekonsha
Computing Device Access in Tekonsha
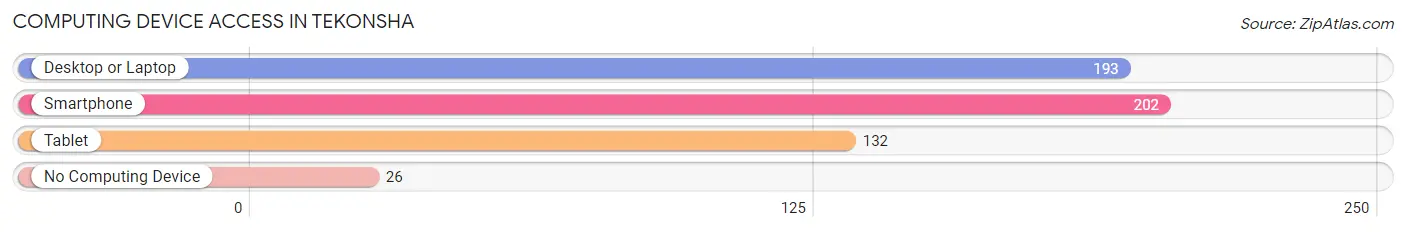
| Device Type | # Households | % Households |
| Desktop or Laptop | 193 | 72.3% |
| Smartphone | 202 | 75.7% |
| Tablet | 132 | 49.4% |
| No Computing Device | 26 | 9.7% |
| Total | 267 | 100.0% |
Internet Access in Tekonsha
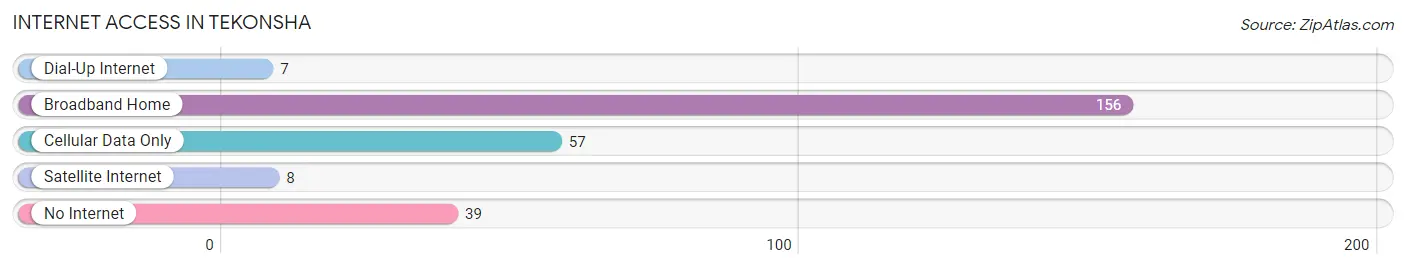
| Internet Type | # Households | % Households |
| Dial-Up Internet | 7 | 2.6% |
| Broadband Home | 156 | 58.4% |
| Cellular Data Only | 57 | 21.3% |
| Satellite Internet | 8 | 3.0% |
| No Internet | 39 | 14.6% |
| Total | 267 | 100.0% |
Tekonsha Summary
Tekonsha is a small village located in the south-central region of Michigan, in Calhoun County. It is situated on the banks of the Kalamazoo River, and is home to a population of just over 1,000 people. The village is known for its rich history, its beautiful natural surroundings, and its strong sense of community.
History
Tekonsha was first settled in 1831 by a group of settlers from New York. The village was named after a Native American chief, Chief Tekonsha, who was a leader of the Potawatomi tribe. The village was incorporated in 1867, and the first post office was established in 1868.
In the late 19th century, Tekonsha was a thriving agricultural community, with a variety of crops being grown in the area. The village was also home to a number of businesses, including a sawmill, a grist mill, a blacksmith shop, and a general store.
In the early 20th century, Tekonsha began to experience a decline in population as many of its residents moved away in search of better economic opportunities. However, the village was able to remain a vibrant community thanks to its strong sense of community and its commitment to preserving its history and culture.
Geography
Tekonsha is located in the south-central region of Michigan, in Calhoun County. It is situated on the banks of the Kalamazoo River, and is surrounded by rolling hills and lush forests. The village is located approximately 25 miles south of Battle Creek, and is about an hour’s drive from the state capital of Lansing.
The village is home to a variety of natural attractions, including the Tekonsha State Game Area, which is a popular spot for hunting and fishing. The area is also home to a number of parks and recreational areas, including the Tekonsha Nature Preserve, which is a popular spot for hiking and bird watching.
Economy
Tekonsha’s economy is largely based on agriculture and tourism. The village is home to a number of farms, which produce a variety of crops, including corn, soybeans, wheat, and hay. The village is also home to a number of small businesses, including restaurants, shops, and other services.
The village is also home to a number of tourist attractions, including the Tekonsha State Game Area, the Tekonsha Nature Preserve, and the historic downtown area. These attractions draw visitors from all over the state and beyond, and help to support the local economy.
Demographics
As of the 2010 census, the population of Tekonsha was 1,039. The racial makeup of the village was 97.3% White, 0.7% African American, 0.3% Native American, 0.2% Asian, 0.1% Pacific Islander, 0.3% from other races, and 1.2% from two or more races. Hispanic or Latino of any race were 1.2% of the population.
The median household income in Tekonsha was $37,917, and the median family income was $45,625. The per capita income for the village was $18,945. About 11.2% of families and 14.2% of the population were below the poverty line, including 19.2% of those under age 18 and 8.3% of those age 65 or over.
Tekonsha is a small village with a rich history and a strong sense of community. The village is home to a variety of natural attractions, and its economy is largely based on agriculture and tourism. The village is also home to a diverse population, with a variety of racial and ethnic backgrounds. Tekonsha is a great place to live, work, and visit, and is sure to remain a vibrant community for many years to come.
Common Questions
What is Per Capita Income in Tekonsha?
Per Capita income in Tekonsha is $26,267.
What is the Median Family Income in Tekonsha?
Median Family Income in Tekonsha is $73,750.
What is the Median Household income in Tekonsha?
Median Household Income in Tekonsha is $59,063.
What is Income or Wage Gap in Tekonsha?
Income or Wage Gap in Tekonsha is 10.7%.
Women in Tekonsha earn 89.3 cents for every dollar earned by a man.
What is Inequality or Gini Index in Tekonsha?
Inequality or Gini Index in Tekonsha is 0.38.
What is the Total Population of Tekonsha?
Total Population of Tekonsha is 685.
What is the Total Male Population of Tekonsha?
Total Male Population of Tekonsha is 338.
What is the Total Female Population of Tekonsha?
Total Female Population of Tekonsha is 347.
What is the Ratio of Males per 100 Females in Tekonsha?
There are 97.41 Males per 100 Females in Tekonsha.
What is the Ratio of Females per 100 Males in Tekonsha?
There are 102.66 Females per 100 Males in Tekonsha.
What is the Median Population Age in Tekonsha?
Median Population Age in Tekonsha is 40.2 Years.
What is the Average Family Size in Tekonsha
Average Family Size in Tekonsha is 3.1 People.
What is the Average Household Size in Tekonsha
Average Household Size in Tekonsha is 2.6 People.
How Large is the Labor Force in Tekonsha?
There are 324 People in the Labor Forcein in Tekonsha.
What is the Percentage of People in the Labor Force in Tekonsha?
58.2% of People are in the Labor Force in Tekonsha.
What is the Unemployment Rate in Tekonsha?
Unemployment Rate in Tekonsha is 10.5%.