Tawas City, MI Map & Demographics
Tawas City Map
Tawas City Overview
$28,529
PER CAPITA INCOME
$60,114
AVG FAMILY INCOME
$51,143
AVG HOUSEHOLD INCOME
21.3%
WAGE / INCOME GAP [ % ]
78.7¢/ $1
WAGE / INCOME GAP [ $ ]
$4,748
FAMILY INCOME DEFICIT
0.40
INEQUALITY / GINI INDEX
1,749
TOTAL POPULATION
836
MALE POPULATION
913
FEMALE POPULATION
91.57
MALES / 100 FEMALES
109.21
FEMALES / 100 MALES
49.1
MEDIAN AGE
2.7
AVG FAMILY SIZE
2.2
AVG HOUSEHOLD SIZE
790
LABOR FORCE [ PEOPLE ]
52.6%
PERCENT IN LABOR FORCE
9.6%
UNEMPLOYMENT RATE
Tawas City Zip Codes
Tawas City Area Codes
Income in Tawas City
Income Overview in Tawas City
Per Capita Income in Tawas City is $28,529, while median incomes of families and households are $60,114 and $51,143 respectively.
| Characteristic | Number | Measure |
| Per Capita Income | 1,749 | $28,529 |
| Median Family Income | 443 | $60,114 |
| Mean Family Income | 443 | $72,833 |
| Median Household Income | 714 | $51,143 |
| Mean Household Income | 714 | $61,697 |
| Income Deficit | 443 | $4,748 |
| Wage / Income Gap (%) | 1,749 | 21.28% |
| Wage / Income Gap ($) | 1,749 | 78.72¢ per $1 |
| Gini / Inequality Index | 1,749 | 0.40 |
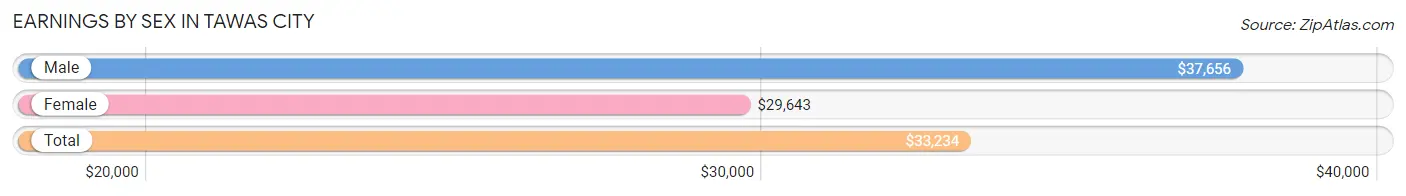
Earnings by Sex in Tawas City
Average Earnings in Tawas City are $33,234, $37,656 for men and $29,643 for women, a difference of 21.3%.
| Sex | Number | Average Earnings |
| Male | 395 (46.9%) | $37,656 |
| Female | 448 (53.1%) | $29,643 |
| Total | 843 (100.0%) | $33,234 |
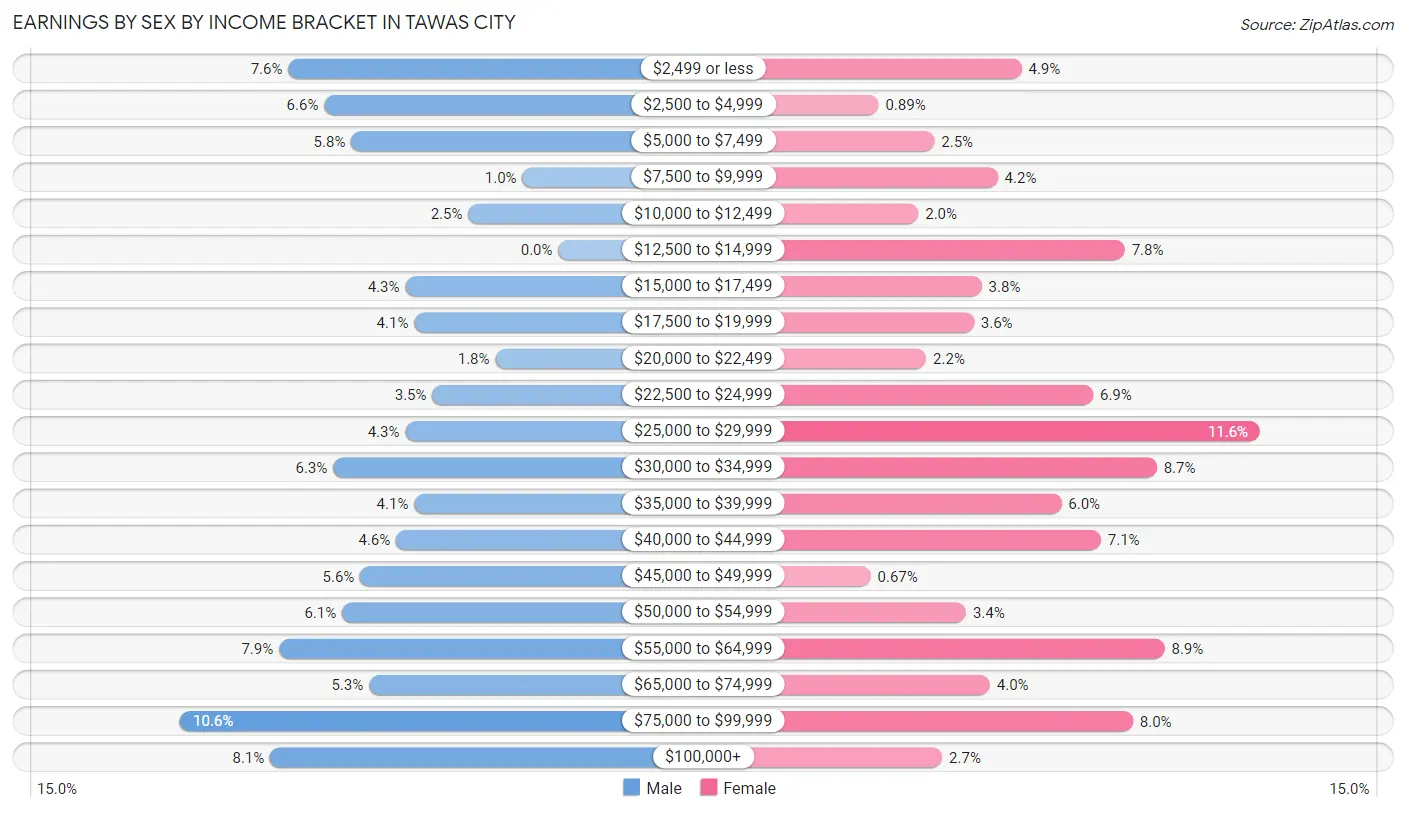
Earnings by Sex by Income Bracket in Tawas City
The most common earnings brackets in Tawas City are $75,000 to $99,999 for men (42 | 10.6%) and $25,000 to $29,999 for women (52 | 11.6%).
| Income | Male | Female |
| $2,499 or less | 30 (7.6%) | 22 (4.9%) |
| $2,500 to $4,999 | 26 (6.6%) | 4 (0.9%) |
| $5,000 to $7,499 | 23 (5.8%) | 11 (2.5%) |
| $7,500 to $9,999 | 4 (1.0%) | 19 (4.2%) |
| $10,000 to $12,499 | 10 (2.5%) | 9 (2.0%) |
| $12,500 to $14,999 | 0 (0.0%) | 35 (7.8%) |
| $15,000 to $17,499 | 17 (4.3%) | 17 (3.8%) |
| $17,500 to $19,999 | 16 (4.1%) | 16 (3.6%) |
| $20,000 to $22,499 | 7 (1.8%) | 10 (2.2%) |
| $22,500 to $24,999 | 14 (3.5%) | 31 (6.9%) |
| $25,000 to $29,999 | 17 (4.3%) | 52 (11.6%) |
| $30,000 to $34,999 | 25 (6.3%) | 39 (8.7%) |
| $35,000 to $39,999 | 16 (4.1%) | 27 (6.0%) |
| $40,000 to $44,999 | 18 (4.6%) | 32 (7.1%) |
| $45,000 to $49,999 | 22 (5.6%) | 3 (0.7%) |
| $50,000 to $54,999 | 24 (6.1%) | 15 (3.4%) |
| $55,000 to $64,999 | 31 (7.9%) | 40 (8.9%) |
| $65,000 to $74,999 | 21 (5.3%) | 18 (4.0%) |
| $75,000 to $99,999 | 42 (10.6%) | 36 (8.0%) |
| $100,000+ | 32 (8.1%) | 12 (2.7%) |
| Total | 395 (100.0%) | 448 (100.0%) |
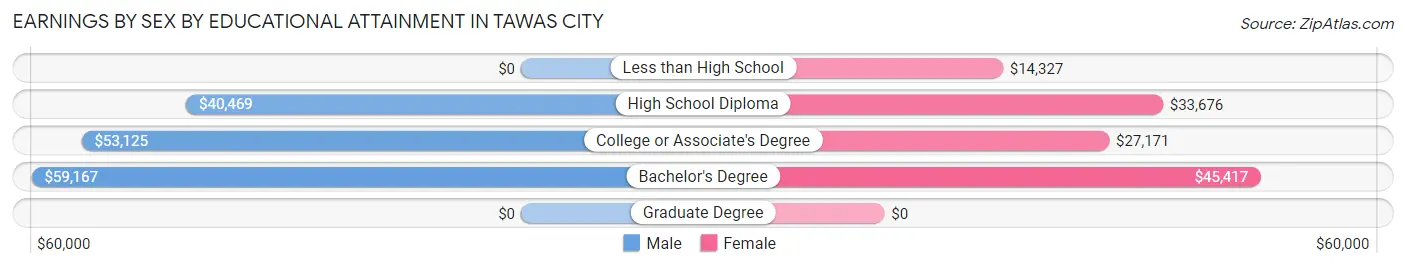
Earnings by Sex by Educational Attainment in Tawas City
Average earnings in Tawas City are $45,592 for men and $32,550 for women, a difference of 28.6%. Men with an educational attainment of bachelor's degree enjoy the highest average annual earnings of $59,167, while those with high school diploma education earn the least with $40,469. Women with an educational attainment of bachelor's degree earn the most with the average annual earnings of $45,417, while those with less than high school education have the smallest earnings of $14,327.
| Educational Attainment | Male Income | Female Income |
| Less than High School | - | - |
| High School Diploma | $40,469 | $33,676 |
| College or Associate's Degree | $53,125 | $27,171 |
| Bachelor's Degree | $59,167 | $45,417 |
| Graduate Degree | - | - |
| Total | $45,592 | $32,550 |
Family Income in Tawas City
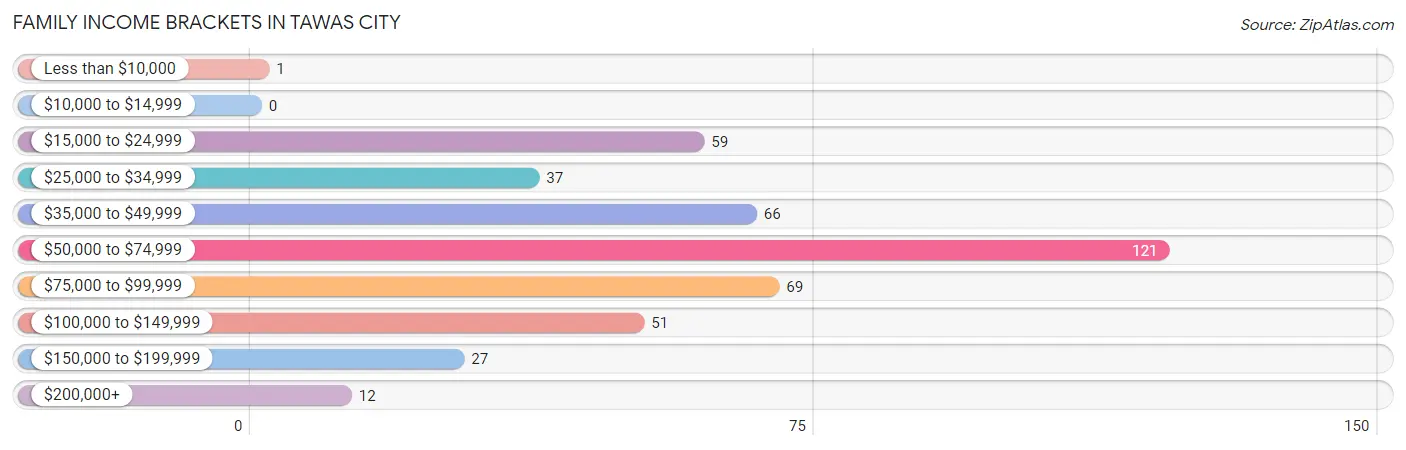
Family Income Brackets in Tawas City
According to the Tawas City family income data, there are 121 families falling into the $50,000 to $74,999 income range, which is the most common income bracket and makes up 27.3% of all families.
| Income Bracket | # Families | % Families |
| Less than $10,000 | 1 | 0.2% |
| $10,000 to $14,999 | 0 | 0.0% |
| $15,000 to $24,999 | 59 | 13.3% |
| $25,000 to $34,999 | 37 | 8.4% |
| $35,000 to $49,999 | 66 | 14.9% |
| $50,000 to $74,999 | 121 | 27.3% |
| $75,000 to $99,999 | 69 | 15.6% |
| $100,000 to $149,999 | 51 | 11.5% |
| $150,000 to $199,999 | 27 | 6.1% |
| $200,000+ | 12 | 2.7% |
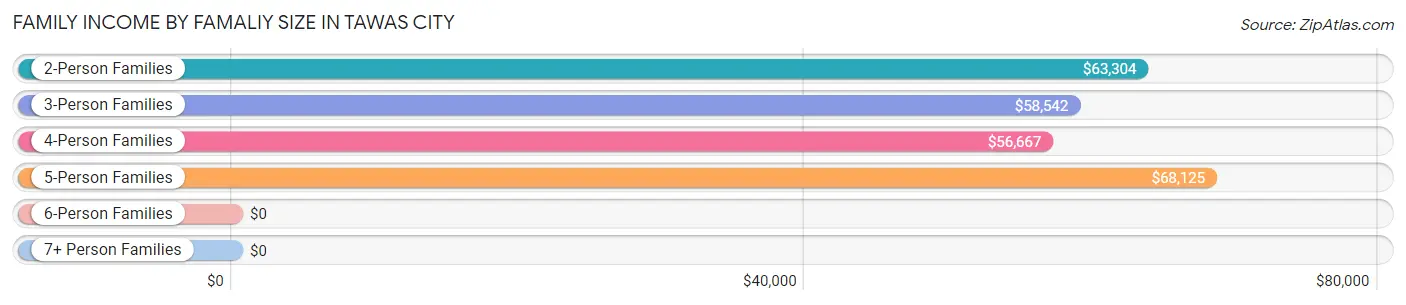
Family Income by Famaliy Size in Tawas City
5-person families (5 | 1.1%) account for the highest median family income in Tawas City with $68,125 per family, while 2-person families (297 | 67.0%) have the highest median income of $31,652 per family member.
| Income Bracket | # Families | Median Income |
| 2-Person Families | 297 (67.0%) | $63,304 |
| 3-Person Families | 71 (16.0%) | $58,542 |
| 4-Person Families | 66 (14.9%) | $56,667 |
| 5-Person Families | 5 (1.1%) | $68,125 |
| 6-Person Families | 4 (0.9%) | $0 |
| 7+ Person Families | 0 (0.0%) | $0 |
| Total | 443 (100.0%) | $60,114 |
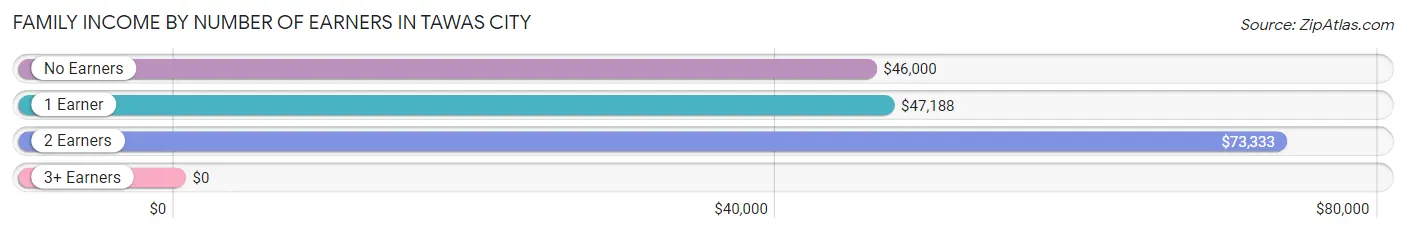
Family Income by Number of Earners in Tawas City
| Number of Earners | # Families | Median Income |
| No Earners | 90 (20.3%) | $46,000 |
| 1 Earner | 164 (37.0%) | $47,188 |
| 2 Earners | 186 (42.0%) | $73,333 |
| 3+ Earners | 3 (0.7%) | $0 |
| Total | 443 (100.0%) | $60,114 |
Household Income in Tawas City
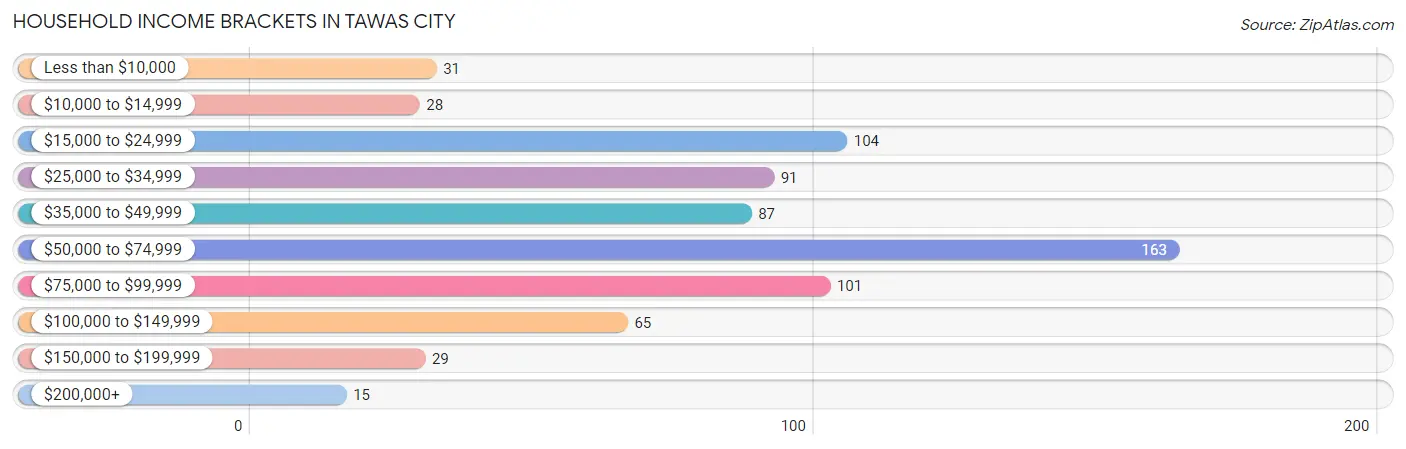
Household Income Brackets in Tawas City
With 163 households falling in the category, the $50,000 to $74,999 income range is the most frequent in Tawas City, accounting for 22.8% of all households. In contrast, only 15 households (2.1%) fall into the $200,000+ income bracket, making it the least populous group.
| Income Bracket | # Households | % Households |
| Less than $10,000 | 31 | 4.3% |
| $10,000 to $14,999 | 28 | 3.9% |
| $15,000 to $24,999 | 104 | 14.6% |
| $25,000 to $34,999 | 91 | 12.7% |
| $35,000 to $49,999 | 87 | 12.2% |
| $50,000 to $74,999 | 163 | 22.8% |
| $75,000 to $99,999 | 101 | 14.1% |
| $100,000 to $149,999 | 65 | 9.1% |
| $150,000 to $199,999 | 29 | 4.1% |
| $200,000+ | 15 | 2.1% |
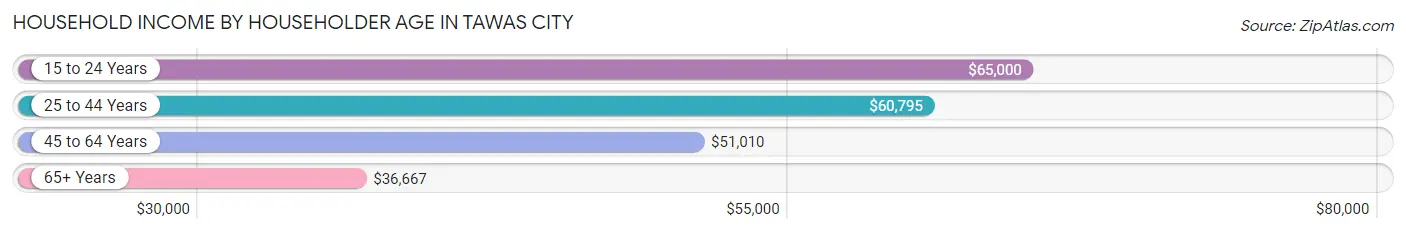
Household Income by Householder Age in Tawas City
The median household income in Tawas City is $51,143, with the highest median household income of $65,000 found in the 15 to 24 years age bracket for the primary householder. A total of 14 households (2.0%) fall into this category. Meanwhile, the 65+ years age bracket for the primary householder has the lowest median household income of $36,667, with 226 households (31.7%) in this group.
| Income Bracket | # Households | Median Income |
| 15 to 24 Years | 14 (2.0%) | $65,000 |
| 25 to 44 Years | 193 (27.0%) | $60,795 |
| 45 to 64 Years | 281 (39.4%) | $51,010 |
| 65+ Years | 226 (31.7%) | $36,667 |
| Total | 714 (100.0%) | $51,143 |
Poverty in Tawas City
Income Below Poverty by Sex and Age in Tawas City
With 18.3% poverty level for males and 10.9% for females among the residents of Tawas City, 12 to 14 year old males and 75 year old and over females are the most vulnerable to poverty, with 23 males (52.3%) and 13 females (18.3%) in their respective age groups living below the poverty level.
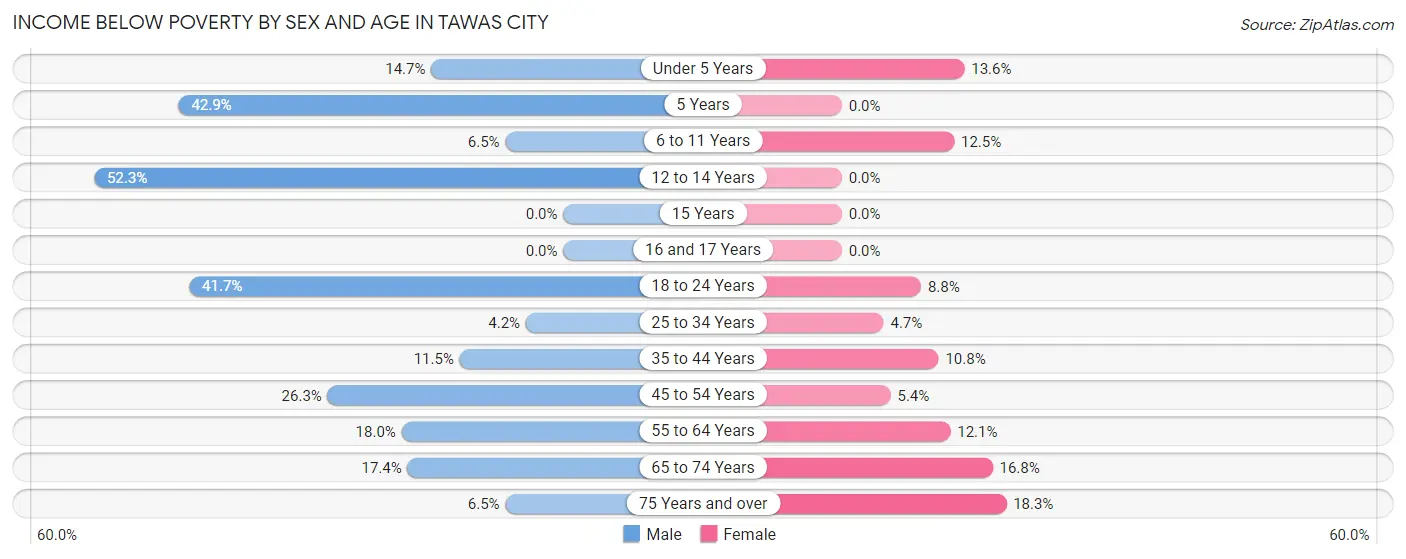
| Age Bracket | Male | Female |
| Under 5 Years | 5 (14.7%) | 3 (13.6%) |
| 5 Years | 3 (42.9%) | 0 (0.0%) |
| 6 to 11 Years | 2 (6.5%) | 8 (12.5%) |
| 12 to 14 Years | 23 (52.3%) | 0 (0.0%) |
| 15 Years | 0 (0.0%) | 0 (0.0%) |
| 16 and 17 Years | 0 (0.0%) | 0 (0.0%) |
| 18 to 24 Years | 25 (41.7%) | 3 (8.8%) |
| 25 to 34 Years | 4 (4.2%) | 4 (4.6%) |
| 35 to 44 Years | 9 (11.5%) | 14 (10.8%) |
| 45 to 54 Years | 21 (26.3%) | 5 (5.4%) |
| 55 to 64 Years | 29 (18.0%) | 18 (12.1%) |
| 65 to 74 Years | 17 (17.3%) | 22 (16.8%) |
| 75 Years and over | 4 (6.5%) | 13 (18.3%) |
| Total | 142 (18.3%) | 90 (10.9%) |
Income Above Poverty by Sex and Age in Tawas City
According to the poverty statistics in Tawas City, males aged 16 and 17 years and females aged 5 years are the age groups that are most secure financially, with 100.0% of males and 100.0% of females in these age groups living above the poverty line.
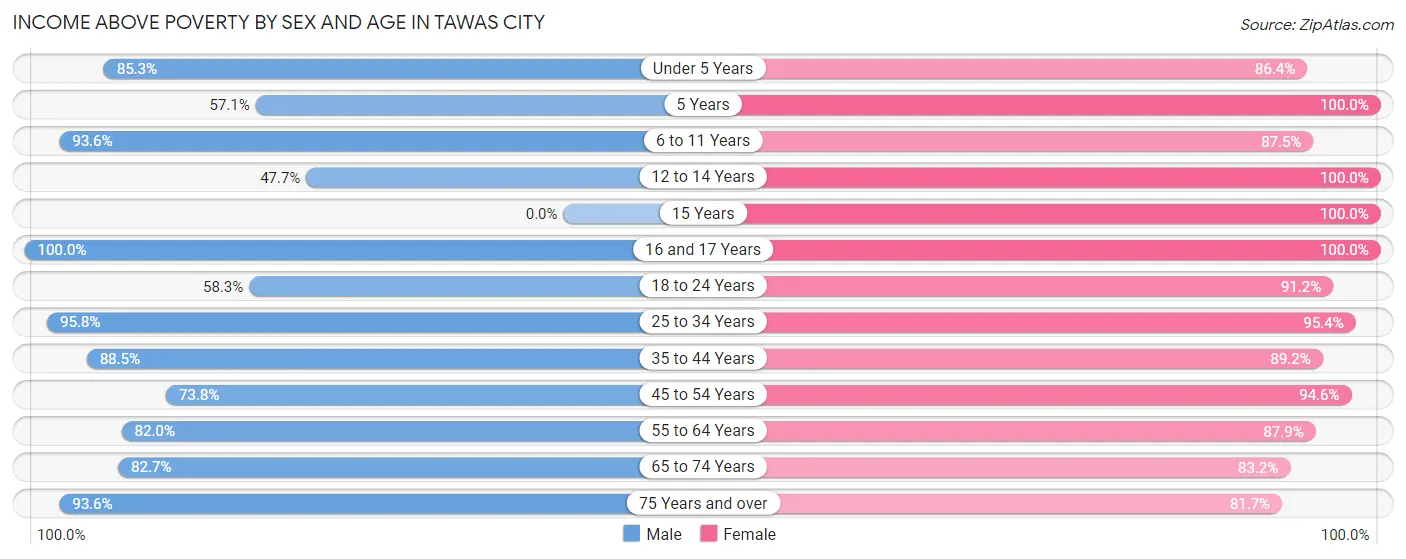
| Age Bracket | Male | Female |
| Under 5 Years | 29 (85.3%) | 19 (86.4%) |
| 5 Years | 4 (57.1%) | 19 (100.0%) |
| 6 to 11 Years | 29 (93.5%) | 56 (87.5%) |
| 12 to 14 Years | 21 (47.7%) | 11 (100.0%) |
| 15 Years | 0 (0.0%) | 9 (100.0%) |
| 16 and 17 Years | 23 (100.0%) | 7 (100.0%) |
| 18 to 24 Years | 35 (58.3%) | 31 (91.2%) |
| 25 to 34 Years | 92 (95.8%) | 82 (95.4%) |
| 35 to 44 Years | 69 (88.5%) | 116 (89.2%) |
| 45 to 54 Years | 59 (73.8%) | 87 (94.6%) |
| 55 to 64 Years | 132 (82.0%) | 131 (87.9%) |
| 65 to 74 Years | 81 (82.7%) | 109 (83.2%) |
| 75 Years and over | 58 (93.5%) | 58 (81.7%) |
| Total | 632 (81.7%) | 735 (89.1%) |
Income Below Poverty Among Married-Couple Families in Tawas City
The poverty statistics for married-couple families in Tawas City show that 2.1% or 6 of the total 281 families live below the poverty line. Families with 3 or 4 children have the highest poverty rate of 50.0%, comprising of 4 families. On the other hand, families with no children have the lowest poverty rate of 0.0%, which includes 0 families.
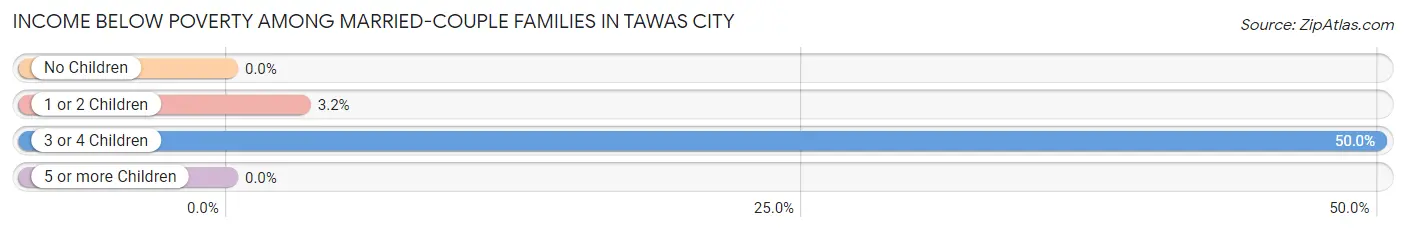
| Children | Above Poverty | Below Poverty |
| No Children | 210 (100.0%) | 0 (0.0%) |
| 1 or 2 Children | 61 (96.8%) | 2 (3.2%) |
| 3 or 4 Children | 4 (50.0%) | 4 (50.0%) |
| 5 or more Children | 0 (0.0%) | 0 (0.0%) |
| Total | 275 (97.9%) | 6 (2.1%) |
Income Below Poverty Among Single-Parent Households in Tawas City
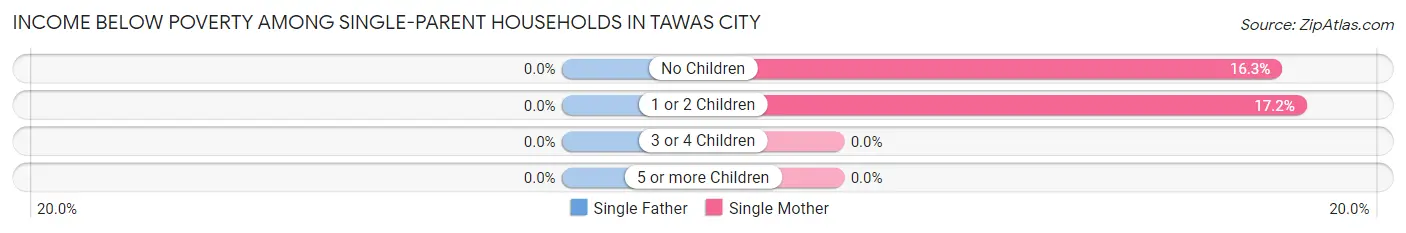
| Children | Single Father | Single Mother |
| No Children | 0 (0.0%) | 8 (16.3%) |
| 1 or 2 Children | 0 (0.0%) | 15 (17.2%) |
| 3 or 4 Children | 0 (0.0%) | 0 (0.0%) |
| 5 or more Children | 0 (0.0%) | 0 (0.0%) |
| Total | 0 (0.0%) | 23 (16.1%) |
Income Below Poverty Among Married-Couple vs Single-Parent Households in Tawas City
The poverty data for Tawas City shows that 6 of the married-couple family households (2.1%) and 23 of the single-parent households (14.2%) are living below the poverty level. Within the married-couple family households, those with 3 or 4 children have the highest poverty rate, with 4 households (50.0%) falling below the poverty line. Among the single-parent households, those with 1 or 2 children have the highest poverty rate, with 15 household (15.3%) living below poverty.
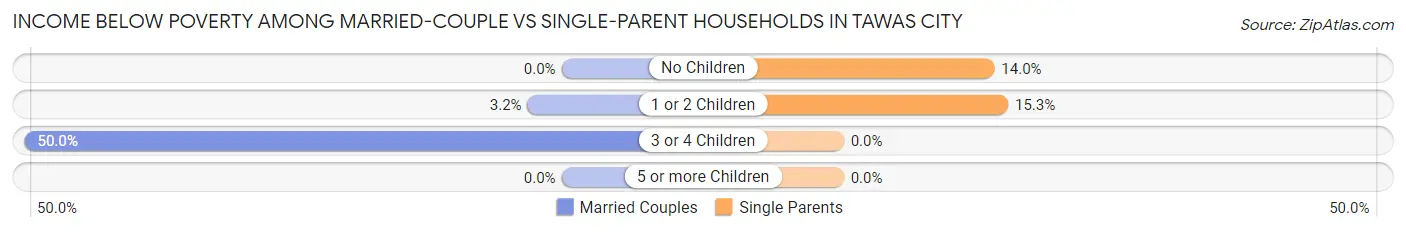
| Children | Married-Couple Families | Single-Parent Households |
| No Children | 0 (0.0%) | 8 (14.0%) |
| 1 or 2 Children | 2 (3.2%) | 15 (15.3%) |
| 3 or 4 Children | 4 (50.0%) | 0 (0.0%) |
| 5 or more Children | 0 (0.0%) | 0 (0.0%) |
| Total | 6 (2.1%) | 23 (14.2%) |
Race in Tawas City
The most populous races in Tawas City are White / Caucasian (1,561 | 89.2%), Two or more Races (116 | 6.6%), and Hispanic or Latino (68 | 3.9%).
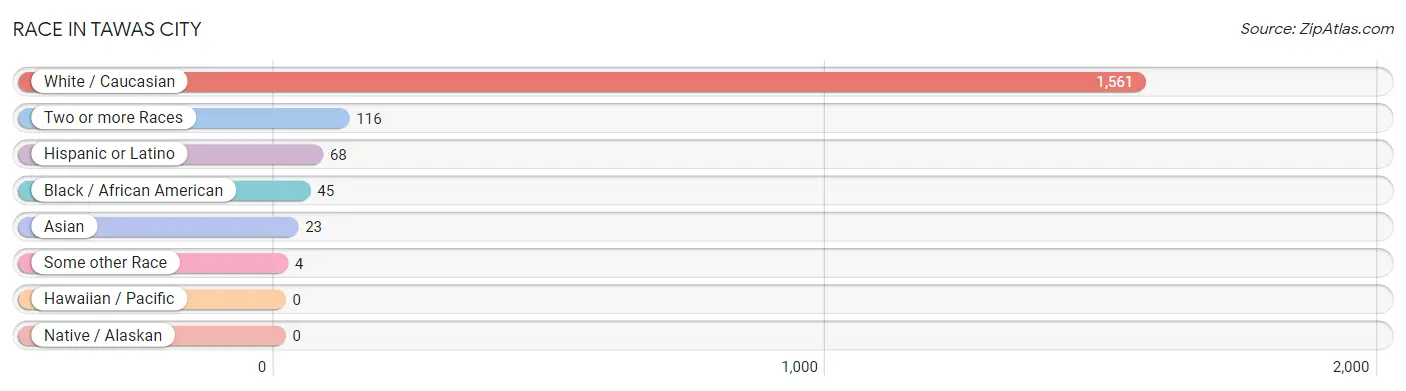
| Race | # Population | % Population |
| Asian | 23 | 1.3% |
| Black / African American | 45 | 2.6% |
| Hawaiian / Pacific | 0 | 0.0% |
| Hispanic or Latino | 68 | 3.9% |
| Native / Alaskan | 0 | 0.0% |
| White / Caucasian | 1,561 | 89.2% |
| Two or more Races | 116 | 6.6% |
| Some other Race | 4 | 0.2% |
| Total | 1,749 | 100.0% |
Ancestry in Tawas City
The most populous ancestries reported in Tawas City are German (483 | 27.6%), Irish (216 | 12.3%), English (193 | 11.0%), American (135 | 7.7%), and Polish (125 | 7.1%), together accounting for 65.9% of all Tawas City residents.
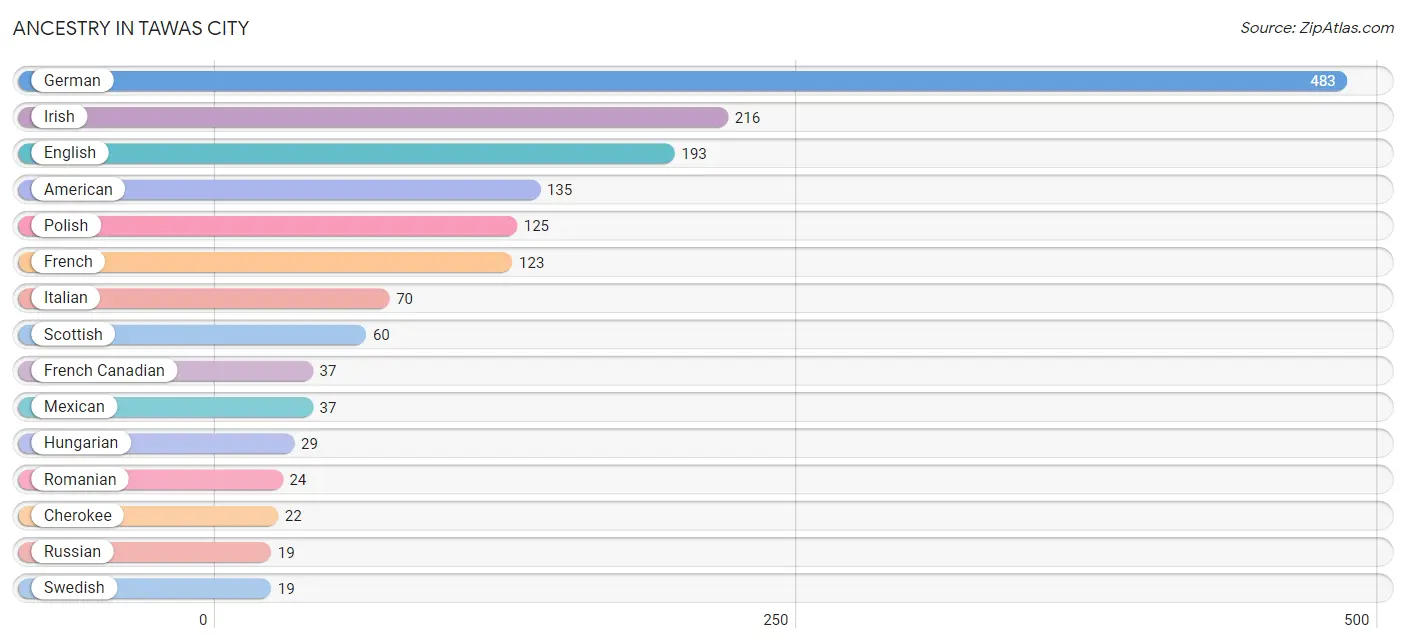
| Ancestry | # Population | % Population |
| American | 135 | 7.7% |
| Arab | 9 | 0.5% |
| Assyrian / Chaldean / Syriac | 8 | 0.5% |
| Austrian | 3 | 0.2% |
| Belgian | 14 | 0.8% |
| British | 7 | 0.4% |
| Canadian | 4 | 0.2% |
| Cherokee | 22 | 1.3% |
| Creek | 2 | 0.1% |
| Czechoslovakian | 2 | 0.1% |
| Dutch | 13 | 0.7% |
| English | 193 | 11.0% |
| European | 18 | 1.0% |
| Finnish | 10 | 0.6% |
| French | 123 | 7.0% |
| French Canadian | 37 | 2.1% |
| German | 483 | 27.6% |
| Hungarian | 29 | 1.7% |
| Indian (Asian) | 9 | 0.5% |
| Irish | 216 | 12.3% |
| Italian | 70 | 4.0% |
| Jamaican | 9 | 0.5% |
| Korean | 14 | 0.8% |
| Mexican | 37 | 2.1% |
| Nigerian | 13 | 0.7% |
| Northern European | 5 | 0.3% |
| Norwegian | 9 | 0.5% |
| Polish | 125 | 7.1% |
| Portuguese | 8 | 0.5% |
| Romanian | 24 | 1.4% |
| Russian | 19 | 1.1% |
| Scandinavian | 14 | 0.8% |
| Scotch-Irish | 4 | 0.2% |
| Scottish | 60 | 3.4% |
| Spaniard | 7 | 0.4% |
| Spanish | 9 | 0.5% |
| Subsaharan African | 13 | 0.7% |
| Swedish | 19 | 1.1% |
| Welsh | 12 | 0.7% | View All 39 Rows |
Immigrants in Tawas City
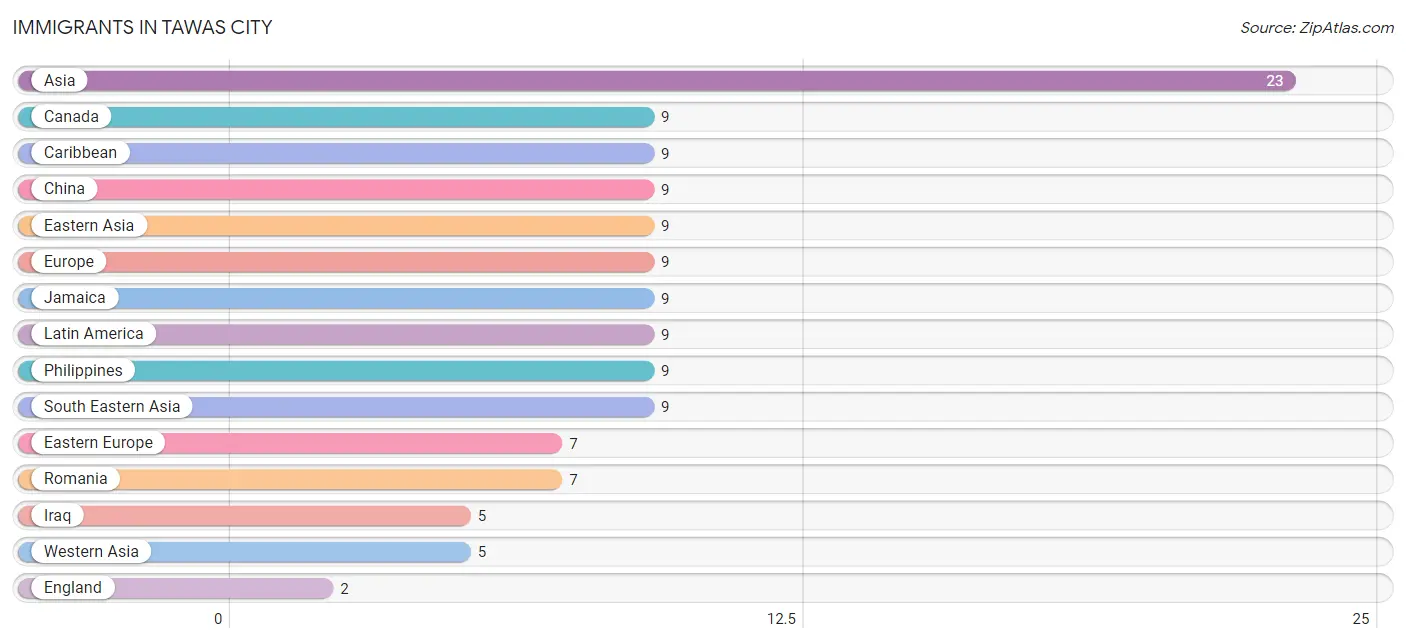
The most numerous immigrant groups reported in Tawas City came from Asia (23 | 1.3%), Canada (9 | 0.5%), Caribbean (9 | 0.5%), China (9 | 0.5%), and Eastern Asia (9 | 0.5%), together accounting for 3.4% of all Tawas City residents.
| Immigration Origin | # Population | % Population |
| Asia | 23 | 1.3% |
| Canada | 9 | 0.5% |
| Caribbean | 9 | 0.5% |
| China | 9 | 0.5% |
| Eastern Asia | 9 | 0.5% |
| Eastern Europe | 7 | 0.4% |
| England | 2 | 0.1% |
| Europe | 9 | 0.5% |
| Iraq | 5 | 0.3% |
| Jamaica | 9 | 0.5% |
| Latin America | 9 | 0.5% |
| Northern Europe | 2 | 0.1% |
| Philippines | 9 | 0.5% |
| Romania | 7 | 0.4% |
| South Eastern Asia | 9 | 0.5% |
| Western Asia | 5 | 0.3% | View All 16 Rows |
Sex and Age in Tawas City
Sex and Age in Tawas City
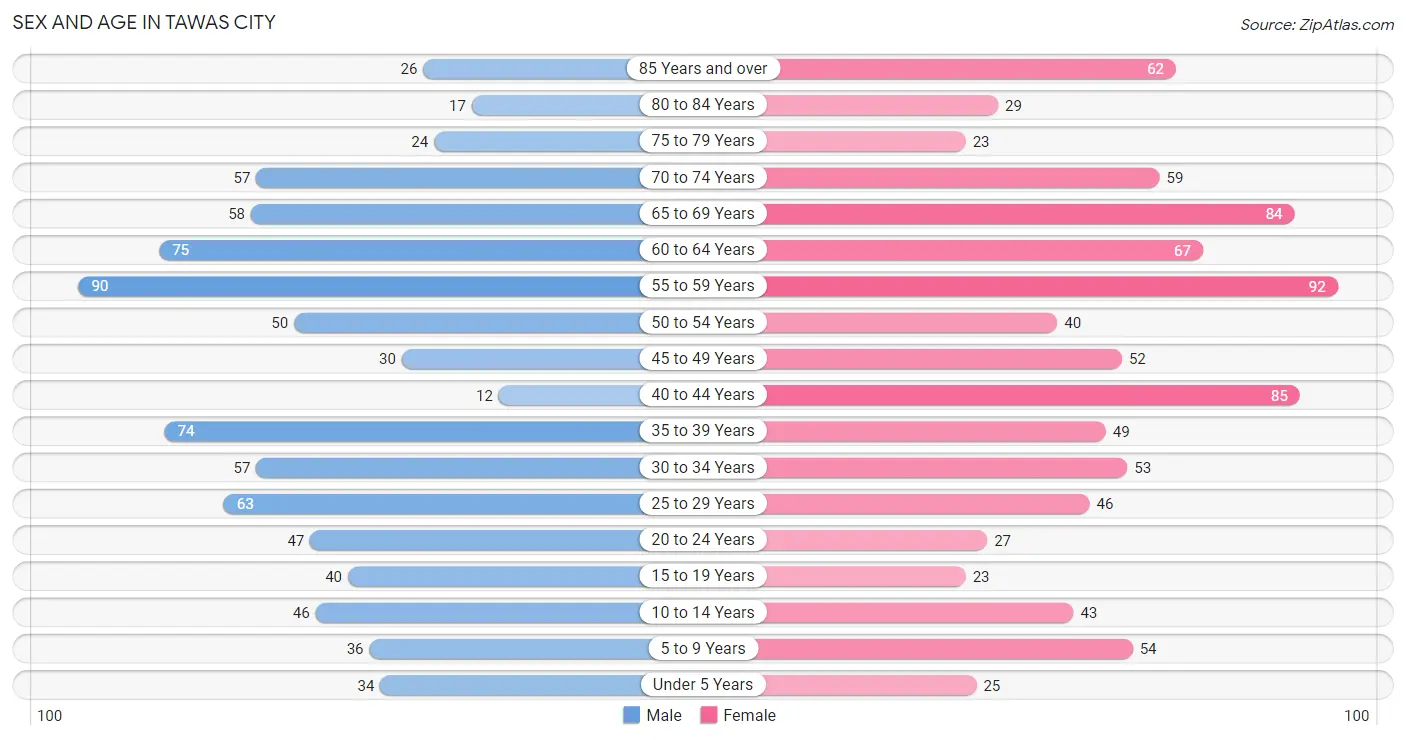
The most populous age groups in Tawas City are 55 to 59 Years (90 | 10.8%) for men and 55 to 59 Years (92 | 10.1%) for women.
| Age Bracket | Male | Female |
| Under 5 Years | 34 (4.1%) | 25 (2.7%) |
| 5 to 9 Years | 36 (4.3%) | 54 (5.9%) |
| 10 to 14 Years | 46 (5.5%) | 43 (4.7%) |
| 15 to 19 Years | 40 (4.8%) | 23 (2.5%) |
| 20 to 24 Years | 47 (5.6%) | 27 (3.0%) |
| 25 to 29 Years | 63 (7.5%) | 46 (5.0%) |
| 30 to 34 Years | 57 (6.8%) | 53 (5.8%) |
| 35 to 39 Years | 74 (8.8%) | 49 (5.4%) |
| 40 to 44 Years | 12 (1.4%) | 85 (9.3%) |
| 45 to 49 Years | 30 (3.6%) | 52 (5.7%) |
| 50 to 54 Years | 50 (6.0%) | 40 (4.4%) |
| 55 to 59 Years | 90 (10.8%) | 92 (10.1%) |
| 60 to 64 Years | 75 (9.0%) | 67 (7.3%) |
| 65 to 69 Years | 58 (6.9%) | 84 (9.2%) |
| 70 to 74 Years | 57 (6.8%) | 59 (6.5%) |
| 75 to 79 Years | 24 (2.9%) | 23 (2.5%) |
| 80 to 84 Years | 17 (2.0%) | 29 (3.2%) |
| 85 Years and over | 26 (3.1%) | 62 (6.8%) |
| Total | 836 (100.0%) | 913 (100.0%) |
Families and Households in Tawas City
Median Family Size in Tawas City
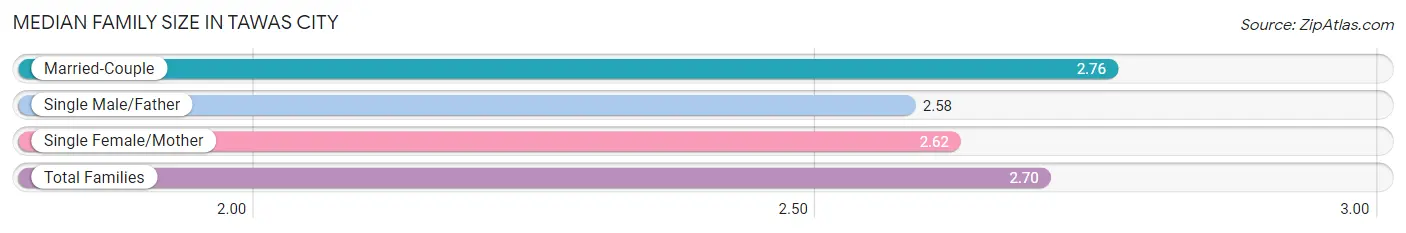
The median family size in Tawas City is 2.70 persons per family, with married-couple families (281 | 63.4%) accounting for the largest median family size of 2.76 persons per family. On the other hand, single male/father families (19 | 4.3%) represent the smallest median family size with 2.58 persons per family.
| Family Type | # Families | Family Size |
| Married-Couple | 281 (63.4%) | 2.76 |
| Single Male/Father | 19 (4.3%) | 2.58 |
| Single Female/Mother | 143 (32.3%) | 2.62 |
| Total Families | 443 (100.0%) | 2.70 |
Median Household Size in Tawas City
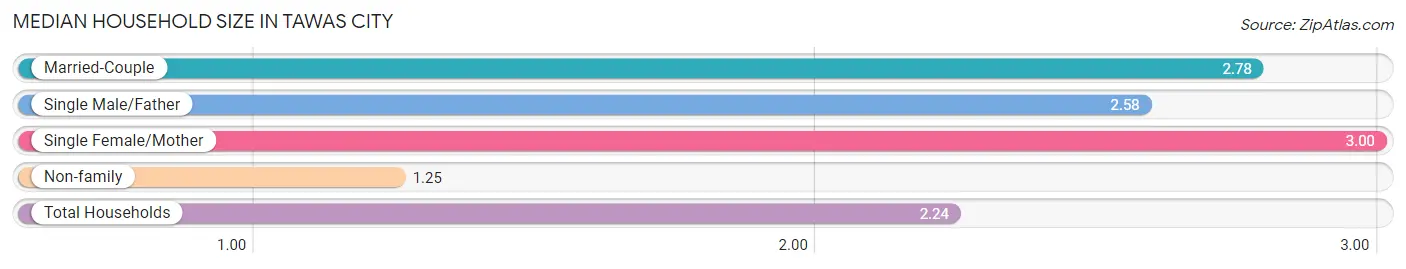
The median household size in Tawas City is 2.24 persons per household, with single female/mother households (143 | 20.0%) accounting for the largest median household size of 3 persons per household. non-family households (271 | 38.0%) represent the smallest median household size with 1.25 persons per household.
| Household Type | # Households | Household Size |
| Married-Couple | 281 (39.4%) | 2.78 |
| Single Male/Father | 19 (2.7%) | 2.58 |
| Single Female/Mother | 143 (20.0%) | 3.00 |
| Non-family | 271 (38.0%) | 1.25 |
| Total Households | 714 (100.0%) | 2.24 |
Household Size by Marriage Status in Tawas City
Out of a total of 714 households in Tawas City, 443 (62.0%) are family households, while 271 (38.0%) are nonfamily households. The most numerous type of family households are 2-person households, comprising 280, and the most common type of nonfamily households are 1-person households, comprising 222.
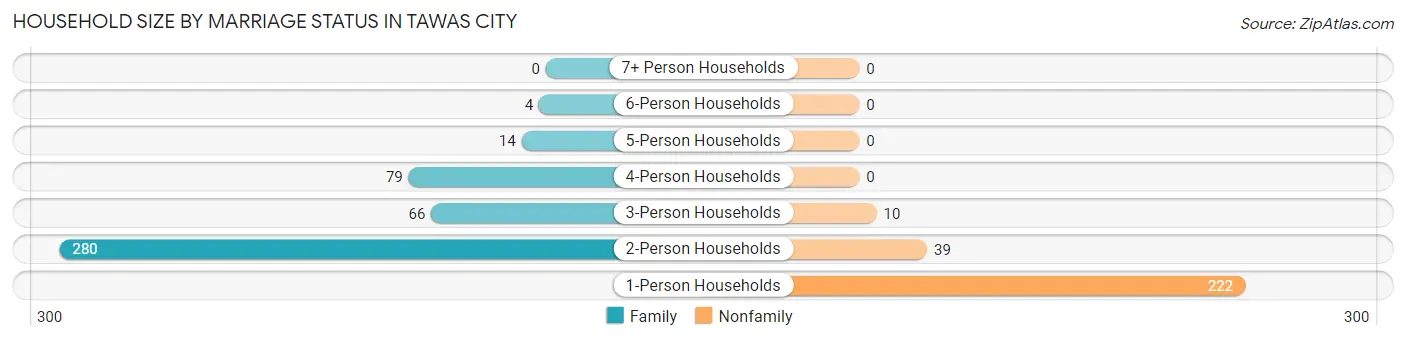
| Household Size | Family Households | Nonfamily Households |
| 1-Person Households | - | 222 (31.1%) |
| 2-Person Households | 280 (39.2%) | 39 (5.5%) |
| 3-Person Households | 66 (9.2%) | 10 (1.4%) |
| 4-Person Households | 79 (11.1%) | 0 (0.0%) |
| 5-Person Households | 14 (2.0%) | 0 (0.0%) |
| 6-Person Households | 4 (0.6%) | 0 (0.0%) |
| 7+ Person Households | 0 (0.0%) | 0 (0.0%) |
| Total | 443 (62.0%) | 271 (38.0%) |
Female Fertility in Tawas City
Fertility by Age in Tawas City
Average fertility rate in Tawas City is 23.0 births per 1,000 women. Women in the age bracket of 20 to 34 years have the highest fertility rate with 32.0 births per 1,000 women. Women in the age bracket of 20 to 34 years acount for 50.0% of all women with births.
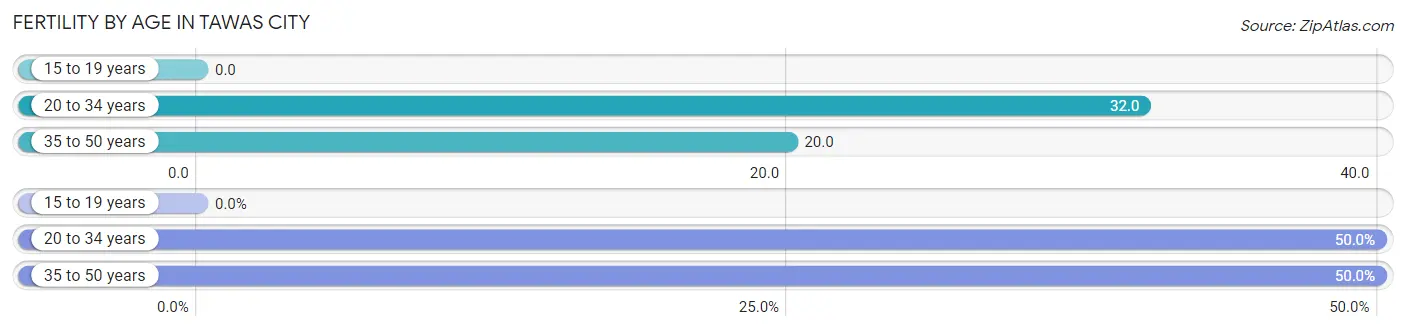
| Age Bracket | Women with Births | Births / 1,000 Women |
| 15 to 19 years | 0 (0.0%) | 0.0 |
| 20 to 34 years | 4 (50.0%) | 32.0 |
| 35 to 50 years | 4 (50.0%) | 20.0 |
| Total | 8 (100.0%) | 23.0 |
Fertility by Age by Marriage Status in Tawas City
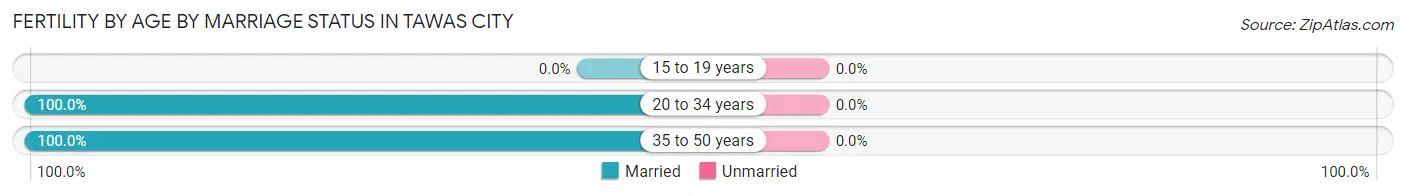
| Age Bracket | Married | Unmarried |
| 15 to 19 years | 0 (0.0%) | 0 (0.0%) |
| 20 to 34 years | 4 (100.0%) | 0 (0.0%) |
| 35 to 50 years | 4 (100.0%) | 0 (0.0%) |
| Total | 8 (100.0%) | 0 (0.0%) |
Fertility by Education in Tawas City
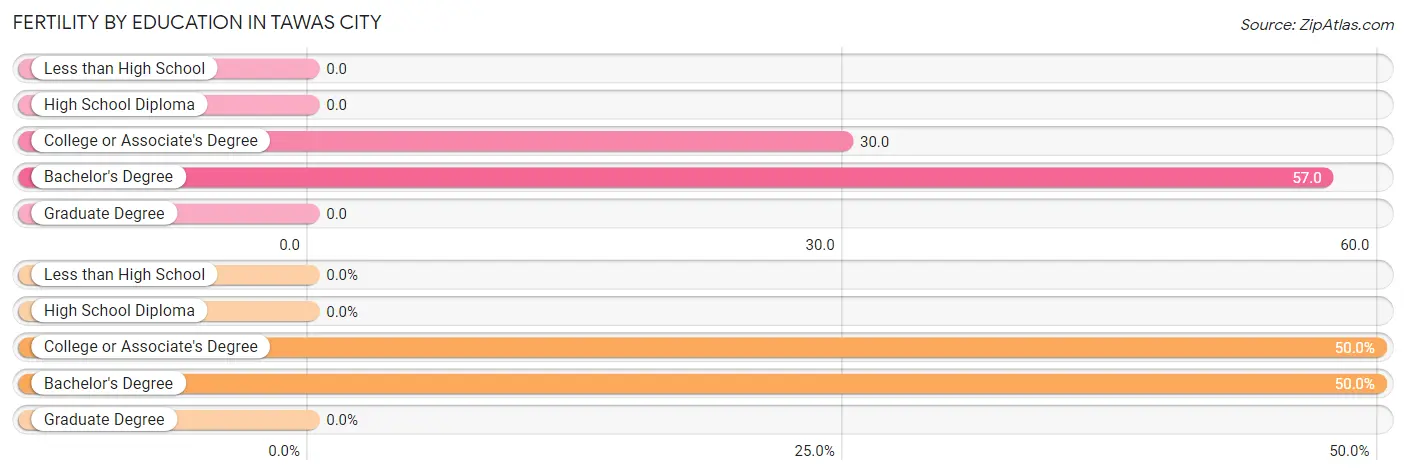
| Educational Attainment | Women with Births | Births / 1,000 Women |
| Less than High School | 0 (0.0%) | 0.0 |
| High School Diploma | 0 (0.0%) | 0.0 |
| College or Associate's Degree | 4 (50.0%) | 30.0 |
| Bachelor's Degree | 4 (50.0%) | 57.0 |
| Graduate Degree | 0 (0.0%) | 0.0 |
| Total | 8 (100.0%) | 23.0 |
Fertility by Education by Marriage Status in Tawas City
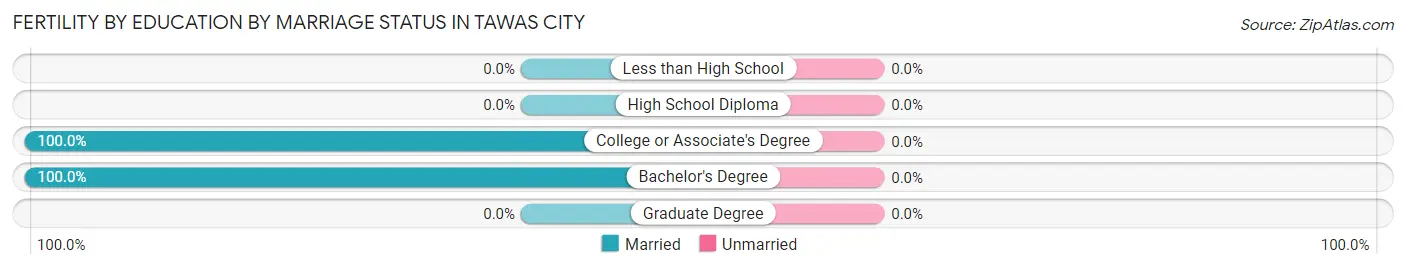
| Educational Attainment | Married | Unmarried |
| Less than High School | 0 (0.0%) | 0 (0.0%) |
| High School Diploma | 0 (0.0%) | 0 (0.0%) |
| College or Associate's Degree | 4 (100.0%) | 0 (0.0%) |
| Bachelor's Degree | 4 (100.0%) | 0 (0.0%) |
| Graduate Degree | 0 (0.0%) | 0 (0.0%) |
| Total | 8 (100.0%) | 0 (0.0%) |
Employment Characteristics in Tawas City
Employment by Class of Employer in Tawas City
Among the 712 employed individuals in Tawas City, private company employees (517 | 72.6%), not-for-profit organizations (57 | 8.0%), and local government employees (46 | 6.5%) make up the most common classes of employment.
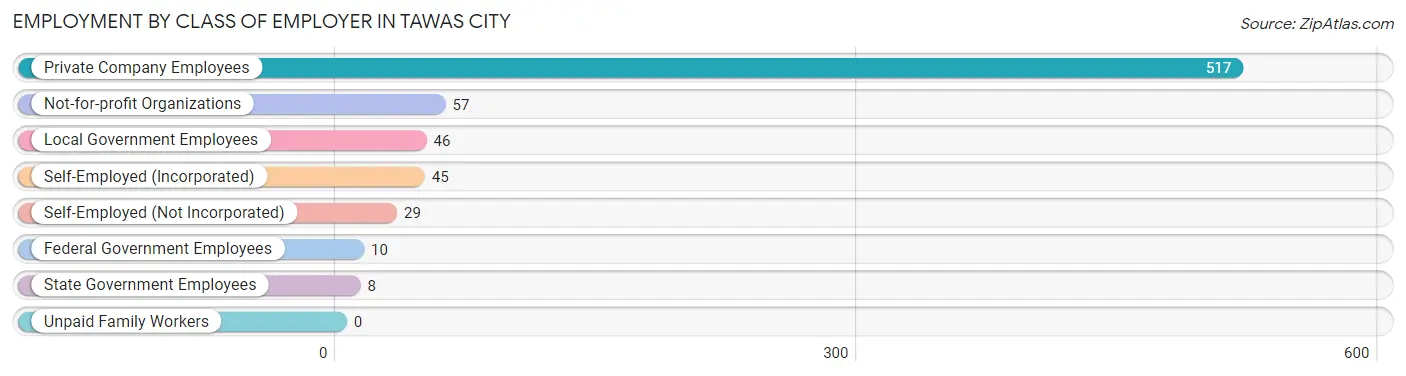
| Employer Class | # Employees | % Employees |
| Private Company Employees | 517 | 72.6% |
| Self-Employed (Incorporated) | 45 | 6.3% |
| Self-Employed (Not Incorporated) | 29 | 4.1% |
| Not-for-profit Organizations | 57 | 8.0% |
| Local Government Employees | 46 | 6.5% |
| State Government Employees | 8 | 1.1% |
| Federal Government Employees | 10 | 1.4% |
| Unpaid Family Workers | 0 | 0.0% |
| Total | 712 | 100.0% |
Employment Status by Age in Tawas City
According to the labor force statistics for Tawas City, out of the total population over 16 years of age (1,502), 52.6% or 790 individuals are in the labor force, with 9.6% or 76 of them unemployed. The age group with the highest labor force participation rate is 20 to 24 years, with 83.8% or 62 individuals in the labor force. Within the labor force, the 16 to 19 years age range has the highest percentage of unemployed individuals, with 47.1% or 16 of them being unemployed.
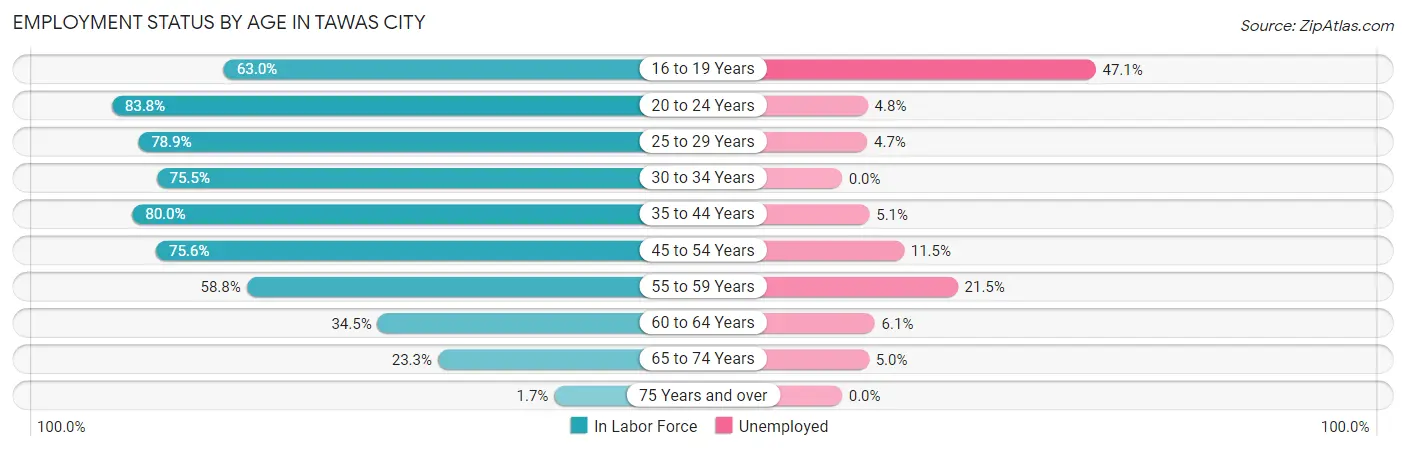
| Age Bracket | In Labor Force | Unemployed |
| 16 to 19 Years | 34 (63.0%) | 16 (47.1%) |
| 20 to 24 Years | 62 (83.8%) | 3 (4.8%) |
| 25 to 29 Years | 86 (78.9%) | 4 (4.7%) |
| 30 to 34 Years | 83 (75.5%) | 0 (0.0%) |
| 35 to 44 Years | 176 (80.0%) | 9 (5.1%) |
| 45 to 54 Years | 130 (75.6%) | 15 (11.5%) |
| 55 to 59 Years | 107 (58.8%) | 23 (21.5%) |
| 60 to 64 Years | 49 (34.5%) | 3 (6.1%) |
| 65 to 74 Years | 60 (23.3%) | 3 (5.0%) |
| 75 Years and over | 3 (1.7%) | 0 (0.0%) |
| Total | 790 (52.6%) | 76 (9.6%) |
Employment Status by Educational Attainment in Tawas City
According to labor force statistics for Tawas City, 67.5% of individuals (631) out of the total population between 25 and 64 years of age (935) are in the labor force, with 8.6% or 54 of them being unemployed. The group with the highest labor force participation rate are those with the educational attainment of bachelor's degree or higher, with 76.3% or 158 individuals in the labor force. Within the labor force, individuals with less than high school education have the highest percentage of unemployment, with 20.6% or 7 of them being unemployed.
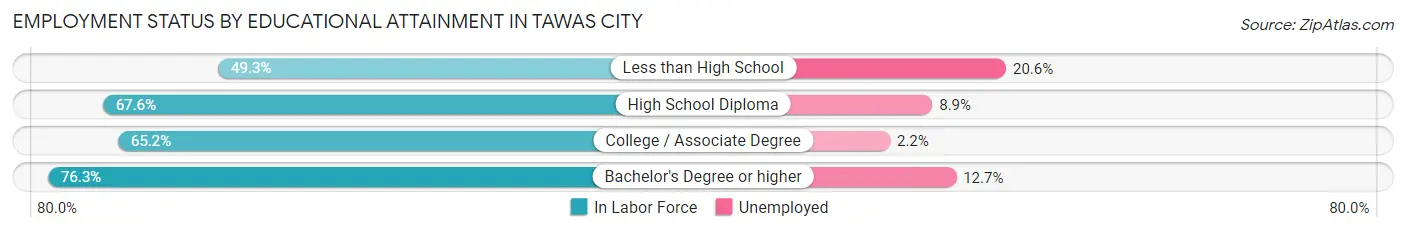
| Educational Attainment | In Labor Force | Unemployed |
| Less than High School | 34 (49.3%) | 14 (20.6%) |
| High School Diploma | 257 (67.6%) | 34 (8.9%) |
| College / Associate Degree | 182 (65.2%) | 6 (2.2%) |
| Bachelor's Degree or higher | 158 (76.3%) | 26 (12.7%) |
| Total | 631 (67.5%) | 80 (8.6%) |
Employment Occupations by Sex in Tawas City
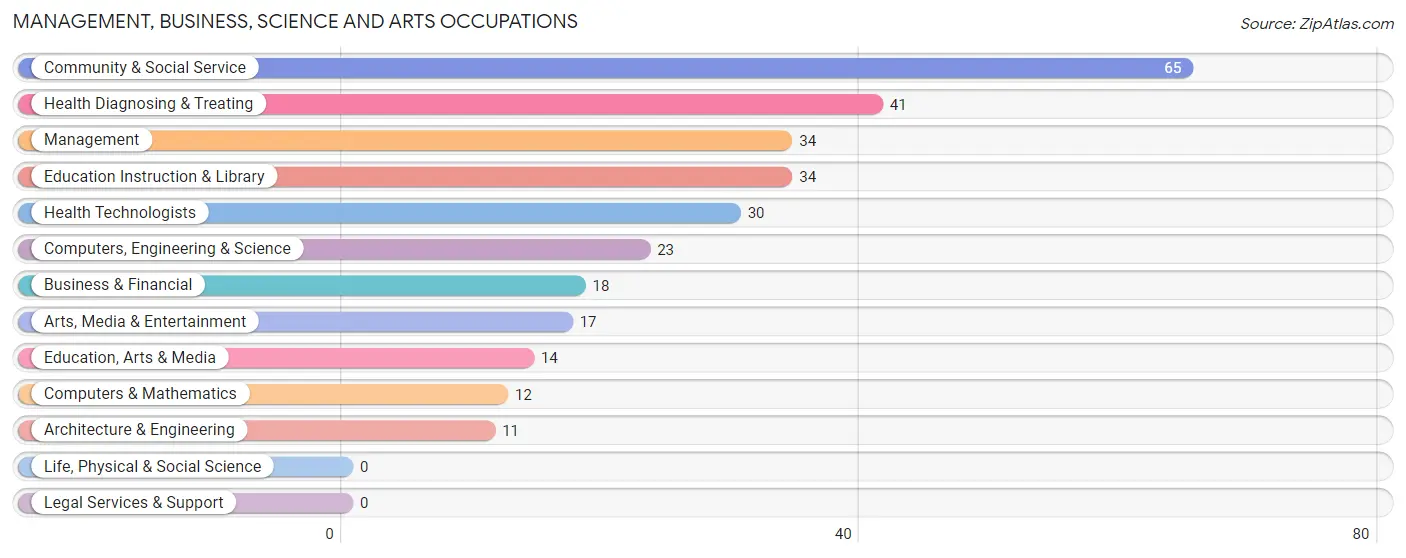
Management, Business, Science and Arts Occupations
The most common Management, Business, Science and Arts occupations in Tawas City are Community & Social Service (65 | 9.1%), Health Diagnosing & Treating (41 | 5.7%), Management (34 | 4.8%), Education Instruction & Library (34 | 4.8%), and Health Technologists (30 | 4.2%).
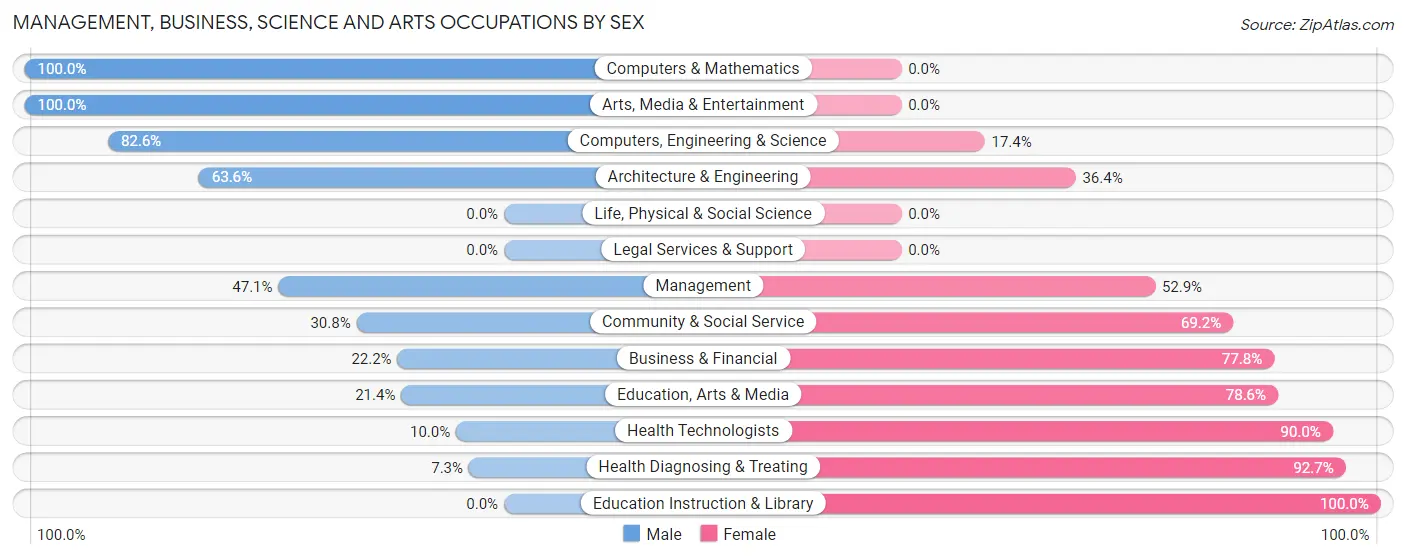
Management, Business, Science and Arts Occupations by Sex
Within the Management, Business, Science and Arts occupations in Tawas City, the most male-oriented occupations are Computers & Mathematics (100.0%), Arts, Media & Entertainment (100.0%), and Computers, Engineering & Science (82.6%), while the most female-oriented occupations are Education Instruction & Library (100.0%), Health Diagnosing & Treating (92.7%), and Health Technologists (90.0%).
| Occupation | Male | Female |
| Management | 16 (47.1%) | 18 (52.9%) |
| Business & Financial | 4 (22.2%) | 14 (77.8%) |
| Computers, Engineering & Science | 19 (82.6%) | 4 (17.4%) |
| Computers & Mathematics | 12 (100.0%) | 0 (0.0%) |
| Architecture & Engineering | 7 (63.6%) | 4 (36.4%) |
| Life, Physical & Social Science | 0 (0.0%) | 0 (0.0%) |
| Community & Social Service | 20 (30.8%) | 45 (69.2%) |
| Education, Arts & Media | 3 (21.4%) | 11 (78.6%) |
| Legal Services & Support | 0 (0.0%) | 0 (0.0%) |
| Education Instruction & Library | 0 (0.0%) | 34 (100.0%) |
| Arts, Media & Entertainment | 17 (100.0%) | 0 (0.0%) |
| Health Diagnosing & Treating | 3 (7.3%) | 38 (92.7%) |
| Health Technologists | 3 (10.0%) | 27 (90.0%) |
| Total (Category) | 62 (34.3%) | 119 (65.7%) |
| Total (Overall) | 298 (41.7%) | 416 (58.3%) |
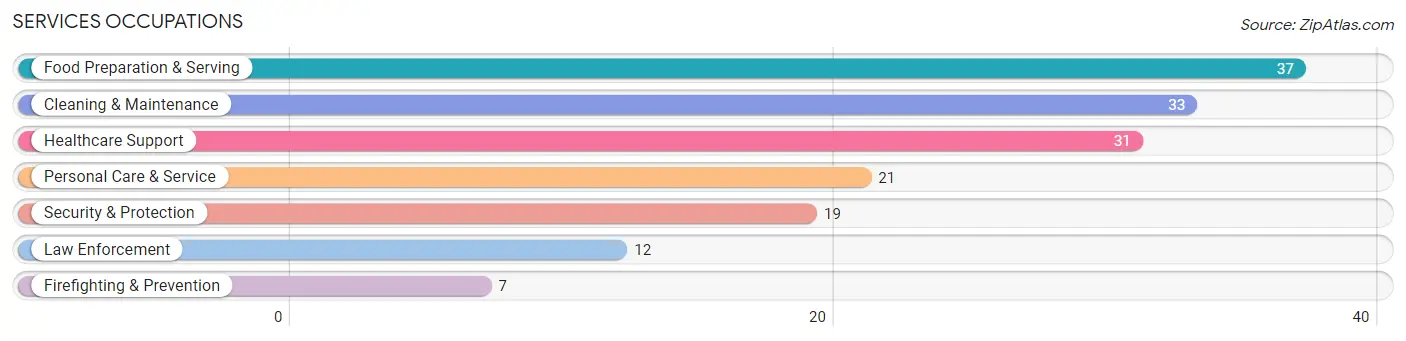
Services Occupations
The most common Services occupations in Tawas City are Food Preparation & Serving (37 | 5.2%), Cleaning & Maintenance (33 | 4.6%), Healthcare Support (31 | 4.3%), Personal Care & Service (21 | 2.9%), and Security & Protection (19 | 2.7%).
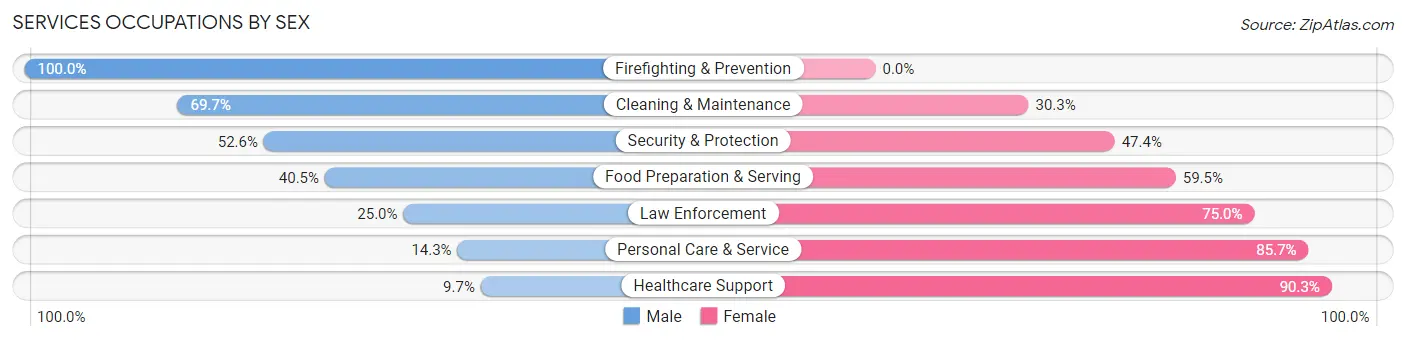
Services Occupations by Sex
Within the Services occupations in Tawas City, the most male-oriented occupations are Firefighting & Prevention (100.0%), Cleaning & Maintenance (69.7%), and Security & Protection (52.6%), while the most female-oriented occupations are Healthcare Support (90.3%), Personal Care & Service (85.7%), and Law Enforcement (75.0%).
| Occupation | Male | Female |
| Healthcare Support | 3 (9.7%) | 28 (90.3%) |
| Security & Protection | 10 (52.6%) | 9 (47.4%) |
| Firefighting & Prevention | 7 (100.0%) | 0 (0.0%) |
| Law Enforcement | 3 (25.0%) | 9 (75.0%) |
| Food Preparation & Serving | 15 (40.5%) | 22 (59.5%) |
| Cleaning & Maintenance | 23 (69.7%) | 10 (30.3%) |
| Personal Care & Service | 3 (14.3%) | 18 (85.7%) |
| Total (Category) | 54 (38.3%) | 87 (61.7%) |
| Total (Overall) | 298 (41.7%) | 416 (58.3%) |
Sales and Office Occupations
The most common Sales and Office occupations in Tawas City are Office & Administration (98 | 13.7%), and Sales & Related (77 | 10.8%).
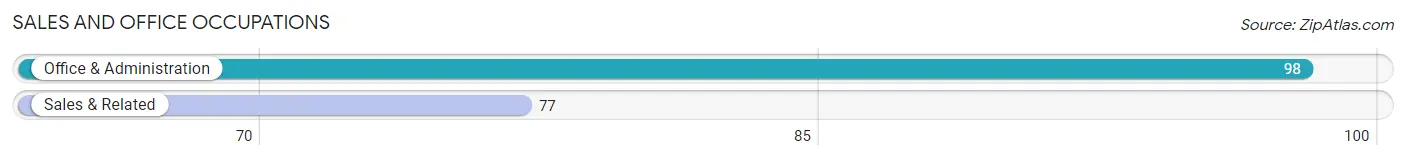
Sales and Office Occupations by Sex
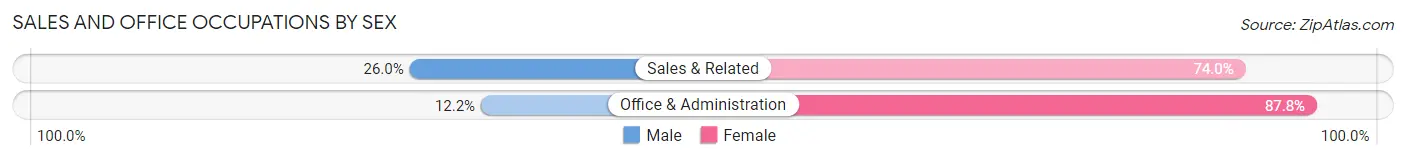
| Occupation | Male | Female |
| Sales & Related | 20 (26.0%) | 57 (74.0%) |
| Office & Administration | 12 (12.2%) | 86 (87.8%) |
| Total (Category) | 32 (18.3%) | 143 (81.7%) |
| Total (Overall) | 298 (41.7%) | 416 (58.3%) |
Natural Resources, Construction and Maintenance Occupations
The most common Natural Resources, Construction and Maintenance occupations in Tawas City are Construction & Extraction (37 | 5.2%), Installation, Maintenance & Repair (18 | 2.5%), and Farming, Fishing & Forestry (16 | 2.2%).
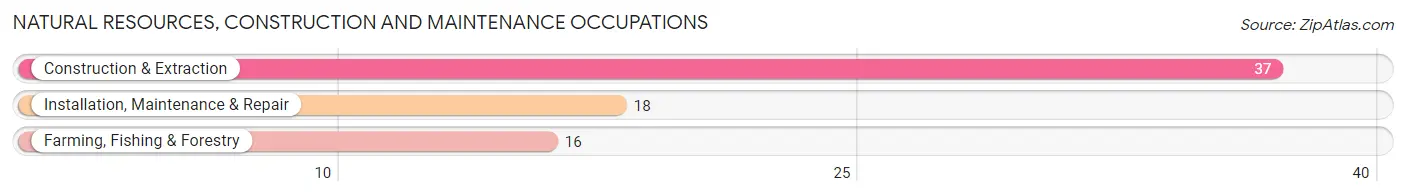
Natural Resources, Construction and Maintenance Occupations by Sex
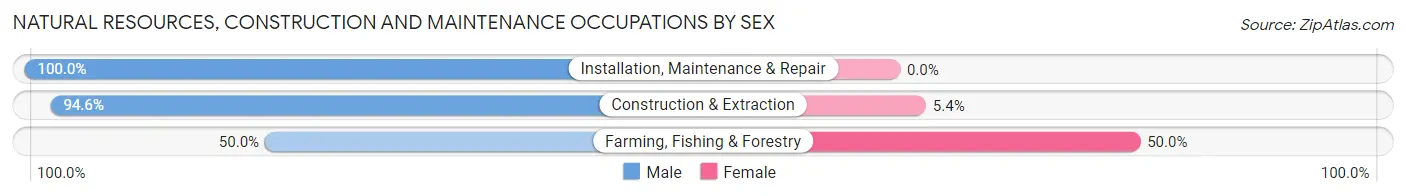
| Occupation | Male | Female |
| Farming, Fishing & Forestry | 8 (50.0%) | 8 (50.0%) |
| Construction & Extraction | 35 (94.6%) | 2 (5.4%) |
| Installation, Maintenance & Repair | 18 (100.0%) | 0 (0.0%) |
| Total (Category) | 61 (85.9%) | 10 (14.1%) |
| Total (Overall) | 298 (41.7%) | 416 (58.3%) |
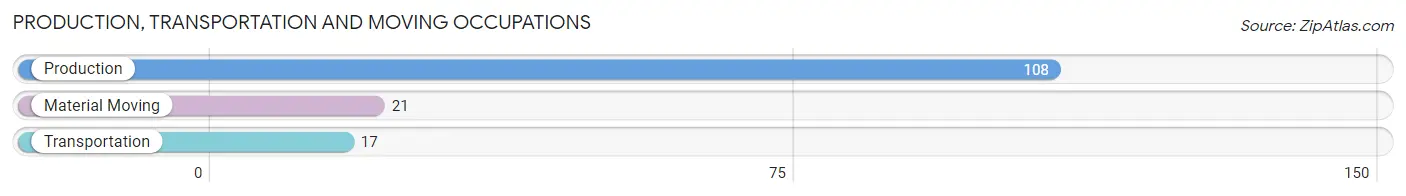
Production, Transportation and Moving Occupations
The most common Production, Transportation and Moving occupations in Tawas City are Production (108 | 15.1%), Material Moving (21 | 2.9%), and Transportation (17 | 2.4%).
Production, Transportation and Moving Occupations by Sex
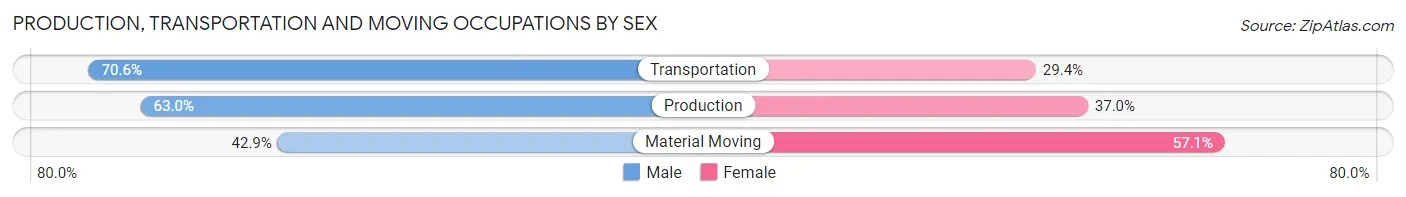
| Occupation | Male | Female |
| Production | 68 (63.0%) | 40 (37.0%) |
| Transportation | 12 (70.6%) | 5 (29.4%) |
| Material Moving | 9 (42.9%) | 12 (57.1%) |
| Total (Category) | 89 (61.0%) | 57 (39.0%) |
| Total (Overall) | 298 (41.7%) | 416 (58.3%) |
Employment Industries by Sex in Tawas City
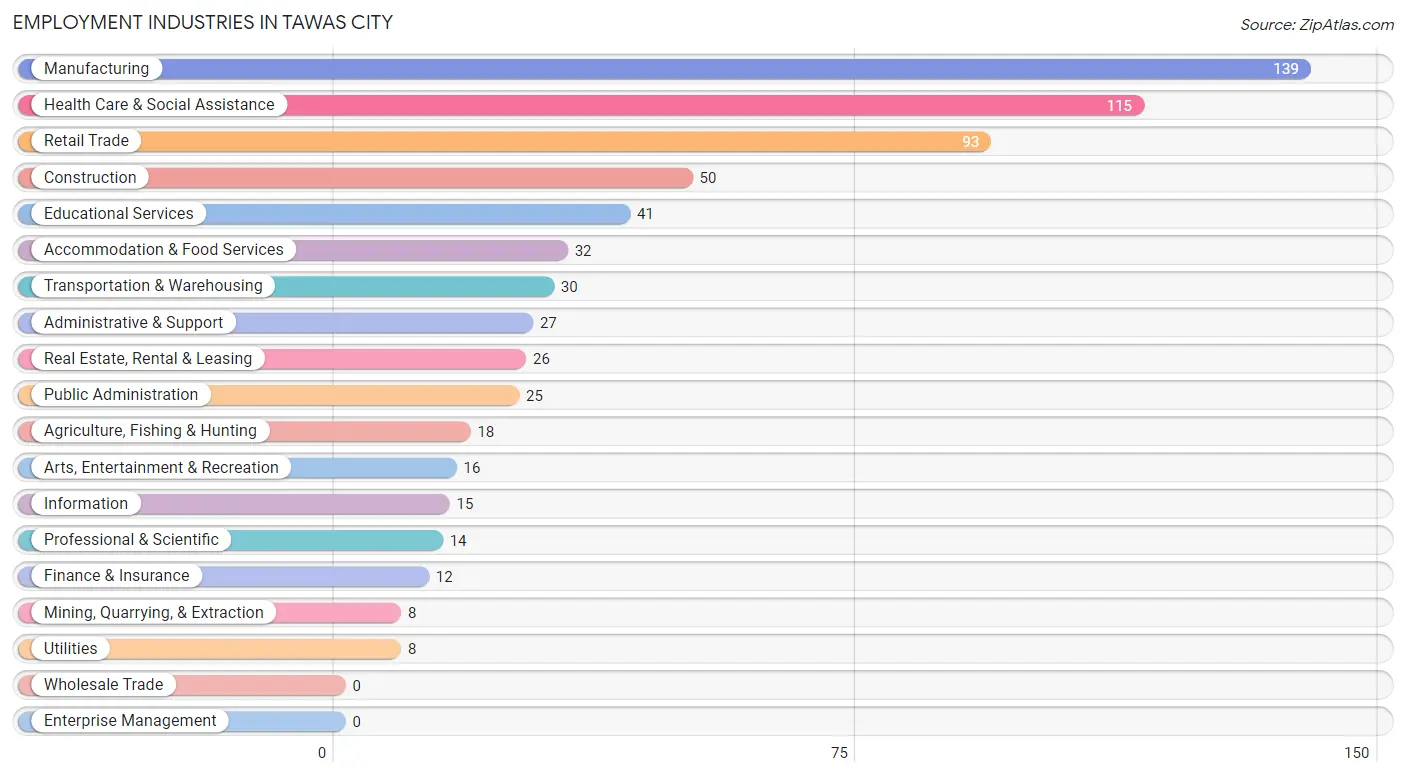
Employment Industries in Tawas City
The major employment industries in Tawas City include Manufacturing (139 | 19.5%), Health Care & Social Assistance (115 | 16.1%), Retail Trade (93 | 13.0%), Construction (50 | 7.0%), and Educational Services (41 | 5.7%).
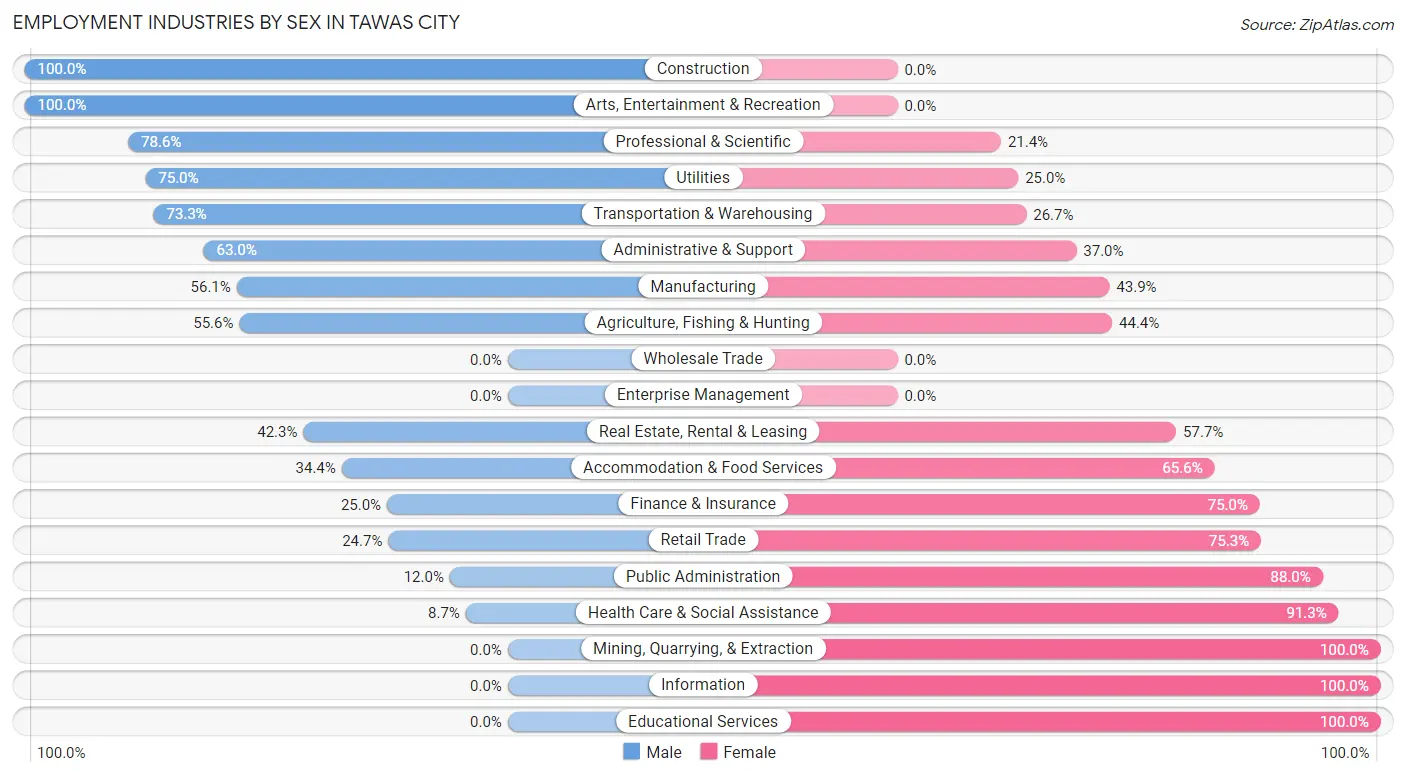
Employment Industries by Sex in Tawas City
The Tawas City industries that see more men than women are Construction (100.0%), Arts, Entertainment & Recreation (100.0%), and Professional & Scientific (78.6%), whereas the industries that tend to have a higher number of women are Mining, Quarrying, & Extraction (100.0%), Information (100.0%), and Educational Services (100.0%).
| Industry | Male | Female |
| Agriculture, Fishing & Hunting | 10 (55.6%) | 8 (44.4%) |
| Mining, Quarrying, & Extraction | 0 (0.0%) | 8 (100.0%) |
| Construction | 50 (100.0%) | 0 (0.0%) |
| Manufacturing | 78 (56.1%) | 61 (43.9%) |
| Wholesale Trade | 0 (0.0%) | 0 (0.0%) |
| Retail Trade | 23 (24.7%) | 70 (75.3%) |
| Transportation & Warehousing | 22 (73.3%) | 8 (26.7%) |
| Utilities | 6 (75.0%) | 2 (25.0%) |
| Information | 0 (0.0%) | 15 (100.0%) |
| Finance & Insurance | 3 (25.0%) | 9 (75.0%) |
| Real Estate, Rental & Leasing | 11 (42.3%) | 15 (57.7%) |
| Professional & Scientific | 11 (78.6%) | 3 (21.4%) |
| Enterprise Management | 0 (0.0%) | 0 (0.0%) |
| Administrative & Support | 17 (63.0%) | 10 (37.0%) |
| Educational Services | 0 (0.0%) | 41 (100.0%) |
| Health Care & Social Assistance | 10 (8.7%) | 105 (91.3%) |
| Arts, Entertainment & Recreation | 16 (100.0%) | 0 (0.0%) |
| Accommodation & Food Services | 11 (34.4%) | 21 (65.6%) |
| Public Administration | 3 (12.0%) | 22 (88.0%) |
| Total | 298 (41.7%) | 416 (58.3%) |
Education in Tawas City
School Enrollment in Tawas City
The most common levels of schooling among the 275 students in Tawas City are middle school (83 | 30.2%), elementary school (59 | 21.4%), and high school (53 | 19.3%).
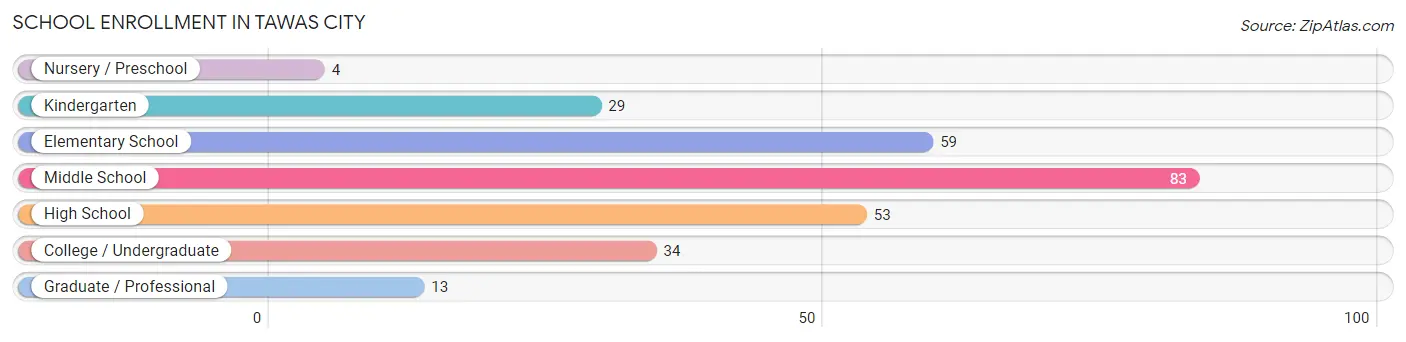
| School Level | # Students | % Students |
| Nursery / Preschool | 4 | 1.5% |
| Kindergarten | 29 | 10.5% |
| Elementary School | 59 | 21.4% |
| Middle School | 83 | 30.2% |
| High School | 53 | 19.3% |
| College / Undergraduate | 34 | 12.4% |
| Graduate / Professional | 13 | 4.7% |
| Total | 275 | 100.0% |
School Enrollment by Age by Funding Source in Tawas City
Out of a total of 275 students who are enrolled in schools in Tawas City, 41 (14.9%) attend a private institution, while the remaining 234 (85.1%) are enrolled in public schools. The age group of 35 years and over has the highest likelihood of being enrolled in private schools, with 12 (75.0% in the age bracket) enrolled. Conversely, the age group of 3 to 4 year olds has the lowest likelihood of being enrolled in a private school, with 2 (100.0% in the age bracket) attending a public institution.
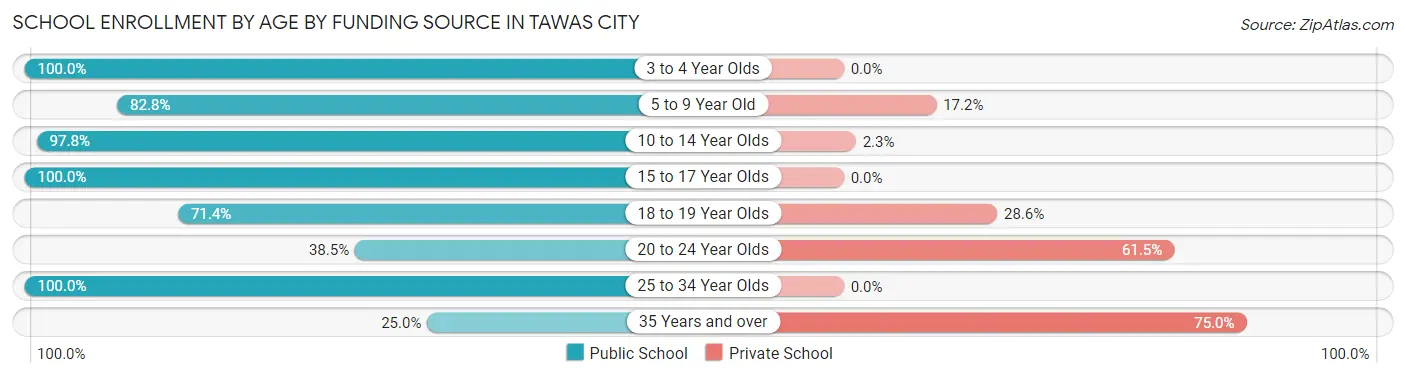
| Age Bracket | Public School | Private School |
| 3 to 4 Year Olds | 2 (100.0%) | 0 (0.0%) |
| 5 to 9 Year Old | 72 (82.8%) | 15 (17.2%) |
| 10 to 14 Year Olds | 87 (97.8%) | 2 (2.2%) |
| 15 to 17 Year Olds | 39 (100.0%) | 0 (0.0%) |
| 18 to 19 Year Olds | 10 (71.4%) | 4 (28.6%) |
| 20 to 24 Year Olds | 5 (38.5%) | 8 (61.5%) |
| 25 to 34 Year Olds | 15 (100.0%) | 0 (0.0%) |
| 35 Years and over | 4 (25.0%) | 12 (75.0%) |
| Total | 234 (85.1%) | 41 (14.9%) |
Educational Attainment by Field of Study in Tawas City
Business (64 | 23.4%), education (55 | 20.2%), science & technology (37 | 13.6%), arts & humanities (32 | 11.7%), and bio, nature & agricultural (22 | 8.1%) are the most common fields of study among 273 individuals in Tawas City who have obtained a bachelor's degree or higher.
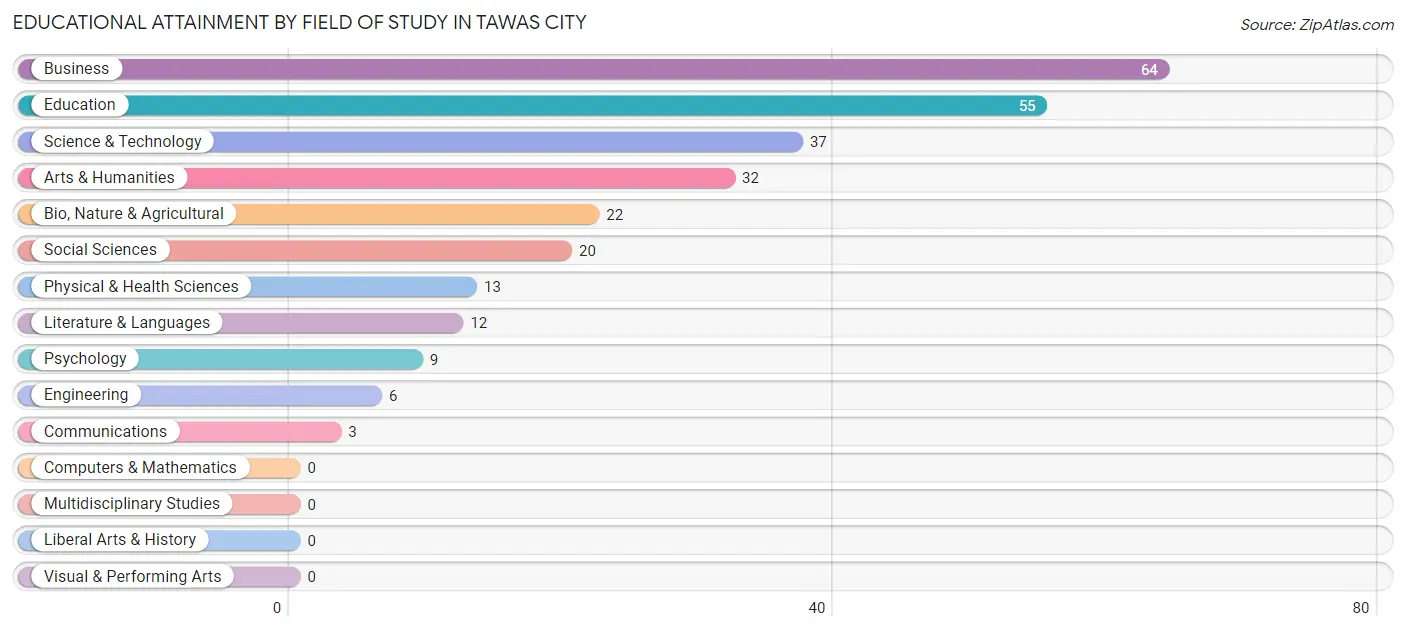
| Field of Study | # Graduates | % Graduates |
| Computers & Mathematics | 0 | 0.0% |
| Bio, Nature & Agricultural | 22 | 8.1% |
| Physical & Health Sciences | 13 | 4.8% |
| Psychology | 9 | 3.3% |
| Social Sciences | 20 | 7.3% |
| Engineering | 6 | 2.2% |
| Multidisciplinary Studies | 0 | 0.0% |
| Science & Technology | 37 | 13.6% |
| Business | 64 | 23.4% |
| Education | 55 | 20.2% |
| Literature & Languages | 12 | 4.4% |
| Liberal Arts & History | 0 | 0.0% |
| Visual & Performing Arts | 0 | 0.0% |
| Communications | 3 | 1.1% |
| Arts & Humanities | 32 | 11.7% |
| Total | 273 | 100.0% |
Transportation & Commute in Tawas City
Vehicle Availability by Sex in Tawas City
The most prevalent vehicle ownership categories in Tawas City are males with 2 vehicles (146, accounting for 49.0%) and females with 2 vehicles (205, making up 35.3%).
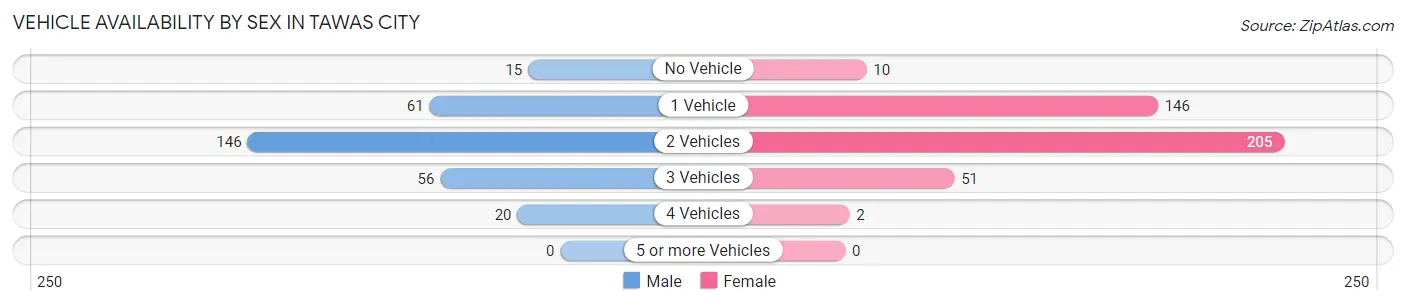
| Vehicles Available | Male | Female |
| No Vehicle | 15 (5.0%) | 10 (2.4%) |
| 1 Vehicle | 61 (20.5%) | 146 (35.3%) |
| 2 Vehicles | 146 (49.0%) | 205 (49.5%) |
| 3 Vehicles | 56 (18.8%) | 51 (12.3%) |
| 4 Vehicles | 20 (6.7%) | 2 (0.5%) |
| 5 or more Vehicles | 0 (0.0%) | 0 (0.0%) |
| Total | 298 (100.0%) | 414 (100.0%) |
Commute Time in Tawas City
The most frequently occuring commute durations in Tawas City are 5 to 9 minutes (214 commuters, 31.6%), 10 to 14 minutes (114 commuters, 16.8%), and less than 5 minutes (83 commuters, 12.3%).
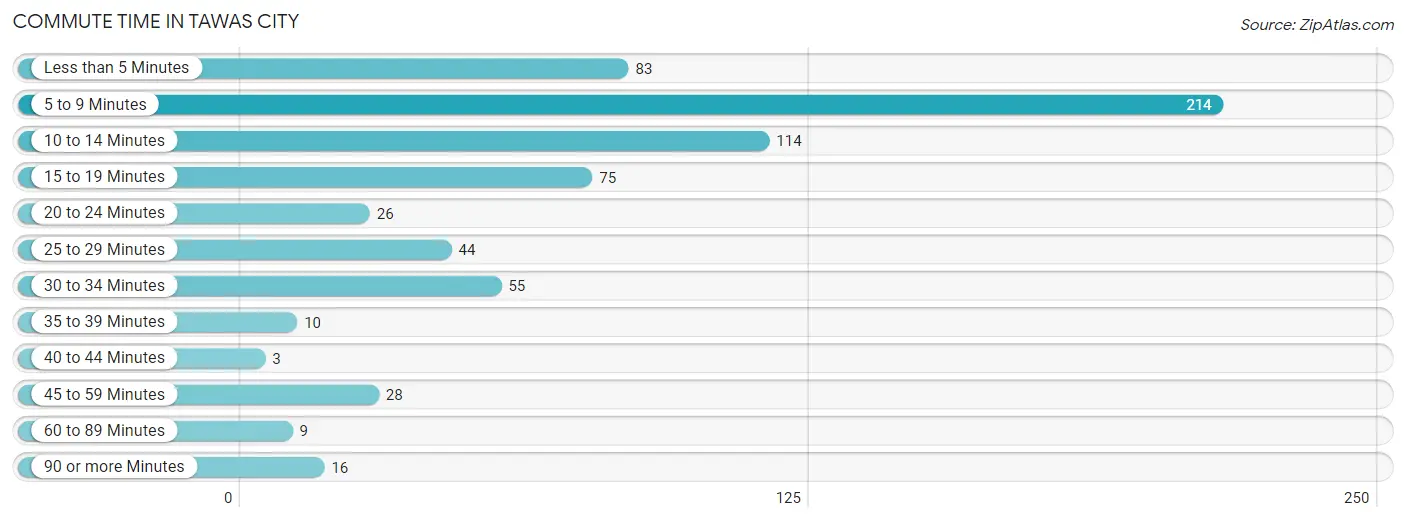
| Commute Time | # Commuters | % Commuters |
| Less than 5 Minutes | 83 | 12.3% |
| 5 to 9 Minutes | 214 | 31.6% |
| 10 to 14 Minutes | 114 | 16.8% |
| 15 to 19 Minutes | 75 | 11.1% |
| 20 to 24 Minutes | 26 | 3.8% |
| 25 to 29 Minutes | 44 | 6.5% |
| 30 to 34 Minutes | 55 | 8.1% |
| 35 to 39 Minutes | 10 | 1.5% |
| 40 to 44 Minutes | 3 | 0.4% |
| 45 to 59 Minutes | 28 | 4.1% |
| 60 to 89 Minutes | 9 | 1.3% |
| 90 or more Minutes | 16 | 2.4% |
Commute Time by Sex in Tawas City
The most common commute times in Tawas City are 5 to 9 minutes (69 commuters, 23.7%) for males and 5 to 9 minutes (145 commuters, 37.6%) for females.
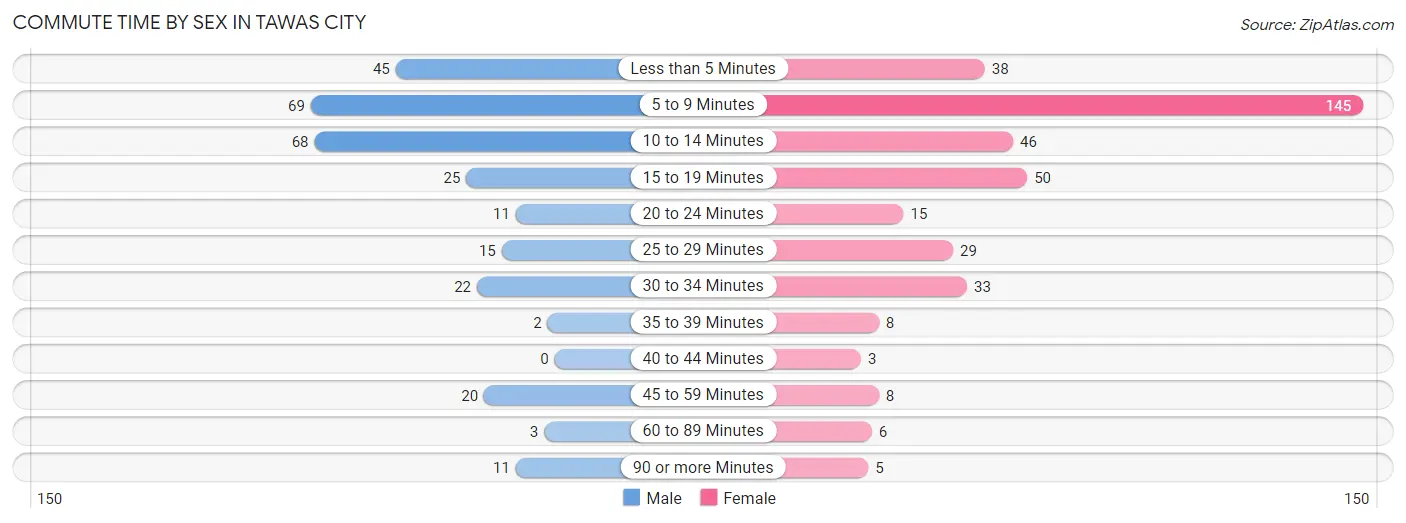
| Commute Time | Male | Female |
| Less than 5 Minutes | 45 (15.5%) | 38 (9.8%) |
| 5 to 9 Minutes | 69 (23.7%) | 145 (37.6%) |
| 10 to 14 Minutes | 68 (23.4%) | 46 (11.9%) |
| 15 to 19 Minutes | 25 (8.6%) | 50 (13.0%) |
| 20 to 24 Minutes | 11 (3.8%) | 15 (3.9%) |
| 25 to 29 Minutes | 15 (5.1%) | 29 (7.5%) |
| 30 to 34 Minutes | 22 (7.6%) | 33 (8.6%) |
| 35 to 39 Minutes | 2 (0.7%) | 8 (2.1%) |
| 40 to 44 Minutes | 0 (0.0%) | 3 (0.8%) |
| 45 to 59 Minutes | 20 (6.9%) | 8 (2.1%) |
| 60 to 89 Minutes | 3 (1.0%) | 6 (1.5%) |
| 90 or more Minutes | 11 (3.8%) | 5 (1.3%) |
Time of Departure to Work by Sex in Tawas City
The most frequent times of departure to work in Tawas City are 12:00 PM to 3:59 PM (46, 15.8%) for males and 8:00 AM to 8:29 AM (62, 16.1%) for females.
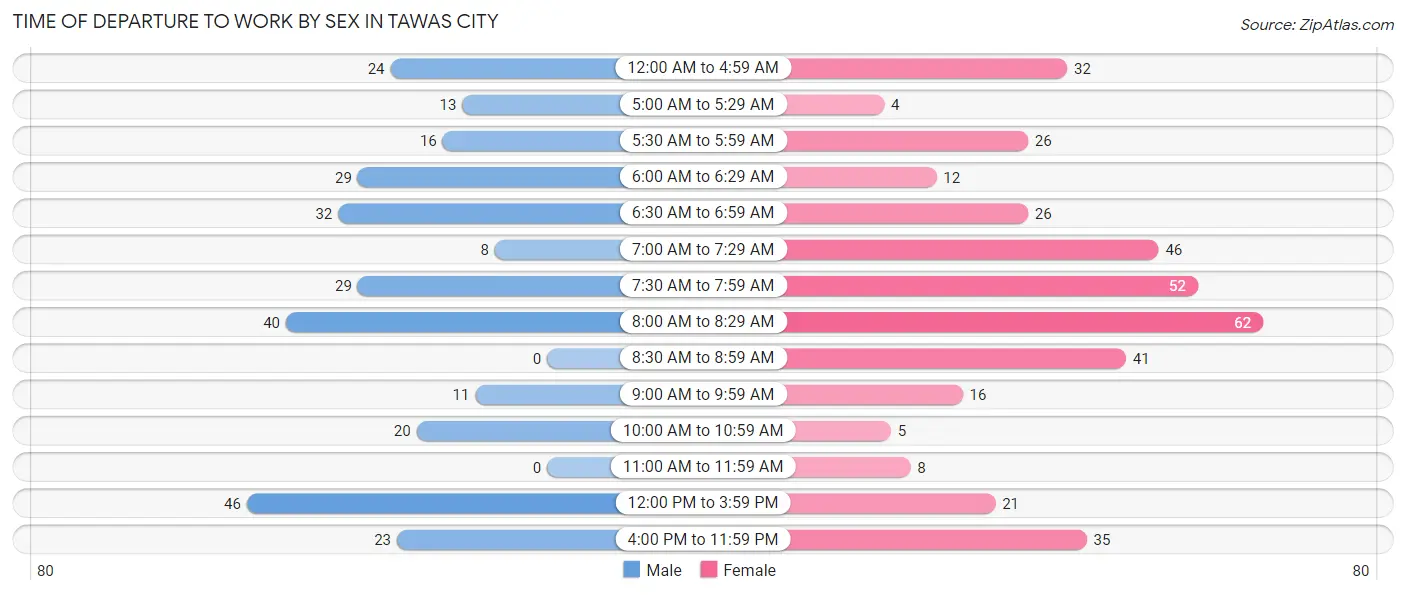
| Time of Departure | Male | Female |
| 12:00 AM to 4:59 AM | 24 (8.3%) | 32 (8.3%) |
| 5:00 AM to 5:29 AM | 13 (4.5%) | 4 (1.0%) |
| 5:30 AM to 5:59 AM | 16 (5.5%) | 26 (6.7%) |
| 6:00 AM to 6:29 AM | 29 (10.0%) | 12 (3.1%) |
| 6:30 AM to 6:59 AM | 32 (11.0%) | 26 (6.7%) |
| 7:00 AM to 7:29 AM | 8 (2.8%) | 46 (11.9%) |
| 7:30 AM to 7:59 AM | 29 (10.0%) | 52 (13.5%) |
| 8:00 AM to 8:29 AM | 40 (13.8%) | 62 (16.1%) |
| 8:30 AM to 8:59 AM | 0 (0.0%) | 41 (10.6%) |
| 9:00 AM to 9:59 AM | 11 (3.8%) | 16 (4.2%) |
| 10:00 AM to 10:59 AM | 20 (6.9%) | 5 (1.3%) |
| 11:00 AM to 11:59 AM | 0 (0.0%) | 8 (2.1%) |
| 12:00 PM to 3:59 PM | 46 (15.8%) | 21 (5.4%) |
| 4:00 PM to 11:59 PM | 23 (7.9%) | 35 (9.1%) |
| Total | 291 (100.0%) | 386 (100.0%) |
Housing Occupancy in Tawas City
Occupancy by Ownership in Tawas City
Of the total 714 dwellings in Tawas City, owner-occupied units account for 528 (74.0%), while renter-occupied units make up 186 (26.1%).
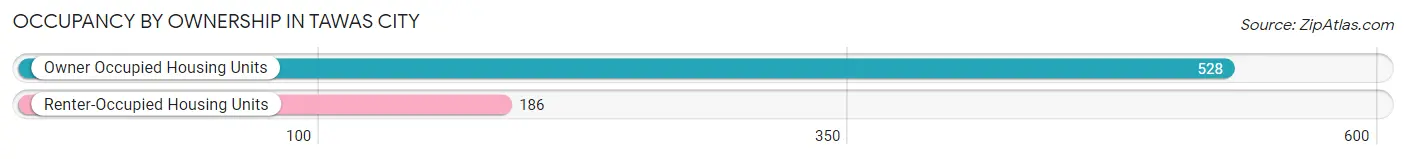
| Occupancy | # Housing Units | % Housing Units |
| Owner Occupied Housing Units | 528 | 74.0% |
| Renter-Occupied Housing Units | 186 | 26.1% |
| Total Occupied Housing Units | 714 | 100.0% |
Occupancy by Household Size in Tawas City
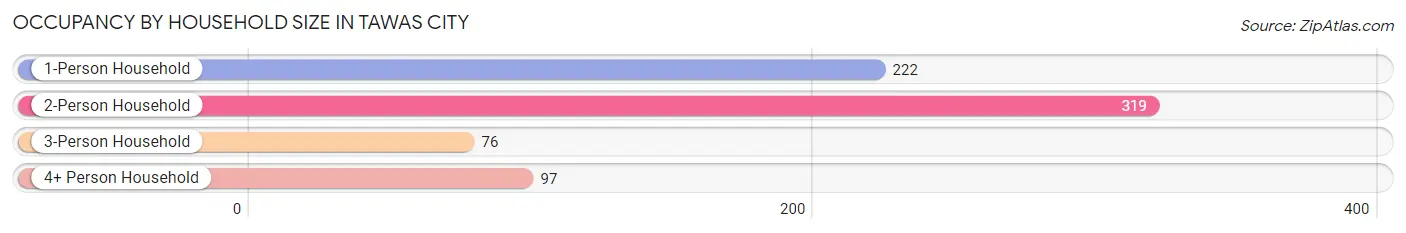
| Household Size | # Housing Units | % Housing Units |
| 1-Person Household | 222 | 31.1% |
| 2-Person Household | 319 | 44.7% |
| 3-Person Household | 76 | 10.6% |
| 4+ Person Household | 97 | 13.6% |
| Total Housing Units | 714 | 100.0% |
Occupancy by Ownership by Household Size in Tawas City
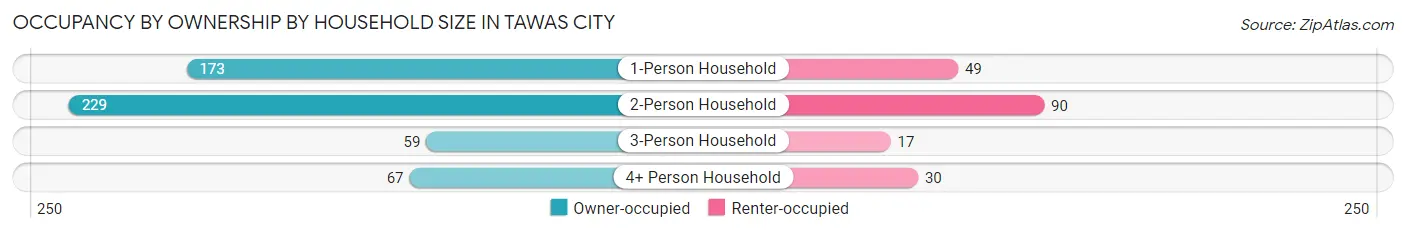
| Household Size | Owner-occupied | Renter-occupied |
| 1-Person Household | 173 (77.9%) | 49 (22.1%) |
| 2-Person Household | 229 (71.8%) | 90 (28.2%) |
| 3-Person Household | 59 (77.6%) | 17 (22.4%) |
| 4+ Person Household | 67 (69.1%) | 30 (30.9%) |
| Total Housing Units | 528 (74.0%) | 186 (26.1%) |
Occupancy by Educational Attainment in Tawas City
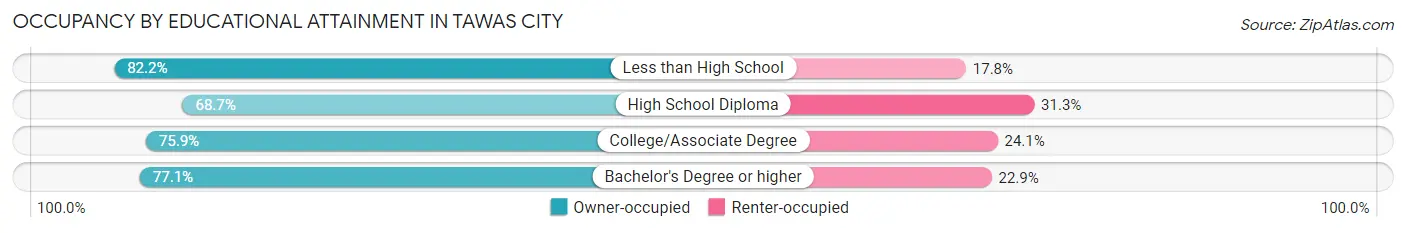
| Household Size | Owner-occupied | Renter-occupied |
| Less than High School | 37 (82.2%) | 8 (17.8%) |
| High School Diploma | 182 (68.7%) | 83 (31.3%) |
| College/Associate Degree | 164 (75.9%) | 52 (24.1%) |
| Bachelor's Degree or higher | 145 (77.1%) | 43 (22.9%) |
Occupancy by Age of Householder in Tawas City
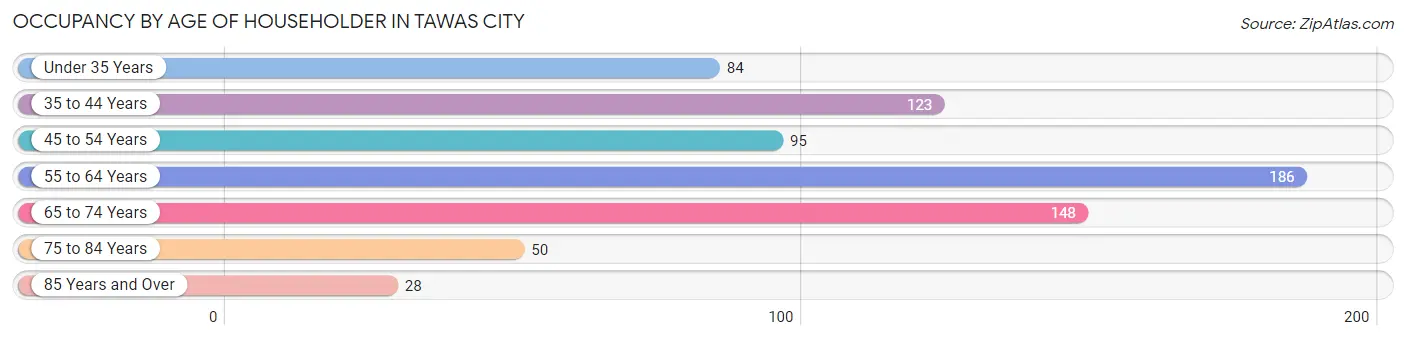
| Age Bracket | # Households | % Households |
| Under 35 Years | 84 | 11.8% |
| 35 to 44 Years | 123 | 17.2% |
| 45 to 54 Years | 95 | 13.3% |
| 55 to 64 Years | 186 | 26.1% |
| 65 to 74 Years | 148 | 20.7% |
| 75 to 84 Years | 50 | 7.0% |
| 85 Years and Over | 28 | 3.9% |
| Total | 714 | 100.0% |
Housing Finances in Tawas City
Median Income by Occupancy in Tawas City
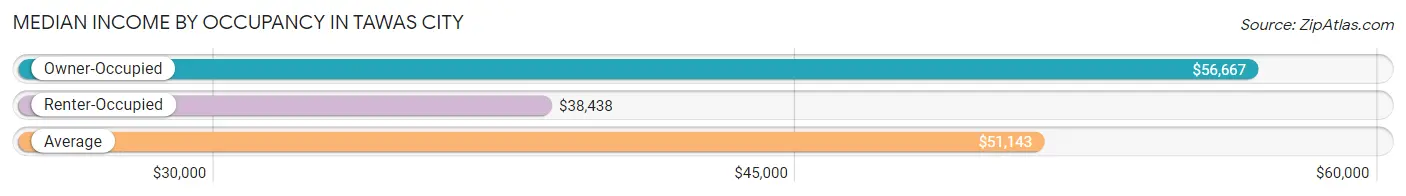
| Occupancy Type | # Households | Median Income |
| Owner-Occupied | 528 (74.0%) | $56,667 |
| Renter-Occupied | 186 (26.1%) | $38,438 |
| Average | 714 (100.0%) | $51,143 |
Occupancy by Householder Income Bracket in Tawas City
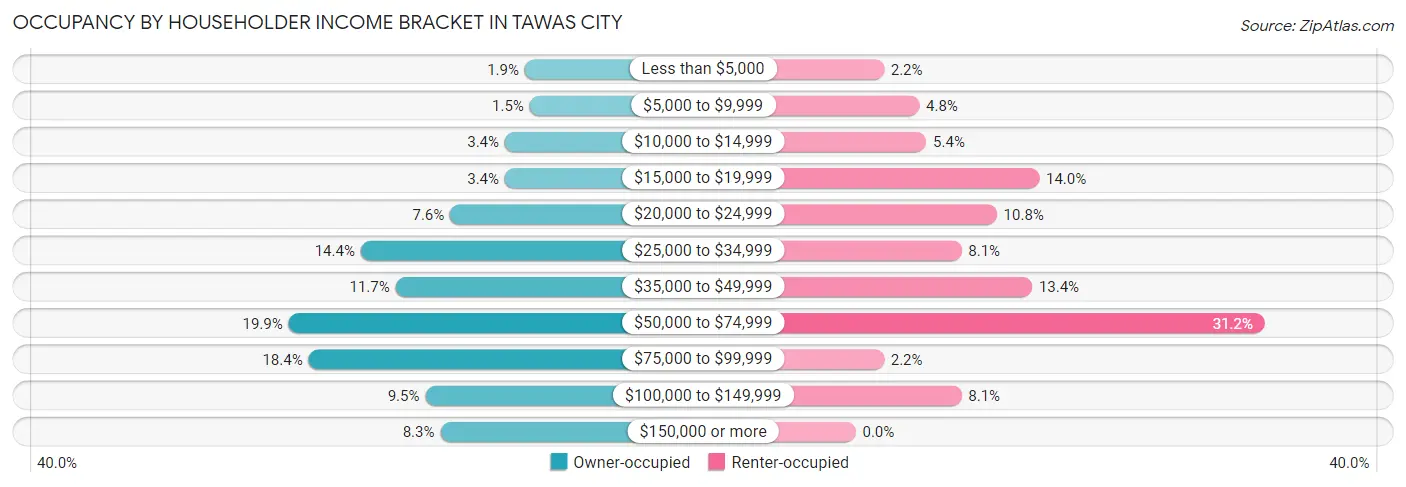
| Income Bracket | Owner-occupied | Renter-occupied |
| Less than $5,000 | 10 (1.9%) | 4 (2.1%) |
| $5,000 to $9,999 | 8 (1.5%) | 9 (4.8%) |
| $10,000 to $14,999 | 18 (3.4%) | 10 (5.4%) |
| $15,000 to $19,999 | 18 (3.4%) | 26 (14.0%) |
| $20,000 to $24,999 | 40 (7.6%) | 20 (10.7%) |
| $25,000 to $34,999 | 76 (14.4%) | 15 (8.1%) |
| $35,000 to $49,999 | 62 (11.7%) | 25 (13.4%) |
| $50,000 to $74,999 | 105 (19.9%) | 58 (31.2%) |
| $75,000 to $99,999 | 97 (18.4%) | 4 (2.1%) |
| $100,000 to $149,999 | 50 (9.5%) | 15 (8.1%) |
| $150,000 or more | 44 (8.3%) | 0 (0.0%) |
| Total | 528 (100.0%) | 186 (100.0%) |
Monthly Housing Cost Tiers in Tawas City
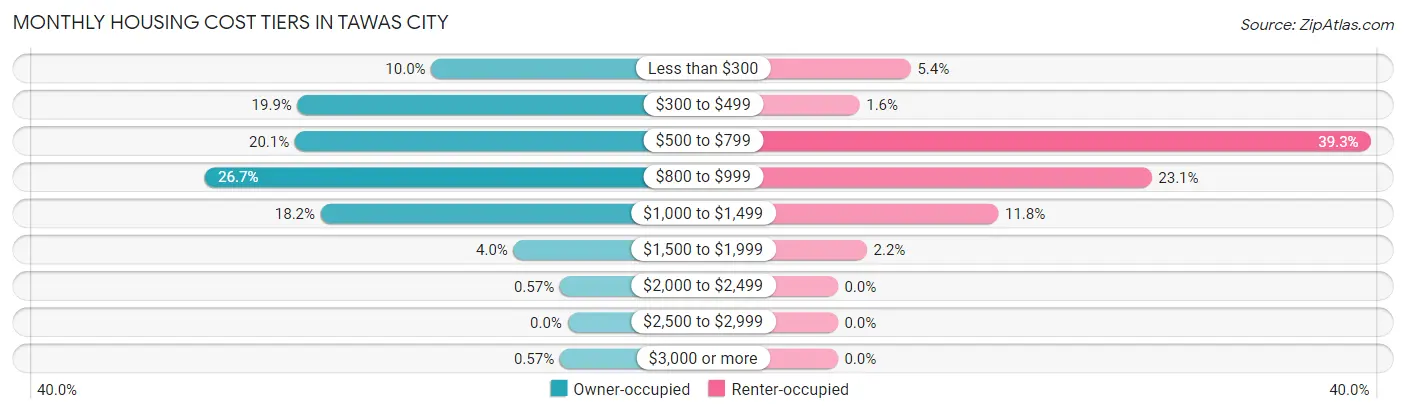
| Monthly Cost | Owner-occupied | Renter-occupied |
| Less than $300 | 53 (10.0%) | 10 (5.4%) |
| $300 to $499 | 105 (19.9%) | 3 (1.6%) |
| $500 to $799 | 106 (20.1%) | 73 (39.3%) |
| $800 to $999 | 141 (26.7%) | 43 (23.1%) |
| $1,000 to $1,499 | 96 (18.2%) | 22 (11.8%) |
| $1,500 to $1,999 | 21 (4.0%) | 4 (2.1%) |
| $2,000 to $2,499 | 3 (0.6%) | 0 (0.0%) |
| $2,500 to $2,999 | 0 (0.0%) | 0 (0.0%) |
| $3,000 or more | 3 (0.6%) | 0 (0.0%) |
| Total | 528 (100.0%) | 186 (100.0%) |
Physical Housing Characteristics in Tawas City
Housing Structures in Tawas City
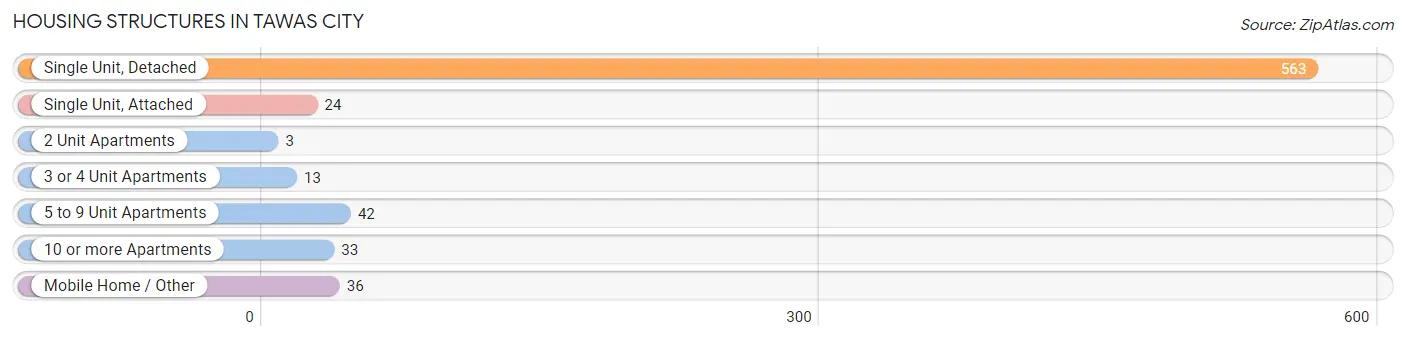
| Structure Type | # Housing Units | % Housing Units |
| Single Unit, Detached | 563 | 78.8% |
| Single Unit, Attached | 24 | 3.4% |
| 2 Unit Apartments | 3 | 0.4% |
| 3 or 4 Unit Apartments | 13 | 1.8% |
| 5 to 9 Unit Apartments | 42 | 5.9% |
| 10 or more Apartments | 33 | 4.6% |
| Mobile Home / Other | 36 | 5.0% |
| Total | 714 | 100.0% |
Housing Structures by Occupancy in Tawas City
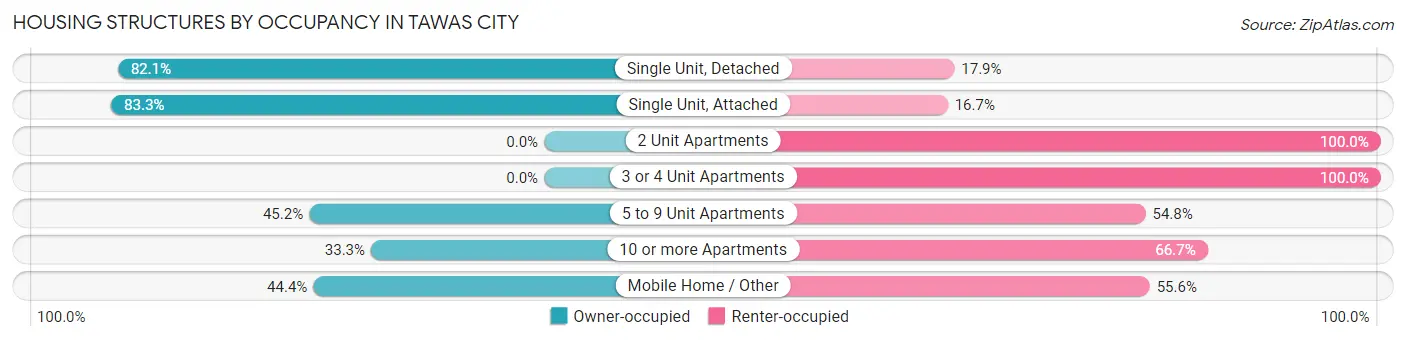
| Structure Type | Owner-occupied | Renter-occupied |
| Single Unit, Detached | 462 (82.1%) | 101 (17.9%) |
| Single Unit, Attached | 20 (83.3%) | 4 (16.7%) |
| 2 Unit Apartments | 0 (0.0%) | 3 (100.0%) |
| 3 or 4 Unit Apartments | 0 (0.0%) | 13 (100.0%) |
| 5 to 9 Unit Apartments | 19 (45.2%) | 23 (54.8%) |
| 10 or more Apartments | 11 (33.3%) | 22 (66.7%) |
| Mobile Home / Other | 16 (44.4%) | 20 (55.6%) |
| Total | 528 (74.0%) | 186 (26.1%) |
Housing Structures by Number of Rooms in Tawas City
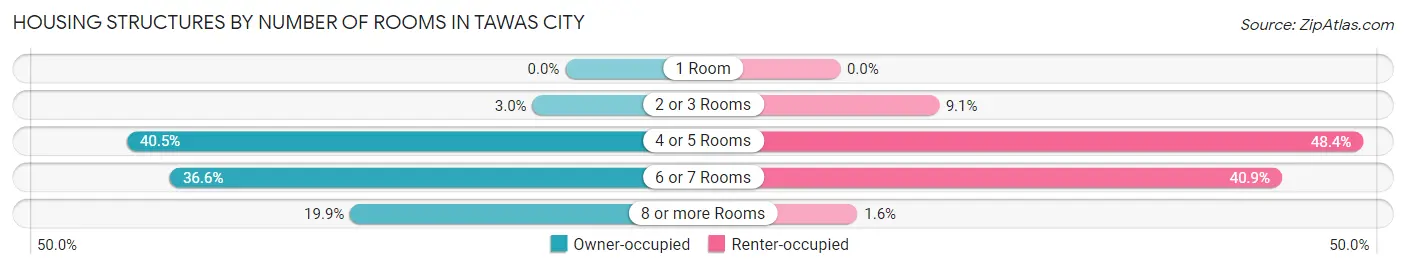
| Number of Rooms | Owner-occupied | Renter-occupied |
| 1 Room | 0 (0.0%) | 0 (0.0%) |
| 2 or 3 Rooms | 16 (3.0%) | 17 (9.1%) |
| 4 or 5 Rooms | 214 (40.5%) | 90 (48.4%) |
| 6 or 7 Rooms | 193 (36.5%) | 76 (40.9%) |
| 8 or more Rooms | 105 (19.9%) | 3 (1.6%) |
| Total | 528 (100.0%) | 186 (100.0%) |
Housing Structure by Heating Type in Tawas City
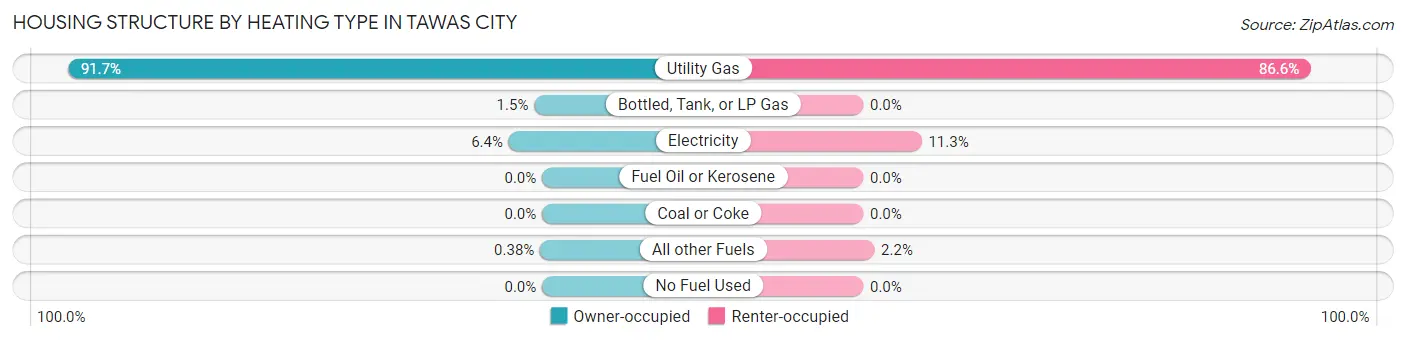
| Heating Type | Owner-occupied | Renter-occupied |
| Utility Gas | 484 (91.7%) | 161 (86.6%) |
| Bottled, Tank, or LP Gas | 8 (1.5%) | 0 (0.0%) |
| Electricity | 34 (6.4%) | 21 (11.3%) |
| Fuel Oil or Kerosene | 0 (0.0%) | 0 (0.0%) |
| Coal or Coke | 0 (0.0%) | 0 (0.0%) |
| All other Fuels | 2 (0.4%) | 4 (2.1%) |
| No Fuel Used | 0 (0.0%) | 0 (0.0%) |
| Total | 528 (100.0%) | 186 (100.0%) |
Household Vehicle Usage in Tawas City
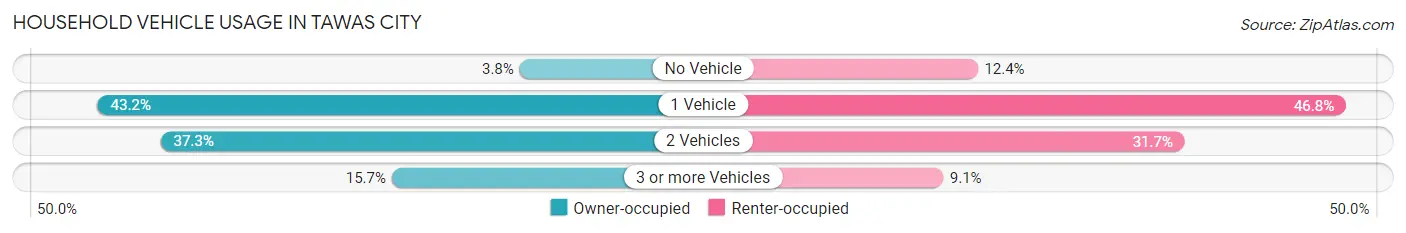
| Vehicles per Household | Owner-occupied | Renter-occupied |
| No Vehicle | 20 (3.8%) | 23 (12.4%) |
| 1 Vehicle | 228 (43.2%) | 87 (46.8%) |
| 2 Vehicles | 197 (37.3%) | 59 (31.7%) |
| 3 or more Vehicles | 83 (15.7%) | 17 (9.1%) |
| Total | 528 (100.0%) | 186 (100.0%) |
Real Estate & Mortgages in Tawas City
Real Estate and Mortgage Overview in Tawas City
| Characteristic | Without Mortgage | With Mortgage |
| Housing Units | 236 | 292 |
| Median Property Value | $126,800 | $106,900 |
| Median Household Income | $40,938 | $31 |
| Monthly Housing Costs | $412 | $3 |
| Real Estate Taxes | $1,471 | $22 |
Property Value by Mortgage Status in Tawas City
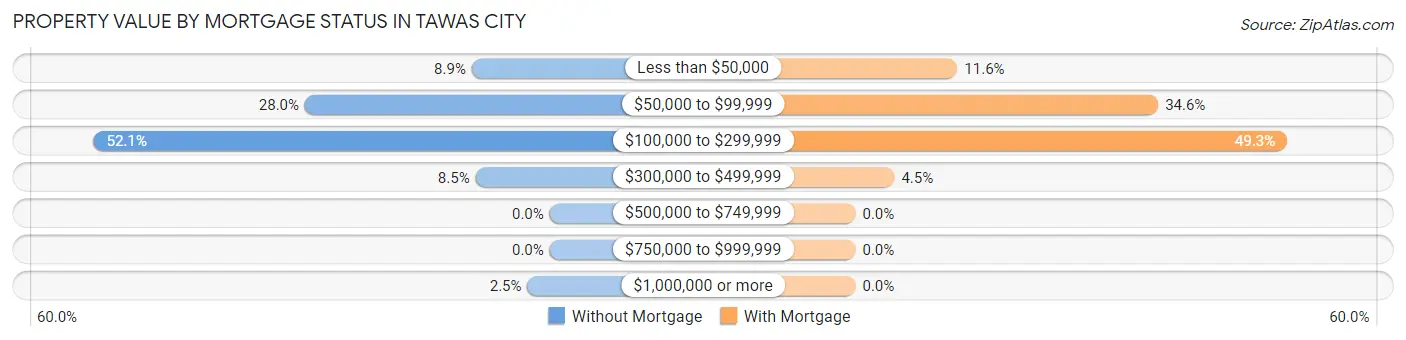
| Property Value | Without Mortgage | With Mortgage |
| Less than $50,000 | 21 (8.9%) | 34 (11.6%) |
| $50,000 to $99,999 | 66 (28.0%) | 101 (34.6%) |
| $100,000 to $299,999 | 123 (52.1%) | 144 (49.3%) |
| $300,000 to $499,999 | 20 (8.5%) | 13 (4.4%) |
| $500,000 to $749,999 | 0 (0.0%) | 0 (0.0%) |
| $750,000 to $999,999 | 0 (0.0%) | 0 (0.0%) |
| $1,000,000 or more | 6 (2.5%) | 0 (0.0%) |
| Total | 236 (100.0%) | 292 (100.0%) |
Household Income by Mortgage Status in Tawas City
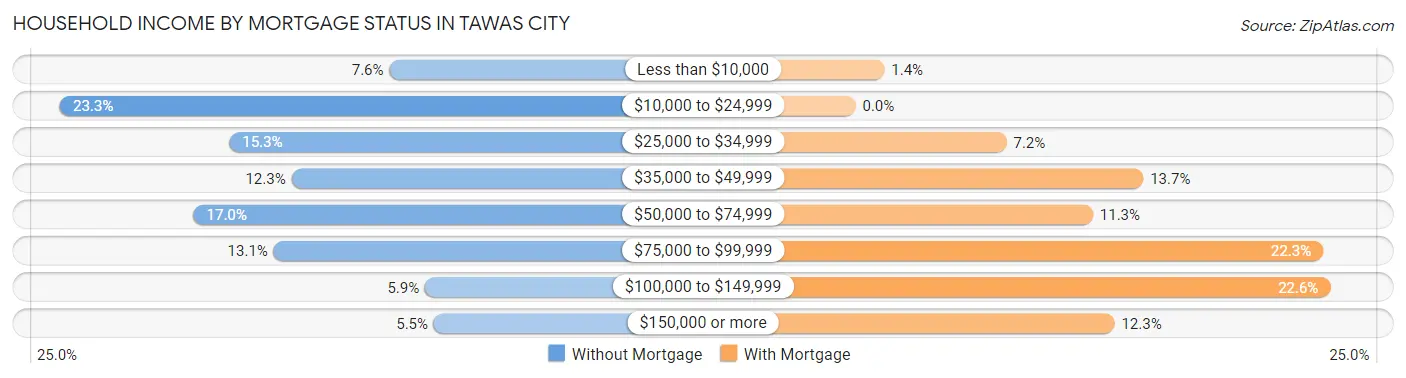
| Household Income | Without Mortgage | With Mortgage |
| Less than $10,000 | 18 (7.6%) | 4 (1.4%) |
| $10,000 to $24,999 | 55 (23.3%) | 0 (0.0%) |
| $25,000 to $34,999 | 36 (15.2%) | 21 (7.2%) |
| $35,000 to $49,999 | 29 (12.3%) | 40 (13.7%) |
| $50,000 to $74,999 | 40 (17.0%) | 33 (11.3%) |
| $75,000 to $99,999 | 31 (13.1%) | 65 (22.3%) |
| $100,000 to $149,999 | 14 (5.9%) | 66 (22.6%) |
| $150,000 or more | 13 (5.5%) | 36 (12.3%) |
| Total | 236 (100.0%) | 292 (100.0%) |
Property Value to Household Income Ratio in Tawas City
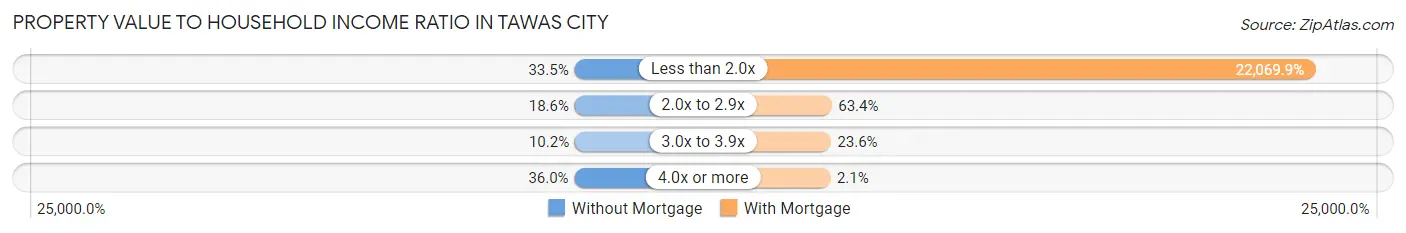
| Value-to-Income Ratio | Without Mortgage | With Mortgage |
| Less than 2.0x | 79 (33.5%) | 64,444 (22,069.9%) |
| 2.0x to 2.9x | 44 (18.6%) | 185 (63.4%) |
| 3.0x to 3.9x | 24 (10.2%) | 69 (23.6%) |
| 4.0x or more | 85 (36.0%) | 6 (2.1%) |
| Total | 236 (100.0%) | 292 (100.0%) |
Real Estate Taxes by Mortgage Status in Tawas City
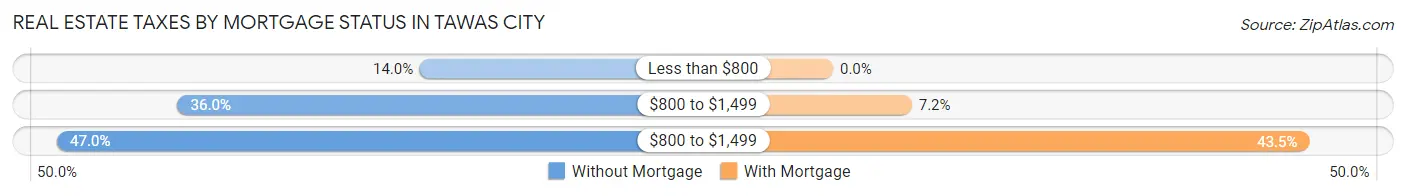
| Property Taxes | Without Mortgage | With Mortgage |
| Less than $800 | 33 (14.0%) | 0 (0.0%) |
| $800 to $1,499 | 85 (36.0%) | 21 (7.2%) |
| $800 to $1,499 | 111 (47.0%) | 127 (43.5%) |
| Total | 236 (100.0%) | 292 (100.0%) |
Health & Disability in Tawas City
Health Insurance Coverage by Age in Tawas City
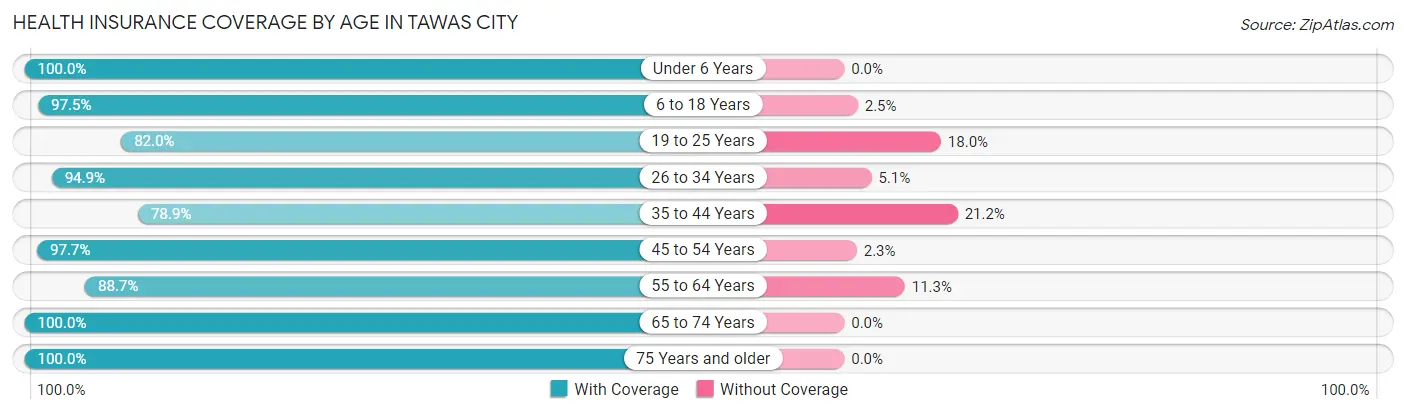
| Age Bracket | With Coverage | Without Coverage |
| Under 6 Years | 85 (100.0%) | 0 (0.0%) |
| 6 to 18 Years | 194 (97.5%) | 5 (2.5%) |
| 19 to 25 Years | 91 (82.0%) | 20 (18.0%) |
| 26 to 34 Years | 150 (94.9%) | 8 (5.1%) |
| 35 to 44 Years | 164 (78.8%) | 44 (21.1%) |
| 45 to 54 Years | 168 (97.7%) | 4 (2.3%) |
| 55 to 64 Years | 275 (88.7%) | 35 (11.3%) |
| 65 to 74 Years | 229 (100.0%) | 0 (0.0%) |
| 75 Years and older | 133 (100.0%) | 0 (0.0%) |
| Total | 1,489 (92.8%) | 116 (7.2%) |
Health Insurance Coverage by Citizenship Status in Tawas City
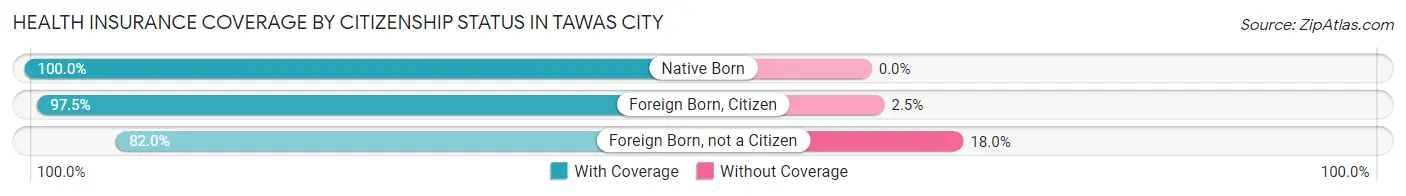
| Citizenship Status | With Coverage | Without Coverage |
| Native Born | 85 (100.0%) | 0 (0.0%) |
| Foreign Born, Citizen | 194 (97.5%) | 5 (2.5%) |
| Foreign Born, not a Citizen | 91 (82.0%) | 20 (18.0%) |
Health Insurance Coverage by Household Income in Tawas City
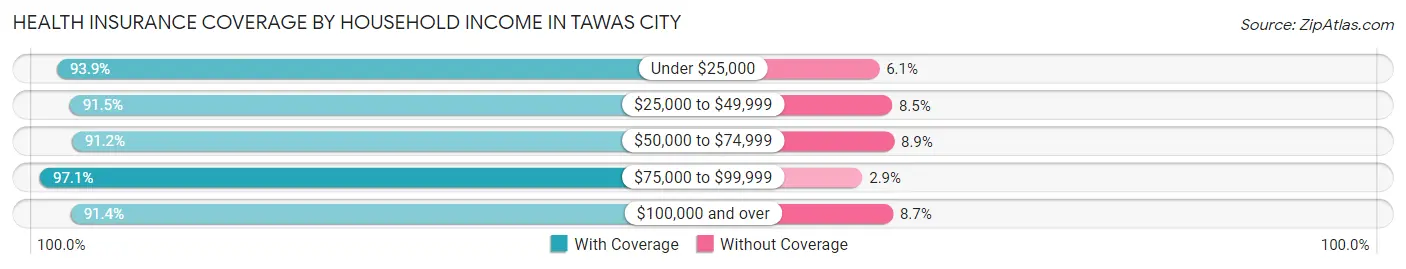
| Household Income | With Coverage | Without Coverage |
| Under $25,000 | 232 (93.9%) | 15 (6.1%) |
| $25,000 to $49,999 | 368 (91.5%) | 34 (8.5%) |
| $50,000 to $74,999 | 371 (91.1%) | 36 (8.8%) |
| $75,000 to $99,999 | 268 (97.1%) | 8 (2.9%) |
| $100,000 and over | 243 (91.3%) | 23 (8.6%) |
Public vs Private Health Insurance Coverage by Age in Tawas City
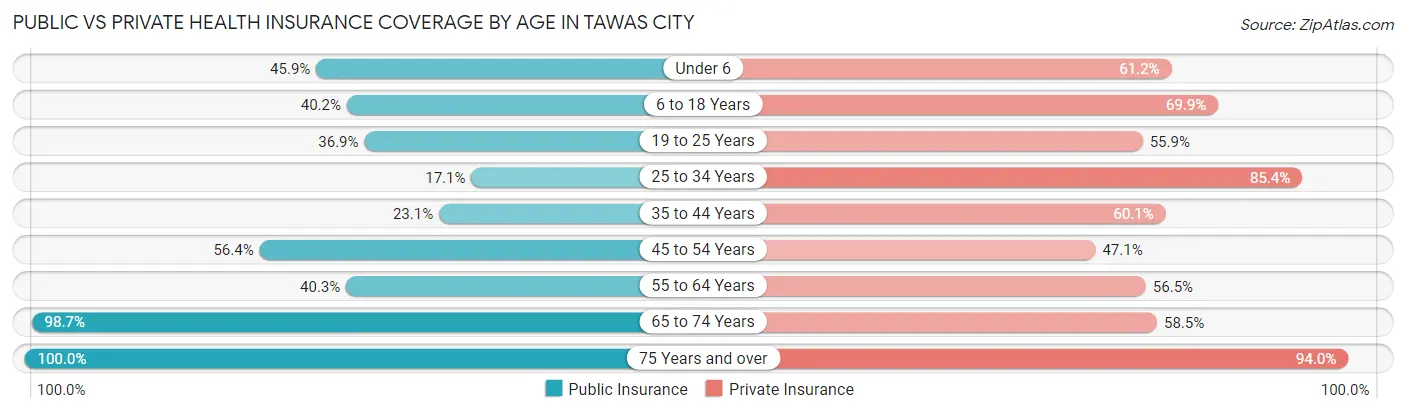
| Age Bracket | Public Insurance | Private Insurance |
| Under 6 | 39 (45.9%) | 52 (61.2%) |
| 6 to 18 Years | 80 (40.2%) | 139 (69.9%) |
| 19 to 25 Years | 41 (36.9%) | 62 (55.9%) |
| 25 to 34 Years | 27 (17.1%) | 135 (85.4%) |
| 35 to 44 Years | 48 (23.1%) | 125 (60.1%) |
| 45 to 54 Years | 97 (56.4%) | 81 (47.1%) |
| 55 to 64 Years | 125 (40.3%) | 175 (56.5%) |
| 65 to 74 Years | 226 (98.7%) | 134 (58.5%) |
| 75 Years and over | 133 (100.0%) | 125 (94.0%) |
| Total | 816 (50.8%) | 1,028 (64.0%) |
Disability Status by Sex by Age in Tawas City
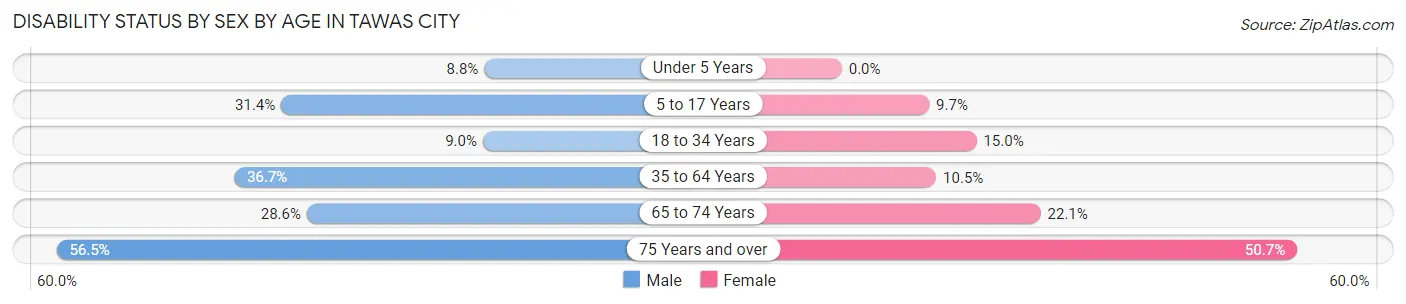
| Age Bracket | Male | Female |
| Under 5 Years | 3 (8.8%) | 0 (0.0%) |
| 5 to 17 Years | 33 (31.4%) | 11 (9.7%) |
| 18 to 34 Years | 14 (9.0%) | 18 (15.0%) |
| 35 to 64 Years | 117 (36.7%) | 39 (10.5%) |
| 65 to 74 Years | 28 (28.6%) | 29 (22.1%) |
| 75 Years and over | 35 (56.5%) | 36 (50.7%) |
Disability Class by Sex by Age in Tawas City
Disability Class: Hearing Difficulty
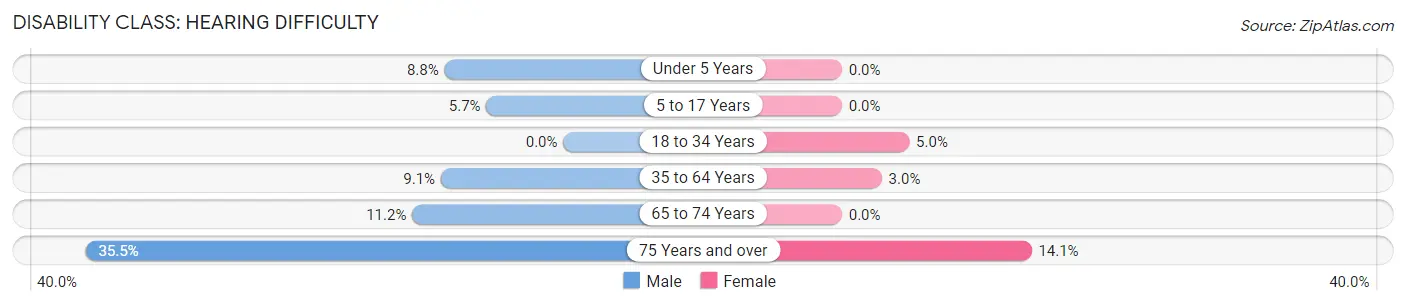
| Age Bracket | Male | Female |
| Under 5 Years | 3 (8.8%) | 0 (0.0%) |
| 5 to 17 Years | 6 (5.7%) | 0 (0.0%) |
| 18 to 34 Years | 0 (0.0%) | 6 (5.0%) |
| 35 to 64 Years | 29 (9.1%) | 11 (3.0%) |
| 65 to 74 Years | 11 (11.2%) | 0 (0.0%) |
| 75 Years and over | 22 (35.5%) | 10 (14.1%) |
Disability Class: Vision Difficulty
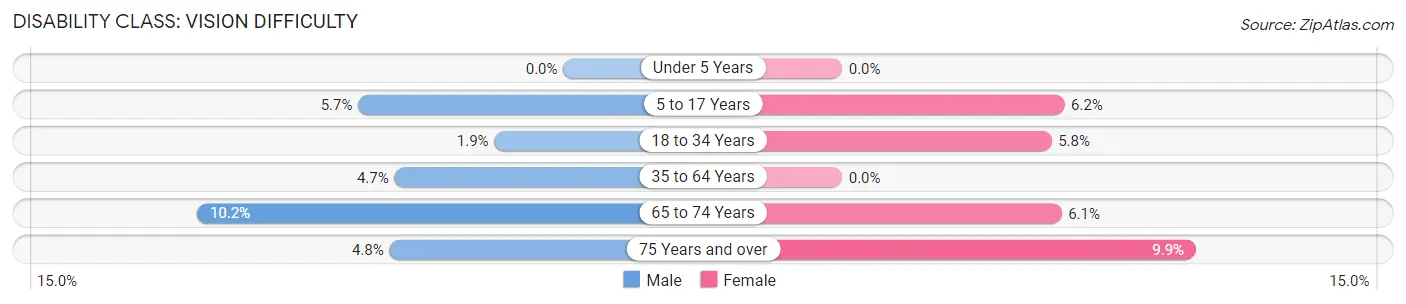
| Age Bracket | Male | Female |
| Under 5 Years | 0 (0.0%) | 0 (0.0%) |
| 5 to 17 Years | 6 (5.7%) | 7 (6.2%) |
| 18 to 34 Years | 3 (1.9%) | 7 (5.8%) |
| 35 to 64 Years | 15 (4.7%) | 0 (0.0%) |
| 65 to 74 Years | 10 (10.2%) | 8 (6.1%) |
| 75 Years and over | 3 (4.8%) | 7 (9.9%) |
Disability Class: Cognitive Difficulty
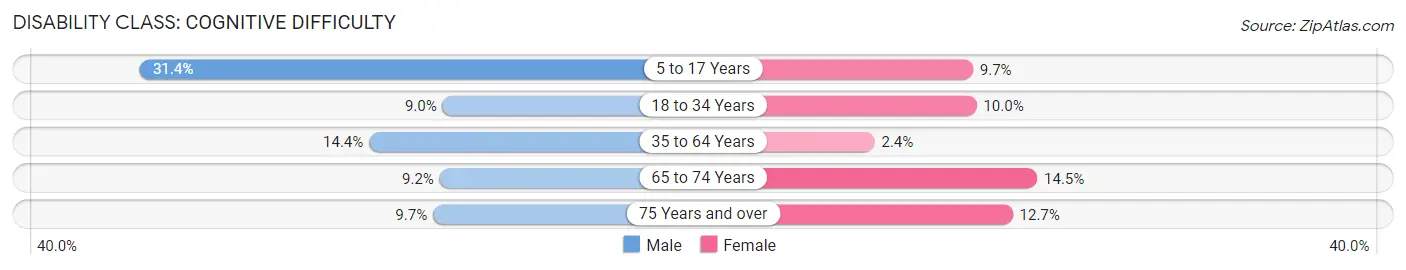
| Age Bracket | Male | Female |
| 5 to 17 Years | 33 (31.4%) | 11 (9.7%) |
| 18 to 34 Years | 14 (9.0%) | 12 (10.0%) |
| 35 to 64 Years | 46 (14.4%) | 9 (2.4%) |
| 65 to 74 Years | 9 (9.2%) | 19 (14.5%) |
| 75 Years and over | 6 (9.7%) | 9 (12.7%) |
Disability Class: Ambulatory Difficulty
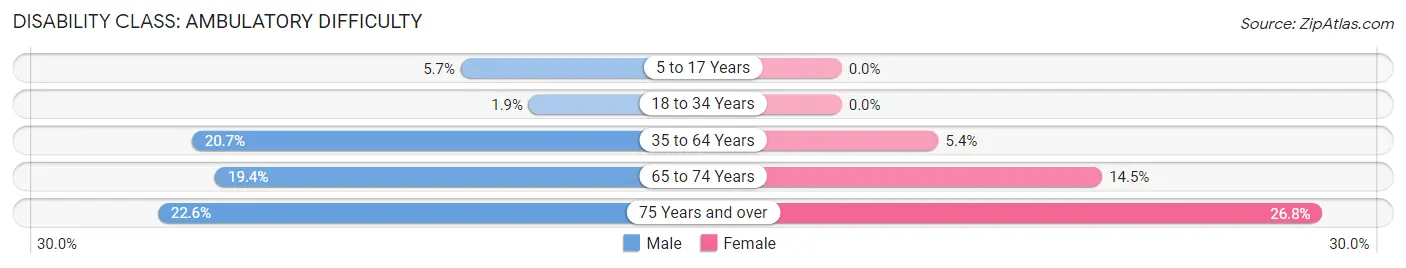
| Age Bracket | Male | Female |
| 5 to 17 Years | 6 (5.7%) | 0 (0.0%) |
| 18 to 34 Years | 3 (1.9%) | 0 (0.0%) |
| 35 to 64 Years | 66 (20.7%) | 20 (5.4%) |
| 65 to 74 Years | 19 (19.4%) | 19 (14.5%) |
| 75 Years and over | 14 (22.6%) | 19 (26.8%) |
Disability Class: Self-Care Difficulty
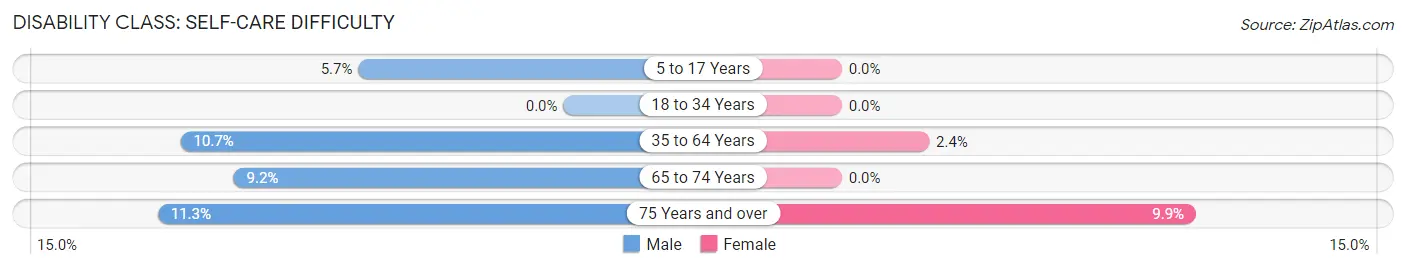
| Age Bracket | Male | Female |
| 5 to 17 Years | 6 (5.7%) | 0 (0.0%) |
| 18 to 34 Years | 0 (0.0%) | 0 (0.0%) |
| 35 to 64 Years | 34 (10.7%) | 9 (2.4%) |
| 65 to 74 Years | 9 (9.2%) | 0 (0.0%) |
| 75 Years and over | 7 (11.3%) | 7 (9.9%) |
Technology Access in Tawas City
Computing Device Access in Tawas City
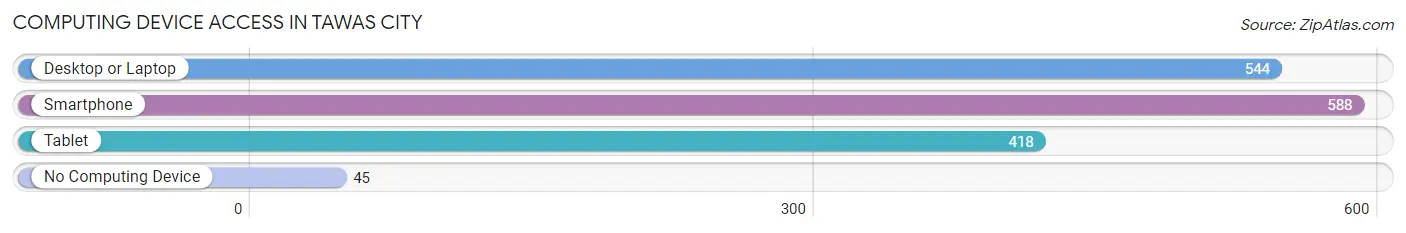
| Device Type | # Households | % Households |
| Desktop or Laptop | 544 | 76.2% |
| Smartphone | 588 | 82.4% |
| Tablet | 418 | 58.5% |
| No Computing Device | 45 | 6.3% |
| Total | 714 | 100.0% |
Internet Access in Tawas City
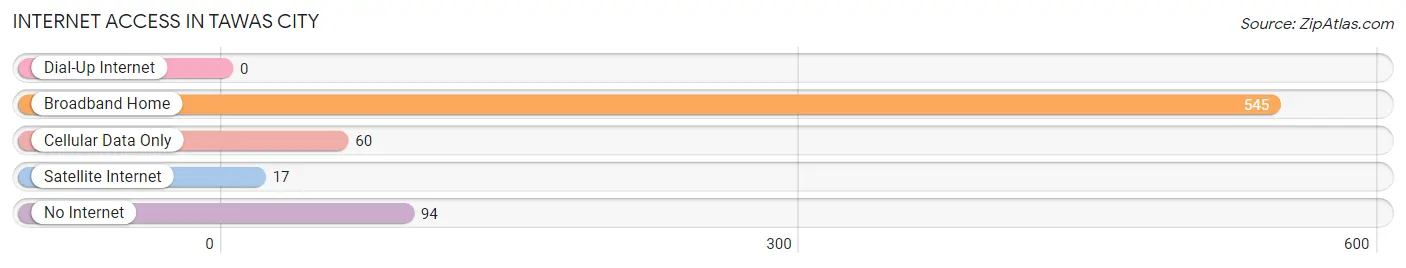
| Internet Type | # Households | % Households |
| Dial-Up Internet | 0 | 0.0% |
| Broadband Home | 545 | 76.3% |
| Cellular Data Only | 60 | 8.4% |
| Satellite Internet | 17 | 2.4% |
| No Internet | 94 | 13.2% |
| Total | 714 | 100.0% |
Tawas City Summary
Tawas City is a city located in Iosco County in the U.S. state of Michigan. It is situated on the shore of Lake Huron, at the mouth of the Tawas River. The city is the county seat of Iosco County and is located about 30 miles northeast of Bay City and about 30 miles southwest of Alpena. The population of Tawas City was 2,827 at the 2010 census.
History
The area around Tawas City was first inhabited by the Chippewa Indians. The first white settlers arrived in the area in the early 1800s. The first permanent settlement was established in 1837 by William T. Trowbridge, who named the settlement Tawas City. The settlement was incorporated as a village in 1859 and as a city in 1871.
Tawas City was an important port on Lake Huron during the 19th century. It was a major shipping point for lumber and other goods. The city was also a popular tourist destination, with many visitors coming to enjoy the beaches and other attractions.
Geography
Tawas City is located at the mouth of the Tawas River, on the shore of Lake Huron. The city has a total area of 4.2 square miles, of which 3.9 square miles is land and 0.3 square miles is water. The city is located about 30 miles northeast of Bay City and about 30 miles southwest of Alpena.
Economy
Tawas City’s economy is largely based on tourism and manufacturing. The city is home to several manufacturing companies, including a paper mill, a plastics plant, and a metal fabrication plant. Tourism is also an important part of the local economy, with many visitors coming to enjoy the beaches and other attractions.
Demographics
As of the 2010 census, there were 2,827 people, 1,179 households, and 745 families residing in Tawas City. The population density was 725.2 people per square mile. The racial makeup of the city was 94.2% White, 0.7% African American, 0.7% Native American, 0.7% Asian, 0.1% Pacific Islander, 1.3% from other races, and 2.3% from two or more races. Hispanic or Latino of any race were 3.2% of the population.
The median income for a household in Tawas City was $35,938, and the median income for a family was $45,938. The per capita income for the city was $19,938. About 11.2% of families and 14.2% of the population were below the poverty line, including 19.2% of those under age 18 and 8.2% of those age 65 or over.
Tawas City is a small city with a rich history and a vibrant economy. It is a popular tourist destination, with many visitors coming to enjoy the beaches and other attractions. The city is also home to several manufacturing companies, making it an important part of the local economy. The population of Tawas City is diverse, with a mix of different racial and ethnic backgrounds.
Common Questions
What is Per Capita Income in Tawas City?
Per Capita income in Tawas City is $28,529.
What is the Median Family Income in Tawas City?
Median Family Income in Tawas City is $60,114.
What is the Median Household income in Tawas City?
Median Household Income in Tawas City is $51,143.
What is Income or Wage Gap in Tawas City?
Income or Wage Gap in Tawas City is 21.3%.
Women in Tawas City earn 78.7 cents for every dollar earned by a man.
What is Family Income Deficit in Tawas City?
Family Income Deficit in Tawas City is $4,748.
Families that are below poverty line in Tawas City earn $4,748 less on average than the poverty threshold level.
What is Inequality or Gini Index in Tawas City?
Inequality or Gini Index in Tawas City is 0.40.
What is the Total Population of Tawas City?
Total Population of Tawas City is 1,749.
What is the Total Male Population of Tawas City?
Total Male Population of Tawas City is 836.
What is the Total Female Population of Tawas City?
Total Female Population of Tawas City is 913.
What is the Ratio of Males per 100 Females in Tawas City?
There are 91.57 Males per 100 Females in Tawas City.
What is the Ratio of Females per 100 Males in Tawas City?
There are 109.21 Females per 100 Males in Tawas City.
What is the Median Population Age in Tawas City?
Median Population Age in Tawas City is 49.1 Years.
What is the Average Family Size in Tawas City
Average Family Size in Tawas City is 2.7 People.
What is the Average Household Size in Tawas City
Average Household Size in Tawas City is 2.2 People.
How Large is the Labor Force in Tawas City?
There are 790 People in the Labor Forcein in Tawas City.
What is the Percentage of People in the Labor Force in Tawas City?
52.6% of People are in the Labor Force in Tawas City.
What is the Unemployment Rate in Tawas City?
Unemployment Rate in Tawas City is 9.6%.