Stevensville, MI Map & Demographics
Stevensville Map
Stevensville Overview
$45,792
PER CAPITA INCOME
$87,500
AVG FAMILY INCOME
$71,823
AVG HOUSEHOLD INCOME
41.4%
WAGE / INCOME GAP [ % ]
58.6¢/ $1
WAGE / INCOME GAP [ $ ]
$5,338
FAMILY INCOME DEFICIT
0.46
INEQUALITY / GINI INDEX
1,126
TOTAL POPULATION
537
MALE POPULATION
589
FEMALE POPULATION
91.17
MALES / 100 FEMALES
109.68
FEMALES / 100 MALES
50.5
MEDIAN AGE
2.8
AVG FAMILY SIZE
2.1
AVG HOUSEHOLD SIZE
628
LABOR FORCE [ PEOPLE ]
63.7%
PERCENT IN LABOR FORCE
3.8%
UNEMPLOYMENT RATE
Stevensville Zip Codes
Stevensville Area Codes
Income in Stevensville
Income Overview in Stevensville
Per Capita Income in Stevensville is $45,792, while median incomes of families and households are $87,500 and $71,823 respectively.
| Characteristic | Number | Measure |
| Per Capita Income | 1,126 | $45,792 |
| Median Family Income | 300 | $87,500 |
| Mean Family Income | 300 | $123,302 |
| Median Household Income | 537 | $71,823 |
| Mean Household Income | 537 | $95,485 |
| Income Deficit | 300 | $5,338 |
| Wage / Income Gap (%) | 1,126 | 41.44% |
| Wage / Income Gap ($) | 1,126 | 58.56¢ per $1 |
| Gini / Inequality Index | 1,126 | 0.46 |
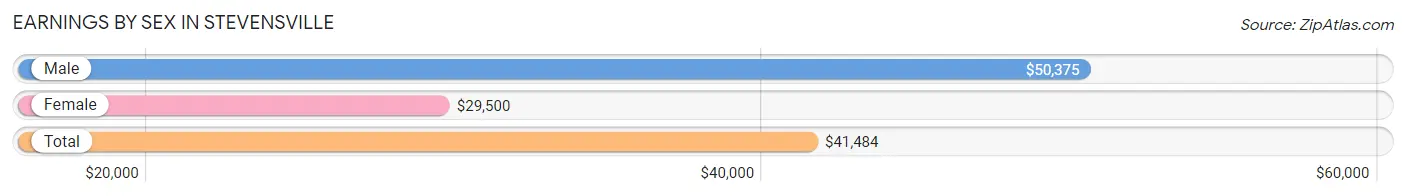
Earnings by Sex in Stevensville
Average Earnings in Stevensville are $41,484, $50,375 for men and $29,500 for women, a difference of 41.4%.
| Sex | Number | Average Earnings |
| Male | 369 (53.7%) | $50,375 |
| Female | 318 (46.3%) | $29,500 |
| Total | 687 (100.0%) | $41,484 |
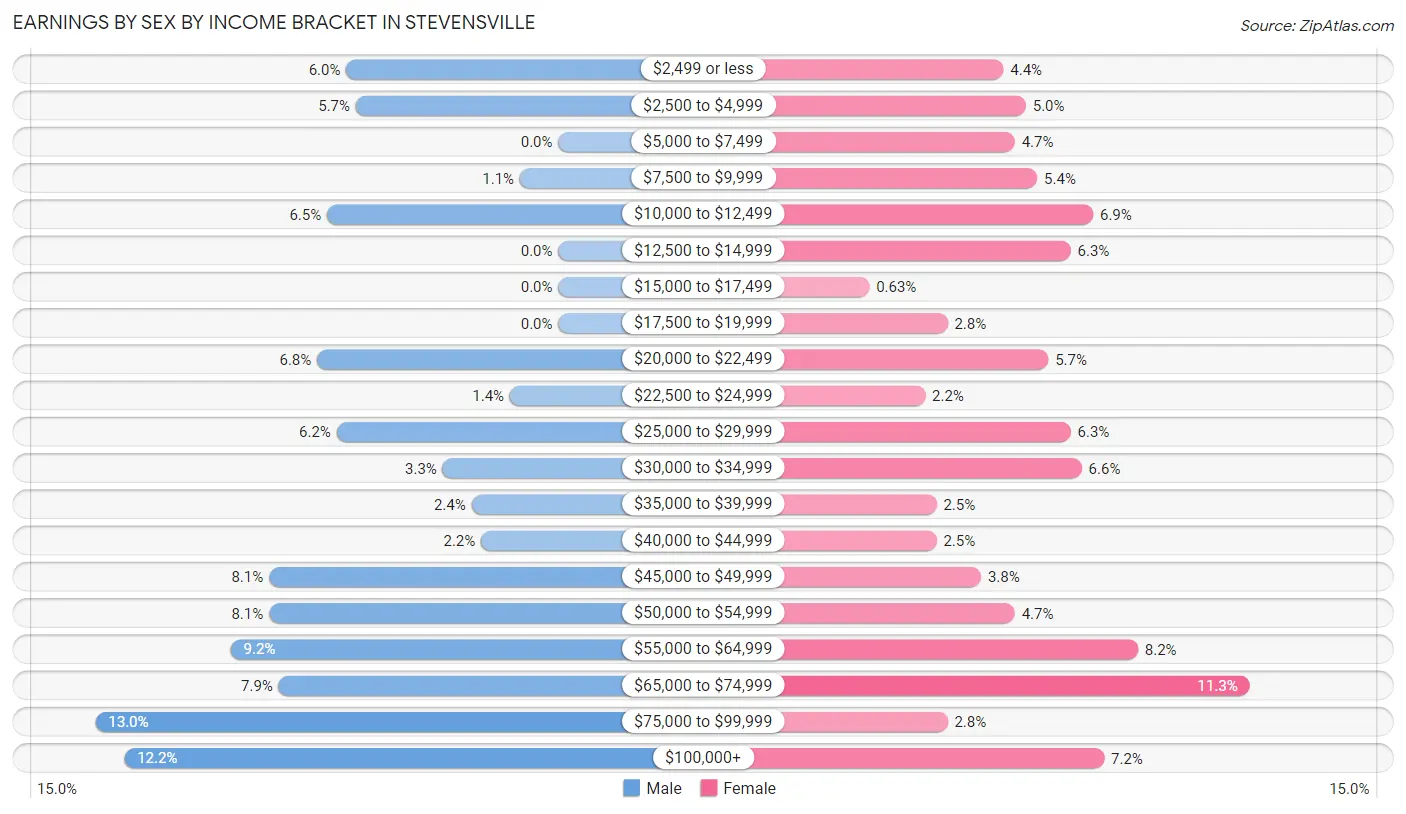
Earnings by Sex by Income Bracket in Stevensville
The most common earnings brackets in Stevensville are $75,000 to $99,999 for men (48 | 13.0%) and $65,000 to $74,999 for women (36 | 11.3%).
| Income | Male | Female |
| $2,499 or less | 22 (6.0%) | 14 (4.4%) |
| $2,500 to $4,999 | 21 (5.7%) | 16 (5.0%) |
| $5,000 to $7,499 | 0 (0.0%) | 15 (4.7%) |
| $7,500 to $9,999 | 4 (1.1%) | 17 (5.3%) |
| $10,000 to $12,499 | 24 (6.5%) | 22 (6.9%) |
| $12,500 to $14,999 | 0 (0.0%) | 20 (6.3%) |
| $15,000 to $17,499 | 0 (0.0%) | 2 (0.6%) |
| $17,500 to $19,999 | 0 (0.0%) | 9 (2.8%) |
| $20,000 to $22,499 | 25 (6.8%) | 18 (5.7%) |
| $22,500 to $24,999 | 5 (1.4%) | 7 (2.2%) |
| $25,000 to $29,999 | 23 (6.2%) | 20 (6.3%) |
| $30,000 to $34,999 | 12 (3.3%) | 21 (6.6%) |
| $35,000 to $39,999 | 9 (2.4%) | 8 (2.5%) |
| $40,000 to $44,999 | 8 (2.2%) | 8 (2.5%) |
| $45,000 to $49,999 | 30 (8.1%) | 12 (3.8%) |
| $50,000 to $54,999 | 30 (8.1%) | 15 (4.7%) |
| $55,000 to $64,999 | 34 (9.2%) | 26 (8.2%) |
| $65,000 to $74,999 | 29 (7.9%) | 36 (11.3%) |
| $75,000 to $99,999 | 48 (13.0%) | 9 (2.8%) |
| $100,000+ | 45 (12.2%) | 23 (7.2%) |
| Total | 369 (100.0%) | 318 (100.0%) |
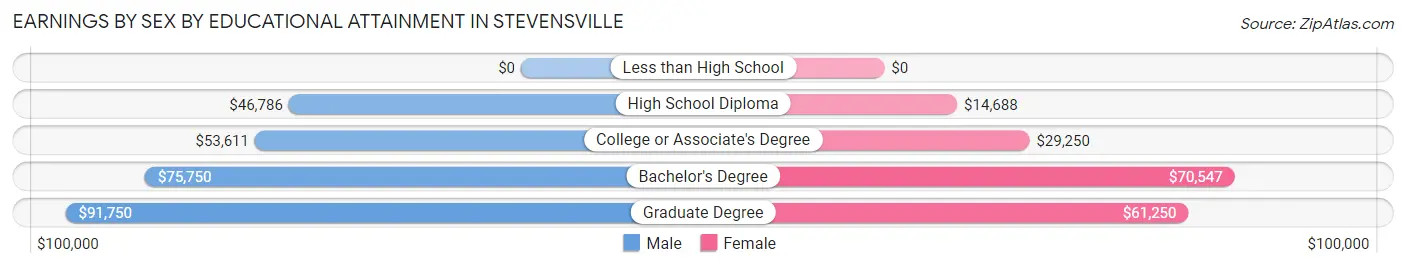
Earnings by Sex by Educational Attainment in Stevensville
Average earnings in Stevensville are $54,625 for men and $40,469 for women, a difference of 25.9%. Men with an educational attainment of graduate degree enjoy the highest average annual earnings of $91,750, while those with high school diploma education earn the least with $46,786. Women with an educational attainment of bachelor's degree earn the most with the average annual earnings of $70,547, while those with high school diploma education have the smallest earnings of $14,688.
| Educational Attainment | Male Income | Female Income |
| Less than High School | - | - |
| High School Diploma | $46,786 | $14,688 |
| College or Associate's Degree | $53,611 | $29,250 |
| Bachelor's Degree | $75,750 | $70,547 |
| Graduate Degree | $91,750 | $61,250 |
| Total | $54,625 | $40,469 |
Family Income in Stevensville
Family Income Brackets in Stevensville
According to the Stevensville family income data, there are 77 families falling into the $75,000 to $99,999 income range, which is the most common income bracket and makes up 25.7% of all families.
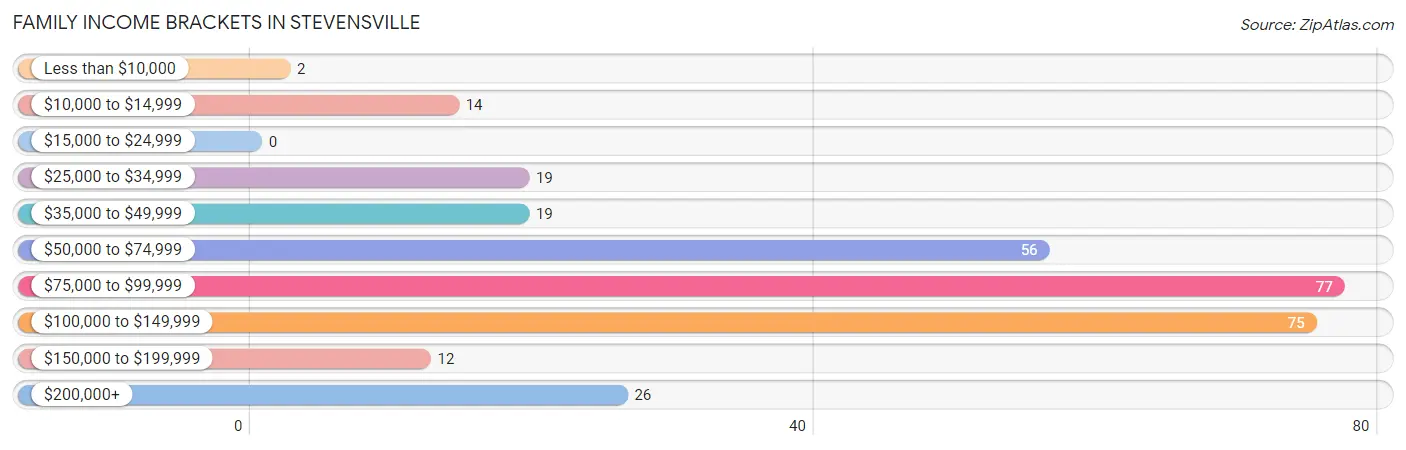
| Income Bracket | # Families | % Families |
| Less than $10,000 | 2 | 0.7% |
| $10,000 to $14,999 | 14 | 4.7% |
| $15,000 to $24,999 | 0 | 0.0% |
| $25,000 to $34,999 | 19 | 6.3% |
| $35,000 to $49,999 | 19 | 6.3% |
| $50,000 to $74,999 | 56 | 18.7% |
| $75,000 to $99,999 | 77 | 25.7% |
| $100,000 to $149,999 | 75 | 25.0% |
| $150,000 to $199,999 | 12 | 4.0% |
| $200,000+ | 26 | 8.7% |
Family Income by Famaliy Size in Stevensville
4-person families (53 | 17.7%) account for the highest median family income in Stevensville with $131,806 per family, while 2-person families (197 | 65.7%) have the highest median income of $38,625 per family member.
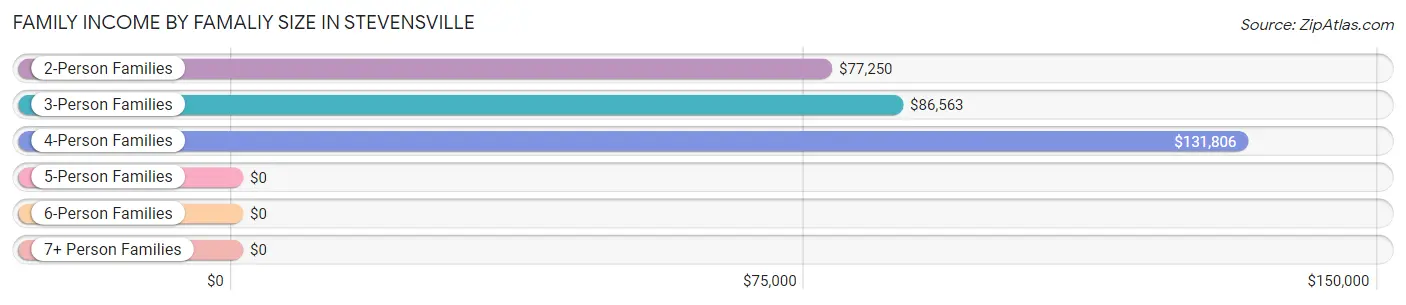
| Income Bracket | # Families | Median Income |
| 2-Person Families | 197 (65.7%) | $77,250 |
| 3-Person Families | 33 (11.0%) | $86,563 |
| 4-Person Families | 53 (17.7%) | $131,806 |
| 5-Person Families | 7 (2.3%) | $0 |
| 6-Person Families | 0 (0.0%) | $0 |
| 7+ Person Families | 10 (3.3%) | $0 |
| Total | 300 (100.0%) | $87,500 |
Family Income by Number of Earners in Stevensville
The median family income in Stevensville is $87,500, with families comprising 3+ earners (39) having the highest median family income of $140,250, while families with no earners (66) have the lowest median family income of $48,000, accounting for 13.0% and 22.0% of families, respectively.
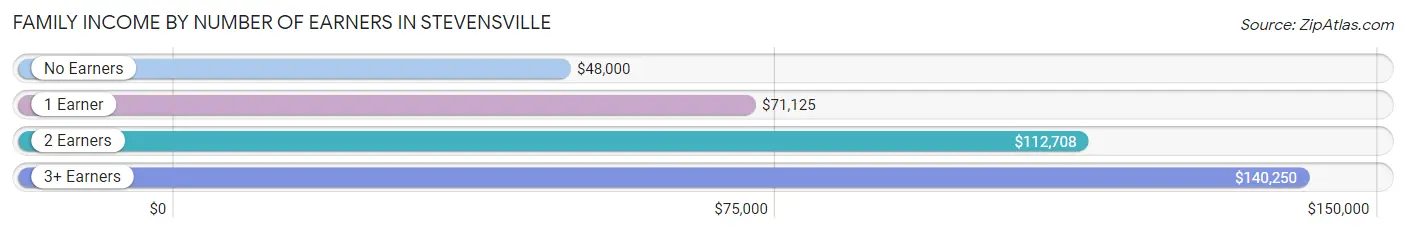
| Number of Earners | # Families | Median Income |
| No Earners | 66 (22.0%) | $48,000 |
| 1 Earner | 59 (19.7%) | $71,125 |
| 2 Earners | 136 (45.3%) | $112,708 |
| 3+ Earners | 39 (13.0%) | $140,250 |
| Total | 300 (100.0%) | $87,500 |
Household Income in Stevensville
Household Income Brackets in Stevensville
With 105 households falling in the category, the $50,000 to $74,999 income range is the most frequent in Stevensville, accounting for 19.6% of all households. In contrast, only 7 households (1.3%) fall into the less than $10,000 income bracket, making it the least populous group.
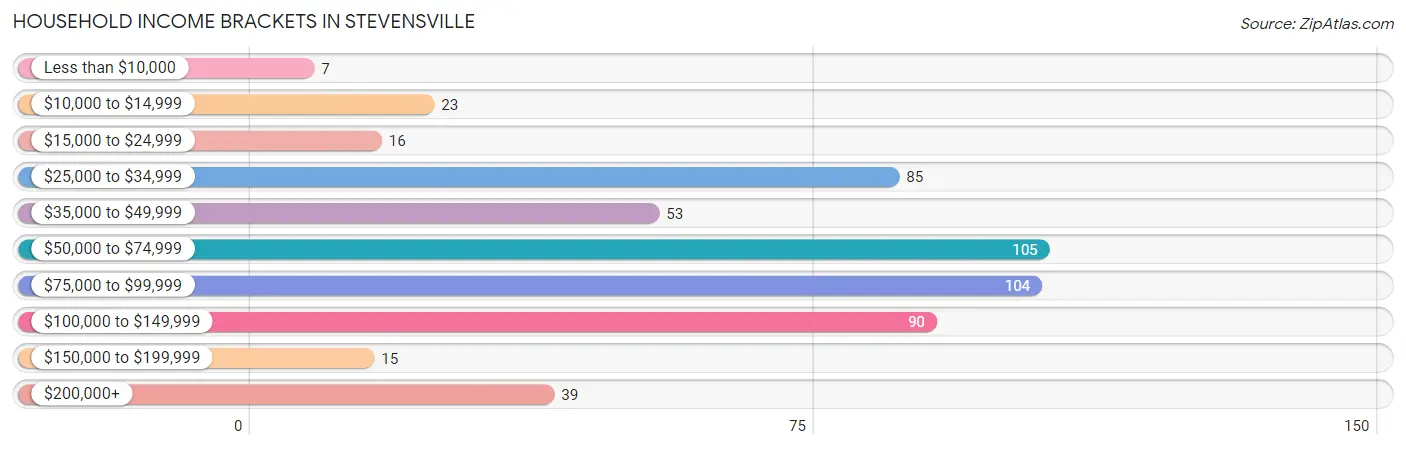
| Income Bracket | # Households | % Households |
| Less than $10,000 | 7 | 1.3% |
| $10,000 to $14,999 | 23 | 4.3% |
| $15,000 to $24,999 | 16 | 3.0% |
| $25,000 to $34,999 | 85 | 15.8% |
| $35,000 to $49,999 | 53 | 9.9% |
| $50,000 to $74,999 | 105 | 19.6% |
| $75,000 to $99,999 | 104 | 19.4% |
| $100,000 to $149,999 | 90 | 16.8% |
| $150,000 to $199,999 | 15 | 2.8% |
| $200,000+ | 39 | 7.3% |
Household Income by Householder Age in Stevensville
The median household income in Stevensville is $71,823, with the highest median household income of $93,750 found in the 45 to 64 years age bracket for the primary householder. A total of 186 households (34.6%) fall into this category. Meanwhile, the 15 to 24 years age bracket for the primary householder has the lowest median household income of $0, with 21 households (3.9%) in this group.
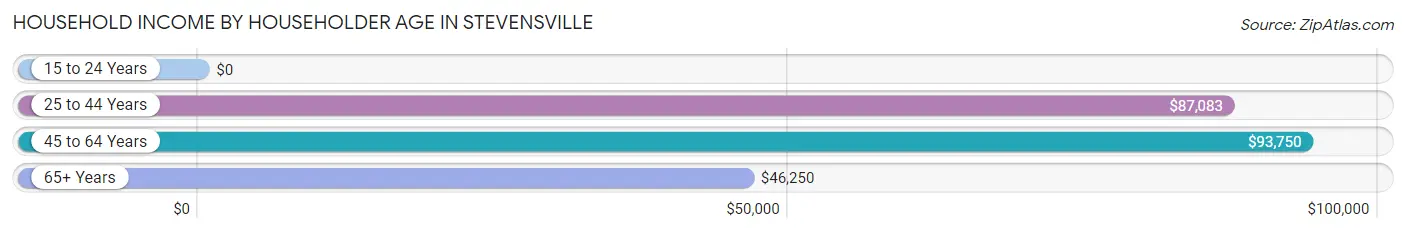
| Income Bracket | # Households | Median Income |
| 15 to 24 Years | 21 (3.9%) | $0 |
| 25 to 44 Years | 128 (23.8%) | $87,083 |
| 45 to 64 Years | 186 (34.6%) | $93,750 |
| 65+ Years | 202 (37.6%) | $46,250 |
| Total | 537 (100.0%) | $71,823 |
Poverty in Stevensville
Income Below Poverty by Sex and Age in Stevensville
With 7.4% poverty level for males and 10.0% for females among the residents of Stevensville, 18 to 24 year old males and 18 to 24 year old females are the most vulnerable to poverty, with 11 males (17.7%) and 21 females (36.2%) in their respective age groups living below the poverty level.
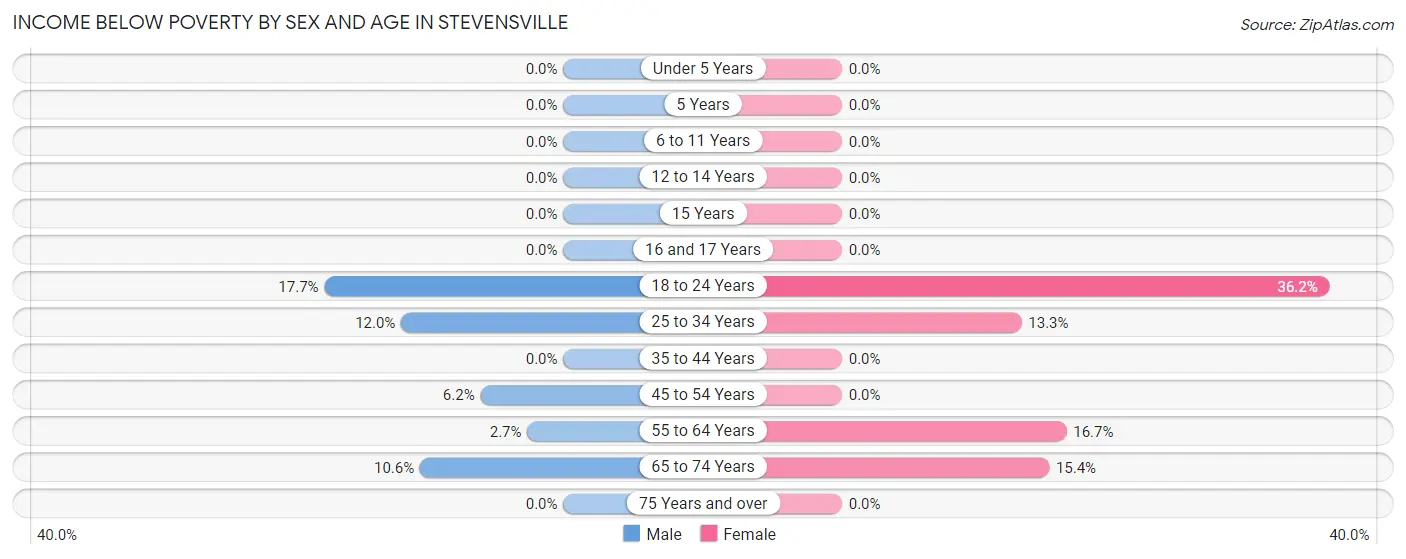
| Age Bracket | Male | Female |
| Under 5 Years | 0 (0.0%) | 0 (0.0%) |
| 5 Years | 0 (0.0%) | 0 (0.0%) |
| 6 to 11 Years | 0 (0.0%) | 0 (0.0%) |
| 12 to 14 Years | 0 (0.0%) | 0 (0.0%) |
| 15 Years | 0 (0.0%) | 0 (0.0%) |
| 16 and 17 Years | 0 (0.0%) | 0 (0.0%) |
| 18 to 24 Years | 11 (17.7%) | 21 (36.2%) |
| 25 to 34 Years | 13 (12.0%) | 8 (13.3%) |
| 35 to 44 Years | 0 (0.0%) | 0 (0.0%) |
| 45 to 54 Years | 4 (6.1%) | 0 (0.0%) |
| 55 to 64 Years | 2 (2.7%) | 16 (16.7%) |
| 65 to 74 Years | 10 (10.6%) | 14 (15.4%) |
| 75 Years and over | 0 (0.0%) | 0 (0.0%) |
| Total | 40 (7.4%) | 59 (10.0%) |
Income Above Poverty by Sex and Age in Stevensville
According to the poverty statistics in Stevensville, males aged under 5 years and females aged under 5 years are the age groups that are most secure financially, with 100.0% of males and 100.0% of females in these age groups living above the poverty line.
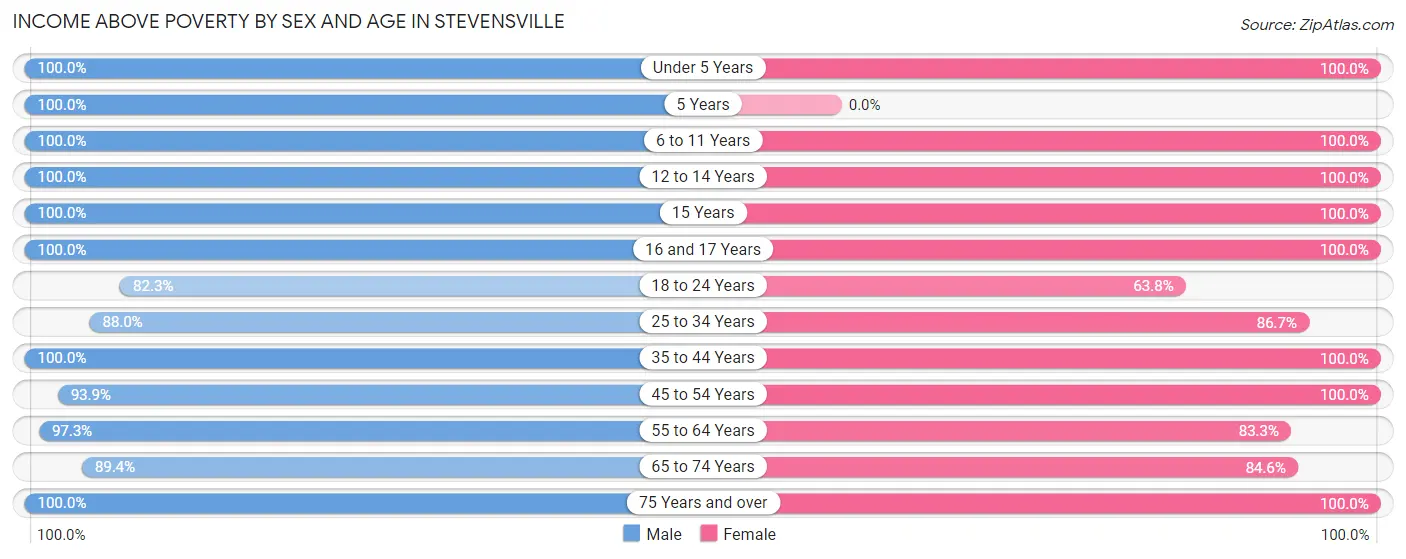
| Age Bracket | Male | Female |
| Under 5 Years | 19 (100.0%) | 35 (100.0%) |
| 5 Years | 5 (100.0%) | 0 (0.0%) |
| 6 to 11 Years | 13 (100.0%) | 45 (100.0%) |
| 12 to 14 Years | 8 (100.0%) | 5 (100.0%) |
| 15 Years | 5 (100.0%) | 5 (100.0%) |
| 16 and 17 Years | 10 (100.0%) | 5 (100.0%) |
| 18 to 24 Years | 51 (82.3%) | 37 (63.8%) |
| 25 to 34 Years | 95 (88.0%) | 52 (86.7%) |
| 35 to 44 Years | 32 (100.0%) | 49 (100.0%) |
| 45 to 54 Years | 61 (93.9%) | 57 (100.0%) |
| 55 to 64 Years | 73 (97.3%) | 80 (83.3%) |
| 65 to 74 Years | 84 (89.4%) | 77 (84.6%) |
| 75 Years and over | 41 (100.0%) | 83 (100.0%) |
| Total | 497 (92.5%) | 530 (90.0%) |
Income Below Poverty Among Married-Couple Families in Stevensville
The poverty statistics for married-couple families in Stevensville show that 6.1% or 16 of the total 261 families live below the poverty line. Families with no children have the highest poverty rate of 8.6%, comprising of 16 families. On the other hand, families with 1 or 2 children have the lowest poverty rate of 0.0%, which includes 0 families.
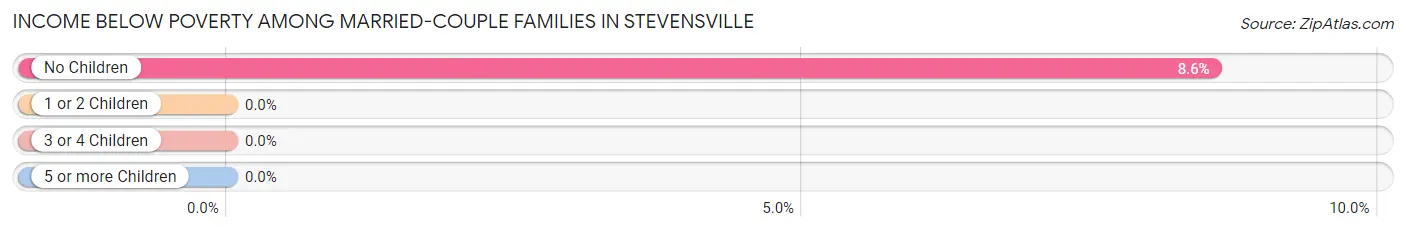
| Children | Above Poverty | Below Poverty |
| No Children | 171 (91.4%) | 16 (8.6%) |
| 1 or 2 Children | 64 (100.0%) | 0 (0.0%) |
| 3 or 4 Children | 0 (0.0%) | 0 (0.0%) |
| 5 or more Children | 10 (100.0%) | 0 (0.0%) |
| Total | 245 (93.9%) | 16 (6.1%) |
Income Below Poverty Among Single-Parent Households in Stevensville
| Children | Single Father | Single Mother |
| No Children | 0 (0.0%) | 0 (0.0%) |
| 1 or 2 Children | 0 (0.0%) | 0 (0.0%) |
| 3 or 4 Children | 0 (0.0%) | 0 (0.0%) |
| 5 or more Children | 0 (0.0%) | 0 (0.0%) |
| Total | 0 (0.0%) | 0 (0.0%) |
Income Below Poverty Among Married-Couple vs Single-Parent Households in Stevensville
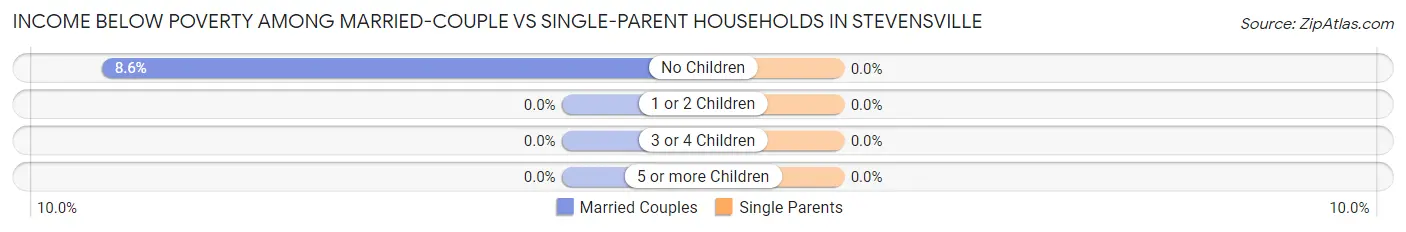
| Children | Married-Couple Families | Single-Parent Households |
| No Children | 16 (8.6%) | 0 (0.0%) |
| 1 or 2 Children | 0 (0.0%) | 0 (0.0%) |
| 3 or 4 Children | 0 (0.0%) | 0 (0.0%) |
| 5 or more Children | 0 (0.0%) | 0 (0.0%) |
| Total | 16 (6.1%) | 0 (0.0%) |
Race in Stevensville
The most populous races in Stevensville are White / Caucasian (1,034 | 91.8%), Hispanic or Latino (59 | 5.2%), and Two or more Races (40 | 3.5%).
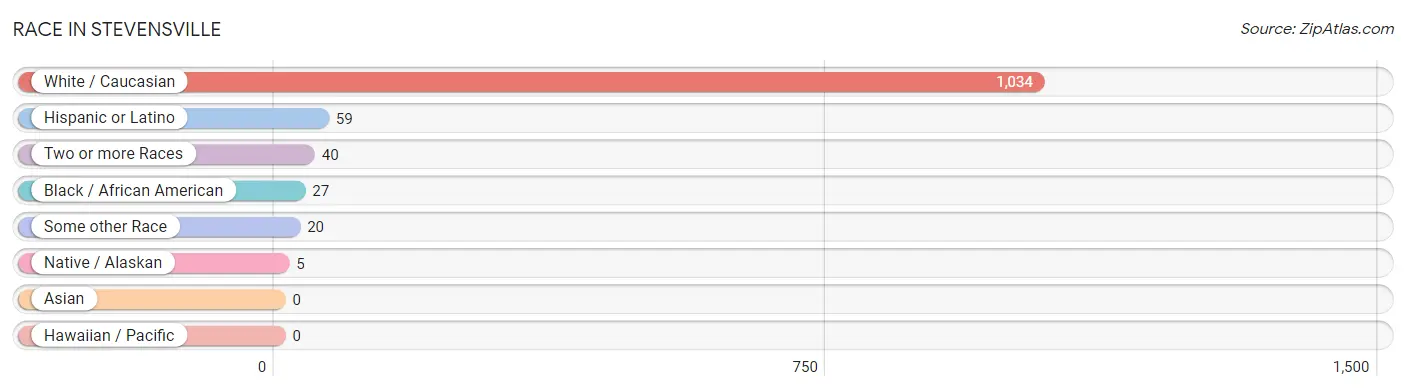
| Race | # Population | % Population |
| Asian | 0 | 0.0% |
| Black / African American | 27 | 2.4% |
| Hawaiian / Pacific | 0 | 0.0% |
| Hispanic or Latino | 59 | 5.2% |
| Native / Alaskan | 5 | 0.4% |
| White / Caucasian | 1,034 | 91.8% |
| Two or more Races | 40 | 3.5% |
| Some other Race | 20 | 1.8% |
| Total | 1,126 | 100.0% |
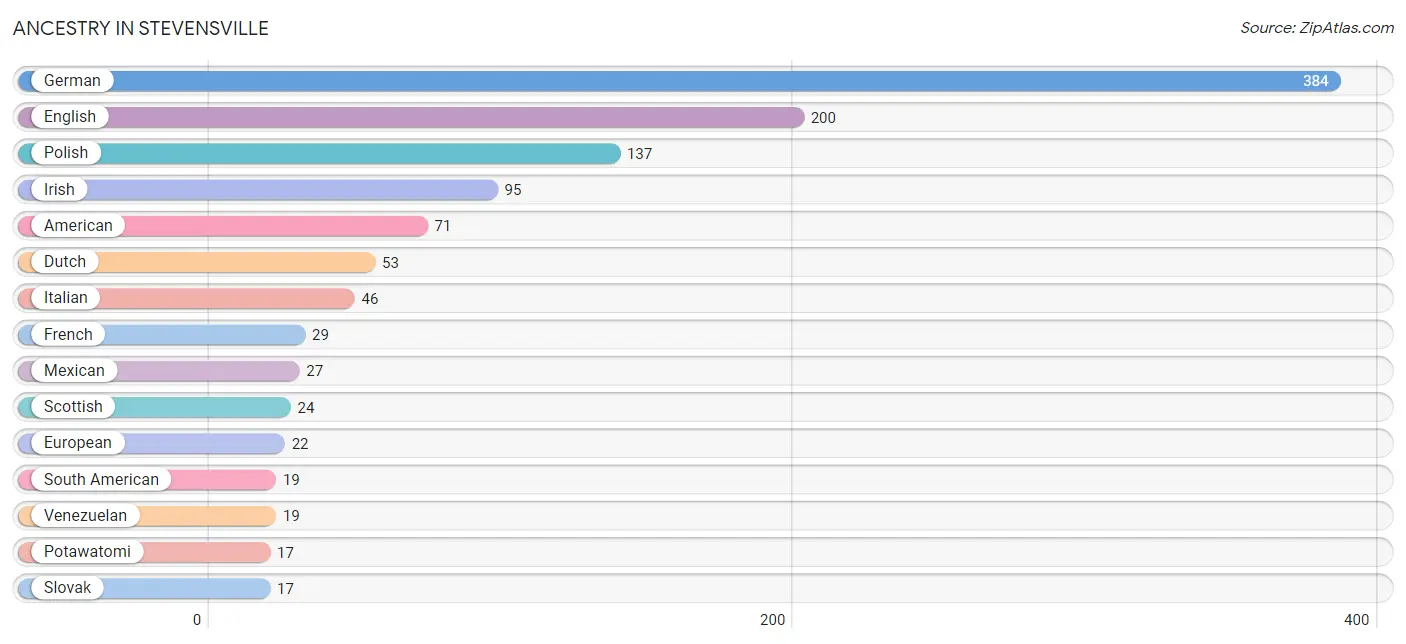
Ancestry in Stevensville
The most populous ancestries reported in Stevensville are German (384 | 34.1%), English (200 | 17.8%), Polish (137 | 12.2%), Irish (95 | 8.4%), and American (71 | 6.3%), together accounting for 78.8% of all Stevensville residents.
| Ancestry | # Population | % Population |
| American | 71 | 6.3% |
| Australian | 3 | 0.3% |
| British | 3 | 0.3% |
| Canadian | 13 | 1.1% |
| Central American | 13 | 1.1% |
| Czech | 2 | 0.2% |
| Danish | 3 | 0.3% |
| Dutch | 53 | 4.7% |
| English | 200 | 17.8% |
| European | 22 | 1.9% |
| French | 29 | 2.6% |
| French Canadian | 16 | 1.4% |
| German | 384 | 34.1% |
| Greek | 6 | 0.5% |
| Hungarian | 7 | 0.6% |
| Irish | 95 | 8.4% |
| Iroquois | 9 | 0.8% |
| Italian | 46 | 4.1% |
| Mexican | 27 | 2.4% |
| Northern European | 3 | 0.3% |
| Norwegian | 9 | 0.8% |
| Panamanian | 13 | 1.1% |
| Pennsylvania German | 2 | 0.2% |
| Polish | 137 | 12.2% |
| Potawatomi | 17 | 1.5% |
| Russian | 6 | 0.5% |
| Scotch-Irish | 8 | 0.7% |
| Scottish | 24 | 2.1% |
| Slovak | 17 | 1.5% |
| South American | 19 | 1.7% |
| Swedish | 16 | 1.4% |
| Trinidadian and Tobagonian | 14 | 1.2% |
| Venezuelan | 19 | 1.7% | View All 33 Rows |
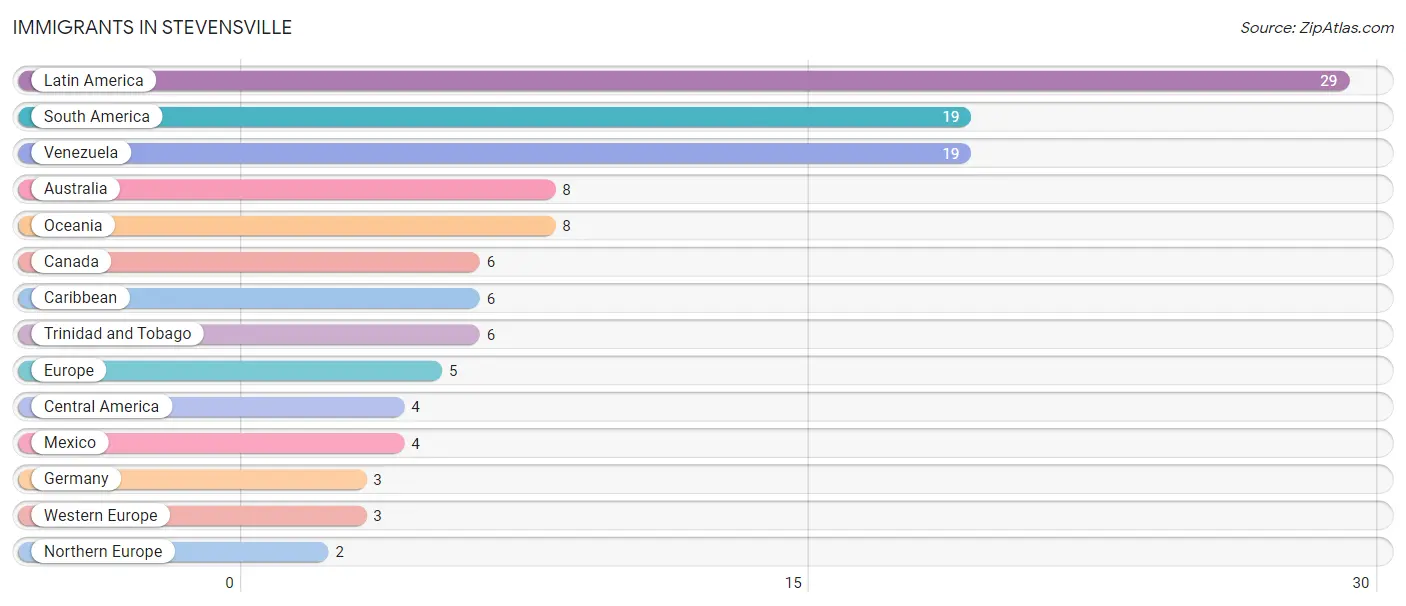
Immigrants in Stevensville
The most numerous immigrant groups reported in Stevensville came from Latin America (29 | 2.6%), South America (19 | 1.7%), Venezuela (19 | 1.7%), Australia (8 | 0.7%), and Oceania (8 | 0.7%), together accounting for 7.4% of all Stevensville residents.
| Immigration Origin | # Population | % Population |
| Australia | 8 | 0.7% |
| Canada | 6 | 0.5% |
| Caribbean | 6 | 0.5% |
| Central America | 4 | 0.4% |
| Europe | 5 | 0.4% |
| Germany | 3 | 0.3% |
| Latin America | 29 | 2.6% |
| Mexico | 4 | 0.4% |
| Northern Europe | 2 | 0.2% |
| Oceania | 8 | 0.7% |
| South America | 19 | 1.7% |
| Trinidad and Tobago | 6 | 0.5% |
| Venezuela | 19 | 1.7% |
| Western Europe | 3 | 0.3% | View All 14 Rows |
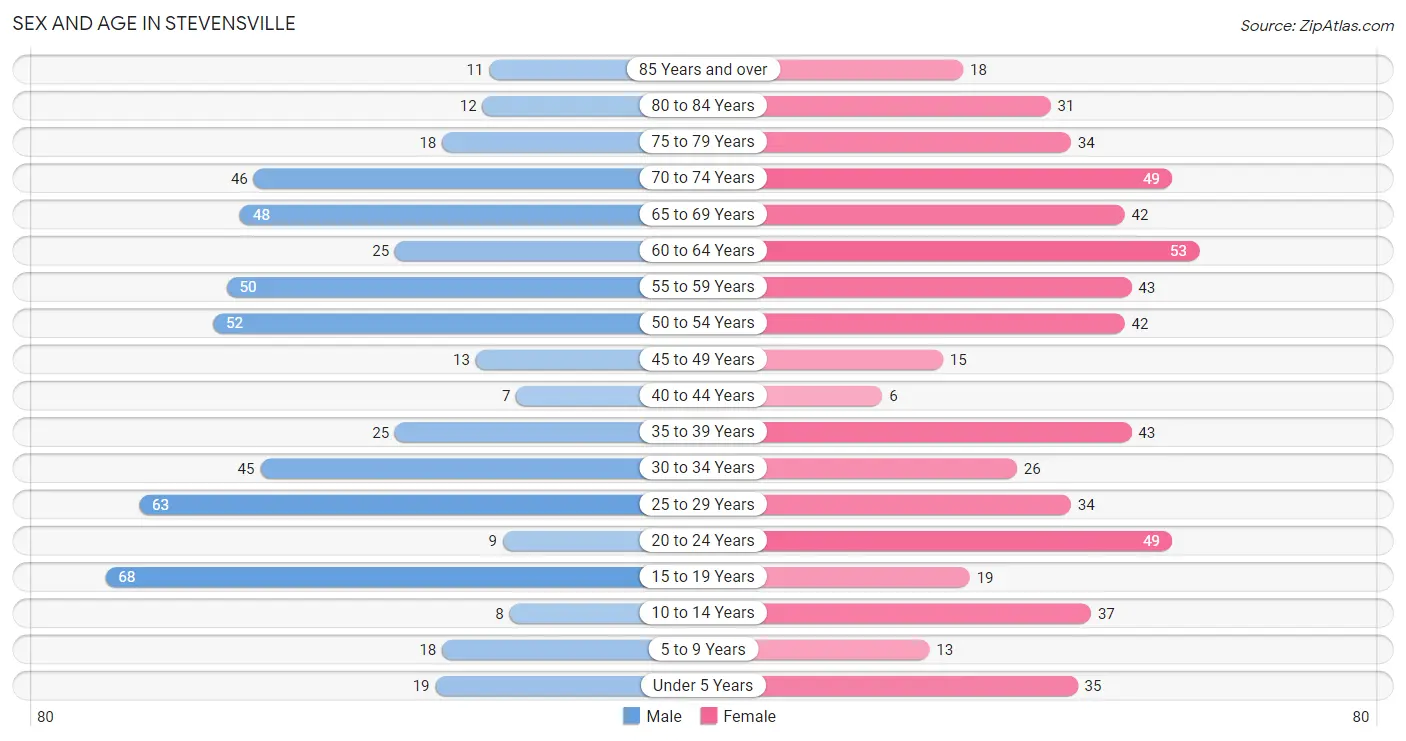
Sex and Age in Stevensville
Sex and Age in Stevensville
The most populous age groups in Stevensville are 15 to 19 Years (68 | 12.7%) for men and 60 to 64 Years (53 | 9.0%) for women.
| Age Bracket | Male | Female |
| Under 5 Years | 19 (3.5%) | 35 (5.9%) |
| 5 to 9 Years | 18 (3.4%) | 13 (2.2%) |
| 10 to 14 Years | 8 (1.5%) | 37 (6.3%) |
| 15 to 19 Years | 68 (12.7%) | 19 (3.2%) |
| 20 to 24 Years | 9 (1.7%) | 49 (8.3%) |
| 25 to 29 Years | 63 (11.7%) | 34 (5.8%) |
| 30 to 34 Years | 45 (8.4%) | 26 (4.4%) |
| 35 to 39 Years | 25 (4.7%) | 43 (7.3%) |
| 40 to 44 Years | 7 (1.3%) | 6 (1.0%) |
| 45 to 49 Years | 13 (2.4%) | 15 (2.5%) |
| 50 to 54 Years | 52 (9.7%) | 42 (7.1%) |
| 55 to 59 Years | 50 (9.3%) | 43 (7.3%) |
| 60 to 64 Years | 25 (4.7%) | 53 (9.0%) |
| 65 to 69 Years | 48 (8.9%) | 42 (7.1%) |
| 70 to 74 Years | 46 (8.6%) | 49 (8.3%) |
| 75 to 79 Years | 18 (3.4%) | 34 (5.8%) |
| 80 to 84 Years | 12 (2.2%) | 31 (5.3%) |
| 85 Years and over | 11 (2.1%) | 18 (3.1%) |
| Total | 537 (100.0%) | 589 (100.0%) |
Families and Households in Stevensville
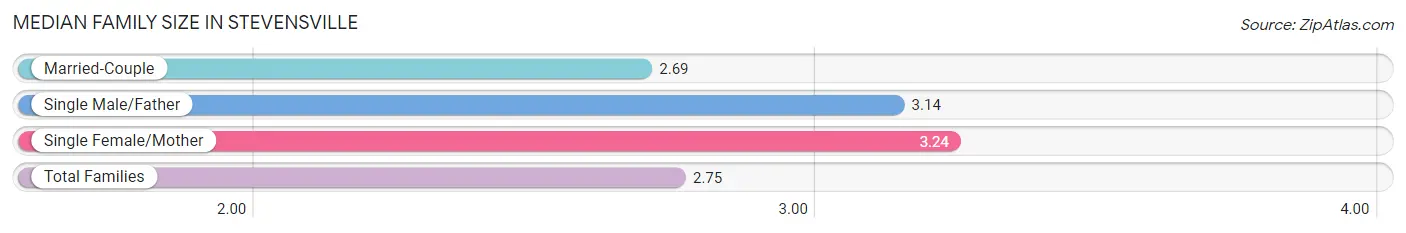
Median Family Size in Stevensville
The median family size in Stevensville is 2.75 persons per family, with single female/mother families (17 | 5.7%) accounting for the largest median family size of 3.24 persons per family. On the other hand, married-couple families (261 | 87.0%) represent the smallest median family size with 2.69 persons per family.
| Family Type | # Families | Family Size |
| Married-Couple | 261 (87.0%) | 2.69 |
| Single Male/Father | 22 (7.3%) | 3.14 |
| Single Female/Mother | 17 (5.7%) | 3.24 |
| Total Families | 300 (100.0%) | 2.75 |
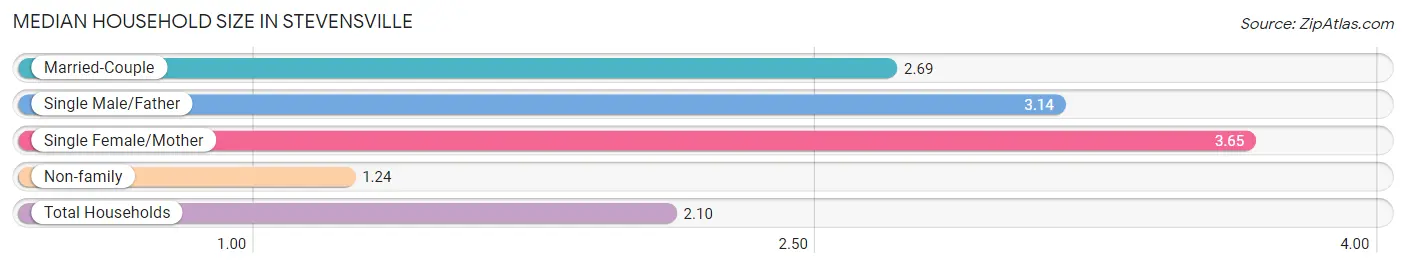
Median Household Size in Stevensville
The median household size in Stevensville is 2.10 persons per household, with single female/mother households (17 | 3.2%) accounting for the largest median household size of 3.65 persons per household. non-family households (237 | 44.1%) represent the smallest median household size with 1.24 persons per household.
| Household Type | # Households | Household Size |
| Married-Couple | 261 (48.6%) | 2.69 |
| Single Male/Father | 22 (4.1%) | 3.14 |
| Single Female/Mother | 17 (3.2%) | 3.65 |
| Non-family | 237 (44.1%) | 1.24 |
| Total Households | 537 (100.0%) | 2.10 |
Household Size by Marriage Status in Stevensville
Out of a total of 537 households in Stevensville, 300 (55.9%) are family households, while 237 (44.1%) are nonfamily households. The most numerous type of family households are 2-person households, comprising 194, and the most common type of nonfamily households are 1-person households, comprising 195.
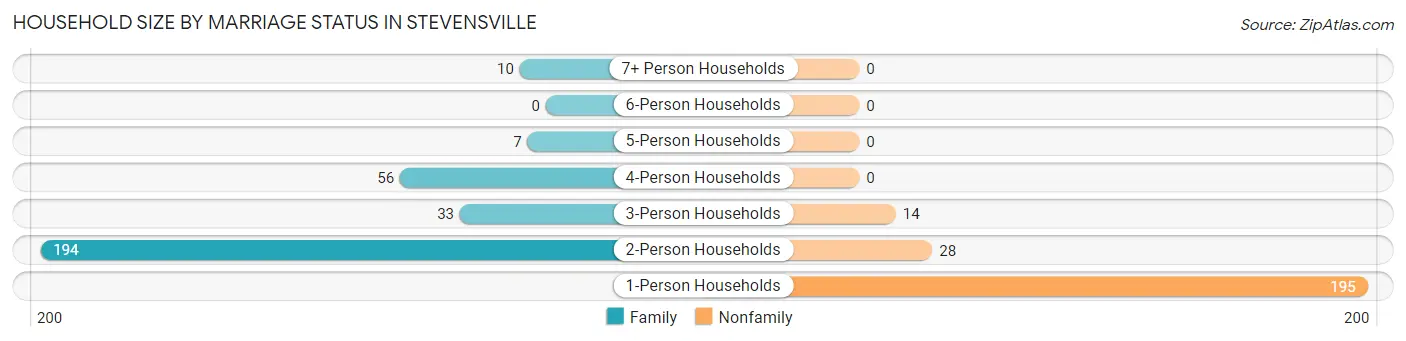
| Household Size | Family Households | Nonfamily Households |
| 1-Person Households | - | 195 (36.3%) |
| 2-Person Households | 194 (36.1%) | 28 (5.2%) |
| 3-Person Households | 33 (6.1%) | 14 (2.6%) |
| 4-Person Households | 56 (10.4%) | 0 (0.0%) |
| 5-Person Households | 7 (1.3%) | 0 (0.0%) |
| 6-Person Households | 0 (0.0%) | 0 (0.0%) |
| 7+ Person Households | 10 (1.9%) | 0 (0.0%) |
| Total | 300 (55.9%) | 237 (44.1%) |
Female Fertility in Stevensville
Fertility by Age in Stevensville
Average fertility rate in Stevensville is 48.0 births per 1,000 women. Women in the age bracket of 35 to 50 years have the highest fertility rate with 74.0 births per 1,000 women. Women in the age bracket of 35 to 50 years acount for 60.0% of all women with births.
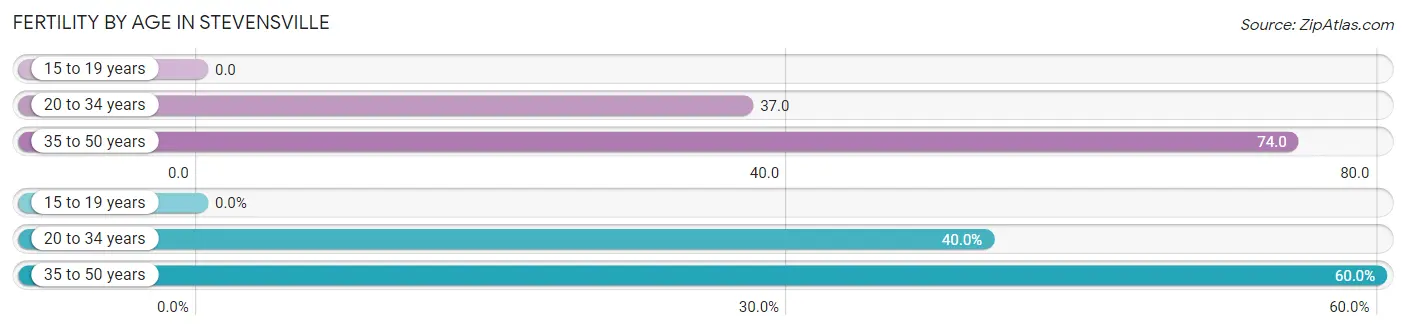
| Age Bracket | Women with Births | Births / 1,000 Women |
| 15 to 19 years | 0 (0.0%) | 0.0 |
| 20 to 34 years | 4 (40.0%) | 37.0 |
| 35 to 50 years | 6 (60.0%) | 74.0 |
| Total | 10 (100.0%) | 48.0 |
Fertility by Age by Marriage Status in Stevensville
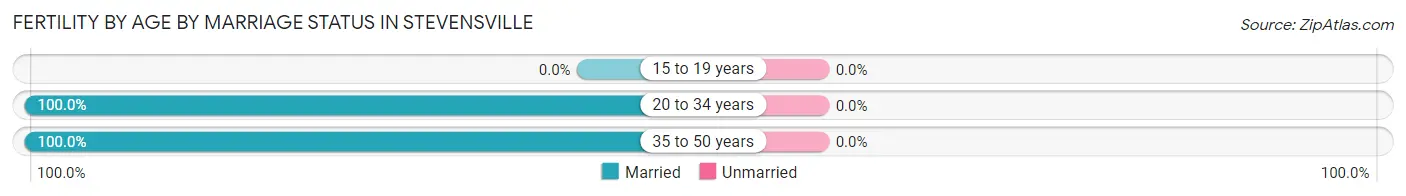
| Age Bracket | Married | Unmarried |
| 15 to 19 years | 0 (0.0%) | 0 (0.0%) |
| 20 to 34 years | 4 (100.0%) | 0 (0.0%) |
| 35 to 50 years | 6 (100.0%) | 0 (0.0%) |
| Total | 10 (100.0%) | 0 (0.0%) |
Fertility by Education in Stevensville
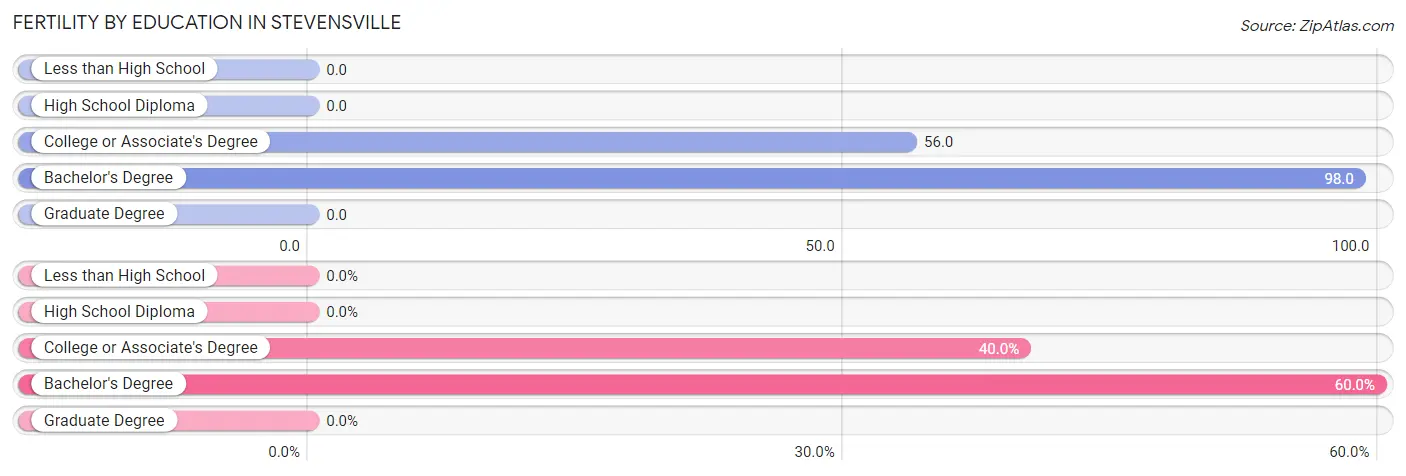
| Educational Attainment | Women with Births | Births / 1,000 Women |
| Less than High School | 0 (0.0%) | 0.0 |
| High School Diploma | 0 (0.0%) | 0.0 |
| College or Associate's Degree | 4 (40.0%) | 56.0 |
| Bachelor's Degree | 6 (60.0%) | 98.0 |
| Graduate Degree | 0 (0.0%) | 0.0 |
| Total | 10 (100.0%) | 48.0 |
Fertility by Education by Marriage Status in Stevensville
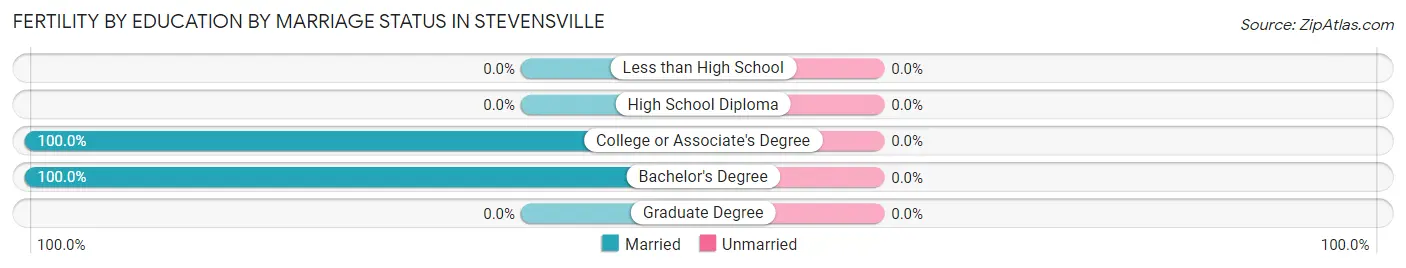
| Educational Attainment | Married | Unmarried |
| Less than High School | 0 (0.0%) | 0 (0.0%) |
| High School Diploma | 0 (0.0%) | 0 (0.0%) |
| College or Associate's Degree | 4 (100.0%) | 0 (0.0%) |
| Bachelor's Degree | 6 (100.0%) | 0 (0.0%) |
| Graduate Degree | 0 (0.0%) | 0 (0.0%) |
| Total | 10 (100.0%) | 0 (0.0%) |
Employment Characteristics in Stevensville
Employment by Class of Employer in Stevensville
Among the 594 employed individuals in Stevensville, private company employees (454 | 76.4%), not-for-profit organizations (57 | 9.6%), and self-employed (incorporated) (27 | 4.5%) make up the most common classes of employment.
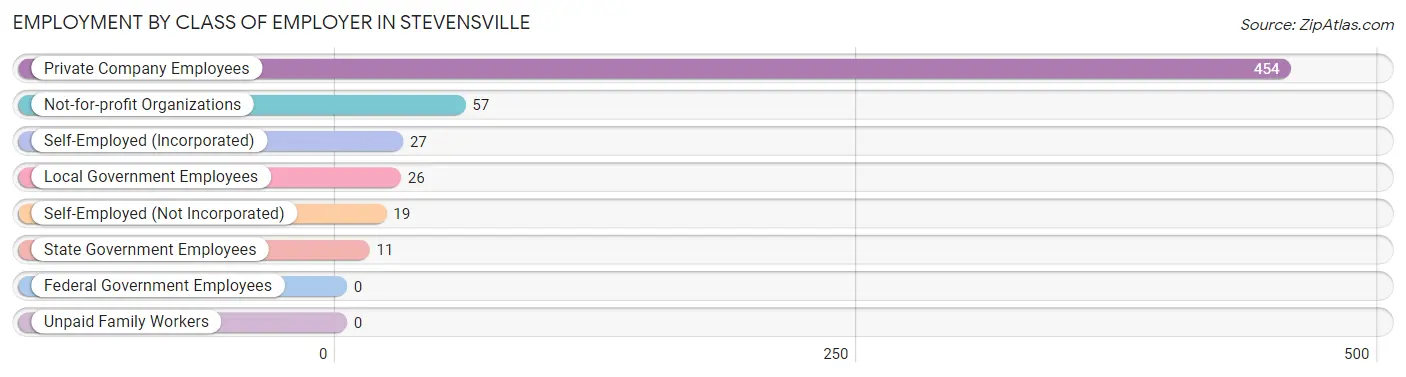
| Employer Class | # Employees | % Employees |
| Private Company Employees | 454 | 76.4% |
| Self-Employed (Incorporated) | 27 | 4.5% |
| Self-Employed (Not Incorporated) | 19 | 3.2% |
| Not-for-profit Organizations | 57 | 9.6% |
| Local Government Employees | 26 | 4.4% |
| State Government Employees | 11 | 1.8% |
| Federal Government Employees | 0 | 0.0% |
| Unpaid Family Workers | 0 | 0.0% |
| Total | 594 | 100.0% |
Employment Status by Age in Stevensville
According to the labor force statistics for Stevensville, out of the total population over 16 years of age (986), 63.7% or 628 individuals are in the labor force, with 3.8% or 24 of them unemployed. The age group with the highest labor force participation rate is 25 to 29 years, with 100.0% or 97 individuals in the labor force. Within the labor force, the 75 years and over age range has the highest percentage of unemployed individuals, with 20.0% or 3 of them being unemployed.
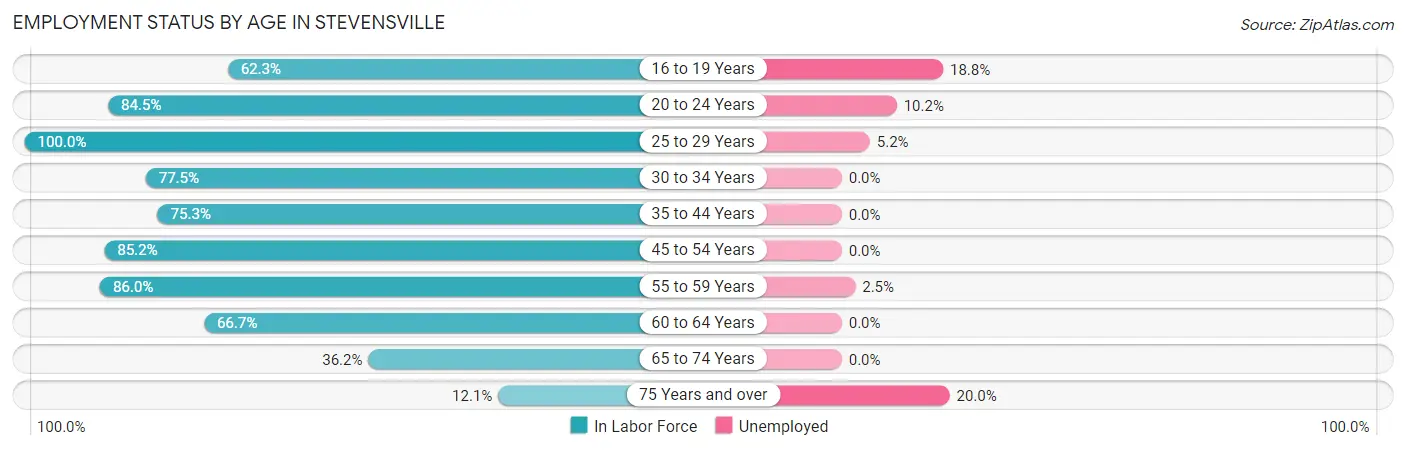
| Age Bracket | In Labor Force | Unemployed |
| 16 to 19 Years | 48 (62.3%) | 9 (18.8%) |
| 20 to 24 Years | 49 (84.5%) | 5 (10.2%) |
| 25 to 29 Years | 97 (100.0%) | 5 (5.2%) |
| 30 to 34 Years | 55 (77.5%) | 0 (0.0%) |
| 35 to 44 Years | 61 (75.3%) | 0 (0.0%) |
| 45 to 54 Years | 104 (85.2%) | 0 (0.0%) |
| 55 to 59 Years | 80 (86.0%) | 2 (2.5%) |
| 60 to 64 Years | 52 (66.7%) | 0 (0.0%) |
| 65 to 74 Years | 67 (36.2%) | 0 (0.0%) |
| 75 Years and over | 15 (12.1%) | 3 (20.0%) |
| Total | 628 (63.7%) | 24 (3.8%) |
Employment Status by Educational Attainment in Stevensville
According to labor force statistics for Stevensville, 82.8% of individuals (449) out of the total population between 25 and 64 years of age (542) are in the labor force, with 1.6% or 7 of them being unemployed. The group with the highest labor force participation rate are those with the educational attainment of less than high school, with 100.0% or 2 individuals in the labor force. Within the labor force, individuals with bachelor's degree or higher education have the highest percentage of unemployment, with 3.2% or 5 of them being unemployed.
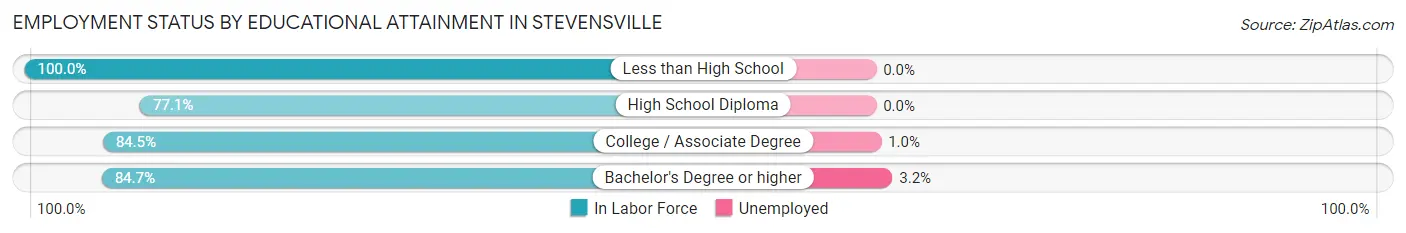
| Educational Attainment | In Labor Force | Unemployed |
| Less than High School | 2 (100.0%) | 0 (0.0%) |
| High School Diploma | 101 (77.1%) | 0 (0.0%) |
| College / Associate Degree | 191 (84.5%) | 2 (1.0%) |
| Bachelor's Degree or higher | 155 (84.7%) | 6 (3.2%) |
| Total | 449 (82.8%) | 9 (1.6%) |
Employment Occupations by Sex in Stevensville
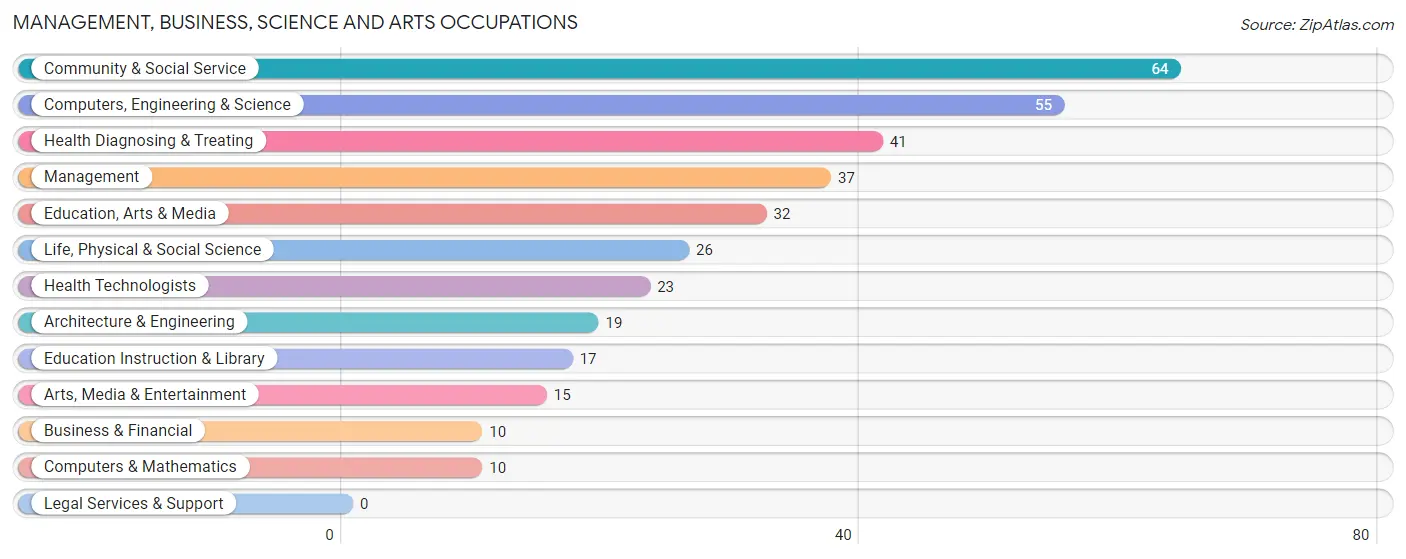
Management, Business, Science and Arts Occupations
The most common Management, Business, Science and Arts occupations in Stevensville are Community & Social Service (64 | 10.6%), Computers, Engineering & Science (55 | 9.1%), Health Diagnosing & Treating (41 | 6.8%), Management (37 | 6.1%), and Education, Arts & Media (32 | 5.3%).
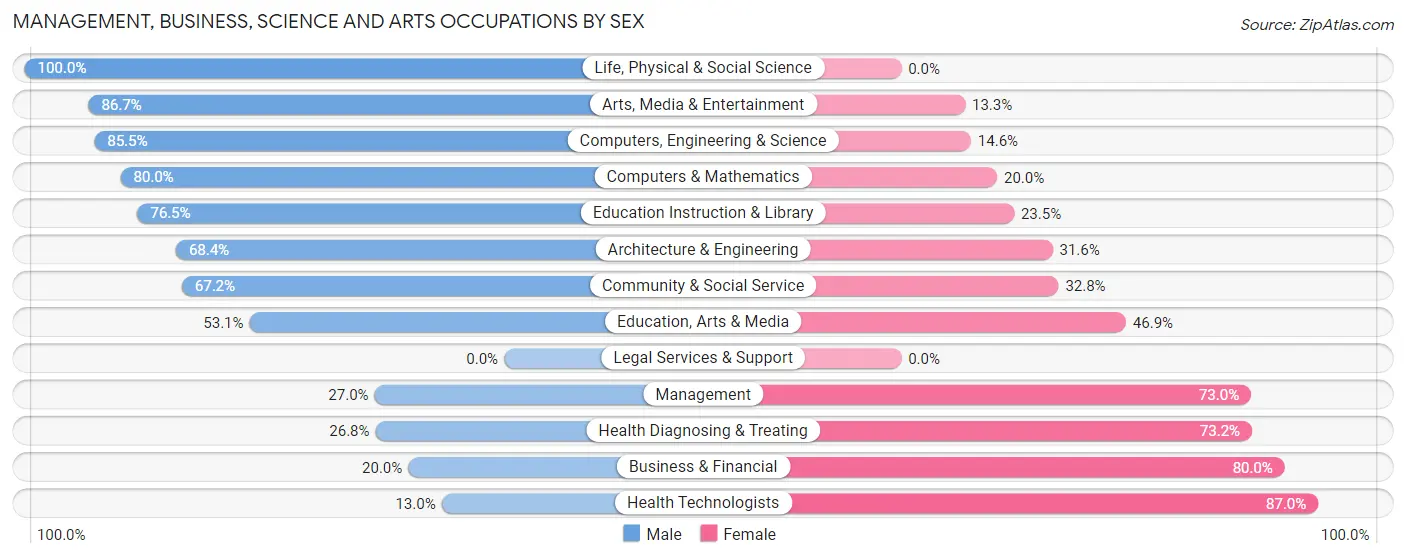
Management, Business, Science and Arts Occupations by Sex
Within the Management, Business, Science and Arts occupations in Stevensville, the most male-oriented occupations are Life, Physical & Social Science (100.0%), Arts, Media & Entertainment (86.7%), and Computers, Engineering & Science (85.5%), while the most female-oriented occupations are Health Technologists (87.0%), Business & Financial (80.0%), and Health Diagnosing & Treating (73.2%).
| Occupation | Male | Female |
| Management | 10 (27.0%) | 27 (73.0%) |
| Business & Financial | 2 (20.0%) | 8 (80.0%) |
| Computers, Engineering & Science | 47 (85.5%) | 8 (14.5%) |
| Computers & Mathematics | 8 (80.0%) | 2 (20.0%) |
| Architecture & Engineering | 13 (68.4%) | 6 (31.6%) |
| Life, Physical & Social Science | 26 (100.0%) | 0 (0.0%) |
| Community & Social Service | 43 (67.2%) | 21 (32.8%) |
| Education, Arts & Media | 17 (53.1%) | 15 (46.9%) |
| Legal Services & Support | 0 (0.0%) | 0 (0.0%) |
| Education Instruction & Library | 13 (76.5%) | 4 (23.5%) |
| Arts, Media & Entertainment | 13 (86.7%) | 2 (13.3%) |
| Health Diagnosing & Treating | 11 (26.8%) | 30 (73.2%) |
| Health Technologists | 3 (13.0%) | 20 (87.0%) |
| Total (Category) | 113 (54.6%) | 94 (45.4%) |
| Total (Overall) | 323 (53.5%) | 281 (46.5%) |
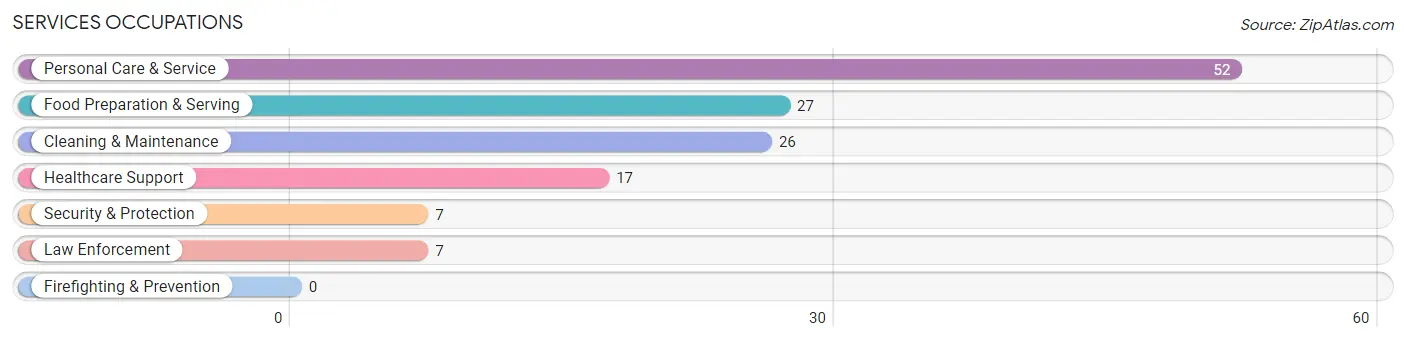
Services Occupations
The most common Services occupations in Stevensville are Personal Care & Service (52 | 8.6%), Food Preparation & Serving (27 | 4.5%), Cleaning & Maintenance (26 | 4.3%), Healthcare Support (17 | 2.8%), and Security & Protection (7 | 1.2%).
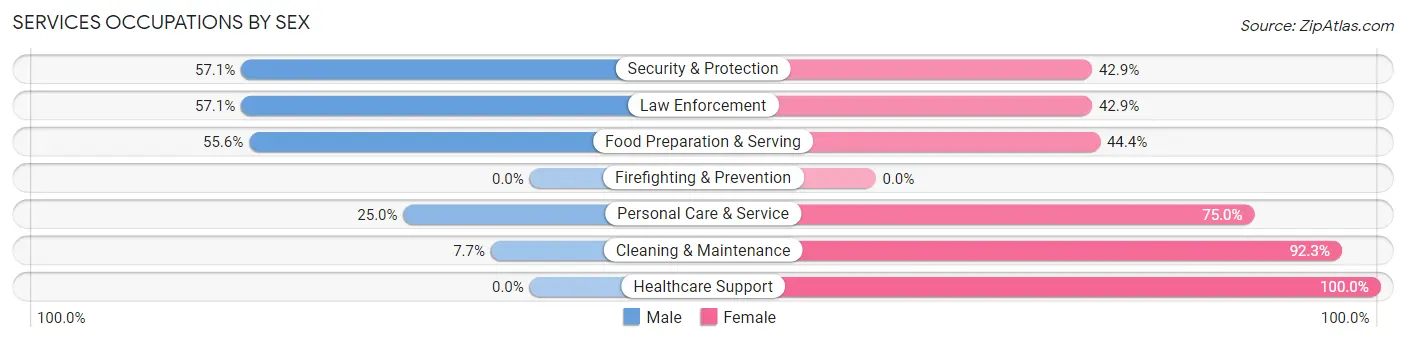
Services Occupations by Sex
Within the Services occupations in Stevensville, the most male-oriented occupations are Security & Protection (57.1%), Law Enforcement (57.1%), and Food Preparation & Serving (55.6%), while the most female-oriented occupations are Healthcare Support (100.0%), Cleaning & Maintenance (92.3%), and Personal Care & Service (75.0%).
| Occupation | Male | Female |
| Healthcare Support | 0 (0.0%) | 17 (100.0%) |
| Security & Protection | 4 (57.1%) | 3 (42.9%) |
| Firefighting & Prevention | 0 (0.0%) | 0 (0.0%) |
| Law Enforcement | 4 (57.1%) | 3 (42.9%) |
| Food Preparation & Serving | 15 (55.6%) | 12 (44.4%) |
| Cleaning & Maintenance | 2 (7.7%) | 24 (92.3%) |
| Personal Care & Service | 13 (25.0%) | 39 (75.0%) |
| Total (Category) | 34 (26.4%) | 95 (73.6%) |
| Total (Overall) | 323 (53.5%) | 281 (46.5%) |
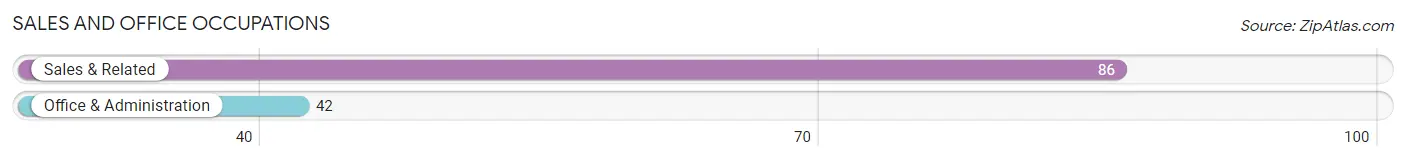
Sales and Office Occupations
The most common Sales and Office occupations in Stevensville are Sales & Related (86 | 14.2%), and Office & Administration (42 | 7.0%).
Sales and Office Occupations by Sex
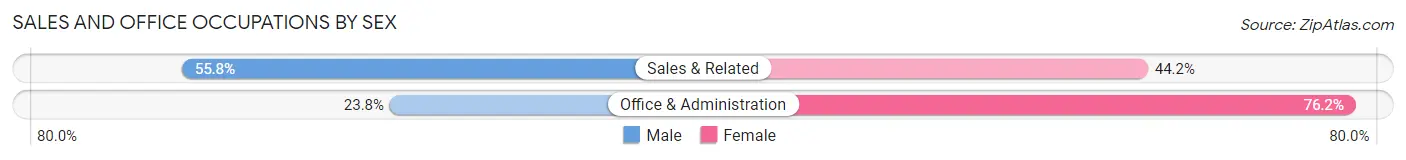
| Occupation | Male | Female |
| Sales & Related | 48 (55.8%) | 38 (44.2%) |
| Office & Administration | 10 (23.8%) | 32 (76.2%) |
| Total (Category) | 58 (45.3%) | 70 (54.7%) |
| Total (Overall) | 323 (53.5%) | 281 (46.5%) |
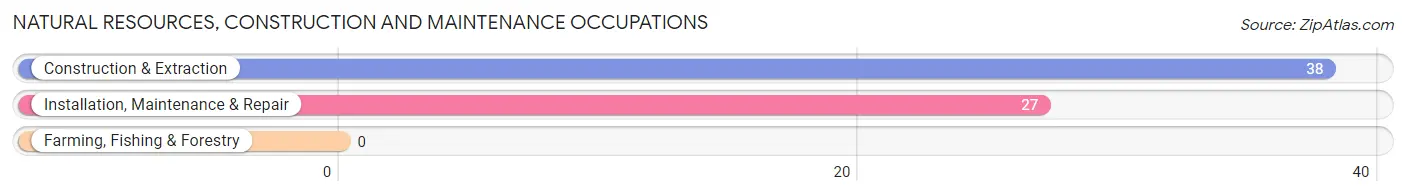
Natural Resources, Construction and Maintenance Occupations
The most common Natural Resources, Construction and Maintenance occupations in Stevensville are Construction & Extraction (38 | 6.3%), and Installation, Maintenance & Repair (27 | 4.5%).
Natural Resources, Construction and Maintenance Occupations by Sex
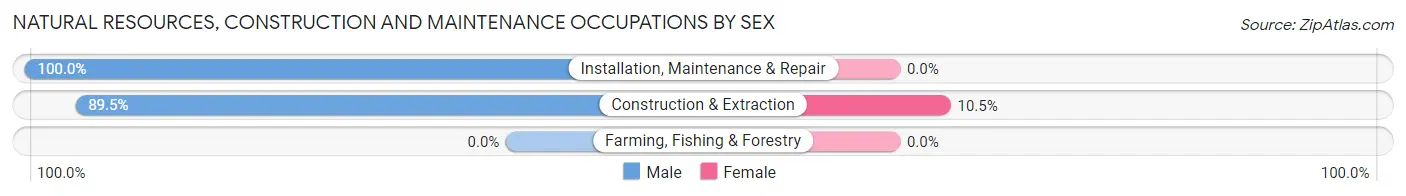
| Occupation | Male | Female |
| Farming, Fishing & Forestry | 0 (0.0%) | 0 (0.0%) |
| Construction & Extraction | 34 (89.5%) | 4 (10.5%) |
| Installation, Maintenance & Repair | 27 (100.0%) | 0 (0.0%) |
| Total (Category) | 61 (93.9%) | 4 (6.1%) |
| Total (Overall) | 323 (53.5%) | 281 (46.5%) |
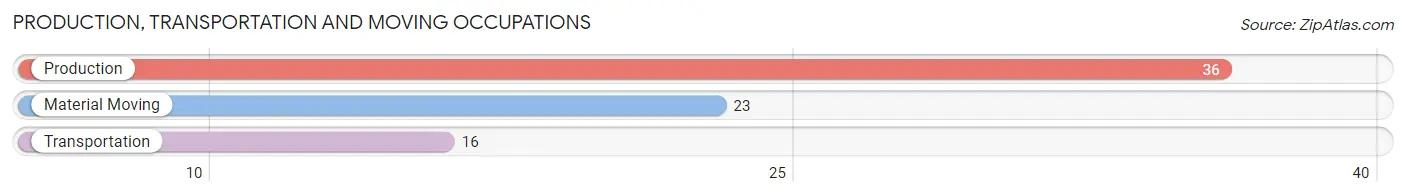
Production, Transportation and Moving Occupations
The most common Production, Transportation and Moving occupations in Stevensville are Production (36 | 6.0%), Material Moving (23 | 3.8%), and Transportation (16 | 2.6%).
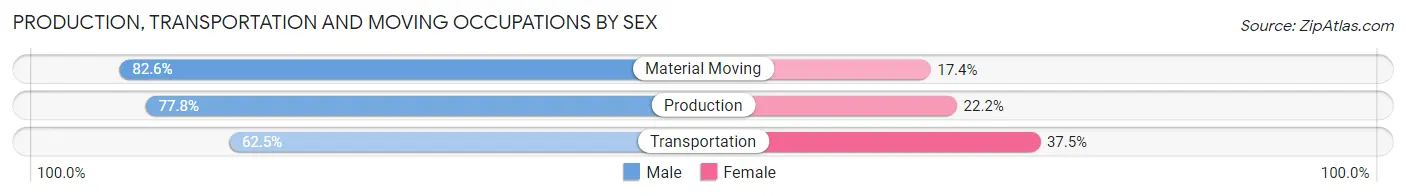
Production, Transportation and Moving Occupations by Sex
| Occupation | Male | Female |
| Production | 28 (77.8%) | 8 (22.2%) |
| Transportation | 10 (62.5%) | 6 (37.5%) |
| Material Moving | 19 (82.6%) | 4 (17.4%) |
| Total (Category) | 57 (76.0%) | 18 (24.0%) |
| Total (Overall) | 323 (53.5%) | 281 (46.5%) |
Employment Industries by Sex in Stevensville
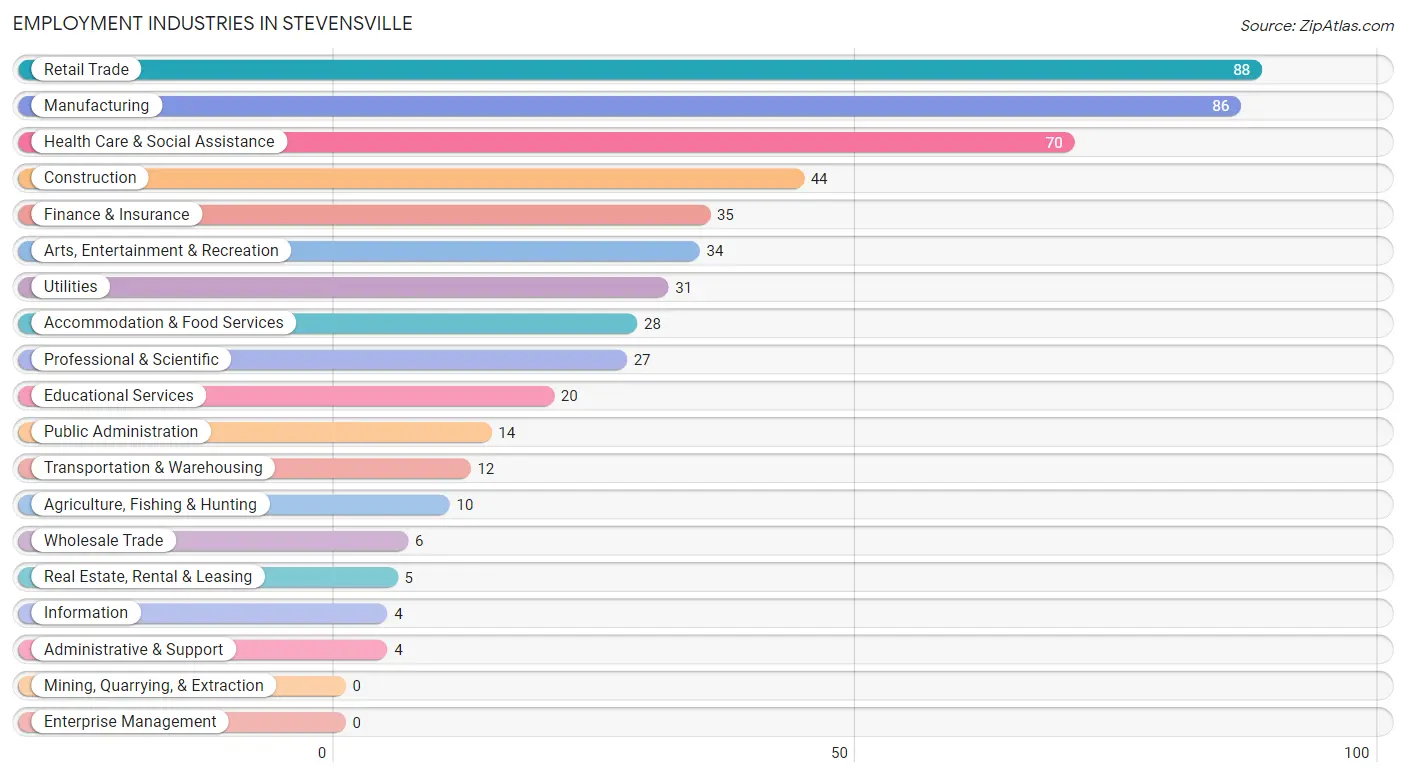
Employment Industries in Stevensville
The major employment industries in Stevensville include Retail Trade (88 | 14.6%), Manufacturing (86 | 14.2%), Health Care & Social Assistance (70 | 11.6%), Construction (44 | 7.3%), and Finance & Insurance (35 | 5.8%).
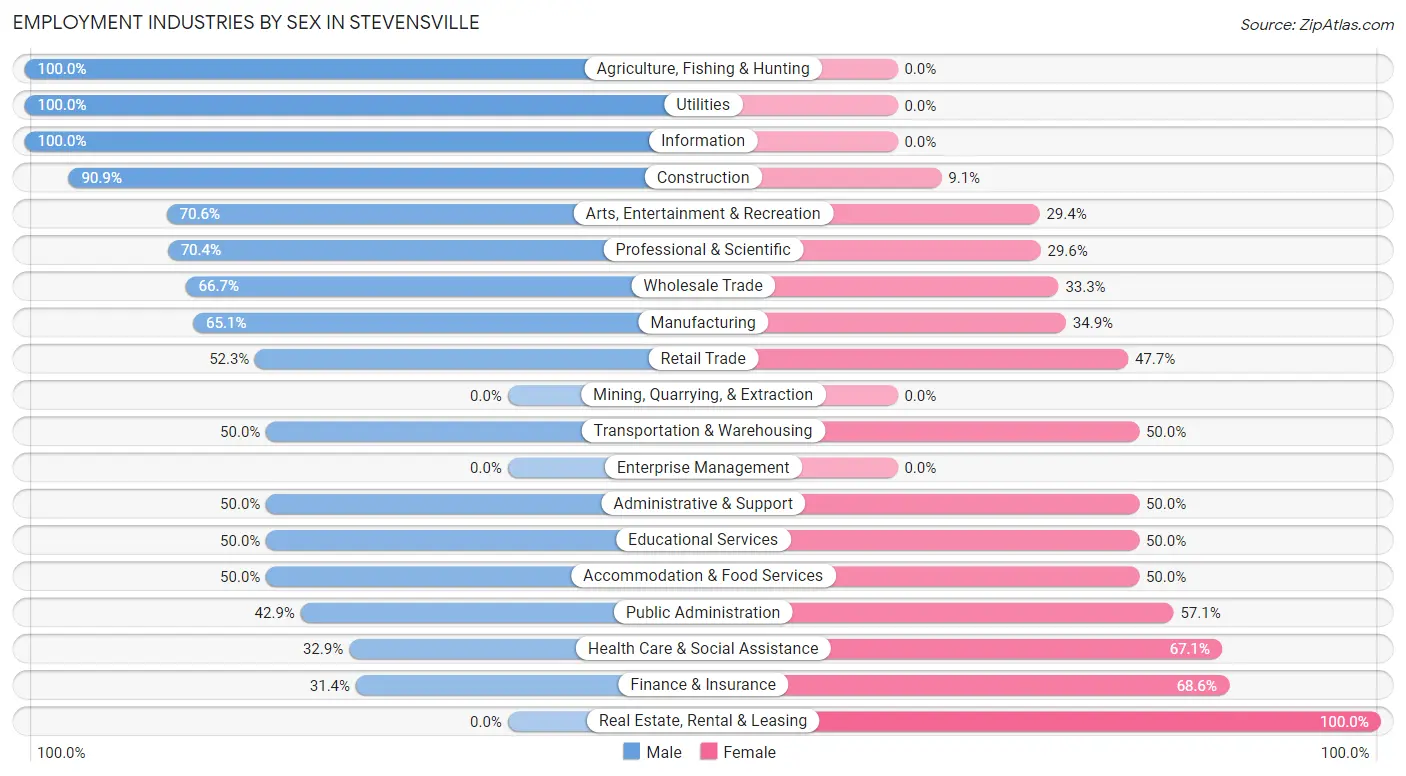
Employment Industries by Sex in Stevensville
The Stevensville industries that see more men than women are Agriculture, Fishing & Hunting (100.0%), Utilities (100.0%), and Information (100.0%), whereas the industries that tend to have a higher number of women are Real Estate, Rental & Leasing (100.0%), Finance & Insurance (68.6%), and Health Care & Social Assistance (67.1%).
| Industry | Male | Female |
| Agriculture, Fishing & Hunting | 10 (100.0%) | 0 (0.0%) |
| Mining, Quarrying, & Extraction | 0 (0.0%) | 0 (0.0%) |
| Construction | 40 (90.9%) | 4 (9.1%) |
| Manufacturing | 56 (65.1%) | 30 (34.9%) |
| Wholesale Trade | 4 (66.7%) | 2 (33.3%) |
| Retail Trade | 46 (52.3%) | 42 (47.7%) |
| Transportation & Warehousing | 6 (50.0%) | 6 (50.0%) |
| Utilities | 31 (100.0%) | 0 (0.0%) |
| Information | 4 (100.0%) | 0 (0.0%) |
| Finance & Insurance | 11 (31.4%) | 24 (68.6%) |
| Real Estate, Rental & Leasing | 0 (0.0%) | 5 (100.0%) |
| Professional & Scientific | 19 (70.4%) | 8 (29.6%) |
| Enterprise Management | 0 (0.0%) | 0 (0.0%) |
| Administrative & Support | 2 (50.0%) | 2 (50.0%) |
| Educational Services | 10 (50.0%) | 10 (50.0%) |
| Health Care & Social Assistance | 23 (32.9%) | 47 (67.1%) |
| Arts, Entertainment & Recreation | 24 (70.6%) | 10 (29.4%) |
| Accommodation & Food Services | 14 (50.0%) | 14 (50.0%) |
| Public Administration | 6 (42.9%) | 8 (57.1%) |
| Total | 323 (53.5%) | 281 (46.5%) |
Education in Stevensville
School Enrollment in Stevensville
The most common levels of schooling among the 155 students in Stevensville are high school (49 | 31.6%), middle school (40 | 25.8%), and college / undergraduate (22 | 14.2%).
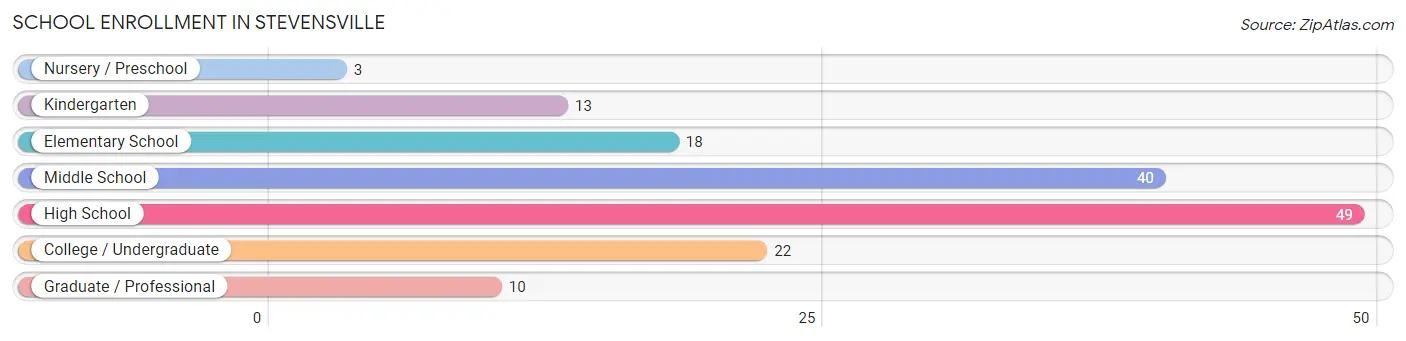
| School Level | # Students | % Students |
| Nursery / Preschool | 3 | 1.9% |
| Kindergarten | 13 | 8.4% |
| Elementary School | 18 | 11.6% |
| Middle School | 40 | 25.8% |
| High School | 49 | 31.6% |
| College / Undergraduate | 22 | 14.2% |
| Graduate / Professional | 10 | 6.5% |
| Total | 155 | 100.0% |
School Enrollment by Age by Funding Source in Stevensville
Out of a total of 155 students who are enrolled in schools in Stevensville, 6 (3.9%) attend a private institution, while the remaining 149 (96.1%) are enrolled in public schools. The age group of 25 to 34 year olds has the highest likelihood of being enrolled in private schools, with 6 (60.0% in the age bracket) enrolled. Conversely, the age group of 3 to 4 year olds has the lowest likelihood of being enrolled in a private school, with 3 (100.0% in the age bracket) attending a public institution.
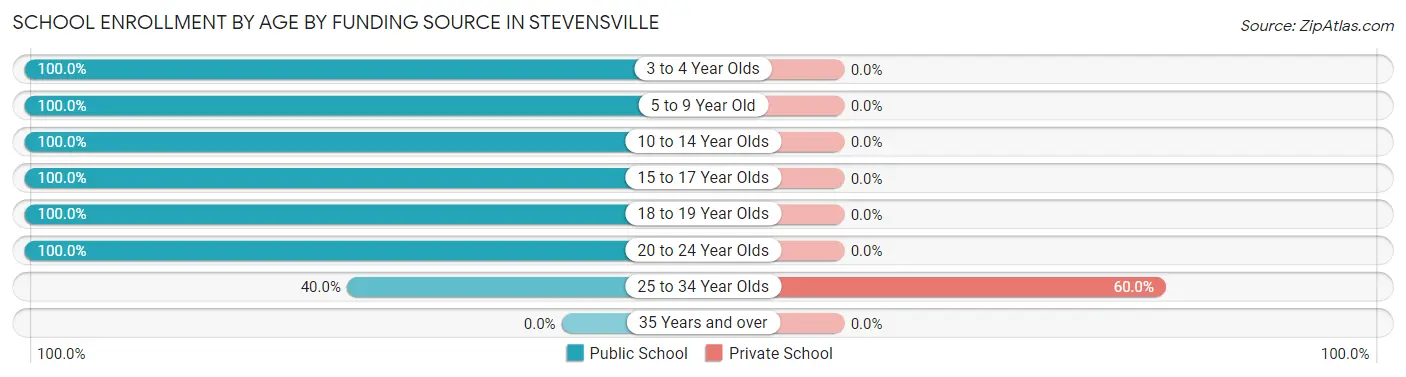
| Age Bracket | Public School | Private School |
| 3 to 4 Year Olds | 3 (100.0%) | 0 (0.0%) |
| 5 to 9 Year Old | 31 (100.0%) | 0 (0.0%) |
| 10 to 14 Year Olds | 45 (100.0%) | 0 (0.0%) |
| 15 to 17 Year Olds | 19 (100.0%) | 0 (0.0%) |
| 18 to 19 Year Olds | 34 (100.0%) | 0 (0.0%) |
| 20 to 24 Year Olds | 13 (100.0%) | 0 (0.0%) |
| 25 to 34 Year Olds | 4 (40.0%) | 6 (60.0%) |
| 35 Years and over | 0 (0.0%) | 0 (0.0%) |
| Total | 149 (96.1%) | 6 (3.9%) |
Educational Attainment by Field of Study in Stevensville
Business (61 | 21.9%), education (55 | 19.8%), science & technology (37 | 13.3%), engineering (25 | 9.0%), and liberal arts & history (18 | 6.5%) are the most common fields of study among 278 individuals in Stevensville who have obtained a bachelor's degree or higher.
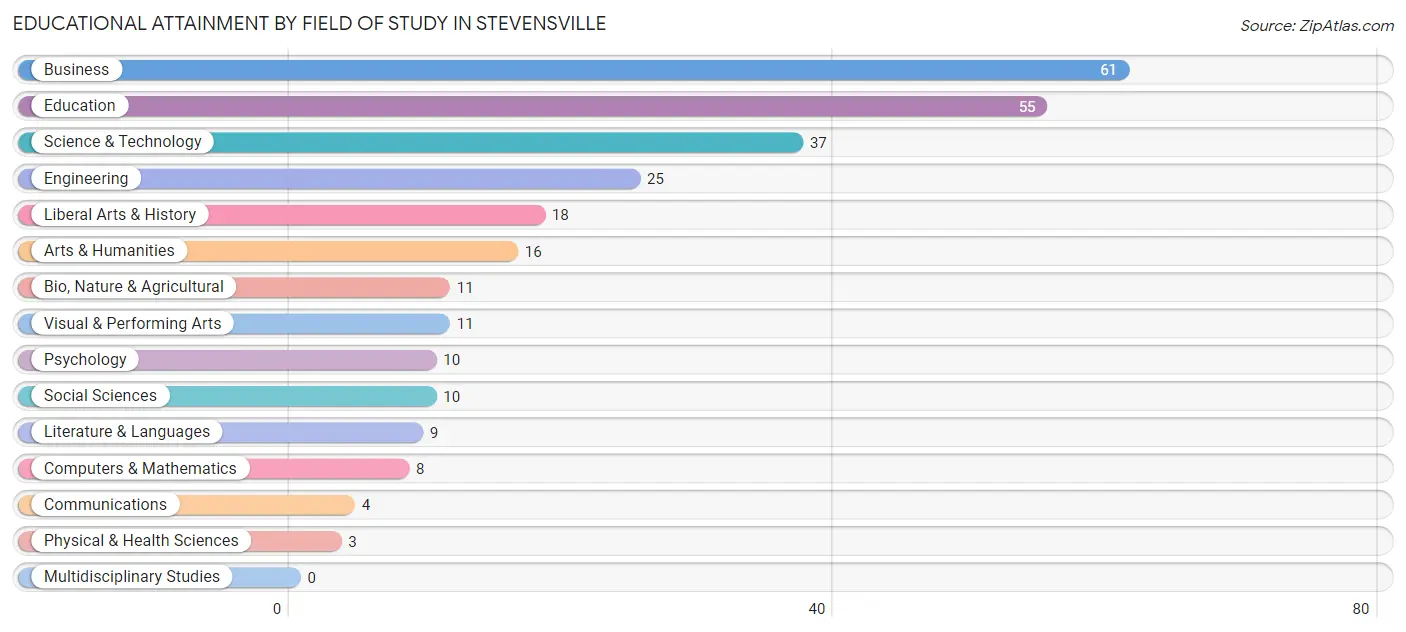
| Field of Study | # Graduates | % Graduates |
| Computers & Mathematics | 8 | 2.9% |
| Bio, Nature & Agricultural | 11 | 4.0% |
| Physical & Health Sciences | 3 | 1.1% |
| Psychology | 10 | 3.6% |
| Social Sciences | 10 | 3.6% |
| Engineering | 25 | 9.0% |
| Multidisciplinary Studies | 0 | 0.0% |
| Science & Technology | 37 | 13.3% |
| Business | 61 | 21.9% |
| Education | 55 | 19.8% |
| Literature & Languages | 9 | 3.2% |
| Liberal Arts & History | 18 | 6.5% |
| Visual & Performing Arts | 11 | 4.0% |
| Communications | 4 | 1.4% |
| Arts & Humanities | 16 | 5.8% |
| Total | 278 | 100.0% |
Transportation & Commute in Stevensville
Vehicle Availability by Sex in Stevensville
The most prevalent vehicle ownership categories in Stevensville are males with 2 vehicles (152, accounting for 47.1%) and females with 2 vehicles (111, making up 56.1%).
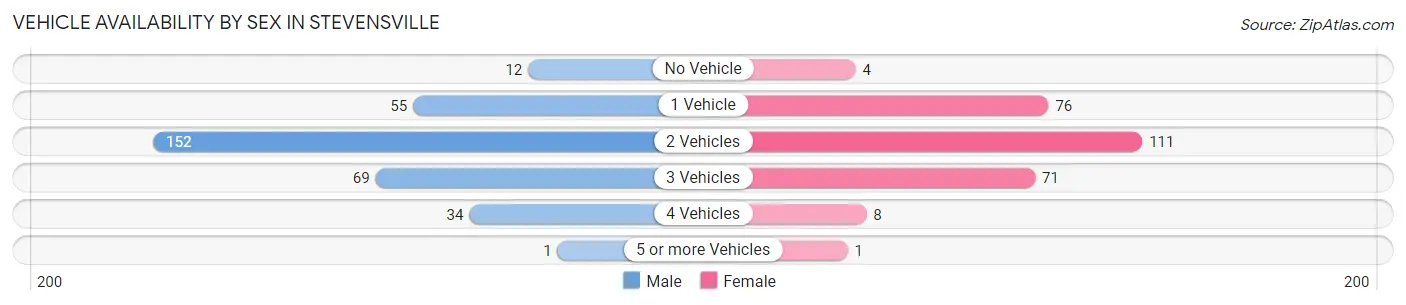
| Vehicles Available | Male | Female |
| No Vehicle | 12 (3.7%) | 4 (1.5%) |
| 1 Vehicle | 55 (17.0%) | 76 (28.0%) |
| 2 Vehicles | 152 (47.1%) | 111 (41.0%) |
| 3 Vehicles | 69 (21.4%) | 71 (26.2%) |
| 4 Vehicles | 34 (10.5%) | 8 (2.9%) |
| 5 or more Vehicles | 1 (0.3%) | 1 (0.4%) |
| Total | 323 (100.0%) | 271 (100.0%) |
Commute Time in Stevensville
The most frequently occuring commute durations in Stevensville are 15 to 19 minutes (127 commuters, 22.4%), 10 to 14 minutes (121 commuters, 21.3%), and 5 to 9 minutes (86 commuters, 15.2%).
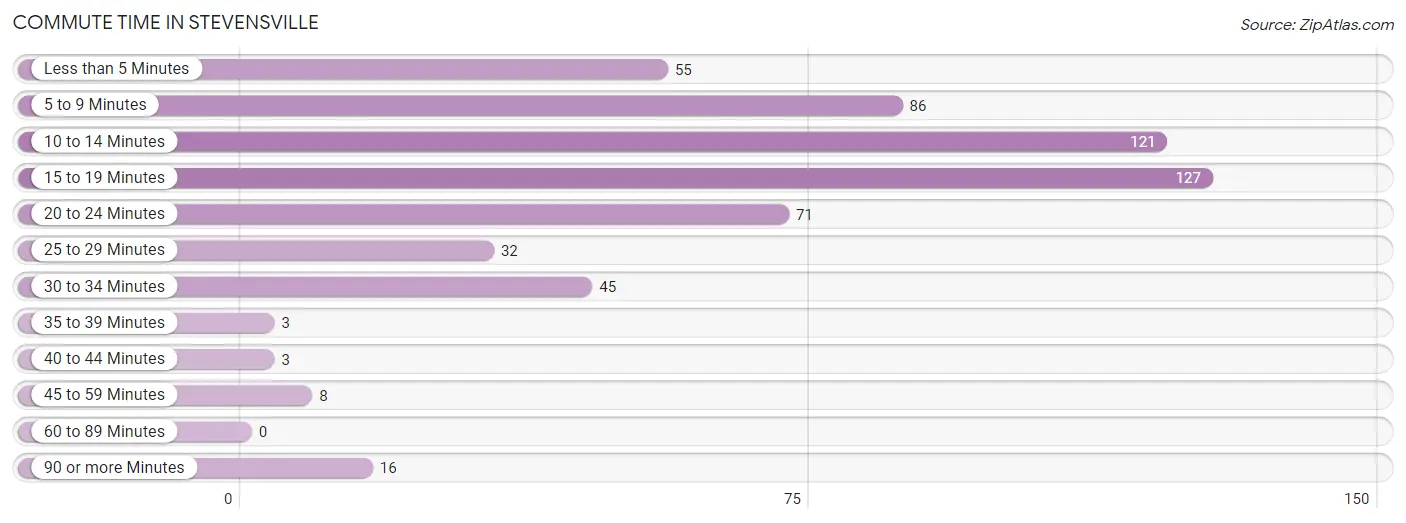
| Commute Time | # Commuters | % Commuters |
| Less than 5 Minutes | 55 | 9.7% |
| 5 to 9 Minutes | 86 | 15.2% |
| 10 to 14 Minutes | 121 | 21.3% |
| 15 to 19 Minutes | 127 | 22.4% |
| 20 to 24 Minutes | 71 | 12.5% |
| 25 to 29 Minutes | 32 | 5.6% |
| 30 to 34 Minutes | 45 | 7.9% |
| 35 to 39 Minutes | 3 | 0.5% |
| 40 to 44 Minutes | 3 | 0.5% |
| 45 to 59 Minutes | 8 | 1.4% |
| 60 to 89 Minutes | 0 | 0.0% |
| 90 or more Minutes | 16 | 2.8% |
Commute Time by Sex in Stevensville
The most common commute times in Stevensville are 10 to 14 minutes (69 commuters, 21.9%) for males and 15 to 19 minutes (70 commuters, 27.8%) for females.
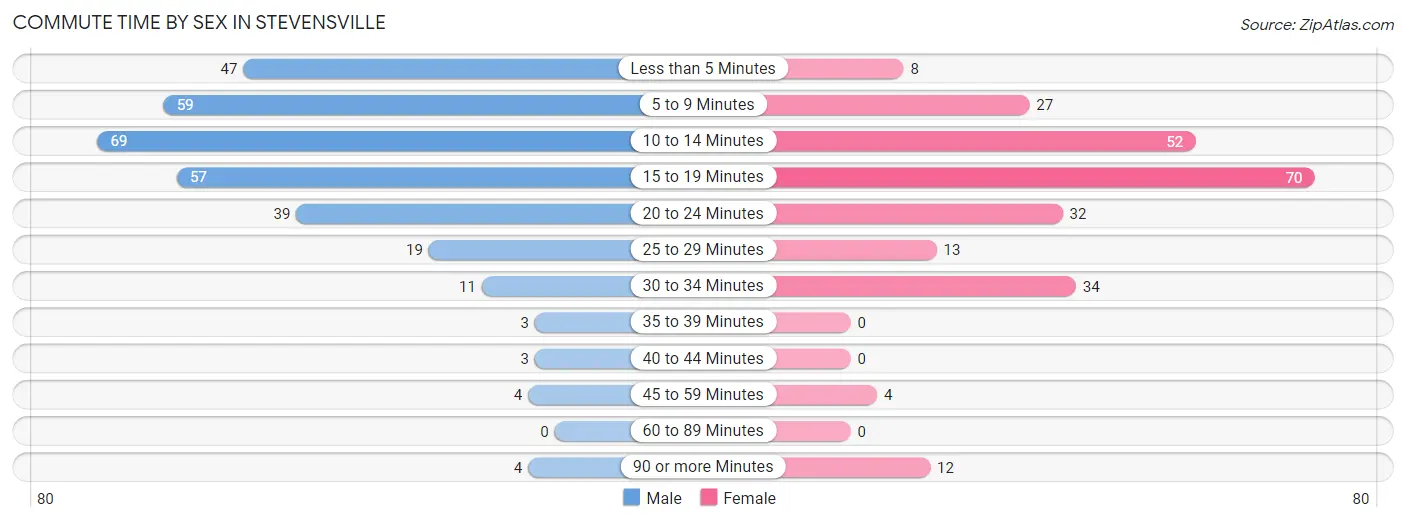
| Commute Time | Male | Female |
| Less than 5 Minutes | 47 (14.9%) | 8 (3.2%) |
| 5 to 9 Minutes | 59 (18.7%) | 27 (10.7%) |
| 10 to 14 Minutes | 69 (21.9%) | 52 (20.6%) |
| 15 to 19 Minutes | 57 (18.1%) | 70 (27.8%) |
| 20 to 24 Minutes | 39 (12.4%) | 32 (12.7%) |
| 25 to 29 Minutes | 19 (6.0%) | 13 (5.2%) |
| 30 to 34 Minutes | 11 (3.5%) | 34 (13.5%) |
| 35 to 39 Minutes | 3 (0.9%) | 0 (0.0%) |
| 40 to 44 Minutes | 3 (0.9%) | 0 (0.0%) |
| 45 to 59 Minutes | 4 (1.3%) | 4 (1.6%) |
| 60 to 89 Minutes | 0 (0.0%) | 0 (0.0%) |
| 90 or more Minutes | 4 (1.3%) | 12 (4.8%) |
Time of Departure to Work by Sex in Stevensville
The most frequent times of departure to work in Stevensville are 7:00 AM to 7:29 AM (59, 18.7%) for males and 7:00 AM to 7:29 AM (64, 25.4%) for females.
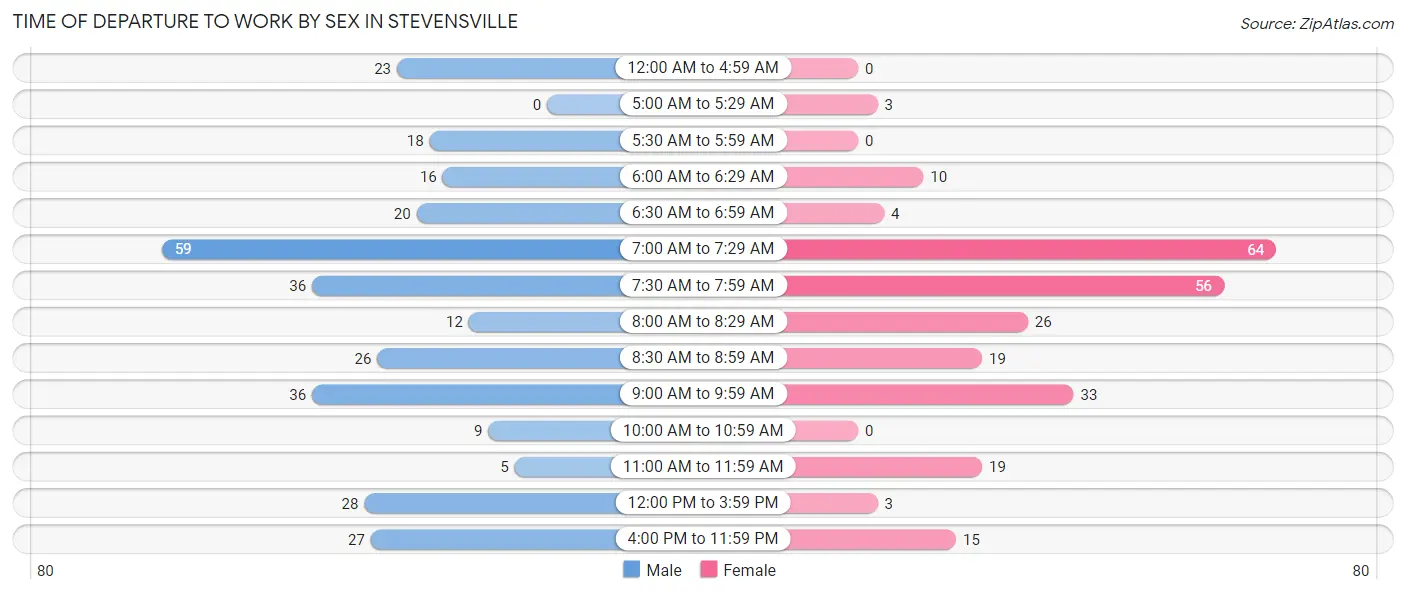
| Time of Departure | Male | Female |
| 12:00 AM to 4:59 AM | 23 (7.3%) | 0 (0.0%) |
| 5:00 AM to 5:29 AM | 0 (0.0%) | 3 (1.2%) |
| 5:30 AM to 5:59 AM | 18 (5.7%) | 0 (0.0%) |
| 6:00 AM to 6:29 AM | 16 (5.1%) | 10 (4.0%) |
| 6:30 AM to 6:59 AM | 20 (6.4%) | 4 (1.6%) |
| 7:00 AM to 7:29 AM | 59 (18.7%) | 64 (25.4%) |
| 7:30 AM to 7:59 AM | 36 (11.4%) | 56 (22.2%) |
| 8:00 AM to 8:29 AM | 12 (3.8%) | 26 (10.3%) |
| 8:30 AM to 8:59 AM | 26 (8.3%) | 19 (7.5%) |
| 9:00 AM to 9:59 AM | 36 (11.4%) | 33 (13.1%) |
| 10:00 AM to 10:59 AM | 9 (2.9%) | 0 (0.0%) |
| 11:00 AM to 11:59 AM | 5 (1.6%) | 19 (7.5%) |
| 12:00 PM to 3:59 PM | 28 (8.9%) | 3 (1.2%) |
| 4:00 PM to 11:59 PM | 27 (8.6%) | 15 (5.9%) |
| Total | 315 (100.0%) | 252 (100.0%) |
Housing Occupancy in Stevensville
Occupancy by Ownership in Stevensville
Of the total 537 dwellings in Stevensville, owner-occupied units account for 312 (58.1%), while renter-occupied units make up 225 (41.9%).
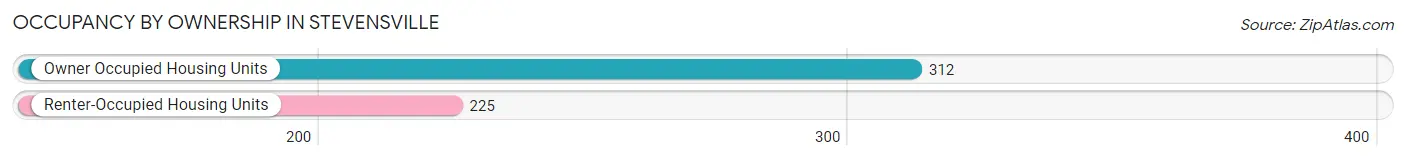
| Occupancy | # Housing Units | % Housing Units |
| Owner Occupied Housing Units | 312 | 58.1% |
| Renter-Occupied Housing Units | 225 | 41.9% |
| Total Occupied Housing Units | 537 | 100.0% |
Occupancy by Household Size in Stevensville
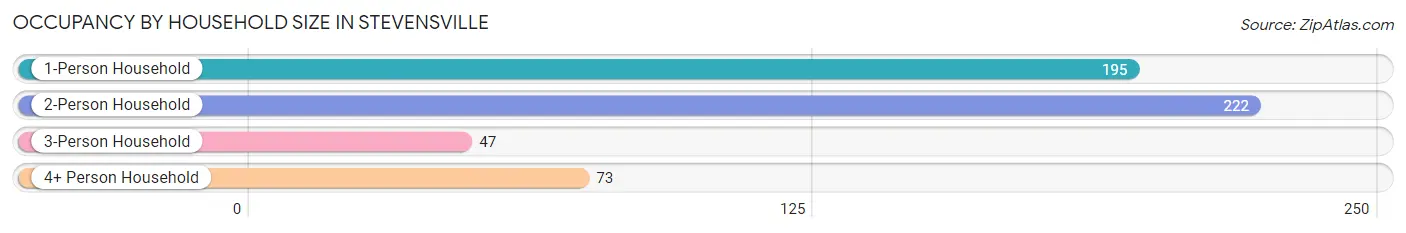
| Household Size | # Housing Units | % Housing Units |
| 1-Person Household | 195 | 36.3% |
| 2-Person Household | 222 | 41.3% |
| 3-Person Household | 47 | 8.7% |
| 4+ Person Household | 73 | 13.6% |
| Total Housing Units | 537 | 100.0% |
Occupancy by Ownership by Household Size in Stevensville
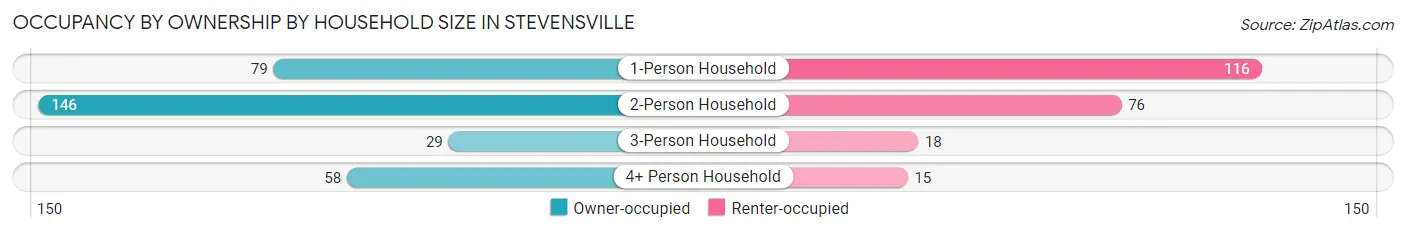
| Household Size | Owner-occupied | Renter-occupied |
| 1-Person Household | 79 (40.5%) | 116 (59.5%) |
| 2-Person Household | 146 (65.8%) | 76 (34.2%) |
| 3-Person Household | 29 (61.7%) | 18 (38.3%) |
| 4+ Person Household | 58 (79.4%) | 15 (20.5%) |
| Total Housing Units | 312 (58.1%) | 225 (41.9%) |
Occupancy by Educational Attainment in Stevensville
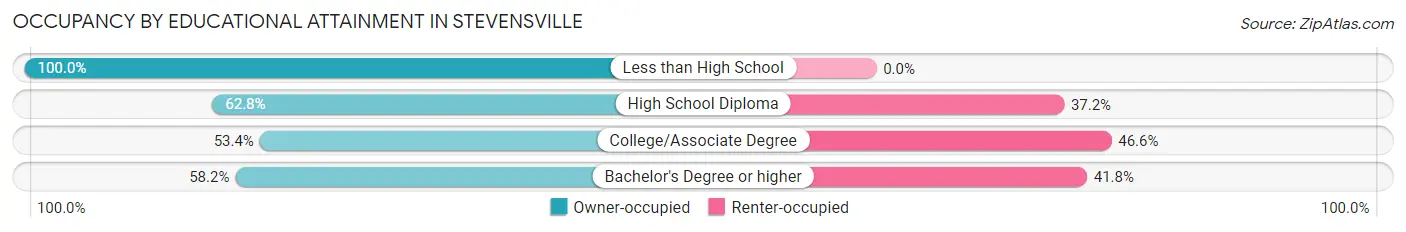
| Household Size | Owner-occupied | Renter-occupied |
| Less than High School | 9 (100.0%) | 0 (0.0%) |
| High School Diploma | 86 (62.8%) | 51 (37.2%) |
| College/Associate Degree | 118 (53.4%) | 103 (46.6%) |
| Bachelor's Degree or higher | 99 (58.2%) | 71 (41.8%) |
Occupancy by Age of Householder in Stevensville
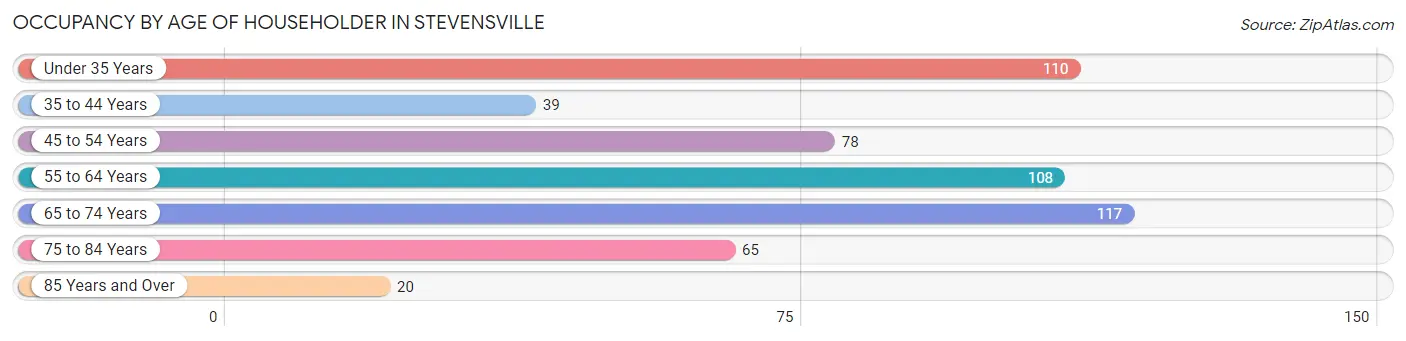
| Age Bracket | # Households | % Households |
| Under 35 Years | 110 | 20.5% |
| 35 to 44 Years | 39 | 7.3% |
| 45 to 54 Years | 78 | 14.5% |
| 55 to 64 Years | 108 | 20.1% |
| 65 to 74 Years | 117 | 21.8% |
| 75 to 84 Years | 65 | 12.1% |
| 85 Years and Over | 20 | 3.7% |
| Total | 537 | 100.0% |
Housing Finances in Stevensville
Median Income by Occupancy in Stevensville
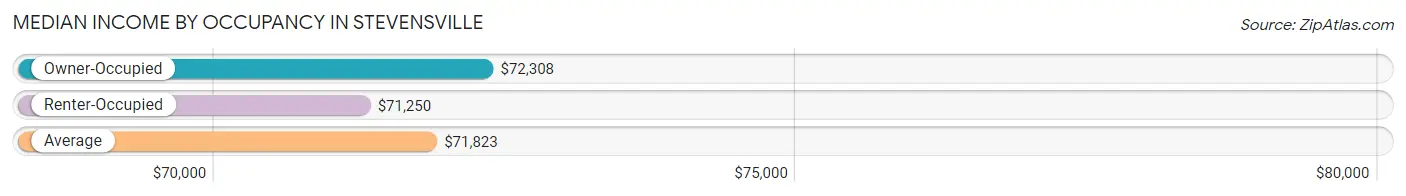
| Occupancy Type | # Households | Median Income |
| Owner-Occupied | 312 (58.1%) | $72,308 |
| Renter-Occupied | 225 (41.9%) | $71,250 |
| Average | 537 (100.0%) | $71,823 |
Occupancy by Householder Income Bracket in Stevensville
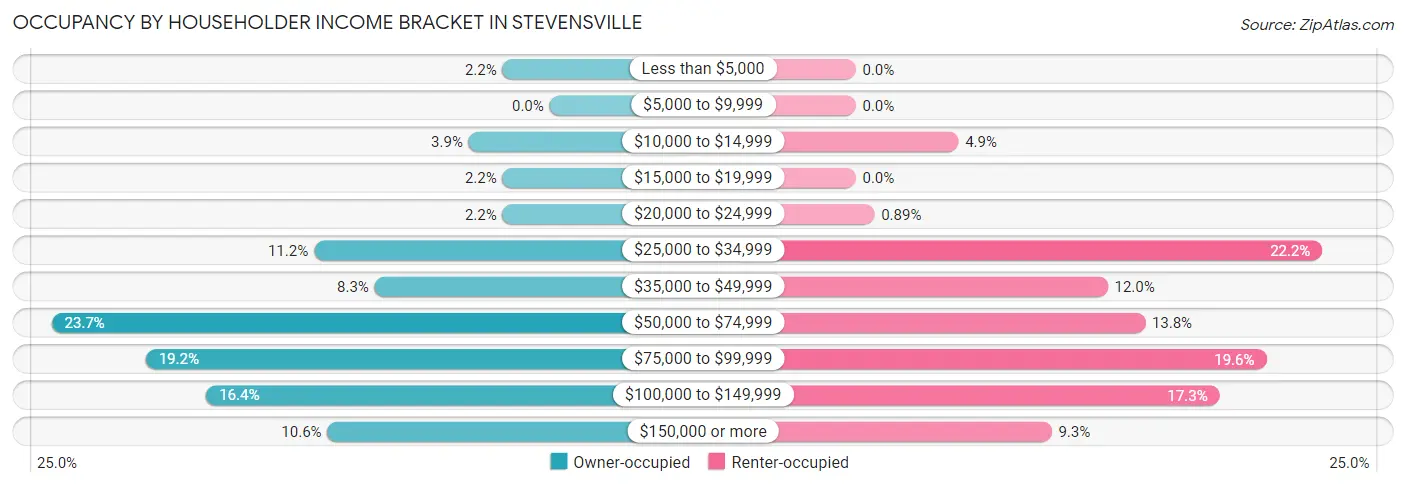
| Income Bracket | Owner-occupied | Renter-occupied |
| Less than $5,000 | 7 (2.2%) | 0 (0.0%) |
| $5,000 to $9,999 | 0 (0.0%) | 0 (0.0%) |
| $10,000 to $14,999 | 12 (3.8%) | 11 (4.9%) |
| $15,000 to $19,999 | 7 (2.2%) | 0 (0.0%) |
| $20,000 to $24,999 | 7 (2.2%) | 2 (0.9%) |
| $25,000 to $34,999 | 35 (11.2%) | 50 (22.2%) |
| $35,000 to $49,999 | 26 (8.3%) | 27 (12.0%) |
| $50,000 to $74,999 | 74 (23.7%) | 31 (13.8%) |
| $75,000 to $99,999 | 60 (19.2%) | 44 (19.6%) |
| $100,000 to $149,999 | 51 (16.4%) | 39 (17.3%) |
| $150,000 or more | 33 (10.6%) | 21 (9.3%) |
| Total | 312 (100.0%) | 225 (100.0%) |
Monthly Housing Cost Tiers in Stevensville
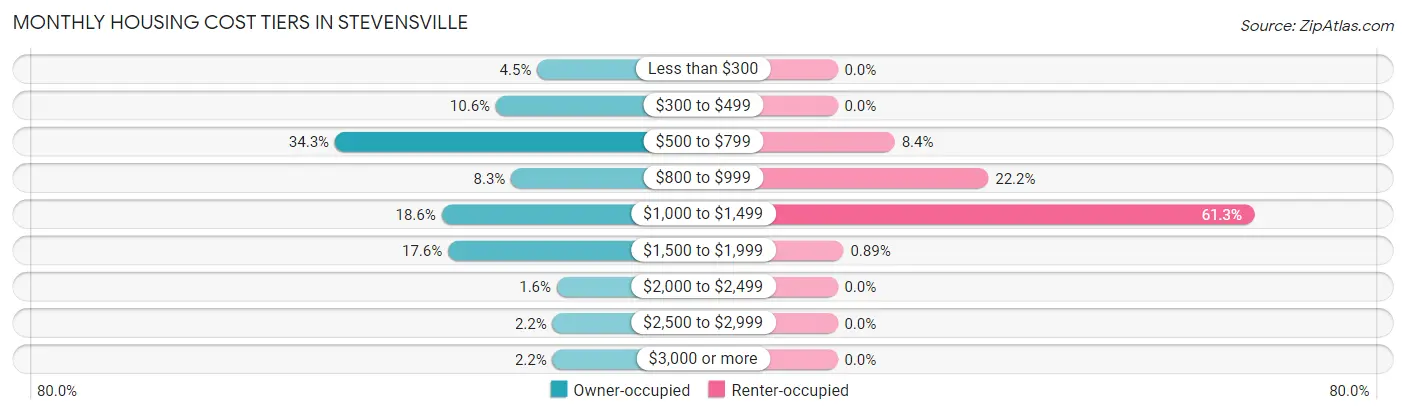
| Monthly Cost | Owner-occupied | Renter-occupied |
| Less than $300 | 14 (4.5%) | 0 (0.0%) |
| $300 to $499 | 33 (10.6%) | 0 (0.0%) |
| $500 to $799 | 107 (34.3%) | 19 (8.4%) |
| $800 to $999 | 26 (8.3%) | 50 (22.2%) |
| $1,000 to $1,499 | 58 (18.6%) | 138 (61.3%) |
| $1,500 to $1,999 | 55 (17.6%) | 2 (0.9%) |
| $2,000 to $2,499 | 5 (1.6%) | 0 (0.0%) |
| $2,500 to $2,999 | 7 (2.2%) | 0 (0.0%) |
| $3,000 or more | 7 (2.2%) | 0 (0.0%) |
| Total | 312 (100.0%) | 225 (100.0%) |
Physical Housing Characteristics in Stevensville
Housing Structures in Stevensville
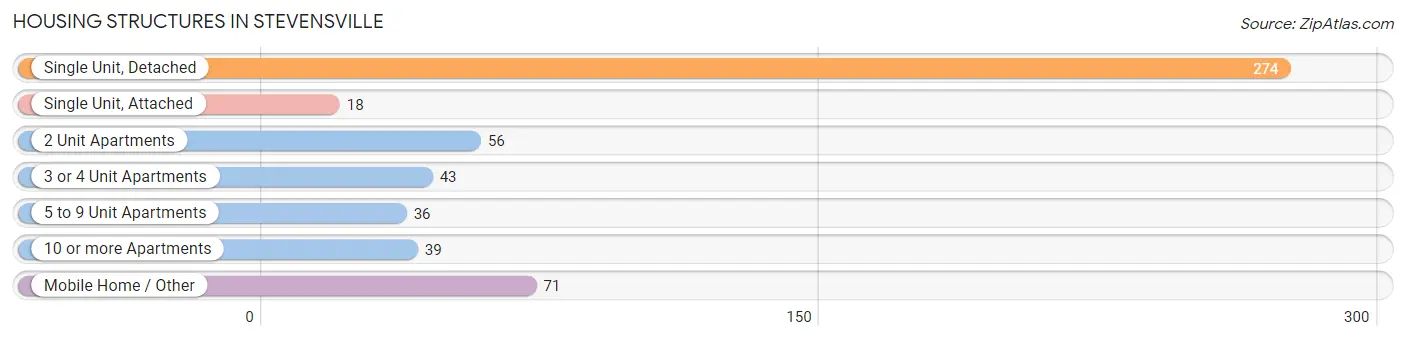
| Structure Type | # Housing Units | % Housing Units |
| Single Unit, Detached | 274 | 51.0% |
| Single Unit, Attached | 18 | 3.4% |
| 2 Unit Apartments | 56 | 10.4% |
| 3 or 4 Unit Apartments | 43 | 8.0% |
| 5 to 9 Unit Apartments | 36 | 6.7% |
| 10 or more Apartments | 39 | 7.3% |
| Mobile Home / Other | 71 | 13.2% |
| Total | 537 | 100.0% |
Housing Structures by Occupancy in Stevensville
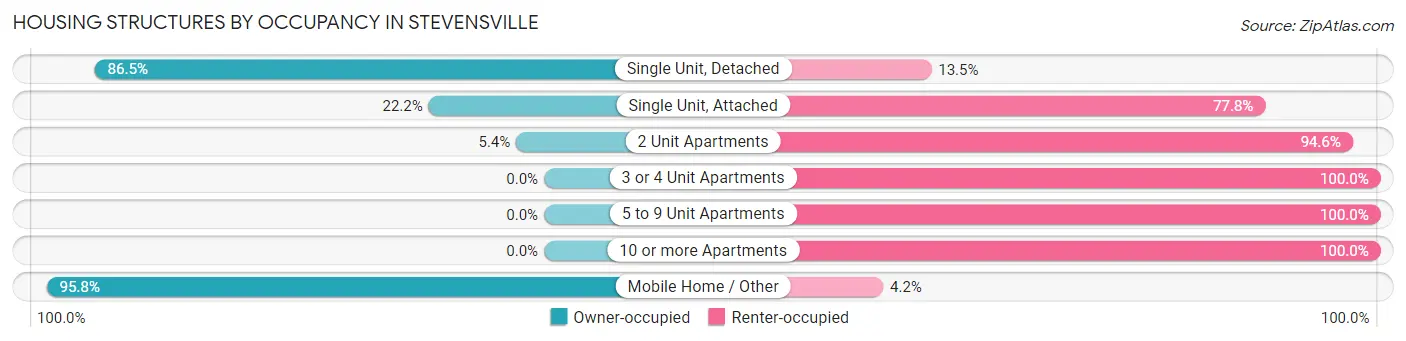
| Structure Type | Owner-occupied | Renter-occupied |
| Single Unit, Detached | 237 (86.5%) | 37 (13.5%) |
| Single Unit, Attached | 4 (22.2%) | 14 (77.8%) |
| 2 Unit Apartments | 3 (5.4%) | 53 (94.6%) |
| 3 or 4 Unit Apartments | 0 (0.0%) | 43 (100.0%) |
| 5 to 9 Unit Apartments | 0 (0.0%) | 36 (100.0%) |
| 10 or more Apartments | 0 (0.0%) | 39 (100.0%) |
| Mobile Home / Other | 68 (95.8%) | 3 (4.2%) |
| Total | 312 (58.1%) | 225 (41.9%) |
Housing Structures by Number of Rooms in Stevensville
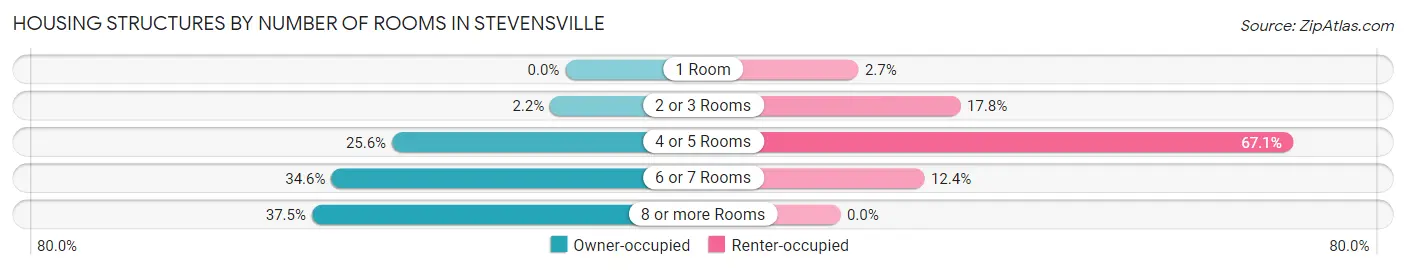
| Number of Rooms | Owner-occupied | Renter-occupied |
| 1 Room | 0 (0.0%) | 6 (2.7%) |
| 2 or 3 Rooms | 7 (2.2%) | 40 (17.8%) |
| 4 or 5 Rooms | 80 (25.6%) | 151 (67.1%) |
| 6 or 7 Rooms | 108 (34.6%) | 28 (12.4%) |
| 8 or more Rooms | 117 (37.5%) | 0 (0.0%) |
| Total | 312 (100.0%) | 225 (100.0%) |
Housing Structure by Heating Type in Stevensville
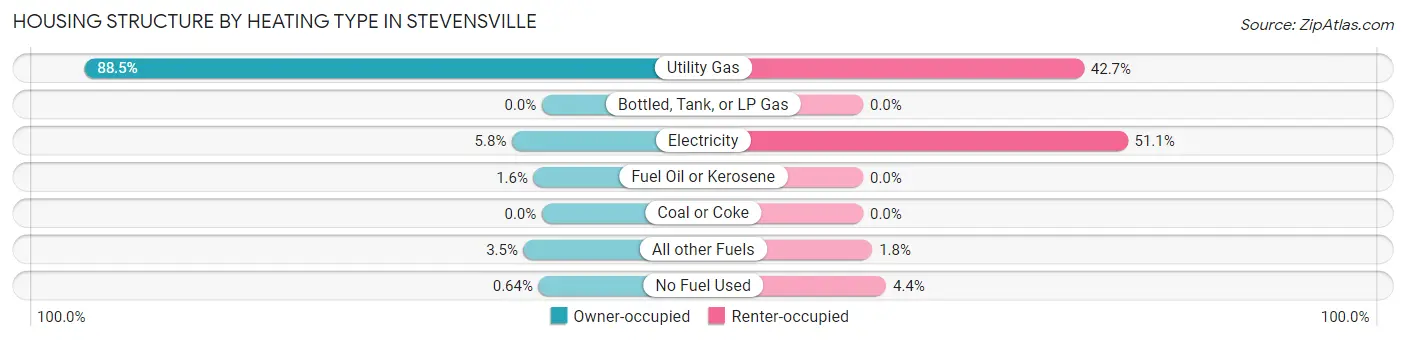
| Heating Type | Owner-occupied | Renter-occupied |
| Utility Gas | 276 (88.5%) | 96 (42.7%) |
| Bottled, Tank, or LP Gas | 0 (0.0%) | 0 (0.0%) |
| Electricity | 18 (5.8%) | 115 (51.1%) |
| Fuel Oil or Kerosene | 5 (1.6%) | 0 (0.0%) |
| Coal or Coke | 0 (0.0%) | 0 (0.0%) |
| All other Fuels | 11 (3.5%) | 4 (1.8%) |
| No Fuel Used | 2 (0.6%) | 10 (4.4%) |
| Total | 312 (100.0%) | 225 (100.0%) |
Household Vehicle Usage in Stevensville
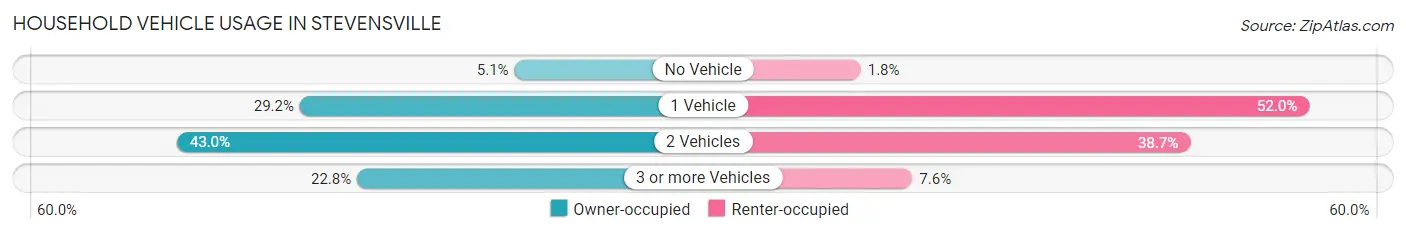
| Vehicles per Household | Owner-occupied | Renter-occupied |
| No Vehicle | 16 (5.1%) | 4 (1.8%) |
| 1 Vehicle | 91 (29.2%) | 117 (52.0%) |
| 2 Vehicles | 134 (42.9%) | 87 (38.7%) |
| 3 or more Vehicles | 71 (22.8%) | 17 (7.6%) |
| Total | 312 (100.0%) | 225 (100.0%) |
Real Estate & Mortgages in Stevensville
Real Estate and Mortgage Overview in Stevensville
| Characteristic | Without Mortgage | With Mortgage |
| Housing Units | 145 | 167 |
| Median Property Value | $151,600 | $219,600 |
| Median Household Income | $51,625 | $26 |
| Monthly Housing Costs | $573 | $7 |
| Real Estate Taxes | $1,881 | $6 |
Property Value by Mortgage Status in Stevensville
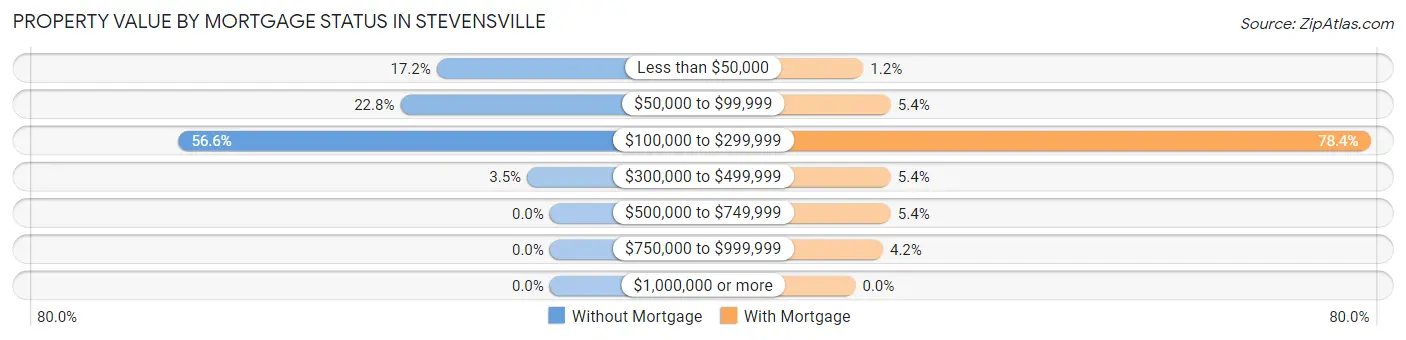
| Property Value | Without Mortgage | With Mortgage |
| Less than $50,000 | 25 (17.2%) | 2 (1.2%) |
| $50,000 to $99,999 | 33 (22.8%) | 9 (5.4%) |
| $100,000 to $299,999 | 82 (56.6%) | 131 (78.4%) |
| $300,000 to $499,999 | 5 (3.5%) | 9 (5.4%) |
| $500,000 to $749,999 | 0 (0.0%) | 9 (5.4%) |
| $750,000 to $999,999 | 0 (0.0%) | 7 (4.2%) |
| $1,000,000 or more | 0 (0.0%) | 0 (0.0%) |
| Total | 145 (100.0%) | 167 (100.0%) |
Household Income by Mortgage Status in Stevensville
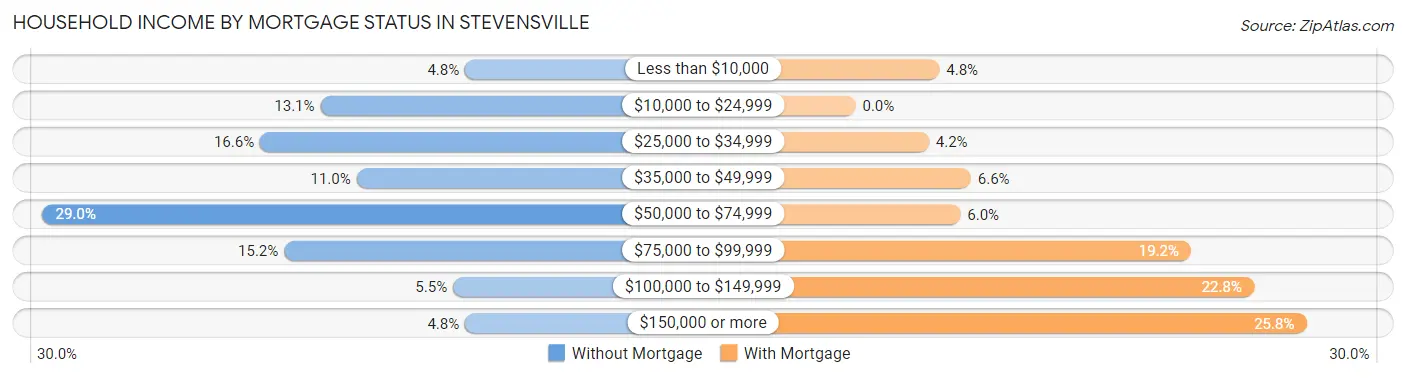
| Household Income | Without Mortgage | With Mortgage |
| Less than $10,000 | 7 (4.8%) | 8 (4.8%) |
| $10,000 to $24,999 | 19 (13.1%) | 0 (0.0%) |
| $25,000 to $34,999 | 24 (16.6%) | 7 (4.2%) |
| $35,000 to $49,999 | 16 (11.0%) | 11 (6.6%) |
| $50,000 to $74,999 | 42 (29.0%) | 10 (6.0%) |
| $75,000 to $99,999 | 22 (15.2%) | 32 (19.2%) |
| $100,000 to $149,999 | 8 (5.5%) | 38 (22.8%) |
| $150,000 or more | 7 (4.8%) | 43 (25.8%) |
| Total | 145 (100.0%) | 167 (100.0%) |
Property Value to Household Income Ratio in Stevensville
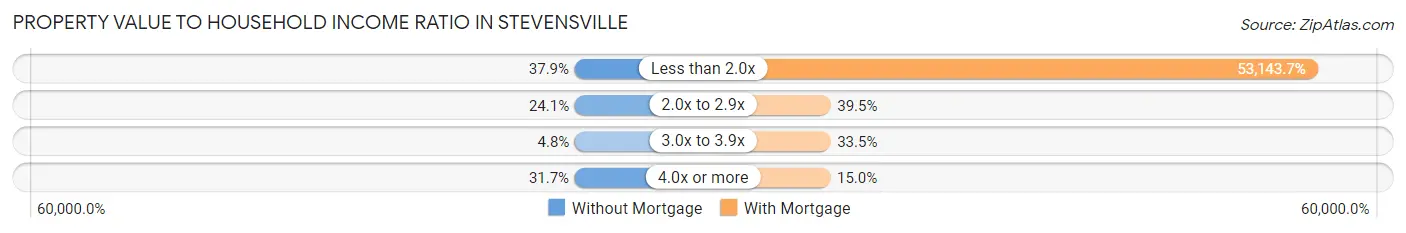
| Value-to-Income Ratio | Without Mortgage | With Mortgage |
| Less than 2.0x | 55 (37.9%) | 88,750 (53,143.7%) |
| 2.0x to 2.9x | 35 (24.1%) | 66 (39.5%) |
| 3.0x to 3.9x | 7 (4.8%) | 56 (33.5%) |
| 4.0x or more | 46 (31.7%) | 25 (15.0%) |
| Total | 145 (100.0%) | 167 (100.0%) |
Real Estate Taxes by Mortgage Status in Stevensville
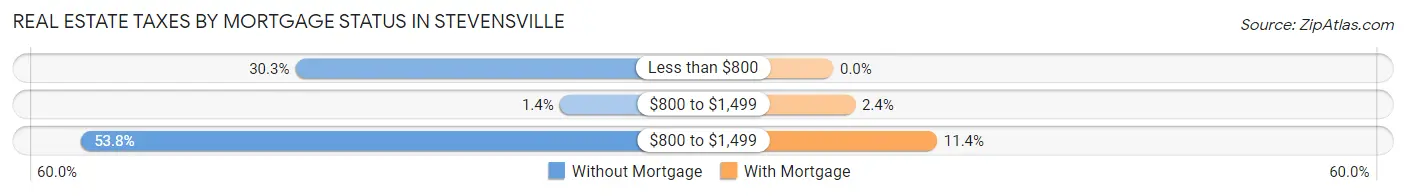
| Property Taxes | Without Mortgage | With Mortgage |
| Less than $800 | 44 (30.3%) | 0 (0.0%) |
| $800 to $1,499 | 2 (1.4%) | 4 (2.4%) |
| $800 to $1,499 | 78 (53.8%) | 19 (11.4%) |
| Total | 145 (100.0%) | 167 (100.0%) |
Health & Disability in Stevensville
Health Insurance Coverage by Age in Stevensville
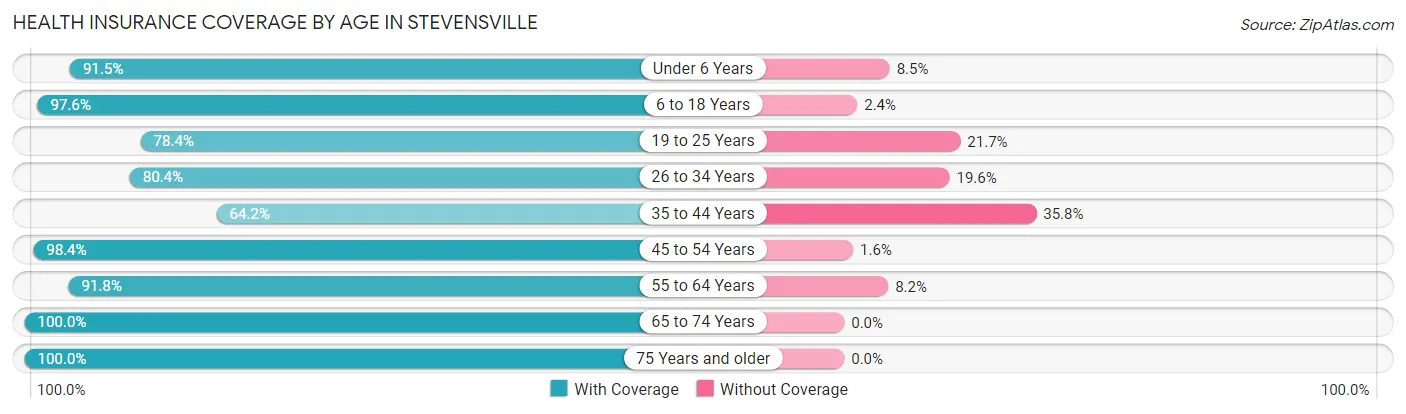
| Age Bracket | With Coverage | Without Coverage |
| Under 6 Years | 54 (91.5%) | 5 (8.5%) |
| 6 to 18 Years | 121 (97.6%) | 3 (2.4%) |
| 19 to 25 Years | 76 (78.3%) | 21 (21.6%) |
| 26 to 34 Years | 131 (80.4%) | 32 (19.6%) |
| 35 to 44 Years | 52 (64.2%) | 29 (35.8%) |
| 45 to 54 Years | 120 (98.4%) | 2 (1.6%) |
| 55 to 64 Years | 157 (91.8%) | 14 (8.2%) |
| 65 to 74 Years | 185 (100.0%) | 0 (0.0%) |
| 75 Years and older | 124 (100.0%) | 0 (0.0%) |
| Total | 1,020 (90.6%) | 106 (9.4%) |
Health Insurance Coverage by Citizenship Status in Stevensville
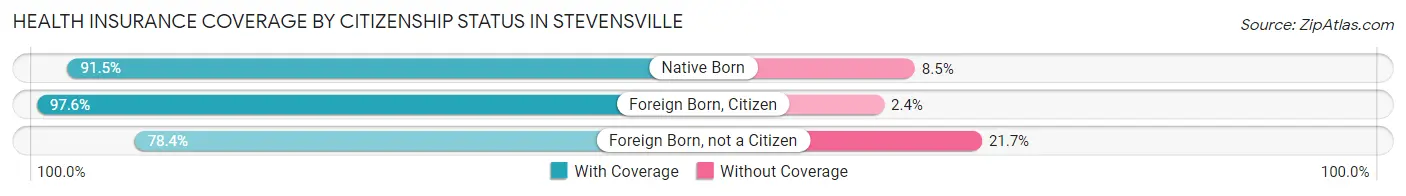
| Citizenship Status | With Coverage | Without Coverage |
| Native Born | 54 (91.5%) | 5 (8.5%) |
| Foreign Born, Citizen | 121 (97.6%) | 3 (2.4%) |
| Foreign Born, not a Citizen | 76 (78.3%) | 21 (21.6%) |
Health Insurance Coverage by Household Income in Stevensville
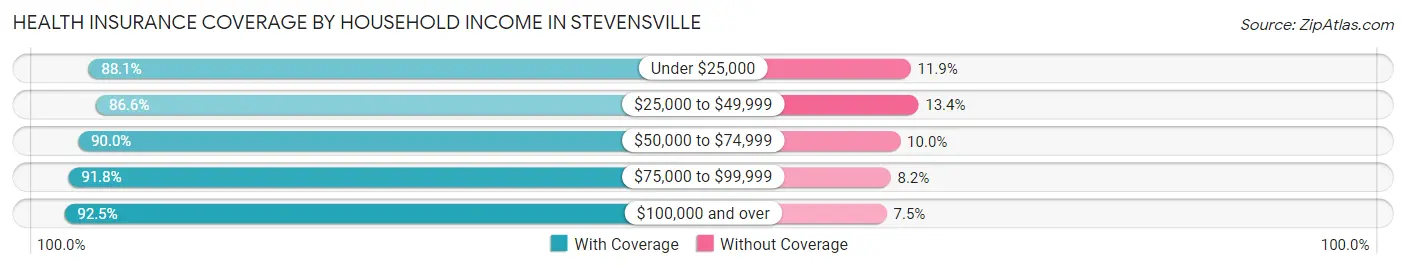
| Household Income | With Coverage | Without Coverage |
| Under $25,000 | 59 (88.1%) | 8 (11.9%) |
| $25,000 to $49,999 | 168 (86.6%) | 26 (13.4%) |
| $50,000 to $74,999 | 198 (90.0%) | 22 (10.0%) |
| $75,000 to $99,999 | 235 (91.8%) | 21 (8.2%) |
| $100,000 and over | 360 (92.5%) | 29 (7.5%) |
Public vs Private Health Insurance Coverage by Age in Stevensville
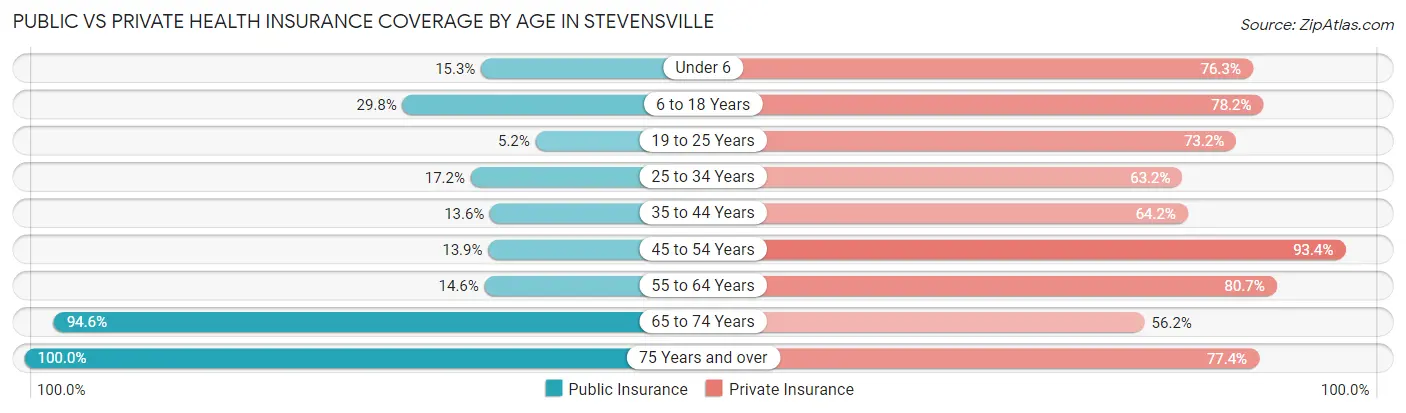
| Age Bracket | Public Insurance | Private Insurance |
| Under 6 | 9 (15.2%) | 45 (76.3%) |
| 6 to 18 Years | 37 (29.8%) | 97 (78.2%) |
| 19 to 25 Years | 5 (5.1%) | 71 (73.2%) |
| 25 to 34 Years | 28 (17.2%) | 103 (63.2%) |
| 35 to 44 Years | 11 (13.6%) | 52 (64.2%) |
| 45 to 54 Years | 17 (13.9%) | 114 (93.4%) |
| 55 to 64 Years | 25 (14.6%) | 138 (80.7%) |
| 65 to 74 Years | 175 (94.6%) | 104 (56.2%) |
| 75 Years and over | 124 (100.0%) | 96 (77.4%) |
| Total | 431 (38.3%) | 820 (72.8%) |
Disability Status by Sex by Age in Stevensville
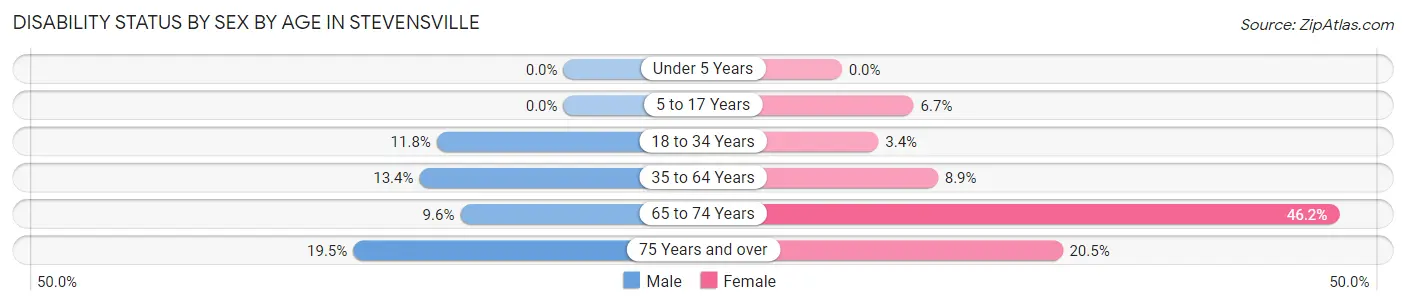
| Age Bracket | Male | Female |
| Under 5 Years | 0 (0.0%) | 0 (0.0%) |
| 5 to 17 Years | 0 (0.0%) | 4 (6.7%) |
| 18 to 34 Years | 20 (11.8%) | 4 (3.4%) |
| 35 to 64 Years | 23 (13.4%) | 18 (8.9%) |
| 65 to 74 Years | 9 (9.6%) | 42 (46.2%) |
| 75 Years and over | 8 (19.5%) | 17 (20.5%) |
Disability Class by Sex by Age in Stevensville
Disability Class: Hearing Difficulty
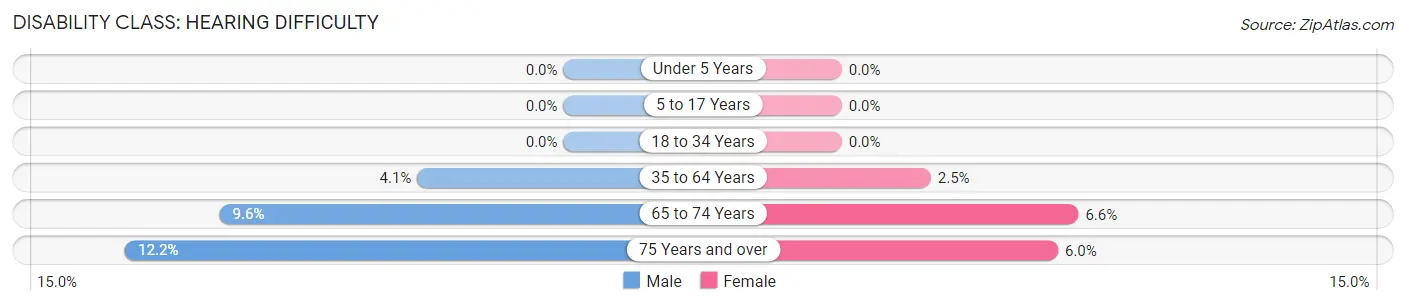
| Age Bracket | Male | Female |
| Under 5 Years | 0 (0.0%) | 0 (0.0%) |
| 5 to 17 Years | 0 (0.0%) | 0 (0.0%) |
| 18 to 34 Years | 0 (0.0%) | 0 (0.0%) |
| 35 to 64 Years | 7 (4.1%) | 5 (2.5%) |
| 65 to 74 Years | 9 (9.6%) | 6 (6.6%) |
| 75 Years and over | 5 (12.2%) | 5 (6.0%) |
Disability Class: Vision Difficulty
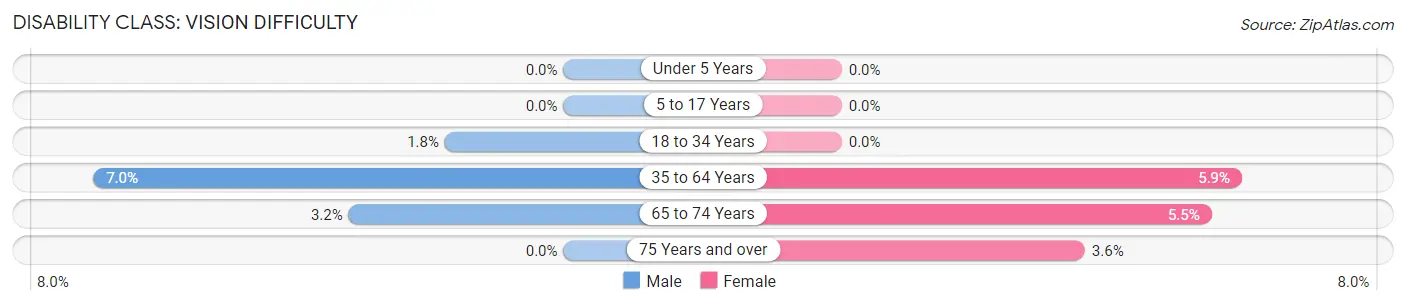
| Age Bracket | Male | Female |
| Under 5 Years | 0 (0.0%) | 0 (0.0%) |
| 5 to 17 Years | 0 (0.0%) | 0 (0.0%) |
| 18 to 34 Years | 3 (1.8%) | 0 (0.0%) |
| 35 to 64 Years | 12 (7.0%) | 12 (5.9%) |
| 65 to 74 Years | 3 (3.2%) | 5 (5.5%) |
| 75 Years and over | 0 (0.0%) | 3 (3.6%) |
Disability Class: Cognitive Difficulty
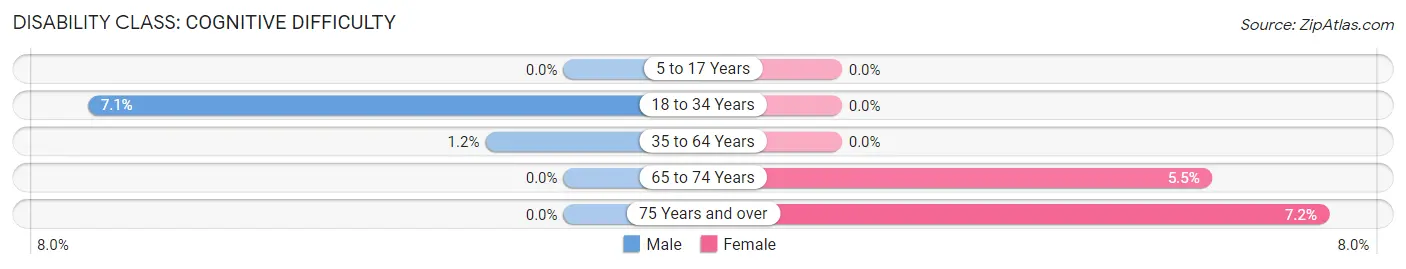
| Age Bracket | Male | Female |
| 5 to 17 Years | 0 (0.0%) | 0 (0.0%) |
| 18 to 34 Years | 12 (7.1%) | 0 (0.0%) |
| 35 to 64 Years | 2 (1.2%) | 0 (0.0%) |
| 65 to 74 Years | 0 (0.0%) | 5 (5.5%) |
| 75 Years and over | 0 (0.0%) | 6 (7.2%) |
Disability Class: Ambulatory Difficulty
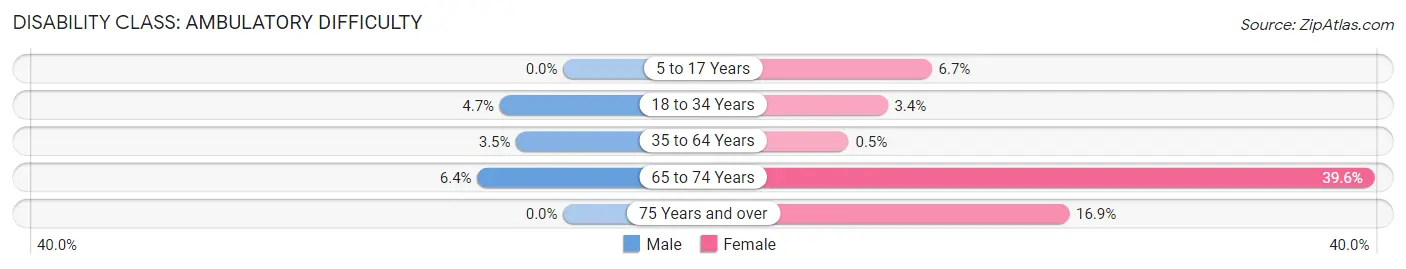
| Age Bracket | Male | Female |
| 5 to 17 Years | 0 (0.0%) | 4 (6.7%) |
| 18 to 34 Years | 8 (4.7%) | 4 (3.4%) |
| 35 to 64 Years | 6 (3.5%) | 1 (0.5%) |
| 65 to 74 Years | 6 (6.4%) | 36 (39.6%) |
| 75 Years and over | 0 (0.0%) | 14 (16.9%) |
Disability Class: Self-Care Difficulty
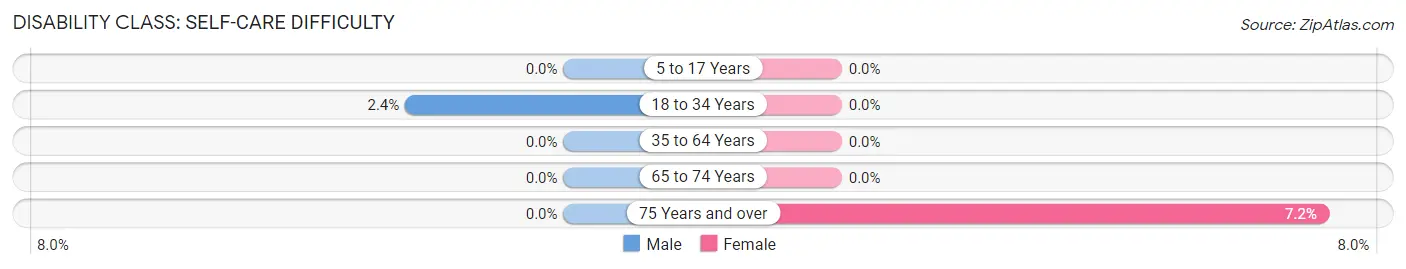
| Age Bracket | Male | Female |
| 5 to 17 Years | 0 (0.0%) | 0 (0.0%) |
| 18 to 34 Years | 4 (2.4%) | 0 (0.0%) |
| 35 to 64 Years | 0 (0.0%) | 0 (0.0%) |
| 65 to 74 Years | 0 (0.0%) | 0 (0.0%) |
| 75 Years and over | 0 (0.0%) | 6 (7.2%) |
Technology Access in Stevensville
Computing Device Access in Stevensville
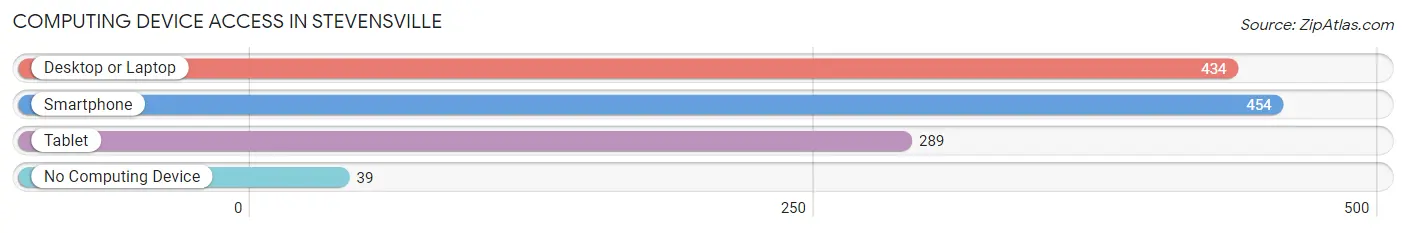
| Device Type | # Households | % Households |
| Desktop or Laptop | 434 | 80.8% |
| Smartphone | 454 | 84.5% |
| Tablet | 289 | 53.8% |
| No Computing Device | 39 | 7.3% |
| Total | 537 | 100.0% |
Internet Access in Stevensville
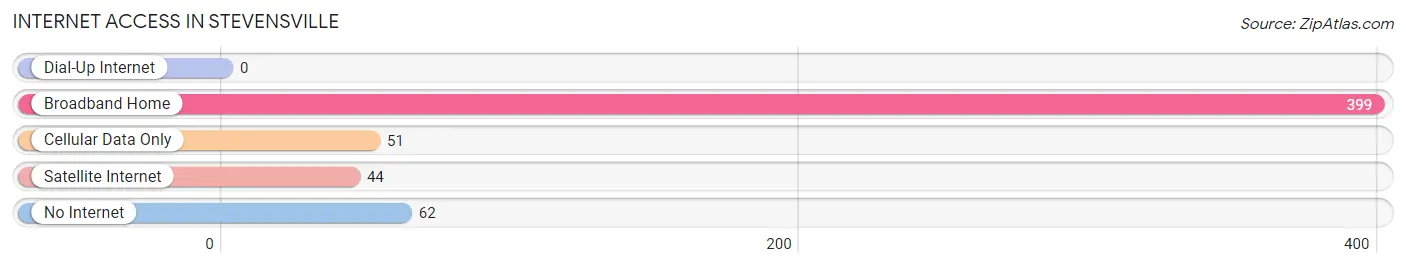
| Internet Type | # Households | % Households |
| Dial-Up Internet | 0 | 0.0% |
| Broadband Home | 399 | 74.3% |
| Cellular Data Only | 51 | 9.5% |
| Satellite Internet | 44 | 8.2% |
| No Internet | 62 | 11.6% |
| Total | 537 | 100.0% |
Stevensville Summary
Stevensville, Michigan is a small village located in the southwestern corner of Berrien County, Michigan. It is situated on the banks of the St. Joseph River, which flows into Lake Michigan. The village is located approximately 10 miles east of the city of Benton Harbor and is part of the Benton Harbor-St. Joseph Metropolitan Statistical Area. As of the 2010 census, the population of Stevensville was 2,686.
History
The area that is now Stevensville was first settled in the early 1800s by a group of French-Canadian fur traders. The village was originally known as “L’Arbre Croche”, which is French for “The Crooked Tree”. The name was changed to Stevensville in 1837, in honor of the first postmaster, William Stevens.
In 1839, the first schoolhouse was built in the village. The first church was built in 1845, and the first newspaper, the Stevensville Gazette, was established in 1848.
The village was incorporated in 1867, and the first mayor was elected in 1868. The first bank was established in 1871, and the first telephone line was installed in 1883.
Geography
Stevensville is located at 42°06'N 86°20'W (42.10, -86.33). According to the United States Census Bureau, the village has a total area of 1.3 square miles (3.4 km2), all of it land.
The village is located on the banks of the St. Joseph River, which flows into Lake Michigan. The village is located approximately 10 miles east of the city of Benton Harbor and is part of the Benton Harbor-St. Joseph Metropolitan Statistical Area.
Economy
The economy of Stevensville is largely based on agriculture and tourism. The village is home to several wineries, including Lemon Creek Winery and Tabor Hill Winery. The village is also home to several small businesses, including restaurants, retail stores, and professional services.
Demographics
As of the 2010 census, there were 2,686 people, 1,093 households, and 717 families residing in the village. The population density was 2,068.2 people per square mile (798.3/km2). There were 1,183 housing units at an average density of 902.3 per square mile (348.7/km2). The racial makeup of the village was 94.2% White, 1.2% African American, 0.4% Native American, 0.7% Asian, 0.1% Pacific Islander, 1.3% from other races, and 2.1% from two or more races. Hispanic or Latino of any race were 4.2% of the population.
There were 1,093 households, out of which 28.2% had children under the age of 18 living with them, 51.2% were married couples living together, 11.2% had a female householder with no husband present, and 33.2% were non-families. 28.2% of all households were made up of individuals, and 12.2% had someone living alone who was 65 years of age or older. The average household size was 2.45 and the average family size was 3.00.
In the village, the population was spread out, with 24.2% under the age of 18, 7.2% from 18 to 24, 25.7% from 25 to 44, 25.7% from 45 to 64, and 17.2% who were 65 years of age or older. The median age was 40 years. For every 100 females, there were 91.2 males. For every 100 females age 18 and over, there were 87.2 males.
The median income for a household in the village was $41,964, and the median income for a family was $50,000. Males had a median income of $37,500 versus $25,000 for females. The per capita income for the village was $20,945. About 5.2% of families and 8.2% of the population were below the poverty line, including 10.2% of those under age 18 and 6.2% of those age 65 or over.
Common Questions
What is Per Capita Income in Stevensville?
Per Capita income in Stevensville is $45,792.
What is the Median Family Income in Stevensville?
Median Family Income in Stevensville is $87,500.
What is the Median Household income in Stevensville?
Median Household Income in Stevensville is $71,823.
What is Income or Wage Gap in Stevensville?
Income or Wage Gap in Stevensville is 41.4%.
Women in Stevensville earn 58.6 cents for every dollar earned by a man.
What is Family Income Deficit in Stevensville?
Family Income Deficit in Stevensville is $5,338.
Families that are below poverty line in Stevensville earn $5,338 less on average than the poverty threshold level.
What is Inequality or Gini Index in Stevensville?
Inequality or Gini Index in Stevensville is 0.46.
What is the Total Population of Stevensville?
Total Population of Stevensville is 1,126.
What is the Total Male Population of Stevensville?
Total Male Population of Stevensville is 537.
What is the Total Female Population of Stevensville?
Total Female Population of Stevensville is 589.
What is the Ratio of Males per 100 Females in Stevensville?
There are 91.17 Males per 100 Females in Stevensville.
What is the Ratio of Females per 100 Males in Stevensville?
There are 109.68 Females per 100 Males in Stevensville.
What is the Median Population Age in Stevensville?
Median Population Age in Stevensville is 50.5 Years.
What is the Average Family Size in Stevensville
Average Family Size in Stevensville is 2.8 People.
What is the Average Household Size in Stevensville
Average Household Size in Stevensville is 2.1 People.
How Large is the Labor Force in Stevensville?
There are 628 People in the Labor Forcein in Stevensville.
What is the Percentage of People in the Labor Force in Stevensville?
63.7% of People are in the Labor Force in Stevensville.
What is the Unemployment Rate in Stevensville?
Unemployment Rate in Stevensville is 3.8%.