Stephenson, MI Map & Demographics
Stephenson Map
Stephenson Overview
$24,286
PER CAPITA INCOME
$54,583
AVG FAMILY INCOME
$52,740
AVG HOUSEHOLD INCOME
53.9%
WAGE / INCOME GAP [ % ]
46.1¢/ $1
WAGE / INCOME GAP [ $ ]
$5,391
FAMILY INCOME DEFICIT
0.37
INEQUALITY / GINI INDEX
933
TOTAL POPULATION
483
MALE POPULATION
450
FEMALE POPULATION
107.33
MALES / 100 FEMALES
93.17
FEMALES / 100 MALES
37.9
MEDIAN AGE
3.2
AVG FAMILY SIZE
2.5
AVG HOUSEHOLD SIZE
400
LABOR FORCE [ PEOPLE ]
55.4%
PERCENT IN LABOR FORCE
2.0%
UNEMPLOYMENT RATE
Stephenson Zip Codes
Stephenson Area Codes
Income in Stephenson
Income Overview in Stephenson
Per Capita Income in Stephenson is $24,286, while median incomes of families and households are $54,583 and $52,740 respectively.
| Characteristic | Number | Measure |
| Per Capita Income | 933 | $24,286 |
| Median Family Income | 209 | $54,583 |
| Mean Family Income | 209 | $62,675 |
| Median Household Income | 343 | $52,740 |
| Mean Household Income | 343 | $59,172 |
| Income Deficit | 209 | $5,391 |
| Wage / Income Gap (%) | 933 | 53.87% |
| Wage / Income Gap ($) | 933 | 46.13¢ per $1 |
| Gini / Inequality Index | 933 | 0.37 |
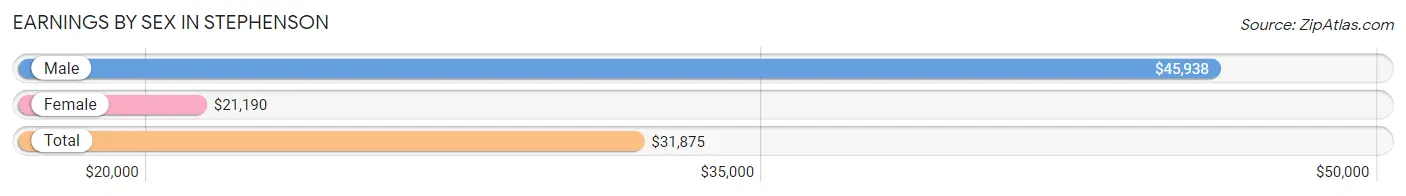
Earnings by Sex in Stephenson
Average Earnings in Stephenson are $31,875, $45,938 for men and $21,190 for women, a difference of 53.9%.
| Sex | Number | Average Earnings |
| Male | 225 (55.0%) | $45,938 |
| Female | 184 (45.0%) | $21,190 |
| Total | 409 (100.0%) | $31,875 |
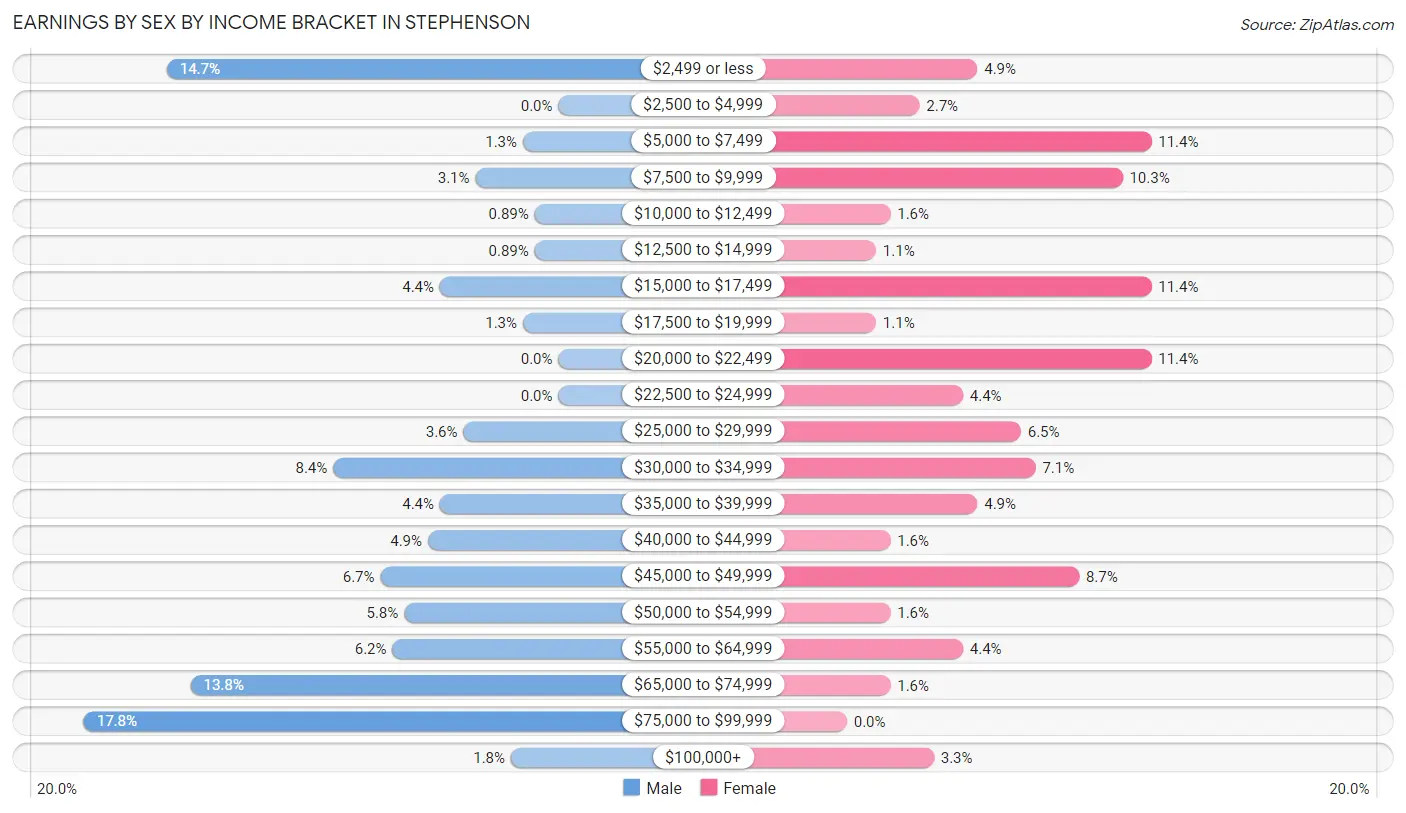
Earnings by Sex by Income Bracket in Stephenson
The most common earnings brackets in Stephenson are $75,000 to $99,999 for men (40 | 17.8%) and $5,000 to $7,499 for women (21 | 11.4%).
| Income | Male | Female |
| $2,499 or less | 33 (14.7%) | 9 (4.9%) |
| $2,500 to $4,999 | 0 (0.0%) | 5 (2.7%) |
| $5,000 to $7,499 | 3 (1.3%) | 21 (11.4%) |
| $7,500 to $9,999 | 7 (3.1%) | 19 (10.3%) |
| $10,000 to $12,499 | 2 (0.9%) | 3 (1.6%) |
| $12,500 to $14,999 | 2 (0.9%) | 2 (1.1%) |
| $15,000 to $17,499 | 10 (4.4%) | 21 (11.4%) |
| $17,500 to $19,999 | 3 (1.3%) | 2 (1.1%) |
| $20,000 to $22,499 | 0 (0.0%) | 21 (11.4%) |
| $22,500 to $24,999 | 0 (0.0%) | 8 (4.3%) |
| $25,000 to $29,999 | 8 (3.6%) | 12 (6.5%) |
| $30,000 to $34,999 | 19 (8.4%) | 13 (7.1%) |
| $35,000 to $39,999 | 10 (4.4%) | 9 (4.9%) |
| $40,000 to $44,999 | 11 (4.9%) | 3 (1.6%) |
| $45,000 to $49,999 | 15 (6.7%) | 16 (8.7%) |
| $50,000 to $54,999 | 13 (5.8%) | 3 (1.6%) |
| $55,000 to $64,999 | 14 (6.2%) | 8 (4.3%) |
| $65,000 to $74,999 | 31 (13.8%) | 3 (1.6%) |
| $75,000 to $99,999 | 40 (17.8%) | 0 (0.0%) |
| $100,000+ | 4 (1.8%) | 6 (3.3%) |
| Total | 225 (100.0%) | 184 (100.0%) |
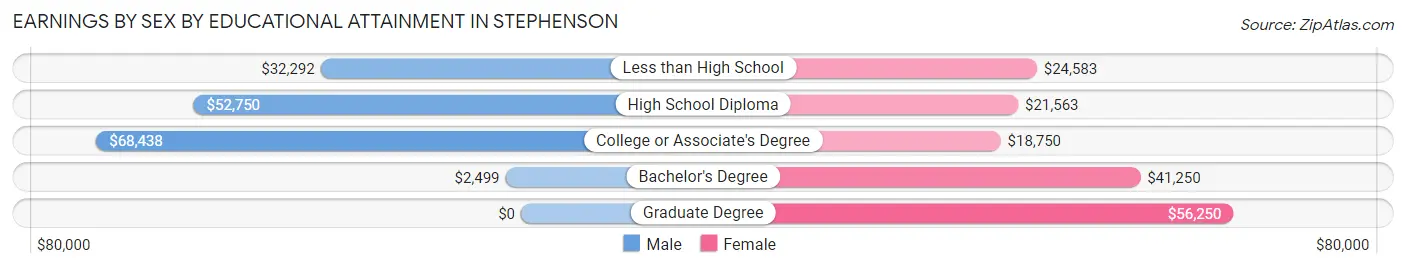
Earnings by Sex by Educational Attainment in Stephenson
Average earnings in Stephenson are $50,625 for men and $22,500 for women, a difference of 55.6%. Men with an educational attainment of college or associate's degree enjoy the highest average annual earnings of $68,438, while those with bachelor's degree education earn the least with $2,499. Women with an educational attainment of graduate degree earn the most with the average annual earnings of $56,250, while those with college or associate's degree education have the smallest earnings of $18,750.
| Educational Attainment | Male Income | Female Income |
| Less than High School | $32,292 | $24,583 |
| High School Diploma | $52,750 | $21,563 |
| College or Associate's Degree | $68,438 | $18,750 |
| Bachelor's Degree | $2,499 | $41,250 |
| Graduate Degree | - | - |
| Total | $50,625 | $22,500 |
Family Income in Stephenson
Family Income Brackets in Stephenson
According to the Stephenson family income data, there are 49 families falling into the $50,000 to $74,999 income range, which is the most common income bracket and makes up 23.4% of all families.
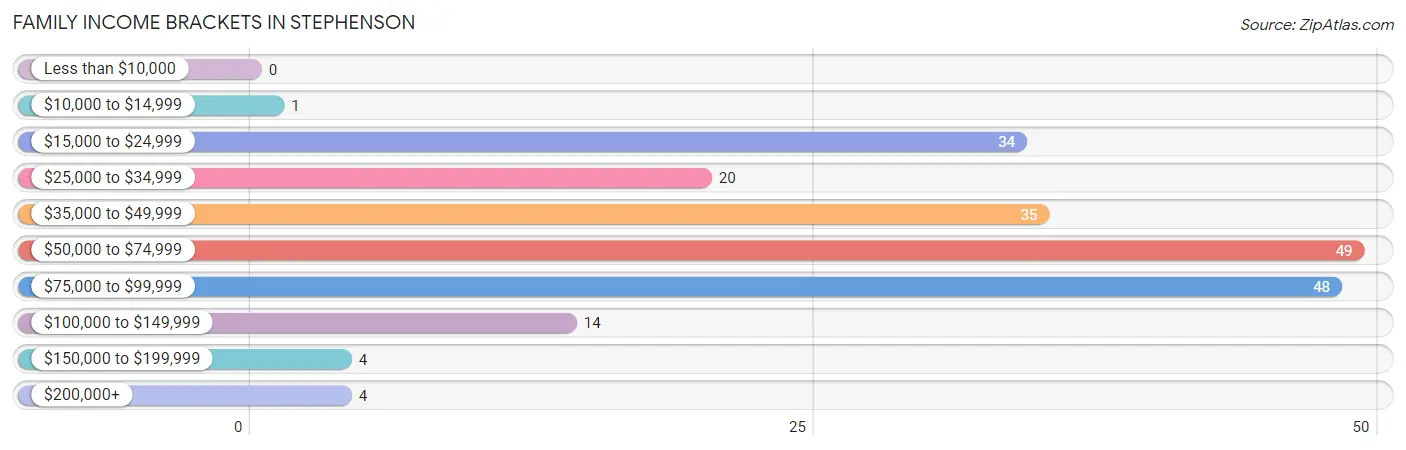
| Income Bracket | # Families | % Families |
| Less than $10,000 | 0 | 0.0% |
| $10,000 to $14,999 | 1 | 0.5% |
| $15,000 to $24,999 | 34 | 16.3% |
| $25,000 to $34,999 | 20 | 9.6% |
| $35,000 to $49,999 | 35 | 16.7% |
| $50,000 to $74,999 | 49 | 23.4% |
| $75,000 to $99,999 | 48 | 23.0% |
| $100,000 to $149,999 | 14 | 6.7% |
| $150,000 to $199,999 | 4 | 1.9% |
| $200,000+ | 4 | 1.9% |
Family Income by Famaliy Size in Stephenson
5-person families (13 | 6.2%) account for the highest median family income in Stephenson with $87,679 per family, while 2-person families (117 | 56.0%) have the highest median income of $26,875 per family member.
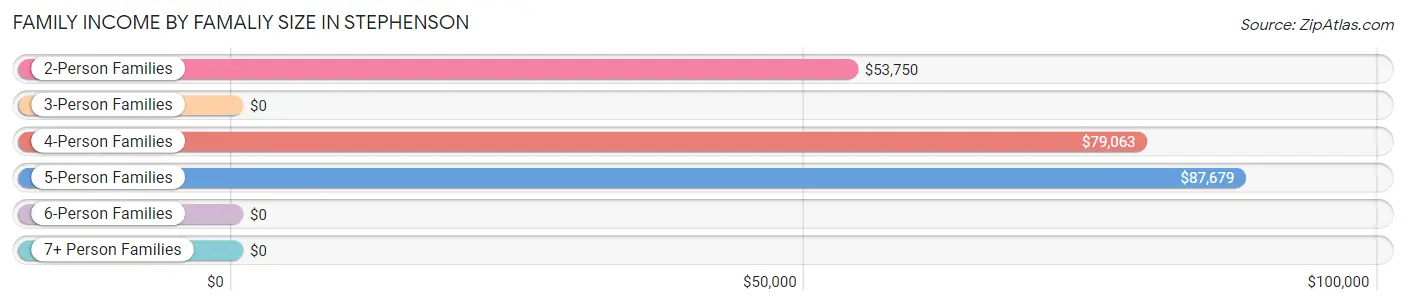
| Income Bracket | # Families | Median Income |
| 2-Person Families | 117 (56.0%) | $53,750 |
| 3-Person Families | 38 (18.2%) | $0 |
| 4-Person Families | 34 (16.3%) | $79,063 |
| 5-Person Families | 13 (6.2%) | $87,679 |
| 6-Person Families | 5 (2.4%) | $0 |
| 7+ Person Families | 2 (1.0%) | $0 |
| Total | 209 (100.0%) | $54,583 |
Family Income by Number of Earners in Stephenson
The median family income in Stephenson is $54,583, with families comprising 3+ earners (11) having the highest median family income of $79,792, while families with 1 earner (72) have the lowest median family income of $31,563, accounting for 5.3% and 34.4% of families, respectively.
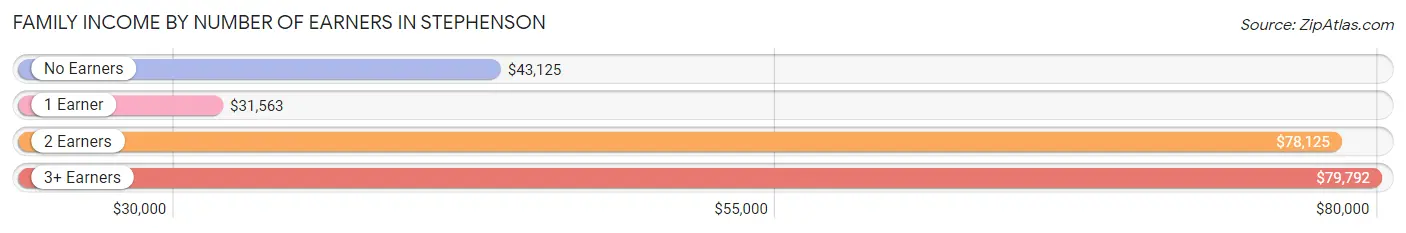
| Number of Earners | # Families | Median Income |
| No Earners | 53 (25.4%) | $43,125 |
| 1 Earner | 72 (34.4%) | $31,563 |
| 2 Earners | 73 (34.9%) | $78,125 |
| 3+ Earners | 11 (5.3%) | $79,792 |
| Total | 209 (100.0%) | $54,583 |
Household Income in Stephenson
Household Income Brackets in Stephenson
With 74 households falling in the category, the $50,000 to $74,999 income range is the most frequent in Stephenson, accounting for 21.6% of all households. In contrast, only 4 households (1.2%) fall into the $200,000+ income bracket, making it the least populous group.
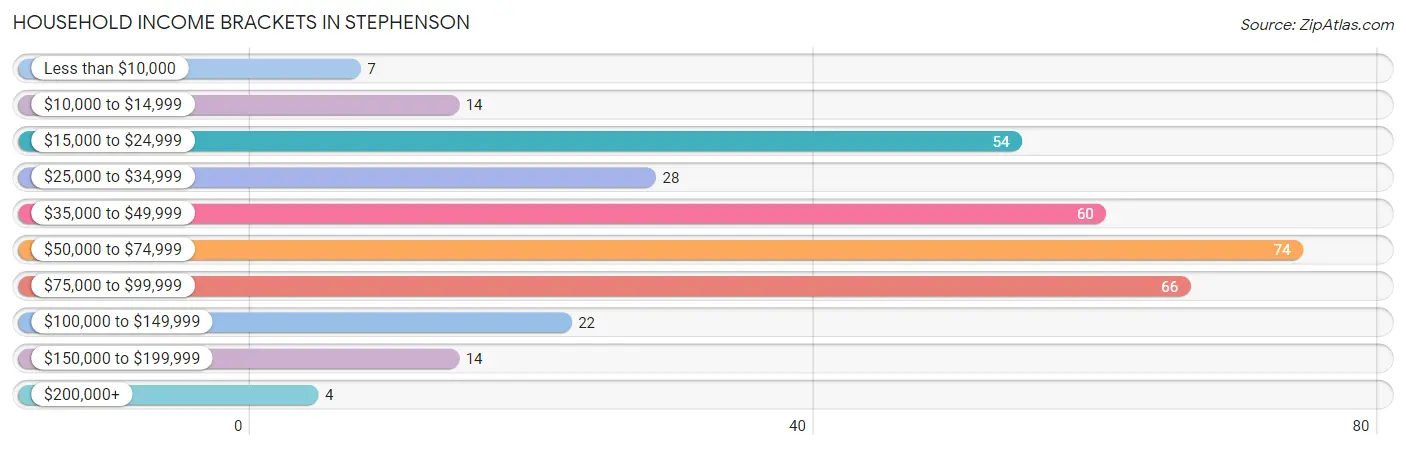
| Income Bracket | # Households | % Households |
| Less than $10,000 | 7 | 2.0% |
| $10,000 to $14,999 | 14 | 4.1% |
| $15,000 to $24,999 | 54 | 15.7% |
| $25,000 to $34,999 | 28 | 8.2% |
| $35,000 to $49,999 | 60 | 17.5% |
| $50,000 to $74,999 | 74 | 21.6% |
| $75,000 to $99,999 | 66 | 19.2% |
| $100,000 to $149,999 | 22 | 6.4% |
| $150,000 to $199,999 | 14 | 4.1% |
| $200,000+ | 4 | 1.2% |
Household Income by Householder Age in Stephenson
The median household income in Stephenson is $52,740, with the highest median household income of $63,906 found in the 25 to 44 years age bracket for the primary householder. A total of 139 households (40.5%) fall into this category. Meanwhile, the 65+ years age bracket for the primary householder has the lowest median household income of $38,333, with 116 households (33.8%) in this group.
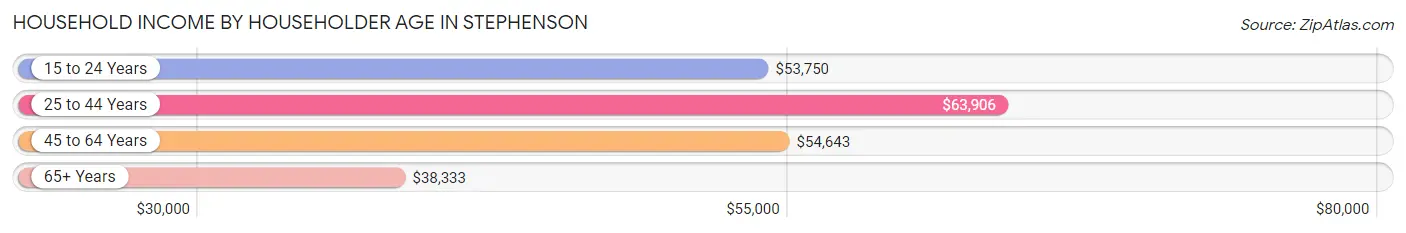
| Income Bracket | # Households | Median Income |
| 15 to 24 Years | 10 (2.9%) | $53,750 |
| 25 to 44 Years | 139 (40.5%) | $63,906 |
| 45 to 64 Years | 78 (22.7%) | $54,643 |
| 65+ Years | 116 (33.8%) | $38,333 |
| Total | 343 (100.0%) | $52,740 |
Poverty in Stephenson
Income Below Poverty by Sex and Age in Stephenson
With 15.7% poverty level for males and 19.2% for females among the residents of Stephenson, 6 to 11 year old males and 15 year old females are the most vulnerable to poverty, with 32 males (84.2%) and 11 females (68.8%) in their respective age groups living below the poverty level.
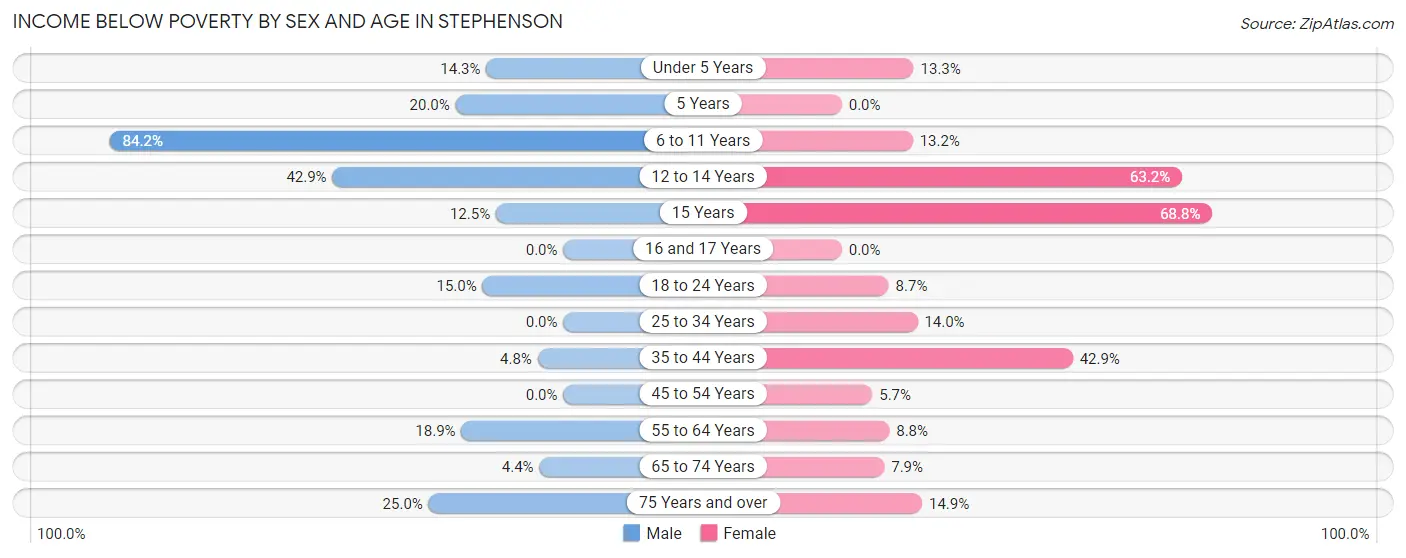
| Age Bracket | Male | Female |
| Under 5 Years | 3 (14.3%) | 4 (13.3%) |
| 5 Years | 2 (20.0%) | 0 (0.0%) |
| 6 to 11 Years | 32 (84.2%) | 5 (13.2%) |
| 12 to 14 Years | 9 (42.9%) | 12 (63.2%) |
| 15 Years | 2 (12.5%) | 11 (68.8%) |
| 16 and 17 Years | 0 (0.0%) | 0 (0.0%) |
| 18 to 24 Years | 3 (15.0%) | 2 (8.7%) |
| 25 to 34 Years | 0 (0.0%) | 8 (14.0%) |
| 35 to 44 Years | 3 (4.8%) | 21 (42.9%) |
| 45 to 54 Years | 0 (0.0%) | 3 (5.7%) |
| 55 to 64 Years | 7 (18.9%) | 3 (8.8%) |
| 65 to 74 Years | 2 (4.4%) | 3 (7.9%) |
| 75 Years and over | 10 (25.0%) | 7 (14.9%) |
| Total | 73 (15.7%) | 79 (19.2%) |
Income Above Poverty by Sex and Age in Stephenson
According to the poverty statistics in Stephenson, males aged 16 and 17 years and females aged 5 years are the age groups that are most secure financially, with 100.0% of males and 100.0% of females in these age groups living above the poverty line.
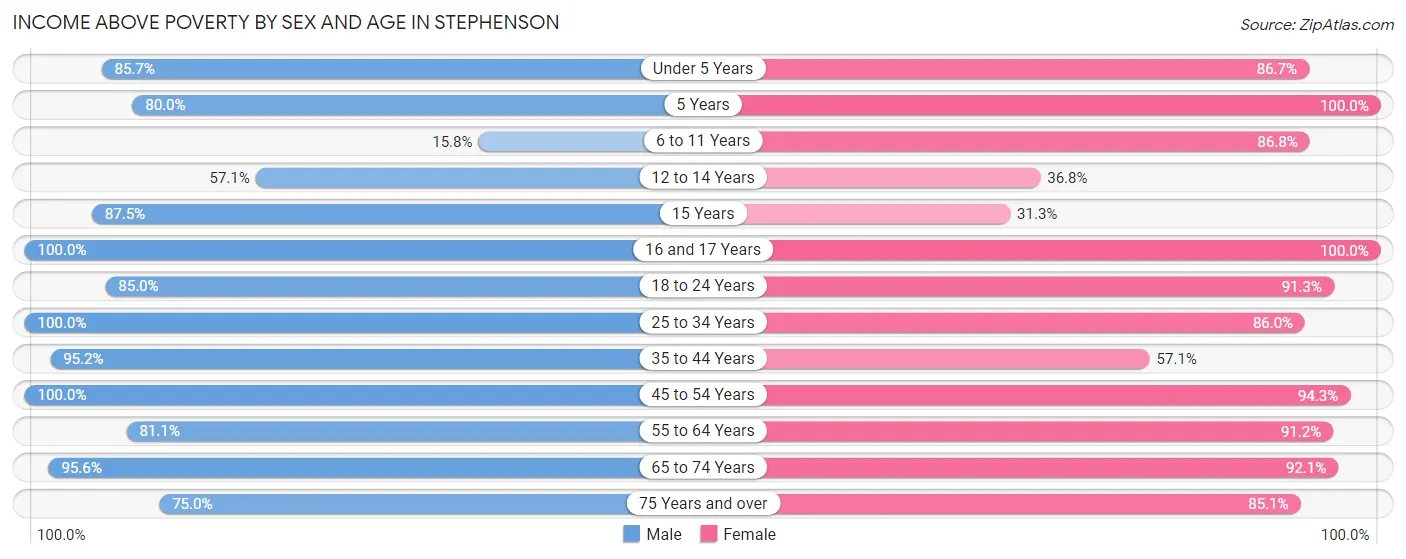
| Age Bracket | Male | Female |
| Under 5 Years | 18 (85.7%) | 26 (86.7%) |
| 5 Years | 8 (80.0%) | 2 (100.0%) |
| 6 to 11 Years | 6 (15.8%) | 33 (86.8%) |
| 12 to 14 Years | 12 (57.1%) | 7 (36.8%) |
| 15 Years | 14 (87.5%) | 5 (31.2%) |
| 16 and 17 Years | 10 (100.0%) | 5 (100.0%) |
| 18 to 24 Years | 17 (85.0%) | 21 (91.3%) |
| 25 to 34 Years | 107 (100.0%) | 49 (86.0%) |
| 35 to 44 Years | 60 (95.2%) | 28 (57.1%) |
| 45 to 54 Years | 37 (100.0%) | 50 (94.3%) |
| 55 to 64 Years | 30 (81.1%) | 31 (91.2%) |
| 65 to 74 Years | 43 (95.6%) | 35 (92.1%) |
| 75 Years and over | 30 (75.0%) | 40 (85.1%) |
| Total | 392 (84.3%) | 332 (80.8%) |
Income Below Poverty Among Married-Couple Families in Stephenson
The poverty statistics for married-couple families in Stephenson show that 7.9% or 10 of the total 126 families live below the poverty line. Families with 5 or more children have the highest poverty rate of 100.0%, comprising of 2 families. On the other hand, families with 1 or 2 children have the lowest poverty rate of 0.0%, which includes 0 families.
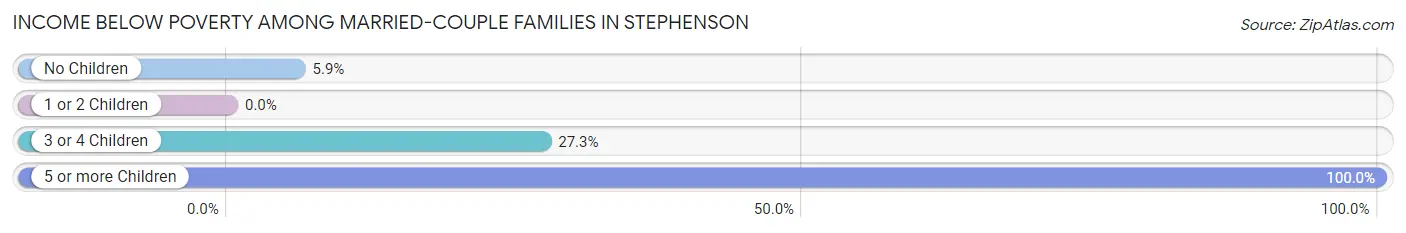
| Children | Above Poverty | Below Poverty |
| No Children | 80 (94.1%) | 5 (5.9%) |
| 1 or 2 Children | 28 (100.0%) | 0 (0.0%) |
| 3 or 4 Children | 8 (72.7%) | 3 (27.3%) |
| 5 or more Children | 0 (0.0%) | 2 (100.0%) |
| Total | 116 (92.1%) | 10 (7.9%) |
Income Below Poverty Among Single-Parent Households in Stephenson
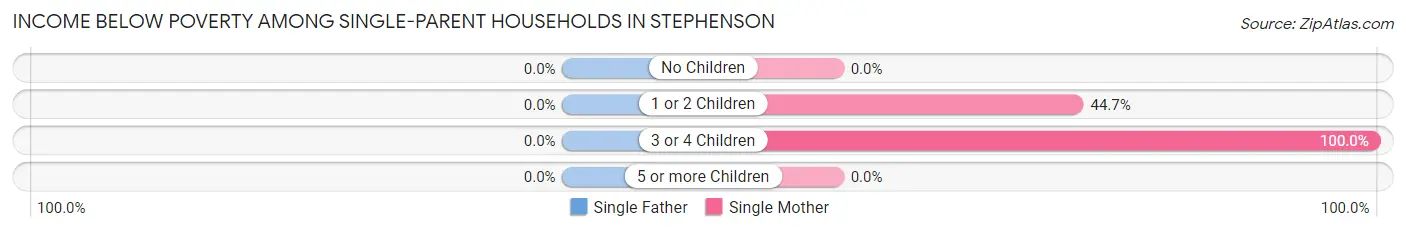
| Children | Single Father | Single Mother |
| No Children | 0 (0.0%) | 0 (0.0%) |
| 1 or 2 Children | 0 (0.0%) | 21 (44.7%) |
| 3 or 4 Children | 0 (0.0%) | 2 (100.0%) |
| 5 or more Children | 0 (0.0%) | 0 (0.0%) |
| Total | 0 (0.0%) | 23 (39.0%) |
Income Below Poverty Among Married-Couple vs Single-Parent Households in Stephenson
The poverty data for Stephenson shows that 10 of the married-couple family households (7.9%) and 23 of the single-parent households (27.7%) are living below the poverty level. Within the married-couple family households, those with 5 or more children have the highest poverty rate, with 2 households (100.0%) falling below the poverty line. Among the single-parent households, those with 1 or 2 children have the highest poverty rate, with 21 household (38.2%) living below poverty.
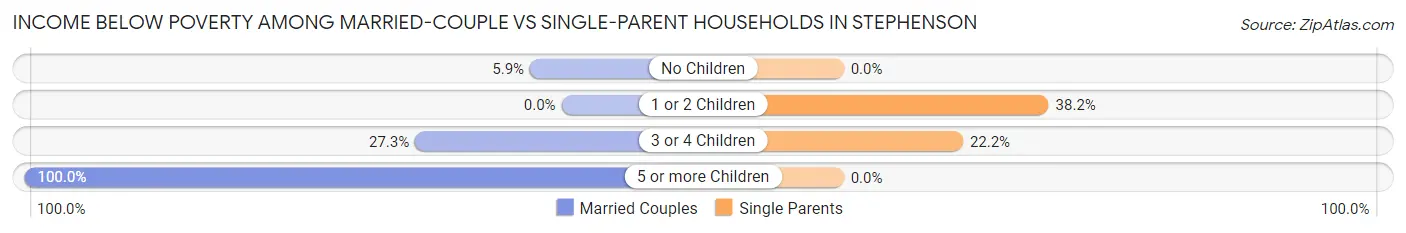
| Children | Married-Couple Families | Single-Parent Households |
| No Children | 5 (5.9%) | 0 (0.0%) |
| 1 or 2 Children | 0 (0.0%) | 21 (38.2%) |
| 3 or 4 Children | 3 (27.3%) | 2 (22.2%) |
| 5 or more Children | 2 (100.0%) | 0 (0.0%) |
| Total | 10 (7.9%) | 23 (27.7%) |
Race in Stephenson
The most populous races in Stephenson are White / Caucasian (876 | 93.9%), Two or more Races (47 | 5.0%), and Hispanic or Latino (11 | 1.2%).
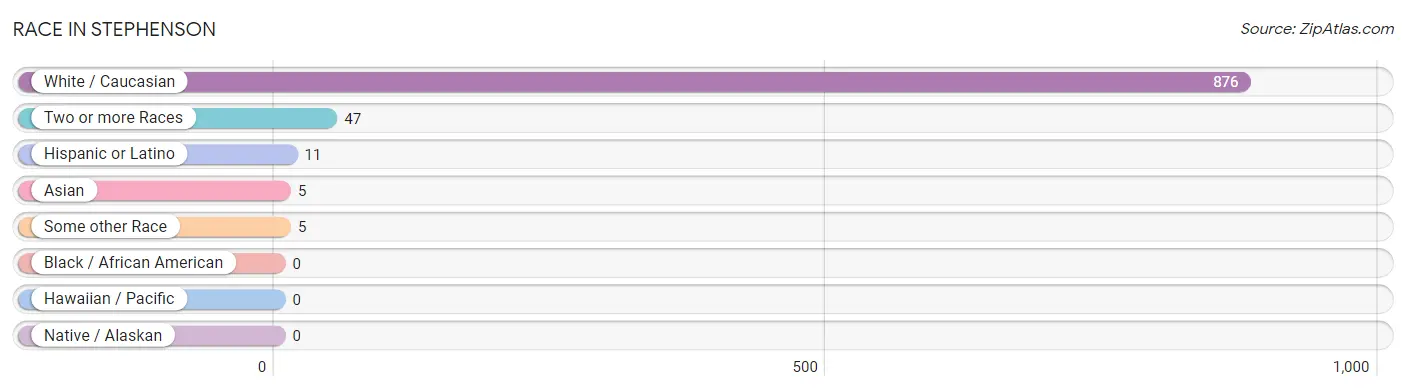
| Race | # Population | % Population |
| Asian | 5 | 0.5% |
| Black / African American | 0 | 0.0% |
| Hawaiian / Pacific | 0 | 0.0% |
| Hispanic or Latino | 11 | 1.2% |
| Native / Alaskan | 0 | 0.0% |
| White / Caucasian | 876 | 93.9% |
| Two or more Races | 47 | 5.0% |
| Some other Race | 5 | 0.5% |
| Total | 933 | 100.0% |
Ancestry in Stephenson
The most populous ancestries reported in Stephenson are German (209 | 22.4%), Polish (132 | 14.1%), French (92 | 9.9%), Swedish (81 | 8.7%), and English (61 | 6.5%), together accounting for 61.6% of all Stephenson residents.
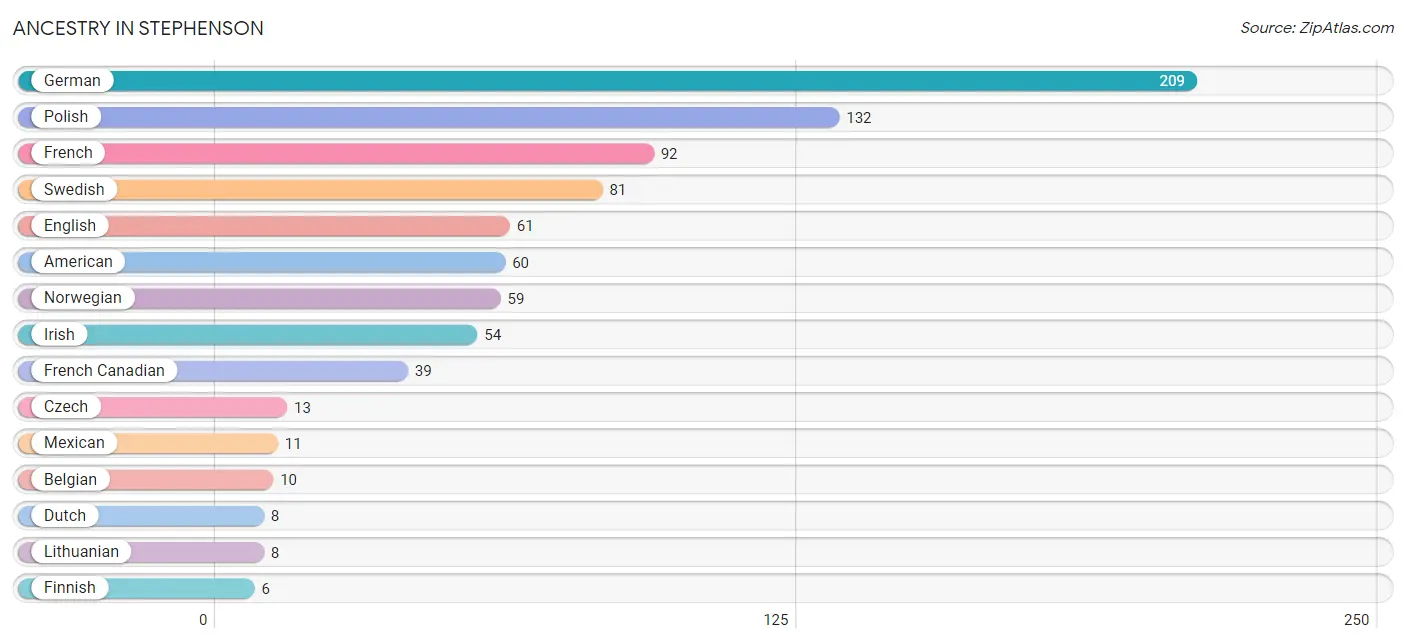
| Ancestry | # Population | % Population |
| American | 60 | 6.4% |
| Belgian | 10 | 1.1% |
| Blackfeet | 2 | 0.2% |
| Burmese | 5 | 0.5% |
| Czech | 13 | 1.4% |
| Danish | 5 | 0.5% |
| Dutch | 8 | 0.9% |
| English | 61 | 6.5% |
| Finnish | 6 | 0.6% |
| French | 92 | 9.9% |
| French Canadian | 39 | 4.2% |
| German | 209 | 22.4% |
| Hungarian | 3 | 0.3% |
| Irish | 54 | 5.8% |
| Italian | 5 | 0.5% |
| Korean | 3 | 0.3% |
| Latvian | 2 | 0.2% |
| Lithuanian | 8 | 0.9% |
| Mexican | 11 | 1.2% |
| Norwegian | 59 | 6.3% |
| Polish | 132 | 14.1% |
| Russian | 2 | 0.2% |
| Scandinavian | 4 | 0.4% |
| Scottish | 6 | 0.6% |
| Swedish | 81 | 8.7% |
| Swiss | 2 | 0.2% |
| Ukrainian | 2 | 0.2% |
| Yugoslavian | 2 | 0.2% | View All 28 Rows |
Immigrants in Stephenson
The most numerous immigrant groups reported in Stephenson came from Asia (3 | 0.3%), Philippines (3 | 0.3%), South Eastern Asia (3 | 0.3%), Central America (2 | 0.2%), and Eastern Europe (2 | 0.2%), together accounting for 1.4% of all Stephenson residents.
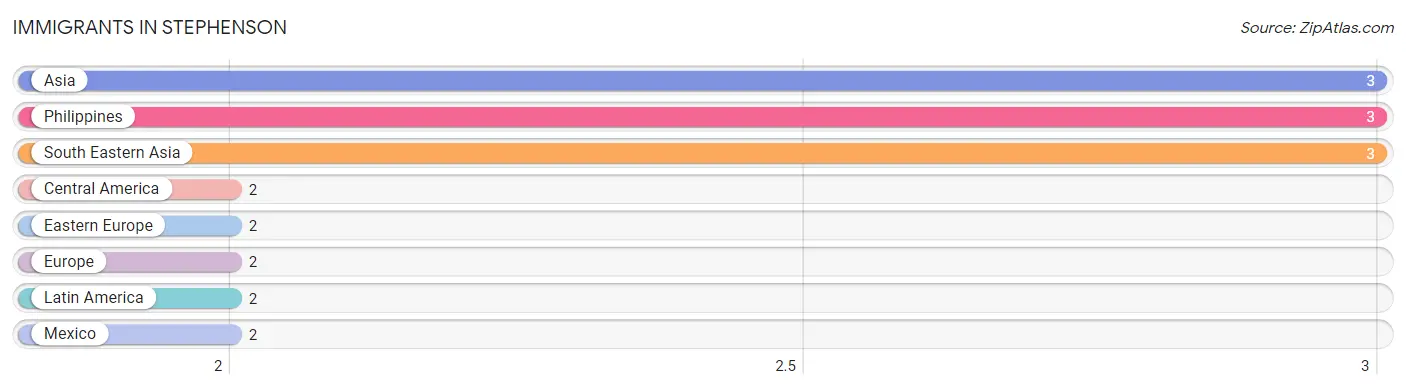
| Immigration Origin | # Population | % Population |
| Asia | 3 | 0.3% |
| Central America | 2 | 0.2% |
| Eastern Europe | 2 | 0.2% |
| Europe | 2 | 0.2% |
| Latin America | 2 | 0.2% |
| Mexico | 2 | 0.2% |
| Philippines | 3 | 0.3% |
| South Eastern Asia | 3 | 0.3% | View All 8 Rows |
Sex and Age in Stephenson
Sex and Age in Stephenson
The most populous age groups in Stephenson are 25 to 29 Years (69 | 14.3%) for men and 65 to 69 Years (48 | 10.7%) for women.
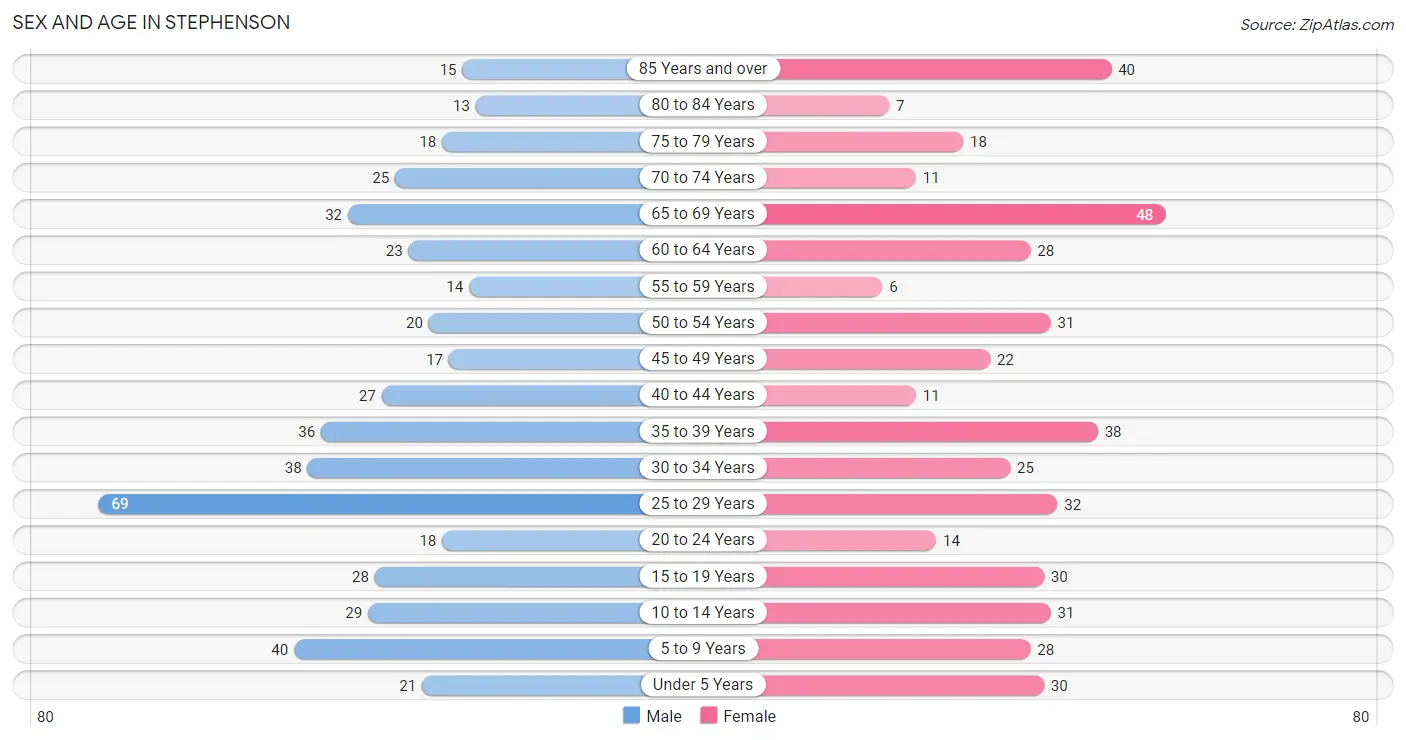
| Age Bracket | Male | Female |
| Under 5 Years | 21 (4.3%) | 30 (6.7%) |
| 5 to 9 Years | 40 (8.3%) | 28 (6.2%) |
| 10 to 14 Years | 29 (6.0%) | 31 (6.9%) |
| 15 to 19 Years | 28 (5.8%) | 30 (6.7%) |
| 20 to 24 Years | 18 (3.7%) | 14 (3.1%) |
| 25 to 29 Years | 69 (14.3%) | 32 (7.1%) |
| 30 to 34 Years | 38 (7.9%) | 25 (5.6%) |
| 35 to 39 Years | 36 (7.4%) | 38 (8.4%) |
| 40 to 44 Years | 27 (5.6%) | 11 (2.4%) |
| 45 to 49 Years | 17 (3.5%) | 22 (4.9%) |
| 50 to 54 Years | 20 (4.1%) | 31 (6.9%) |
| 55 to 59 Years | 14 (2.9%) | 6 (1.3%) |
| 60 to 64 Years | 23 (4.8%) | 28 (6.2%) |
| 65 to 69 Years | 32 (6.6%) | 48 (10.7%) |
| 70 to 74 Years | 25 (5.2%) | 11 (2.4%) |
| 75 to 79 Years | 18 (3.7%) | 18 (4.0%) |
| 80 to 84 Years | 13 (2.7%) | 7 (1.6%) |
| 85 Years and over | 15 (3.1%) | 40 (8.9%) |
| Total | 483 (100.0%) | 450 (100.0%) |
Families and Households in Stephenson
Median Family Size in Stephenson
The median family size in Stephenson is 3.24 persons per family, with single male/father families (24 | 11.5%) accounting for the largest median family size of 3.46 persons per family. On the other hand, single female/mother families (59 | 28.2%) represent the smallest median family size with 2.71 persons per family.
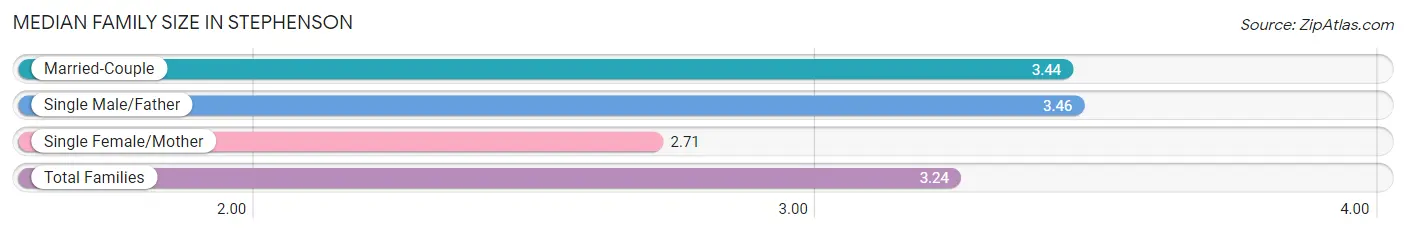
| Family Type | # Families | Family Size |
| Married-Couple | 126 (60.3%) | 3.44 |
| Single Male/Father | 24 (11.5%) | 3.46 |
| Single Female/Mother | 59 (28.2%) | 2.71 |
| Total Families | 209 (100.0%) | 3.24 |
Median Household Size in Stephenson
The median household size in Stephenson is 2.54 persons per household, with single male/father households (24 | 7.0%) accounting for the largest median household size of 3.54 persons per household. non-family households (134 | 39.1%) represent the smallest median household size with 1.21 persons per household.
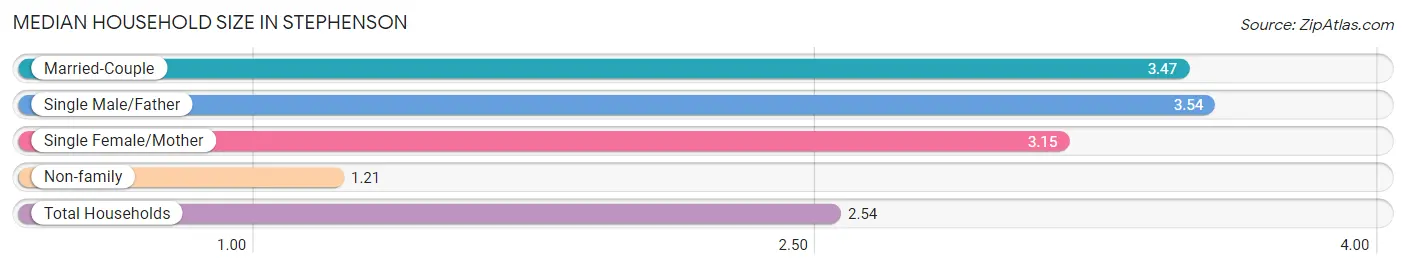
| Household Type | # Households | Household Size |
| Married-Couple | 126 (36.7%) | 3.47 |
| Single Male/Father | 24 (7.0%) | 3.54 |
| Single Female/Mother | 59 (17.2%) | 3.15 |
| Non-family | 134 (39.1%) | 1.21 |
| Total Households | 343 (100.0%) | 2.54 |
Household Size by Marriage Status in Stephenson
Out of a total of 343 households in Stephenson, 209 (60.9%) are family households, while 134 (39.1%) are nonfamily households. The most numerous type of family households are 2-person households, comprising 96, and the most common type of nonfamily households are 1-person households, comprising 113.
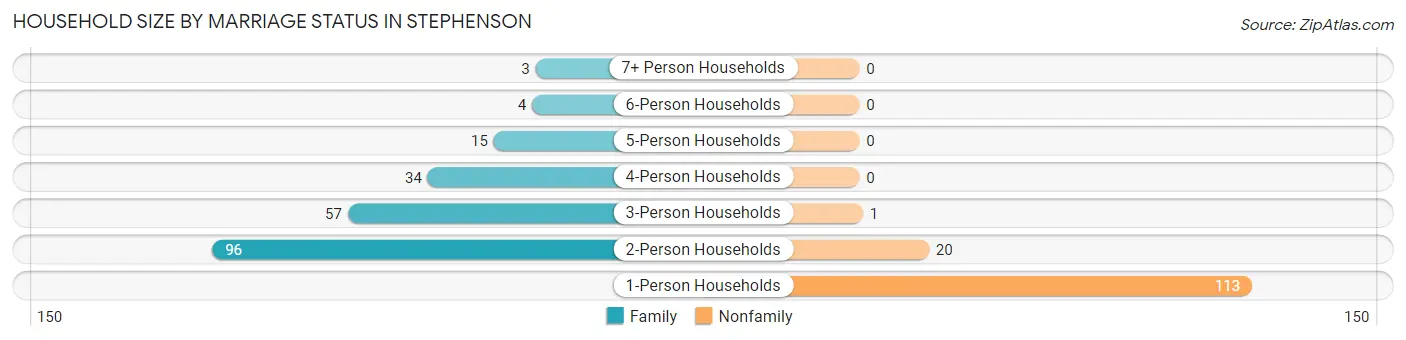
| Household Size | Family Households | Nonfamily Households |
| 1-Person Households | - | 113 (32.9%) |
| 2-Person Households | 96 (28.0%) | 20 (5.8%) |
| 3-Person Households | 57 (16.6%) | 1 (0.3%) |
| 4-Person Households | 34 (9.9%) | 0 (0.0%) |
| 5-Person Households | 15 (4.4%) | 0 (0.0%) |
| 6-Person Households | 4 (1.2%) | 0 (0.0%) |
| 7+ Person Households | 3 (0.9%) | 0 (0.0%) |
| Total | 209 (60.9%) | 134 (39.1%) |
Female Fertility in Stephenson
Fertility by Age in Stephenson
Average fertility rate in Stephenson is 123.0 births per 1,000 women. Women in the age bracket of 20 to 34 years have the highest fertility rate with 324.0 births per 1,000 women. Women in the age bracket of 20 to 34 years acount for 100.0% of all women with births.
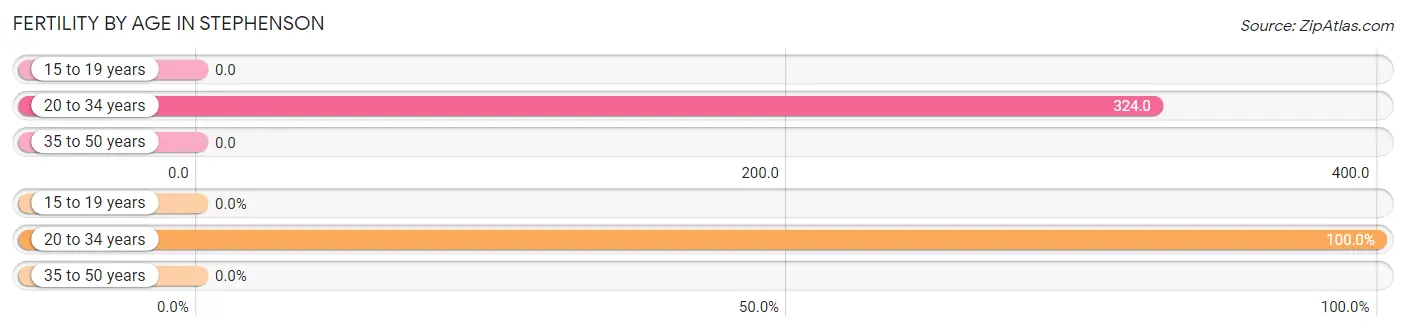
| Age Bracket | Women with Births | Births / 1,000 Women |
| 15 to 19 years | 0 (0.0%) | 0.0 |
| 20 to 34 years | 23 (100.0%) | 324.0 |
| 35 to 50 years | 0 (0.0%) | 0.0 |
| Total | 23 (100.0%) | 123.0 |
Fertility by Age by Marriage Status in Stephenson
39.1% of women with births (23) in Stephenson are married. The highest percentage of unmarried women with births falls into 20 to 34 years age bracket with 60.9% of them unmarried at the time of birth, while the lowest percentage of unmarried women with births belong to 20 to 34 years age bracket with 60.9% of them unmarried.
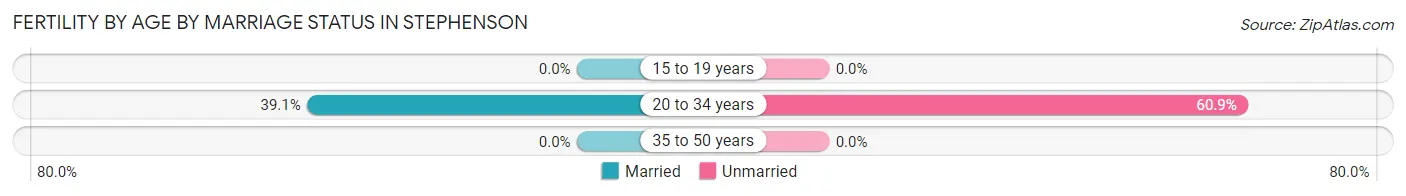
| Age Bracket | Married | Unmarried |
| 15 to 19 years | 0 (0.0%) | 0 (0.0%) |
| 20 to 34 years | 9 (39.1%) | 14 (60.9%) |
| 35 to 50 years | 0 (0.0%) | 0 (0.0%) |
| Total | 9 (39.1%) | 14 (60.9%) |
Fertility by Education in Stephenson
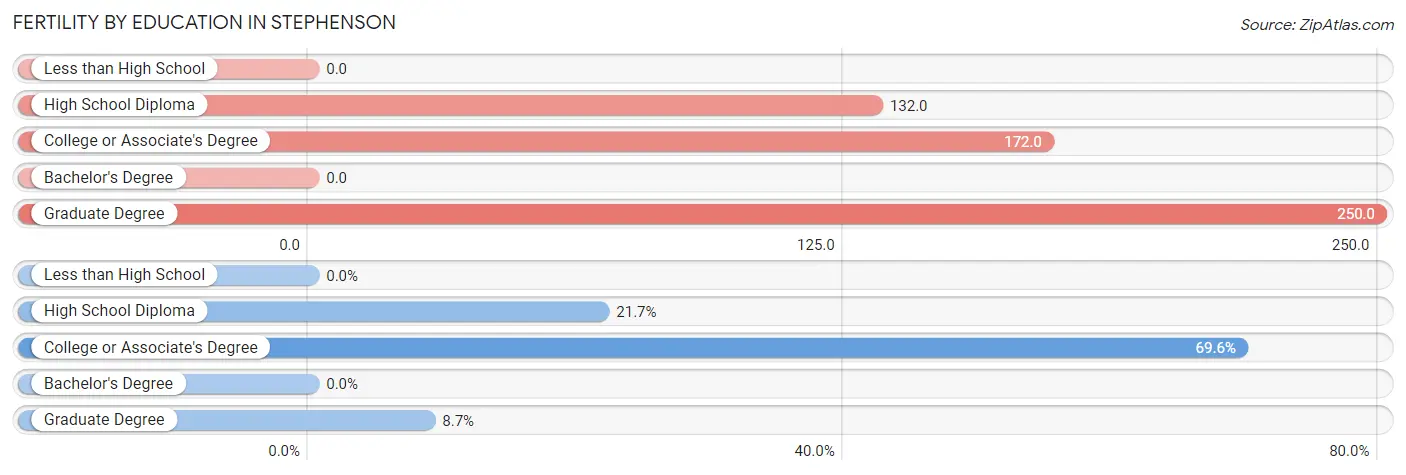
| Educational Attainment | Women with Births | Births / 1,000 Women |
| Less than High School | 0 (0.0%) | 0.0 |
| High School Diploma | 5 (21.7%) | 132.0 |
| College or Associate's Degree | 16 (69.6%) | 172.0 |
| Bachelor's Degree | 0 (0.0%) | 0.0 |
| Graduate Degree | 2 (8.7%) | 250.0 |
| Total | 23 (100.0%) | 123.0 |
Fertility by Education by Marriage Status in Stephenson
60.9% of women with births in Stephenson are unmarried. Women with the educational attainment of graduate degree are most likely to be married with 100.0% of them married at childbirth, while women with the educational attainment of high school diploma are least likely to be married with 100.0% of them unmarried at childbirth.
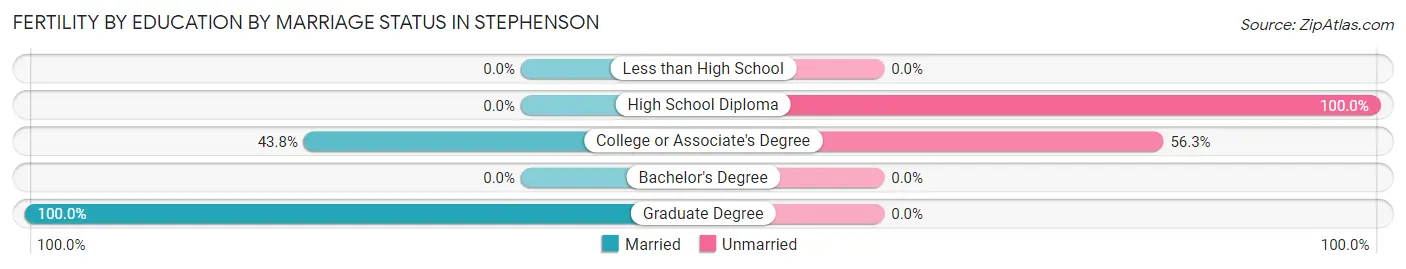
| Educational Attainment | Married | Unmarried |
| Less than High School | 0 (0.0%) | 0 (0.0%) |
| High School Diploma | 0 (0.0%) | 5 (100.0%) |
| College or Associate's Degree | 7 (43.8%) | 9 (56.2%) |
| Bachelor's Degree | 0 (0.0%) | 0 (0.0%) |
| Graduate Degree | 2 (100.0%) | 0 (0.0%) |
| Total | 9 (39.1%) | 14 (60.9%) |
Employment Characteristics in Stephenson
Employment by Class of Employer in Stephenson
Among the 379 employed individuals in Stephenson, private company employees (274 | 72.3%), self-employed (not incorporated) (43 | 11.4%), and local government employees (22 | 5.8%) make up the most common classes of employment.
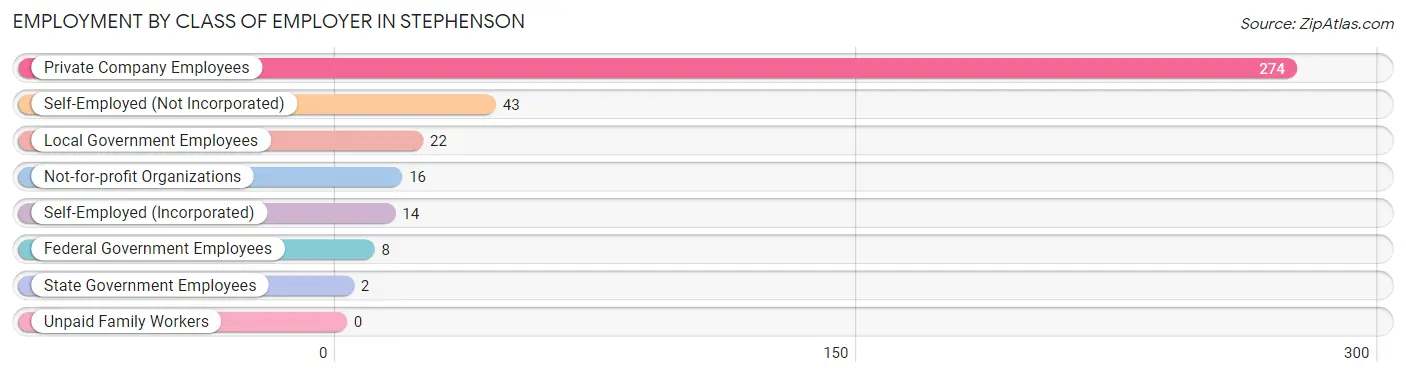
| Employer Class | # Employees | % Employees |
| Private Company Employees | 274 | 72.3% |
| Self-Employed (Incorporated) | 14 | 3.7% |
| Self-Employed (Not Incorporated) | 43 | 11.4% |
| Not-for-profit Organizations | 16 | 4.2% |
| Local Government Employees | 22 | 5.8% |
| State Government Employees | 2 | 0.5% |
| Federal Government Employees | 8 | 2.1% |
| Unpaid Family Workers | 0 | 0.0% |
| Total | 379 | 100.0% |
Employment Status by Age in Stephenson
According to the labor force statistics for Stephenson, out of the total population over 16 years of age (722), 55.4% or 400 individuals are in the labor force, with 2.0% or 8 of them unemployed. The age group with the highest labor force participation rate is 30 to 34 years, with 100.0% or 63 individuals in the labor force. Within the labor force, the 20 to 24 years age range has the highest percentage of unemployed individuals, with 10.7% or 3 of them being unemployed.
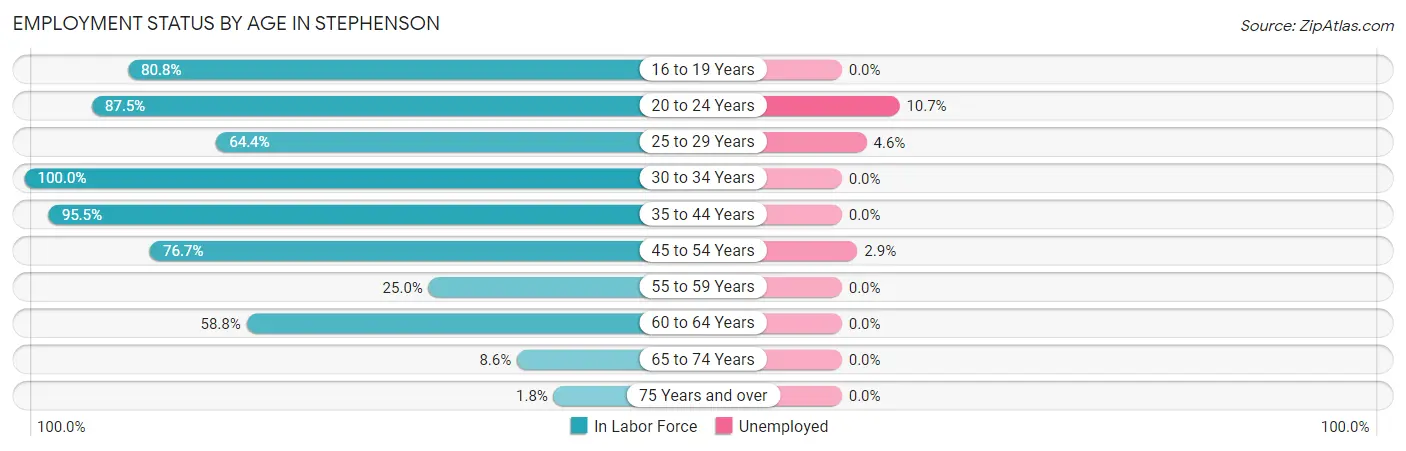
| Age Bracket | In Labor Force | Unemployed |
| 16 to 19 Years | 21 (80.8%) | 0 (0.0%) |
| 20 to 24 Years | 28 (87.5%) | 3 (10.7%) |
| 25 to 29 Years | 65 (64.4%) | 3 (4.6%) |
| 30 to 34 Years | 63 (100.0%) | 0 (0.0%) |
| 35 to 44 Years | 107 (95.5%) | 0 (0.0%) |
| 45 to 54 Years | 69 (76.7%) | 2 (2.9%) |
| 55 to 59 Years | 5 (25.0%) | 0 (0.0%) |
| 60 to 64 Years | 30 (58.8%) | 0 (0.0%) |
| 65 to 74 Years | 10 (8.6%) | 0 (0.0%) |
| 75 Years and over | 2 (1.8%) | 0 (0.0%) |
| Total | 400 (55.4%) | 8 (2.0%) |
Employment Status by Educational Attainment in Stephenson
According to labor force statistics for Stephenson, 77.6% of individuals (339) out of the total population between 25 and 64 years of age (437) are in the labor force, with 1.5% or 5 of them being unemployed. The group with the highest labor force participation rate are those with the educational attainment of bachelor's degree or higher, with 92.9% or 65 individuals in the labor force. Within the labor force, individuals with high school diploma education have the highest percentage of unemployment, with 5.0% or 5 of them being unemployed.
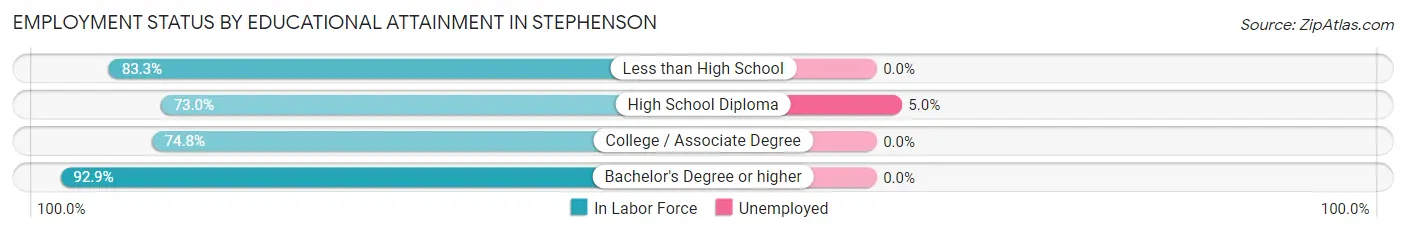
| Educational Attainment | In Labor Force | Unemployed |
| Less than High School | 20 (83.3%) | 0 (0.0%) |
| High School Diploma | 100 (73.0%) | 7 (5.0%) |
| College / Associate Degree | 154 (74.8%) | 0 (0.0%) |
| Bachelor's Degree or higher | 65 (92.9%) | 0 (0.0%) |
| Total | 339 (77.6%) | 7 (1.5%) |
Employment Occupations by Sex in Stephenson
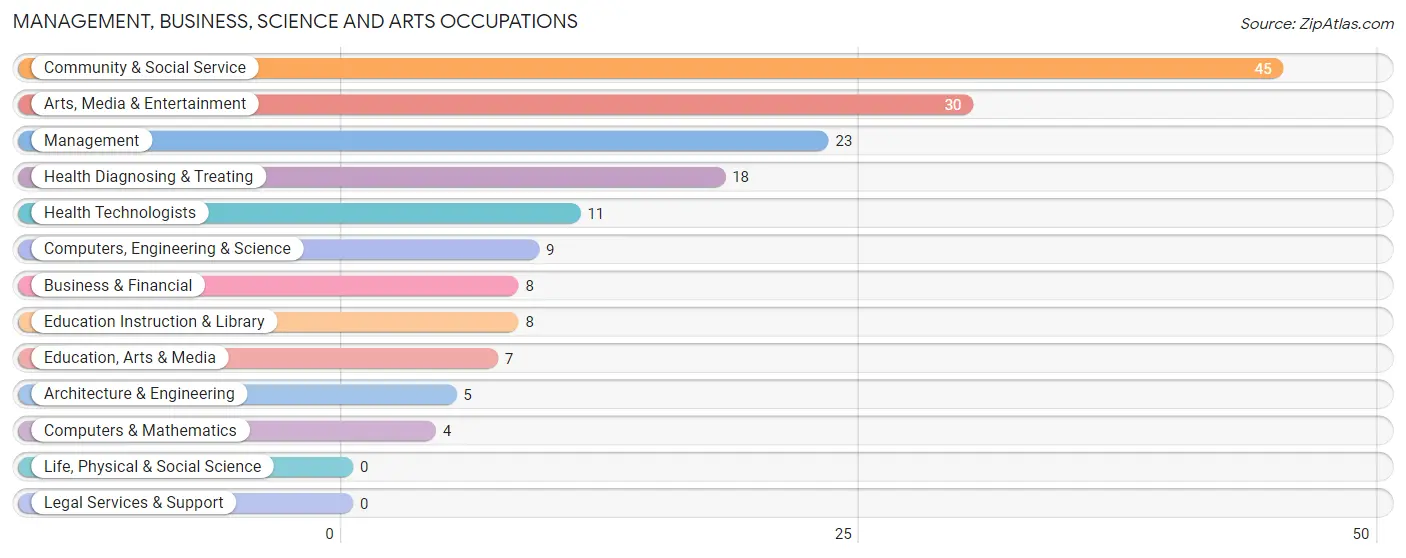
Management, Business, Science and Arts Occupations
The most common Management, Business, Science and Arts occupations in Stephenson are Community & Social Service (45 | 11.5%), Arts, Media & Entertainment (30 | 7.6%), Management (23 | 5.9%), Health Diagnosing & Treating (18 | 4.6%), and Health Technologists (11 | 2.8%).
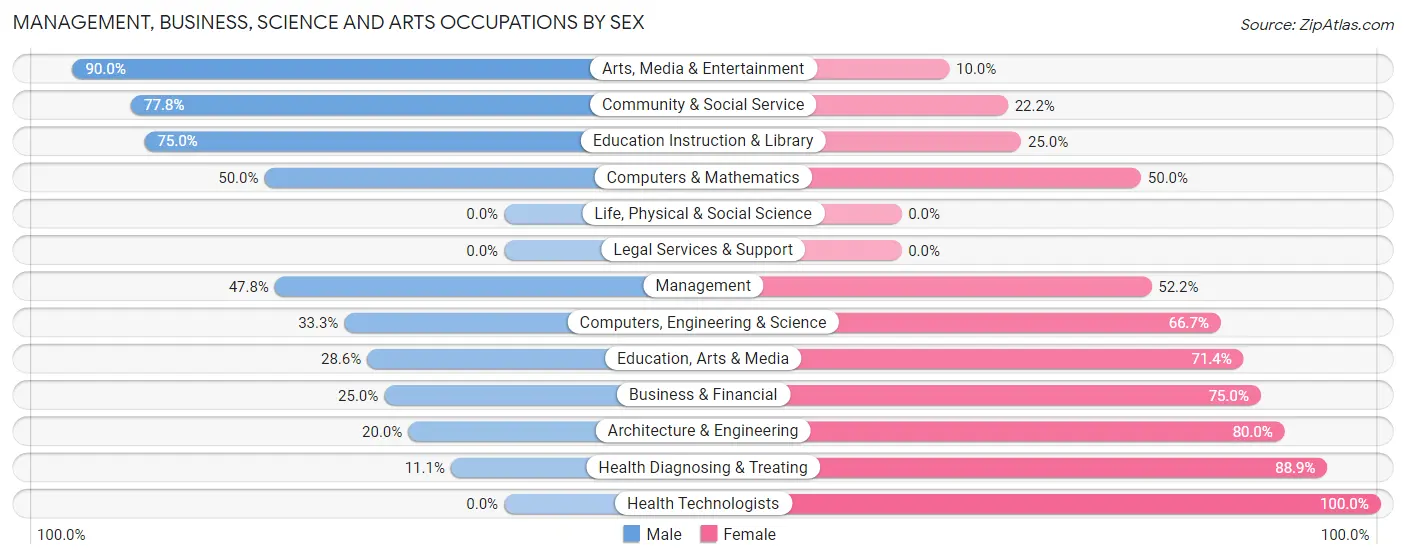
Management, Business, Science and Arts Occupations by Sex
Within the Management, Business, Science and Arts occupations in Stephenson, the most male-oriented occupations are Arts, Media & Entertainment (90.0%), Community & Social Service (77.8%), and Education Instruction & Library (75.0%), while the most female-oriented occupations are Health Technologists (100.0%), Health Diagnosing & Treating (88.9%), and Architecture & Engineering (80.0%).
| Occupation | Male | Female |
| Management | 11 (47.8%) | 12 (52.2%) |
| Business & Financial | 2 (25.0%) | 6 (75.0%) |
| Computers, Engineering & Science | 3 (33.3%) | 6 (66.7%) |
| Computers & Mathematics | 2 (50.0%) | 2 (50.0%) |
| Architecture & Engineering | 1 (20.0%) | 4 (80.0%) |
| Life, Physical & Social Science | 0 (0.0%) | 0 (0.0%) |
| Community & Social Service | 35 (77.8%) | 10 (22.2%) |
| Education, Arts & Media | 2 (28.6%) | 5 (71.4%) |
| Legal Services & Support | 0 (0.0%) | 0 (0.0%) |
| Education Instruction & Library | 6 (75.0%) | 2 (25.0%) |
| Arts, Media & Entertainment | 27 (90.0%) | 3 (10.0%) |
| Health Diagnosing & Treating | 2 (11.1%) | 16 (88.9%) |
| Health Technologists | 0 (0.0%) | 11 (100.0%) |
| Total (Category) | 53 (51.5%) | 50 (48.5%) |
| Total (Overall) | 217 (55.4%) | 175 (44.6%) |
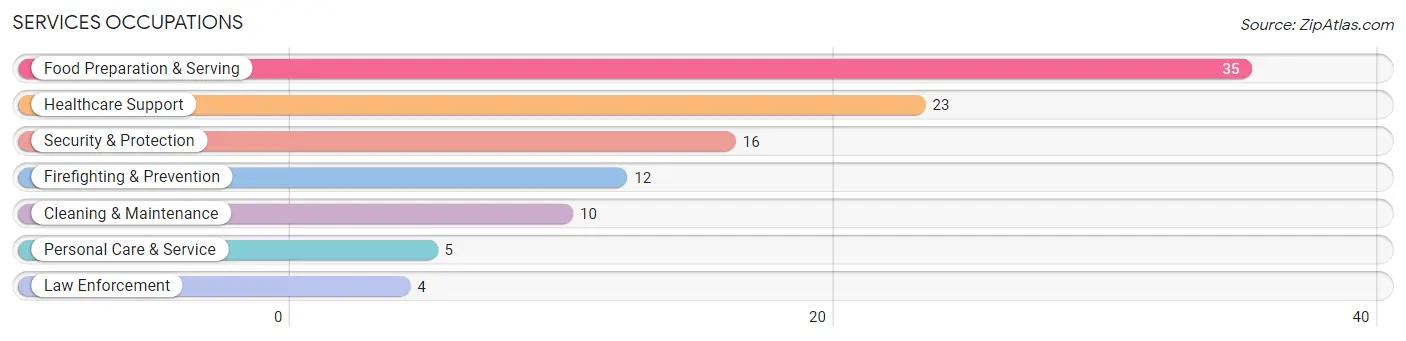
Services Occupations
The most common Services occupations in Stephenson are Food Preparation & Serving (35 | 8.9%), Healthcare Support (23 | 5.9%), Security & Protection (16 | 4.1%), Firefighting & Prevention (12 | 3.1%), and Cleaning & Maintenance (10 | 2.5%).
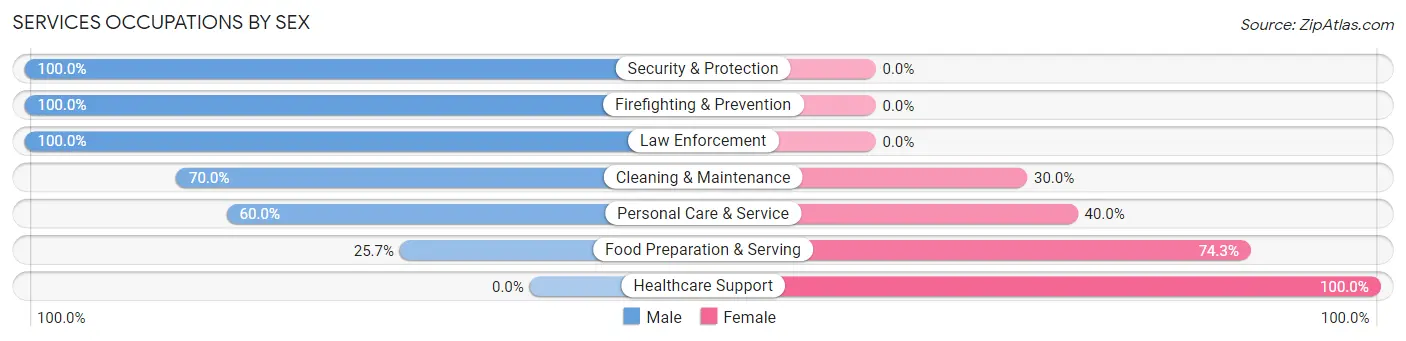
Services Occupations by Sex
Within the Services occupations in Stephenson, the most male-oriented occupations are Security & Protection (100.0%), Firefighting & Prevention (100.0%), and Law Enforcement (100.0%), while the most female-oriented occupations are Healthcare Support (100.0%), Food Preparation & Serving (74.3%), and Personal Care & Service (40.0%).
| Occupation | Male | Female |
| Healthcare Support | 0 (0.0%) | 23 (100.0%) |
| Security & Protection | 16 (100.0%) | 0 (0.0%) |
| Firefighting & Prevention | 12 (100.0%) | 0 (0.0%) |
| Law Enforcement | 4 (100.0%) | 0 (0.0%) |
| Food Preparation & Serving | 9 (25.7%) | 26 (74.3%) |
| Cleaning & Maintenance | 7 (70.0%) | 3 (30.0%) |
| Personal Care & Service | 3 (60.0%) | 2 (40.0%) |
| Total (Category) | 35 (39.3%) | 54 (60.7%) |
| Total (Overall) | 217 (55.4%) | 175 (44.6%) |
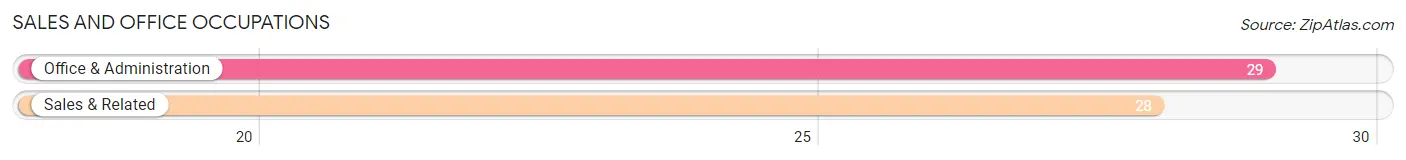
Sales and Office Occupations
The most common Sales and Office occupations in Stephenson are Office & Administration (29 | 7.4%), and Sales & Related (28 | 7.1%).
Sales and Office Occupations by Sex
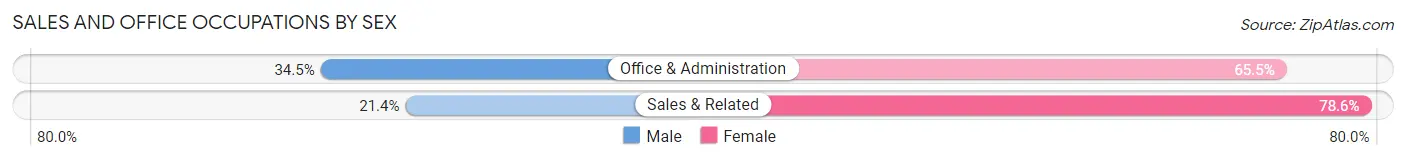
| Occupation | Male | Female |
| Sales & Related | 6 (21.4%) | 22 (78.6%) |
| Office & Administration | 10 (34.5%) | 19 (65.5%) |
| Total (Category) | 16 (28.1%) | 41 (71.9%) |
| Total (Overall) | 217 (55.4%) | 175 (44.6%) |
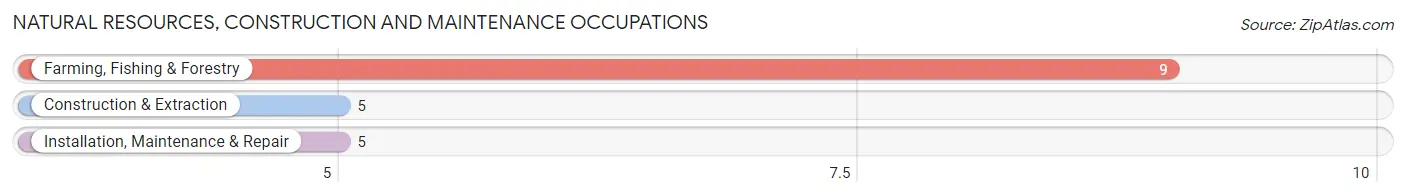
Natural Resources, Construction and Maintenance Occupations
The most common Natural Resources, Construction and Maintenance occupations in Stephenson are Farming, Fishing & Forestry (9 | 2.3%), Construction & Extraction (5 | 1.3%), and Installation, Maintenance & Repair (5 | 1.3%).
Natural Resources, Construction and Maintenance Occupations by Sex
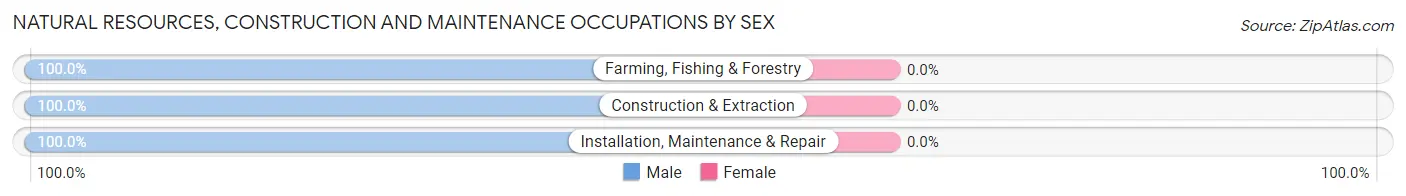
| Occupation | Male | Female |
| Farming, Fishing & Forestry | 9 (100.0%) | 0 (0.0%) |
| Construction & Extraction | 5 (100.0%) | 0 (0.0%) |
| Installation, Maintenance & Repair | 5 (100.0%) | 0 (0.0%) |
| Total (Category) | 19 (100.0%) | 0 (0.0%) |
| Total (Overall) | 217 (55.4%) | 175 (44.6%) |
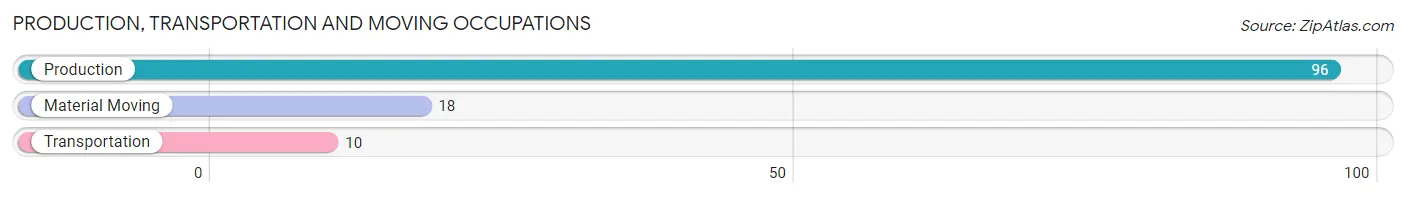
Production, Transportation and Moving Occupations
The most common Production, Transportation and Moving occupations in Stephenson are Production (96 | 24.5%), Material Moving (18 | 4.6%), and Transportation (10 | 2.5%).
Production, Transportation and Moving Occupations by Sex
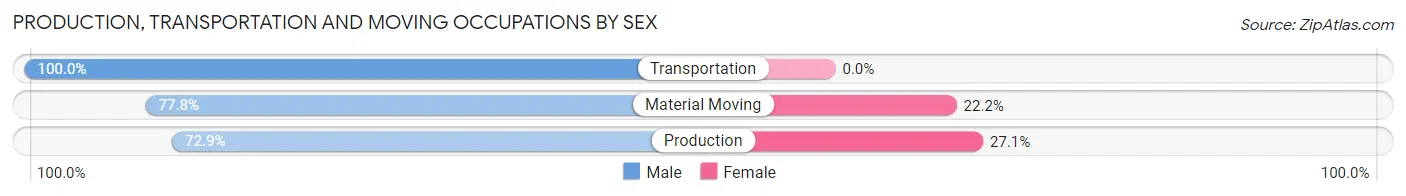
| Occupation | Male | Female |
| Production | 70 (72.9%) | 26 (27.1%) |
| Transportation | 10 (100.0%) | 0 (0.0%) |
| Material Moving | 14 (77.8%) | 4 (22.2%) |
| Total (Category) | 94 (75.8%) | 30 (24.2%) |
| Total (Overall) | 217 (55.4%) | 175 (44.6%) |
Employment Industries by Sex in Stephenson
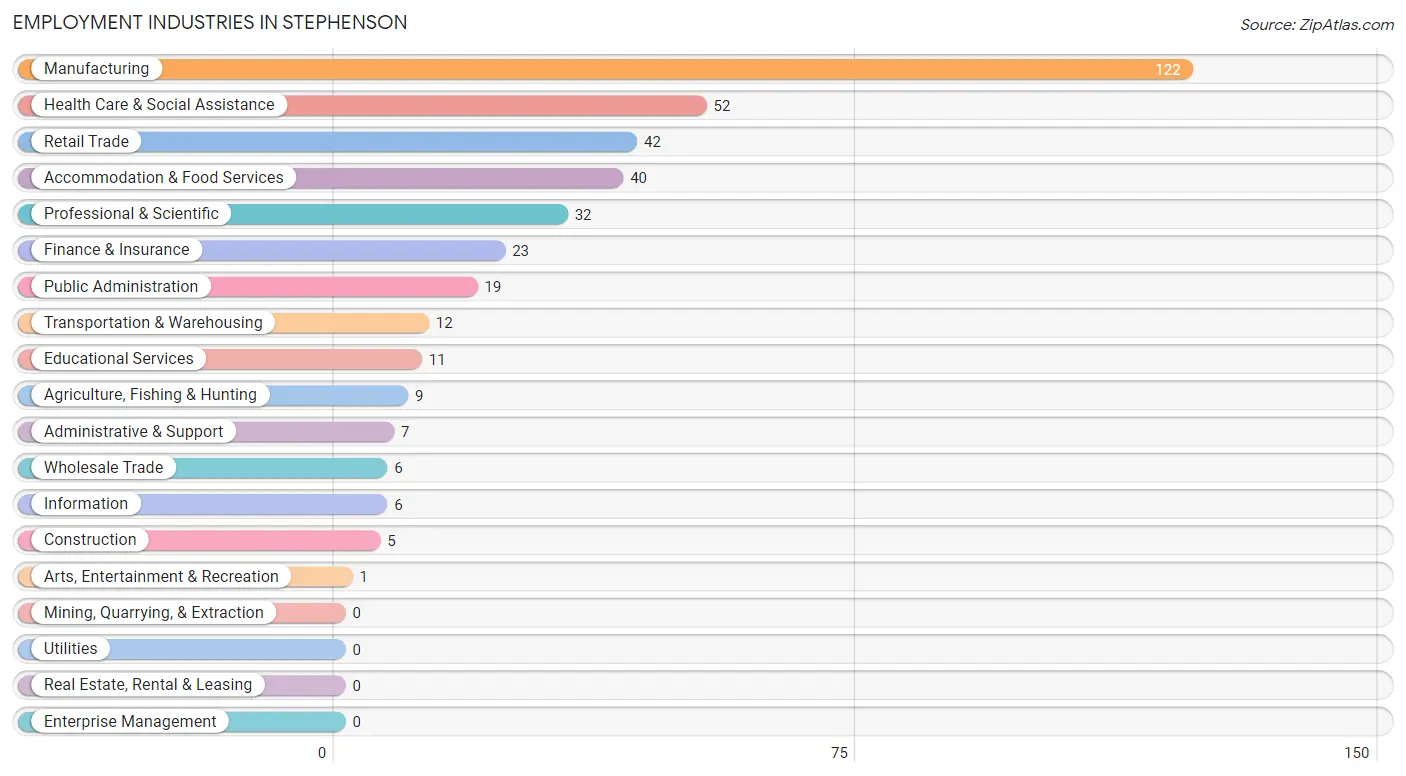
Employment Industries in Stephenson
The major employment industries in Stephenson include Manufacturing (122 | 31.1%), Health Care & Social Assistance (52 | 13.3%), Retail Trade (42 | 10.7%), Accommodation & Food Services (40 | 10.2%), and Professional & Scientific (32 | 8.2%).
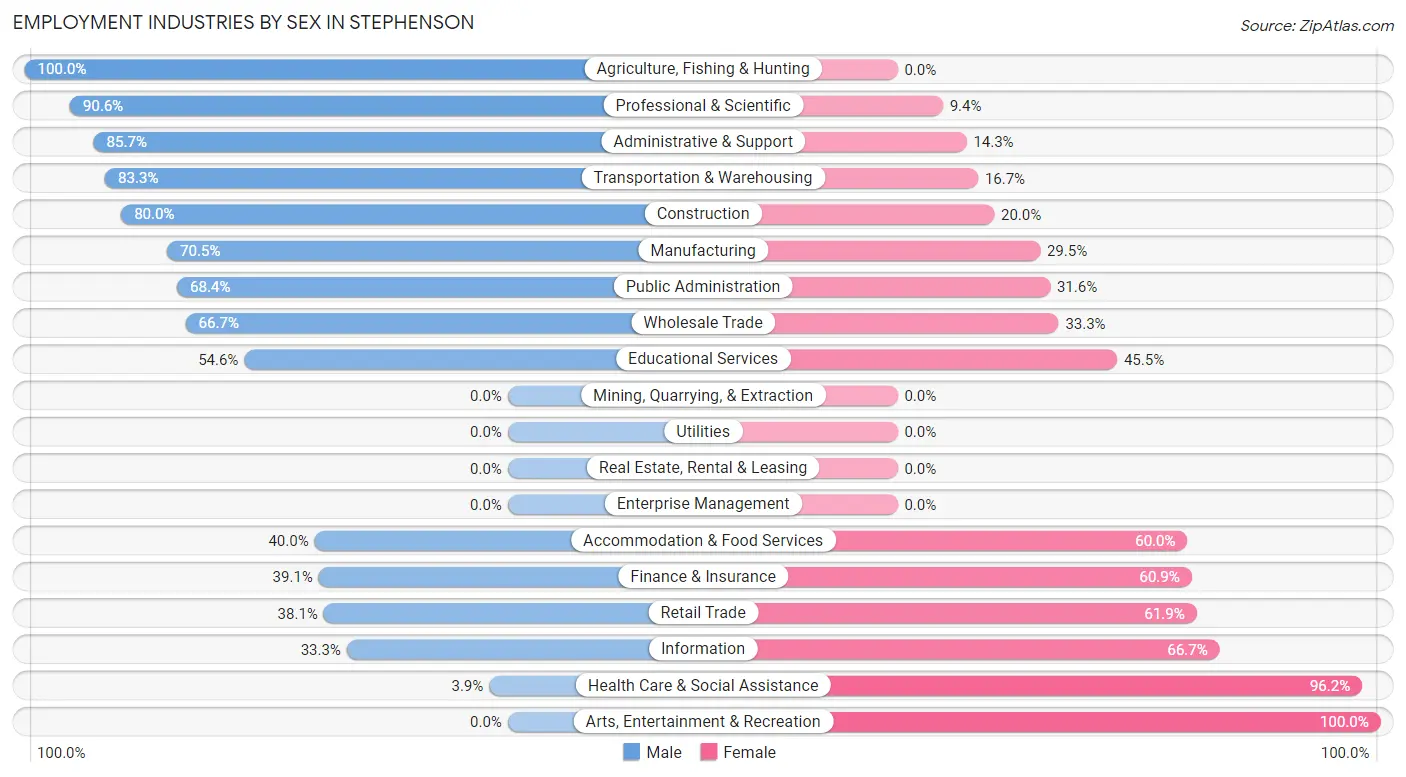
Employment Industries by Sex in Stephenson
The Stephenson industries that see more men than women are Agriculture, Fishing & Hunting (100.0%), Professional & Scientific (90.6%), and Administrative & Support (85.7%), whereas the industries that tend to have a higher number of women are Arts, Entertainment & Recreation (100.0%), Health Care & Social Assistance (96.2%), and Information (66.7%).
| Industry | Male | Female |
| Agriculture, Fishing & Hunting | 9 (100.0%) | 0 (0.0%) |
| Mining, Quarrying, & Extraction | 0 (0.0%) | 0 (0.0%) |
| Construction | 4 (80.0%) | 1 (20.0%) |
| Manufacturing | 86 (70.5%) | 36 (29.5%) |
| Wholesale Trade | 4 (66.7%) | 2 (33.3%) |
| Retail Trade | 16 (38.1%) | 26 (61.9%) |
| Transportation & Warehousing | 10 (83.3%) | 2 (16.7%) |
| Utilities | 0 (0.0%) | 0 (0.0%) |
| Information | 2 (33.3%) | 4 (66.7%) |
| Finance & Insurance | 9 (39.1%) | 14 (60.9%) |
| Real Estate, Rental & Leasing | 0 (0.0%) | 0 (0.0%) |
| Professional & Scientific | 29 (90.6%) | 3 (9.4%) |
| Enterprise Management | 0 (0.0%) | 0 (0.0%) |
| Administrative & Support | 6 (85.7%) | 1 (14.3%) |
| Educational Services | 6 (54.5%) | 5 (45.5%) |
| Health Care & Social Assistance | 2 (3.8%) | 50 (96.2%) |
| Arts, Entertainment & Recreation | 0 (0.0%) | 1 (100.0%) |
| Accommodation & Food Services | 16 (40.0%) | 24 (60.0%) |
| Public Administration | 13 (68.4%) | 6 (31.6%) |
| Total | 217 (55.4%) | 175 (44.6%) |
Education in Stephenson
School Enrollment in Stephenson
The most common levels of schooling among the 202 students in Stephenson are middle school (61 | 30.2%), high school (58 | 28.7%), and elementary school (51 | 25.3%).
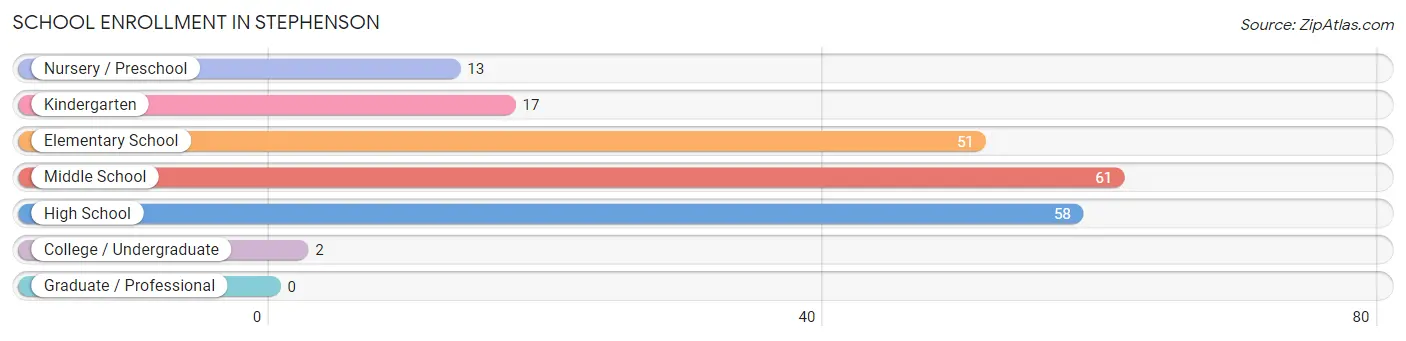
| School Level | # Students | % Students |
| Nursery / Preschool | 13 | 6.4% |
| Kindergarten | 17 | 8.4% |
| Elementary School | 51 | 25.3% |
| Middle School | 61 | 30.2% |
| High School | 58 | 28.7% |
| College / Undergraduate | 2 | 1.0% |
| Graduate / Professional | 0 | 0.0% |
| Total | 202 | 100.0% |
School Enrollment by Age by Funding Source in Stephenson
Out of a total of 202 students who are enrolled in schools in Stephenson, 18 (8.9%) attend a private institution, while the remaining 184 (91.1%) are enrolled in public schools. The age group of 3 to 4 year olds has the highest likelihood of being enrolled in private schools, with 1 (11.1% in the age bracket) enrolled. Conversely, the age group of 20 to 24 year olds has the lowest likelihood of being enrolled in a private school, with 5 (100.0% in the age bracket) attending a public institution.
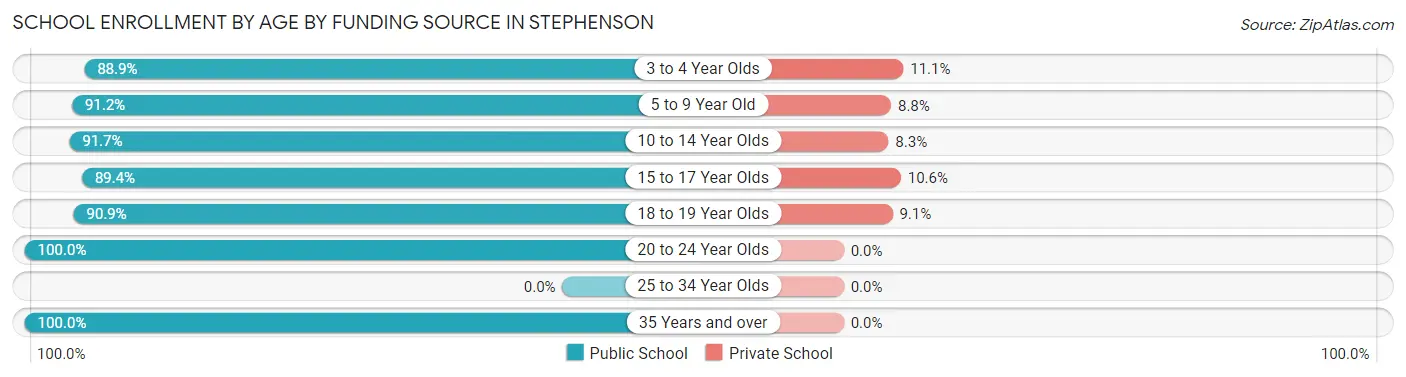
| Age Bracket | Public School | Private School |
| 3 to 4 Year Olds | 8 (88.9%) | 1 (11.1%) |
| 5 to 9 Year Old | 62 (91.2%) | 6 (8.8%) |
| 10 to 14 Year Olds | 55 (91.7%) | 5 (8.3%) |
| 15 to 17 Year Olds | 42 (89.4%) | 5 (10.6%) |
| 18 to 19 Year Olds | 10 (90.9%) | 1 (9.1%) |
| 20 to 24 Year Olds | 5 (100.0%) | 0 (0.0%) |
| 25 to 34 Year Olds | 0 (0.0%) | 0 (0.0%) |
| 35 Years and over | 2 (100.0%) | 0 (0.0%) |
| Total | 184 (91.1%) | 18 (8.9%) |
Educational Attainment by Field of Study in Stephenson
Business (28 | 31.8%), science & technology (12 | 13.6%), literature & languages (12 | 13.6%), bio, nature & agricultural (6 | 6.8%), and education (6 | 6.8%) are the most common fields of study among 88 individuals in Stephenson who have obtained a bachelor's degree or higher.
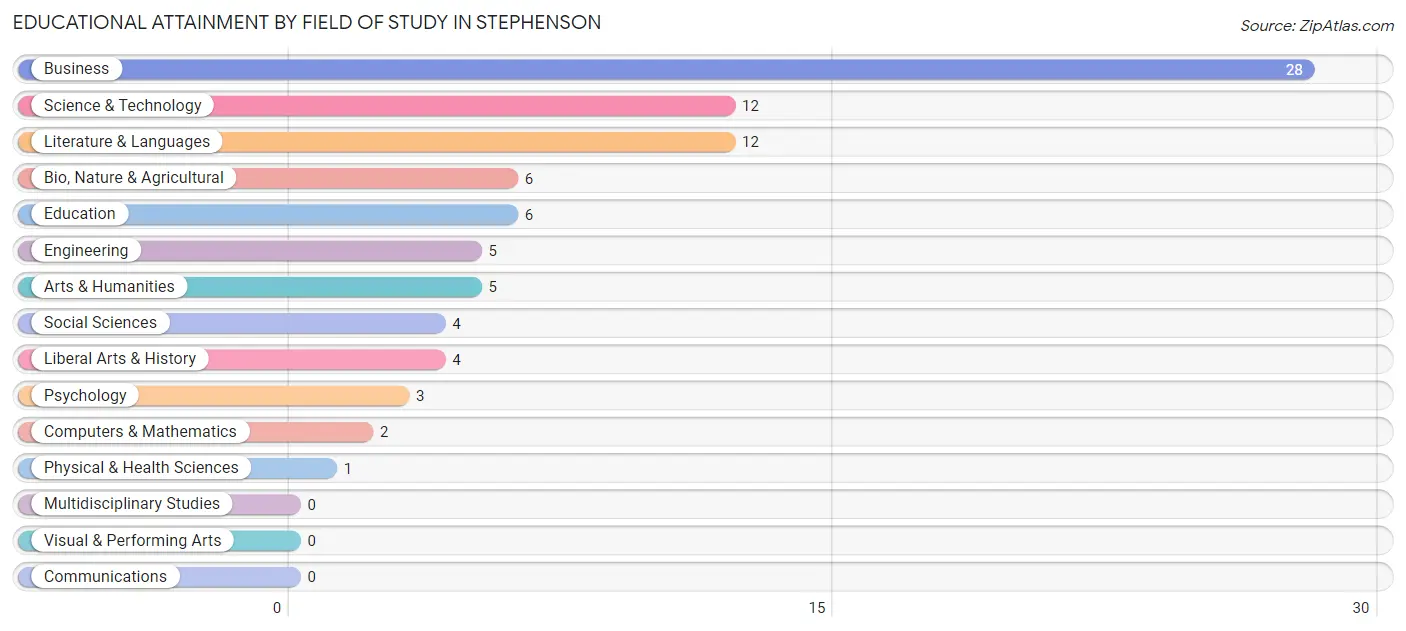
| Field of Study | # Graduates | % Graduates |
| Computers & Mathematics | 2 | 2.3% |
| Bio, Nature & Agricultural | 6 | 6.8% |
| Physical & Health Sciences | 1 | 1.1% |
| Psychology | 3 | 3.4% |
| Social Sciences | 4 | 4.5% |
| Engineering | 5 | 5.7% |
| Multidisciplinary Studies | 0 | 0.0% |
| Science & Technology | 12 | 13.6% |
| Business | 28 | 31.8% |
| Education | 6 | 6.8% |
| Literature & Languages | 12 | 13.6% |
| Liberal Arts & History | 4 | 4.5% |
| Visual & Performing Arts | 0 | 0.0% |
| Communications | 0 | 0.0% |
| Arts & Humanities | 5 | 5.7% |
| Total | 88 | 100.0% |
Transportation & Commute in Stephenson
Vehicle Availability by Sex in Stephenson
The most prevalent vehicle ownership categories in Stephenson are males with 3 vehicles (74, accounting for 35.6%) and females with 3 vehicles (56, making up 44.9%).
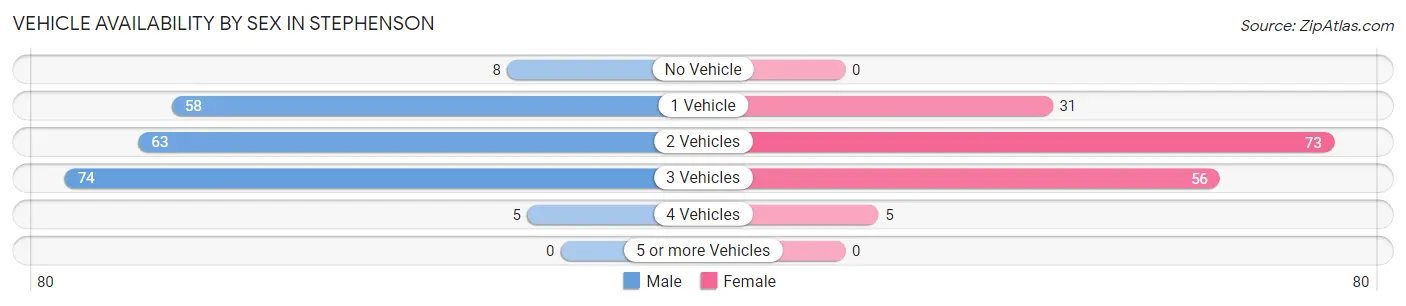
| Vehicles Available | Male | Female |
| No Vehicle | 8 (3.8%) | 0 (0.0%) |
| 1 Vehicle | 58 (27.9%) | 31 (18.8%) |
| 2 Vehicles | 63 (30.3%) | 73 (44.2%) |
| 3 Vehicles | 74 (35.6%) | 56 (33.9%) |
| 4 Vehicles | 5 (2.4%) | 5 (3.0%) |
| 5 or more Vehicles | 0 (0.0%) | 0 (0.0%) |
| Total | 208 (100.0%) | 165 (100.0%) |
Commute Time in Stephenson
The most frequently occuring commute durations in Stephenson are less than 5 minutes (75 commuters, 20.7%), 30 to 34 minutes (72 commuters, 19.9%), and 35 to 39 minutes (32 commuters, 8.8%).
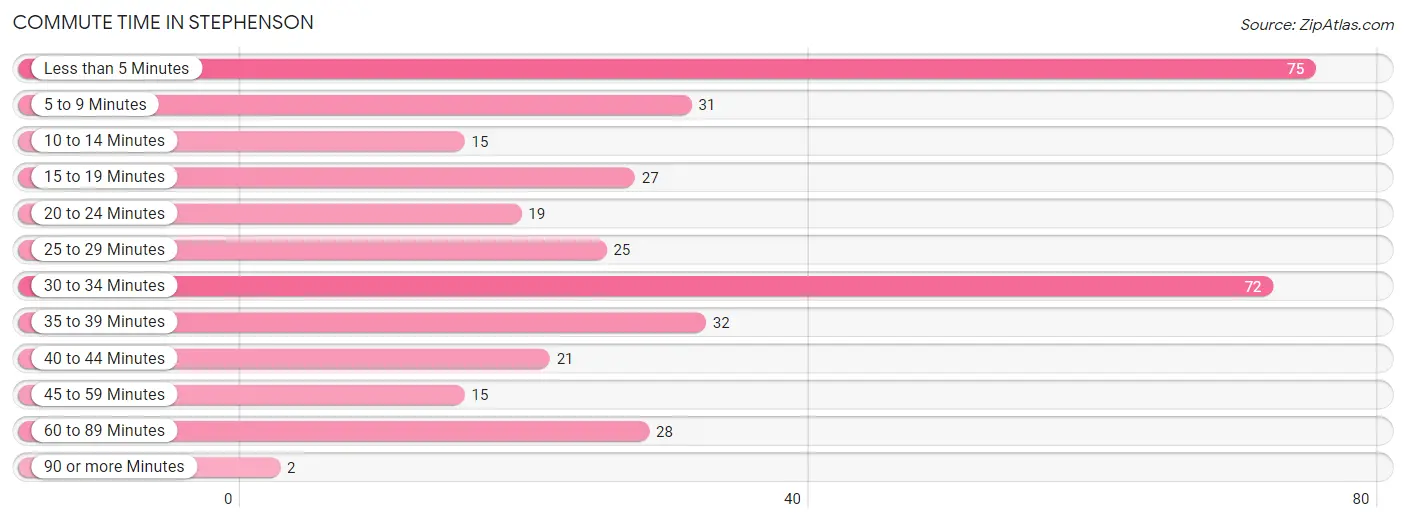
| Commute Time | # Commuters | % Commuters |
| Less than 5 Minutes | 75 | 20.7% |
| 5 to 9 Minutes | 31 | 8.6% |
| 10 to 14 Minutes | 15 | 4.1% |
| 15 to 19 Minutes | 27 | 7.5% |
| 20 to 24 Minutes | 19 | 5.2% |
| 25 to 29 Minutes | 25 | 6.9% |
| 30 to 34 Minutes | 72 | 19.9% |
| 35 to 39 Minutes | 32 | 8.8% |
| 40 to 44 Minutes | 21 | 5.8% |
| 45 to 59 Minutes | 15 | 4.1% |
| 60 to 89 Minutes | 28 | 7.7% |
| 90 or more Minutes | 2 | 0.5% |
Commute Time by Sex in Stephenson
The most common commute times in Stephenson are less than 5 minutes (43 commuters, 21.3%) for males and less than 5 minutes (32 commuters, 20.0%) for females.
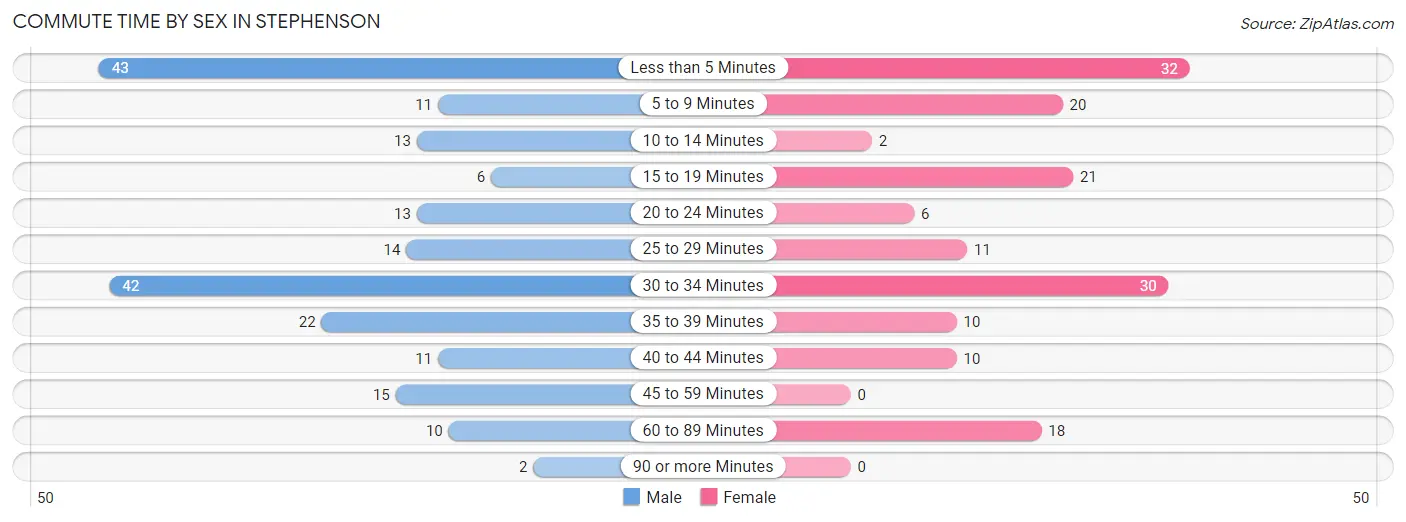
| Commute Time | Male | Female |
| Less than 5 Minutes | 43 (21.3%) | 32 (20.0%) |
| 5 to 9 Minutes | 11 (5.4%) | 20 (12.5%) |
| 10 to 14 Minutes | 13 (6.4%) | 2 (1.3%) |
| 15 to 19 Minutes | 6 (3.0%) | 21 (13.1%) |
| 20 to 24 Minutes | 13 (6.4%) | 6 (3.7%) |
| 25 to 29 Minutes | 14 (6.9%) | 11 (6.9%) |
| 30 to 34 Minutes | 42 (20.8%) | 30 (18.8%) |
| 35 to 39 Minutes | 22 (10.9%) | 10 (6.2%) |
| 40 to 44 Minutes | 11 (5.4%) | 10 (6.2%) |
| 45 to 59 Minutes | 15 (7.4%) | 0 (0.0%) |
| 60 to 89 Minutes | 10 (5.0%) | 18 (11.3%) |
| 90 or more Minutes | 2 (1.0%) | 0 (0.0%) |
Time of Departure to Work by Sex in Stephenson
The most frequent times of departure to work in Stephenson are 12:00 AM to 4:59 AM (45, 22.3%) for males and 7:30 AM to 7:59 AM (36, 22.5%) for females.
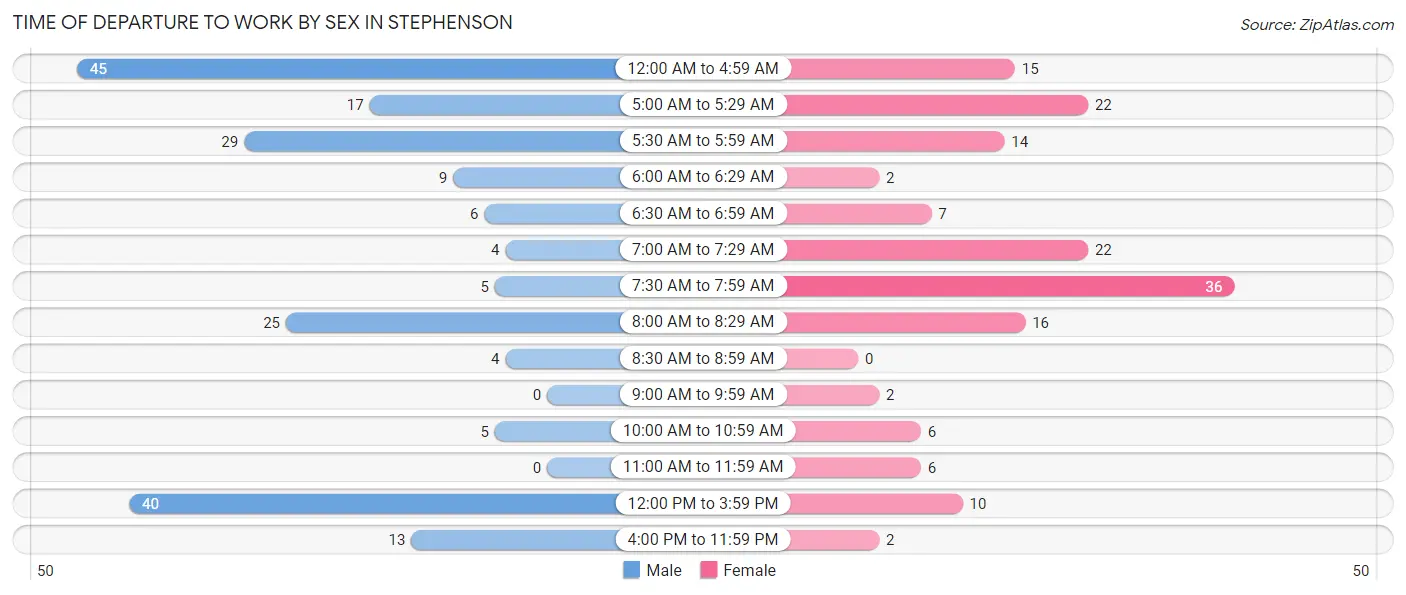
| Time of Departure | Male | Female |
| 12:00 AM to 4:59 AM | 45 (22.3%) | 15 (9.4%) |
| 5:00 AM to 5:29 AM | 17 (8.4%) | 22 (13.8%) |
| 5:30 AM to 5:59 AM | 29 (14.4%) | 14 (8.7%) |
| 6:00 AM to 6:29 AM | 9 (4.5%) | 2 (1.3%) |
| 6:30 AM to 6:59 AM | 6 (3.0%) | 7 (4.4%) |
| 7:00 AM to 7:29 AM | 4 (2.0%) | 22 (13.8%) |
| 7:30 AM to 7:59 AM | 5 (2.5%) | 36 (22.5%) |
| 8:00 AM to 8:29 AM | 25 (12.4%) | 16 (10.0%) |
| 8:30 AM to 8:59 AM | 4 (2.0%) | 0 (0.0%) |
| 9:00 AM to 9:59 AM | 0 (0.0%) | 2 (1.3%) |
| 10:00 AM to 10:59 AM | 5 (2.5%) | 6 (3.7%) |
| 11:00 AM to 11:59 AM | 0 (0.0%) | 6 (3.7%) |
| 12:00 PM to 3:59 PM | 40 (19.8%) | 10 (6.2%) |
| 4:00 PM to 11:59 PM | 13 (6.4%) | 2 (1.3%) |
| Total | 202 (100.0%) | 160 (100.0%) |
Housing Occupancy in Stephenson
Occupancy by Ownership in Stephenson
Of the total 343 dwellings in Stephenson, owner-occupied units account for 242 (70.6%), while renter-occupied units make up 101 (29.4%).
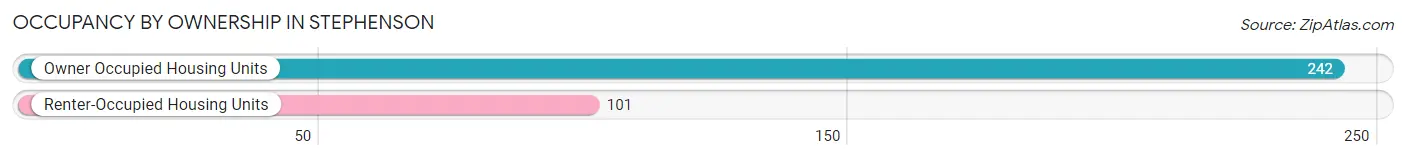
| Occupancy | # Housing Units | % Housing Units |
| Owner Occupied Housing Units | 242 | 70.6% |
| Renter-Occupied Housing Units | 101 | 29.4% |
| Total Occupied Housing Units | 343 | 100.0% |
Occupancy by Household Size in Stephenson
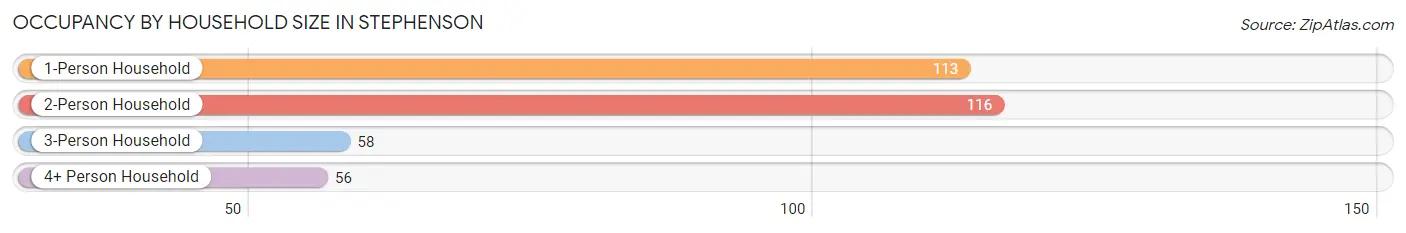
| Household Size | # Housing Units | % Housing Units |
| 1-Person Household | 113 | 32.9% |
| 2-Person Household | 116 | 33.8% |
| 3-Person Household | 58 | 16.9% |
| 4+ Person Household | 56 | 16.3% |
| Total Housing Units | 343 | 100.0% |
Occupancy by Ownership by Household Size in Stephenson
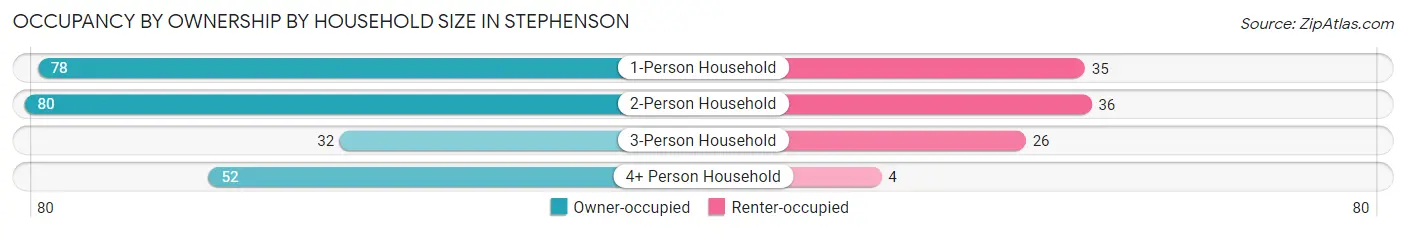
| Household Size | Owner-occupied | Renter-occupied |
| 1-Person Household | 78 (69.0%) | 35 (31.0%) |
| 2-Person Household | 80 (69.0%) | 36 (31.0%) |
| 3-Person Household | 32 (55.2%) | 26 (44.8%) |
| 4+ Person Household | 52 (92.9%) | 4 (7.1%) |
| Total Housing Units | 242 (70.6%) | 101 (29.4%) |
Occupancy by Educational Attainment in Stephenson
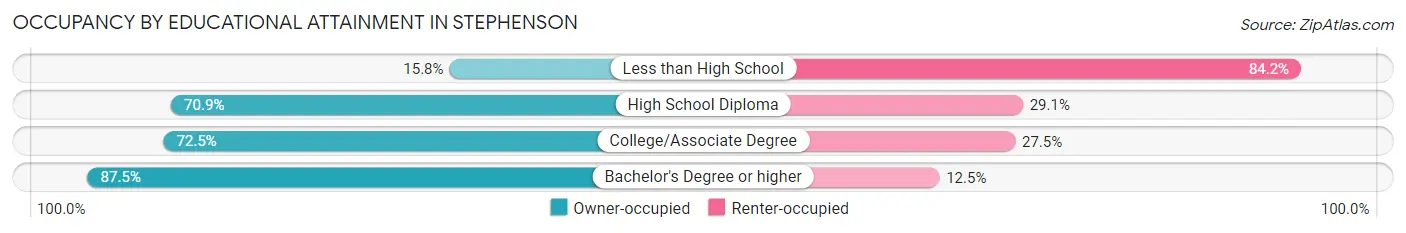
| Household Size | Owner-occupied | Renter-occupied |
| Less than High School | 3 (15.8%) | 16 (84.2%) |
| High School Diploma | 83 (70.9%) | 34 (29.1%) |
| College/Associate Degree | 121 (72.5%) | 46 (27.5%) |
| Bachelor's Degree or higher | 35 (87.5%) | 5 (12.5%) |
Occupancy by Age of Householder in Stephenson
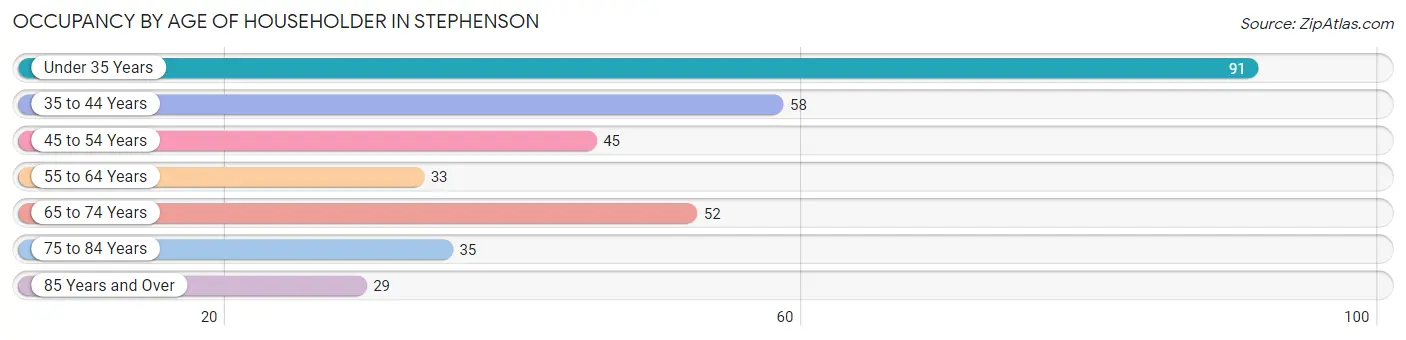
| Age Bracket | # Households | % Households |
| Under 35 Years | 91 | 26.5% |
| 35 to 44 Years | 58 | 16.9% |
| 45 to 54 Years | 45 | 13.1% |
| 55 to 64 Years | 33 | 9.6% |
| 65 to 74 Years | 52 | 15.2% |
| 75 to 84 Years | 35 | 10.2% |
| 85 Years and Over | 29 | 8.5% |
| Total | 343 | 100.0% |
Housing Finances in Stephenson
Median Income by Occupancy in Stephenson
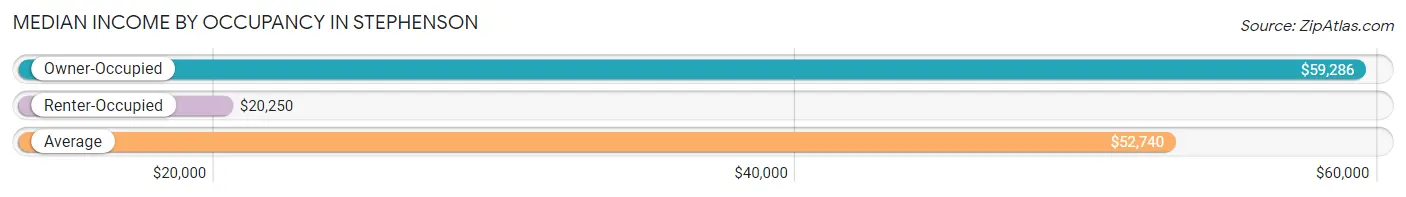
| Occupancy Type | # Households | Median Income |
| Owner-Occupied | 242 (70.6%) | $59,286 |
| Renter-Occupied | 101 (29.4%) | $20,250 |
| Average | 343 (100.0%) | $52,740 |
Occupancy by Householder Income Bracket in Stephenson
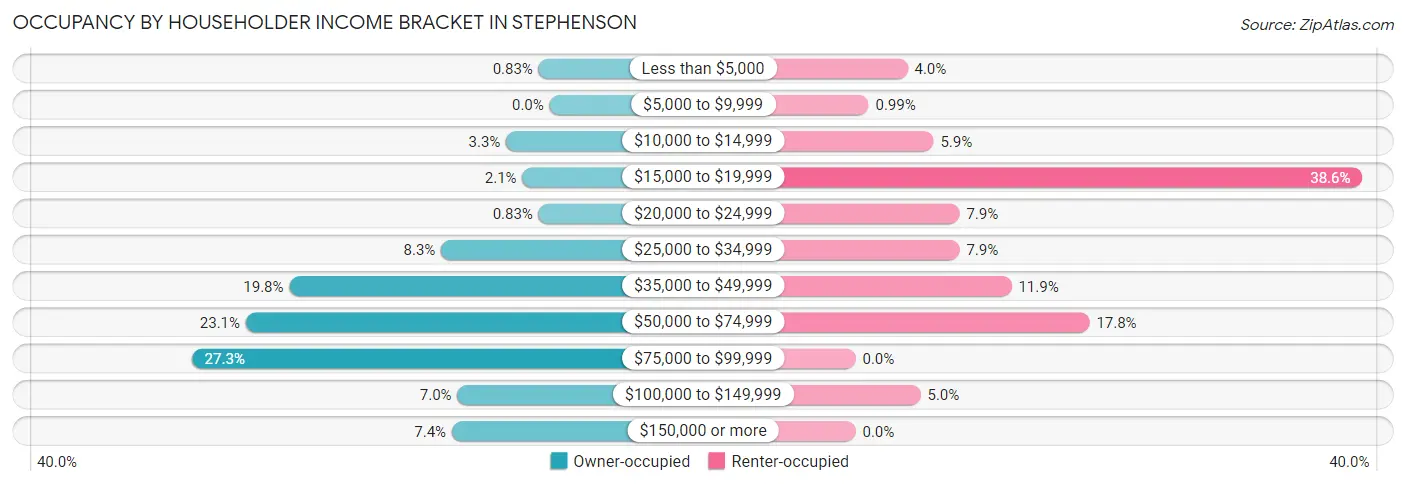
| Income Bracket | Owner-occupied | Renter-occupied |
| Less than $5,000 | 2 (0.8%) | 4 (4.0%) |
| $5,000 to $9,999 | 0 (0.0%) | 1 (1.0%) |
| $10,000 to $14,999 | 8 (3.3%) | 6 (5.9%) |
| $15,000 to $19,999 | 5 (2.1%) | 39 (38.6%) |
| $20,000 to $24,999 | 2 (0.8%) | 8 (7.9%) |
| $25,000 to $34,999 | 20 (8.3%) | 8 (7.9%) |
| $35,000 to $49,999 | 48 (19.8%) | 12 (11.9%) |
| $50,000 to $74,999 | 56 (23.1%) | 18 (17.8%) |
| $75,000 to $99,999 | 66 (27.3%) | 0 (0.0%) |
| $100,000 to $149,999 | 17 (7.0%) | 5 (5.0%) |
| $150,000 or more | 18 (7.4%) | 0 (0.0%) |
| Total | 242 (100.0%) | 101 (100.0%) |
Monthly Housing Cost Tiers in Stephenson
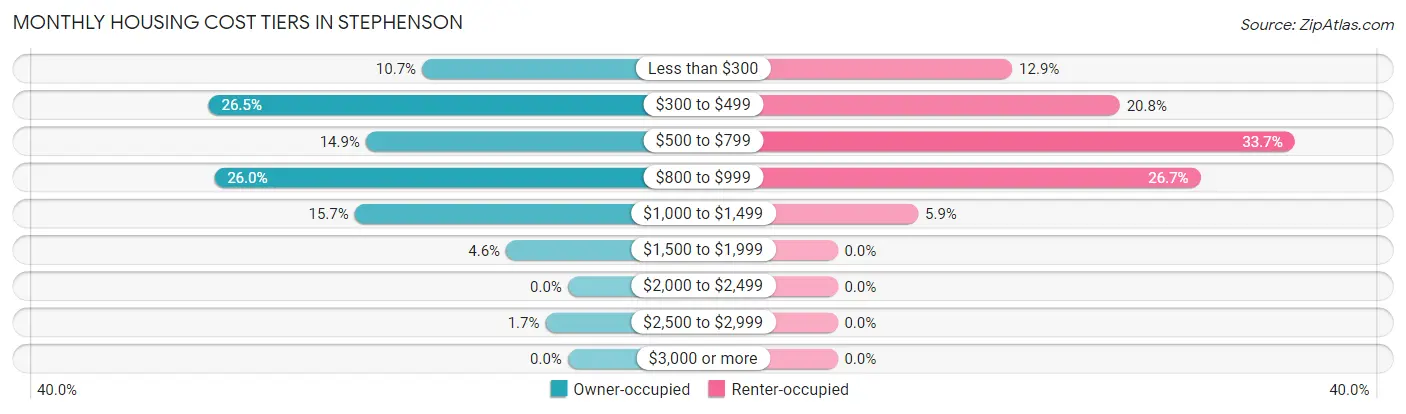
| Monthly Cost | Owner-occupied | Renter-occupied |
| Less than $300 | 26 (10.7%) | 13 (12.9%) |
| $300 to $499 | 64 (26.5%) | 21 (20.8%) |
| $500 to $799 | 36 (14.9%) | 34 (33.7%) |
| $800 to $999 | 63 (26.0%) | 27 (26.7%) |
| $1,000 to $1,499 | 38 (15.7%) | 6 (5.9%) |
| $1,500 to $1,999 | 11 (4.5%) | 0 (0.0%) |
| $2,000 to $2,499 | 0 (0.0%) | 0 (0.0%) |
| $2,500 to $2,999 | 4 (1.7%) | 0 (0.0%) |
| $3,000 or more | 0 (0.0%) | 0 (0.0%) |
| Total | 242 (100.0%) | 101 (100.0%) |
Physical Housing Characteristics in Stephenson
Housing Structures in Stephenson
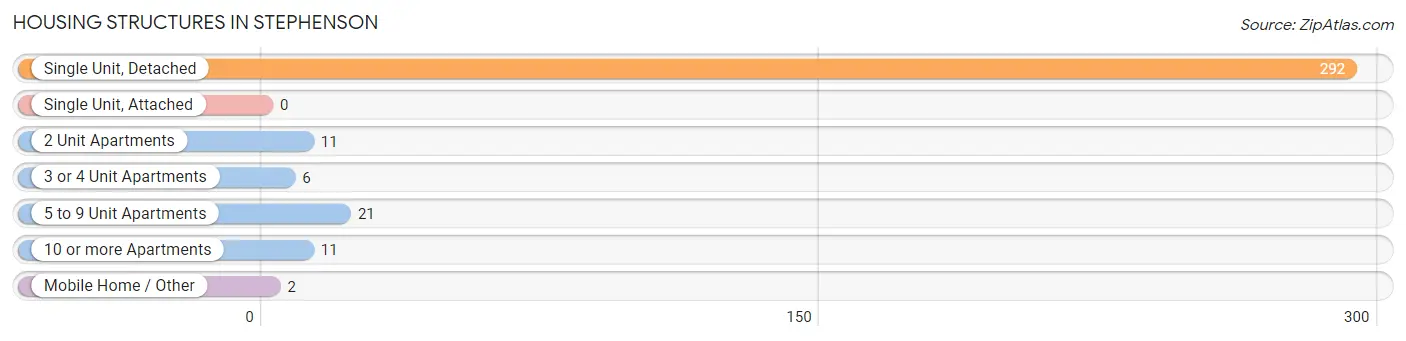
| Structure Type | # Housing Units | % Housing Units |
| Single Unit, Detached | 292 | 85.1% |
| Single Unit, Attached | 0 | 0.0% |
| 2 Unit Apartments | 11 | 3.2% |
| 3 or 4 Unit Apartments | 6 | 1.8% |
| 5 to 9 Unit Apartments | 21 | 6.1% |
| 10 or more Apartments | 11 | 3.2% |
| Mobile Home / Other | 2 | 0.6% |
| Total | 343 | 100.0% |
Housing Structures by Occupancy in Stephenson
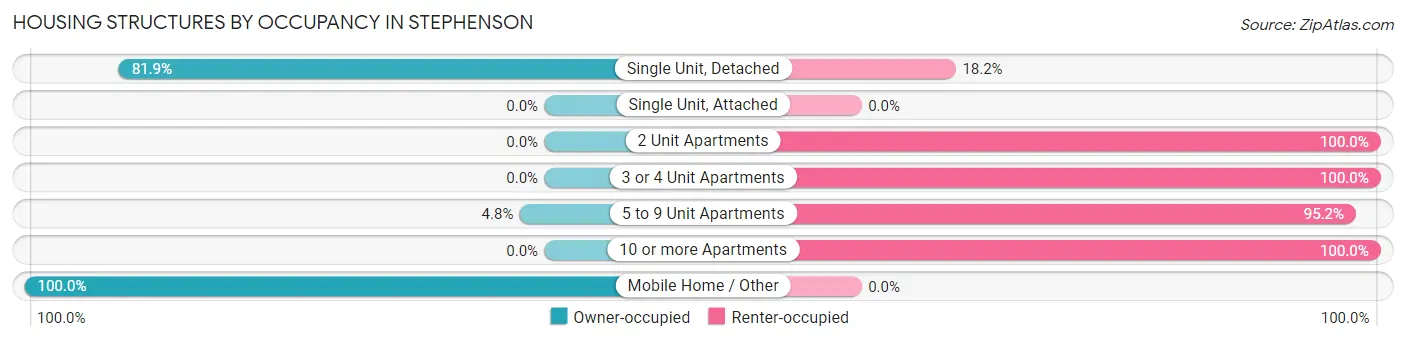
| Structure Type | Owner-occupied | Renter-occupied |
| Single Unit, Detached | 239 (81.9%) | 53 (18.1%) |
| Single Unit, Attached | 0 (0.0%) | 0 (0.0%) |
| 2 Unit Apartments | 0 (0.0%) | 11 (100.0%) |
| 3 or 4 Unit Apartments | 0 (0.0%) | 6 (100.0%) |
| 5 to 9 Unit Apartments | 1 (4.8%) | 20 (95.2%) |
| 10 or more Apartments | 0 (0.0%) | 11 (100.0%) |
| Mobile Home / Other | 2 (100.0%) | 0 (0.0%) |
| Total | 242 (70.6%) | 101 (29.4%) |
Housing Structures by Number of Rooms in Stephenson
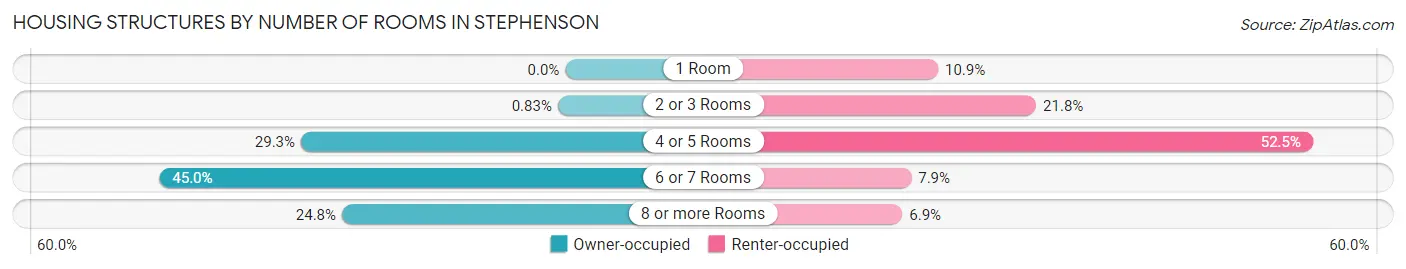
| Number of Rooms | Owner-occupied | Renter-occupied |
| 1 Room | 0 (0.0%) | 11 (10.9%) |
| 2 or 3 Rooms | 2 (0.8%) | 22 (21.8%) |
| 4 or 5 Rooms | 71 (29.3%) | 53 (52.5%) |
| 6 or 7 Rooms | 109 (45.0%) | 8 (7.9%) |
| 8 or more Rooms | 60 (24.8%) | 7 (6.9%) |
| Total | 242 (100.0%) | 101 (100.0%) |
Housing Structure by Heating Type in Stephenson
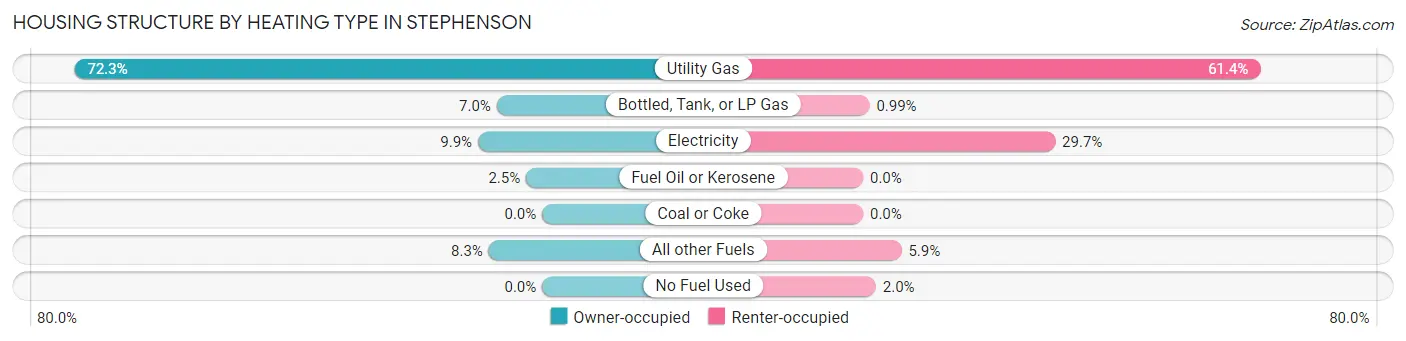
| Heating Type | Owner-occupied | Renter-occupied |
| Utility Gas | 175 (72.3%) | 62 (61.4%) |
| Bottled, Tank, or LP Gas | 17 (7.0%) | 1 (1.0%) |
| Electricity | 24 (9.9%) | 30 (29.7%) |
| Fuel Oil or Kerosene | 6 (2.5%) | 0 (0.0%) |
| Coal or Coke | 0 (0.0%) | 0 (0.0%) |
| All other Fuels | 20 (8.3%) | 6 (5.9%) |
| No Fuel Used | 0 (0.0%) | 2 (2.0%) |
| Total | 242 (100.0%) | 101 (100.0%) |
Household Vehicle Usage in Stephenson
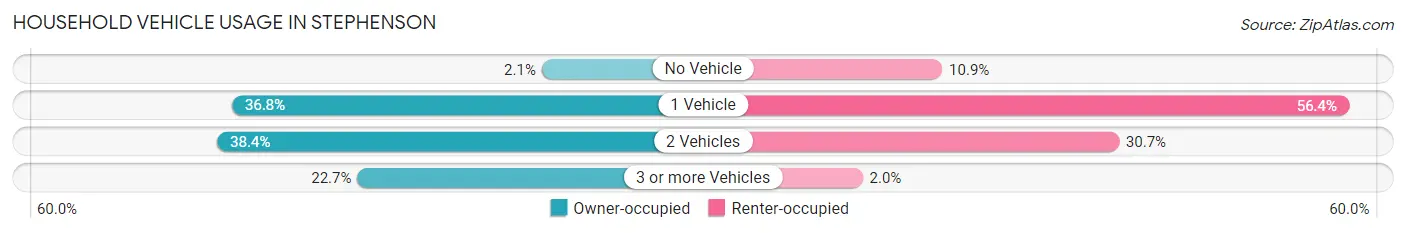
| Vehicles per Household | Owner-occupied | Renter-occupied |
| No Vehicle | 5 (2.1%) | 11 (10.9%) |
| 1 Vehicle | 89 (36.8%) | 57 (56.4%) |
| 2 Vehicles | 93 (38.4%) | 31 (30.7%) |
| 3 or more Vehicles | 55 (22.7%) | 2 (2.0%) |
| Total | 242 (100.0%) | 101 (100.0%) |
Real Estate & Mortgages in Stephenson
Real Estate and Mortgage Overview in Stephenson
| Characteristic | Without Mortgage | With Mortgage |
| Housing Units | 106 | 136 |
| Median Property Value | $94,100 | $105,000 |
| Median Household Income | $51,250 | $16 |
| Monthly Housing Costs | $373 | $0 |
| Real Estate Taxes | $1,280 | $3 |
Property Value by Mortgage Status in Stephenson
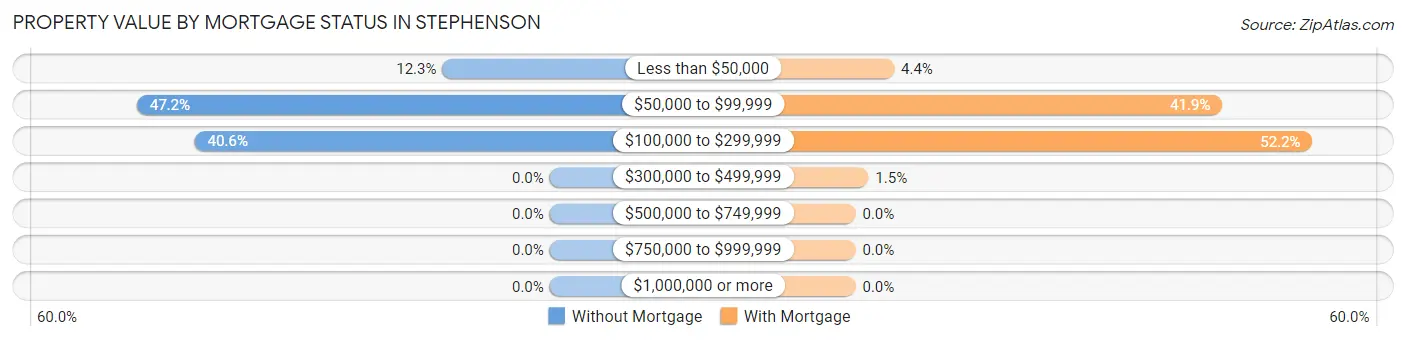
| Property Value | Without Mortgage | With Mortgage |
| Less than $50,000 | 13 (12.3%) | 6 (4.4%) |
| $50,000 to $99,999 | 50 (47.2%) | 57 (41.9%) |
| $100,000 to $299,999 | 43 (40.6%) | 71 (52.2%) |
| $300,000 to $499,999 | 0 (0.0%) | 2 (1.5%) |
| $500,000 to $749,999 | 0 (0.0%) | 0 (0.0%) |
| $750,000 to $999,999 | 0 (0.0%) | 0 (0.0%) |
| $1,000,000 or more | 0 (0.0%) | 0 (0.0%) |
| Total | 106 (100.0%) | 136 (100.0%) |
Household Income by Mortgage Status in Stephenson
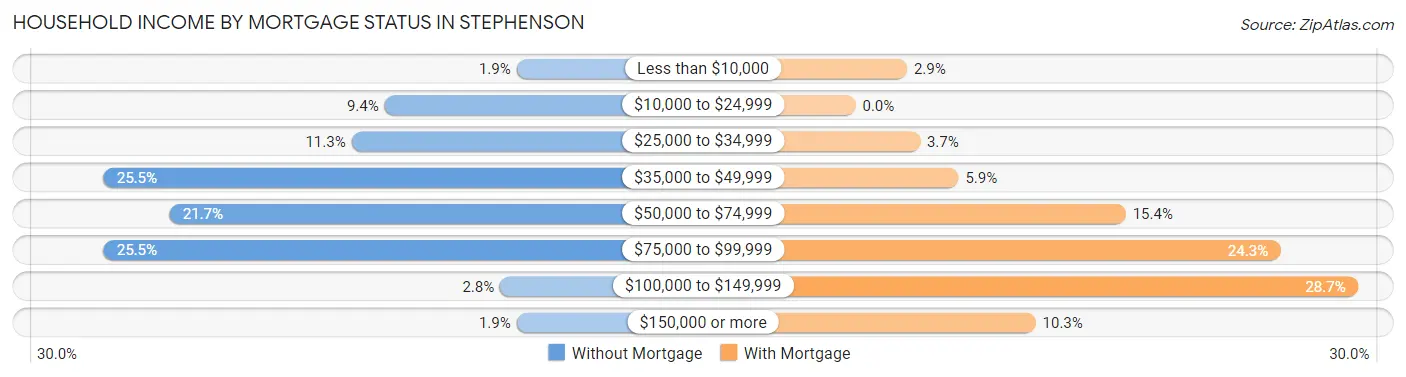
| Household Income | Without Mortgage | With Mortgage |
| Less than $10,000 | 2 (1.9%) | 4 (2.9%) |
| $10,000 to $24,999 | 10 (9.4%) | 0 (0.0%) |
| $25,000 to $34,999 | 12 (11.3%) | 5 (3.7%) |
| $35,000 to $49,999 | 27 (25.5%) | 8 (5.9%) |
| $50,000 to $74,999 | 23 (21.7%) | 21 (15.4%) |
| $75,000 to $99,999 | 27 (25.5%) | 33 (24.3%) |
| $100,000 to $149,999 | 3 (2.8%) | 39 (28.7%) |
| $150,000 or more | 2 (1.9%) | 14 (10.3%) |
| Total | 106 (100.0%) | 136 (100.0%) |
Property Value to Household Income Ratio in Stephenson
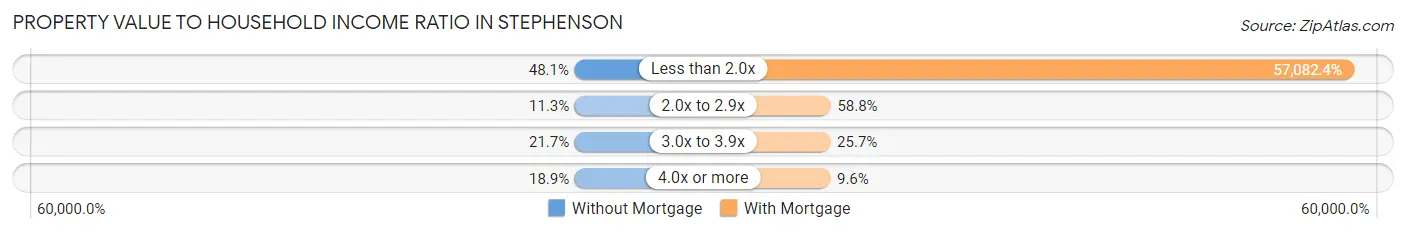
| Value-to-Income Ratio | Without Mortgage | With Mortgage |
| Less than 2.0x | 51 (48.1%) | 77,632 (57,082.3%) |
| 2.0x to 2.9x | 12 (11.3%) | 80 (58.8%) |
| 3.0x to 3.9x | 23 (21.7%) | 35 (25.7%) |
| 4.0x or more | 20 (18.9%) | 13 (9.6%) |
| Total | 106 (100.0%) | 136 (100.0%) |
Real Estate Taxes by Mortgage Status in Stephenson
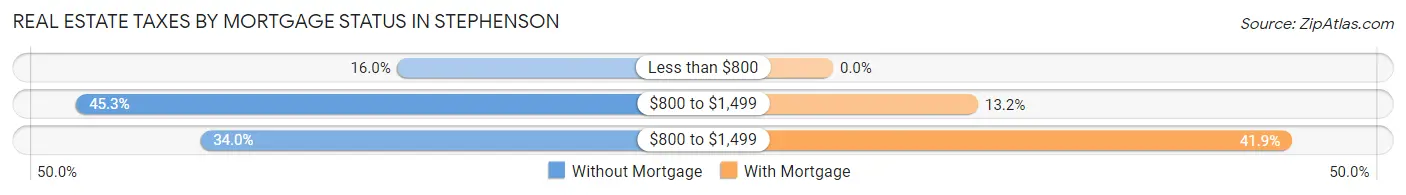
| Property Taxes | Without Mortgage | With Mortgage |
| Less than $800 | 17 (16.0%) | 0 (0.0%) |
| $800 to $1,499 | 48 (45.3%) | 18 (13.2%) |
| $800 to $1,499 | 36 (34.0%) | 57 (41.9%) |
| Total | 106 (100.0%) | 136 (100.0%) |
Health & Disability in Stephenson
Health Insurance Coverage by Age in Stephenson
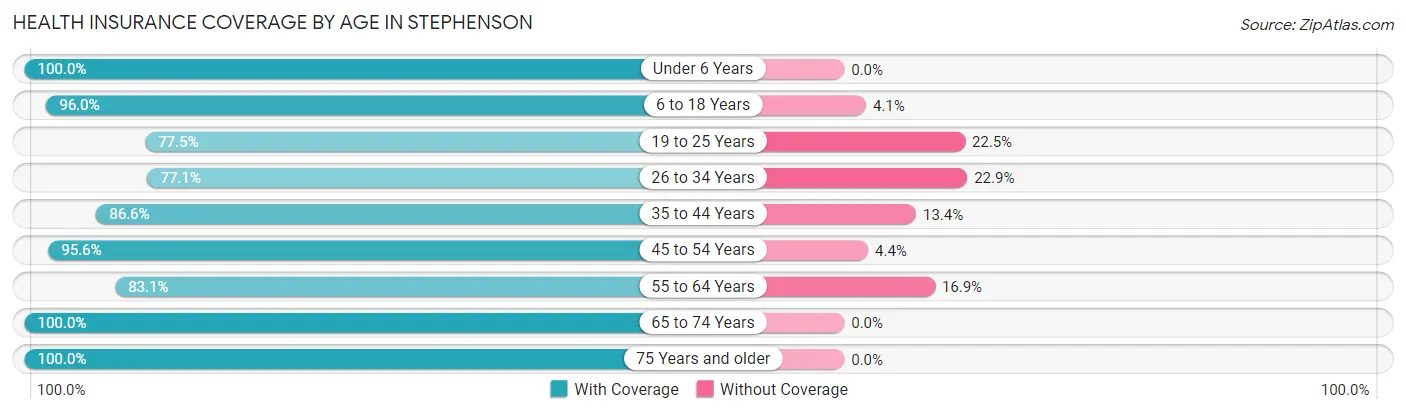
| Age Bracket | With Coverage | Without Coverage |
| Under 6 Years | 63 (100.0%) | 0 (0.0%) |
| 6 to 18 Years | 166 (96.0%) | 7 (4.1%) |
| 19 to 25 Years | 31 (77.5%) | 9 (22.5%) |
| 26 to 34 Years | 121 (77.1%) | 36 (22.9%) |
| 35 to 44 Years | 97 (86.6%) | 15 (13.4%) |
| 45 to 54 Years | 86 (95.6%) | 4 (4.4%) |
| 55 to 64 Years | 59 (83.1%) | 12 (16.9%) |
| 65 to 74 Years | 83 (100.0%) | 0 (0.0%) |
| 75 Years and older | 87 (100.0%) | 0 (0.0%) |
| Total | 793 (90.5%) | 83 (9.5%) |
Health Insurance Coverage by Citizenship Status in Stephenson
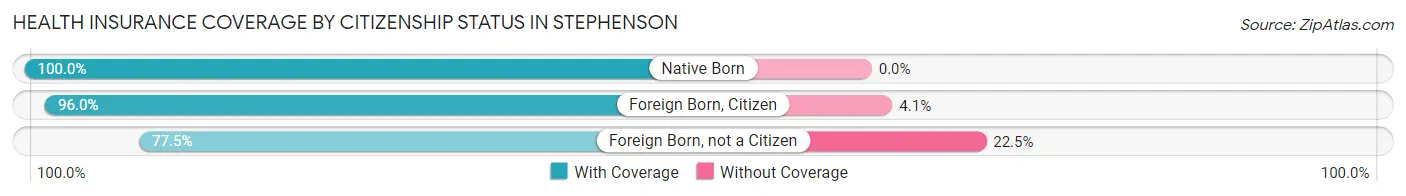
| Citizenship Status | With Coverage | Without Coverage |
| Native Born | 63 (100.0%) | 0 (0.0%) |
| Foreign Born, Citizen | 166 (96.0%) | 7 (4.1%) |
| Foreign Born, not a Citizen | 31 (77.5%) | 9 (22.5%) |
Health Insurance Coverage by Household Income in Stephenson
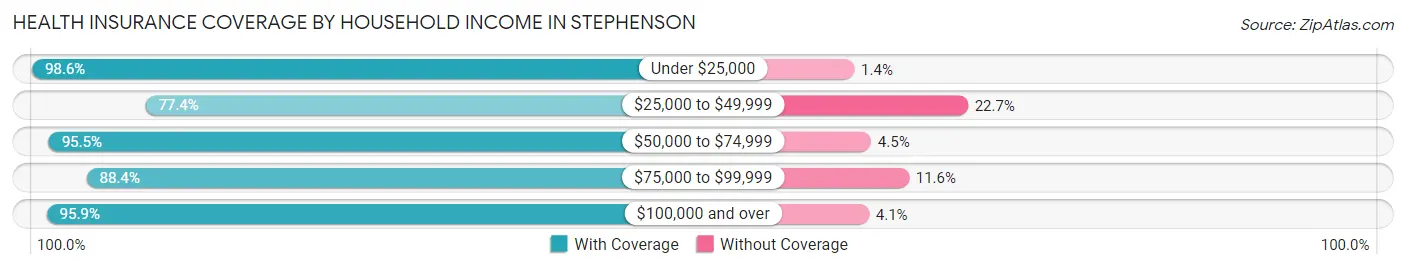
| Household Income | With Coverage | Without Coverage |
| Under $25,000 | 143 (98.6%) | 2 (1.4%) |
| $25,000 to $49,999 | 140 (77.3%) | 41 (22.7%) |
| $50,000 to $74,999 | 190 (95.5%) | 9 (4.5%) |
| $75,000 to $99,999 | 198 (88.4%) | 26 (11.6%) |
| $100,000 and over | 116 (95.9%) | 5 (4.1%) |
Public vs Private Health Insurance Coverage by Age in Stephenson
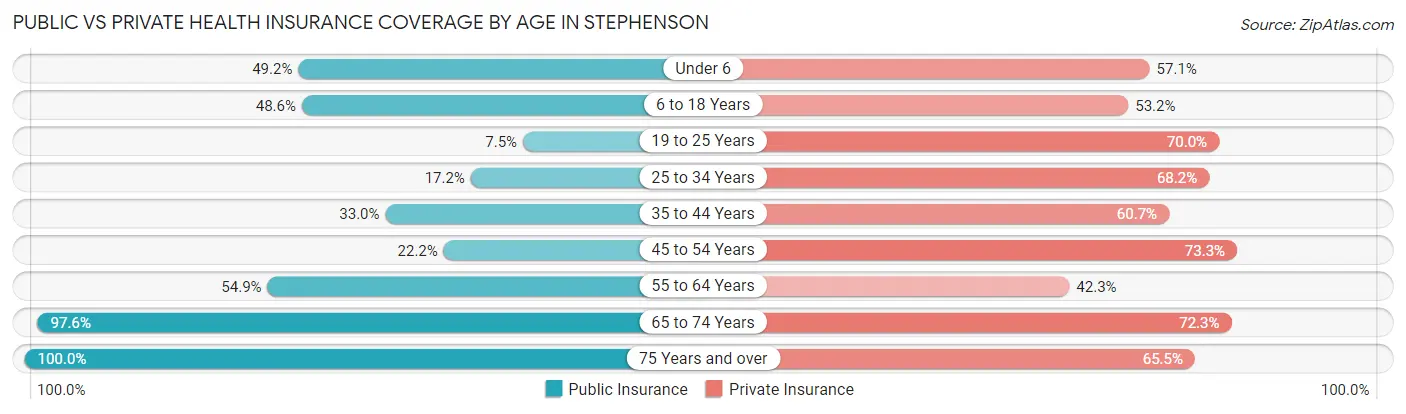
| Age Bracket | Public Insurance | Private Insurance |
| Under 6 | 31 (49.2%) | 36 (57.1%) |
| 6 to 18 Years | 84 (48.5%) | 92 (53.2%) |
| 19 to 25 Years | 3 (7.5%) | 28 (70.0%) |
| 25 to 34 Years | 27 (17.2%) | 107 (68.1%) |
| 35 to 44 Years | 37 (33.0%) | 68 (60.7%) |
| 45 to 54 Years | 20 (22.2%) | 66 (73.3%) |
| 55 to 64 Years | 39 (54.9%) | 30 (42.2%) |
| 65 to 74 Years | 81 (97.6%) | 60 (72.3%) |
| 75 Years and over | 87 (100.0%) | 57 (65.5%) |
| Total | 409 (46.7%) | 544 (62.1%) |
Disability Status by Sex by Age in Stephenson
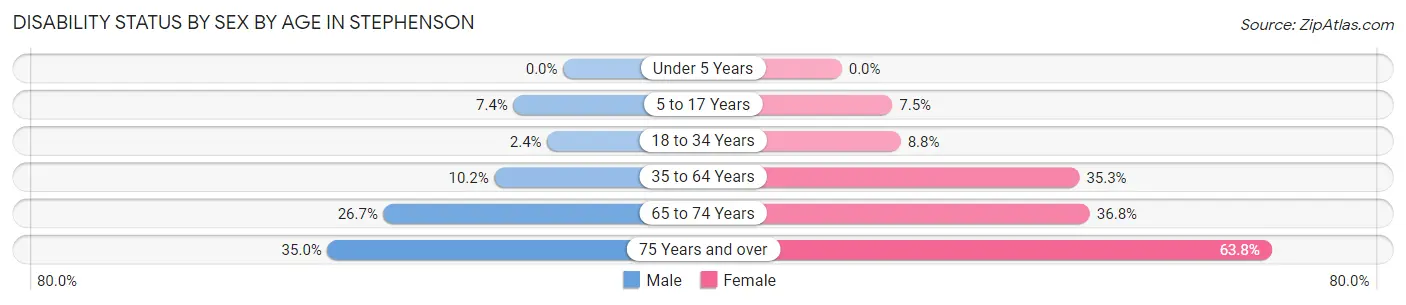
| Age Bracket | Male | Female |
| Under 5 Years | 0 (0.0%) | 0 (0.0%) |
| 5 to 17 Years | 7 (7.4%) | 6 (7.5%) |
| 18 to 34 Years | 3 (2.4%) | 7 (8.7%) |
| 35 to 64 Years | 14 (10.2%) | 48 (35.3%) |
| 65 to 74 Years | 12 (26.7%) | 14 (36.8%) |
| 75 Years and over | 14 (35.0%) | 30 (63.8%) |
Disability Class by Sex by Age in Stephenson
Disability Class: Hearing Difficulty
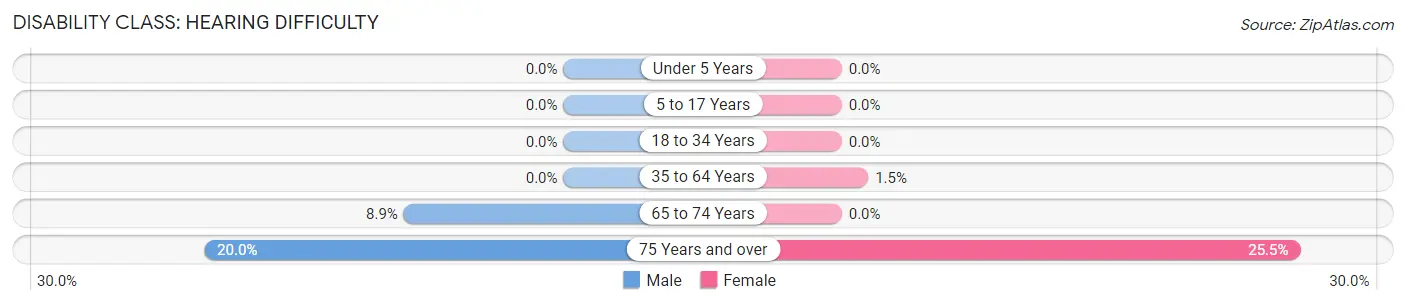
| Age Bracket | Male | Female |
| Under 5 Years | 0 (0.0%) | 0 (0.0%) |
| 5 to 17 Years | 0 (0.0%) | 0 (0.0%) |
| 18 to 34 Years | 0 (0.0%) | 0 (0.0%) |
| 35 to 64 Years | 0 (0.0%) | 2 (1.5%) |
| 65 to 74 Years | 4 (8.9%) | 0 (0.0%) |
| 75 Years and over | 8 (20.0%) | 12 (25.5%) |
Disability Class: Vision Difficulty
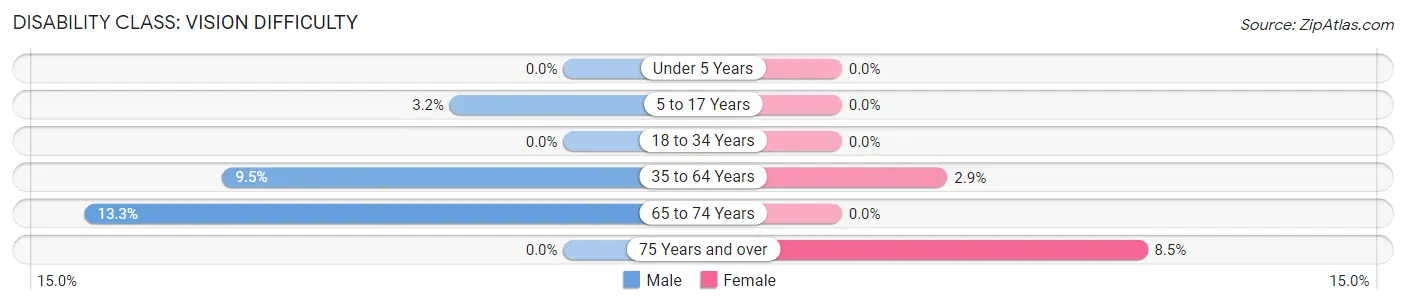
| Age Bracket | Male | Female |
| Under 5 Years | 0 (0.0%) | 0 (0.0%) |
| 5 to 17 Years | 3 (3.2%) | 0 (0.0%) |
| 18 to 34 Years | 0 (0.0%) | 0 (0.0%) |
| 35 to 64 Years | 13 (9.5%) | 4 (2.9%) |
| 65 to 74 Years | 6 (13.3%) | 0 (0.0%) |
| 75 Years and over | 0 (0.0%) | 4 (8.5%) |
Disability Class: Cognitive Difficulty
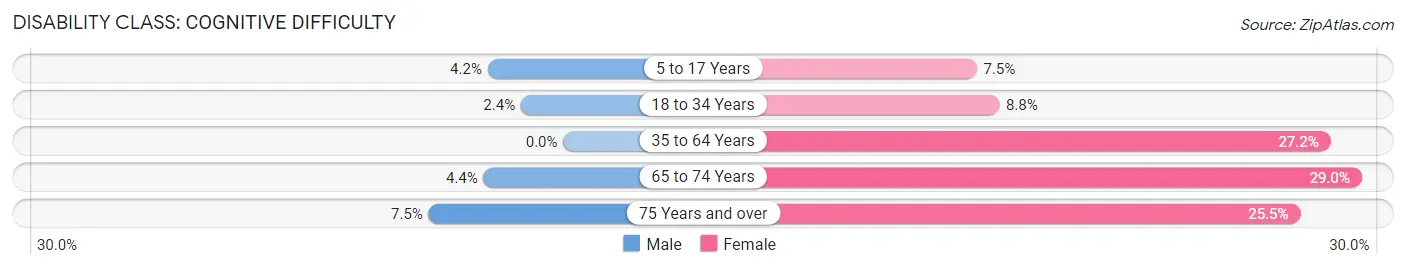
| Age Bracket | Male | Female |
| 5 to 17 Years | 4 (4.2%) | 6 (7.5%) |
| 18 to 34 Years | 3 (2.4%) | 7 (8.7%) |
| 35 to 64 Years | 0 (0.0%) | 37 (27.2%) |
| 65 to 74 Years | 2 (4.4%) | 11 (28.9%) |
| 75 Years and over | 3 (7.5%) | 12 (25.5%) |
Disability Class: Ambulatory Difficulty
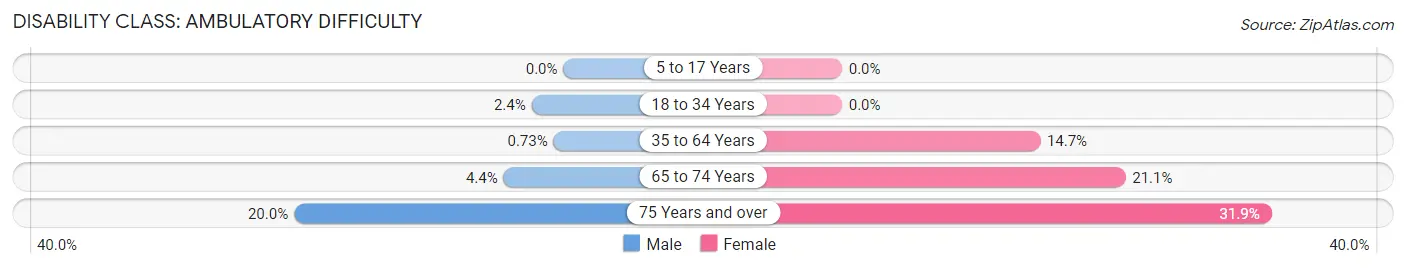
| Age Bracket | Male | Female |
| 5 to 17 Years | 0 (0.0%) | 0 (0.0%) |
| 18 to 34 Years | 3 (2.4%) | 0 (0.0%) |
| 35 to 64 Years | 1 (0.7%) | 20 (14.7%) |
| 65 to 74 Years | 2 (4.4%) | 8 (21.0%) |
| 75 Years and over | 8 (20.0%) | 15 (31.9%) |
Disability Class: Self-Care Difficulty
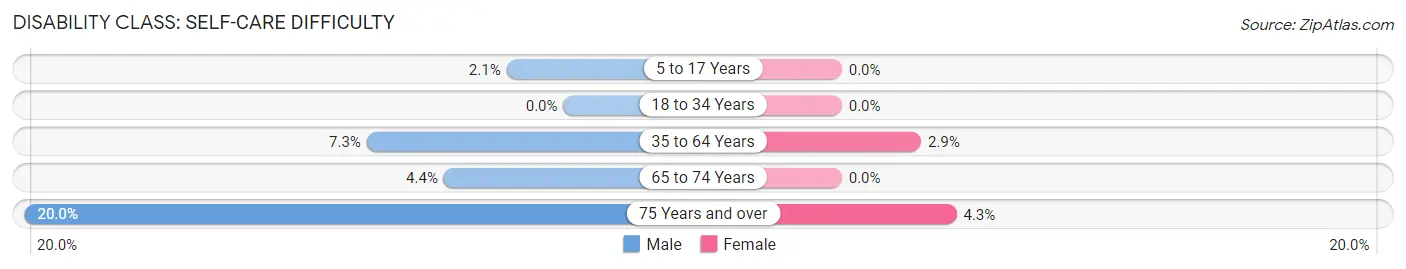
| Age Bracket | Male | Female |
| 5 to 17 Years | 2 (2.1%) | 0 (0.0%) |
| 18 to 34 Years | 0 (0.0%) | 0 (0.0%) |
| 35 to 64 Years | 10 (7.3%) | 4 (2.9%) |
| 65 to 74 Years | 2 (4.4%) | 0 (0.0%) |
| 75 Years and over | 8 (20.0%) | 2 (4.3%) |
Technology Access in Stephenson
Computing Device Access in Stephenson
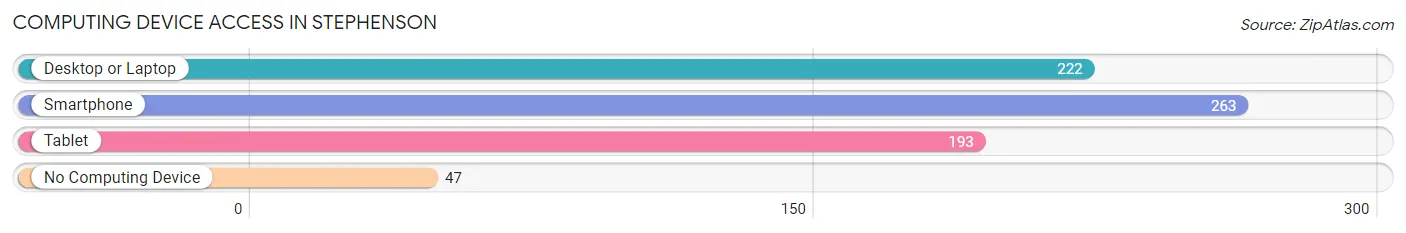
| Device Type | # Households | % Households |
| Desktop or Laptop | 222 | 64.7% |
| Smartphone | 263 | 76.7% |
| Tablet | 193 | 56.3% |
| No Computing Device | 47 | 13.7% |
| Total | 343 | 100.0% |
Internet Access in Stephenson
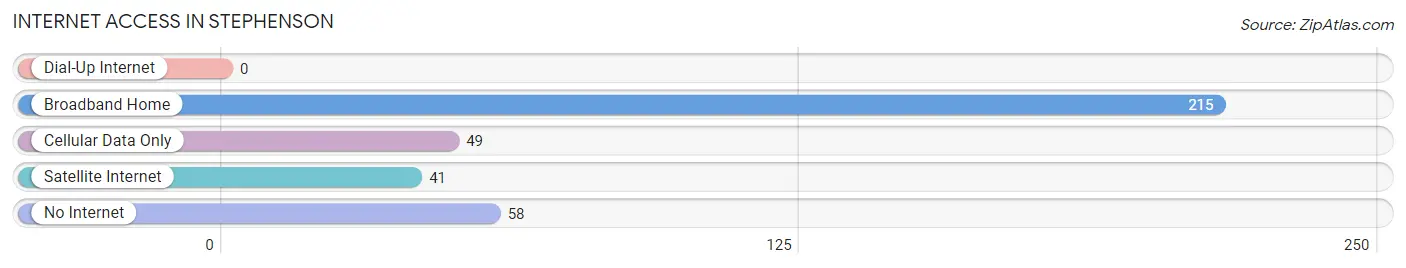
| Internet Type | # Households | % Households |
| Dial-Up Internet | 0 | 0.0% |
| Broadband Home | 215 | 62.7% |
| Cellular Data Only | 49 | 14.3% |
| Satellite Internet | 41 | 11.9% |
| No Internet | 58 | 16.9% |
| Total | 343 | 100.0% |
Stephenson Summary
Stephenson is a small unincorporated community located in Menominee County, Michigan. It is situated in the Upper Peninsula of Michigan, approximately 20 miles south of the city of Escanaba. The community is located on the banks of the Menominee River, and is surrounded by the Menominee State Forest.
History
The area that is now Stephenson was first settled in the late 1800s by a group of Finnish immigrants. The immigrants were attracted to the area due to its abundance of natural resources, including timber and fish. The community was originally known as “Finn Town”, and was later renamed “Stephenson” after the first postmaster, John Stephenson.
The community grew slowly over the years, and by the early 1900s, it had become a bustling logging town. The town was home to several sawmills, a general store, a blacksmith shop, and a school. The town also had a thriving fishing industry, and was home to several commercial fishing boats.
In the 1950s, the logging industry began to decline, and the town’s population began to dwindle. The town’s economy shifted to tourism, and the town became a popular destination for outdoor recreation. The town is now home to several campgrounds, and is a popular destination for hunting, fishing, and snowmobiling.
Geography
Stephenson is located in the Upper Peninsula of Michigan, approximately 20 miles south of the city of Escanaba. The community is situated on the banks of the Menominee River, and is surrounded by the Menominee State Forest. The area is characterized by rolling hills, dense forests, and numerous lakes and streams.
The climate in Stephenson is typical of the Upper Peninsula, with cold winters and mild summers. The average temperature in the winter is around 20 degrees Fahrenheit, and the average temperature in the summer is around 70 degrees Fahrenheit. The area receives an average of 40 inches of snowfall each year.
Economy
The economy of Stephenson is largely based on tourism. The town is home to several campgrounds, and is a popular destination for hunting, fishing, and snowmobiling. The town is also home to several small businesses, including a general store, a restaurant, and a gas station.
The town is also home to several logging companies, which harvest timber from the surrounding forests. The timber is then processed at local sawmills and sold to lumber companies.
Demographics
As of the 2010 census, the population of Stephenson was 1,093. The population is largely white (97.3%), with a small percentage of Native American (1.2%) and African American (0.5%) residents. The median household income is $37,500, and the median home value is $90,000.
The town is served by the Stephenson-Spalding School District, which consists of one elementary school and one high school. The town is also home to a branch of the Menominee County Library.
Conclusion
Stephenson is a small unincorporated community located in Menominee County, Michigan. It is situated in the Upper Peninsula of Michigan, approximately 20 miles south of the city of Escanaba. The community is located on the banks of the Menominee River, and is surrounded by the Menominee State Forest. The economy of Stephenson is largely based on tourism, and the town is home to several small businesses. The population of Stephenson is largely white, with a small percentage of Native American and African American residents. The town is served by the Stephenson-Spalding School District, and is home to a branch of the Menominee County Library.
Common Questions
What is Per Capita Income in Stephenson?
Per Capita income in Stephenson is $24,286.
What is the Median Family Income in Stephenson?
Median Family Income in Stephenson is $54,583.
What is the Median Household income in Stephenson?
Median Household Income in Stephenson is $52,740.
What is Income or Wage Gap in Stephenson?
Income or Wage Gap in Stephenson is 53.9%.
Women in Stephenson earn 46.1 cents for every dollar earned by a man.
What is Family Income Deficit in Stephenson?
Family Income Deficit in Stephenson is $5,391.
Families that are below poverty line in Stephenson earn $5,391 less on average than the poverty threshold level.
What is Inequality or Gini Index in Stephenson?
Inequality or Gini Index in Stephenson is 0.37.
What is the Total Population of Stephenson?
Total Population of Stephenson is 933.
What is the Total Male Population of Stephenson?
Total Male Population of Stephenson is 483.
What is the Total Female Population of Stephenson?
Total Female Population of Stephenson is 450.
What is the Ratio of Males per 100 Females in Stephenson?
There are 107.33 Males per 100 Females in Stephenson.
What is the Ratio of Females per 100 Males in Stephenson?
There are 93.17 Females per 100 Males in Stephenson.
What is the Median Population Age in Stephenson?
Median Population Age in Stephenson is 37.9 Years.
What is the Average Family Size in Stephenson
Average Family Size in Stephenson is 3.2 People.
What is the Average Household Size in Stephenson
Average Household Size in Stephenson is 2.5 People.
How Large is the Labor Force in Stephenson?
There are 400 People in the Labor Forcein in Stephenson.
What is the Percentage of People in the Labor Force in Stephenson?
55.4% of People are in the Labor Force in Stephenson.
What is the Unemployment Rate in Stephenson?
Unemployment Rate in Stephenson is 2.0%.