South Monroe, MI Map & Demographics
South Monroe Map
South Monroe Overview
$31,464
PER CAPITA INCOME
$66,181
AVG FAMILY INCOME
$51,518
AVG HOUSEHOLD INCOME
37.2%
WAGE / INCOME GAP [ % ]
62.8¢/ $1
WAGE / INCOME GAP [ $ ]
0.45
INEQUALITY / GINI INDEX
6,658
TOTAL POPULATION
3,342
MALE POPULATION
3,316
FEMALE POPULATION
100.78
MALES / 100 FEMALES
99.22
FEMALES / 100 MALES
42.5
MEDIAN AGE
2.9
AVG FAMILY SIZE
2.3
AVG HOUSEHOLD SIZE
3,077
LABOR FORCE [ PEOPLE ]
55.3%
PERCENT IN LABOR FORCE
11.0%
UNEMPLOYMENT RATE
Income in South Monroe
Income Overview in South Monroe
Per Capita Income in South Monroe is $31,464, while median incomes of families and households are $66,181 and $51,518 respectively.
| Characteristic | Number | Measure |
| Per Capita Income | 6,658 | $31,464 |
| Median Family Income | 1,777 | $66,181 |
| Mean Family Income | 1,777 | $84,999 |
| Median Household Income | 2,834 | $51,518 |
| Mean Household Income | 2,834 | $71,828 |
| Income Deficit | 1,777 | $0 |
| Wage / Income Gap (%) | 6,658 | 37.23% |
| Wage / Income Gap ($) | 6,658 | 62.77¢ per $1 |
| Gini / Inequality Index | 6,658 | 0.45 |
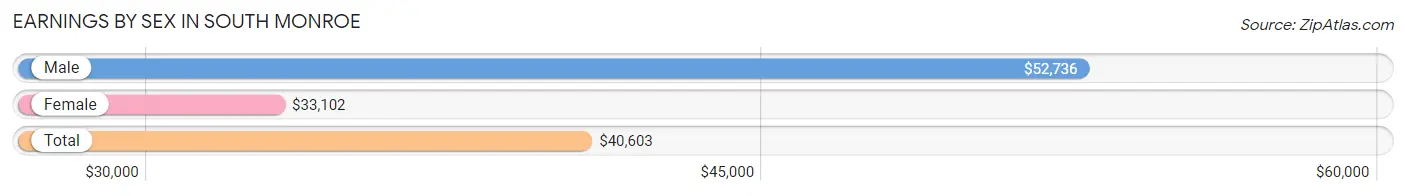
Earnings by Sex in South Monroe
Average Earnings in South Monroe are $40,603, $52,736 for men and $33,102 for women, a difference of 37.2%.
| Sex | Number | Average Earnings |
| Male | 1,525 (49.0%) | $52,736 |
| Female | 1,585 (51.0%) | $33,102 |
| Total | 3,110 (100.0%) | $40,603 |
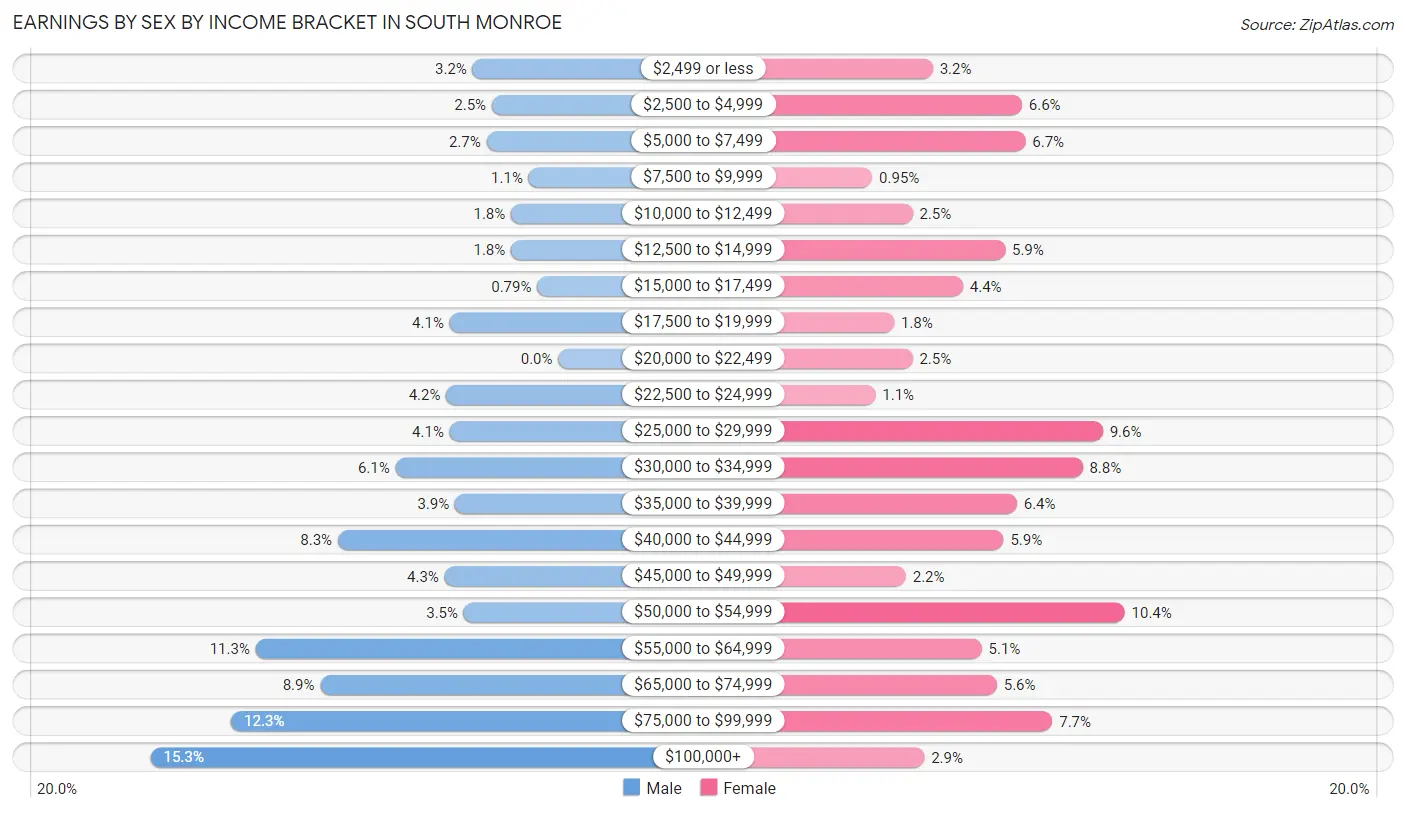
Earnings by Sex by Income Bracket in South Monroe
The most common earnings brackets in South Monroe are $100,000+ for men (233 | 15.3%) and $50,000 to $54,999 for women (165 | 10.4%).
| Income | Male | Female |
| $2,499 or less | 49 (3.2%) | 51 (3.2%) |
| $2,500 to $4,999 | 38 (2.5%) | 104 (6.6%) |
| $5,000 to $7,499 | 41 (2.7%) | 106 (6.7%) |
| $7,500 to $9,999 | 17 (1.1%) | 15 (0.9%) |
| $10,000 to $12,499 | 27 (1.8%) | 39 (2.5%) |
| $12,500 to $14,999 | 27 (1.8%) | 94 (5.9%) |
| $15,000 to $17,499 | 12 (0.8%) | 69 (4.3%) |
| $17,500 to $19,999 | 62 (4.1%) | 28 (1.8%) |
| $20,000 to $22,499 | 0 (0.0%) | 39 (2.5%) |
| $22,500 to $24,999 | 64 (4.2%) | 17 (1.1%) |
| $25,000 to $29,999 | 62 (4.1%) | 152 (9.6%) |
| $30,000 to $34,999 | 93 (6.1%) | 140 (8.8%) |
| $35,000 to $39,999 | 59 (3.9%) | 101 (6.4%) |
| $40,000 to $44,999 | 126 (8.3%) | 93 (5.9%) |
| $45,000 to $49,999 | 65 (4.3%) | 35 (2.2%) |
| $50,000 to $54,999 | 54 (3.5%) | 165 (10.4%) |
| $55,000 to $64,999 | 173 (11.3%) | 80 (5.1%) |
| $65,000 to $74,999 | 136 (8.9%) | 89 (5.6%) |
| $75,000 to $99,999 | 187 (12.3%) | 122 (7.7%) |
| $100,000+ | 233 (15.3%) | 46 (2.9%) |
| Total | 1,525 (100.0%) | 1,585 (100.0%) |
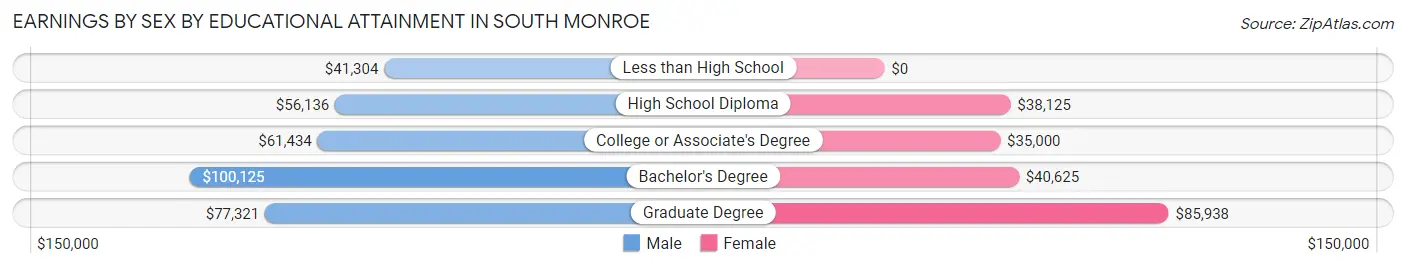
Earnings by Sex by Educational Attainment in South Monroe
Average earnings in South Monroe are $60,087 for men and $36,681 for women, a difference of 39.0%. Men with an educational attainment of bachelor's degree enjoy the highest average annual earnings of $100,125, while those with less than high school education earn the least with $41,304. Women with an educational attainment of graduate degree earn the most with the average annual earnings of $85,938, while those with college or associate's degree education have the smallest earnings of $35,000.
| Educational Attainment | Male Income | Female Income |
| Less than High School | $41,304 | $0 |
| High School Diploma | $56,136 | $38,125 |
| College or Associate's Degree | $61,434 | $35,000 |
| Bachelor's Degree | $100,125 | $40,625 |
| Graduate Degree | $77,321 | $85,938 |
| Total | $60,087 | $36,681 |
Family Income in South Monroe
Family Income Brackets in South Monroe
According to the South Monroe family income data, there are 364 families falling into the $100,000 to $149,999 income range, which is the most common income bracket and makes up 20.5% of all families. Conversely, the $10,000 to $14,999 income bracket is the least frequent group with only 62 families (3.5%) belonging to this category.
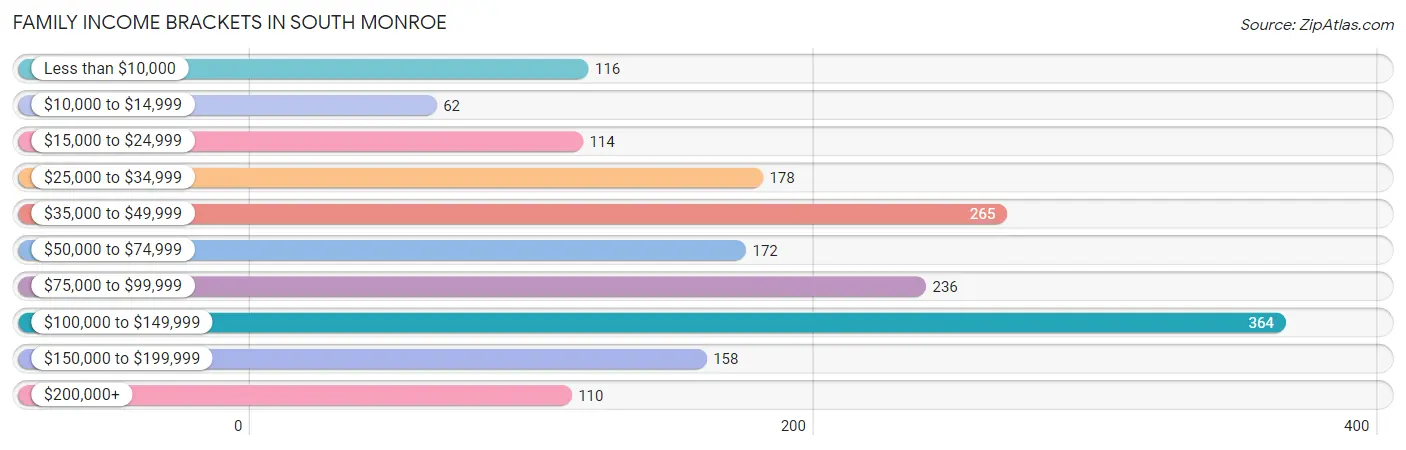
| Income Bracket | # Families | % Families |
| Less than $10,000 | 116 | 6.5% |
| $10,000 to $14,999 | 62 | 3.5% |
| $15,000 to $24,999 | 114 | 6.4% |
| $25,000 to $34,999 | 178 | 10.0% |
| $35,000 to $49,999 | 265 | 14.9% |
| $50,000 to $74,999 | 172 | 9.7% |
| $75,000 to $99,999 | 236 | 13.3% |
| $100,000 to $149,999 | 364 | 20.5% |
| $150,000 to $199,999 | 158 | 8.9% |
| $200,000+ | 110 | 6.2% |
Family Income by Famaliy Size in South Monroe
5-person families (91 | 5.1%) account for the highest median family income in South Monroe with $153,068 per family, while 3-person families (371 | 20.9%) have the highest median income of $35,708 per family member.
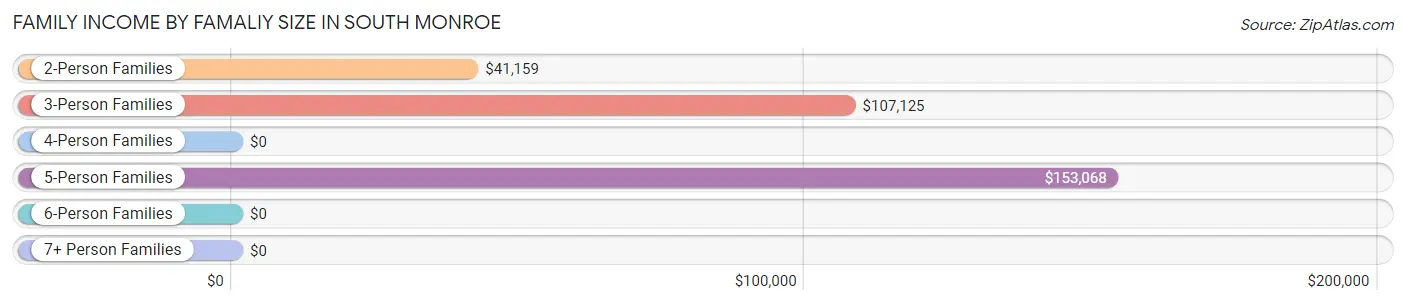
| Income Bracket | # Families | Median Income |
| 2-Person Families | 964 (54.2%) | $41,159 |
| 3-Person Families | 371 (20.9%) | $107,125 |
| 4-Person Families | 324 (18.2%) | $0 |
| 5-Person Families | 91 (5.1%) | $153,068 |
| 6-Person Families | 0 (0.0%) | $0 |
| 7+ Person Families | 27 (1.5%) | $0 |
| Total | 1,777 (100.0%) | $66,181 |
Family Income by Number of Earners in South Monroe
The median family income in South Monroe is $66,181, with families comprising 3+ earners (254) having the highest median family income of $177,579, while families with no earners (426) have the lowest median family income of $27,813, accounting for 14.3% and 24.0% of families, respectively.
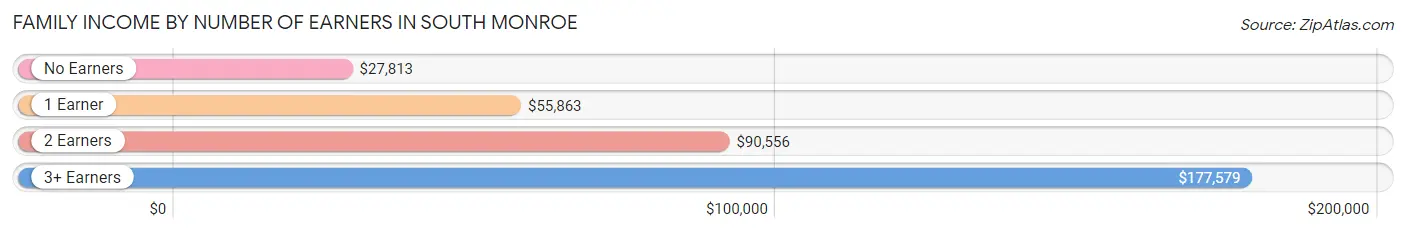
| Number of Earners | # Families | Median Income |
| No Earners | 426 (24.0%) | $27,813 |
| 1 Earner | 587 (33.0%) | $55,863 |
| 2 Earners | 510 (28.7%) | $90,556 |
| 3+ Earners | 254 (14.3%) | $177,579 |
| Total | 1,777 (100.0%) | $66,181 |
Household Income in South Monroe
Household Income Brackets in South Monroe
With 442 households falling in the category, the $100,000 to $149,999 income range is the most frequent in South Monroe, accounting for 15.6% of all households. In contrast, only 111 households (3.9%) fall into the $200,000+ income bracket, making it the least populous group.
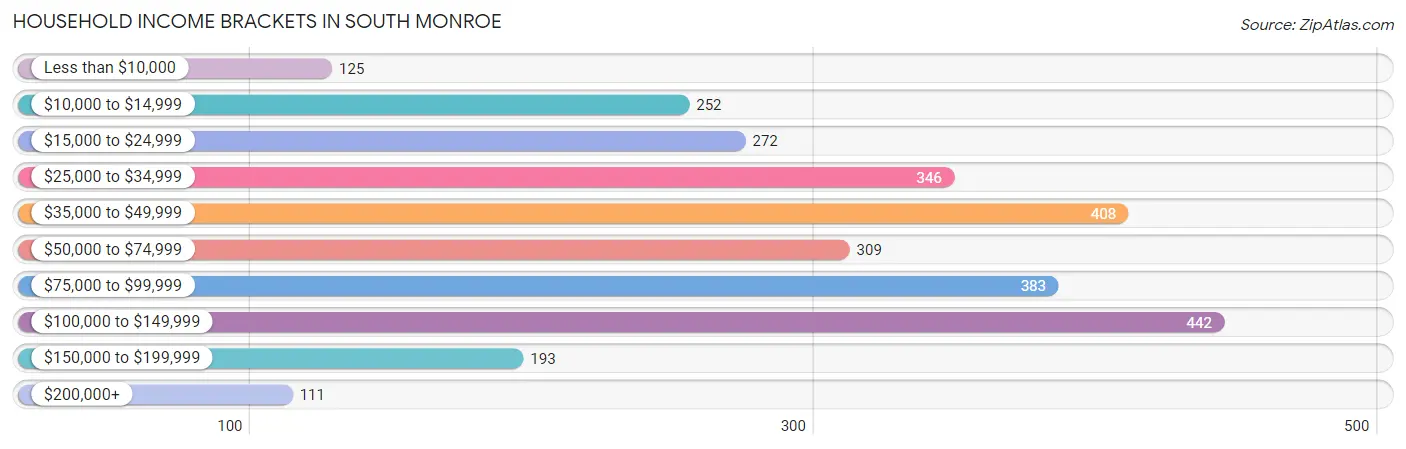
| Income Bracket | # Households | % Households |
| Less than $10,000 | 125 | 4.4% |
| $10,000 to $14,999 | 252 | 8.9% |
| $15,000 to $24,999 | 272 | 9.6% |
| $25,000 to $34,999 | 346 | 12.2% |
| $35,000 to $49,999 | 408 | 14.4% |
| $50,000 to $74,999 | 309 | 10.9% |
| $75,000 to $99,999 | 383 | 13.5% |
| $100,000 to $149,999 | 442 | 15.6% |
| $150,000 to $199,999 | 193 | 6.8% |
| $200,000+ | 111 | 3.9% |
Household Income by Householder Age in South Monroe
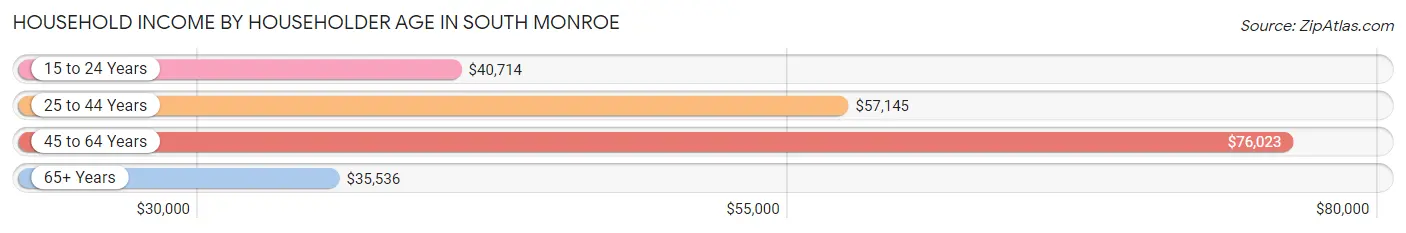
The median household income in South Monroe is $51,518, with the highest median household income of $76,023 found in the 45 to 64 years age bracket for the primary householder. A total of 1,124 households (39.7%) fall into this category. Meanwhile, the 65+ years age bracket for the primary householder has the lowest median household income of $35,536, with 861 households (30.4%) in this group.
| Income Bracket | # Households | Median Income |
| 15 to 24 Years | 178 (6.3%) | $40,714 |
| 25 to 44 Years | 671 (23.7%) | $57,145 |
| 45 to 64 Years | 1,124 (39.7%) | $76,023 |
| 65+ Years | 861 (30.4%) | $35,536 |
| Total | 2,834 (100.0%) | $51,518 |
Poverty in South Monroe
Income Below Poverty by Sex and Age in South Monroe
With 15.7% poverty level for males and 13.4% for females among the residents of South Monroe, 5 year old males and 6 to 11 year old females are the most vulnerable to poverty, with 54 males (69.2%) and 53 females (57.0%) in their respective age groups living below the poverty level.
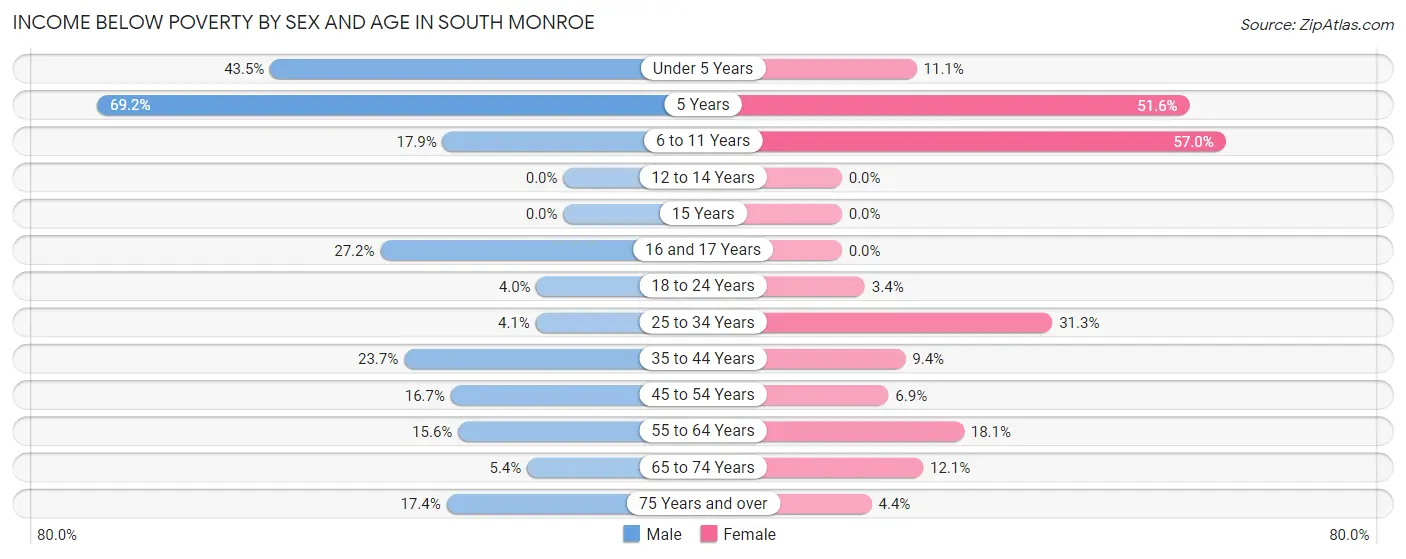
| Age Bracket | Male | Female |
| Under 5 Years | 74 (43.5%) | 12 (11.1%) |
| 5 Years | 54 (69.2%) | 16 (51.6%) |
| 6 to 11 Years | 47 (17.9%) | 53 (57.0%) |
| 12 to 14 Years | 0 (0.0%) | 0 (0.0%) |
| 15 Years | 0 (0.0%) | 0 (0.0%) |
| 16 and 17 Years | 56 (27.2%) | 0 (0.0%) |
| 18 to 24 Years | 11 (4.0%) | 11 (3.4%) |
| 25 to 34 Years | 21 (4.1%) | 115 (31.2%) |
| 35 to 44 Years | 62 (23.7%) | 37 (9.4%) |
| 45 to 54 Years | 70 (16.7%) | 29 (6.9%) |
| 55 to 64 Years | 77 (15.6%) | 86 (18.1%) |
| 65 to 74 Years | 14 (5.4%) | 53 (12.1%) |
| 75 Years and over | 34 (17.3%) | 17 (4.4%) |
| Total | 520 (15.7%) | 429 (13.4%) |
Income Above Poverty by Sex and Age in South Monroe
According to the poverty statistics in South Monroe, males aged 12 to 14 years and females aged 12 to 14 years are the age groups that are most secure financially, with 100.0% of males and 100.0% of females in these age groups living above the poverty line.
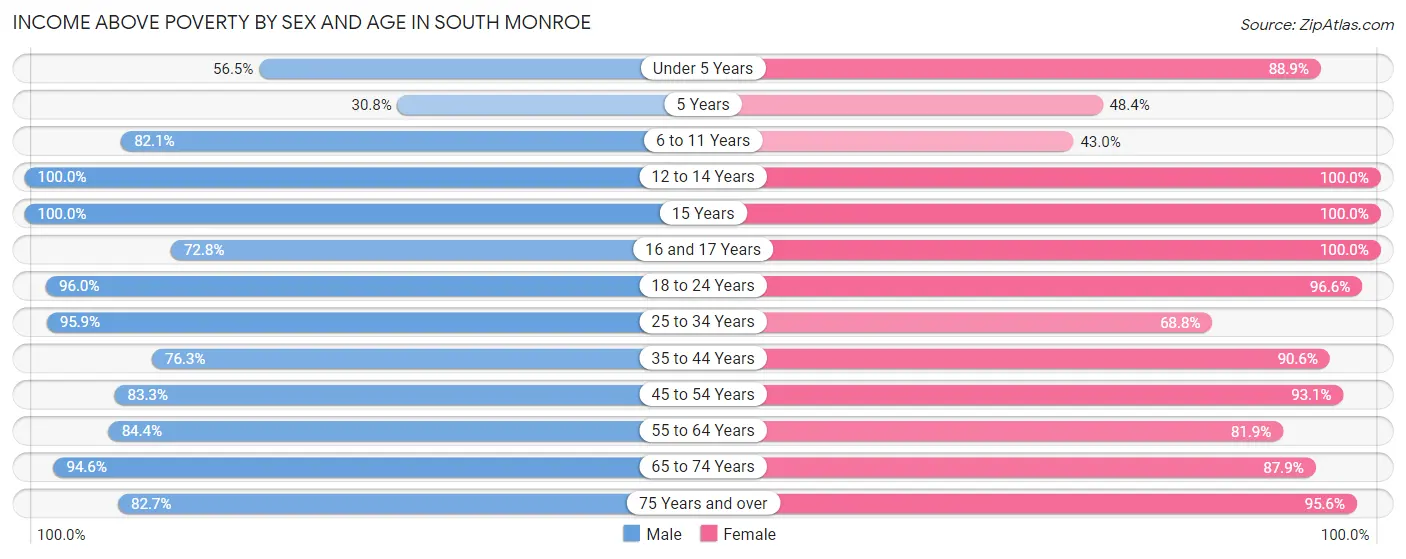
| Age Bracket | Male | Female |
| Under 5 Years | 96 (56.5%) | 96 (88.9%) |
| 5 Years | 24 (30.8%) | 15 (48.4%) |
| 6 to 11 Years | 215 (82.1%) | 40 (43.0%) |
| 12 to 14 Years | 93 (100.0%) | 124 (100.0%) |
| 15 Years | 86 (100.0%) | 11 (100.0%) |
| 16 and 17 Years | 150 (72.8%) | 43 (100.0%) |
| 18 to 24 Years | 264 (96.0%) | 310 (96.6%) |
| 25 to 34 Years | 489 (95.9%) | 253 (68.8%) |
| 35 to 44 Years | 200 (76.3%) | 355 (90.6%) |
| 45 to 54 Years | 349 (83.3%) | 390 (93.1%) |
| 55 to 64 Years | 416 (84.4%) | 389 (81.9%) |
| 65 to 74 Years | 246 (94.6%) | 386 (87.9%) |
| 75 Years and over | 162 (82.7%) | 368 (95.6%) |
| Total | 2,790 (84.3%) | 2,780 (86.6%) |
Income Below Poverty Among Married-Couple Families in South Monroe
The poverty statistics for married-couple families in South Monroe show that 4.0% or 44 of the total 1,108 families live below the poverty line. Families with 1 or 2 children have the highest poverty rate of 11.6%, comprising of 32 families. On the other hand, families with 3 or 4 children have the lowest poverty rate of 0.0%, which includes 0 families.
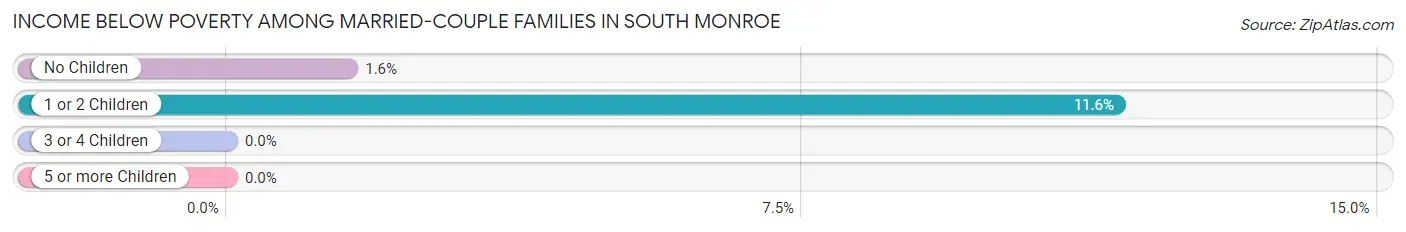
| Children | Above Poverty | Below Poverty |
| No Children | 753 (98.4%) | 12 (1.6%) |
| 1 or 2 Children | 244 (88.4%) | 32 (11.6%) |
| 3 or 4 Children | 40 (100.0%) | 0 (0.0%) |
| 5 or more Children | 27 (100.0%) | 0 (0.0%) |
| Total | 1,064 (96.0%) | 44 (4.0%) |
Income Below Poverty Among Single-Parent Households in South Monroe
According to the poverty data in South Monroe, 40.3% or 60 single-father households and 22.7% or 118 single-mother households are living below the poverty line. Among single-father households, those with 1 or 2 children have the highest poverty rate, with 50 households (54.9%) experiencing poverty. Likewise, among single-mother households, those with 3 or 4 children have the highest poverty rate, with 40 households (57.1%) falling below the poverty line.
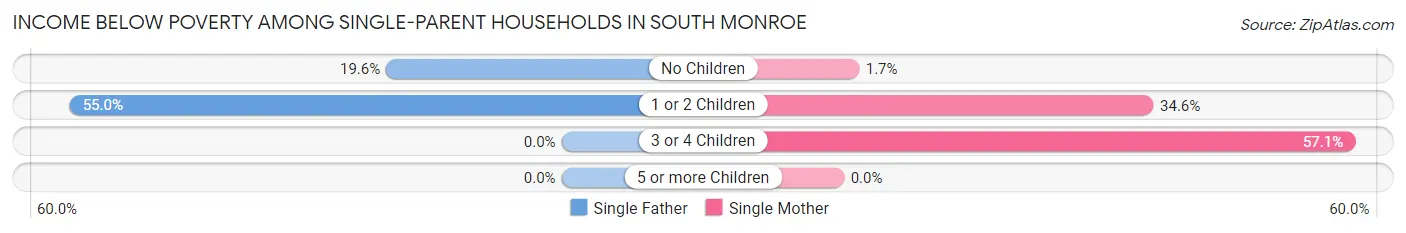
| Children | Single Father | Single Mother |
| No Children | 10 (19.6%) | 4 (1.7%) |
| 1 or 2 Children | 50 (54.9%) | 74 (34.6%) |
| 3 or 4 Children | 0 (0.0%) | 40 (57.1%) |
| 5 or more Children | 0 (0.0%) | 0 (0.0%) |
| Total | 60 (40.3%) | 118 (22.7%) |
Income Below Poverty Among Married-Couple vs Single-Parent Households in South Monroe
The poverty data for South Monroe shows that 44 of the married-couple family households (4.0%) and 178 of the single-parent households (26.6%) are living below the poverty level. Within the married-couple family households, those with 1 or 2 children have the highest poverty rate, with 32 households (11.6%) falling below the poverty line. Among the single-parent households, those with 3 or 4 children have the highest poverty rate, with 40 household (51.9%) living below poverty.
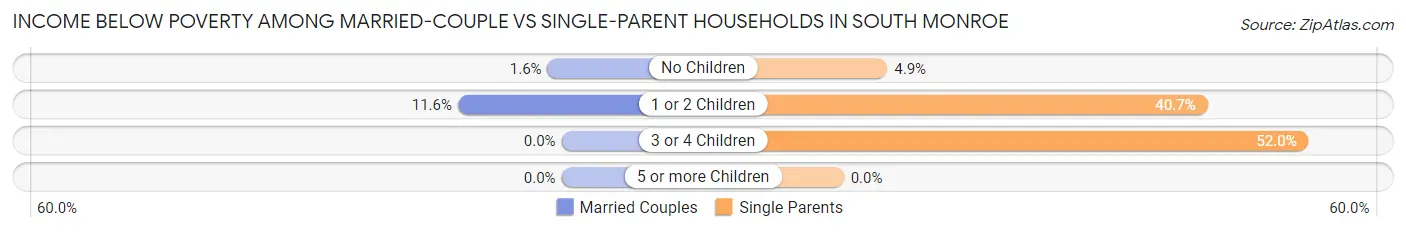
| Children | Married-Couple Families | Single-Parent Households |
| No Children | 12 (1.6%) | 14 (4.9%) |
| 1 or 2 Children | 32 (11.6%) | 124 (40.7%) |
| 3 or 4 Children | 0 (0.0%) | 40 (51.9%) |
| 5 or more Children | 0 (0.0%) | 0 (0.0%) |
| Total | 44 (4.0%) | 178 (26.6%) |
Race in South Monroe
The most populous races in South Monroe are White / Caucasian (6,063 | 91.1%), Two or more Races (288 | 4.3%), and Black / African American (242 | 3.6%).
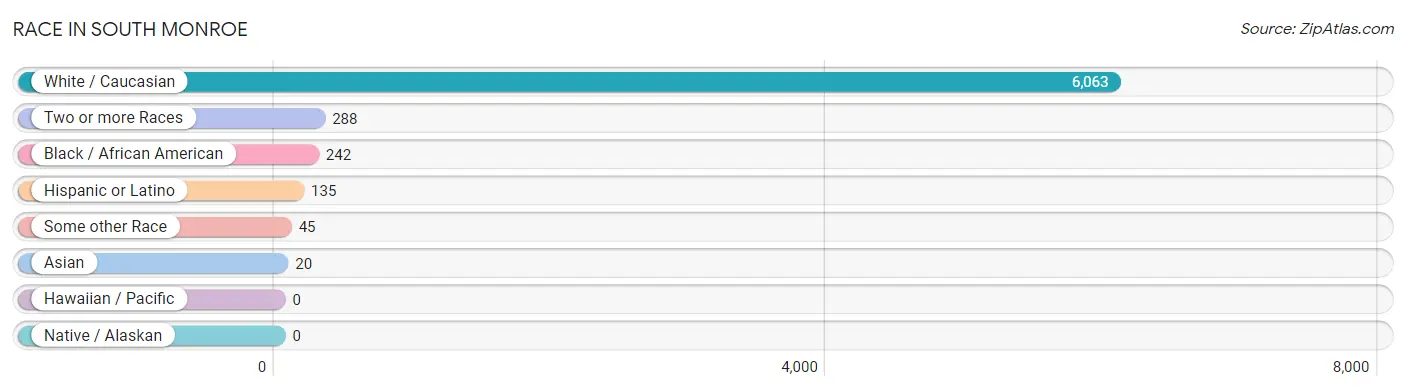
| Race | # Population | % Population |
| Asian | 20 | 0.3% |
| Black / African American | 242 | 3.6% |
| Hawaiian / Pacific | 0 | 0.0% |
| Hispanic or Latino | 135 | 2.0% |
| Native / Alaskan | 0 | 0.0% |
| White / Caucasian | 6,063 | 91.1% |
| Two or more Races | 288 | 4.3% |
| Some other Race | 45 | 0.7% |
| Total | 6,658 | 100.0% |
Ancestry in South Monroe
The most populous ancestries reported in South Monroe are German (1,235 | 18.5%), Irish (884 | 13.3%), French (744 | 11.2%), American (699 | 10.5%), and Polish (645 | 9.7%), together accounting for 63.2% of all South Monroe residents.
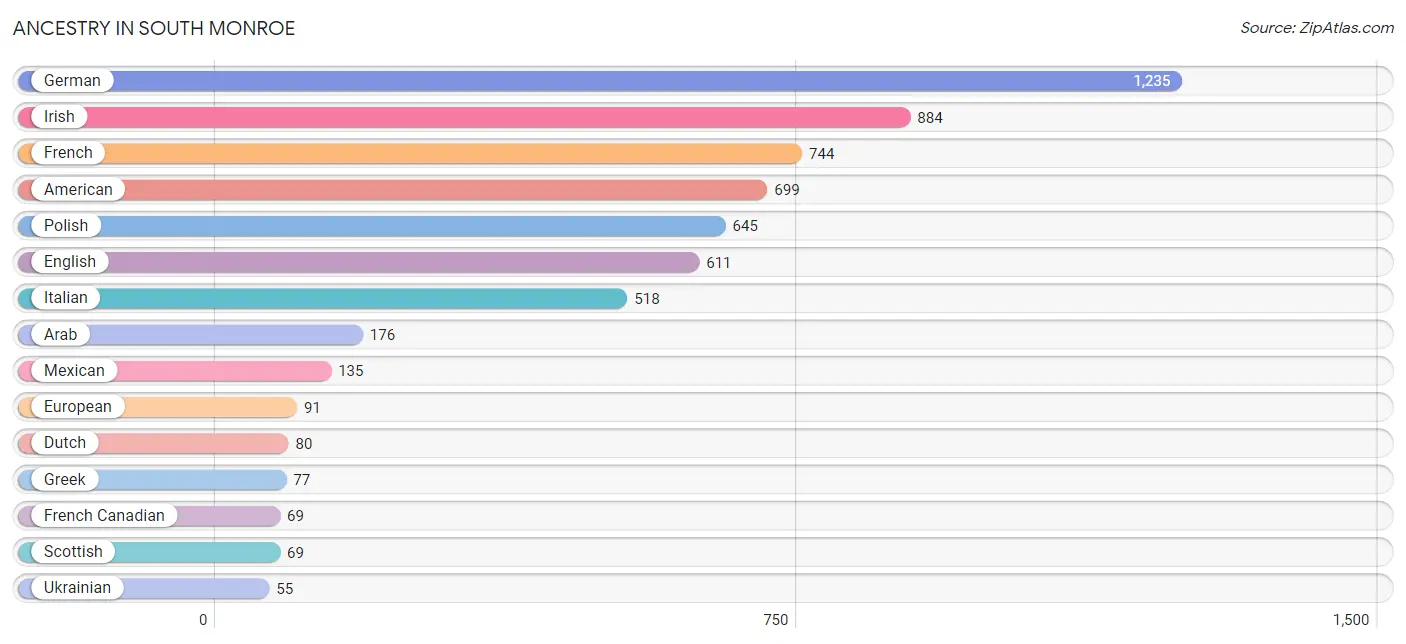
| Ancestry | # Population | % Population |
| African | 48 | 0.7% |
| American | 699 | 10.5% |
| Arab | 176 | 2.6% |
| Belgian | 22 | 0.3% |
| British | 31 | 0.5% |
| Celtic | 10 | 0.2% |
| Cherokee | 20 | 0.3% |
| Croatian | 13 | 0.2% |
| Czech | 14 | 0.2% |
| Dutch | 80 | 1.2% |
| English | 611 | 9.2% |
| European | 91 | 1.4% |
| Finnish | 47 | 0.7% |
| French | 744 | 11.2% |
| French Canadian | 69 | 1.0% |
| German | 1,235 | 18.5% |
| Greek | 77 | 1.2% |
| Hungarian | 46 | 0.7% |
| Indian (Asian) | 24 | 0.4% |
| Irish | 884 | 13.3% |
| Iroquois | 12 | 0.2% |
| Italian | 518 | 7.8% |
| Korean | 5 | 0.1% |
| Lebanese | 32 | 0.5% |
| Lithuanian | 21 | 0.3% |
| Mexican | 135 | 2.0% |
| Northern European | 8 | 0.1% |
| Norwegian | 36 | 0.5% |
| Palestinian | 11 | 0.2% |
| Pennsylvania German | 10 | 0.2% |
| Polish | 645 | 9.7% |
| Russian | 46 | 0.7% |
| Scotch-Irish | 23 | 0.4% |
| Scottish | 69 | 1.0% |
| Serbian | 40 | 0.6% |
| Subsaharan African | 48 | 0.7% |
| Swedish | 42 | 0.6% |
| Swiss | 43 | 0.6% |
| Syrian | 52 | 0.8% |
| Thai | 9 | 0.1% |
| Ukrainian | 55 | 0.8% |
| Welsh | 5 | 0.1% | View All 42 Rows |
Immigrants in South Monroe
The most numerous immigrant groups reported in South Monroe came from Asia (112 | 1.7%), Western Asia (36 | 0.5%), Syria (25 | 0.4%), Canada (21 | 0.3%), and Europe (21 | 0.3%), together accounting for 3.2% of all South Monroe residents.
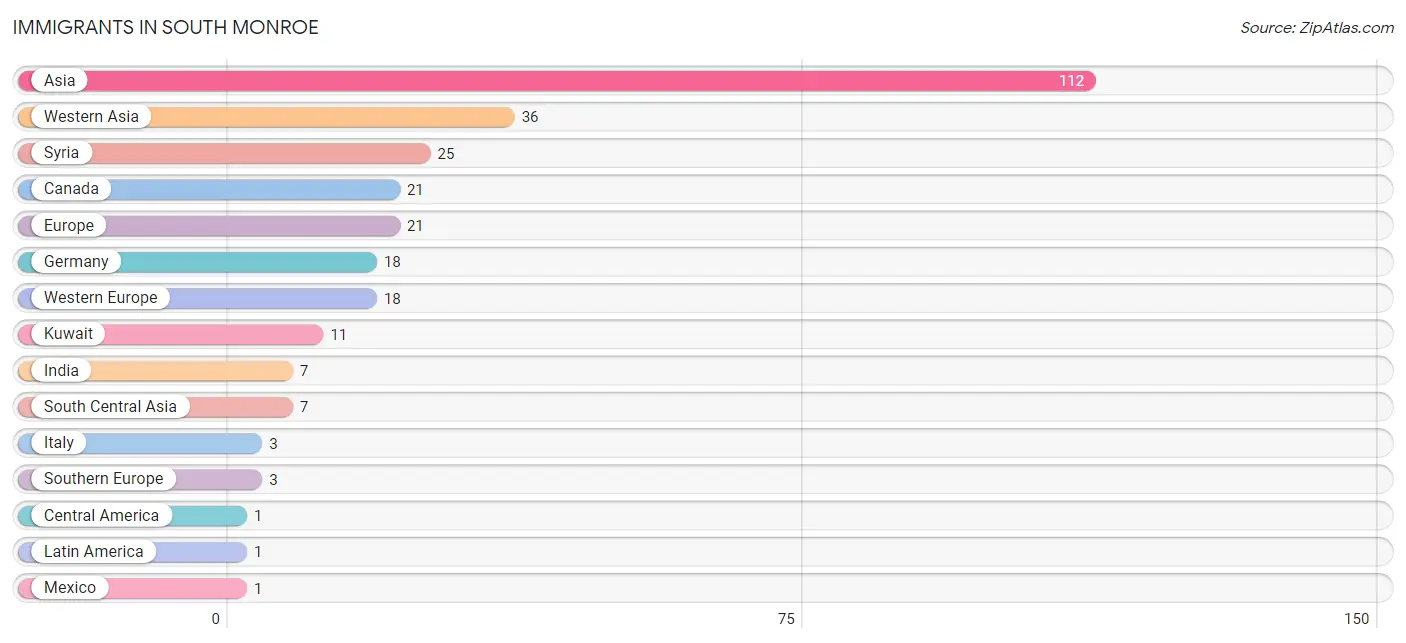
| Immigration Origin | # Population | % Population |
| Asia | 112 | 1.7% |
| Canada | 21 | 0.3% |
| Central America | 1 | 0.0% |
| Europe | 21 | 0.3% |
| Germany | 18 | 0.3% |
| India | 7 | 0.1% |
| Italy | 3 | 0.1% |
| Kuwait | 11 | 0.2% |
| Latin America | 1 | 0.0% |
| Mexico | 1 | 0.0% |
| South Central Asia | 7 | 0.1% |
| Southern Europe | 3 | 0.1% |
| Syria | 25 | 0.4% |
| Western Asia | 36 | 0.5% |
| Western Europe | 18 | 0.3% | View All 15 Rows |
Sex and Age in South Monroe
Sex and Age in South Monroe
The most populous age groups in South Monroe are 15 to 19 Years (370 | 11.1%) for men and 60 to 64 Years (294 | 8.9%) for women.
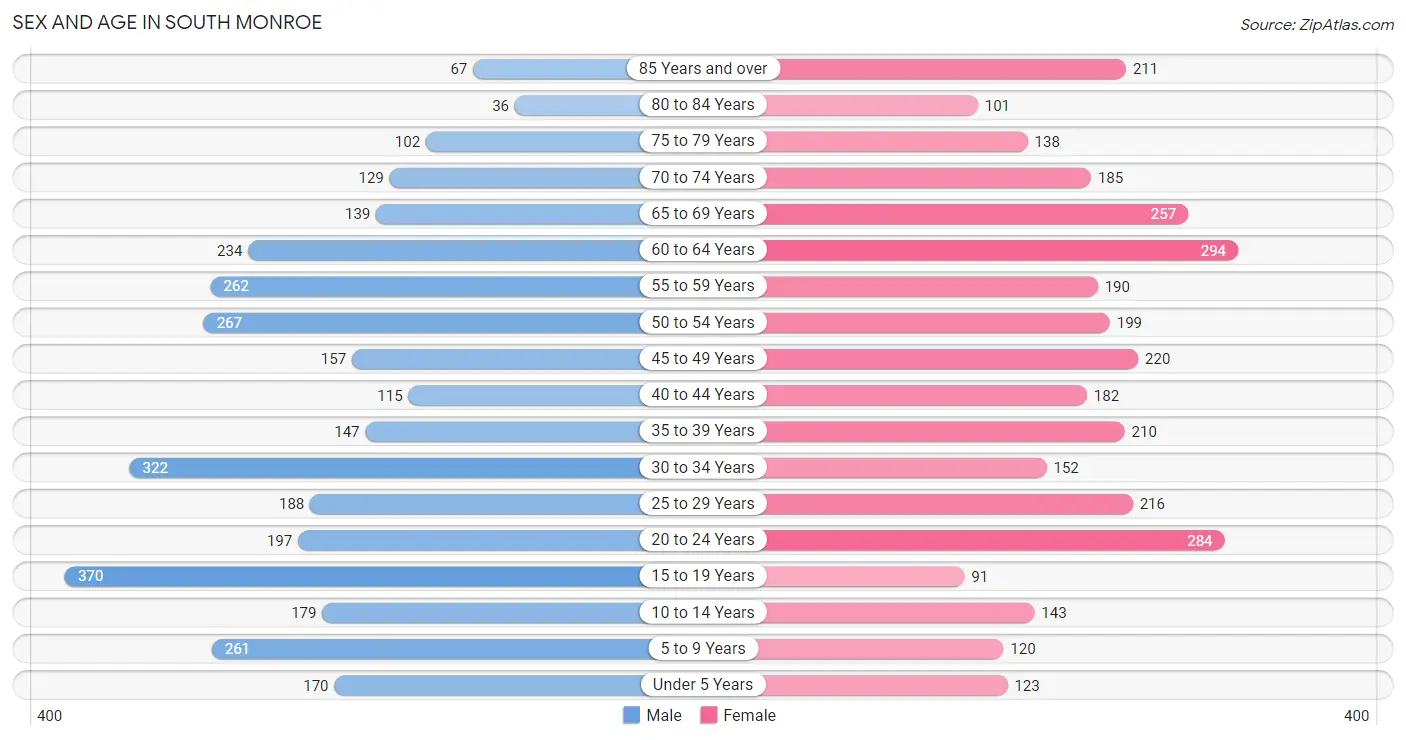
| Age Bracket | Male | Female |
| Under 5 Years | 170 (5.1%) | 123 (3.7%) |
| 5 to 9 Years | 261 (7.8%) | 120 (3.6%) |
| 10 to 14 Years | 179 (5.4%) | 143 (4.3%) |
| 15 to 19 Years | 370 (11.1%) | 91 (2.7%) |
| 20 to 24 Years | 197 (5.9%) | 284 (8.6%) |
| 25 to 29 Years | 188 (5.6%) | 216 (6.5%) |
| 30 to 34 Years | 322 (9.6%) | 152 (4.6%) |
| 35 to 39 Years | 147 (4.4%) | 210 (6.3%) |
| 40 to 44 Years | 115 (3.4%) | 182 (5.5%) |
| 45 to 49 Years | 157 (4.7%) | 220 (6.6%) |
| 50 to 54 Years | 267 (8.0%) | 199 (6.0%) |
| 55 to 59 Years | 262 (7.8%) | 190 (5.7%) |
| 60 to 64 Years | 234 (7.0%) | 294 (8.9%) |
| 65 to 69 Years | 139 (4.2%) | 257 (7.7%) |
| 70 to 74 Years | 129 (3.9%) | 185 (5.6%) |
| 75 to 79 Years | 102 (3.0%) | 138 (4.2%) |
| 80 to 84 Years | 36 (1.1%) | 101 (3.0%) |
| 85 Years and over | 67 (2.0%) | 211 (6.4%) |
| Total | 3,342 (100.0%) | 3,316 (100.0%) |
Families and Households in South Monroe
Median Family Size in South Monroe
The median family size in South Monroe is 2.87 persons per family, with married-couple families (1,108 | 62.4%) accounting for the largest median family size of 2.98 persons per family. On the other hand, single male/father families (149 | 8.4%) represent the smallest median family size with 2.51 persons per family.
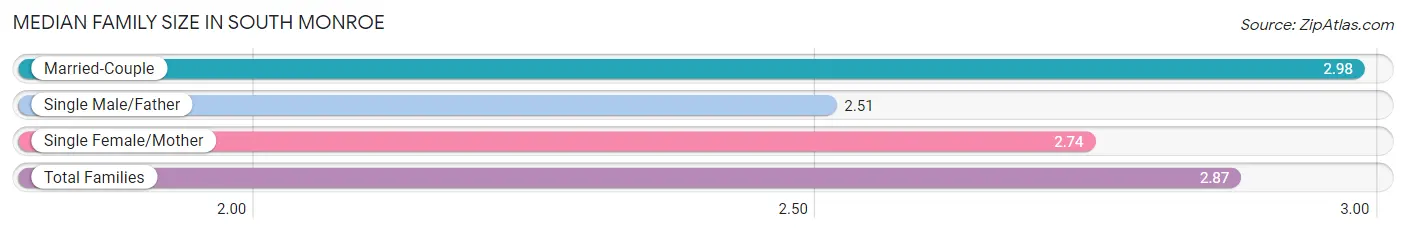
| Family Type | # Families | Family Size |
| Married-Couple | 1,108 (62.4%) | 2.98 |
| Single Male/Father | 149 (8.4%) | 2.51 |
| Single Female/Mother | 520 (29.3%) | 2.74 |
| Total Families | 1,777 (100.0%) | 2.87 |
Median Household Size in South Monroe
The median household size in South Monroe is 2.31 persons per household, with single female/mother households (520 | 18.3%) accounting for the largest median household size of 3.01 persons per household. non-family households (1,057 | 37.3%) represent the smallest median household size with 1.19 persons per household.
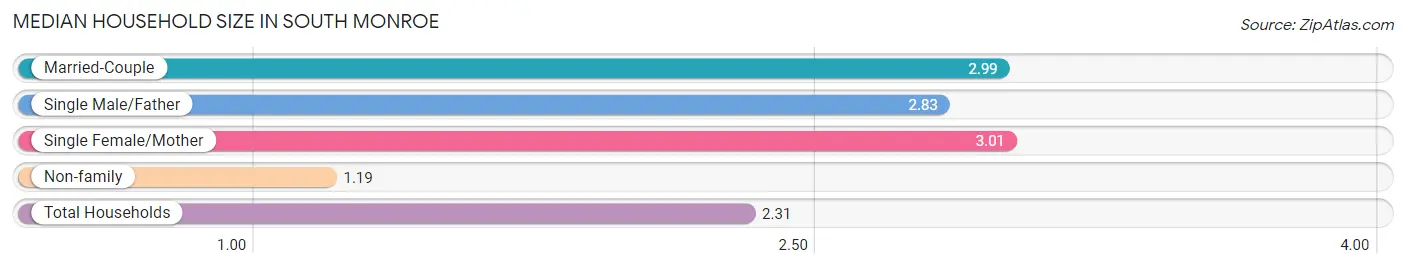
| Household Type | # Households | Household Size |
| Married-Couple | 1,108 (39.1%) | 2.99 |
| Single Male/Father | 149 (5.3%) | 2.83 |
| Single Female/Mother | 520 (18.3%) | 3.01 |
| Non-family | 1,057 (37.3%) | 1.19 |
| Total Households | 2,834 (100.0%) | 2.31 |
Household Size by Marriage Status in South Monroe
Out of a total of 2,834 households in South Monroe, 1,777 (62.7%) are family households, while 1,057 (37.3%) are nonfamily households. The most numerous type of family households are 2-person households, comprising 909, and the most common type of nonfamily households are 1-person households, comprising 879.
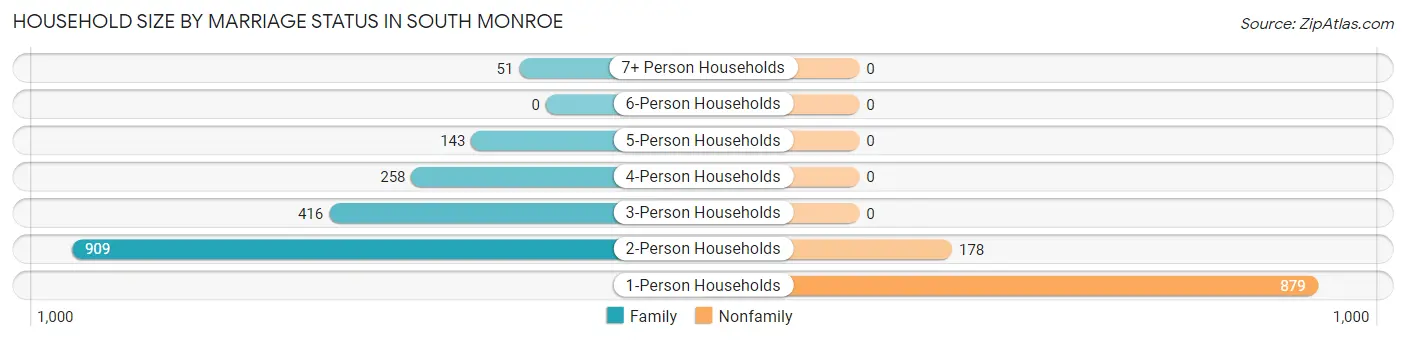
| Household Size | Family Households | Nonfamily Households |
| 1-Person Households | - | 879 (31.0%) |
| 2-Person Households | 909 (32.1%) | 178 (6.3%) |
| 3-Person Households | 416 (14.7%) | 0 (0.0%) |
| 4-Person Households | 258 (9.1%) | 0 (0.0%) |
| 5-Person Households | 143 (5.1%) | 0 (0.0%) |
| 6-Person Households | 0 (0.0%) | 0 (0.0%) |
| 7+ Person Households | 51 (1.8%) | 0 (0.0%) |
| Total | 1,777 (62.7%) | 1,057 (37.3%) |
Female Fertility in South Monroe
Fertility by Age in South Monroe
Average fertility rate in South Monroe is 41.0 births per 1,000 women. Women in the age bracket of 20 to 34 years have the highest fertility rate with 72.0 births per 1,000 women. Women in the age bracket of 20 to 34 years acount for 83.9% of all women with births.
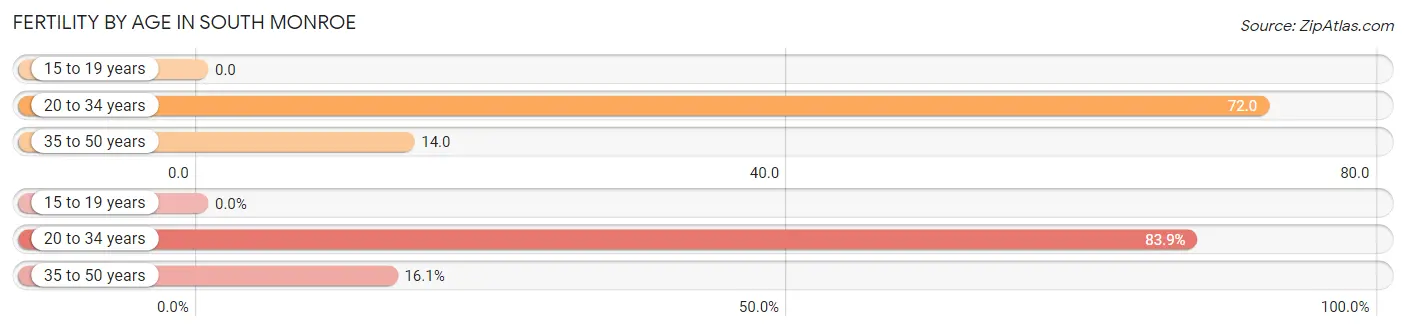
| Age Bracket | Women with Births | Births / 1,000 Women |
| 15 to 19 years | 0 (0.0%) | 0.0 |
| 20 to 34 years | 47 (83.9%) | 72.0 |
| 35 to 50 years | 9 (16.1%) | 14.0 |
| Total | 56 (100.0%) | 41.0 |
Fertility by Age by Marriage Status in South Monroe
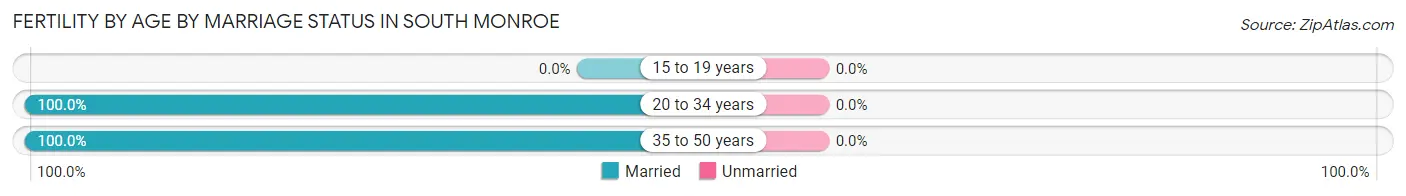
| Age Bracket | Married | Unmarried |
| 15 to 19 years | 0 (0.0%) | 0 (0.0%) |
| 20 to 34 years | 47 (100.0%) | 0 (0.0%) |
| 35 to 50 years | 9 (100.0%) | 0 (0.0%) |
| Total | 56 (100.0%) | 0 (0.0%) |
Fertility by Education in South Monroe
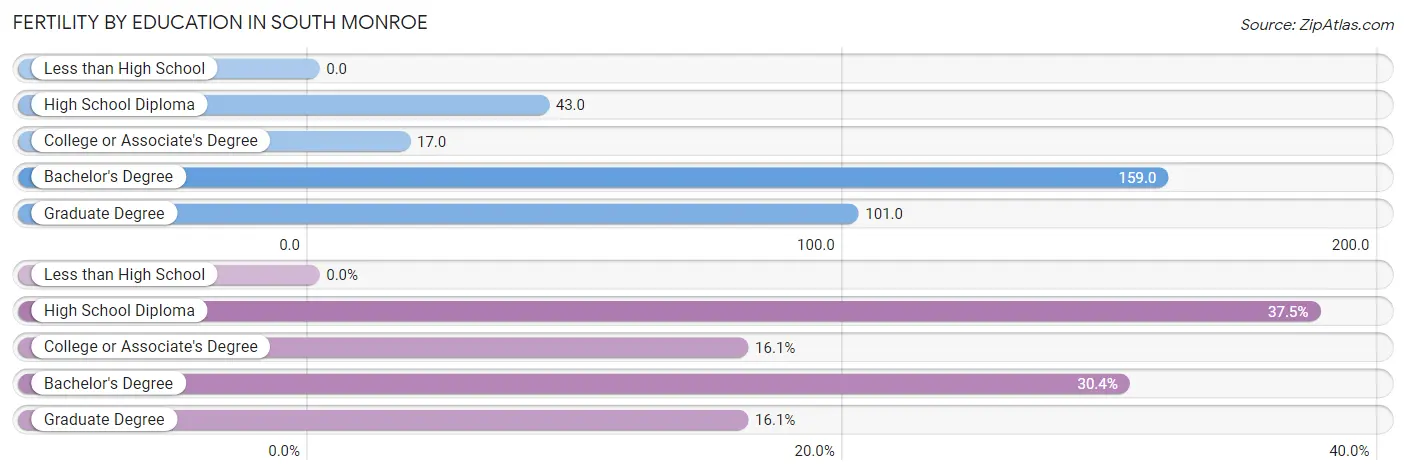
| Educational Attainment | Women with Births | Births / 1,000 Women |
| Less than High School | 0 (0.0%) | 0.0 |
| High School Diploma | 21 (37.5%) | 43.0 |
| College or Associate's Degree | 9 (16.1%) | 17.0 |
| Bachelor's Degree | 17 (30.4%) | 159.0 |
| Graduate Degree | 9 (16.1%) | 101.0 |
| Total | 56 (100.0%) | 41.0 |
Fertility by Education by Marriage Status in South Monroe
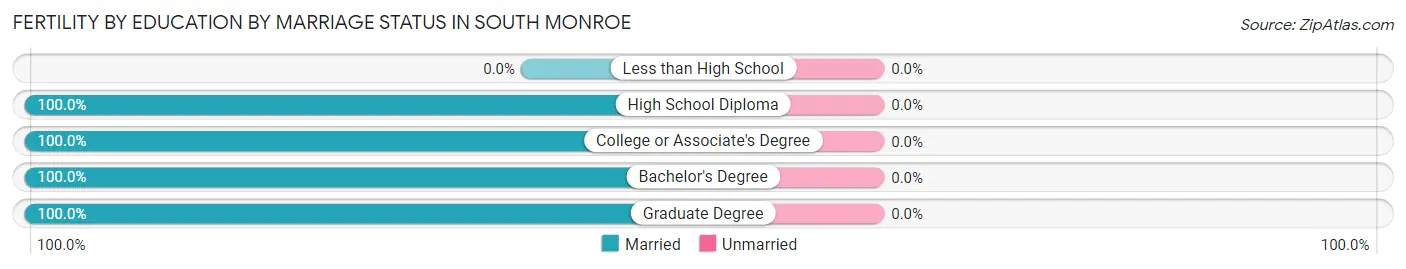
| Educational Attainment | Married | Unmarried |
| Less than High School | 0 (0.0%) | 0 (0.0%) |
| High School Diploma | 21 (100.0%) | 0 (0.0%) |
| College or Associate's Degree | 9 (100.0%) | 0 (0.0%) |
| Bachelor's Degree | 17 (100.0%) | 0 (0.0%) |
| Graduate Degree | 9 (100.0%) | 0 (0.0%) |
| Total | 56 (100.0%) | 0 (0.0%) |
Employment Characteristics in South Monroe
Employment by Class of Employer in South Monroe
Among the 2,599 employed individuals in South Monroe, private company employees (1,937 | 74.5%), not-for-profit organizations (226 | 8.7%), and local government employees (156 | 6.0%) make up the most common classes of employment.
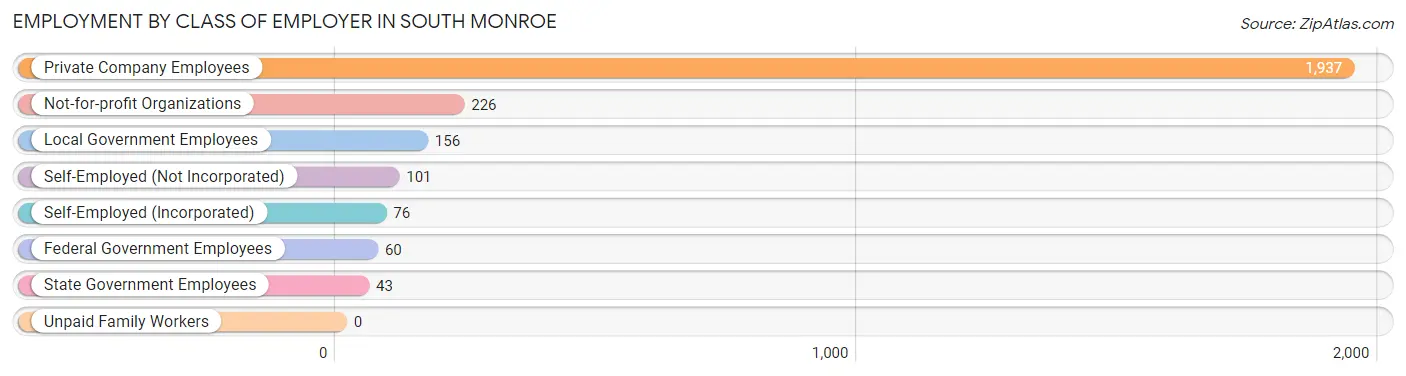
| Employer Class | # Employees | % Employees |
| Private Company Employees | 1,937 | 74.5% |
| Self-Employed (Incorporated) | 76 | 2.9% |
| Self-Employed (Not Incorporated) | 101 | 3.9% |
| Not-for-profit Organizations | 226 | 8.7% |
| Local Government Employees | 156 | 6.0% |
| State Government Employees | 43 | 1.7% |
| Federal Government Employees | 60 | 2.3% |
| Unpaid Family Workers | 0 | 0.0% |
| Total | 2,599 | 100.0% |
Employment Status by Age in South Monroe
According to the labor force statistics for South Monroe, out of the total population over 16 years of age (5,565), 55.3% or 3,077 individuals are in the labor force, with 11.0% or 338 of them unemployed. The age group with the highest labor force participation rate is 25 to 29 years, with 93.1% or 376 individuals in the labor force. Within the labor force, the 20 to 24 years age range has the highest percentage of unemployed individuals, with 24.0% or 93 of them being unemployed.
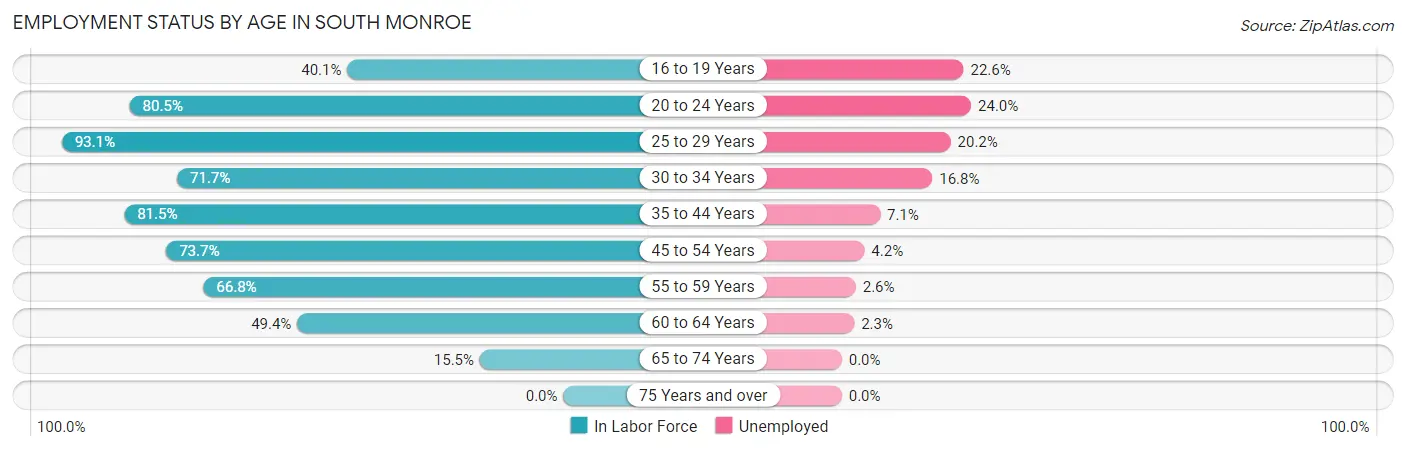
| Age Bracket | In Labor Force | Unemployed |
| 16 to 19 Years | 146 (40.1%) | 33 (22.6%) |
| 20 to 24 Years | 387 (80.5%) | 93 (24.0%) |
| 25 to 29 Years | 376 (93.1%) | 76 (20.2%) |
| 30 to 34 Years | 340 (71.7%) | 57 (16.8%) |
| 35 to 44 Years | 533 (81.5%) | 38 (7.1%) |
| 45 to 54 Years | 621 (73.7%) | 26 (4.2%) |
| 55 to 59 Years | 302 (66.8%) | 8 (2.6%) |
| 60 to 64 Years | 261 (49.4%) | 6 (2.3%) |
| 65 to 74 Years | 110 (15.5%) | 0 (0.0%) |
| 75 Years and over | 0 (0.0%) | 0 (0.0%) |
| Total | 3,077 (55.3%) | 338 (11.0%) |
Employment Status by Educational Attainment in South Monroe
According to labor force statistics for South Monroe, 72.5% of individuals (2,432) out of the total population between 25 and 64 years of age (3,355) are in the labor force, with 8.7% or 212 of them being unemployed. The group with the highest labor force participation rate are those with the educational attainment of bachelor's degree or higher, with 85.0% or 453 individuals in the labor force. Within the labor force, individuals with high school diploma education have the highest percentage of unemployment, with 12.8% or 120 of them being unemployed.
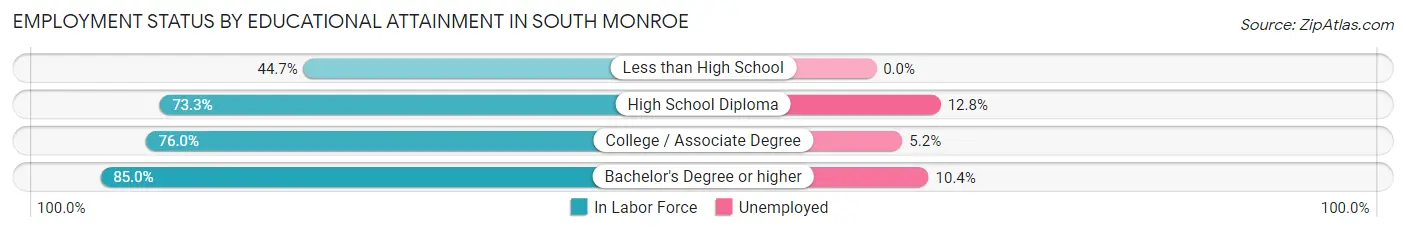
| Educational Attainment | In Labor Force | Unemployed |
| Less than High School | 187 (44.7%) | 0 (0.0%) |
| High School Diploma | 939 (73.3%) | 164 (12.8%) |
| College / Associate Degree | 853 (76.0%) | 58 (5.2%) |
| Bachelor's Degree or higher | 453 (85.0%) | 55 (10.4%) |
| Total | 2,432 (72.5%) | 292 (8.7%) |
Employment Occupations by Sex in South Monroe
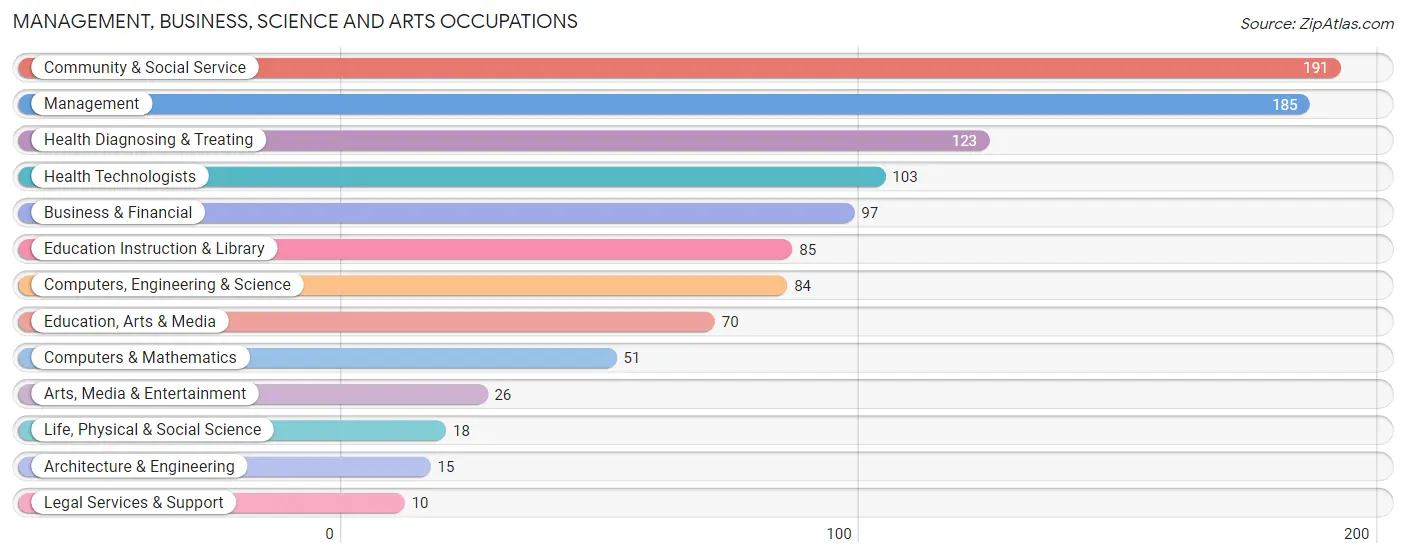
Management, Business, Science and Arts Occupations
The most common Management, Business, Science and Arts occupations in South Monroe are Community & Social Service (191 | 7.0%), Management (185 | 6.8%), Health Diagnosing & Treating (123 | 4.5%), Health Technologists (103 | 3.8%), and Business & Financial (97 | 3.5%).
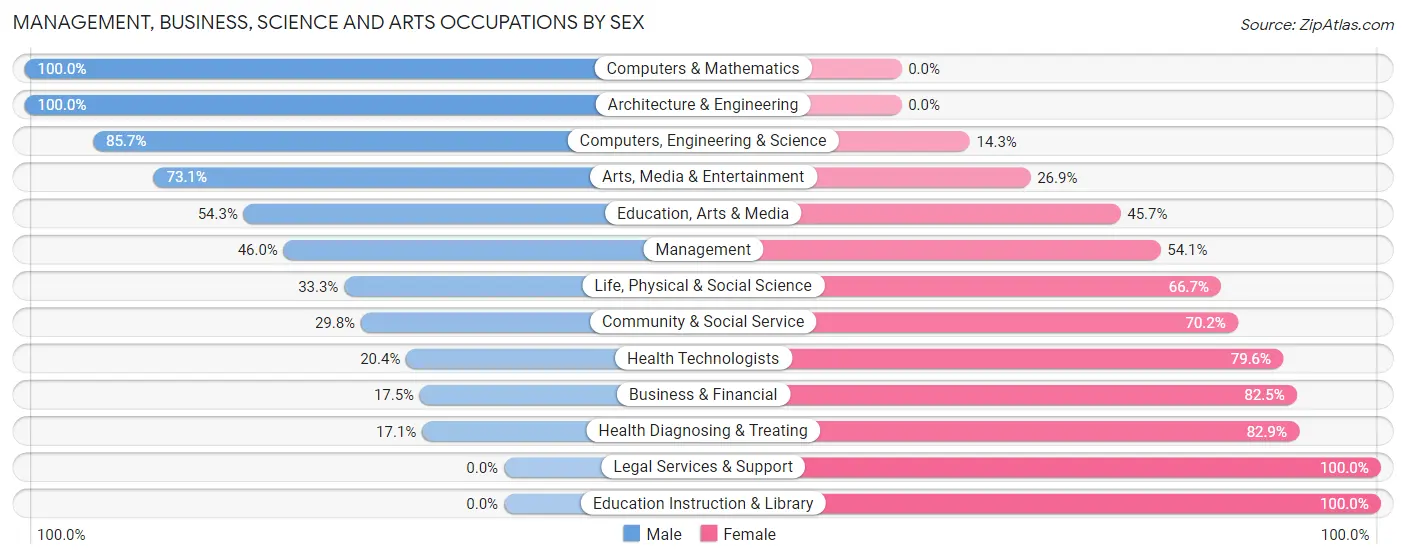
Management, Business, Science and Arts Occupations by Sex
Within the Management, Business, Science and Arts occupations in South Monroe, the most male-oriented occupations are Computers & Mathematics (100.0%), Architecture & Engineering (100.0%), and Computers, Engineering & Science (85.7%), while the most female-oriented occupations are Legal Services & Support (100.0%), Education Instruction & Library (100.0%), and Health Diagnosing & Treating (82.9%).
| Occupation | Male | Female |
| Management | 85 (46.0%) | 100 (54.0%) |
| Business & Financial | 17 (17.5%) | 80 (82.5%) |
| Computers, Engineering & Science | 72 (85.7%) | 12 (14.3%) |
| Computers & Mathematics | 51 (100.0%) | 0 (0.0%) |
| Architecture & Engineering | 15 (100.0%) | 0 (0.0%) |
| Life, Physical & Social Science | 6 (33.3%) | 12 (66.7%) |
| Community & Social Service | 57 (29.8%) | 134 (70.2%) |
| Education, Arts & Media | 38 (54.3%) | 32 (45.7%) |
| Legal Services & Support | 0 (0.0%) | 10 (100.0%) |
| Education Instruction & Library | 0 (0.0%) | 85 (100.0%) |
| Arts, Media & Entertainment | 19 (73.1%) | 7 (26.9%) |
| Health Diagnosing & Treating | 21 (17.1%) | 102 (82.9%) |
| Health Technologists | 21 (20.4%) | 82 (79.6%) |
| Total (Category) | 252 (37.1%) | 428 (62.9%) |
| Total (Overall) | 1,329 (48.5%) | 1,410 (51.5%) |
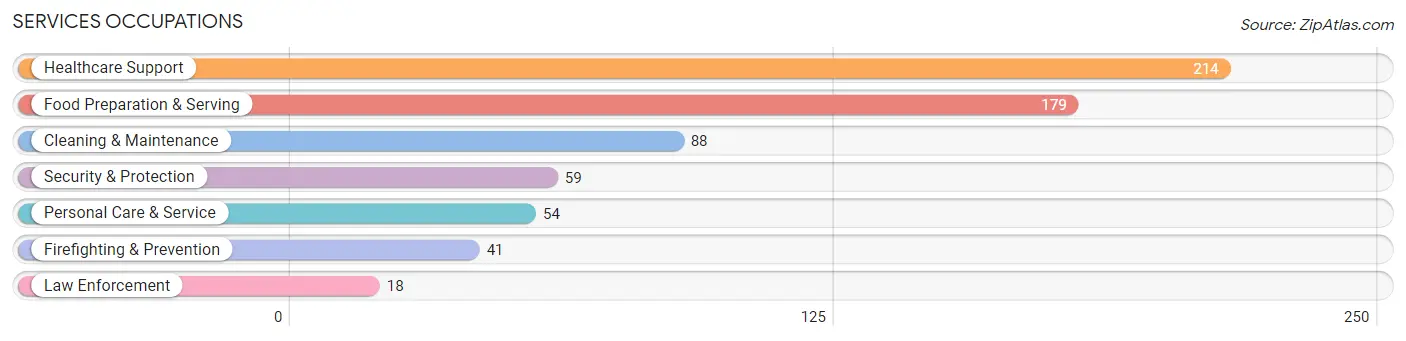
Services Occupations
The most common Services occupations in South Monroe are Healthcare Support (214 | 7.8%), Food Preparation & Serving (179 | 6.5%), Cleaning & Maintenance (88 | 3.2%), Security & Protection (59 | 2.1%), and Personal Care & Service (54 | 2.0%).
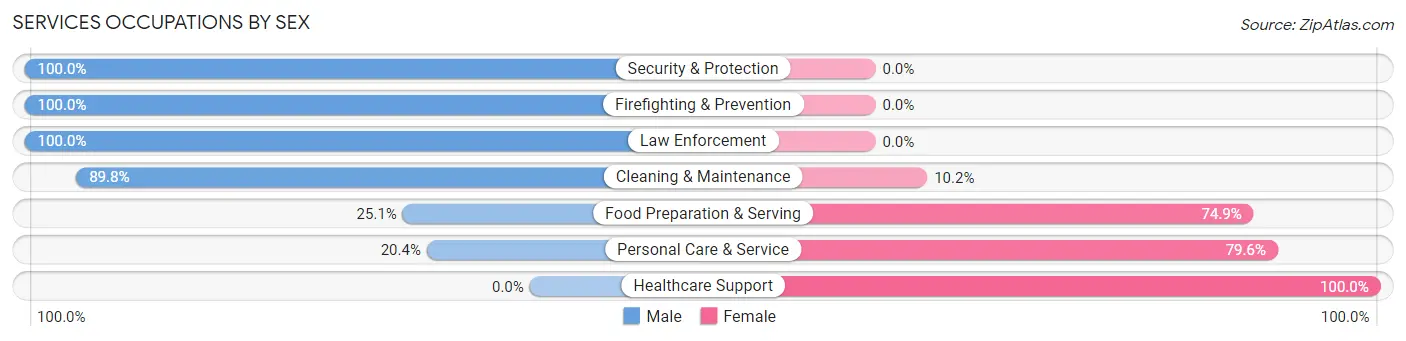
Services Occupations by Sex
Within the Services occupations in South Monroe, the most male-oriented occupations are Security & Protection (100.0%), Firefighting & Prevention (100.0%), and Law Enforcement (100.0%), while the most female-oriented occupations are Healthcare Support (100.0%), Personal Care & Service (79.6%), and Food Preparation & Serving (74.9%).
| Occupation | Male | Female |
| Healthcare Support | 0 (0.0%) | 214 (100.0%) |
| Security & Protection | 59 (100.0%) | 0 (0.0%) |
| Firefighting & Prevention | 41 (100.0%) | 0 (0.0%) |
| Law Enforcement | 18 (100.0%) | 0 (0.0%) |
| Food Preparation & Serving | 45 (25.1%) | 134 (74.9%) |
| Cleaning & Maintenance | 79 (89.8%) | 9 (10.2%) |
| Personal Care & Service | 11 (20.4%) | 43 (79.6%) |
| Total (Category) | 194 (32.7%) | 400 (67.3%) |
| Total (Overall) | 1,329 (48.5%) | 1,410 (51.5%) |
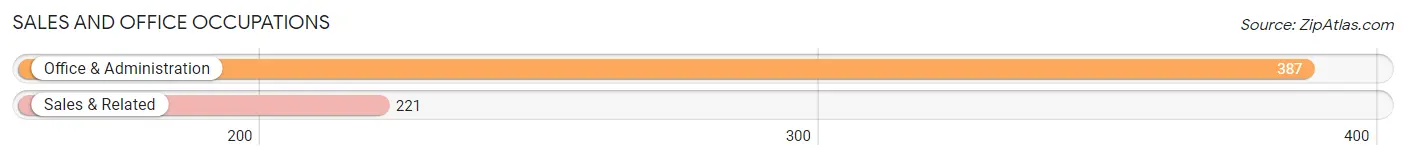
Sales and Office Occupations
The most common Sales and Office occupations in South Monroe are Office & Administration (387 | 14.1%), and Sales & Related (221 | 8.1%).
Sales and Office Occupations by Sex
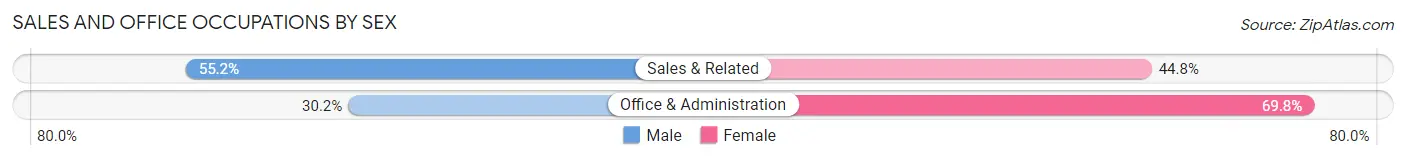
| Occupation | Male | Female |
| Sales & Related | 122 (55.2%) | 99 (44.8%) |
| Office & Administration | 117 (30.2%) | 270 (69.8%) |
| Total (Category) | 239 (39.3%) | 369 (60.7%) |
| Total (Overall) | 1,329 (48.5%) | 1,410 (51.5%) |
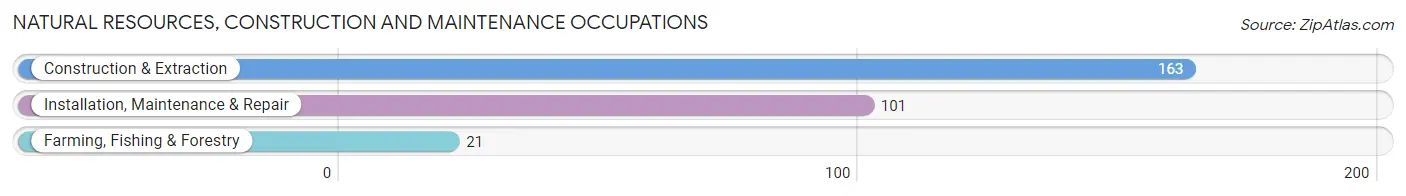
Natural Resources, Construction and Maintenance Occupations
The most common Natural Resources, Construction and Maintenance occupations in South Monroe are Construction & Extraction (163 | 5.9%), Installation, Maintenance & Repair (101 | 3.7%), and Farming, Fishing & Forestry (21 | 0.8%).
Natural Resources, Construction and Maintenance Occupations by Sex
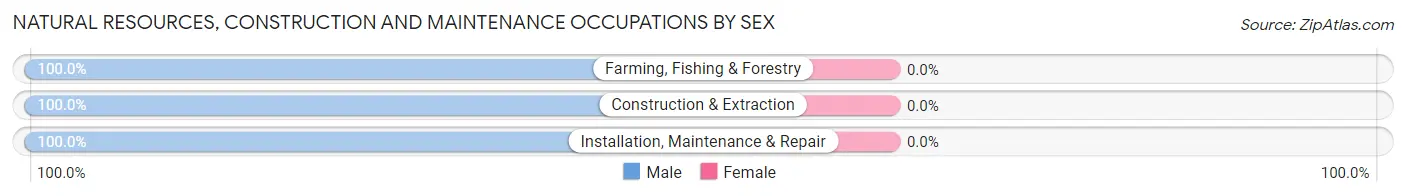
| Occupation | Male | Female |
| Farming, Fishing & Forestry | 21 (100.0%) | 0 (0.0%) |
| Construction & Extraction | 163 (100.0%) | 0 (0.0%) |
| Installation, Maintenance & Repair | 101 (100.0%) | 0 (0.0%) |
| Total (Category) | 285 (100.0%) | 0 (0.0%) |
| Total (Overall) | 1,329 (48.5%) | 1,410 (51.5%) |
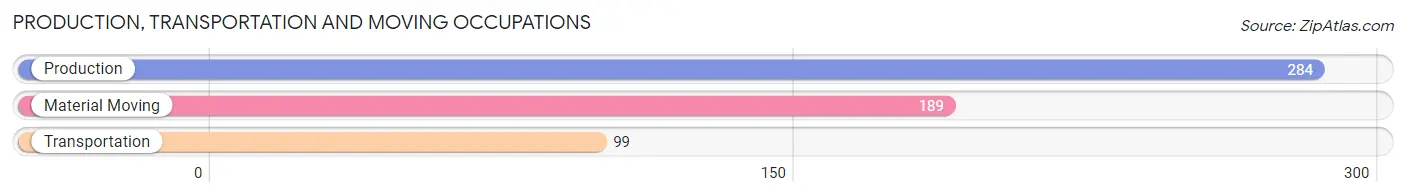
Production, Transportation and Moving Occupations
The most common Production, Transportation and Moving occupations in South Monroe are Production (284 | 10.4%), Material Moving (189 | 6.9%), and Transportation (99 | 3.6%).
Production, Transportation and Moving Occupations by Sex
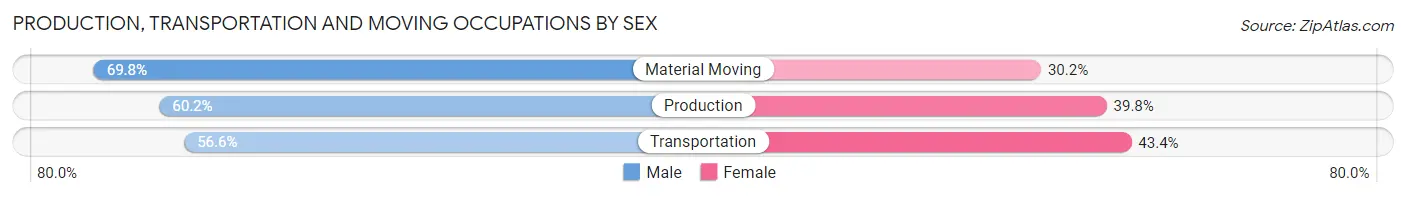
| Occupation | Male | Female |
| Production | 171 (60.2%) | 113 (39.8%) |
| Transportation | 56 (56.6%) | 43 (43.4%) |
| Material Moving | 132 (69.8%) | 57 (30.2%) |
| Total (Category) | 359 (62.8%) | 213 (37.2%) |
| Total (Overall) | 1,329 (48.5%) | 1,410 (51.5%) |
Employment Industries by Sex in South Monroe
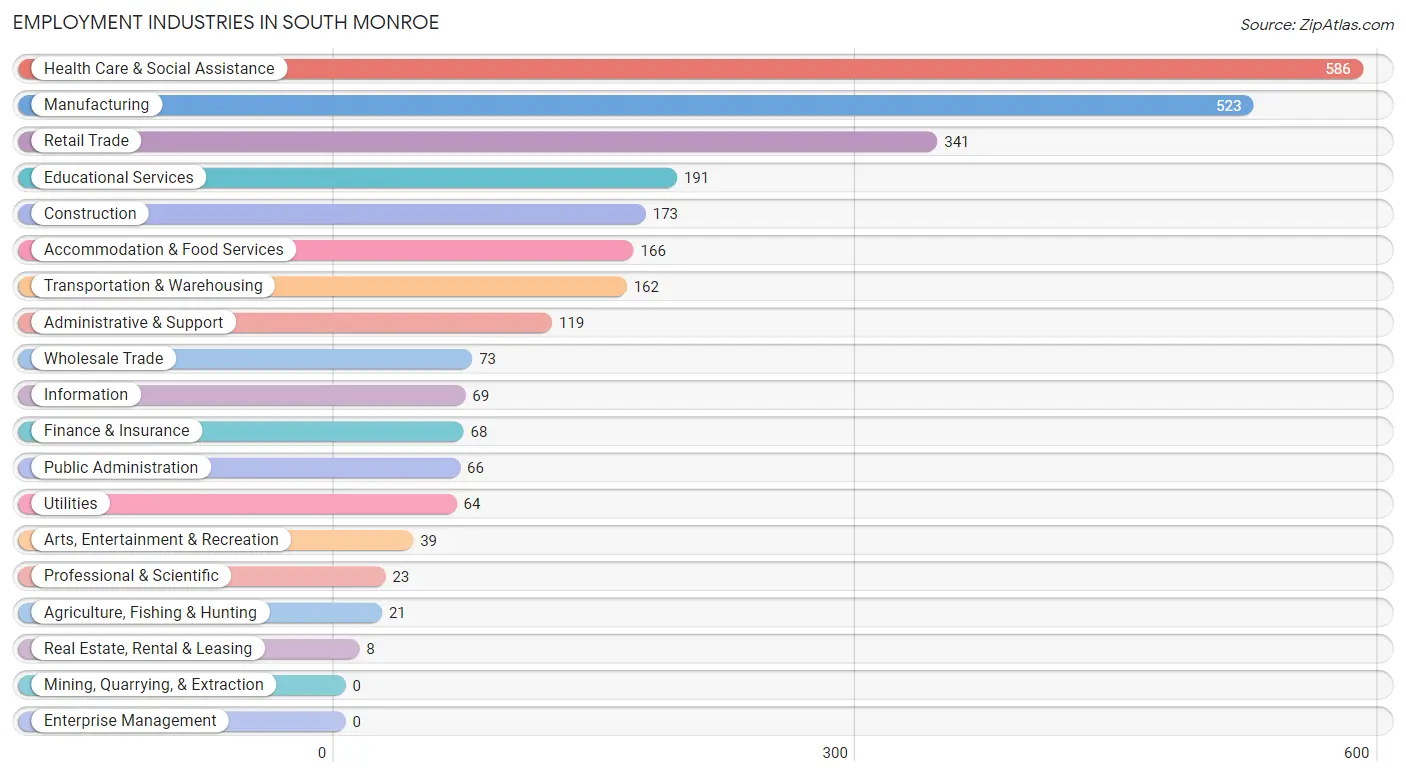
Employment Industries in South Monroe
The major employment industries in South Monroe include Health Care & Social Assistance (586 | 21.4%), Manufacturing (523 | 19.1%), Retail Trade (341 | 12.4%), Educational Services (191 | 7.0%), and Construction (173 | 6.3%).
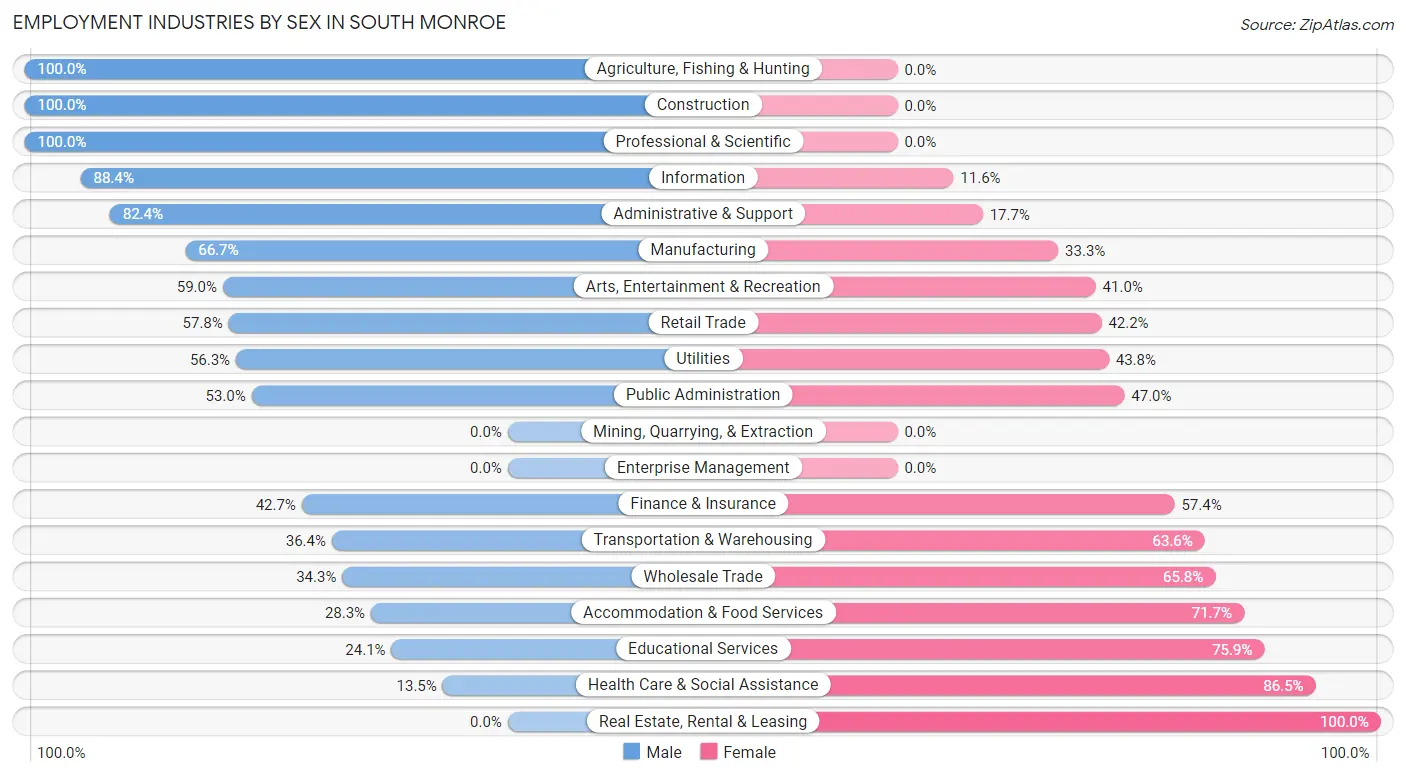
Employment Industries by Sex in South Monroe
The South Monroe industries that see more men than women are Agriculture, Fishing & Hunting (100.0%), Construction (100.0%), and Professional & Scientific (100.0%), whereas the industries that tend to have a higher number of women are Real Estate, Rental & Leasing (100.0%), Health Care & Social Assistance (86.5%), and Educational Services (75.9%).
| Industry | Male | Female |
| Agriculture, Fishing & Hunting | 21 (100.0%) | 0 (0.0%) |
| Mining, Quarrying, & Extraction | 0 (0.0%) | 0 (0.0%) |
| Construction | 173 (100.0%) | 0 (0.0%) |
| Manufacturing | 349 (66.7%) | 174 (33.3%) |
| Wholesale Trade | 25 (34.3%) | 48 (65.7%) |
| Retail Trade | 197 (57.8%) | 144 (42.2%) |
| Transportation & Warehousing | 59 (36.4%) | 103 (63.6%) |
| Utilities | 36 (56.2%) | 28 (43.8%) |
| Information | 61 (88.4%) | 8 (11.6%) |
| Finance & Insurance | 29 (42.6%) | 39 (57.4%) |
| Real Estate, Rental & Leasing | 0 (0.0%) | 8 (100.0%) |
| Professional & Scientific | 23 (100.0%) | 0 (0.0%) |
| Enterprise Management | 0 (0.0%) | 0 (0.0%) |
| Administrative & Support | 98 (82.4%) | 21 (17.6%) |
| Educational Services | 46 (24.1%) | 145 (75.9%) |
| Health Care & Social Assistance | 79 (13.5%) | 507 (86.5%) |
| Arts, Entertainment & Recreation | 23 (59.0%) | 16 (41.0%) |
| Accommodation & Food Services | 47 (28.3%) | 119 (71.7%) |
| Public Administration | 35 (53.0%) | 31 (47.0%) |
| Total | 1,329 (48.5%) | 1,410 (51.5%) |
Education in South Monroe
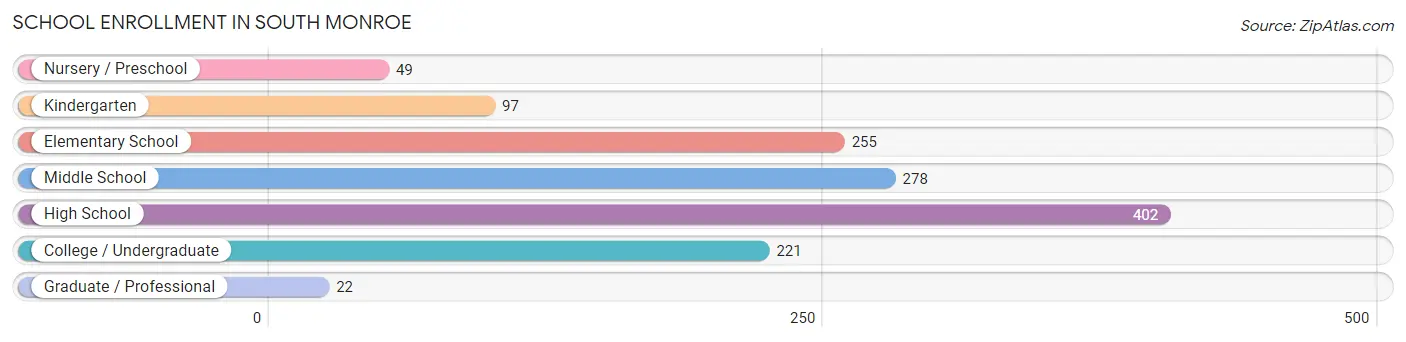
School Enrollment in South Monroe
The most common levels of schooling among the 1,324 students in South Monroe are high school (402 | 30.4%), middle school (278 | 21.0%), and elementary school (255 | 19.3%).
| School Level | # Students | % Students |
| Nursery / Preschool | 49 | 3.7% |
| Kindergarten | 97 | 7.3% |
| Elementary School | 255 | 19.3% |
| Middle School | 278 | 21.0% |
| High School | 402 | 30.4% |
| College / Undergraduate | 221 | 16.7% |
| Graduate / Professional | 22 | 1.7% |
| Total | 1,324 | 100.0% |
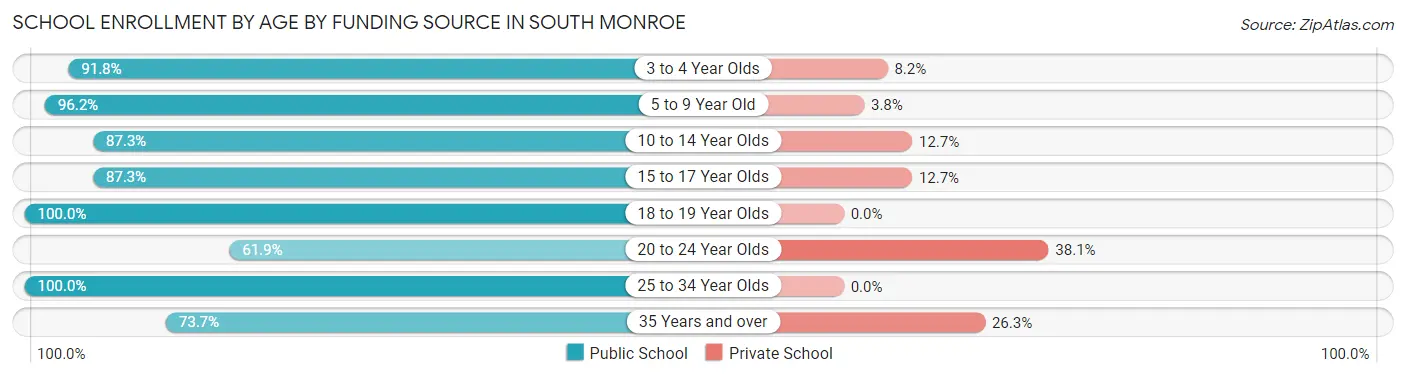
School Enrollment by Age by Funding Source in South Monroe
Out of a total of 1,324 students who are enrolled in schools in South Monroe, 158 (11.9%) attend a private institution, while the remaining 1,166 (88.1%) are enrolled in public schools. The age group of 20 to 24 year olds has the highest likelihood of being enrolled in private schools, with 45 (38.1% in the age bracket) enrolled. Conversely, the age group of 18 to 19 year olds has the lowest likelihood of being enrolled in a private school, with 56 (100.0% in the age bracket) attending a public institution.
| Age Bracket | Public School | Private School |
| 3 to 4 Year Olds | 45 (91.8%) | 4 (8.2%) |
| 5 to 9 Year Old | 330 (96.2%) | 13 (3.8%) |
| 10 to 14 Year Olds | 281 (87.3%) | 41 (12.7%) |
| 15 to 17 Year Olds | 302 (87.3%) | 44 (12.7%) |
| 18 to 19 Year Olds | 56 (100.0%) | 0 (0.0%) |
| 20 to 24 Year Olds | 73 (61.9%) | 45 (38.1%) |
| 25 to 34 Year Olds | 52 (100.0%) | 0 (0.0%) |
| 35 Years and over | 28 (73.7%) | 10 (26.3%) |
| Total | 1,166 (88.1%) | 158 (11.9%) |
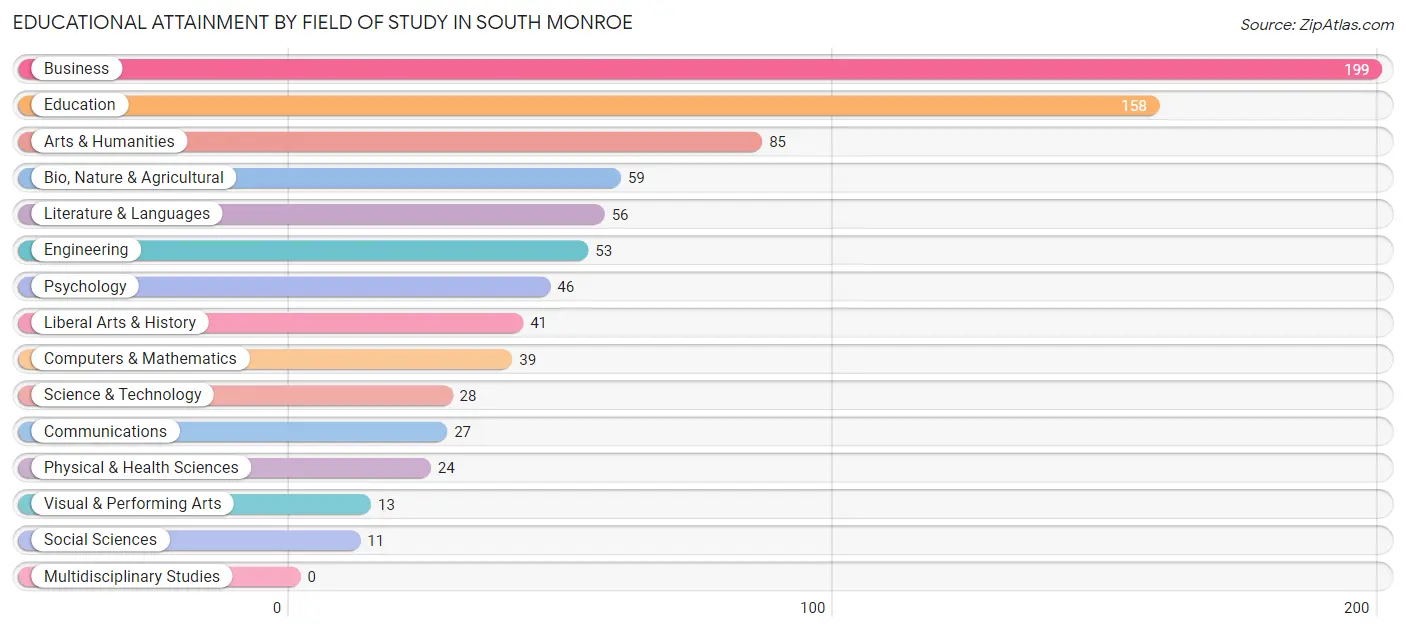
Educational Attainment by Field of Study in South Monroe
Business (199 | 23.7%), education (158 | 18.8%), arts & humanities (85 | 10.1%), bio, nature & agricultural (59 | 7.0%), and literature & languages (56 | 6.7%) are the most common fields of study among 839 individuals in South Monroe who have obtained a bachelor's degree or higher.
| Field of Study | # Graduates | % Graduates |
| Computers & Mathematics | 39 | 4.6% |
| Bio, Nature & Agricultural | 59 | 7.0% |
| Physical & Health Sciences | 24 | 2.9% |
| Psychology | 46 | 5.5% |
| Social Sciences | 11 | 1.3% |
| Engineering | 53 | 6.3% |
| Multidisciplinary Studies | 0 | 0.0% |
| Science & Technology | 28 | 3.3% |
| Business | 199 | 23.7% |
| Education | 158 | 18.8% |
| Literature & Languages | 56 | 6.7% |
| Liberal Arts & History | 41 | 4.9% |
| Visual & Performing Arts | 13 | 1.5% |
| Communications | 27 | 3.2% |
| Arts & Humanities | 85 | 10.1% |
| Total | 839 | 100.0% |
Transportation & Commute in South Monroe
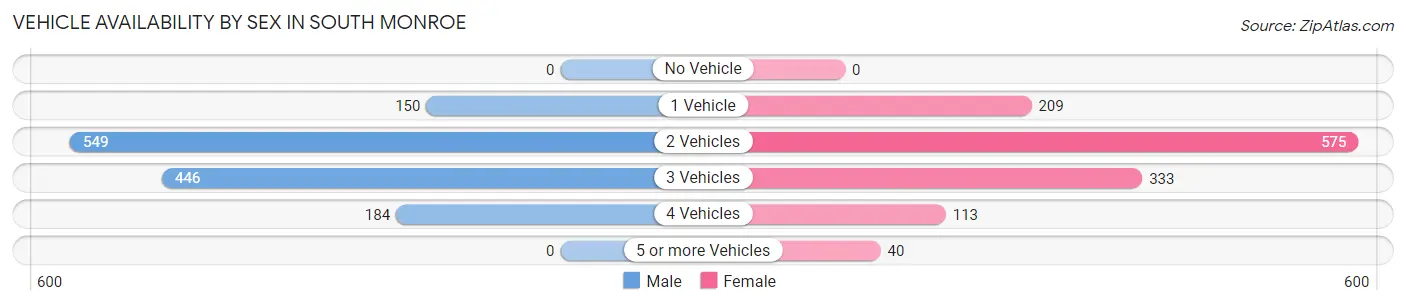
Vehicle Availability by Sex in South Monroe
The most prevalent vehicle ownership categories in South Monroe are males with 2 vehicles (549, accounting for 41.3%) and females with 2 vehicles (575, making up 43.2%).
| Vehicles Available | Male | Female |
| No Vehicle | 0 (0.0%) | 0 (0.0%) |
| 1 Vehicle | 150 (11.3%) | 209 (16.5%) |
| 2 Vehicles | 549 (41.3%) | 575 (45.3%) |
| 3 Vehicles | 446 (33.6%) | 333 (26.2%) |
| 4 Vehicles | 184 (13.8%) | 113 (8.9%) |
| 5 or more Vehicles | 0 (0.0%) | 40 (3.2%) |
| Total | 1,329 (100.0%) | 1,270 (100.0%) |
Commute Time in South Monroe
The most frequently occuring commute durations in South Monroe are 10 to 14 minutes (540 commuters, 22.7%), 5 to 9 minutes (444 commuters, 18.6%), and 20 to 24 minutes (284 commuters, 11.9%).
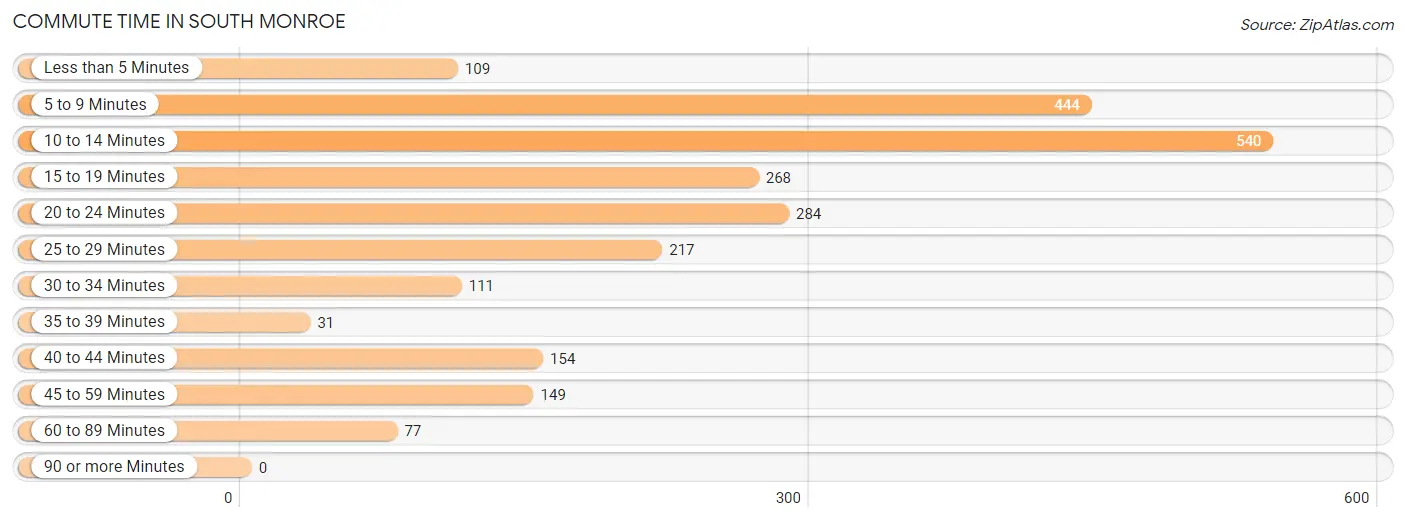
| Commute Time | # Commuters | % Commuters |
| Less than 5 Minutes | 109 | 4.6% |
| 5 to 9 Minutes | 444 | 18.6% |
| 10 to 14 Minutes | 540 | 22.7% |
| 15 to 19 Minutes | 268 | 11.2% |
| 20 to 24 Minutes | 284 | 11.9% |
| 25 to 29 Minutes | 217 | 9.1% |
| 30 to 34 Minutes | 111 | 4.7% |
| 35 to 39 Minutes | 31 | 1.3% |
| 40 to 44 Minutes | 154 | 6.5% |
| 45 to 59 Minutes | 149 | 6.2% |
| 60 to 89 Minutes | 77 | 3.2% |
| 90 or more Minutes | 0 | 0.0% |
Commute Time by Sex in South Monroe
The most common commute times in South Monroe are 5 to 9 minutes (264 commuters, 21.3%) for males and 10 to 14 minutes (391 commuters, 34.1%) for females.
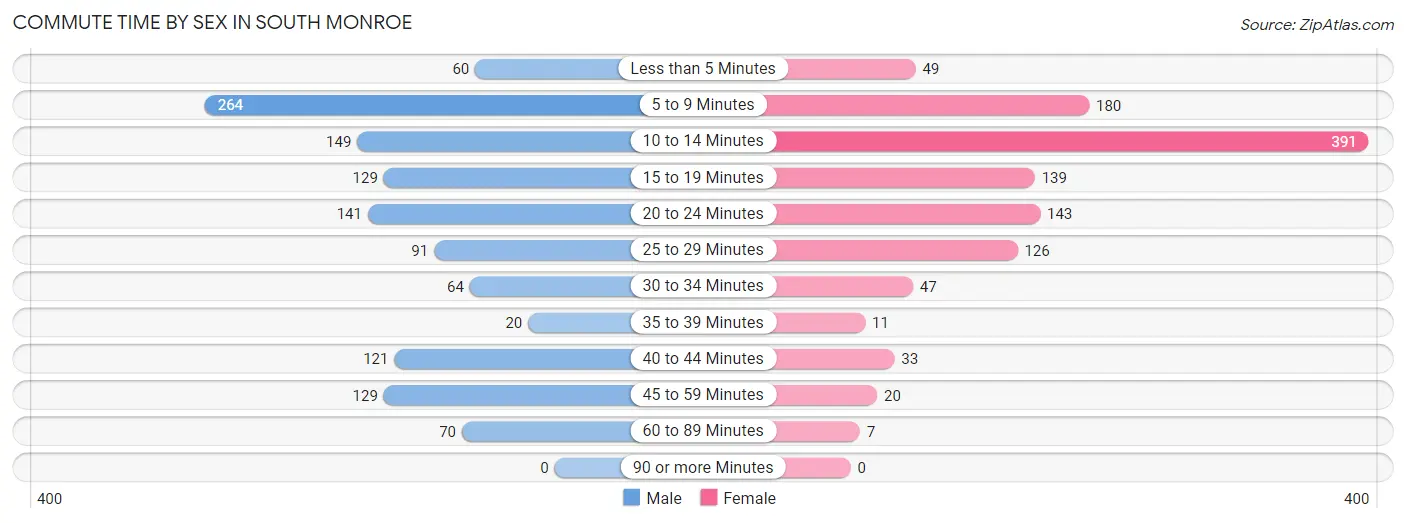
| Commute Time | Male | Female |
| Less than 5 Minutes | 60 (4.9%) | 49 (4.3%) |
| 5 to 9 Minutes | 264 (21.3%) | 180 (15.7%) |
| 10 to 14 Minutes | 149 (12.0%) | 391 (34.1%) |
| 15 to 19 Minutes | 129 (10.4%) | 139 (12.1%) |
| 20 to 24 Minutes | 141 (11.4%) | 143 (12.5%) |
| 25 to 29 Minutes | 91 (7.3%) | 126 (11.0%) |
| 30 to 34 Minutes | 64 (5.2%) | 47 (4.1%) |
| 35 to 39 Minutes | 20 (1.6%) | 11 (1.0%) |
| 40 to 44 Minutes | 121 (9.8%) | 33 (2.9%) |
| 45 to 59 Minutes | 129 (10.4%) | 20 (1.8%) |
| 60 to 89 Minutes | 70 (5.7%) | 7 (0.6%) |
| 90 or more Minutes | 0 (0.0%) | 0 (0.0%) |
Time of Departure to Work by Sex in South Monroe
The most frequent times of departure to work in South Monroe are 6:30 AM to 6:59 AM (203, 16.4%) for males and 8:00 AM to 8:29 AM (187, 16.3%) for females.
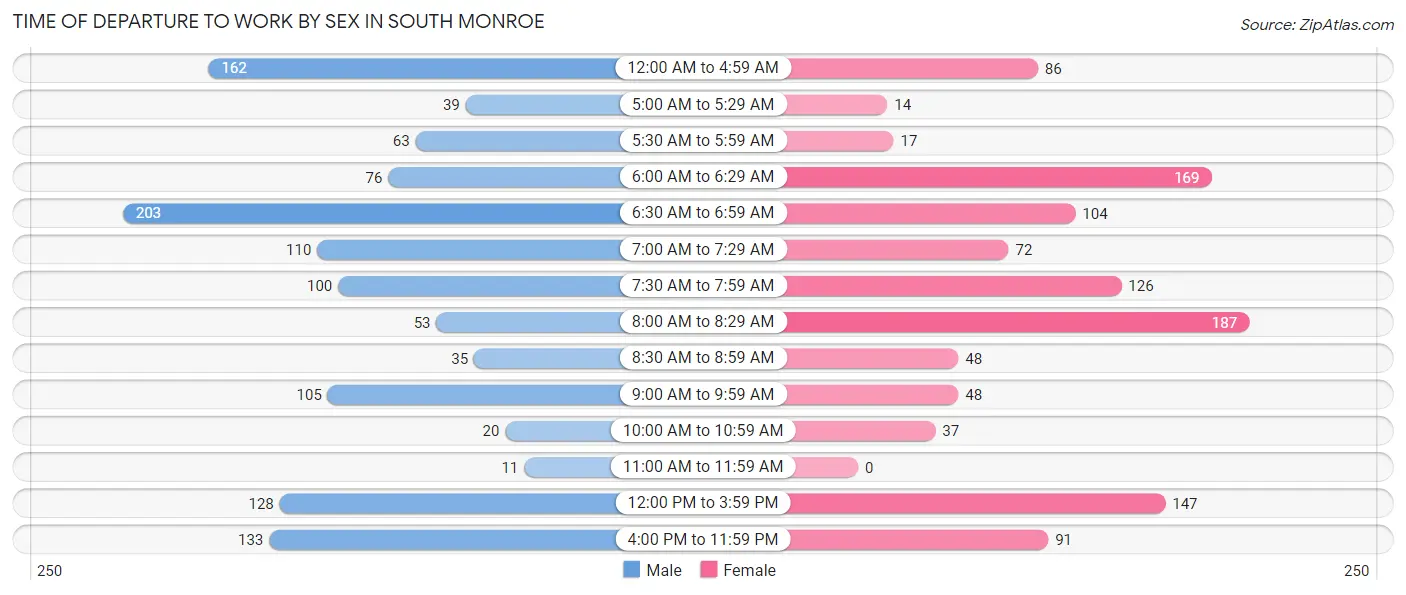
| Time of Departure | Male | Female |
| 12:00 AM to 4:59 AM | 162 (13.1%) | 86 (7.5%) |
| 5:00 AM to 5:29 AM | 39 (3.2%) | 14 (1.2%) |
| 5:30 AM to 5:59 AM | 63 (5.1%) | 17 (1.5%) |
| 6:00 AM to 6:29 AM | 76 (6.1%) | 169 (14.7%) |
| 6:30 AM to 6:59 AM | 203 (16.4%) | 104 (9.1%) |
| 7:00 AM to 7:29 AM | 110 (8.9%) | 72 (6.3%) |
| 7:30 AM to 7:59 AM | 100 (8.1%) | 126 (11.0%) |
| 8:00 AM to 8:29 AM | 53 (4.3%) | 187 (16.3%) |
| 8:30 AM to 8:59 AM | 35 (2.8%) | 48 (4.2%) |
| 9:00 AM to 9:59 AM | 105 (8.5%) | 48 (4.2%) |
| 10:00 AM to 10:59 AM | 20 (1.6%) | 37 (3.2%) |
| 11:00 AM to 11:59 AM | 11 (0.9%) | 0 (0.0%) |
| 12:00 PM to 3:59 PM | 128 (10.3%) | 147 (12.8%) |
| 4:00 PM to 11:59 PM | 133 (10.7%) | 91 (7.9%) |
| Total | 1,238 (100.0%) | 1,146 (100.0%) |
Housing Occupancy in South Monroe
Occupancy by Ownership in South Monroe
Of the total 2,834 dwellings in South Monroe, owner-occupied units account for 1,895 (66.9%), while renter-occupied units make up 939 (33.1%).
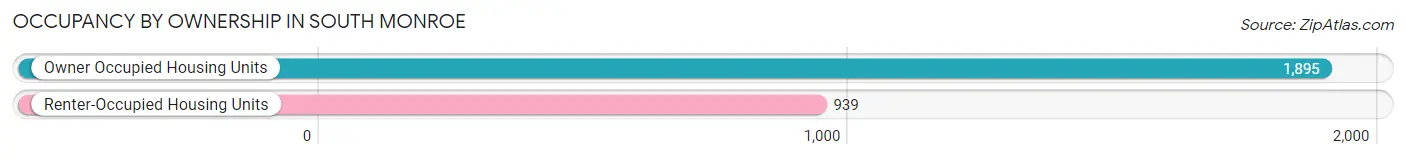
| Occupancy | # Housing Units | % Housing Units |
| Owner Occupied Housing Units | 1,895 | 66.9% |
| Renter-Occupied Housing Units | 939 | 33.1% |
| Total Occupied Housing Units | 2,834 | 100.0% |
Occupancy by Household Size in South Monroe
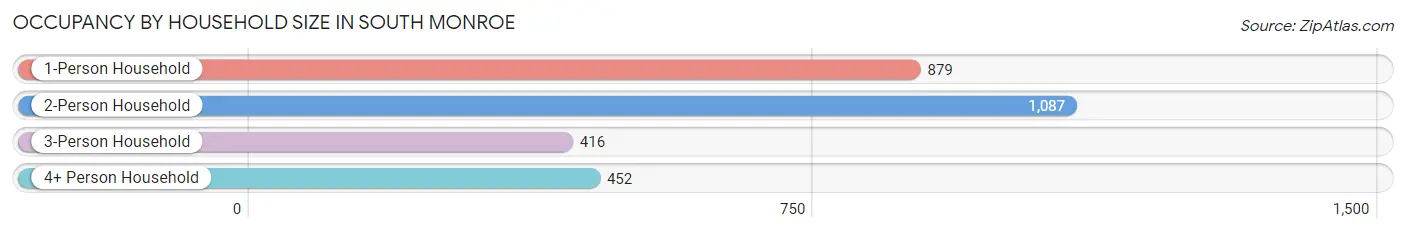
| Household Size | # Housing Units | % Housing Units |
| 1-Person Household | 879 | 31.0% |
| 2-Person Household | 1,087 | 38.4% |
| 3-Person Household | 416 | 14.7% |
| 4+ Person Household | 452 | 16.0% |
| Total Housing Units | 2,834 | 100.0% |
Occupancy by Ownership by Household Size in South Monroe
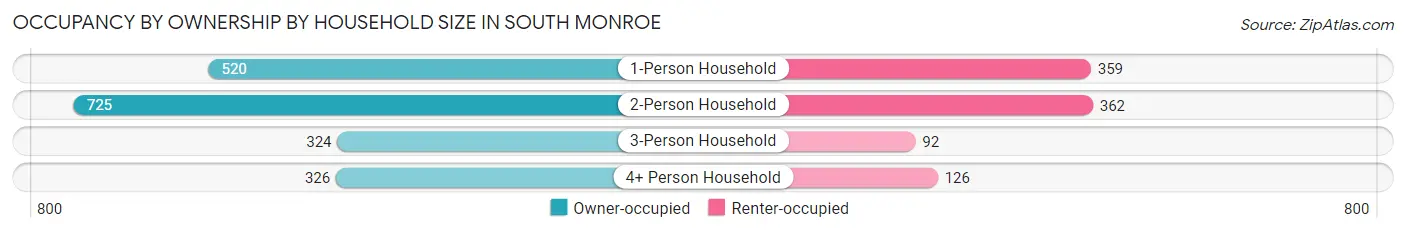
| Household Size | Owner-occupied | Renter-occupied |
| 1-Person Household | 520 (59.2%) | 359 (40.8%) |
| 2-Person Household | 725 (66.7%) | 362 (33.3%) |
| 3-Person Household | 324 (77.9%) | 92 (22.1%) |
| 4+ Person Household | 326 (72.1%) | 126 (27.9%) |
| Total Housing Units | 1,895 (66.9%) | 939 (33.1%) |
Occupancy by Educational Attainment in South Monroe
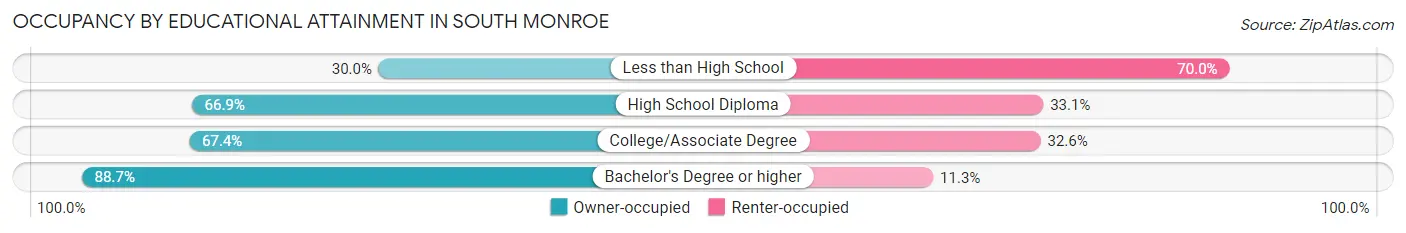
| Household Size | Owner-occupied | Renter-occupied |
| Less than High School | 89 (30.0%) | 208 (70.0%) |
| High School Diploma | 743 (66.9%) | 368 (33.1%) |
| College/Associate Degree | 639 (67.4%) | 309 (32.6%) |
| Bachelor's Degree or higher | 424 (88.7%) | 54 (11.3%) |
Occupancy by Age of Householder in South Monroe
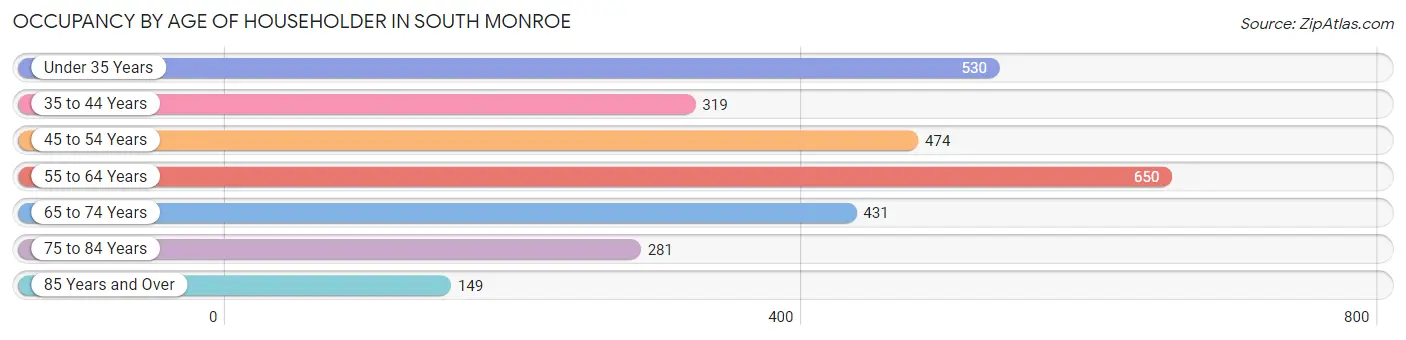
| Age Bracket | # Households | % Households |
| Under 35 Years | 530 | 18.7% |
| 35 to 44 Years | 319 | 11.3% |
| 45 to 54 Years | 474 | 16.7% |
| 55 to 64 Years | 650 | 22.9% |
| 65 to 74 Years | 431 | 15.2% |
| 75 to 84 Years | 281 | 9.9% |
| 85 Years and Over | 149 | 5.3% |
| Total | 2,834 | 100.0% |
Housing Finances in South Monroe
Median Income by Occupancy in South Monroe
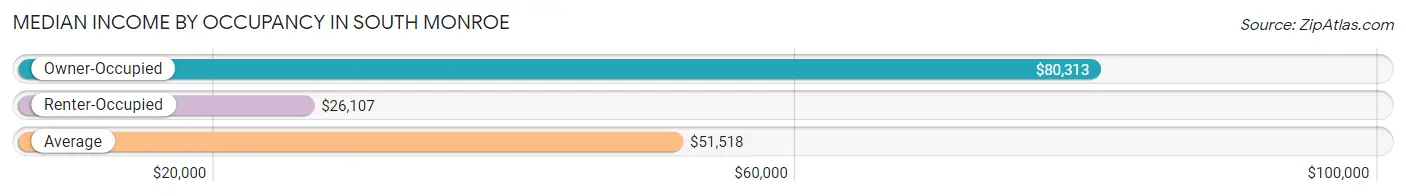
| Occupancy Type | # Households | Median Income |
| Owner-Occupied | 1,895 (66.9%) | $80,313 |
| Renter-Occupied | 939 (33.1%) | $26,107 |
| Average | 2,834 (100.0%) | $51,518 |
Occupancy by Householder Income Bracket in South Monroe
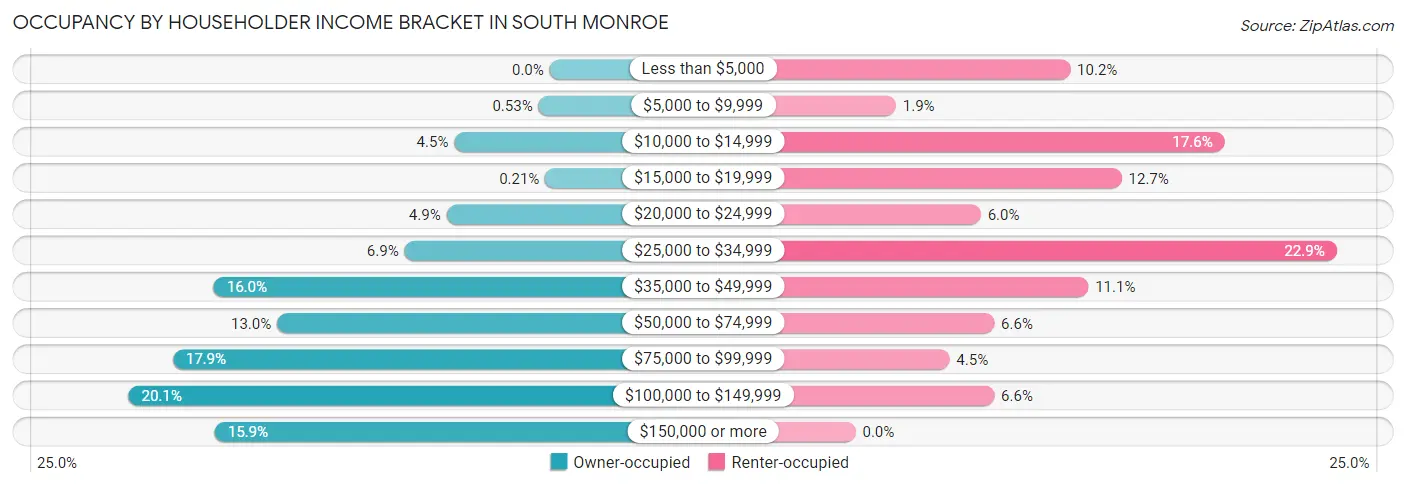
| Income Bracket | Owner-occupied | Renter-occupied |
| Less than $5,000 | 0 (0.0%) | 96 (10.2%) |
| $5,000 to $9,999 | 10 (0.5%) | 18 (1.9%) |
| $10,000 to $14,999 | 86 (4.5%) | 165 (17.6%) |
| $15,000 to $19,999 | 4 (0.2%) | 119 (12.7%) |
| $20,000 to $24,999 | 93 (4.9%) | 56 (6.0%) |
| $25,000 to $34,999 | 131 (6.9%) | 215 (22.9%) |
| $35,000 to $49,999 | 303 (16.0%) | 104 (11.1%) |
| $50,000 to $74,999 | 246 (13.0%) | 62 (6.6%) |
| $75,000 to $99,999 | 340 (17.9%) | 42 (4.5%) |
| $100,000 to $149,999 | 380 (20.1%) | 62 (6.6%) |
| $150,000 or more | 302 (15.9%) | 0 (0.0%) |
| Total | 1,895 (100.0%) | 939 (100.0%) |
Monthly Housing Cost Tiers in South Monroe
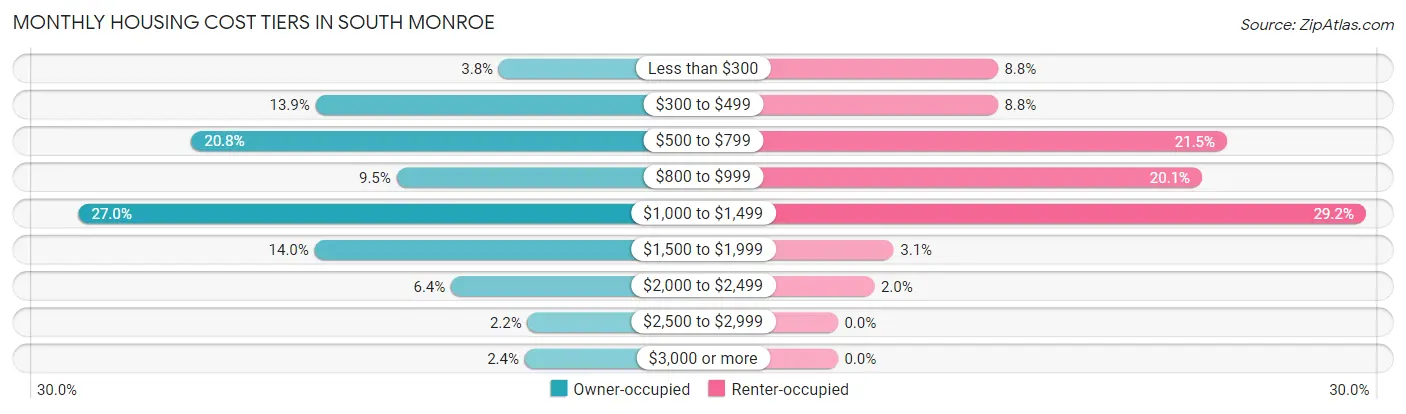
| Monthly Cost | Owner-occupied | Renter-occupied |
| Less than $300 | 72 (3.8%) | 83 (8.8%) |
| $300 to $499 | 264 (13.9%) | 83 (8.8%) |
| $500 to $799 | 394 (20.8%) | 202 (21.5%) |
| $800 to $999 | 179 (9.5%) | 189 (20.1%) |
| $1,000 to $1,499 | 512 (27.0%) | 274 (29.2%) |
| $1,500 to $1,999 | 265 (14.0%) | 29 (3.1%) |
| $2,000 to $2,499 | 122 (6.4%) | 19 (2.0%) |
| $2,500 to $2,999 | 42 (2.2%) | 0 (0.0%) |
| $3,000 or more | 45 (2.4%) | 0 (0.0%) |
| Total | 1,895 (100.0%) | 939 (100.0%) |
Physical Housing Characteristics in South Monroe
Housing Structures in South Monroe
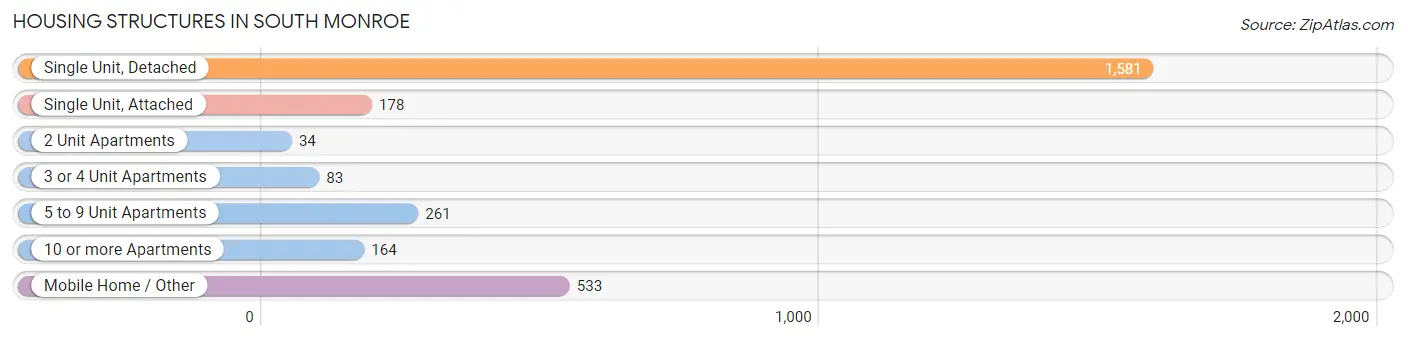
| Structure Type | # Housing Units | % Housing Units |
| Single Unit, Detached | 1,581 | 55.8% |
| Single Unit, Attached | 178 | 6.3% |
| 2 Unit Apartments | 34 | 1.2% |
| 3 or 4 Unit Apartments | 83 | 2.9% |
| 5 to 9 Unit Apartments | 261 | 9.2% |
| 10 or more Apartments | 164 | 5.8% |
| Mobile Home / Other | 533 | 18.8% |
| Total | 2,834 | 100.0% |
Housing Structures by Occupancy in South Monroe
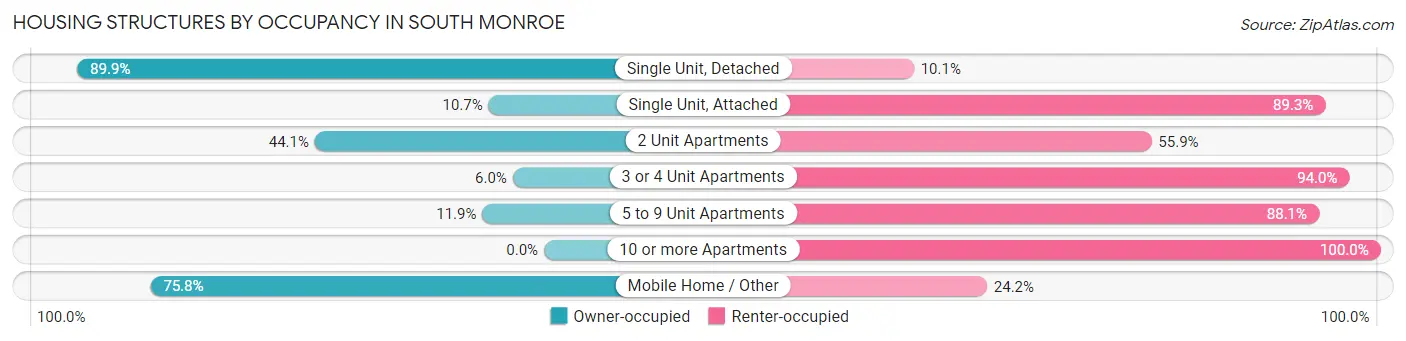
| Structure Type | Owner-occupied | Renter-occupied |
| Single Unit, Detached | 1,421 (89.9%) | 160 (10.1%) |
| Single Unit, Attached | 19 (10.7%) | 159 (89.3%) |
| 2 Unit Apartments | 15 (44.1%) | 19 (55.9%) |
| 3 or 4 Unit Apartments | 5 (6.0%) | 78 (94.0%) |
| 5 to 9 Unit Apartments | 31 (11.9%) | 230 (88.1%) |
| 10 or more Apartments | 0 (0.0%) | 164 (100.0%) |
| Mobile Home / Other | 404 (75.8%) | 129 (24.2%) |
| Total | 1,895 (66.9%) | 939 (33.1%) |
Housing Structures by Number of Rooms in South Monroe
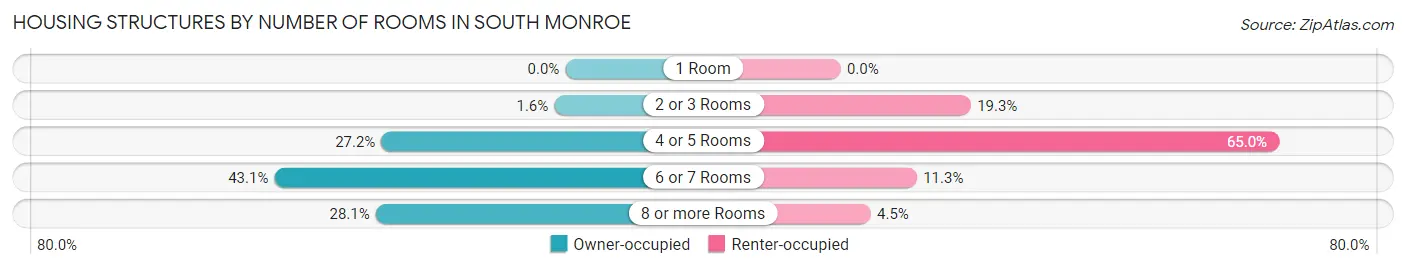
| Number of Rooms | Owner-occupied | Renter-occupied |
| 1 Room | 0 (0.0%) | 0 (0.0%) |
| 2 or 3 Rooms | 31 (1.6%) | 181 (19.3%) |
| 4 or 5 Rooms | 516 (27.2%) | 610 (65.0%) |
| 6 or 7 Rooms | 816 (43.1%) | 106 (11.3%) |
| 8 or more Rooms | 532 (28.1%) | 42 (4.5%) |
| Total | 1,895 (100.0%) | 939 (100.0%) |
Housing Structure by Heating Type in South Monroe
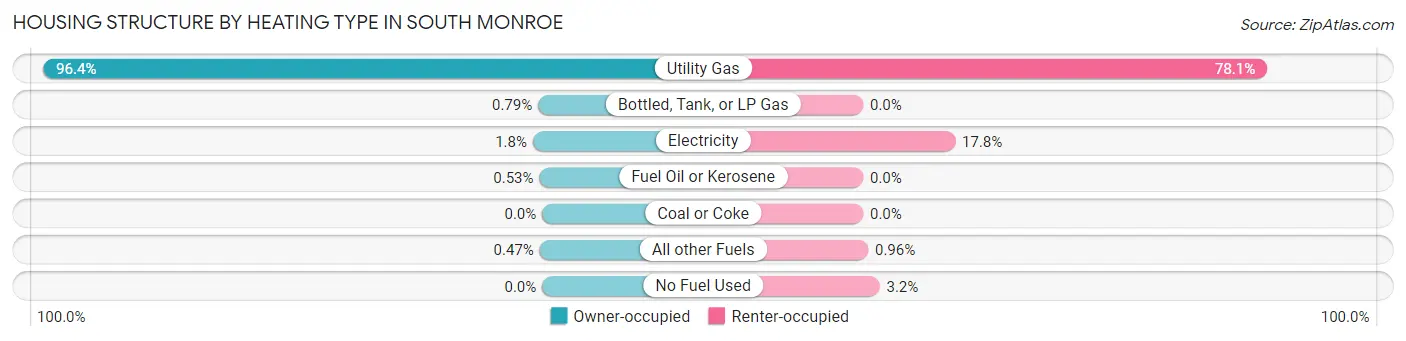
| Heating Type | Owner-occupied | Renter-occupied |
| Utility Gas | 1,827 (96.4%) | 733 (78.1%) |
| Bottled, Tank, or LP Gas | 15 (0.8%) | 0 (0.0%) |
| Electricity | 34 (1.8%) | 167 (17.8%) |
| Fuel Oil or Kerosene | 10 (0.5%) | 0 (0.0%) |
| Coal or Coke | 0 (0.0%) | 0 (0.0%) |
| All other Fuels | 9 (0.5%) | 9 (1.0%) |
| No Fuel Used | 0 (0.0%) | 30 (3.2%) |
| Total | 1,895 (100.0%) | 939 (100.0%) |
Household Vehicle Usage in South Monroe
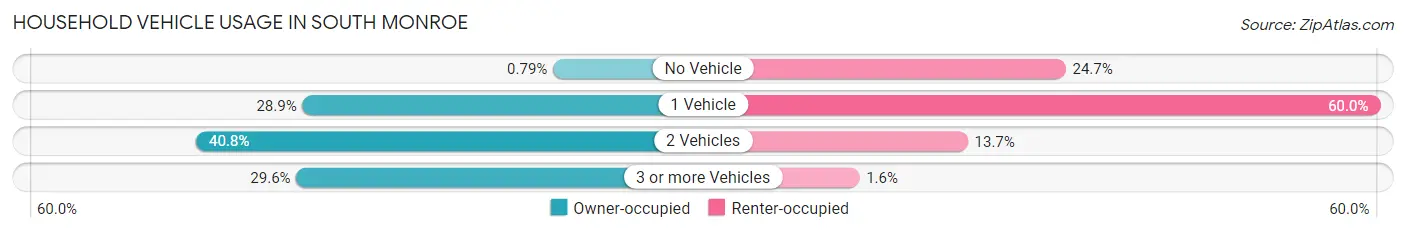
| Vehicles per Household | Owner-occupied | Renter-occupied |
| No Vehicle | 15 (0.8%) | 232 (24.7%) |
| 1 Vehicle | 547 (28.9%) | 563 (60.0%) |
| 2 Vehicles | 773 (40.8%) | 129 (13.7%) |
| 3 or more Vehicles | 560 (29.5%) | 15 (1.6%) |
| Total | 1,895 (100.0%) | 939 (100.0%) |
Real Estate & Mortgages in South Monroe
Real Estate and Mortgage Overview in South Monroe
| Characteristic | Without Mortgage | With Mortgage |
| Housing Units | 847 | 1,048 |
| Median Property Value | $162,100 | $177,900 |
| Median Household Income | $55,350 | $221 |
| Monthly Housing Costs | $622 | $45 |
| Real Estate Taxes | $1,724 | $143 |
Property Value by Mortgage Status in South Monroe
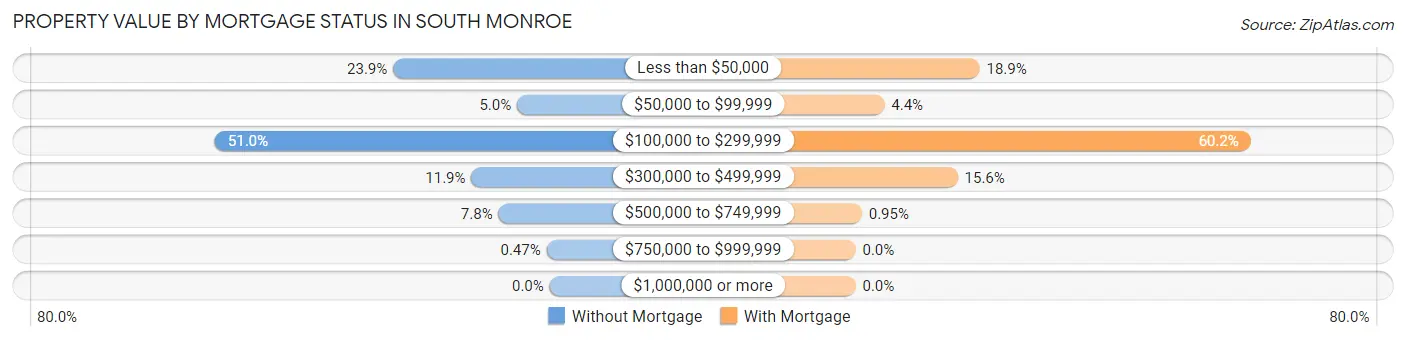
| Property Value | Without Mortgage | With Mortgage |
| Less than $50,000 | 202 (23.8%) | 198 (18.9%) |
| $50,000 to $99,999 | 42 (5.0%) | 46 (4.4%) |
| $100,000 to $299,999 | 432 (51.0%) | 631 (60.2%) |
| $300,000 to $499,999 | 101 (11.9%) | 163 (15.5%) |
| $500,000 to $749,999 | 66 (7.8%) | 10 (0.9%) |
| $750,000 to $999,999 | 4 (0.5%) | 0 (0.0%) |
| $1,000,000 or more | 0 (0.0%) | 0 (0.0%) |
| Total | 847 (100.0%) | 1,048 (100.0%) |
Household Income by Mortgage Status in South Monroe
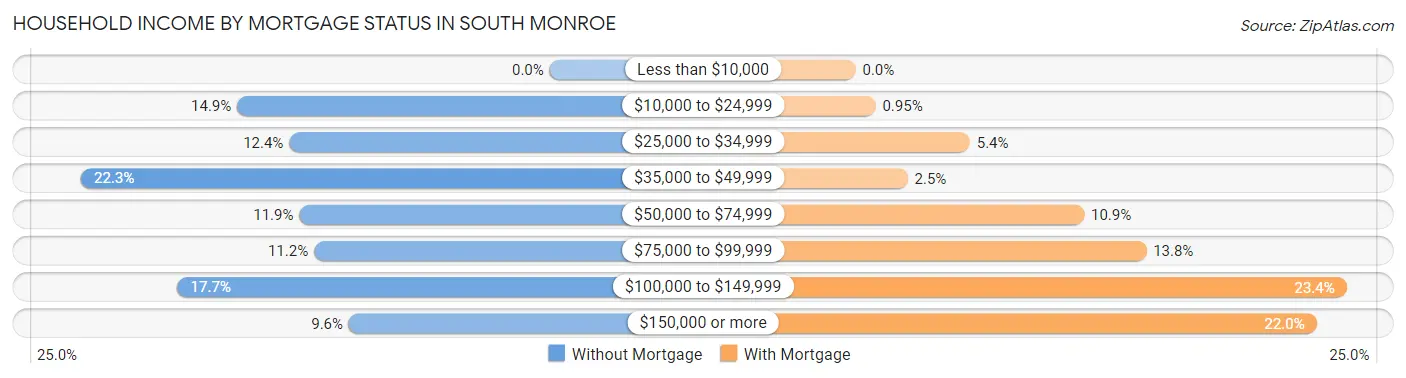
| Household Income | Without Mortgage | With Mortgage |
| Less than $10,000 | 0 (0.0%) | 0 (0.0%) |
| $10,000 to $24,999 | 126 (14.9%) | 10 (0.9%) |
| $25,000 to $34,999 | 105 (12.4%) | 57 (5.4%) |
| $35,000 to $49,999 | 189 (22.3%) | 26 (2.5%) |
| $50,000 to $74,999 | 101 (11.9%) | 114 (10.9%) |
| $75,000 to $99,999 | 95 (11.2%) | 145 (13.8%) |
| $100,000 to $149,999 | 150 (17.7%) | 245 (23.4%) |
| $150,000 or more | 81 (9.6%) | 230 (22.0%) |
| Total | 847 (100.0%) | 1,048 (100.0%) |
Property Value to Household Income Ratio in South Monroe
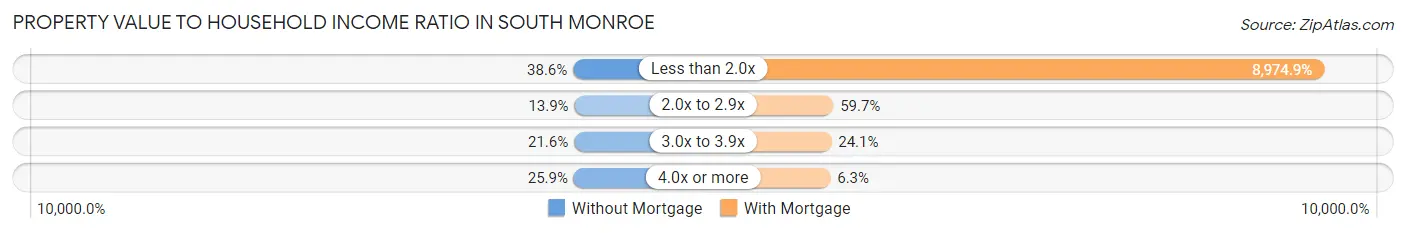
| Value-to-Income Ratio | Without Mortgage | With Mortgage |
| Less than 2.0x | 327 (38.6%) | 94,057 (8,974.9%) |
| 2.0x to 2.9x | 118 (13.9%) | 626 (59.7%) |
| 3.0x to 3.9x | 183 (21.6%) | 253 (24.1%) |
| 4.0x or more | 219 (25.9%) | 66 (6.3%) |
| Total | 847 (100.0%) | 1,048 (100.0%) |
Real Estate Taxes by Mortgage Status in South Monroe
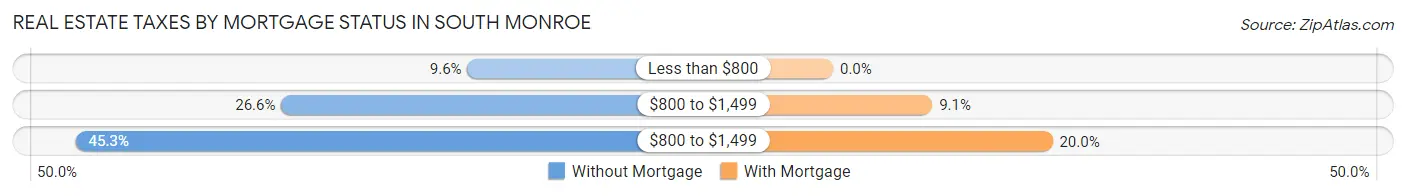
| Property Taxes | Without Mortgage | With Mortgage |
| Less than $800 | 81 (9.6%) | 0 (0.0%) |
| $800 to $1,499 | 225 (26.6%) | 95 (9.1%) |
| $800 to $1,499 | 384 (45.3%) | 210 (20.0%) |
| Total | 847 (100.0%) | 1,048 (100.0%) |
Health & Disability in South Monroe
Health Insurance Coverage by Age in South Monroe
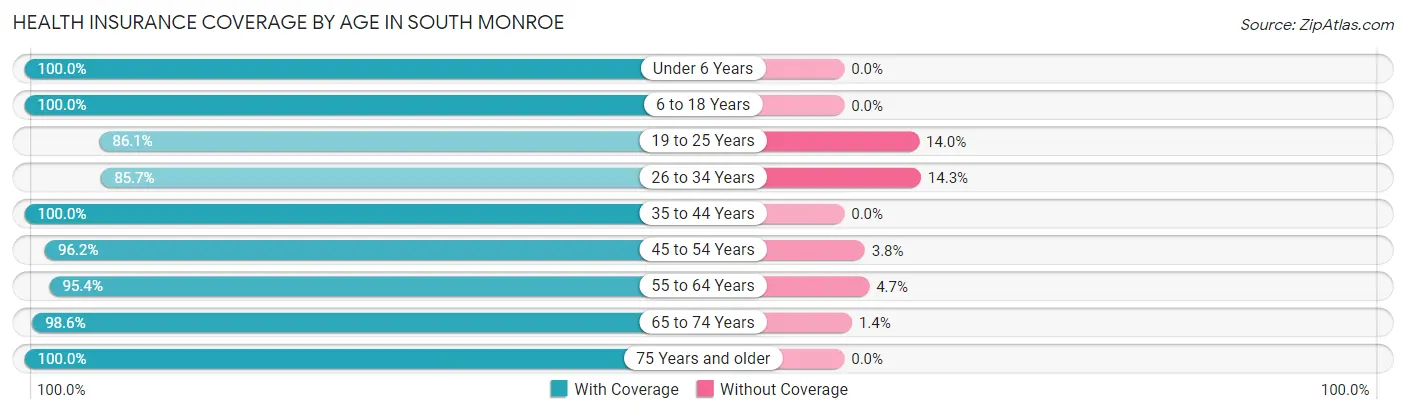
| Age Bracket | With Coverage | Without Coverage |
| Under 6 Years | 402 (100.0%) | 0 (0.0%) |
| 6 to 18 Years | 993 (100.0%) | 0 (0.0%) |
| 19 to 25 Years | 518 (86.1%) | 84 (14.0%) |
| 26 to 34 Years | 702 (85.7%) | 117 (14.3%) |
| 35 to 44 Years | 654 (100.0%) | 0 (0.0%) |
| 45 to 54 Years | 806 (96.2%) | 32 (3.8%) |
| 55 to 64 Years | 923 (95.4%) | 45 (4.6%) |
| 65 to 74 Years | 689 (98.6%) | 10 (1.4%) |
| 75 Years and older | 581 (100.0%) | 0 (0.0%) |
| Total | 6,268 (95.6%) | 288 (4.4%) |
Health Insurance Coverage by Citizenship Status in South Monroe
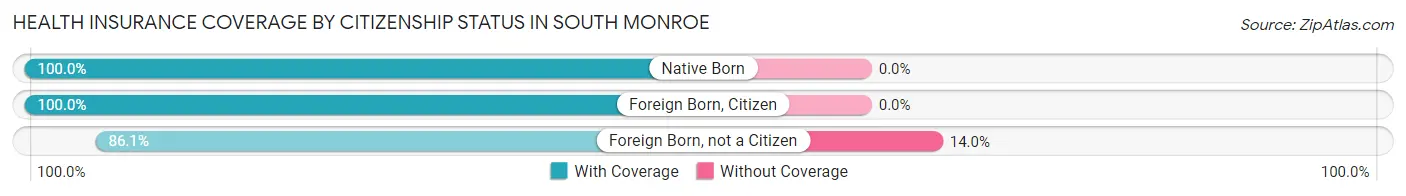
| Citizenship Status | With Coverage | Without Coverage |
| Native Born | 402 (100.0%) | 0 (0.0%) |
| Foreign Born, Citizen | 993 (100.0%) | 0 (0.0%) |
| Foreign Born, not a Citizen | 518 (86.1%) | 84 (14.0%) |
Health Insurance Coverage by Household Income in South Monroe
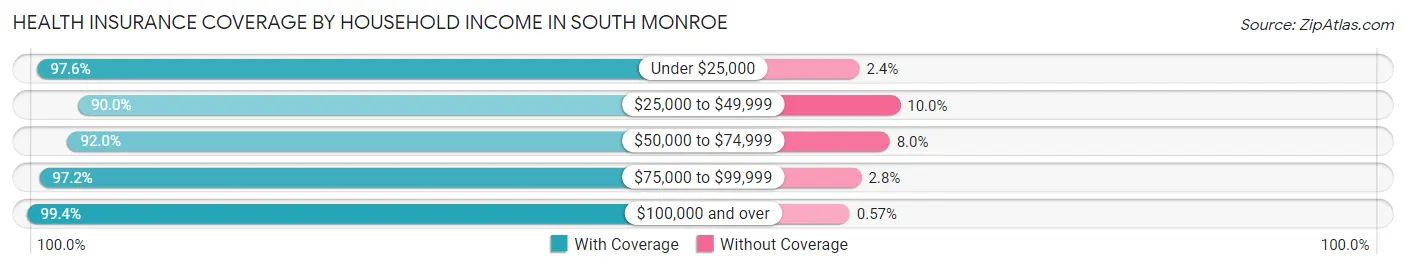
| Household Income | With Coverage | Without Coverage |
| Under $25,000 | 939 (97.6%) | 23 (2.4%) |
| $25,000 to $49,999 | 1,491 (90.0%) | 166 (10.0%) |
| $50,000 to $74,999 | 698 (92.0%) | 61 (8.0%) |
| $75,000 to $99,999 | 873 (97.2%) | 25 (2.8%) |
| $100,000 and over | 2,267 (99.4%) | 13 (0.6%) |
Public vs Private Health Insurance Coverage by Age in South Monroe
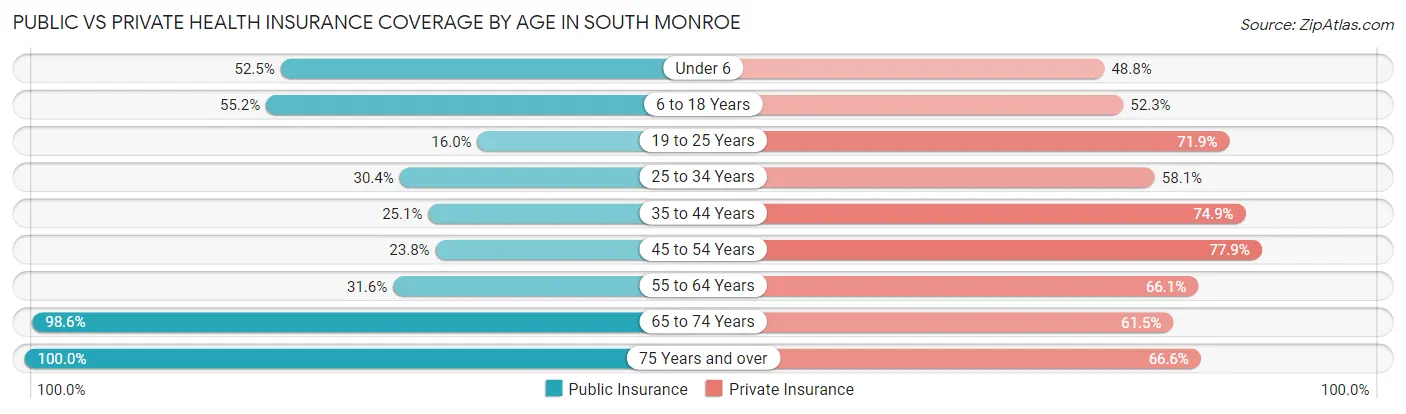
| Age Bracket | Public Insurance | Private Insurance |
| Under 6 | 211 (52.5%) | 196 (48.8%) |
| 6 to 18 Years | 548 (55.2%) | 519 (52.3%) |
| 19 to 25 Years | 96 (16.0%) | 433 (71.9%) |
| 25 to 34 Years | 249 (30.4%) | 476 (58.1%) |
| 35 to 44 Years | 164 (25.1%) | 490 (74.9%) |
| 45 to 54 Years | 199 (23.7%) | 653 (77.9%) |
| 55 to 64 Years | 306 (31.6%) | 640 (66.1%) |
| 65 to 74 Years | 689 (98.6%) | 430 (61.5%) |
| 75 Years and over | 581 (100.0%) | 387 (66.6%) |
| Total | 3,043 (46.4%) | 4,224 (64.4%) |
Disability Status by Sex by Age in South Monroe
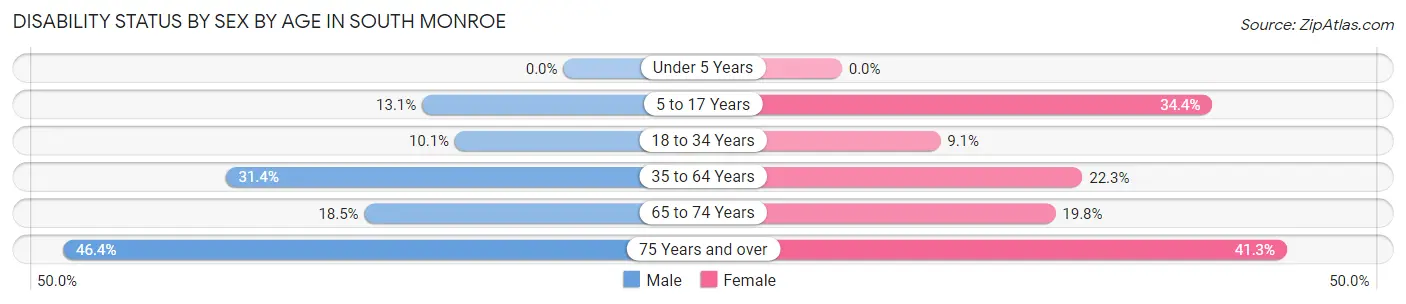
| Age Bracket | Male | Female |
| Under 5 Years | 0 (0.0%) | 0 (0.0%) |
| 5 to 17 Years | 96 (13.1%) | 109 (34.4%) |
| 18 to 34 Years | 79 (10.1%) | 63 (9.1%) |
| 35 to 64 Years | 368 (31.4%) | 287 (22.3%) |
| 65 to 74 Years | 48 (18.5%) | 87 (19.8%) |
| 75 Years and over | 91 (46.4%) | 159 (41.3%) |
Disability Class by Sex by Age in South Monroe
Disability Class: Hearing Difficulty
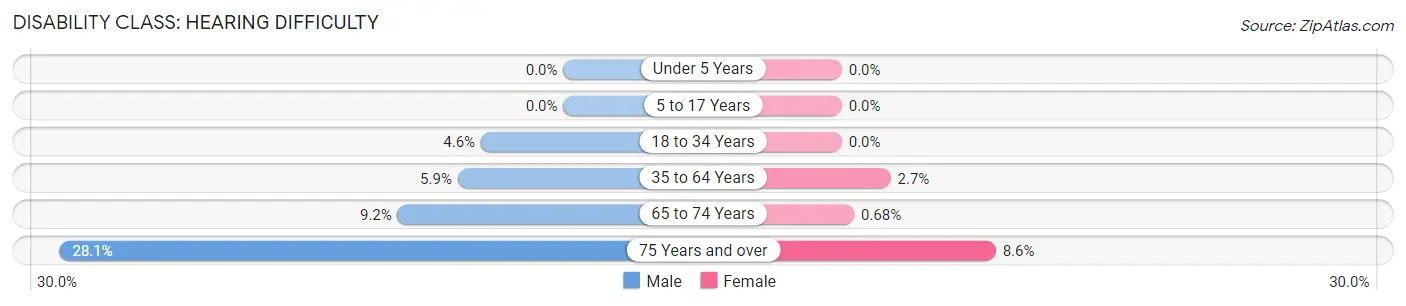
| Age Bracket | Male | Female |
| Under 5 Years | 0 (0.0%) | 0 (0.0%) |
| 5 to 17 Years | 0 (0.0%) | 0 (0.0%) |
| 18 to 34 Years | 36 (4.6%) | 0 (0.0%) |
| 35 to 64 Years | 69 (5.9%) | 35 (2.7%) |
| 65 to 74 Years | 24 (9.2%) | 3 (0.7%) |
| 75 Years and over | 55 (28.1%) | 33 (8.6%) |
Disability Class: Vision Difficulty
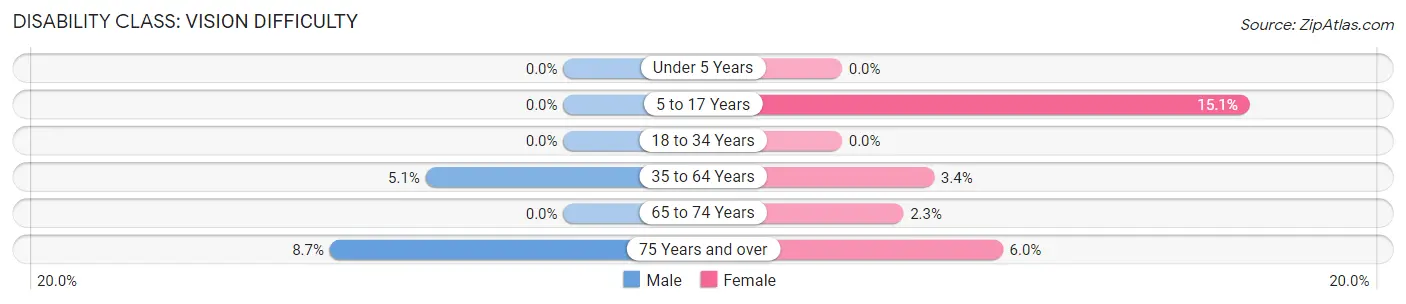
| Age Bracket | Male | Female |
| Under 5 Years | 0 (0.0%) | 0 (0.0%) |
| 5 to 17 Years | 0 (0.0%) | 48 (15.1%) |
| 18 to 34 Years | 0 (0.0%) | 0 (0.0%) |
| 35 to 64 Years | 60 (5.1%) | 44 (3.4%) |
| 65 to 74 Years | 0 (0.0%) | 10 (2.3%) |
| 75 Years and over | 17 (8.7%) | 23 (6.0%) |
Disability Class: Cognitive Difficulty
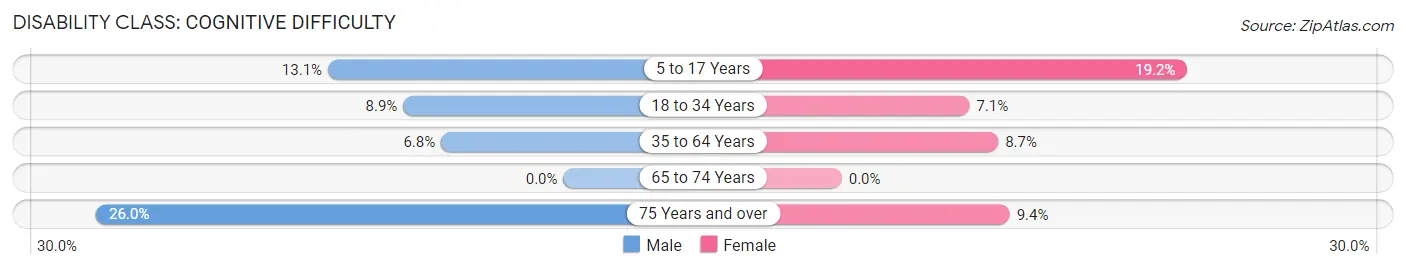
| Age Bracket | Male | Female |
| 5 to 17 Years | 96 (13.1%) | 61 (19.2%) |
| 18 to 34 Years | 70 (8.9%) | 49 (7.1%) |
| 35 to 64 Years | 80 (6.8%) | 112 (8.7%) |
| 65 to 74 Years | 0 (0.0%) | 0 (0.0%) |
| 75 Years and over | 51 (26.0%) | 36 (9.3%) |
Disability Class: Ambulatory Difficulty
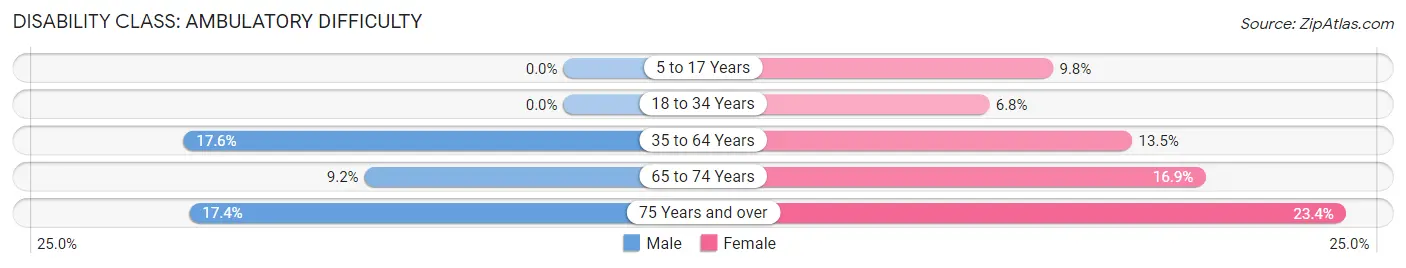
| Age Bracket | Male | Female |
| 5 to 17 Years | 0 (0.0%) | 31 (9.8%) |
| 18 to 34 Years | 0 (0.0%) | 47 (6.8%) |
| 35 to 64 Years | 207 (17.6%) | 173 (13.5%) |
| 65 to 74 Years | 24 (9.2%) | 74 (16.9%) |
| 75 Years and over | 34 (17.3%) | 90 (23.4%) |
Disability Class: Self-Care Difficulty
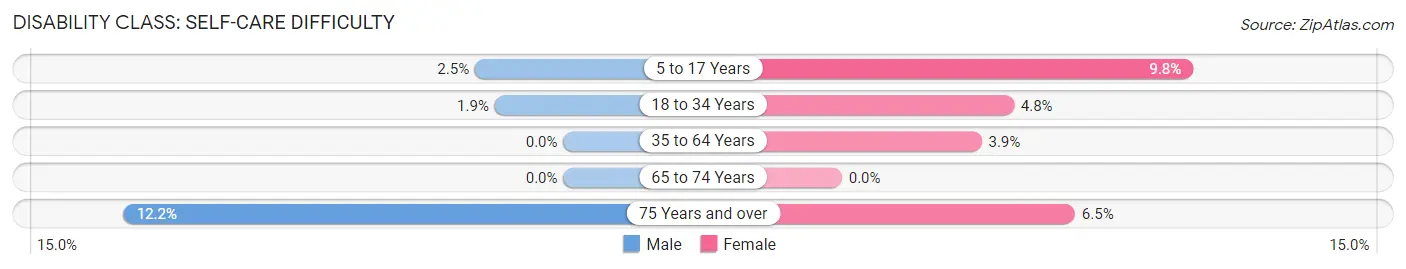
| Age Bracket | Male | Female |
| 5 to 17 Years | 18 (2.5%) | 31 (9.8%) |
| 18 to 34 Years | 15 (1.9%) | 33 (4.8%) |
| 35 to 64 Years | 0 (0.0%) | 50 (3.9%) |
| 65 to 74 Years | 0 (0.0%) | 0 (0.0%) |
| 75 Years and over | 24 (12.2%) | 25 (6.5%) |
Technology Access in South Monroe
Computing Device Access in South Monroe
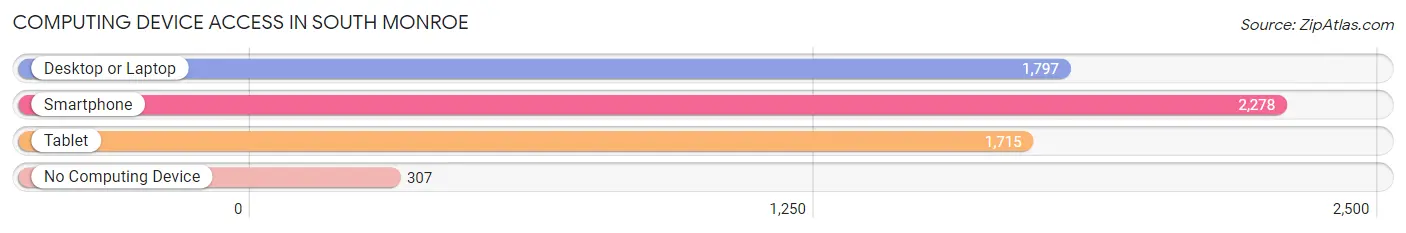
| Device Type | # Households | % Households |
| Desktop or Laptop | 1,797 | 63.4% |
| Smartphone | 2,278 | 80.4% |
| Tablet | 1,715 | 60.5% |
| No Computing Device | 307 | 10.8% |
| Total | 2,834 | 100.0% |
Internet Access in South Monroe
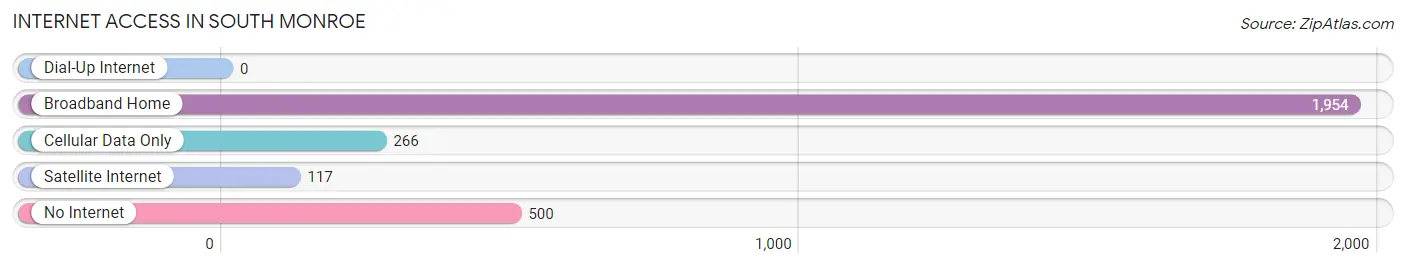
| Internet Type | # Households | % Households |
| Dial-Up Internet | 0 | 0.0% |
| Broadband Home | 1,954 | 69.0% |
| Cellular Data Only | 266 | 9.4% |
| Satellite Internet | 117 | 4.1% |
| No Internet | 500 | 17.6% |
| Total | 2,834 | 100.0% |
South Monroe Summary
Monroe County, Michigan is located in the southeastern corner of the state, and is bordered by the states of Ohio and Indiana. The county seat is Monroe, and the county is home to a population of over 150,000 people. The county is home to the cities of Monroe, Dundee, Maybee, South Monroe, and Temperance.
History
Monroe County was established in 1817, and was named after James Monroe, the fifth President of the United States. The county was originally part of the Michigan Territory, and was one of the first counties to be organized in the state. The county was originally home to Native American tribes, including the Potawatomi, Ottawa, and Chippewa.
The first settlers in the area were French-Canadian fur traders, who established trading posts in the area in the late 1700s. The first permanent settlers arrived in the early 1800s, and the county was officially organized in 1817.
The county was an important part of the Underground Railroad, and was home to many abolitionists who helped escaped slaves make their way to freedom. The county was also home to many Civil War veterans, and was the site of several battles during the war.
Geography
Monroe County is located in the southeastern corner of Michigan, and is bordered by the states of Ohio and Indiana. The county is home to a total area of 545 square miles, of which 543 square miles is land and 2 square miles is water. The county is home to several rivers, including the River Raisin, the Huron River, and the Maumee River.
The county is home to several parks, including Sterling State Park, River Raisin National Battlefield Park, and the River Raisin Heritage Trail. The county is also home to several lakes, including Lake Erie, Lake St. Clair, and Lake Monroe.
Economy
Monroe County has a diverse economy, with a variety of industries providing employment opportunities. The county is home to several manufacturing companies, including automotive parts manufacturers, food processing companies, and metalworking companies. The county is also home to several agricultural operations, including dairy farms, fruit farms, and vegetable farms.
The county is home to several educational institutions, including Monroe County Community College, the University of Michigan-Monroe, and Monroe Public Schools. The county is also home to several healthcare facilities, including ProMedica Monroe Regional Hospital and Mercy Memorial Hospital.
Demographics
As of the 2010 census, Monroe County had a population of 152,021 people. The racial makeup of the county was 87.3% White, 8.2% African American, 0.7% Native American, 1.2% Asian, 0.1% Pacific Islander, and 2.5% from two or more races. The median household income in the county was $45,945, and the median family income was $54,945. The per capita income in the county was $22,945.
The largest city in the county is Monroe, which had a population of 20,733 people as of the 2010 census. The other cities in the county are Dundee, Maybee, South Monroe, and Temperance. The county is home to several unincorporated communities, including Carleton, Estral Beach, Ida, La Salle, Luna Pier, and Maybee.
Common Questions
What is Per Capita Income in South Monroe?
Per Capita income in South Monroe is $31,464.
What is the Median Family Income in South Monroe?
Median Family Income in South Monroe is $66,181.
What is the Median Household income in South Monroe?
Median Household Income in South Monroe is $51,518.
What is Income or Wage Gap in South Monroe?
Income or Wage Gap in South Monroe is 37.2%.
Women in South Monroe earn 62.8 cents for every dollar earned by a man.
What is Inequality or Gini Index in South Monroe?
Inequality or Gini Index in South Monroe is 0.45.
What is the Total Population of South Monroe?
Total Population of South Monroe is 6,658.
What is the Total Male Population of South Monroe?
Total Male Population of South Monroe is 3,342.
What is the Total Female Population of South Monroe?
Total Female Population of South Monroe is 3,316.
What is the Ratio of Males per 100 Females in South Monroe?
There are 100.78 Males per 100 Females in South Monroe.
What is the Ratio of Females per 100 Males in South Monroe?
There are 99.22 Females per 100 Males in South Monroe.
What is the Median Population Age in South Monroe?
Median Population Age in South Monroe is 42.5 Years.
What is the Average Family Size in South Monroe
Average Family Size in South Monroe is 2.9 People.
What is the Average Household Size in South Monroe
Average Household Size in South Monroe is 2.3 People.
How Large is the Labor Force in South Monroe?
There are 3,077 People in the Labor Forcein in South Monroe.
What is the Percentage of People in the Labor Force in South Monroe?
55.3% of People are in the Labor Force in South Monroe.
What is the Unemployment Rate in South Monroe?
Unemployment Rate in South Monroe is 11.0%.