Sebewaing, MI Map & Demographics
Sebewaing Map
Sebewaing Overview
$27,515
PER CAPITA INCOME
$56,477
AVG FAMILY INCOME
$44,441
AVG HOUSEHOLD INCOME
38.6%
WAGE / INCOME GAP [ % ]
61.4¢/ $1
WAGE / INCOME GAP [ $ ]
$6,700
FAMILY INCOME DEFICIT
0.40
INEQUALITY / GINI INDEX
1,951
TOTAL POPULATION
960
MALE POPULATION
991
FEMALE POPULATION
96.87
MALES / 100 FEMALES
103.23
FEMALES / 100 MALES
52.0
MEDIAN AGE
2.9
AVG FAMILY SIZE
2.1
AVG HOUSEHOLD SIZE
870
LABOR FORCE [ PEOPLE ]
53.6%
PERCENT IN LABOR FORCE
8.6%
UNEMPLOYMENT RATE
Sebewaing Zip Codes
Sebewaing Area Codes
Income in Sebewaing
Income Overview in Sebewaing
Per Capita Income in Sebewaing is $27,515, while median incomes of families and households are $56,477 and $44,441 respectively.
| Characteristic | Number | Measure |
| Per Capita Income | 1,951 | $27,515 |
| Median Family Income | 459 | $56,477 |
| Mean Family Income | 459 | $66,876 |
| Median Household Income | 919 | $44,441 |
| Mean Household Income | 919 | $57,114 |
| Income Deficit | 459 | $6,700 |
| Wage / Income Gap (%) | 1,951 | 38.60% |
| Wage / Income Gap ($) | 1,951 | 61.40¢ per $1 |
| Gini / Inequality Index | 1,951 | 0.40 |
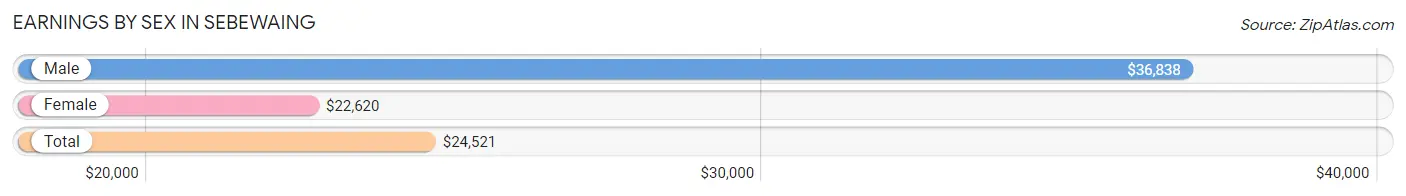
Earnings by Sex in Sebewaing
Average Earnings in Sebewaing are $24,521, $36,838 for men and $22,620 for women, a difference of 38.6%.
| Sex | Number | Average Earnings |
| Male | 505 (54.3%) | $36,838 |
| Female | 425 (45.7%) | $22,620 |
| Total | 930 (100.0%) | $24,521 |
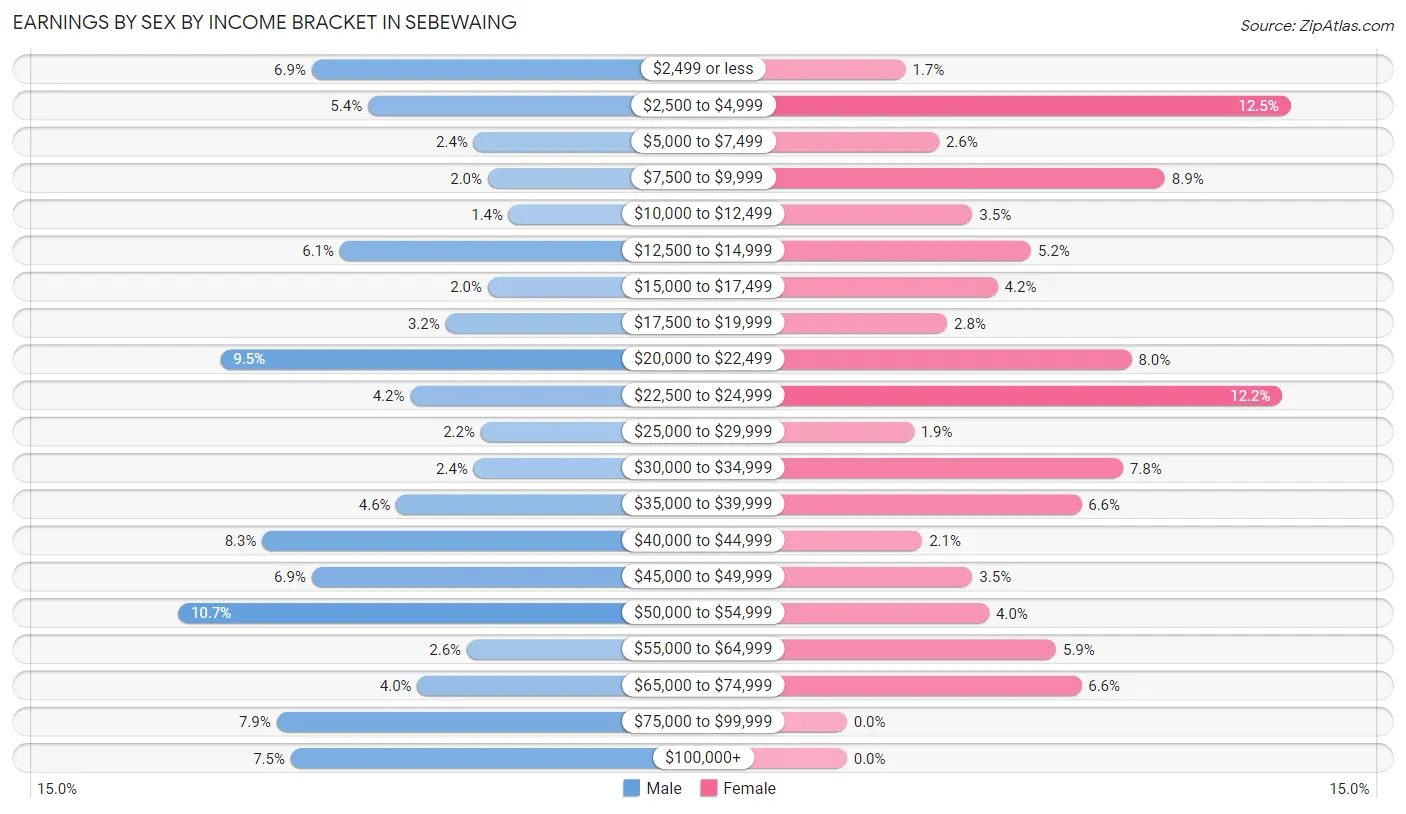
Earnings by Sex by Income Bracket in Sebewaing
The most common earnings brackets in Sebewaing are $50,000 to $54,999 for men (54 | 10.7%) and $2,500 to $4,999 for women (53 | 12.5%).
| Income | Male | Female |
| $2,499 or less | 35 (6.9%) | 7 (1.7%) |
| $2,500 to $4,999 | 27 (5.3%) | 53 (12.5%) |
| $5,000 to $7,499 | 12 (2.4%) | 11 (2.6%) |
| $7,500 to $9,999 | 10 (2.0%) | 38 (8.9%) |
| $10,000 to $12,499 | 7 (1.4%) | 15 (3.5%) |
| $12,500 to $14,999 | 31 (6.1%) | 22 (5.2%) |
| $15,000 to $17,499 | 10 (2.0%) | 18 (4.2%) |
| $17,500 to $19,999 | 16 (3.2%) | 12 (2.8%) |
| $20,000 to $22,499 | 48 (9.5%) | 34 (8.0%) |
| $22,500 to $24,999 | 21 (4.2%) | 52 (12.2%) |
| $25,000 to $29,999 | 11 (2.2%) | 8 (1.9%) |
| $30,000 to $34,999 | 12 (2.4%) | 33 (7.8%) |
| $35,000 to $39,999 | 23 (4.5%) | 28 (6.6%) |
| $40,000 to $44,999 | 42 (8.3%) | 9 (2.1%) |
| $45,000 to $49,999 | 35 (6.9%) | 15 (3.5%) |
| $50,000 to $54,999 | 54 (10.7%) | 17 (4.0%) |
| $55,000 to $64,999 | 13 (2.6%) | 25 (5.9%) |
| $65,000 to $74,999 | 20 (4.0%) | 28 (6.6%) |
| $75,000 to $99,999 | 40 (7.9%) | 0 (0.0%) |
| $100,000+ | 38 (7.5%) | 0 (0.0%) |
| Total | 505 (100.0%) | 425 (100.0%) |
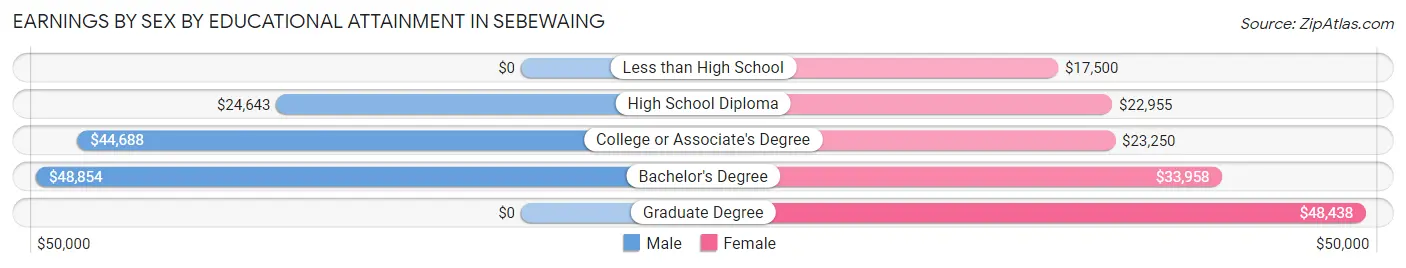
Earnings by Sex by Educational Attainment in Sebewaing
Average earnings in Sebewaing are $41,136 for men and $23,317 for women, a difference of 43.3%. Men with an educational attainment of bachelor's degree enjoy the highest average annual earnings of $48,854, while those with high school diploma education earn the least with $24,643. Women with an educational attainment of graduate degree earn the most with the average annual earnings of $48,438, while those with less than high school education have the smallest earnings of $17,500.
| Educational Attainment | Male Income | Female Income |
| Less than High School | - | - |
| High School Diploma | $24,643 | $22,955 |
| College or Associate's Degree | $44,688 | $23,250 |
| Bachelor's Degree | $48,854 | $33,958 |
| Graduate Degree | - | - |
| Total | $41,136 | $23,317 |
Family Income in Sebewaing
Family Income Brackets in Sebewaing
According to the Sebewaing family income data, there are 145 families falling into the $50,000 to $74,999 income range, which is the most common income bracket and makes up 31.6% of all families.
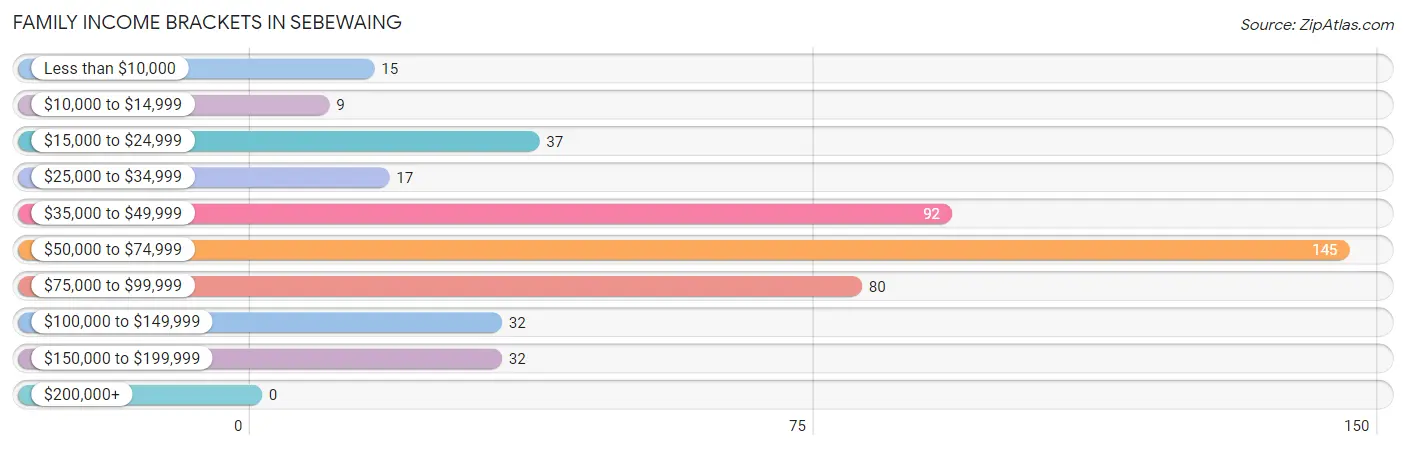
| Income Bracket | # Families | % Families |
| Less than $10,000 | 15 | 3.3% |
| $10,000 to $14,999 | 9 | 2.0% |
| $15,000 to $24,999 | 37 | 8.1% |
| $25,000 to $34,999 | 17 | 3.7% |
| $35,000 to $49,999 | 92 | 20.0% |
| $50,000 to $74,999 | 145 | 31.6% |
| $75,000 to $99,999 | 80 | 17.4% |
| $100,000 to $149,999 | 32 | 7.0% |
| $150,000 to $199,999 | 32 | 7.0% |
| $200,000+ | 0 | 0.0% |
Family Income by Famaliy Size in Sebewaing
5-person families (51 | 11.1%) account for the highest median family income in Sebewaing with $82,768 per family, while 2-person families (248 | 54.0%) have the highest median income of $26,574 per family member.
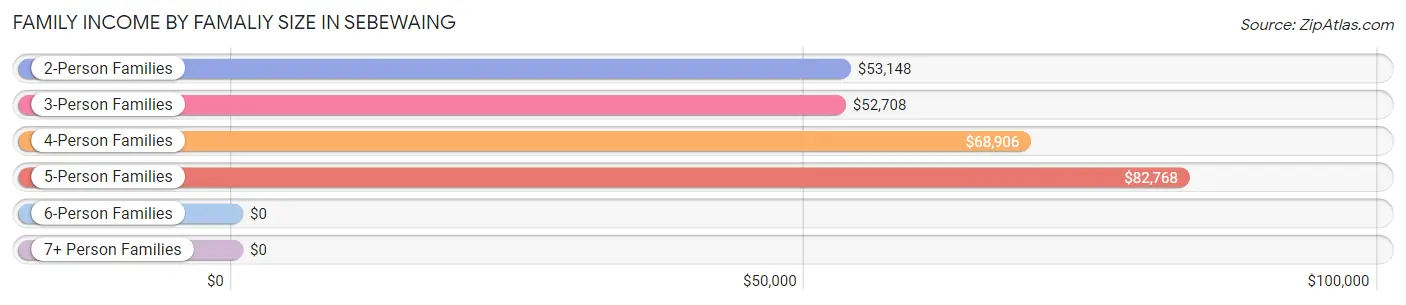
| Income Bracket | # Families | Median Income |
| 2-Person Families | 248 (54.0%) | $53,148 |
| 3-Person Families | 99 (21.6%) | $52,708 |
| 4-Person Families | 61 (13.3%) | $68,906 |
| 5-Person Families | 51 (11.1%) | $82,768 |
| 6-Person Families | 0 (0.0%) | $0 |
| 7+ Person Families | 0 (0.0%) | $0 |
| Total | 459 (100.0%) | $56,477 |
Family Income by Number of Earners in Sebewaing
The median family income in Sebewaing is $56,477, with families comprising 3+ earners (50) having the highest median family income of $75,333, while families with no earners (78) have the lowest median family income of $44,205, accounting for 10.9% and 17.0% of families, respectively.
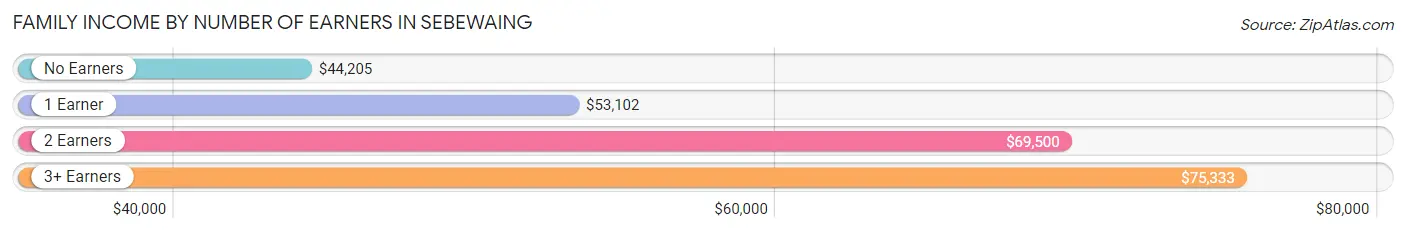
| Number of Earners | # Families | Median Income |
| No Earners | 78 (17.0%) | $44,205 |
| 1 Earner | 179 (39.0%) | $53,102 |
| 2 Earners | 152 (33.1%) | $69,500 |
| 3+ Earners | 50 (10.9%) | $75,333 |
| Total | 459 (100.0%) | $56,477 |
Household Income in Sebewaing
Household Income Brackets in Sebewaing
With 201 households falling in the category, the $35,000 to $49,999 income range is the most frequent in Sebewaing, accounting for 21.9% of all households. In contrast, only 11 households (1.2%) fall into the $200,000+ income bracket, making it the least populous group.
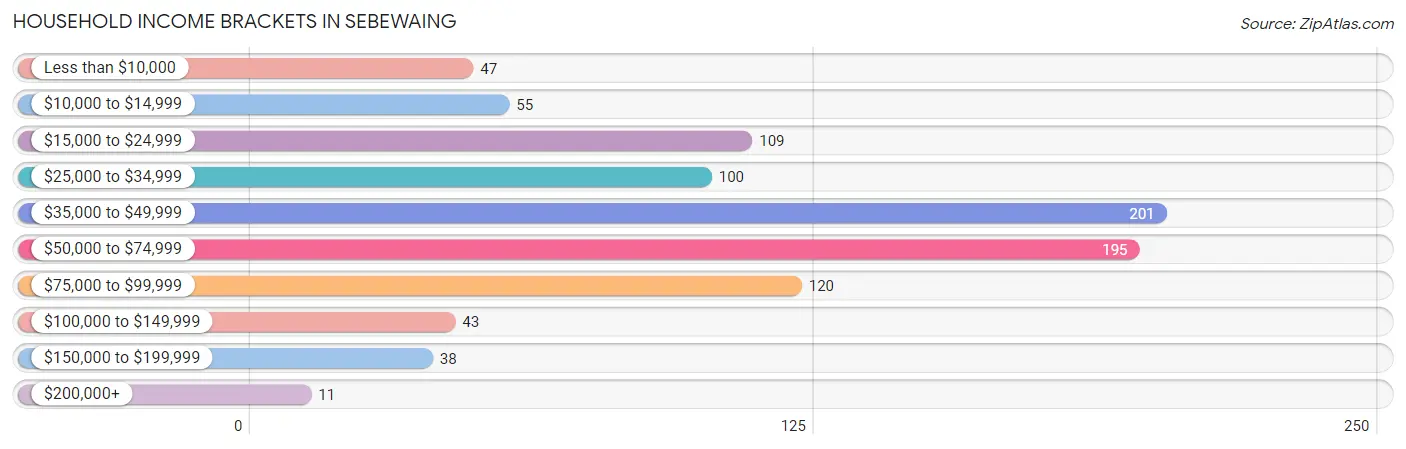
| Income Bracket | # Households | % Households |
| Less than $10,000 | 47 | 5.1% |
| $10,000 to $14,999 | 55 | 6.0% |
| $15,000 to $24,999 | 109 | 11.9% |
| $25,000 to $34,999 | 100 | 10.9% |
| $35,000 to $49,999 | 201 | 21.9% |
| $50,000 to $74,999 | 195 | 21.2% |
| $75,000 to $99,999 | 120 | 13.1% |
| $100,000 to $149,999 | 43 | 4.7% |
| $150,000 to $199,999 | 38 | 4.1% |
| $200,000+ | 11 | 1.2% |
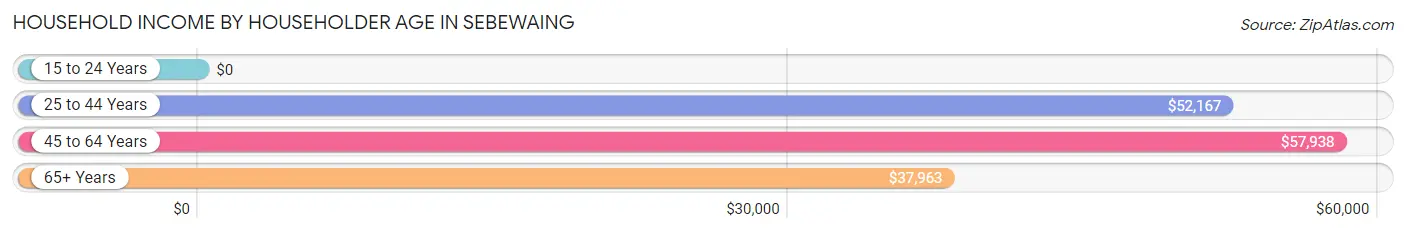
Household Income by Householder Age in Sebewaing
The median household income in Sebewaing is $44,441, with the highest median household income of $57,938 found in the 45 to 64 years age bracket for the primary householder. A total of 313 households (34.1%) fall into this category. Meanwhile, the 15 to 24 years age bracket for the primary householder has the lowest median household income of $0, with 12 households (1.3%) in this group.
| Income Bracket | # Households | Median Income |
| 15 to 24 Years | 12 (1.3%) | $0 |
| 25 to 44 Years | 222 (24.2%) | $52,167 |
| 45 to 64 Years | 313 (34.1%) | $57,938 |
| 65+ Years | 372 (40.5%) | $37,963 |
| Total | 919 (100.0%) | $44,441 |
Poverty in Sebewaing
Income Below Poverty by Sex and Age in Sebewaing
With 10.9% poverty level for males and 19.8% for females among the residents of Sebewaing, 5 year old males and 16 and 17 year old females are the most vulnerable to poverty, with 4 males (40.0%) and 15 females (100.0%) in their respective age groups living below the poverty level.
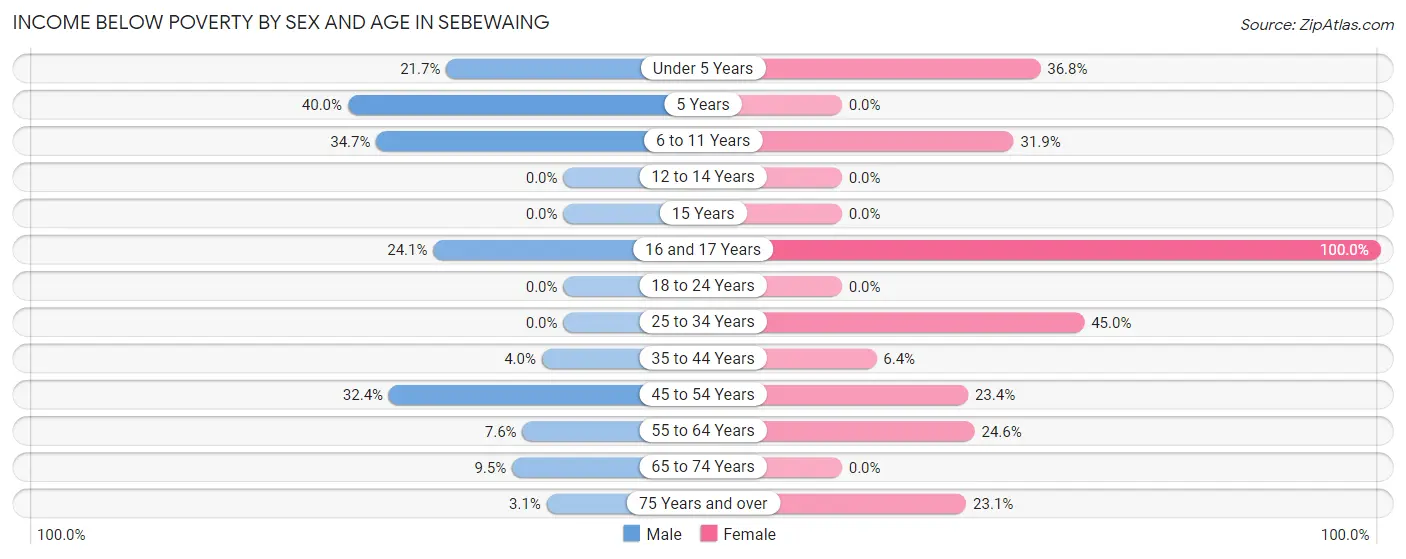
| Age Bracket | Male | Female |
| Under 5 Years | 5 (21.7%) | 7 (36.8%) |
| 5 Years | 4 (40.0%) | 0 (0.0%) |
| 6 to 11 Years | 25 (34.7%) | 22 (31.9%) |
| 12 to 14 Years | 0 (0.0%) | 0 (0.0%) |
| 15 Years | 0 (0.0%) | 0 (0.0%) |
| 16 and 17 Years | 7 (24.1%) | 15 (100.0%) |
| 18 to 24 Years | 0 (0.0%) | 0 (0.0%) |
| 25 to 34 Years | 0 (0.0%) | 27 (45.0%) |
| 35 to 44 Years | 5 (4.0%) | 7 (6.4%) |
| 45 to 54 Years | 34 (32.4%) | 26 (23.4%) |
| 55 to 64 Years | 12 (7.6%) | 52 (24.6%) |
| 65 to 74 Years | 10 (9.5%) | 0 (0.0%) |
| 75 Years and over | 3 (3.1%) | 39 (23.1%) |
| Total | 105 (10.9%) | 195 (19.8%) |
Income Above Poverty by Sex and Age in Sebewaing
According to the poverty statistics in Sebewaing, males aged 12 to 14 years and females aged 12 to 14 years are the age groups that are most secure financially, with 100.0% of males and 100.0% of females in these age groups living above the poverty line.
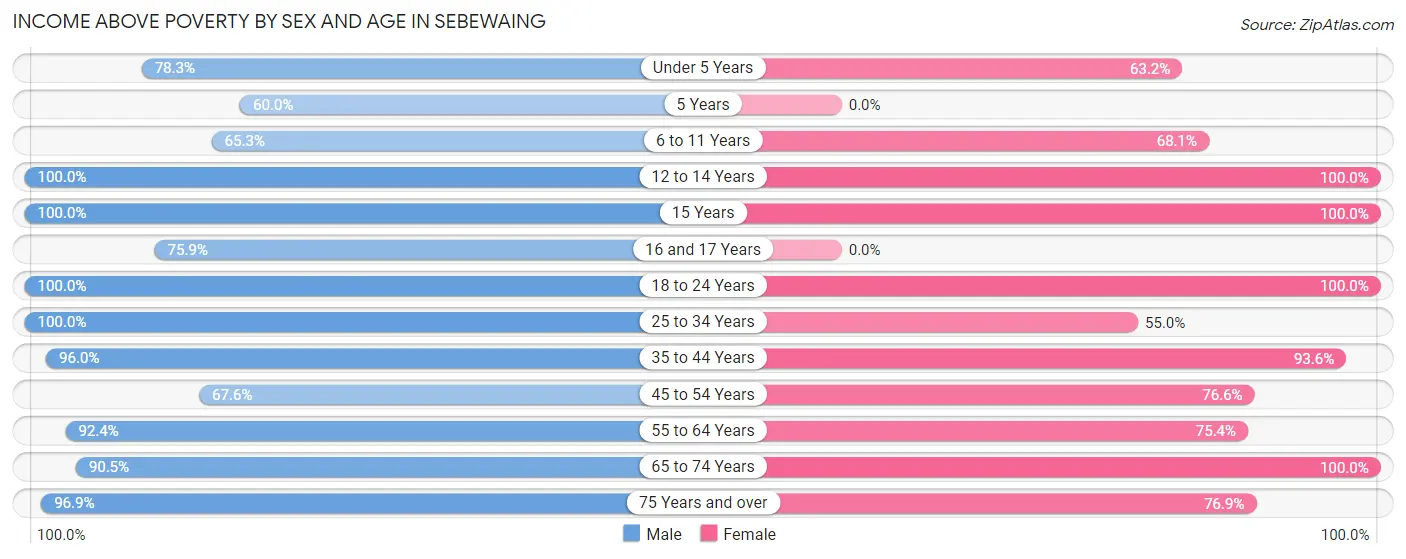
| Age Bracket | Male | Female |
| Under 5 Years | 18 (78.3%) | 12 (63.2%) |
| 5 Years | 6 (60.0%) | 0 (0.0%) |
| 6 to 11 Years | 47 (65.3%) | 47 (68.1%) |
| 12 to 14 Years | 68 (100.0%) | 33 (100.0%) |
| 15 Years | 15 (100.0%) | 19 (100.0%) |
| 16 and 17 Years | 22 (75.9%) | 0 (0.0%) |
| 18 to 24 Years | 59 (100.0%) | 43 (100.0%) |
| 25 to 34 Years | 94 (100.0%) | 33 (55.0%) |
| 35 to 44 Years | 120 (96.0%) | 102 (93.6%) |
| 45 to 54 Years | 71 (67.6%) | 85 (76.6%) |
| 55 to 64 Years | 146 (92.4%) | 159 (75.4%) |
| 65 to 74 Years | 95 (90.5%) | 126 (100.0%) |
| 75 Years and over | 94 (96.9%) | 130 (76.9%) |
| Total | 855 (89.1%) | 789 (80.2%) |
Income Below Poverty Among Married-Couple Families in Sebewaing
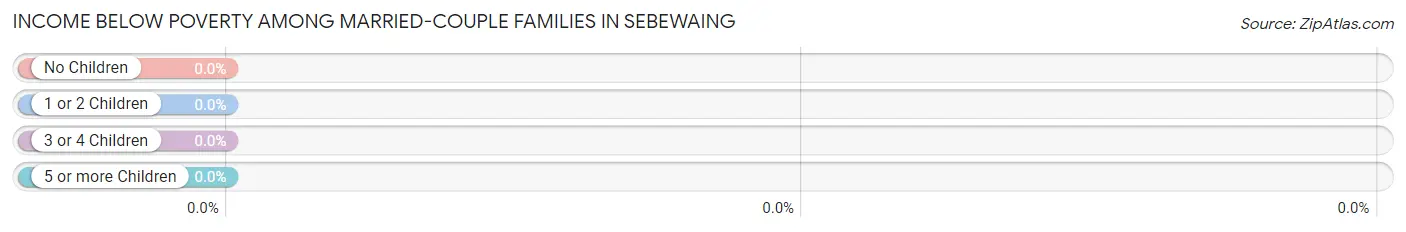
| Children | Above Poverty | Below Poverty |
| No Children | 234 (100.0%) | 0 (0.0%) |
| 1 or 2 Children | 57 (100.0%) | 0 (0.0%) |
| 3 or 4 Children | 51 (100.0%) | 0 (0.0%) |
| 5 or more Children | 0 (0.0%) | 0 (0.0%) |
| Total | 342 (100.0%) | 0 (0.0%) |
Income Below Poverty Among Single-Parent Households in Sebewaing
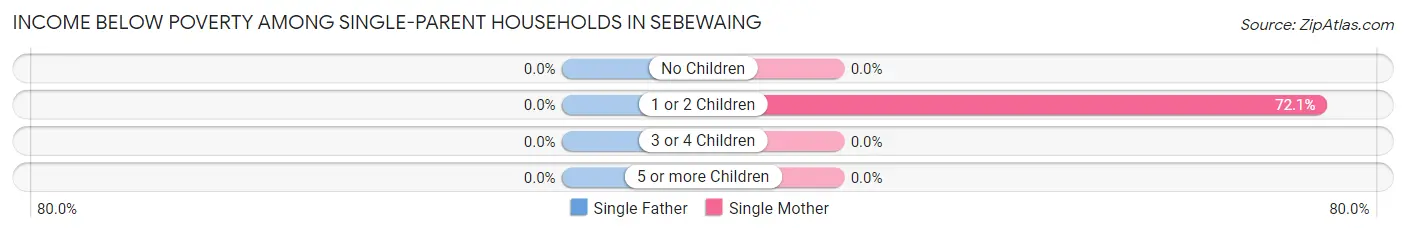
| Children | Single Father | Single Mother |
| No Children | 0 (0.0%) | 0 (0.0%) |
| 1 or 2 Children | 0 (0.0%) | 49 (72.1%) |
| 3 or 4 Children | 0 (0.0%) | 0 (0.0%) |
| 5 or more Children | 0 (0.0%) | 0 (0.0%) |
| Total | 0 (0.0%) | 49 (41.9%) |
Income Below Poverty Among Married-Couple vs Single-Parent Households in Sebewaing
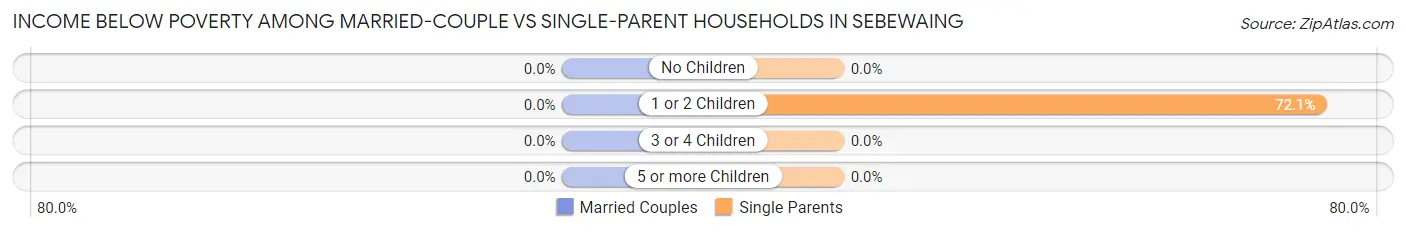
| Children | Married-Couple Families | Single-Parent Households |
| No Children | 0 (0.0%) | 0 (0.0%) |
| 1 or 2 Children | 0 (0.0%) | 49 (72.1%) |
| 3 or 4 Children | 0 (0.0%) | 0 (0.0%) |
| 5 or more Children | 0 (0.0%) | 0 (0.0%) |
| Total | 0 (0.0%) | 49 (41.9%) |
Race in Sebewaing
The most populous races in Sebewaing are White / Caucasian (1,825 | 93.5%), Hispanic or Latino (85 | 4.4%), and Two or more Races (69 | 3.5%).
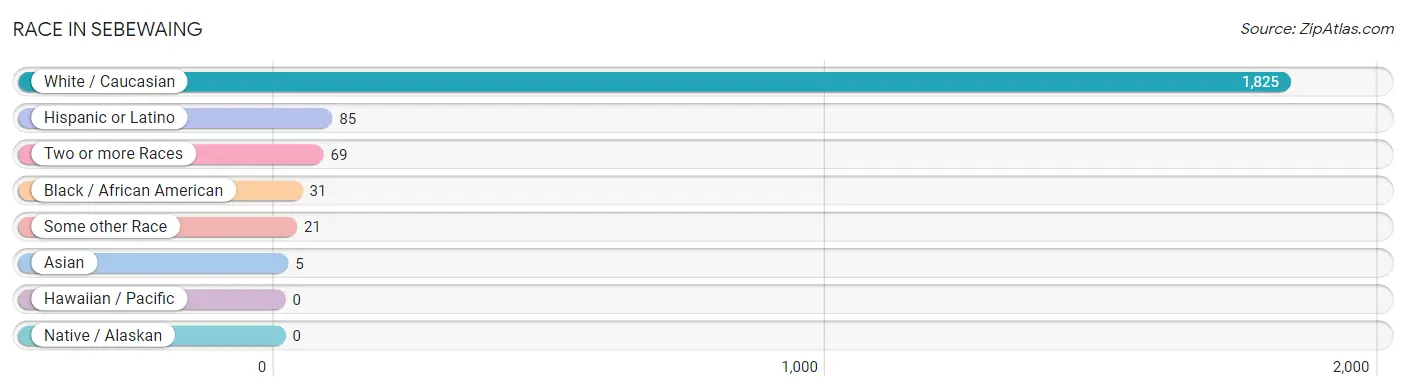
| Race | # Population | % Population |
| Asian | 5 | 0.3% |
| Black / African American | 31 | 1.6% |
| Hawaiian / Pacific | 0 | 0.0% |
| Hispanic or Latino | 85 | 4.4% |
| Native / Alaskan | 0 | 0.0% |
| White / Caucasian | 1,825 | 93.5% |
| Two or more Races | 69 | 3.5% |
| Some other Race | 21 | 1.1% |
| Total | 1,951 | 100.0% |
Ancestry in Sebewaing
The most populous ancestries reported in Sebewaing are German (863 | 44.2%), English (119 | 6.1%), Polish (105 | 5.4%), Russian (104 | 5.3%), and Irish (99 | 5.1%), together accounting for 66.1% of all Sebewaing residents.
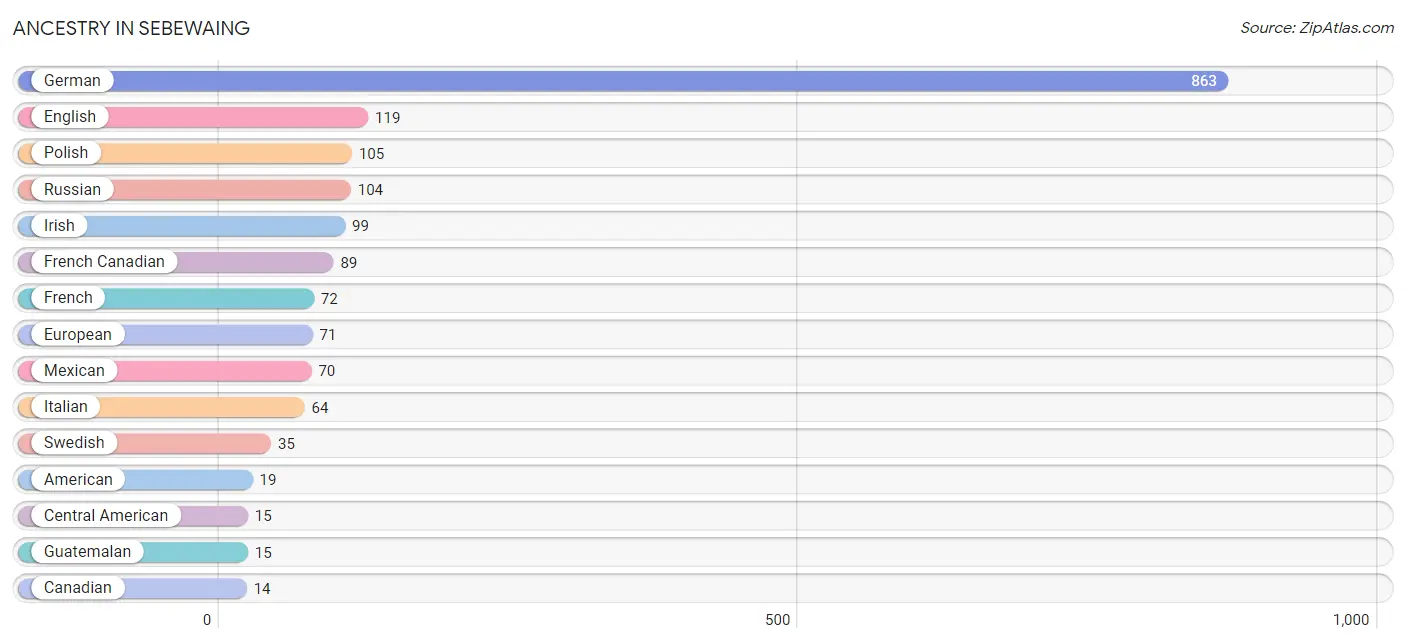
| Ancestry | # Population | % Population |
| American | 19 | 1.0% |
| Canadian | 14 | 0.7% |
| Central American | 15 | 0.8% |
| Chippewa | 5 | 0.3% |
| Croatian | 5 | 0.3% |
| Danish | 11 | 0.6% |
| Dutch | 11 | 0.6% |
| English | 119 | 6.1% |
| European | 71 | 3.6% |
| Finnish | 6 | 0.3% |
| French | 72 | 3.7% |
| French Canadian | 89 | 4.6% |
| German | 863 | 44.2% |
| Guatemalan | 15 | 0.8% |
| Irish | 99 | 5.1% |
| Italian | 64 | 3.3% |
| Mexican | 70 | 3.6% |
| Norwegian | 14 | 0.7% |
| Pakistani | 5 | 0.3% |
| Polish | 105 | 5.4% |
| Russian | 104 | 5.3% |
| Scotch-Irish | 6 | 0.3% |
| Scottish | 12 | 0.6% |
| Swedish | 35 | 1.8% |
| Ukrainian | 10 | 0.5% | View All 25 Rows |
Immigrants in Sebewaing
The most numerous immigrant groups reported in Sebewaing came from Central America (15 | 0.8%), Guatemala (15 | 0.8%), Latin America (15 | 0.8%), Asia (5 | 0.3%), and South Eastern Asia (5 | 0.3%), together accounting for 2.8% of all Sebewaing residents.
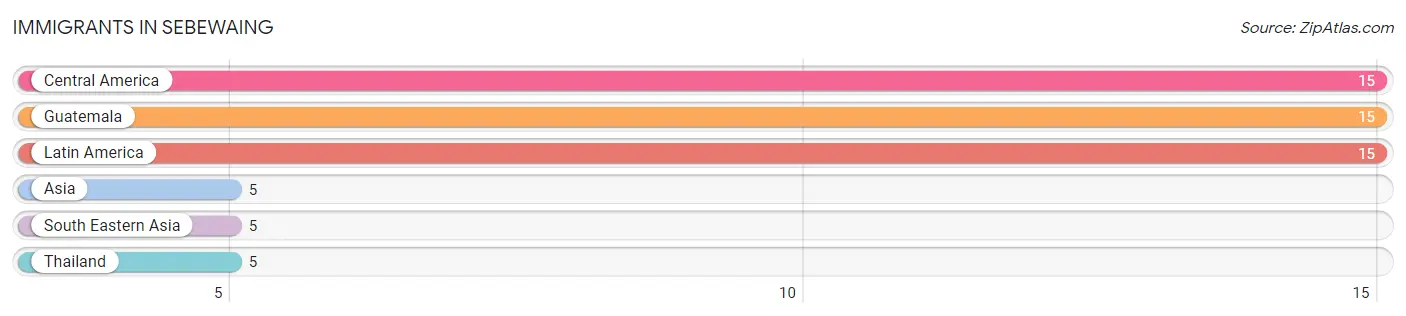
| Immigration Origin | # Population | % Population |
| Asia | 5 | 0.3% |
| Central America | 15 | 0.8% |
| Guatemala | 15 | 0.8% |
| Latin America | 15 | 0.8% |
| South Eastern Asia | 5 | 0.3% |
| Thailand | 5 | 0.3% | View All 6 Rows |
Sex and Age in Sebewaing
Sex and Age in Sebewaing
The most populous age groups in Sebewaing are 10 to 14 Years (114 | 11.9%) for men and 60 to 64 Years (152 | 15.3%) for women.
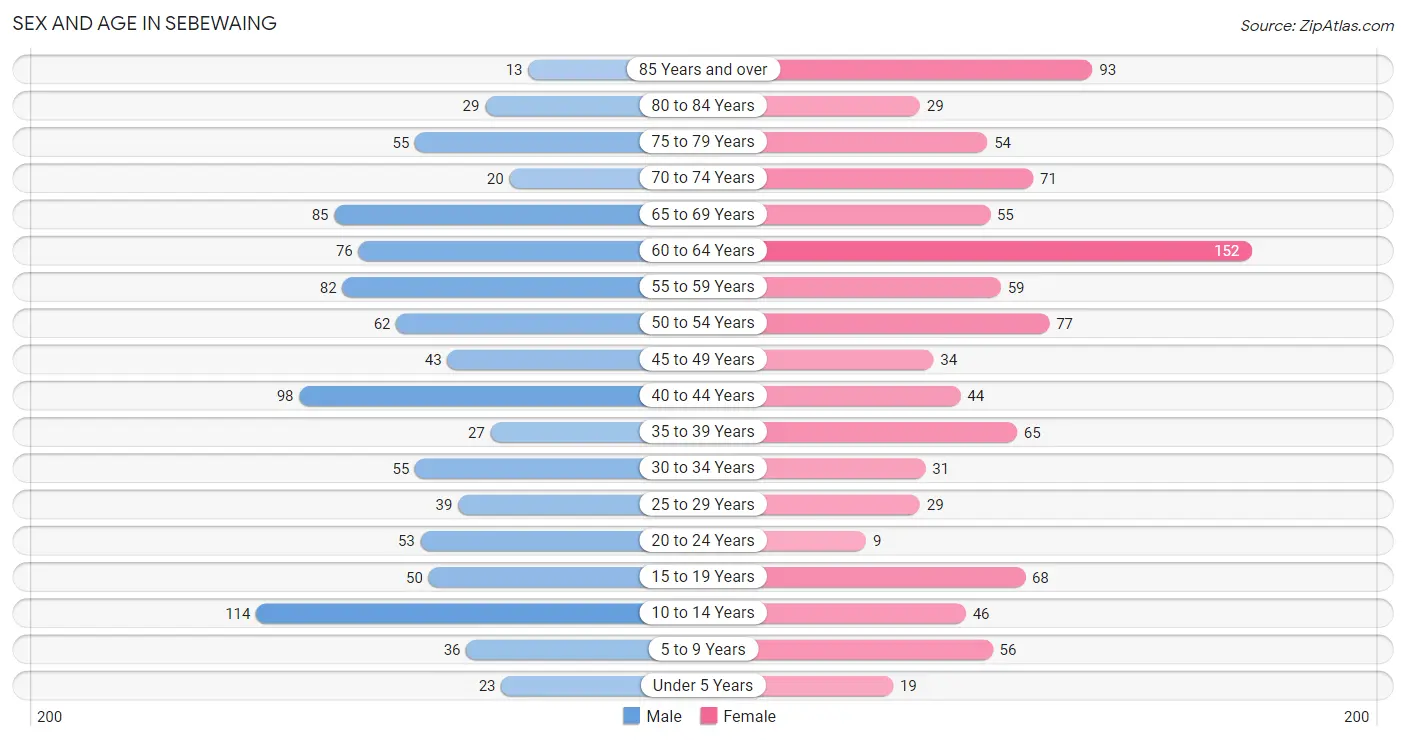
| Age Bracket | Male | Female |
| Under 5 Years | 23 (2.4%) | 19 (1.9%) |
| 5 to 9 Years | 36 (3.7%) | 56 (5.7%) |
| 10 to 14 Years | 114 (11.9%) | 46 (4.6%) |
| 15 to 19 Years | 50 (5.2%) | 68 (6.9%) |
| 20 to 24 Years | 53 (5.5%) | 9 (0.9%) |
| 25 to 29 Years | 39 (4.1%) | 29 (2.9%) |
| 30 to 34 Years | 55 (5.7%) | 31 (3.1%) |
| 35 to 39 Years | 27 (2.8%) | 65 (6.6%) |
| 40 to 44 Years | 98 (10.2%) | 44 (4.4%) |
| 45 to 49 Years | 43 (4.5%) | 34 (3.4%) |
| 50 to 54 Years | 62 (6.5%) | 77 (7.8%) |
| 55 to 59 Years | 82 (8.5%) | 59 (5.9%) |
| 60 to 64 Years | 76 (7.9%) | 152 (15.3%) |
| 65 to 69 Years | 85 (8.8%) | 55 (5.6%) |
| 70 to 74 Years | 20 (2.1%) | 71 (7.2%) |
| 75 to 79 Years | 55 (5.7%) | 54 (5.4%) |
| 80 to 84 Years | 29 (3.0%) | 29 (2.9%) |
| 85 Years and over | 13 (1.3%) | 93 (9.4%) |
| Total | 960 (100.0%) | 991 (100.0%) |
Families and Households in Sebewaing
Median Family Size in Sebewaing
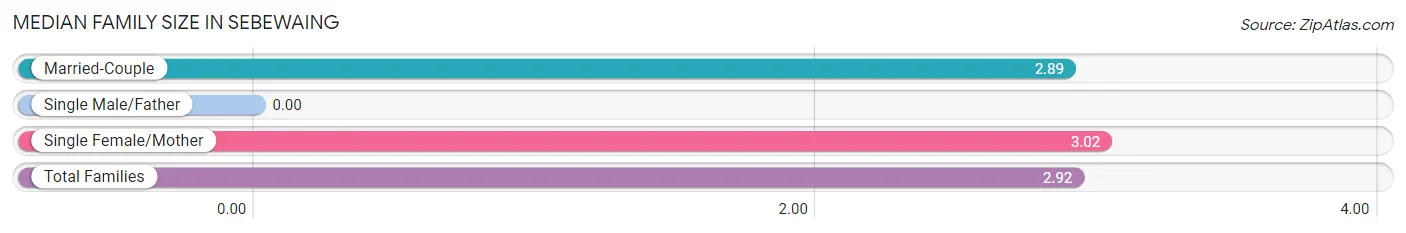
| Family Type | # Families | Family Size |
| Married-Couple | 342 (74.5%) | 2.89 |
| Single Male/Father | 0 (0.0%) | - |
| Single Female/Mother | 117 (25.5%) | 3.02 |
| Total Families | 459 (100.0%) | 2.92 |
Median Household Size in Sebewaing
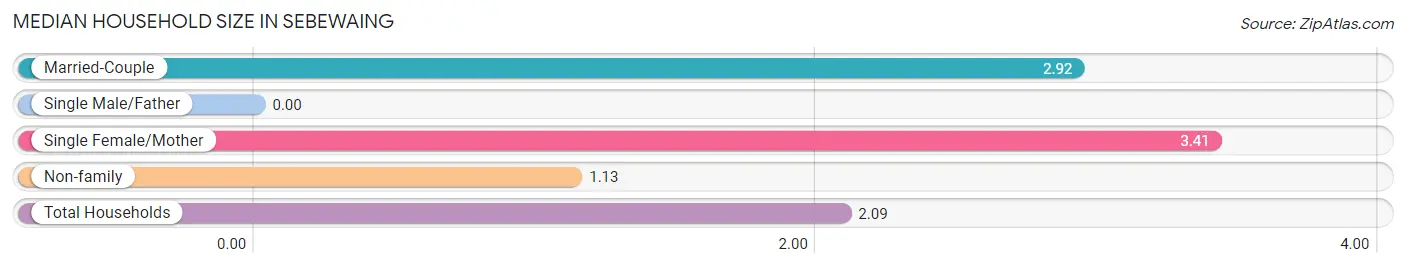
| Household Type | # Households | Household Size |
| Married-Couple | 342 (37.2%) | 2.92 |
| Single Male/Father | 0 (0.0%) | - |
| Single Female/Mother | 117 (12.7%) | 3.41 |
| Non-family | 460 (50.0%) | 1.13 |
| Total Households | 919 (100.0%) | 2.09 |
Household Size by Marriage Status in Sebewaing
Out of a total of 919 households in Sebewaing, 459 (49.9%) are family households, while 460 (50.0%) are nonfamily households. The most numerous type of family households are 2-person households, comprising 243, and the most common type of nonfamily households are 1-person households, comprising 420.
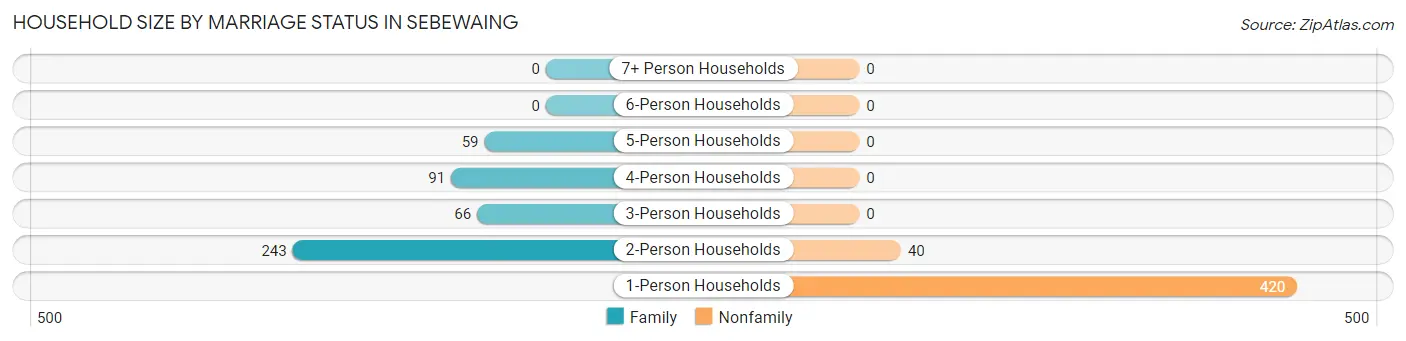
| Household Size | Family Households | Nonfamily Households |
| 1-Person Households | - | 420 (45.7%) |
| 2-Person Households | 243 (26.4%) | 40 (4.3%) |
| 3-Person Households | 66 (7.2%) | 0 (0.0%) |
| 4-Person Households | 91 (9.9%) | 0 (0.0%) |
| 5-Person Households | 59 (6.4%) | 0 (0.0%) |
| 6-Person Households | 0 (0.0%) | 0 (0.0%) |
| 7+ Person Households | 0 (0.0%) | 0 (0.0%) |
| Total | 459 (49.9%) | 460 (50.0%) |
Female Fertility in Sebewaing
Fertility by Age in Sebewaing
| Age Bracket | Women with Births | Births / 1,000 Women |
| 15 to 19 years | 0 (0.0%) | 0.0 |
| 20 to 34 years | 0 (0.0%) | 0.0 |
| 35 to 50 years | 0 (0.0%) | 0.0 |
| Total | 0 (0.0%) | 0.0 |
Fertility by Age by Marriage Status in Sebewaing
| Age Bracket | Married | Unmarried |
| 15 to 19 years | 0 (0.0%) | 0 (0.0%) |
| 20 to 34 years | 0 (0.0%) | 0 (0.0%) |
| 35 to 50 years | 0 (0.0%) | 0 (0.0%) |
| Total | 0 (0.0%) | 0 (0.0%) |
Fertility by Education in Sebewaing
| Educational Attainment | Women with Births | Births / 1,000 Women |
| Less than High School | 0 (0.0%) | 0.0 |
| High School Diploma | 0 (0.0%) | 0.0 |
| College or Associate's Degree | 0 (0.0%) | 0.0 |
| Bachelor's Degree | 0 (0.0%) | 0.0 |
| Graduate Degree | 0 (0.0%) | 0.0 |
| Total | 0 (0.0%) | 0.0 |
Fertility by Education by Marriage Status in Sebewaing
| Educational Attainment | Married | Unmarried |
| Less than High School | 0 (0.0%) | 0 (0.0%) |
| High School Diploma | 0 (0.0%) | 0 (0.0%) |
| College or Associate's Degree | 0 (0.0%) | 0 (0.0%) |
| Bachelor's Degree | 0 (0.0%) | 0 (0.0%) |
| Graduate Degree | 0 (0.0%) | 0 (0.0%) |
| Total | 0 (0.0%) | 0 (0.0%) |
Employment Characteristics in Sebewaing
Employment by Class of Employer in Sebewaing
Among the 785 employed individuals in Sebewaing, private company employees (578 | 73.6%), not-for-profit organizations (97 | 12.4%), and local government employees (49 | 6.2%) make up the most common classes of employment.
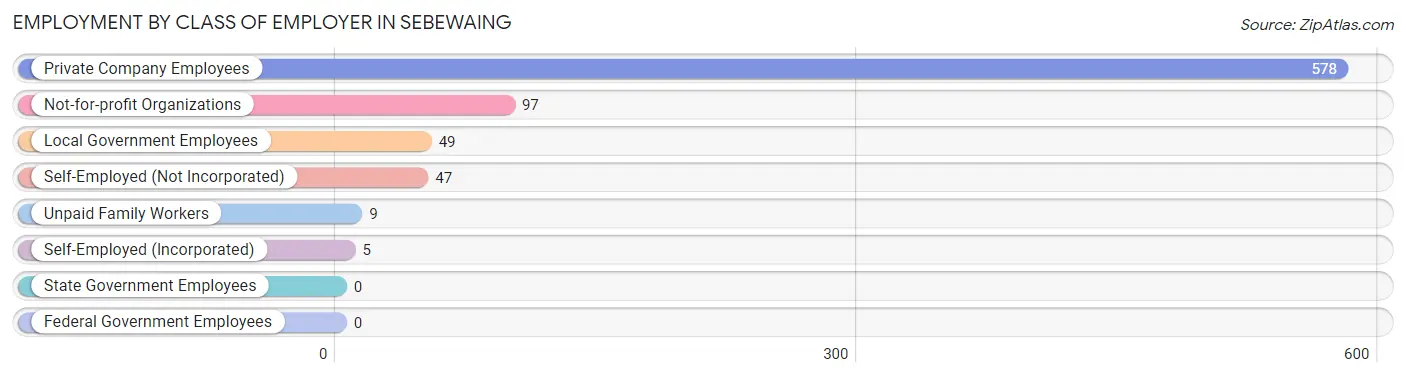
| Employer Class | # Employees | % Employees |
| Private Company Employees | 578 | 73.6% |
| Self-Employed (Incorporated) | 5 | 0.6% |
| Self-Employed (Not Incorporated) | 47 | 6.0% |
| Not-for-profit Organizations | 97 | 12.4% |
| Local Government Employees | 49 | 6.2% |
| State Government Employees | 0 | 0.0% |
| Federal Government Employees | 0 | 0.0% |
| Unpaid Family Workers | 9 | 1.1% |
| Total | 785 | 100.0% |
Employment Status by Age in Sebewaing
According to the labor force statistics for Sebewaing, out of the total population over 16 years of age (1,623), 53.6% or 870 individuals are in the labor force, with 8.6% or 75 of them unemployed. The age group with the highest labor force participation rate is 25 to 29 years, with 100.0% or 68 individuals in the labor force. Within the labor force, the 25 to 29 years age range has the highest percentage of unemployed individuals, with 20.6% or 14 of them being unemployed.
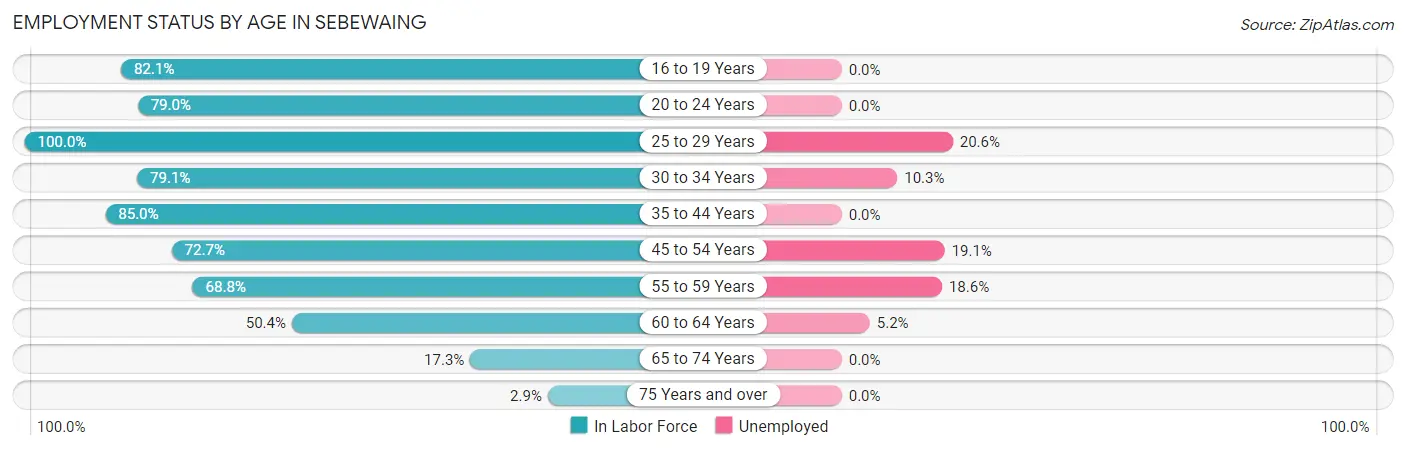
| Age Bracket | In Labor Force | Unemployed |
| 16 to 19 Years | 69 (82.1%) | 0 (0.0%) |
| 20 to 24 Years | 49 (79.0%) | 0 (0.0%) |
| 25 to 29 Years | 68 (100.0%) | 14 (20.6%) |
| 30 to 34 Years | 68 (79.1%) | 7 (10.3%) |
| 35 to 44 Years | 199 (85.0%) | 0 (0.0%) |
| 45 to 54 Years | 157 (72.7%) | 30 (19.1%) |
| 55 to 59 Years | 97 (68.8%) | 18 (18.6%) |
| 60 to 64 Years | 115 (50.4%) | 6 (5.2%) |
| 65 to 74 Years | 40 (17.3%) | 0 (0.0%) |
| 75 Years and over | 8 (2.9%) | 0 (0.0%) |
| Total | 870 (53.6%) | 75 (8.6%) |
Employment Status by Educational Attainment in Sebewaing
According to labor force statistics for Sebewaing, 72.4% of individuals (704) out of the total population between 25 and 64 years of age (973) are in the labor force, with 10.7% or 75 of them being unemployed. The group with the highest labor force participation rate are those with the educational attainment of bachelor's degree or higher, with 82.1% or 124 individuals in the labor force. Within the labor force, individuals with high school diploma education have the highest percentage of unemployment, with 24.9% or 68 of them being unemployed.
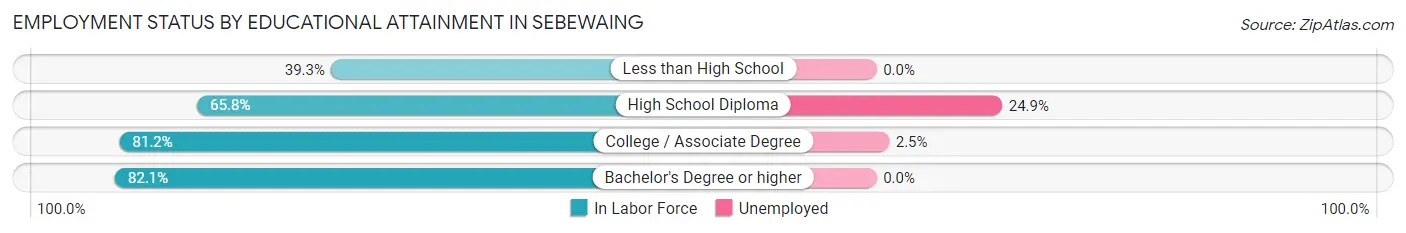
| Educational Attainment | In Labor Force | Unemployed |
| Less than High School | 22 (39.3%) | 0 (0.0%) |
| High School Diploma | 273 (65.8%) | 103 (24.9%) |
| College / Associate Degree | 285 (81.2%) | 9 (2.5%) |
| Bachelor's Degree or higher | 124 (82.1%) | 0 (0.0%) |
| Total | 704 (72.4%) | 104 (10.7%) |
Employment Occupations by Sex in Sebewaing
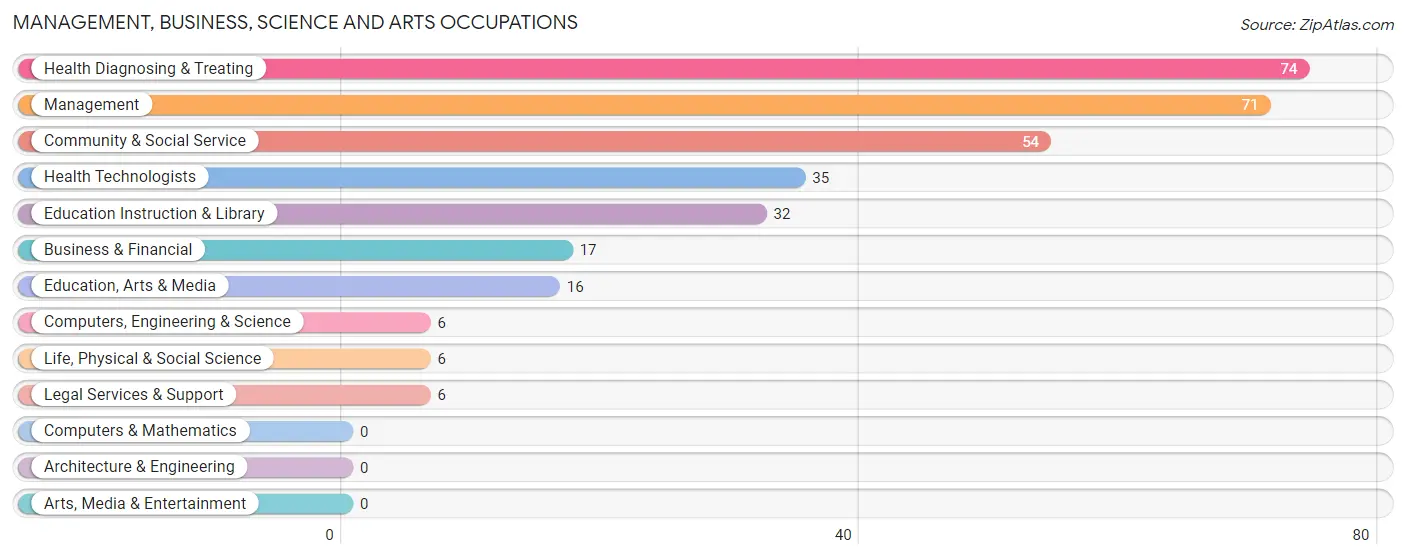
Management, Business, Science and Arts Occupations
The most common Management, Business, Science and Arts occupations in Sebewaing are Health Diagnosing & Treating (74 | 9.3%), Management (71 | 8.9%), Community & Social Service (54 | 6.8%), Health Technologists (35 | 4.4%), and Education Instruction & Library (32 | 4.0%).
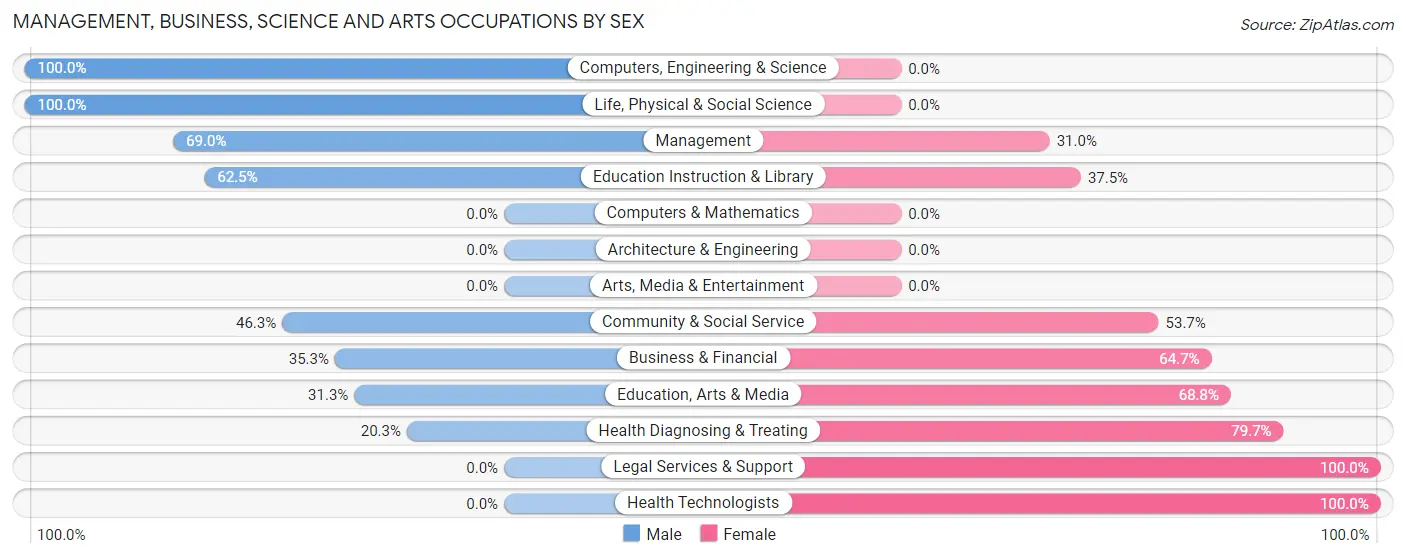
Management, Business, Science and Arts Occupations by Sex
Within the Management, Business, Science and Arts occupations in Sebewaing, the most male-oriented occupations are Computers, Engineering & Science (100.0%), Life, Physical & Social Science (100.0%), and Management (69.0%), while the most female-oriented occupations are Legal Services & Support (100.0%), Health Technologists (100.0%), and Health Diagnosing & Treating (79.7%).
| Occupation | Male | Female |
| Management | 49 (69.0%) | 22 (31.0%) |
| Business & Financial | 6 (35.3%) | 11 (64.7%) |
| Computers, Engineering & Science | 6 (100.0%) | 0 (0.0%) |
| Computers & Mathematics | 0 (0.0%) | 0 (0.0%) |
| Architecture & Engineering | 0 (0.0%) | 0 (0.0%) |
| Life, Physical & Social Science | 6 (100.0%) | 0 (0.0%) |
| Community & Social Service | 25 (46.3%) | 29 (53.7%) |
| Education, Arts & Media | 5 (31.2%) | 11 (68.8%) |
| Legal Services & Support | 0 (0.0%) | 6 (100.0%) |
| Education Instruction & Library | 20 (62.5%) | 12 (37.5%) |
| Arts, Media & Entertainment | 0 (0.0%) | 0 (0.0%) |
| Health Diagnosing & Treating | 15 (20.3%) | 59 (79.7%) |
| Health Technologists | 0 (0.0%) | 35 (100.0%) |
| Total (Category) | 101 (45.5%) | 121 (54.5%) |
| Total (Overall) | 416 (52.3%) | 379 (47.7%) |
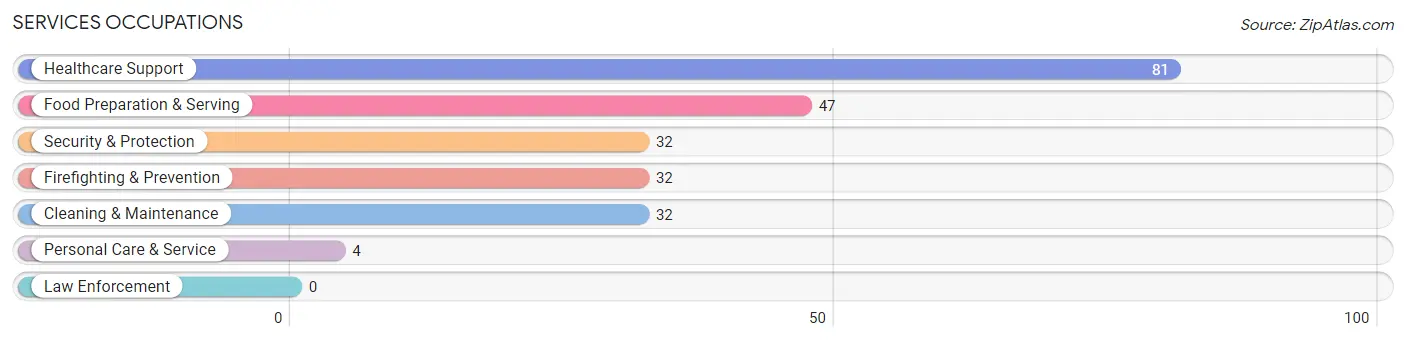
Services Occupations
The most common Services occupations in Sebewaing are Healthcare Support (81 | 10.2%), Food Preparation & Serving (47 | 5.9%), Security & Protection (32 | 4.0%), Firefighting & Prevention (32 | 4.0%), and Cleaning & Maintenance (32 | 4.0%).
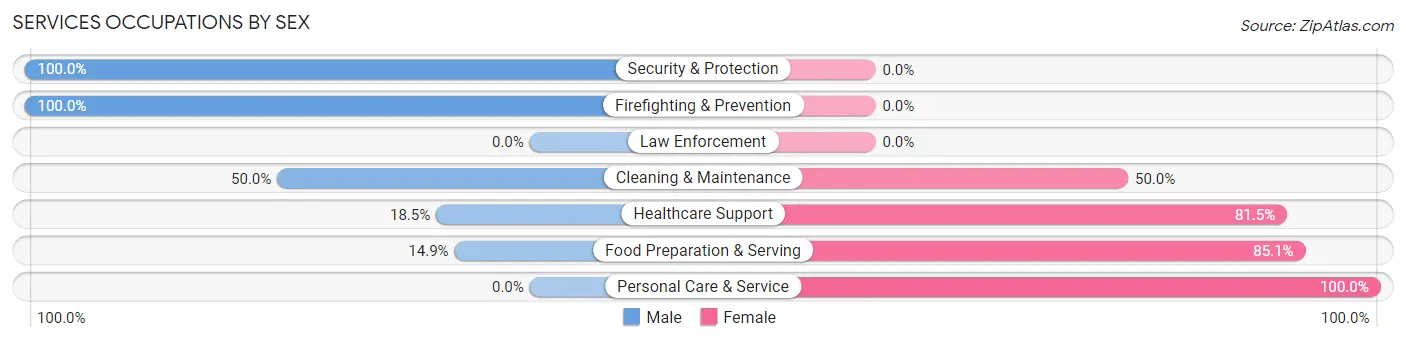
Services Occupations by Sex
Within the Services occupations in Sebewaing, the most male-oriented occupations are Security & Protection (100.0%), Firefighting & Prevention (100.0%), and Cleaning & Maintenance (50.0%), while the most female-oriented occupations are Personal Care & Service (100.0%), Food Preparation & Serving (85.1%), and Healthcare Support (81.5%).
| Occupation | Male | Female |
| Healthcare Support | 15 (18.5%) | 66 (81.5%) |
| Security & Protection | 32 (100.0%) | 0 (0.0%) |
| Firefighting & Prevention | 32 (100.0%) | 0 (0.0%) |
| Law Enforcement | 0 (0.0%) | 0 (0.0%) |
| Food Preparation & Serving | 7 (14.9%) | 40 (85.1%) |
| Cleaning & Maintenance | 16 (50.0%) | 16 (50.0%) |
| Personal Care & Service | 0 (0.0%) | 4 (100.0%) |
| Total (Category) | 70 (35.7%) | 126 (64.3%) |
| Total (Overall) | 416 (52.3%) | 379 (47.7%) |
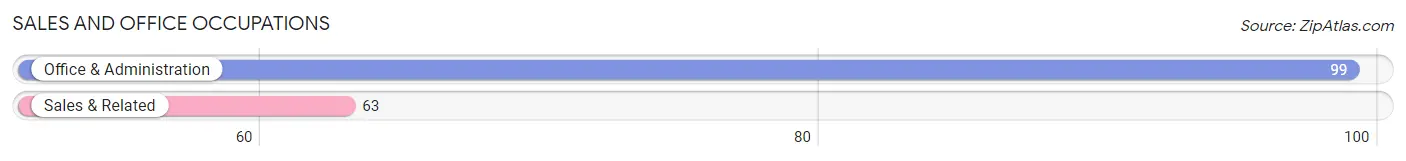
Sales and Office Occupations
The most common Sales and Office occupations in Sebewaing are Office & Administration (99 | 12.4%), and Sales & Related (63 | 7.9%).
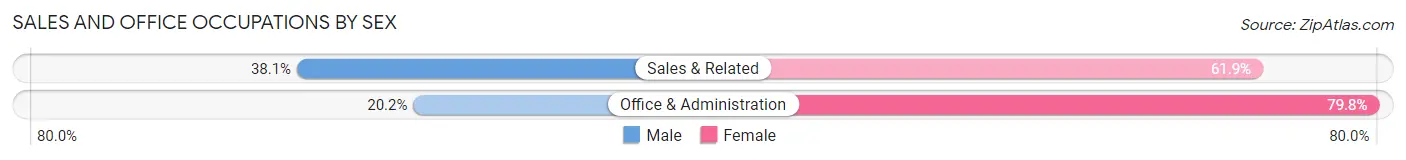
Sales and Office Occupations by Sex
| Occupation | Male | Female |
| Sales & Related | 24 (38.1%) | 39 (61.9%) |
| Office & Administration | 20 (20.2%) | 79 (79.8%) |
| Total (Category) | 44 (27.2%) | 118 (72.8%) |
| Total (Overall) | 416 (52.3%) | 379 (47.7%) |
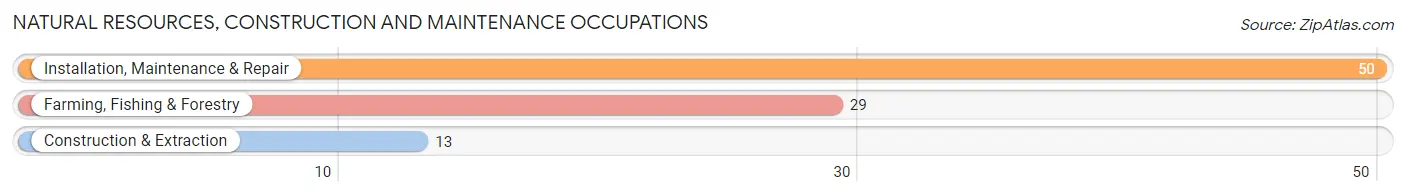
Natural Resources, Construction and Maintenance Occupations
The most common Natural Resources, Construction and Maintenance occupations in Sebewaing are Installation, Maintenance & Repair (50 | 6.3%), Farming, Fishing & Forestry (29 | 3.6%), and Construction & Extraction (13 | 1.6%).
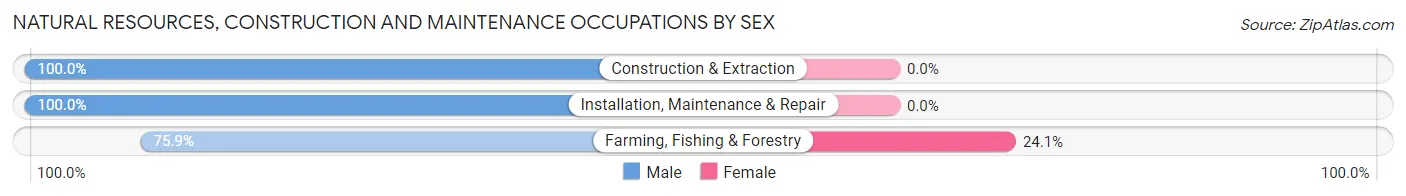
Natural Resources, Construction and Maintenance Occupations by Sex
| Occupation | Male | Female |
| Farming, Fishing & Forestry | 22 (75.9%) | 7 (24.1%) |
| Construction & Extraction | 13 (100.0%) | 0 (0.0%) |
| Installation, Maintenance & Repair | 50 (100.0%) | 0 (0.0%) |
| Total (Category) | 85 (92.4%) | 7 (7.6%) |
| Total (Overall) | 416 (52.3%) | 379 (47.7%) |
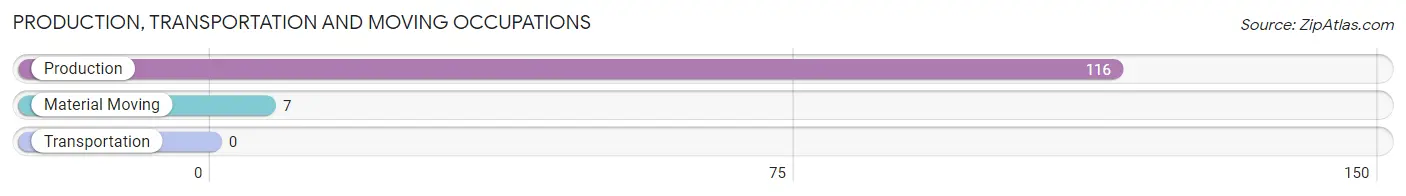
Production, Transportation and Moving Occupations
The most common Production, Transportation and Moving occupations in Sebewaing are Production (116 | 14.6%), and Material Moving (7 | 0.9%).
Production, Transportation and Moving Occupations by Sex
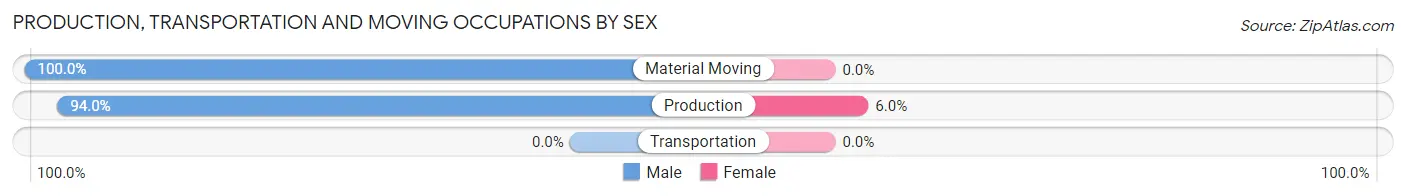
| Occupation | Male | Female |
| Production | 109 (94.0%) | 7 (6.0%) |
| Transportation | 0 (0.0%) | 0 (0.0%) |
| Material Moving | 7 (100.0%) | 0 (0.0%) |
| Total (Category) | 116 (94.3%) | 7 (5.7%) |
| Total (Overall) | 416 (52.3%) | 379 (47.7%) |
Employment Industries by Sex in Sebewaing
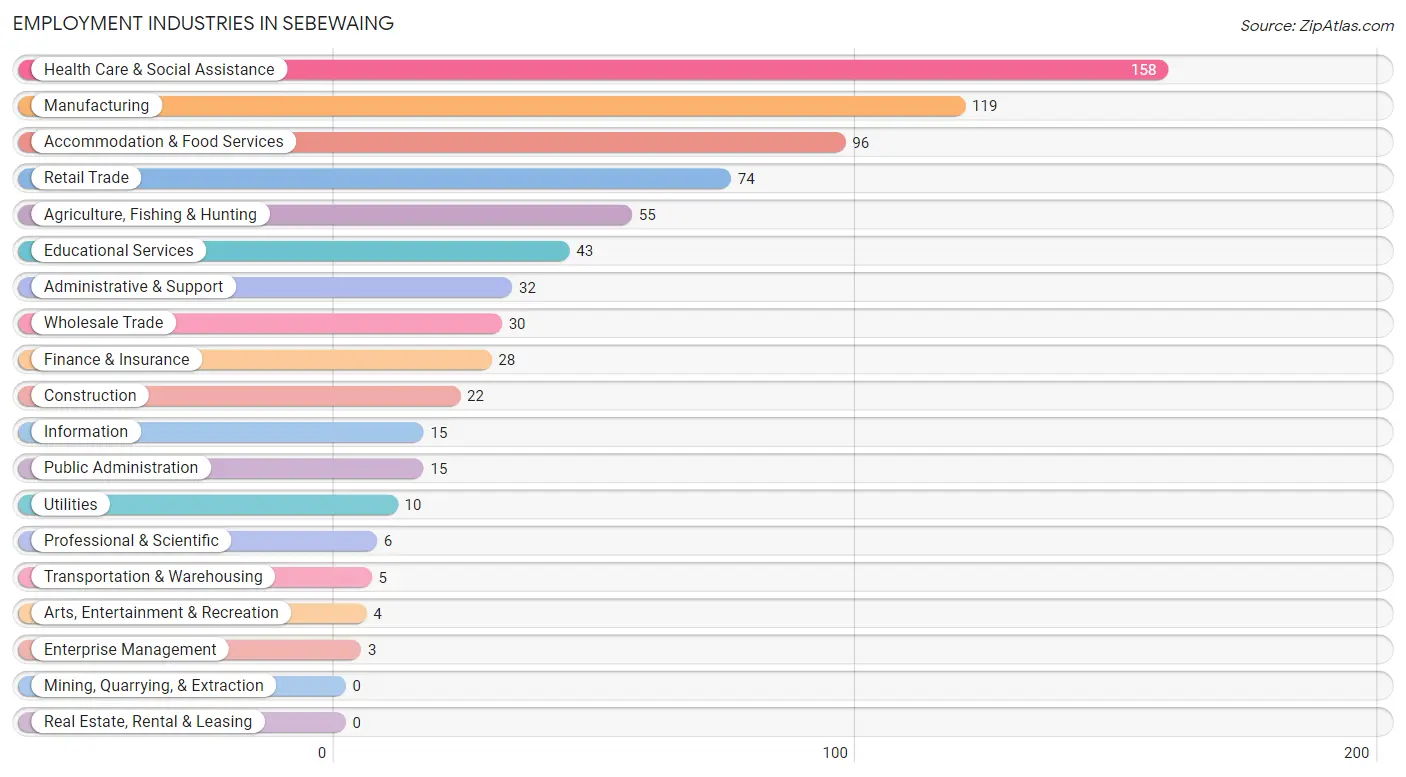
Employment Industries in Sebewaing
The major employment industries in Sebewaing include Health Care & Social Assistance (158 | 19.9%), Manufacturing (119 | 15.0%), Accommodation & Food Services (96 | 12.1%), Retail Trade (74 | 9.3%), and Agriculture, Fishing & Hunting (55 | 6.9%).
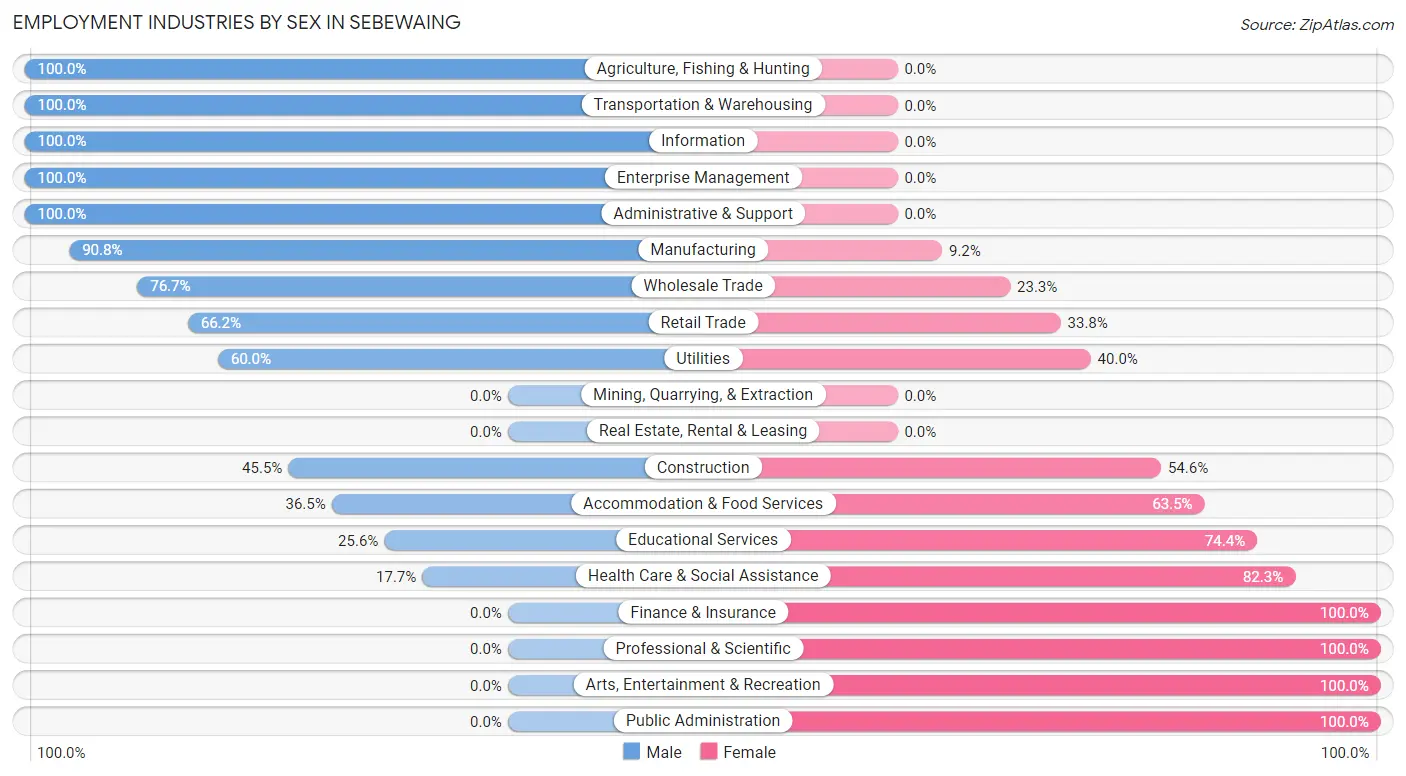
Employment Industries by Sex in Sebewaing
The Sebewaing industries that see more men than women are Agriculture, Fishing & Hunting (100.0%), Transportation & Warehousing (100.0%), and Information (100.0%), whereas the industries that tend to have a higher number of women are Finance & Insurance (100.0%), Professional & Scientific (100.0%), and Arts, Entertainment & Recreation (100.0%).
| Industry | Male | Female |
| Agriculture, Fishing & Hunting | 55 (100.0%) | 0 (0.0%) |
| Mining, Quarrying, & Extraction | 0 (0.0%) | 0 (0.0%) |
| Construction | 10 (45.5%) | 12 (54.5%) |
| Manufacturing | 108 (90.8%) | 11 (9.2%) |
| Wholesale Trade | 23 (76.7%) | 7 (23.3%) |
| Retail Trade | 49 (66.2%) | 25 (33.8%) |
| Transportation & Warehousing | 5 (100.0%) | 0 (0.0%) |
| Utilities | 6 (60.0%) | 4 (40.0%) |
| Information | 15 (100.0%) | 0 (0.0%) |
| Finance & Insurance | 0 (0.0%) | 28 (100.0%) |
| Real Estate, Rental & Leasing | 0 (0.0%) | 0 (0.0%) |
| Professional & Scientific | 0 (0.0%) | 6 (100.0%) |
| Enterprise Management | 3 (100.0%) | 0 (0.0%) |
| Administrative & Support | 32 (100.0%) | 0 (0.0%) |
| Educational Services | 11 (25.6%) | 32 (74.4%) |
| Health Care & Social Assistance | 28 (17.7%) | 130 (82.3%) |
| Arts, Entertainment & Recreation | 0 (0.0%) | 4 (100.0%) |
| Accommodation & Food Services | 35 (36.5%) | 61 (63.5%) |
| Public Administration | 0 (0.0%) | 15 (100.0%) |
| Total | 416 (52.3%) | 379 (47.7%) |
Education in Sebewaing
School Enrollment in Sebewaing
The most common levels of schooling among the 359 students in Sebewaing are middle school (148 | 41.2%), high school (87 | 24.2%), and elementary school (72 | 20.1%).
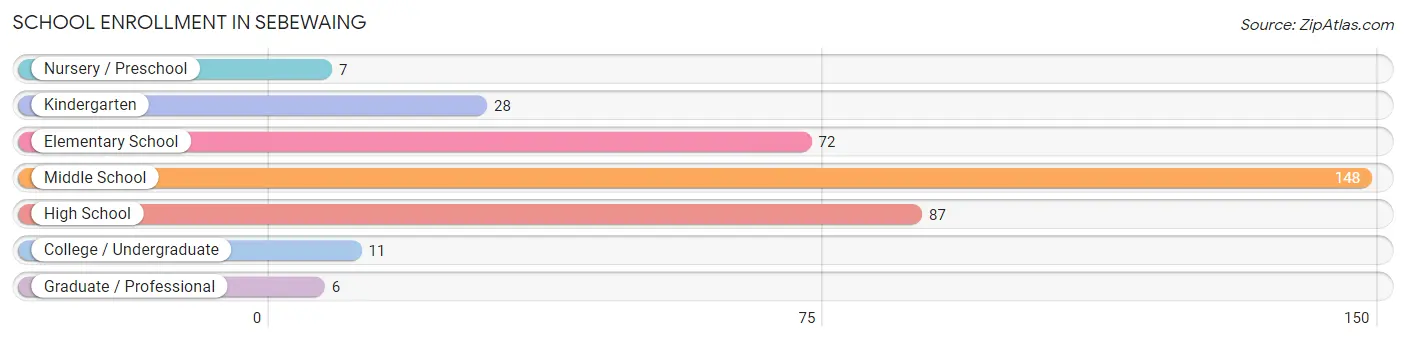
| School Level | # Students | % Students |
| Nursery / Preschool | 7 | 1.9% |
| Kindergarten | 28 | 7.8% |
| Elementary School | 72 | 20.1% |
| Middle School | 148 | 41.2% |
| High School | 87 | 24.2% |
| College / Undergraduate | 11 | 3.1% |
| Graduate / Professional | 6 | 1.7% |
| Total | 359 | 100.0% |
School Enrollment by Age by Funding Source in Sebewaing
Out of a total of 359 students who are enrolled in schools in Sebewaing, 54 (15.0%) attend a private institution, while the remaining 305 (85.0%) are enrolled in public schools. The age group of 35 years and over has the highest likelihood of being enrolled in private schools, with 6 (100.0% in the age bracket) enrolled. Conversely, the age group of 3 to 4 year olds has the lowest likelihood of being enrolled in a private school, with 7 (100.0% in the age bracket) attending a public institution.
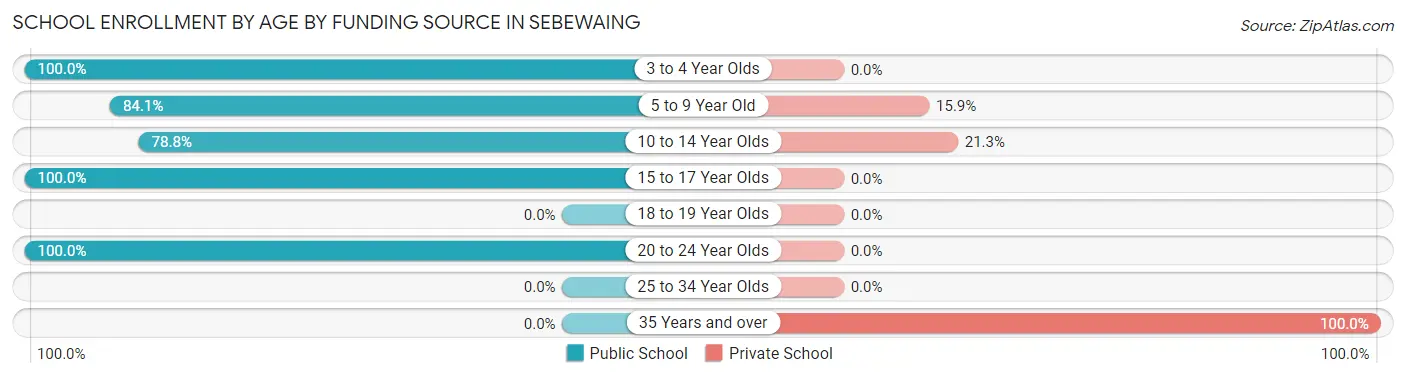
| Age Bracket | Public School | Private School |
| 3 to 4 Year Olds | 7 (100.0%) | 0 (0.0%) |
| 5 to 9 Year Old | 74 (84.1%) | 14 (15.9%) |
| 10 to 14 Year Olds | 126 (78.7%) | 34 (21.2%) |
| 15 to 17 Year Olds | 78 (100.0%) | 0 (0.0%) |
| 18 to 19 Year Olds | 0 (0.0%) | 0 (0.0%) |
| 20 to 24 Year Olds | 20 (100.0%) | 0 (0.0%) |
| 25 to 34 Year Olds | 0 (0.0%) | 0 (0.0%) |
| 35 Years and over | 0 (0.0%) | 6 (100.0%) |
| Total | 305 (85.0%) | 54 (15.0%) |
Educational Attainment by Field of Study in Sebewaing
Business (76 | 34.4%), education (36 | 16.3%), bio, nature & agricultural (17 | 7.7%), social sciences (16 | 7.2%), and arts & humanities (15 | 6.8%) are the most common fields of study among 221 individuals in Sebewaing who have obtained a bachelor's degree or higher.
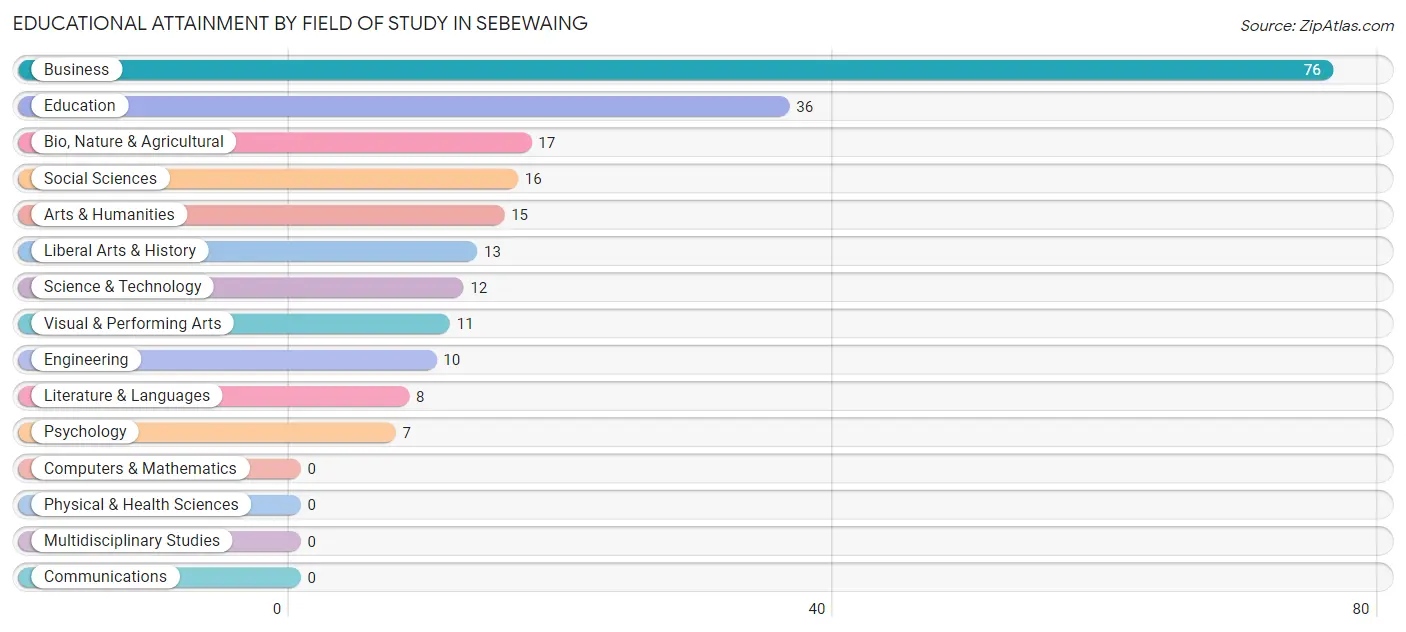
| Field of Study | # Graduates | % Graduates |
| Computers & Mathematics | 0 | 0.0% |
| Bio, Nature & Agricultural | 17 | 7.7% |
| Physical & Health Sciences | 0 | 0.0% |
| Psychology | 7 | 3.2% |
| Social Sciences | 16 | 7.2% |
| Engineering | 10 | 4.5% |
| Multidisciplinary Studies | 0 | 0.0% |
| Science & Technology | 12 | 5.4% |
| Business | 76 | 34.4% |
| Education | 36 | 16.3% |
| Literature & Languages | 8 | 3.6% |
| Liberal Arts & History | 13 | 5.9% |
| Visual & Performing Arts | 11 | 5.0% |
| Communications | 0 | 0.0% |
| Arts & Humanities | 15 | 6.8% |
| Total | 221 | 100.0% |
Transportation & Commute in Sebewaing
Vehicle Availability by Sex in Sebewaing
The most prevalent vehicle ownership categories in Sebewaing are males with 2 vehicles (229, accounting for 56.4%) and females with 2 vehicles (175, making up 60.4%).
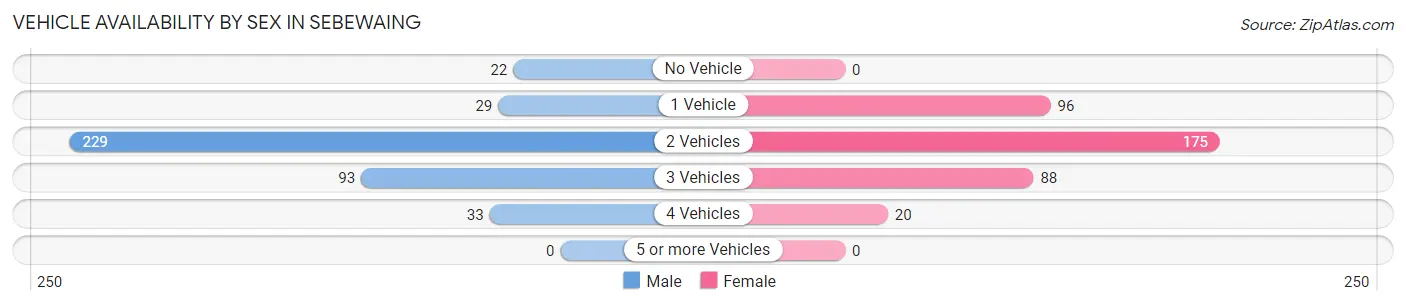
| Vehicles Available | Male | Female |
| No Vehicle | 22 (5.4%) | 0 (0.0%) |
| 1 Vehicle | 29 (7.1%) | 96 (25.3%) |
| 2 Vehicles | 229 (56.4%) | 175 (46.2%) |
| 3 Vehicles | 93 (22.9%) | 88 (23.2%) |
| 4 Vehicles | 33 (8.1%) | 20 (5.3%) |
| 5 or more Vehicles | 0 (0.0%) | 0 (0.0%) |
| Total | 406 (100.0%) | 379 (100.0%) |
Commute Time in Sebewaing
The most frequently occuring commute durations in Sebewaing are 5 to 9 minutes (157 commuters, 21.4%), 30 to 34 minutes (155 commuters, 21.1%), and 20 to 24 minutes (80 commuters, 10.9%).
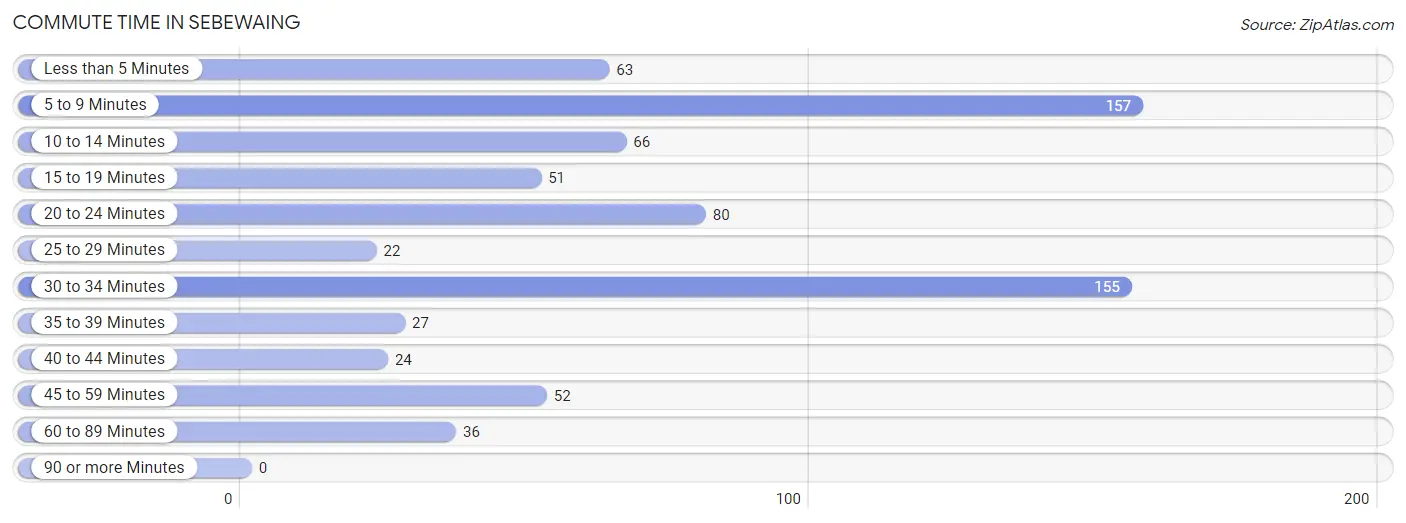
| Commute Time | # Commuters | % Commuters |
| Less than 5 Minutes | 63 | 8.6% |
| 5 to 9 Minutes | 157 | 21.4% |
| 10 to 14 Minutes | 66 | 9.0% |
| 15 to 19 Minutes | 51 | 7.0% |
| 20 to 24 Minutes | 80 | 10.9% |
| 25 to 29 Minutes | 22 | 3.0% |
| 30 to 34 Minutes | 155 | 21.1% |
| 35 to 39 Minutes | 27 | 3.7% |
| 40 to 44 Minutes | 24 | 3.3% |
| 45 to 59 Minutes | 52 | 7.1% |
| 60 to 89 Minutes | 36 | 4.9% |
| 90 or more Minutes | 0 | 0.0% |
Commute Time by Sex in Sebewaing
The most common commute times in Sebewaing are 5 to 9 minutes (86 commuters, 22.9%) for males and 5 to 9 minutes (71 commuters, 19.8%) for females.
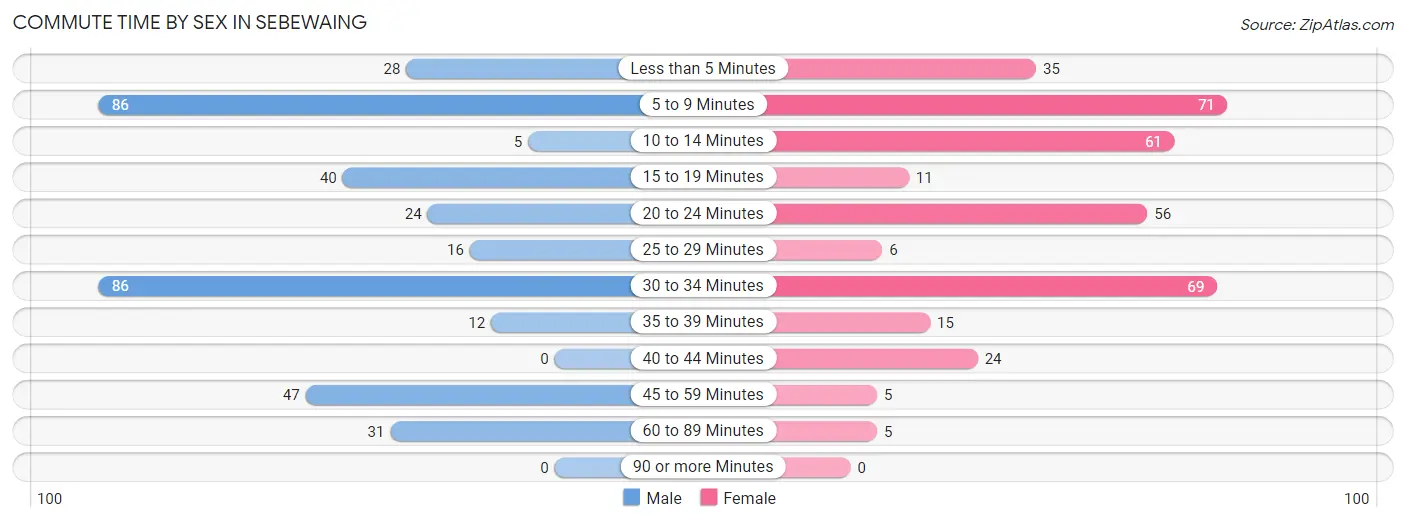
| Commute Time | Male | Female |
| Less than 5 Minutes | 28 (7.5%) | 35 (9.8%) |
| 5 to 9 Minutes | 86 (22.9%) | 71 (19.8%) |
| 10 to 14 Minutes | 5 (1.3%) | 61 (17.0%) |
| 15 to 19 Minutes | 40 (10.7%) | 11 (3.1%) |
| 20 to 24 Minutes | 24 (6.4%) | 56 (15.6%) |
| 25 to 29 Minutes | 16 (4.3%) | 6 (1.7%) |
| 30 to 34 Minutes | 86 (22.9%) | 69 (19.3%) |
| 35 to 39 Minutes | 12 (3.2%) | 15 (4.2%) |
| 40 to 44 Minutes | 0 (0.0%) | 24 (6.7%) |
| 45 to 59 Minutes | 47 (12.5%) | 5 (1.4%) |
| 60 to 89 Minutes | 31 (8.3%) | 5 (1.4%) |
| 90 or more Minutes | 0 (0.0%) | 0 (0.0%) |
Time of Departure to Work by Sex in Sebewaing
The most frequent times of departure to work in Sebewaing are 4:00 PM to 11:59 PM (73, 19.5%) for males and 12:00 PM to 3:59 PM (81, 22.6%) for females.
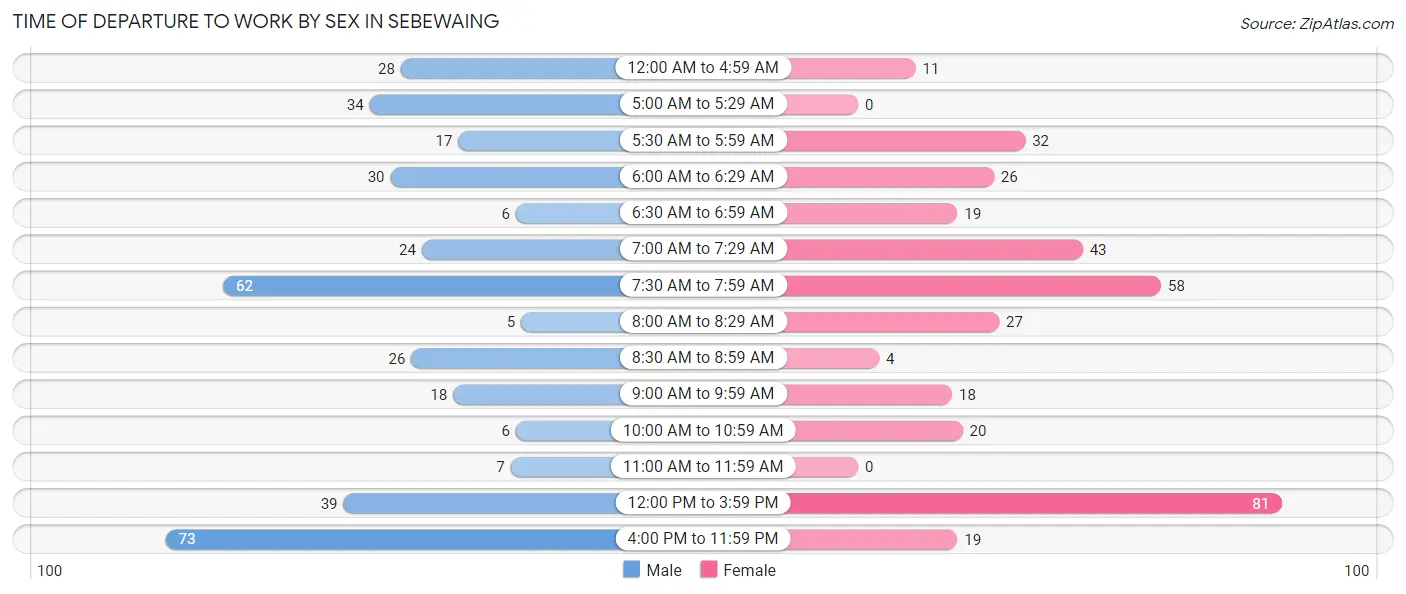
| Time of Departure | Male | Female |
| 12:00 AM to 4:59 AM | 28 (7.5%) | 11 (3.1%) |
| 5:00 AM to 5:29 AM | 34 (9.1%) | 0 (0.0%) |
| 5:30 AM to 5:59 AM | 17 (4.5%) | 32 (8.9%) |
| 6:00 AM to 6:29 AM | 30 (8.0%) | 26 (7.3%) |
| 6:30 AM to 6:59 AM | 6 (1.6%) | 19 (5.3%) |
| 7:00 AM to 7:29 AM | 24 (6.4%) | 43 (12.0%) |
| 7:30 AM to 7:59 AM | 62 (16.5%) | 58 (16.2%) |
| 8:00 AM to 8:29 AM | 5 (1.3%) | 27 (7.5%) |
| 8:30 AM to 8:59 AM | 26 (6.9%) | 4 (1.1%) |
| 9:00 AM to 9:59 AM | 18 (4.8%) | 18 (5.0%) |
| 10:00 AM to 10:59 AM | 6 (1.6%) | 20 (5.6%) |
| 11:00 AM to 11:59 AM | 7 (1.9%) | 0 (0.0%) |
| 12:00 PM to 3:59 PM | 39 (10.4%) | 81 (22.6%) |
| 4:00 PM to 11:59 PM | 73 (19.5%) | 19 (5.3%) |
| Total | 375 (100.0%) | 358 (100.0%) |
Housing Occupancy in Sebewaing
Occupancy by Ownership in Sebewaing
Of the total 919 dwellings in Sebewaing, owner-occupied units account for 735 (80.0%), while renter-occupied units make up 184 (20.0%).
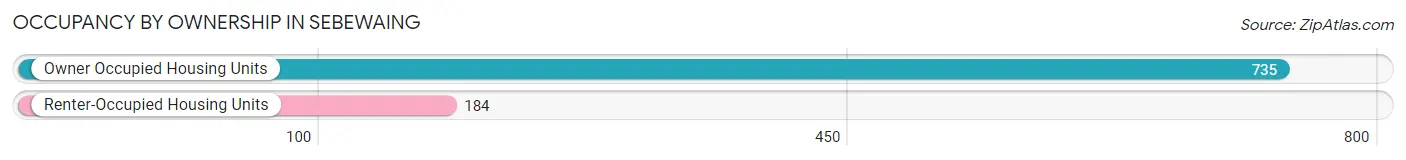
| Occupancy | # Housing Units | % Housing Units |
| Owner Occupied Housing Units | 735 | 80.0% |
| Renter-Occupied Housing Units | 184 | 20.0% |
| Total Occupied Housing Units | 919 | 100.0% |
Occupancy by Household Size in Sebewaing
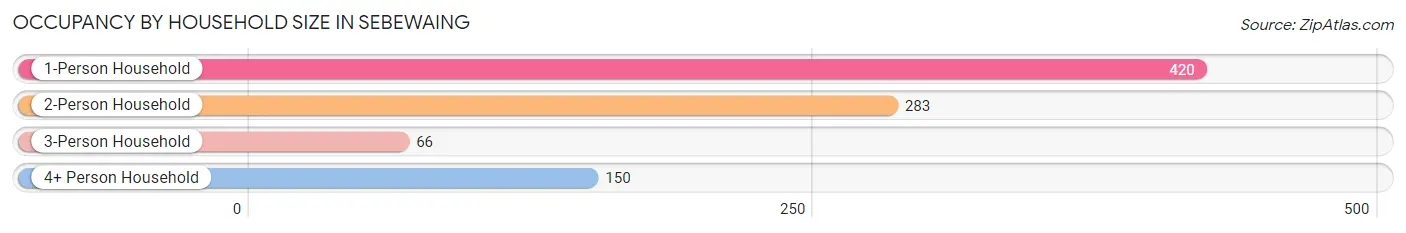
| Household Size | # Housing Units | % Housing Units |
| 1-Person Household | 420 | 45.7% |
| 2-Person Household | 283 | 30.8% |
| 3-Person Household | 66 | 7.2% |
| 4+ Person Household | 150 | 16.3% |
| Total Housing Units | 919 | 100.0% |
Occupancy by Ownership by Household Size in Sebewaing
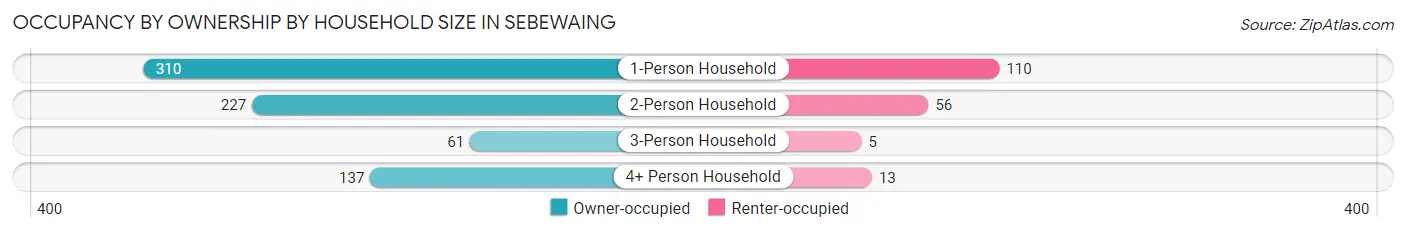
| Household Size | Owner-occupied | Renter-occupied |
| 1-Person Household | 310 (73.8%) | 110 (26.2%) |
| 2-Person Household | 227 (80.2%) | 56 (19.8%) |
| 3-Person Household | 61 (92.4%) | 5 (7.6%) |
| 4+ Person Household | 137 (91.3%) | 13 (8.7%) |
| Total Housing Units | 735 (80.0%) | 184 (20.0%) |
Occupancy by Educational Attainment in Sebewaing
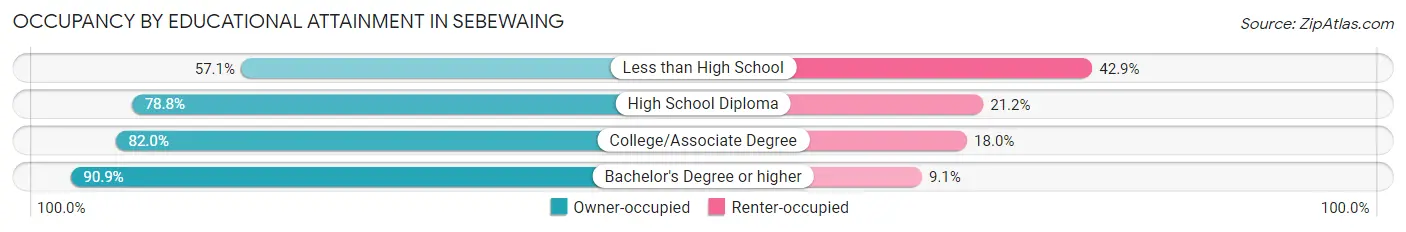
| Household Size | Owner-occupied | Renter-occupied |
| Less than High School | 36 (57.1%) | 27 (42.9%) |
| High School Diploma | 330 (78.8%) | 89 (21.2%) |
| College/Associate Degree | 259 (82.0%) | 57 (18.0%) |
| Bachelor's Degree or higher | 110 (90.9%) | 11 (9.1%) |
Occupancy by Age of Householder in Sebewaing
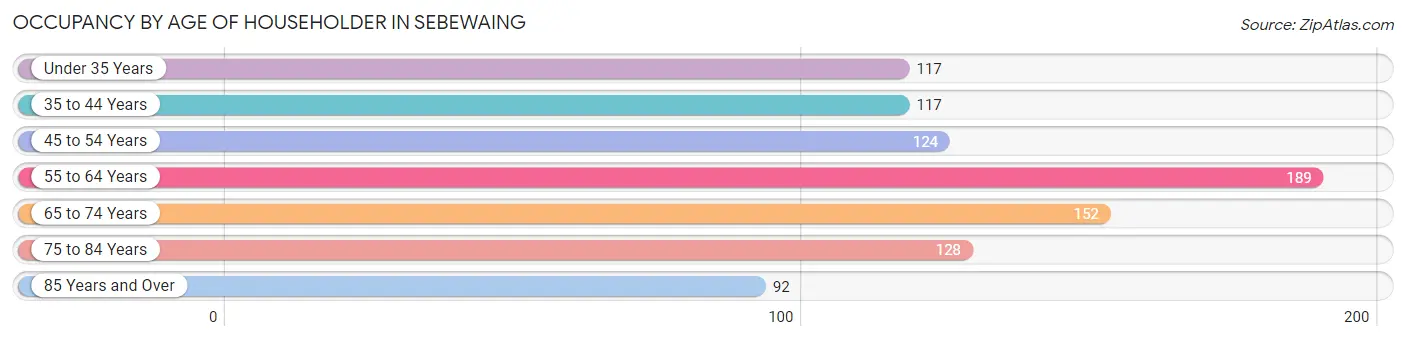
| Age Bracket | # Households | % Households |
| Under 35 Years | 117 | 12.7% |
| 35 to 44 Years | 117 | 12.7% |
| 45 to 54 Years | 124 | 13.5% |
| 55 to 64 Years | 189 | 20.6% |
| 65 to 74 Years | 152 | 16.5% |
| 75 to 84 Years | 128 | 13.9% |
| 85 Years and Over | 92 | 10.0% |
| Total | 919 | 100.0% |
Housing Finances in Sebewaing
Median Income by Occupancy in Sebewaing
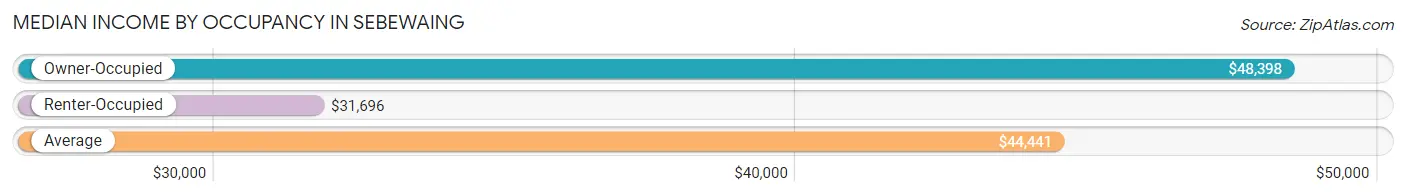
| Occupancy Type | # Households | Median Income |
| Owner-Occupied | 735 (80.0%) | $48,398 |
| Renter-Occupied | 184 (20.0%) | $31,696 |
| Average | 919 (100.0%) | $44,441 |
Occupancy by Householder Income Bracket in Sebewaing
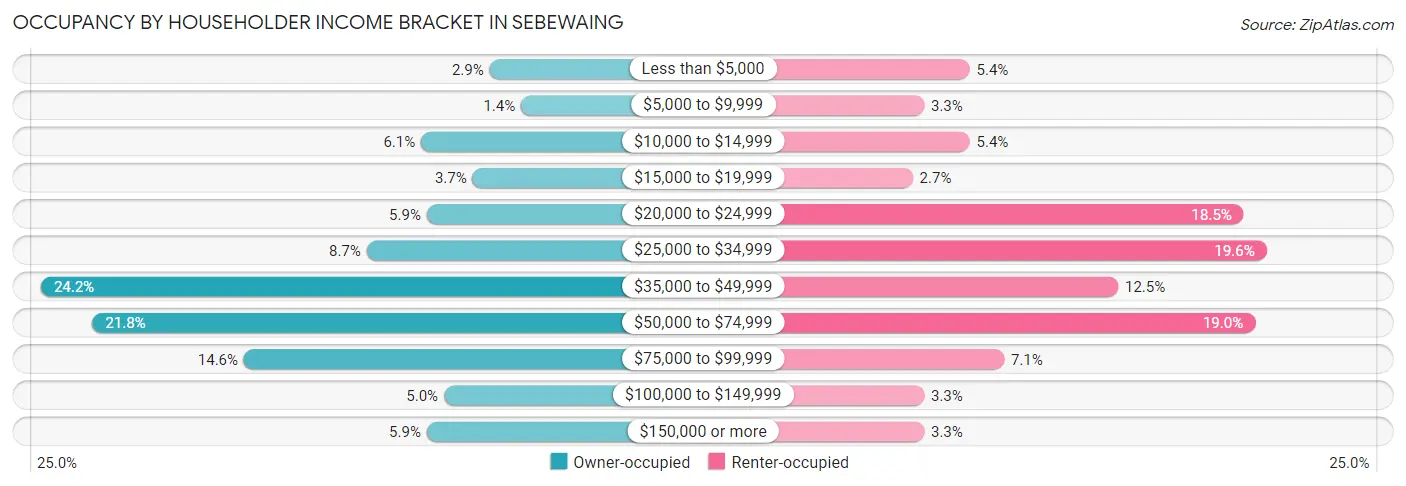
| Income Bracket | Owner-occupied | Renter-occupied |
| Less than $5,000 | 21 (2.9%) | 10 (5.4%) |
| $5,000 to $9,999 | 10 (1.4%) | 6 (3.3%) |
| $10,000 to $14,999 | 45 (6.1%) | 10 (5.4%) |
| $15,000 to $19,999 | 27 (3.7%) | 5 (2.7%) |
| $20,000 to $24,999 | 43 (5.9%) | 34 (18.5%) |
| $25,000 to $34,999 | 64 (8.7%) | 36 (19.6%) |
| $35,000 to $49,999 | 178 (24.2%) | 23 (12.5%) |
| $50,000 to $74,999 | 160 (21.8%) | 35 (19.0%) |
| $75,000 to $99,999 | 107 (14.6%) | 13 (7.1%) |
| $100,000 to $149,999 | 37 (5.0%) | 6 (3.3%) |
| $150,000 or more | 43 (5.9%) | 6 (3.3%) |
| Total | 735 (100.0%) | 184 (100.0%) |
Monthly Housing Cost Tiers in Sebewaing
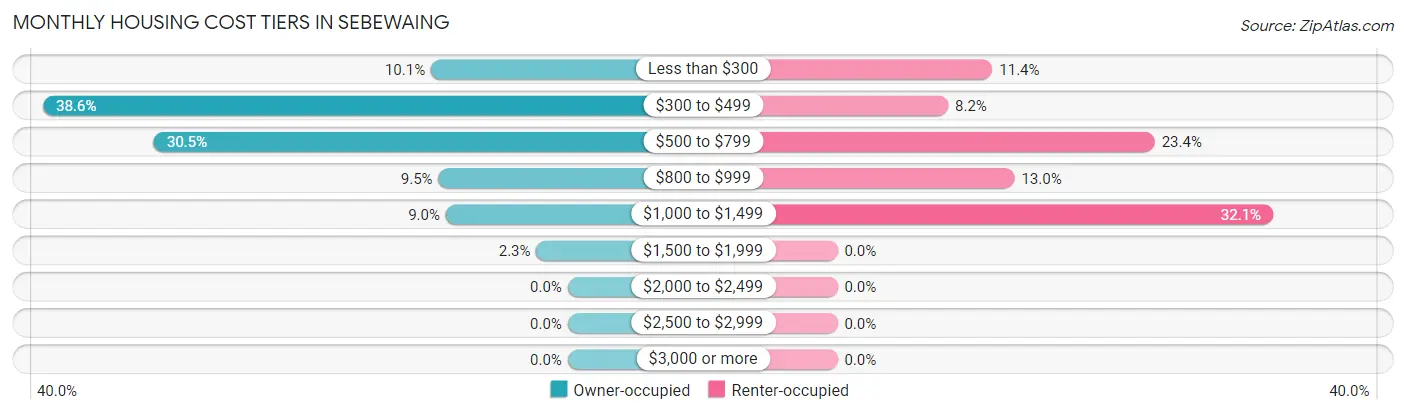
| Monthly Cost | Owner-occupied | Renter-occupied |
| Less than $300 | 74 (10.1%) | 21 (11.4%) |
| $300 to $499 | 284 (38.6%) | 15 (8.2%) |
| $500 to $799 | 224 (30.5%) | 43 (23.4%) |
| $800 to $999 | 70 (9.5%) | 24 (13.0%) |
| $1,000 to $1,499 | 66 (9.0%) | 59 (32.1%) |
| $1,500 to $1,999 | 17 (2.3%) | 0 (0.0%) |
| $2,000 to $2,499 | 0 (0.0%) | 0 (0.0%) |
| $2,500 to $2,999 | 0 (0.0%) | 0 (0.0%) |
| $3,000 or more | 0 (0.0%) | 0 (0.0%) |
| Total | 735 (100.0%) | 184 (100.0%) |
Physical Housing Characteristics in Sebewaing
Housing Structures in Sebewaing
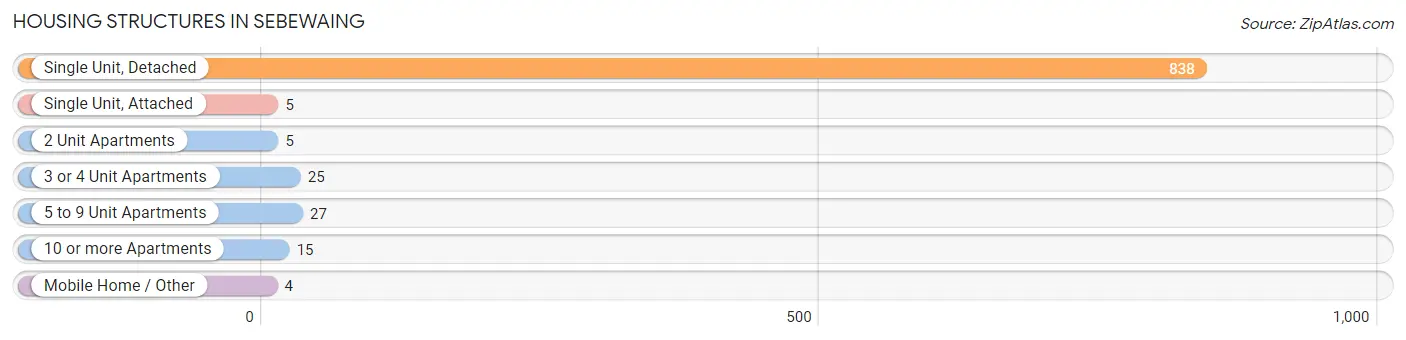
| Structure Type | # Housing Units | % Housing Units |
| Single Unit, Detached | 838 | 91.2% |
| Single Unit, Attached | 5 | 0.5% |
| 2 Unit Apartments | 5 | 0.5% |
| 3 or 4 Unit Apartments | 25 | 2.7% |
| 5 to 9 Unit Apartments | 27 | 2.9% |
| 10 or more Apartments | 15 | 1.6% |
| Mobile Home / Other | 4 | 0.4% |
| Total | 919 | 100.0% |
Housing Structures by Occupancy in Sebewaing
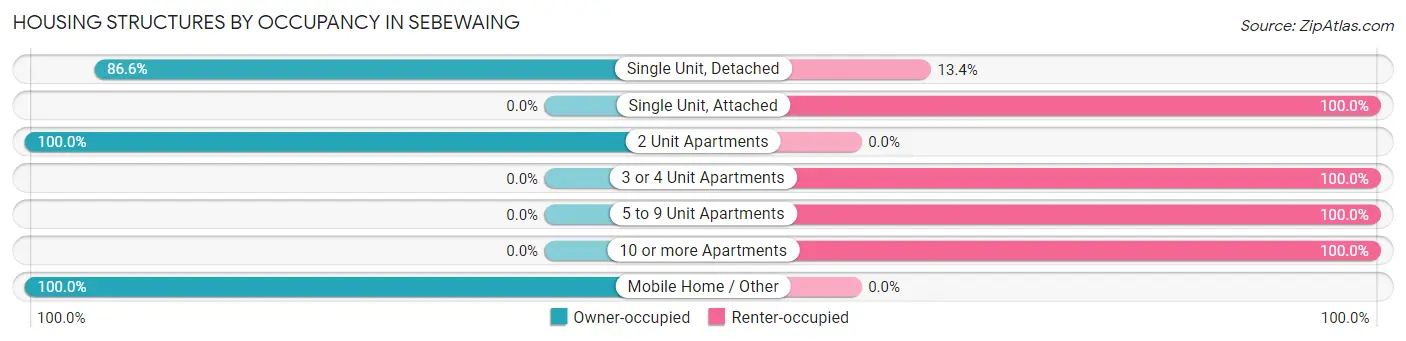
| Structure Type | Owner-occupied | Renter-occupied |
| Single Unit, Detached | 726 (86.6%) | 112 (13.4%) |
| Single Unit, Attached | 0 (0.0%) | 5 (100.0%) |
| 2 Unit Apartments | 5 (100.0%) | 0 (0.0%) |
| 3 or 4 Unit Apartments | 0 (0.0%) | 25 (100.0%) |
| 5 to 9 Unit Apartments | 0 (0.0%) | 27 (100.0%) |
| 10 or more Apartments | 0 (0.0%) | 15 (100.0%) |
| Mobile Home / Other | 4 (100.0%) | 0 (0.0%) |
| Total | 735 (80.0%) | 184 (20.0%) |
Housing Structures by Number of Rooms in Sebewaing
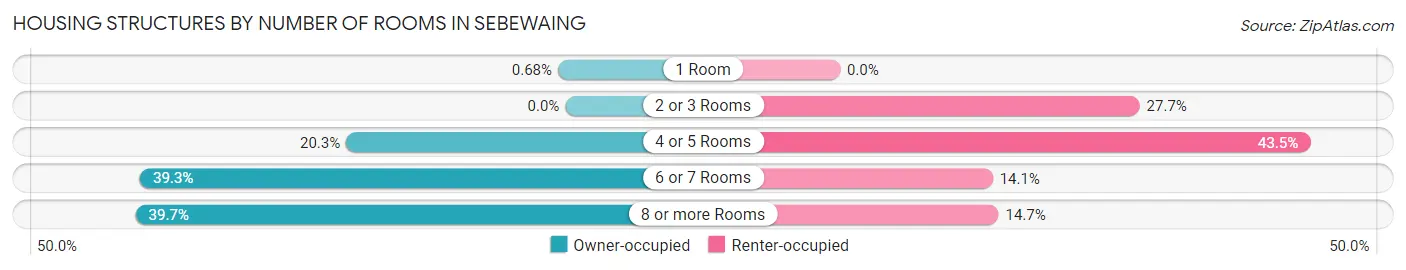
| Number of Rooms | Owner-occupied | Renter-occupied |
| 1 Room | 5 (0.7%) | 0 (0.0%) |
| 2 or 3 Rooms | 0 (0.0%) | 51 (27.7%) |
| 4 or 5 Rooms | 149 (20.3%) | 80 (43.5%) |
| 6 or 7 Rooms | 289 (39.3%) | 26 (14.1%) |
| 8 or more Rooms | 292 (39.7%) | 27 (14.7%) |
| Total | 735 (100.0%) | 184 (100.0%) |
Housing Structure by Heating Type in Sebewaing
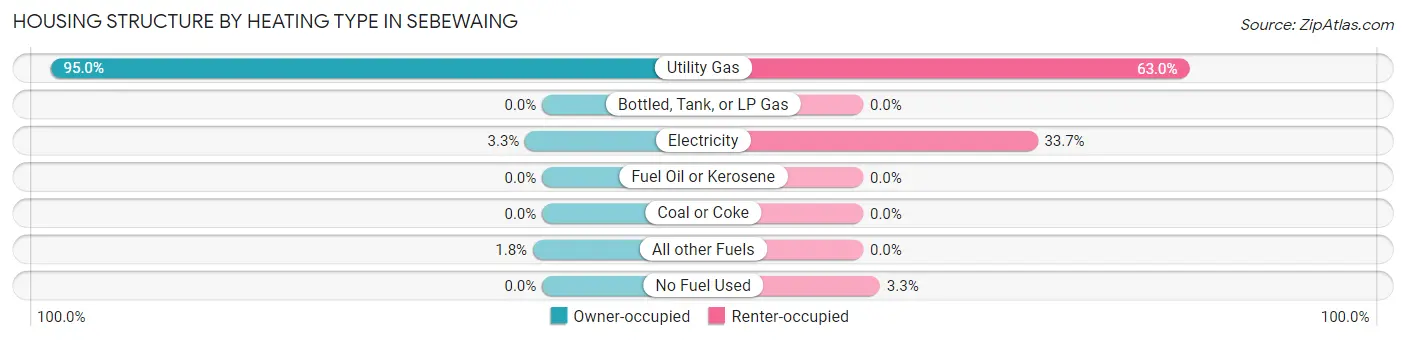
| Heating Type | Owner-occupied | Renter-occupied |
| Utility Gas | 698 (95.0%) | 116 (63.0%) |
| Bottled, Tank, or LP Gas | 0 (0.0%) | 0 (0.0%) |
| Electricity | 24 (3.3%) | 62 (33.7%) |
| Fuel Oil or Kerosene | 0 (0.0%) | 0 (0.0%) |
| Coal or Coke | 0 (0.0%) | 0 (0.0%) |
| All other Fuels | 13 (1.8%) | 0 (0.0%) |
| No Fuel Used | 0 (0.0%) | 6 (3.3%) |
| Total | 735 (100.0%) | 184 (100.0%) |
Household Vehicle Usage in Sebewaing
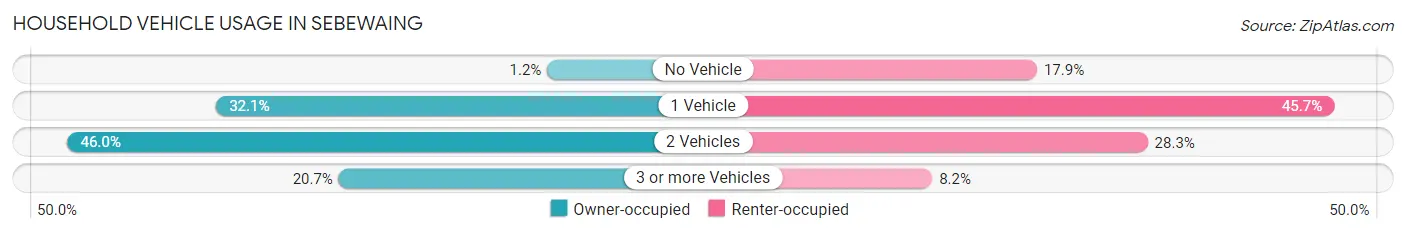
| Vehicles per Household | Owner-occupied | Renter-occupied |
| No Vehicle | 9 (1.2%) | 33 (17.9%) |
| 1 Vehicle | 236 (32.1%) | 84 (45.7%) |
| 2 Vehicles | 338 (46.0%) | 52 (28.3%) |
| 3 or more Vehicles | 152 (20.7%) | 15 (8.2%) |
| Total | 735 (100.0%) | 184 (100.0%) |
Real Estate & Mortgages in Sebewaing
Real Estate and Mortgage Overview in Sebewaing
| Characteristic | Without Mortgage | With Mortgage |
| Housing Units | 498 | 237 |
| Median Property Value | $79,400 | $92,900 |
| Median Household Income | $39,648 | $32 |
| Monthly Housing Costs | $444 | $0 |
| Real Estate Taxes | $1,427 | $18 |
Property Value by Mortgage Status in Sebewaing
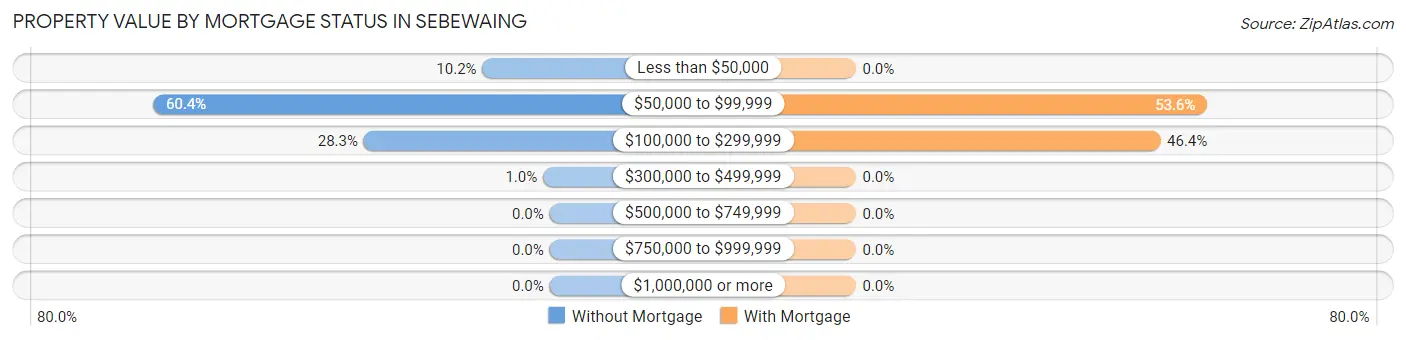
| Property Value | Without Mortgage | With Mortgage |
| Less than $50,000 | 51 (10.2%) | 0 (0.0%) |
| $50,000 to $99,999 | 301 (60.4%) | 127 (53.6%) |
| $100,000 to $299,999 | 141 (28.3%) | 110 (46.4%) |
| $300,000 to $499,999 | 5 (1.0%) | 0 (0.0%) |
| $500,000 to $749,999 | 0 (0.0%) | 0 (0.0%) |
| $750,000 to $999,999 | 0 (0.0%) | 0 (0.0%) |
| $1,000,000 or more | 0 (0.0%) | 0 (0.0%) |
| Total | 498 (100.0%) | 237 (100.0%) |
Household Income by Mortgage Status in Sebewaing
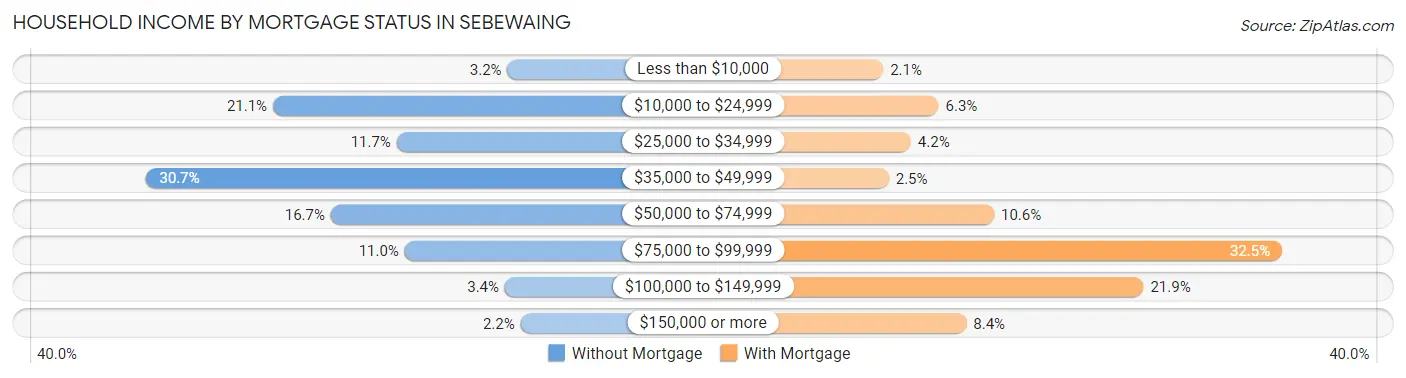
| Household Income | Without Mortgage | With Mortgage |
| Less than $10,000 | 16 (3.2%) | 5 (2.1%) |
| $10,000 to $24,999 | 105 (21.1%) | 15 (6.3%) |
| $25,000 to $34,999 | 58 (11.7%) | 10 (4.2%) |
| $35,000 to $49,999 | 153 (30.7%) | 6 (2.5%) |
| $50,000 to $74,999 | 83 (16.7%) | 25 (10.5%) |
| $75,000 to $99,999 | 55 (11.0%) | 77 (32.5%) |
| $100,000 to $149,999 | 17 (3.4%) | 52 (21.9%) |
| $150,000 or more | 11 (2.2%) | 20 (8.4%) |
| Total | 498 (100.0%) | 237 (100.0%) |
Property Value to Household Income Ratio in Sebewaing
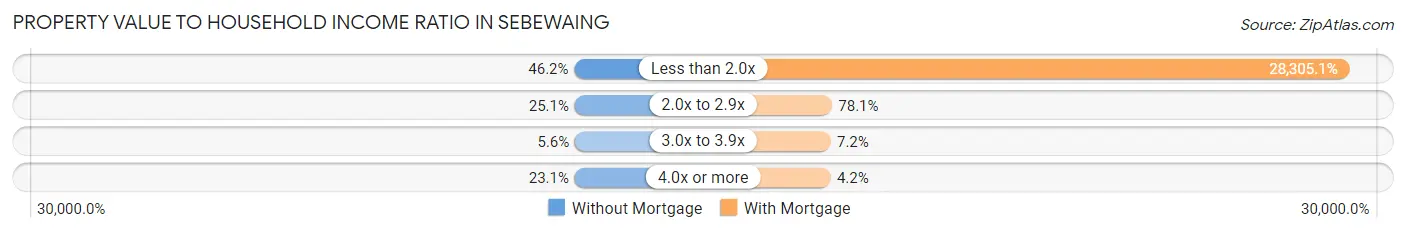
| Value-to-Income Ratio | Without Mortgage | With Mortgage |
| Less than 2.0x | 230 (46.2%) | 67,083 (28,305.1%) |
| 2.0x to 2.9x | 125 (25.1%) | 185 (78.1%) |
| 3.0x to 3.9x | 28 (5.6%) | 17 (7.2%) |
| 4.0x or more | 115 (23.1%) | 10 (4.2%) |
| Total | 498 (100.0%) | 237 (100.0%) |
Real Estate Taxes by Mortgage Status in Sebewaing
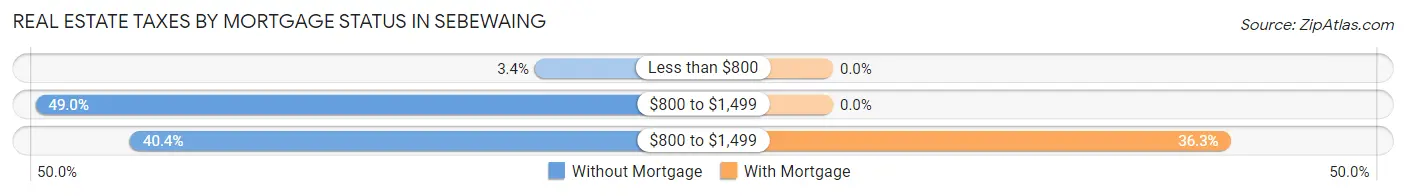
| Property Taxes | Without Mortgage | With Mortgage |
| Less than $800 | 17 (3.4%) | 0 (0.0%) |
| $800 to $1,499 | 244 (49.0%) | 0 (0.0%) |
| $800 to $1,499 | 201 (40.4%) | 86 (36.3%) |
| Total | 498 (100.0%) | 237 (100.0%) |
Health & Disability in Sebewaing
Health Insurance Coverage by Age in Sebewaing
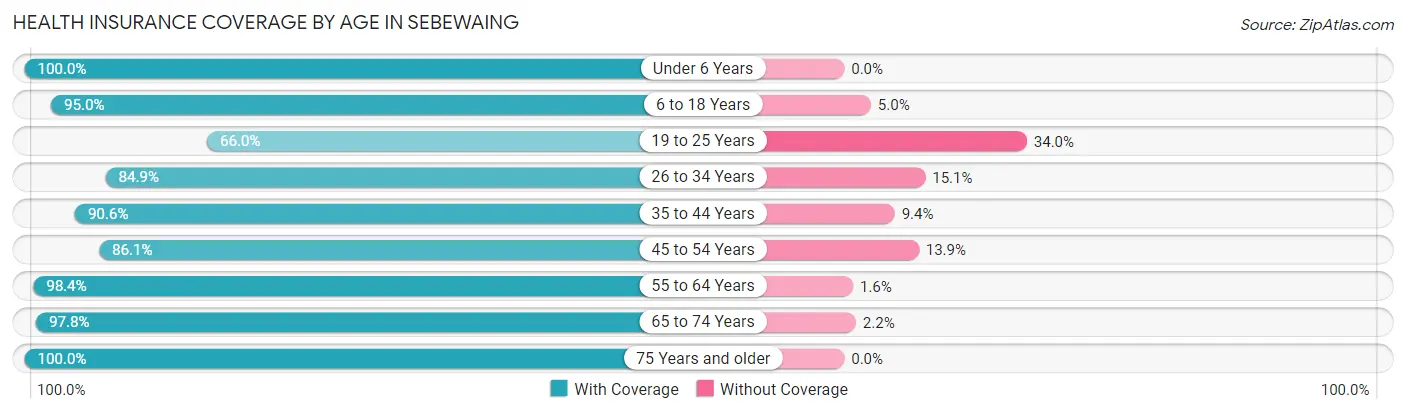
| Age Bracket | With Coverage | Without Coverage |
| Under 6 Years | 52 (100.0%) | 0 (0.0%) |
| 6 to 18 Years | 326 (95.0%) | 17 (5.0%) |
| 19 to 25 Years | 62 (66.0%) | 32 (34.0%) |
| 26 to 34 Years | 118 (84.9%) | 21 (15.1%) |
| 35 to 44 Years | 212 (90.6%) | 22 (9.4%) |
| 45 to 54 Years | 186 (86.1%) | 30 (13.9%) |
| 55 to 64 Years | 363 (98.4%) | 6 (1.6%) |
| 65 to 74 Years | 226 (97.8%) | 5 (2.2%) |
| 75 Years and older | 266 (100.0%) | 0 (0.0%) |
| Total | 1,811 (93.2%) | 133 (6.8%) |
Health Insurance Coverage by Citizenship Status in Sebewaing
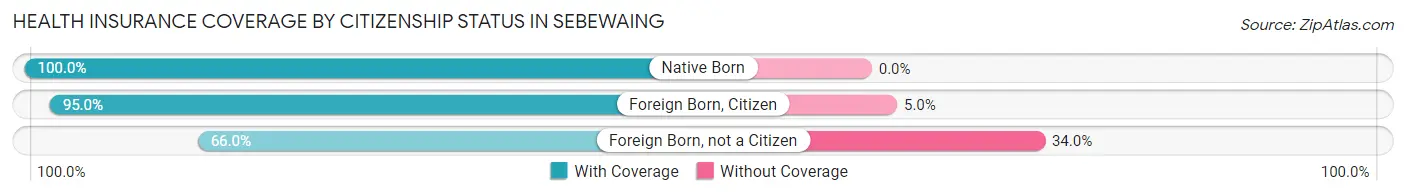
| Citizenship Status | With Coverage | Without Coverage |
| Native Born | 52 (100.0%) | 0 (0.0%) |
| Foreign Born, Citizen | 326 (95.0%) | 17 (5.0%) |
| Foreign Born, not a Citizen | 62 (66.0%) | 32 (34.0%) |
Health Insurance Coverage by Household Income in Sebewaing
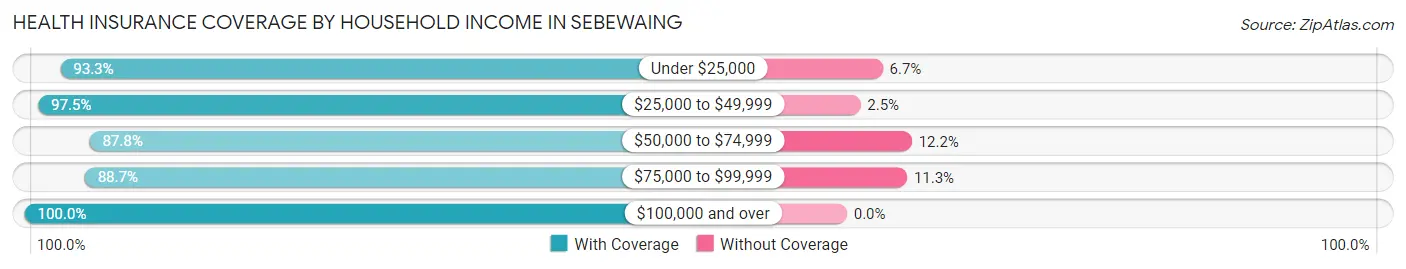
| Household Income | With Coverage | Without Coverage |
| Under $25,000 | 264 (93.3%) | 19 (6.7%) |
| $25,000 to $49,999 | 498 (97.5%) | 13 (2.5%) |
| $50,000 to $74,999 | 390 (87.8%) | 54 (12.2%) |
| $75,000 to $99,999 | 370 (88.7%) | 47 (11.3%) |
| $100,000 and over | 262 (100.0%) | 0 (0.0%) |
Public vs Private Health Insurance Coverage by Age in Sebewaing
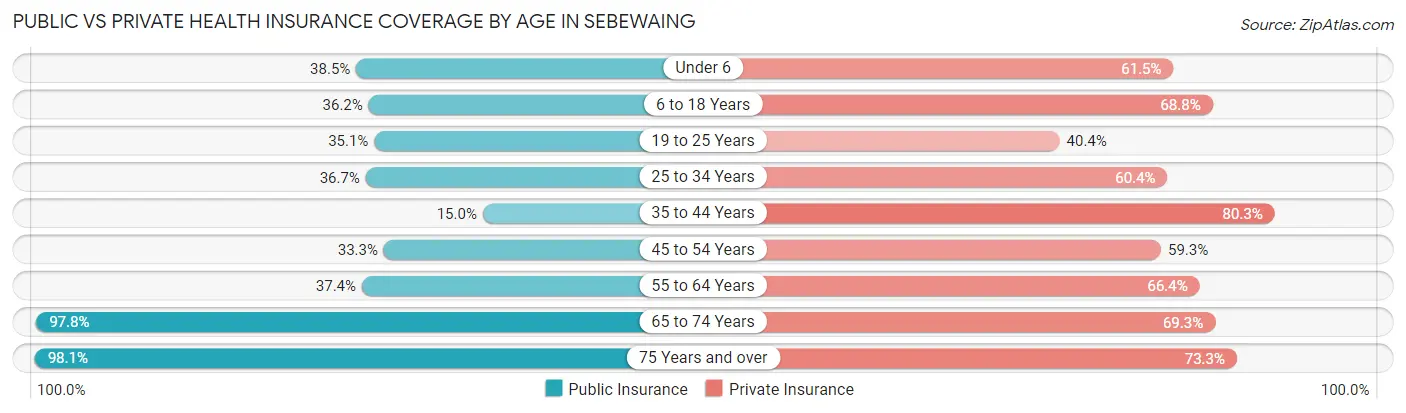
| Age Bracket | Public Insurance | Private Insurance |
| Under 6 | 20 (38.5%) | 32 (61.5%) |
| 6 to 18 Years | 124 (36.1%) | 236 (68.8%) |
| 19 to 25 Years | 33 (35.1%) | 38 (40.4%) |
| 25 to 34 Years | 51 (36.7%) | 84 (60.4%) |
| 35 to 44 Years | 35 (15.0%) | 188 (80.3%) |
| 45 to 54 Years | 72 (33.3%) | 128 (59.3%) |
| 55 to 64 Years | 138 (37.4%) | 245 (66.4%) |
| 65 to 74 Years | 226 (97.8%) | 160 (69.3%) |
| 75 Years and over | 261 (98.1%) | 195 (73.3%) |
| Total | 960 (49.4%) | 1,306 (67.2%) |
Disability Status by Sex by Age in Sebewaing
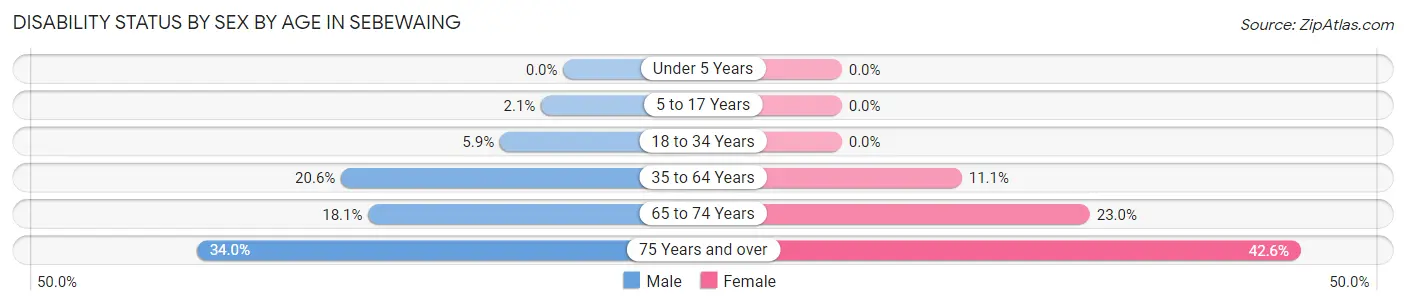
| Age Bracket | Male | Female |
| Under 5 Years | 0 (0.0%) | 0 (0.0%) |
| 5 to 17 Years | 4 (2.1%) | 0 (0.0%) |
| 18 to 34 Years | 9 (5.9%) | 0 (0.0%) |
| 35 to 64 Years | 80 (20.6%) | 48 (11.1%) |
| 65 to 74 Years | 19 (18.1%) | 29 (23.0%) |
| 75 Years and over | 33 (34.0%) | 72 (42.6%) |
Disability Class by Sex by Age in Sebewaing
Disability Class: Hearing Difficulty
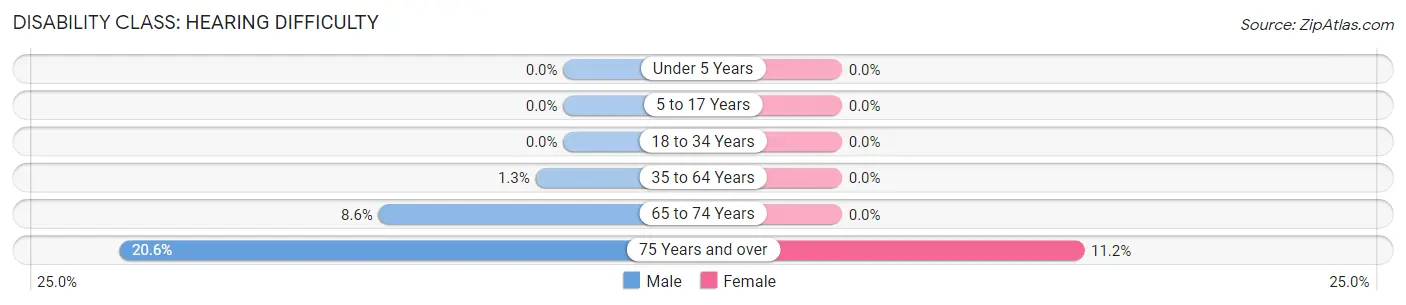
| Age Bracket | Male | Female |
| Under 5 Years | 0 (0.0%) | 0 (0.0%) |
| 5 to 17 Years | 0 (0.0%) | 0 (0.0%) |
| 18 to 34 Years | 0 (0.0%) | 0 (0.0%) |
| 35 to 64 Years | 5 (1.3%) | 0 (0.0%) |
| 65 to 74 Years | 9 (8.6%) | 0 (0.0%) |
| 75 Years and over | 20 (20.6%) | 19 (11.2%) |
Disability Class: Vision Difficulty
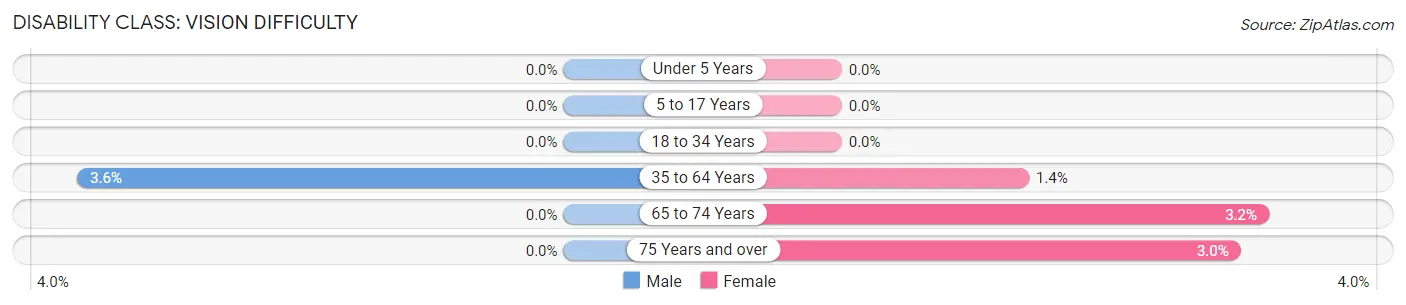
| Age Bracket | Male | Female |
| Under 5 Years | 0 (0.0%) | 0 (0.0%) |
| 5 to 17 Years | 0 (0.0%) | 0 (0.0%) |
| 18 to 34 Years | 0 (0.0%) | 0 (0.0%) |
| 35 to 64 Years | 14 (3.6%) | 6 (1.4%) |
| 65 to 74 Years | 0 (0.0%) | 4 (3.2%) |
| 75 Years and over | 0 (0.0%) | 5 (3.0%) |
Disability Class: Cognitive Difficulty
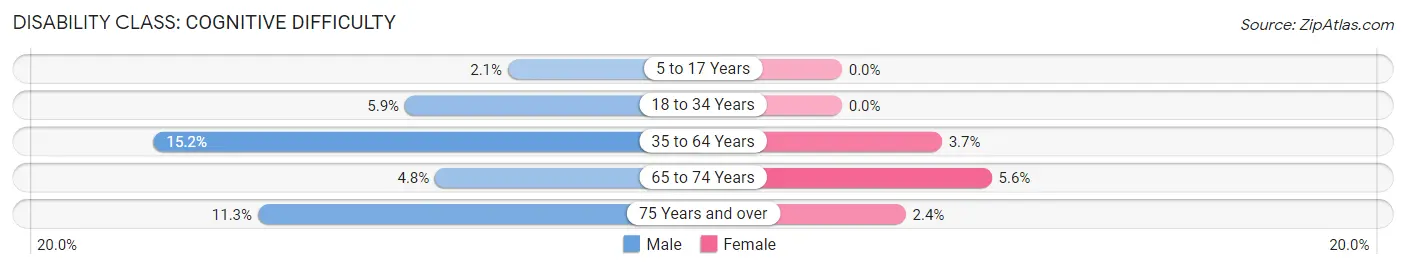
| Age Bracket | Male | Female |
| 5 to 17 Years | 4 (2.1%) | 0 (0.0%) |
| 18 to 34 Years | 9 (5.9%) | 0 (0.0%) |
| 35 to 64 Years | 59 (15.2%) | 16 (3.7%) |
| 65 to 74 Years | 5 (4.8%) | 7 (5.6%) |
| 75 Years and over | 11 (11.3%) | 4 (2.4%) |
Disability Class: Ambulatory Difficulty
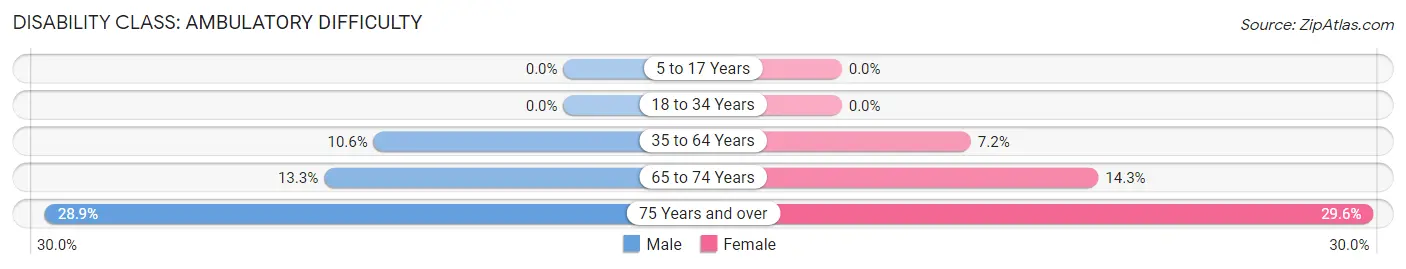
| Age Bracket | Male | Female |
| 5 to 17 Years | 0 (0.0%) | 0 (0.0%) |
| 18 to 34 Years | 0 (0.0%) | 0 (0.0%) |
| 35 to 64 Years | 41 (10.6%) | 31 (7.2%) |
| 65 to 74 Years | 14 (13.3%) | 18 (14.3%) |
| 75 Years and over | 28 (28.9%) | 50 (29.6%) |
Disability Class: Self-Care Difficulty
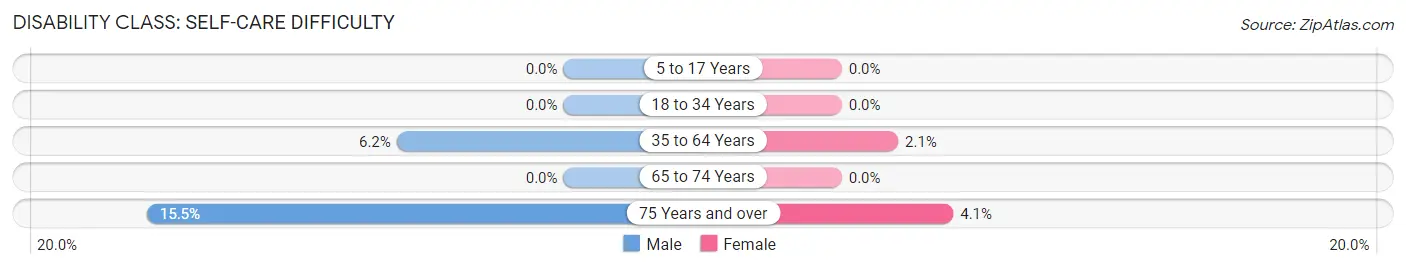
| Age Bracket | Male | Female |
| 5 to 17 Years | 0 (0.0%) | 0 (0.0%) |
| 18 to 34 Years | 0 (0.0%) | 0 (0.0%) |
| 35 to 64 Years | 24 (6.2%) | 9 (2.1%) |
| 65 to 74 Years | 0 (0.0%) | 0 (0.0%) |
| 75 Years and over | 15 (15.5%) | 7 (4.1%) |
Technology Access in Sebewaing
Computing Device Access in Sebewaing
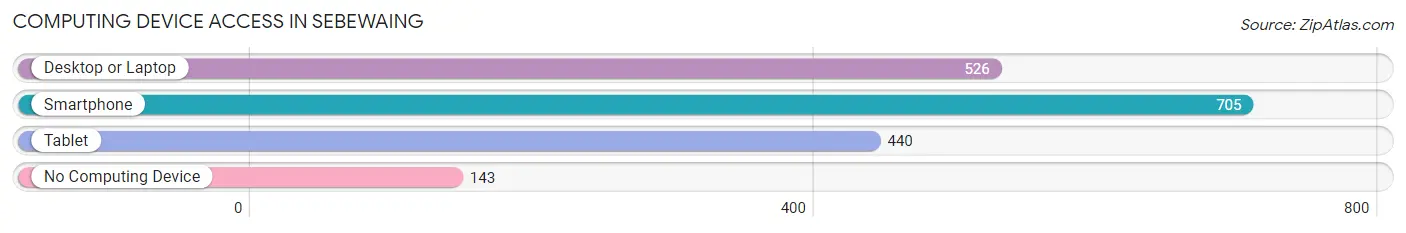
| Device Type | # Households | % Households |
| Desktop or Laptop | 526 | 57.2% |
| Smartphone | 705 | 76.7% |
| Tablet | 440 | 47.9% |
| No Computing Device | 143 | 15.6% |
| Total | 919 | 100.0% |
Internet Access in Sebewaing
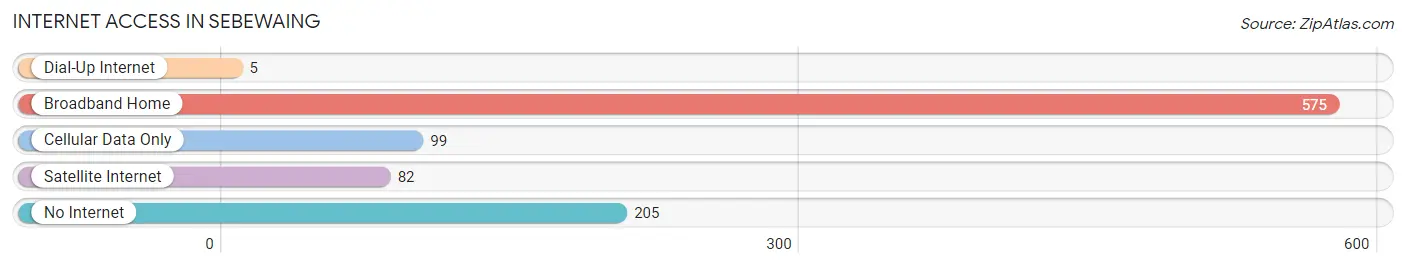
| Internet Type | # Households | % Households |
| Dial-Up Internet | 5 | 0.5% |
| Broadband Home | 575 | 62.6% |
| Cellular Data Only | 99 | 10.8% |
| Satellite Internet | 82 | 8.9% |
| No Internet | 205 | 22.3% |
| Total | 919 | 100.0% |
Sebewaing Summary
Sebewaing is a village located in Huron County, Michigan, United States. The population was 1,717 at the 2010 census. It is the county seat of Huron County.
Geography
Sebewaing is located at 43°45'25" North, 83°14'17" West (43.756944, -83.238056). According to the United States Census Bureau, the village has a total area of 1.2 square miles (3.1 km2), all land.
History
Sebewaing was founded in 1854 by German immigrants. The name is derived from the Chippewa Indian word for "place of the wild geese". The village was incorporated in 1871.
The first settlers in the area were German immigrants who arrived in the 1840s. They were attracted to the area by the fertile soil and abundant wildlife. The first settlers built log cabins and cleared the land for farming.
The village was platted in 1854 and the first post office was established in 1855. The first school was built in 1856 and the first church was built in 1858.
The village was incorporated in 1871 and the first village hall was built in 1872. The first newspaper, the Sebewaing Times, was established in 1873.
Economy
Sebewaing is a small rural community with a strong agricultural base. The village is home to several businesses, including a grocery store, a hardware store, a lumber yard, a bank, and a variety of other small businesses.
The village is also home to several manufacturing companies, including a plastics manufacturer, a metal fabricator, and a food processor.
Demographics
As of the census of 2010, there were 1,717 people, 717 households, and 463 families residing in the village. The population density was 1,420.8 people per square mile (548.7/km2). There were 790 housing units at an average density of 654.2 per square mile (252.7/km2). The racial makeup of the village was 97.2% White, 0.2% African American, 0.2% Native American, 0.2% Asian, 0.2% from other races, and 1.9% from two or more races. Hispanic or Latino of any race were 1.2% of the population.
There were 717 households, out of which 28.2% had children under the age of 18 living with them, 48.2% were married couples living together, 11.2% had a female householder with no husband present, and 36.2% were non-families. 32.2% of all households were made up of individuals, and 16.2% had someone living alone who was 65 years of age or older. The average household size was 2.37 and the average family size was 2.97.
In the village, the population was spread out, with 24.2% under the age of 18, 7.2% from 18 to 24, 25.2% from 25 to 44, 24.2% from 45 to 64, and 19.2% who were 65 years of age or older. The median age was 40 years. For every 100 females, there were 91.2 males. For every 100 females age 18 and over, there were 87.2 males.
The median income for a household in the village was $37,500, and the median income for a family was $45,000. Males had a median income of $35,000 versus $22,500 for females. The per capita income for the village was $18,845. About 6.2% of families and 8.2% of the population were below the poverty line, including 10.2% of those under age 18 and 8.2% of those age 65 or over.
Common Questions
What is Per Capita Income in Sebewaing?
Per Capita income in Sebewaing is $27,515.
What is the Median Family Income in Sebewaing?
Median Family Income in Sebewaing is $56,477.
What is the Median Household income in Sebewaing?
Median Household Income in Sebewaing is $44,441.
What is Income or Wage Gap in Sebewaing?
Income or Wage Gap in Sebewaing is 38.6%.
Women in Sebewaing earn 61.4 cents for every dollar earned by a man.
What is Family Income Deficit in Sebewaing?
Family Income Deficit in Sebewaing is $6,700.
Families that are below poverty line in Sebewaing earn $6,700 less on average than the poverty threshold level.
What is Inequality or Gini Index in Sebewaing?
Inequality or Gini Index in Sebewaing is 0.40.
What is the Total Population of Sebewaing?
Total Population of Sebewaing is 1,951.
What is the Total Male Population of Sebewaing?
Total Male Population of Sebewaing is 960.
What is the Total Female Population of Sebewaing?
Total Female Population of Sebewaing is 991.
What is the Ratio of Males per 100 Females in Sebewaing?
There are 96.87 Males per 100 Females in Sebewaing.
What is the Ratio of Females per 100 Males in Sebewaing?
There are 103.23 Females per 100 Males in Sebewaing.
What is the Median Population Age in Sebewaing?
Median Population Age in Sebewaing is 52.0 Years.
What is the Average Family Size in Sebewaing
Average Family Size in Sebewaing is 2.9 People.
What is the Average Household Size in Sebewaing
Average Household Size in Sebewaing is 2.1 People.
How Large is the Labor Force in Sebewaing?
There are 870 People in the Labor Forcein in Sebewaing.
What is the Percentage of People in the Labor Force in Sebewaing?
53.6% of People are in the Labor Force in Sebewaing.
What is the Unemployment Rate in Sebewaing?
Unemployment Rate in Sebewaing is 8.6%.