Schoolcraft, MI Map & Demographics
Schoolcraft Map
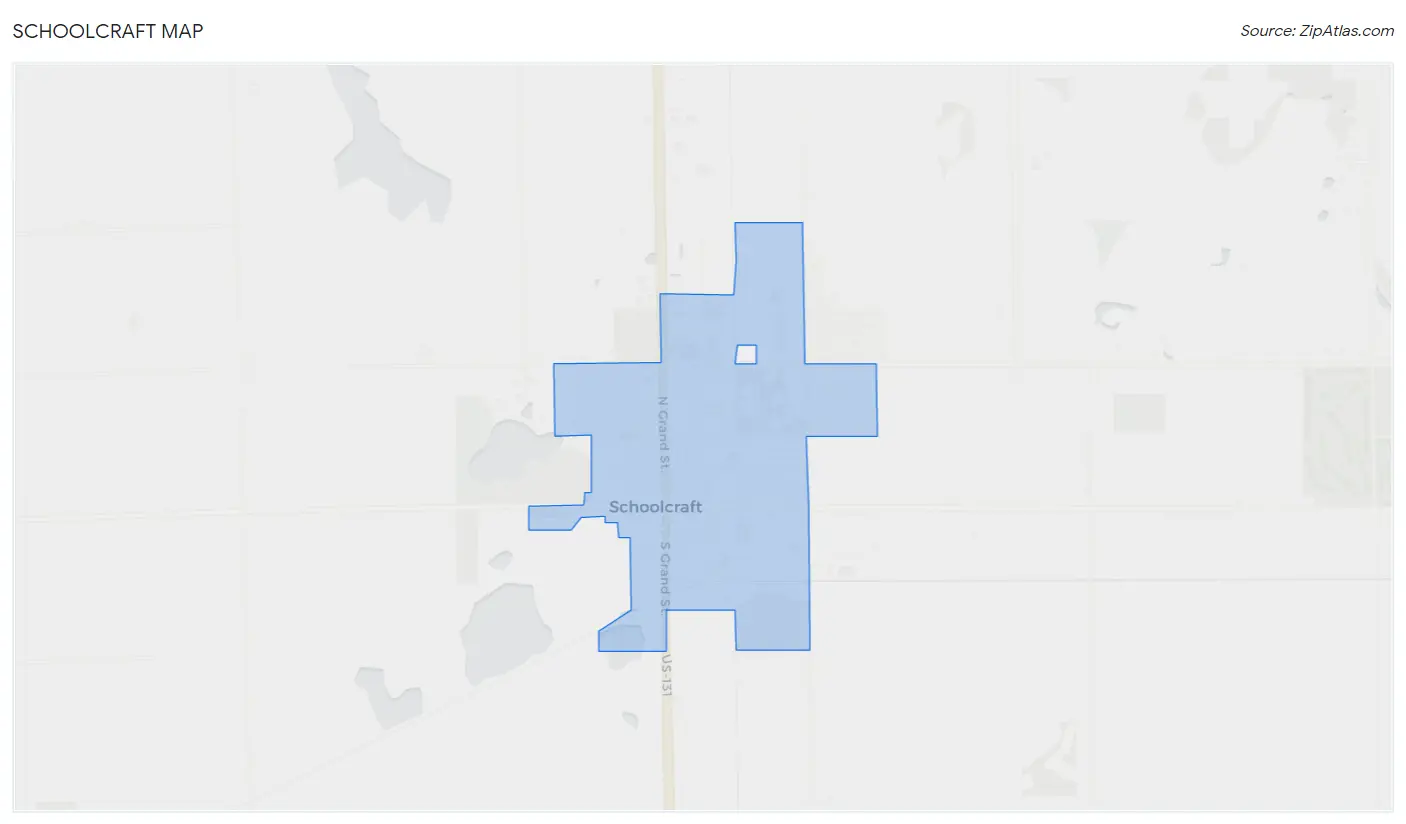
Schoolcraft Overview
$34,545
PER CAPITA INCOME
$102,917
AVG FAMILY INCOME
$82,500
AVG HOUSEHOLD INCOME
33.8%
WAGE / INCOME GAP [ % ]
66.2¢/ $1
WAGE / INCOME GAP [ $ ]
$11,780
FAMILY INCOME DEFICIT
0.38
INEQUALITY / GINI INDEX
1,409
TOTAL POPULATION
779
MALE POPULATION
630
FEMALE POPULATION
123.65
MALES / 100 FEMALES
80.87
FEMALES / 100 MALES
34.5
MEDIAN AGE
3.4
AVG FAMILY SIZE
2.6
AVG HOUSEHOLD SIZE
788
LABOR FORCE [ PEOPLE ]
75.7%
PERCENT IN LABOR FORCE
1.9%
UNEMPLOYMENT RATE
Schoolcraft Zip Codes
Schoolcraft Area Codes
Income in Schoolcraft
Income Overview in Schoolcraft
Per Capita Income in Schoolcraft is $34,545, while median incomes of families and households are $102,917 and $82,500 respectively.
| Characteristic | Number | Measure |
| Per Capita Income | 1,409 | $34,545 |
| Median Family Income | 334 | $102,917 |
| Mean Family Income | 334 | $108,271 |
| Median Household Income | 546 | $82,500 |
| Mean Household Income | 546 | $89,589 |
| Income Deficit | 334 | $11,780 |
| Wage / Income Gap (%) | 1,409 | 33.75% |
| Wage / Income Gap ($) | 1,409 | 66.25¢ per $1 |
| Gini / Inequality Index | 1,409 | 0.38 |
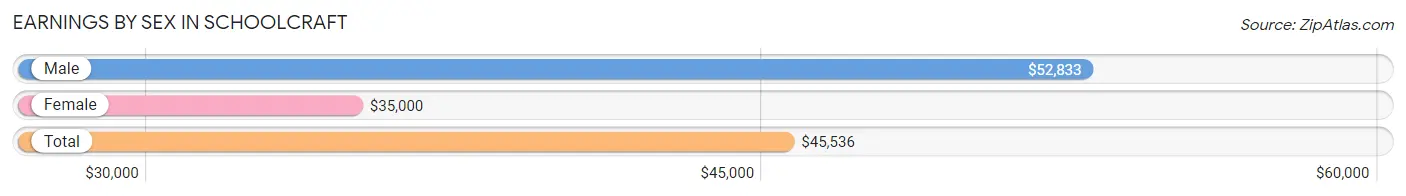
Earnings by Sex in Schoolcraft
Average Earnings in Schoolcraft are $45,536, $52,833 for men and $35,000 for women, a difference of 33.8%.
| Sex | Number | Average Earnings |
| Male | 478 (58.2%) | $52,833 |
| Female | 344 (41.8%) | $35,000 |
| Total | 822 (100.0%) | $45,536 |
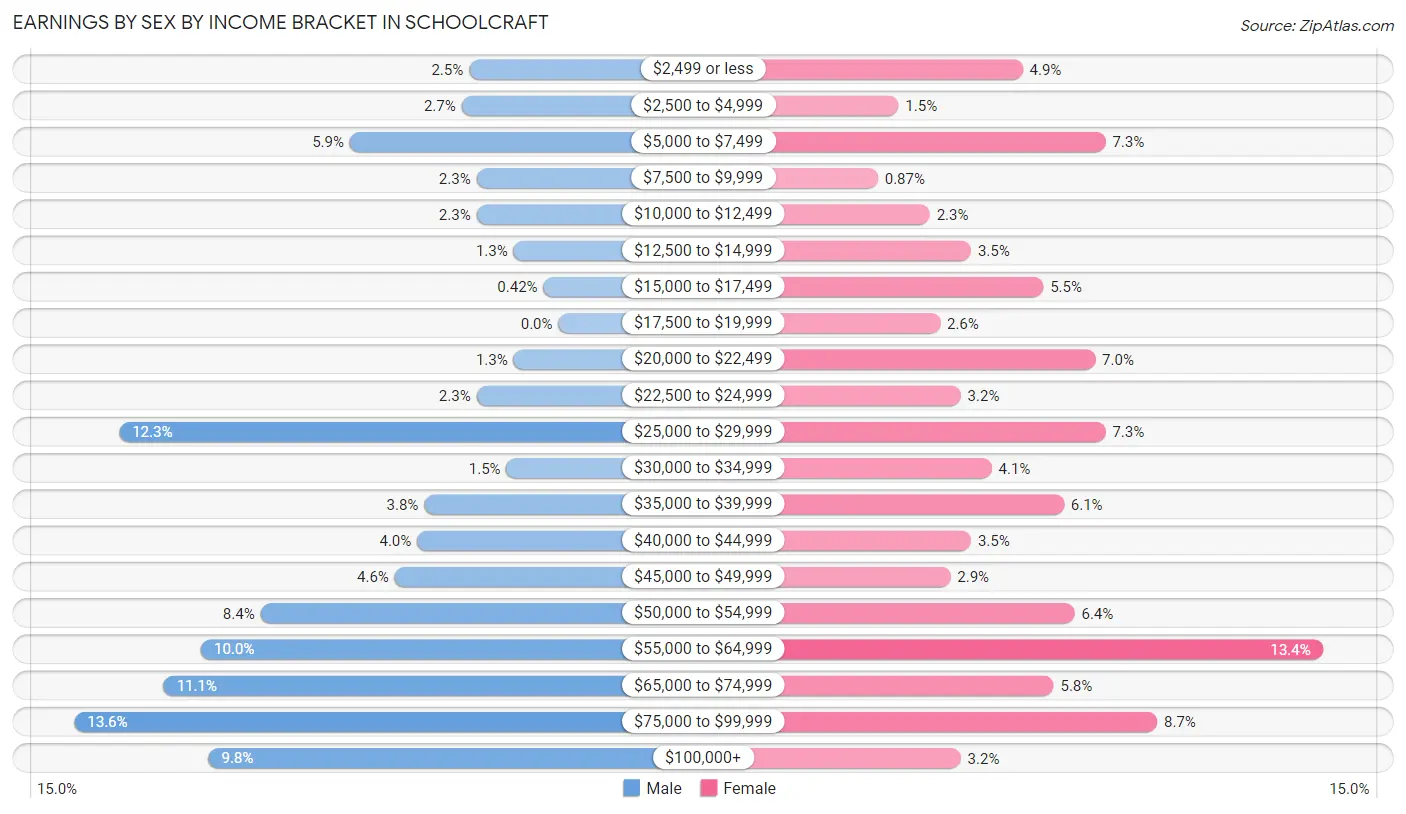
Earnings by Sex by Income Bracket in Schoolcraft
The most common earnings brackets in Schoolcraft are $75,000 to $99,999 for men (65 | 13.6%) and $55,000 to $64,999 for women (46 | 13.4%).
| Income | Male | Female |
| $2,499 or less | 12 (2.5%) | 17 (4.9%) |
| $2,500 to $4,999 | 13 (2.7%) | 5 (1.5%) |
| $5,000 to $7,499 | 28 (5.9%) | 25 (7.3%) |
| $7,500 to $9,999 | 11 (2.3%) | 3 (0.9%) |
| $10,000 to $12,499 | 11 (2.3%) | 8 (2.3%) |
| $12,500 to $14,999 | 6 (1.3%) | 12 (3.5%) |
| $15,000 to $17,499 | 2 (0.4%) | 19 (5.5%) |
| $17,500 to $19,999 | 0 (0.0%) | 9 (2.6%) |
| $20,000 to $22,499 | 6 (1.3%) | 24 (7.0%) |
| $22,500 to $24,999 | 11 (2.3%) | 11 (3.2%) |
| $25,000 to $29,999 | 59 (12.3%) | 25 (7.3%) |
| $30,000 to $34,999 | 7 (1.5%) | 14 (4.1%) |
| $35,000 to $39,999 | 18 (3.8%) | 21 (6.1%) |
| $40,000 to $44,999 | 19 (4.0%) | 12 (3.5%) |
| $45,000 to $49,999 | 22 (4.6%) | 10 (2.9%) |
| $50,000 to $54,999 | 40 (8.4%) | 22 (6.4%) |
| $55,000 to $64,999 | 48 (10.0%) | 46 (13.4%) |
| $65,000 to $74,999 | 53 (11.1%) | 20 (5.8%) |
| $75,000 to $99,999 | 65 (13.6%) | 30 (8.7%) |
| $100,000+ | 47 (9.8%) | 11 (3.2%) |
| Total | 478 (100.0%) | 344 (100.0%) |
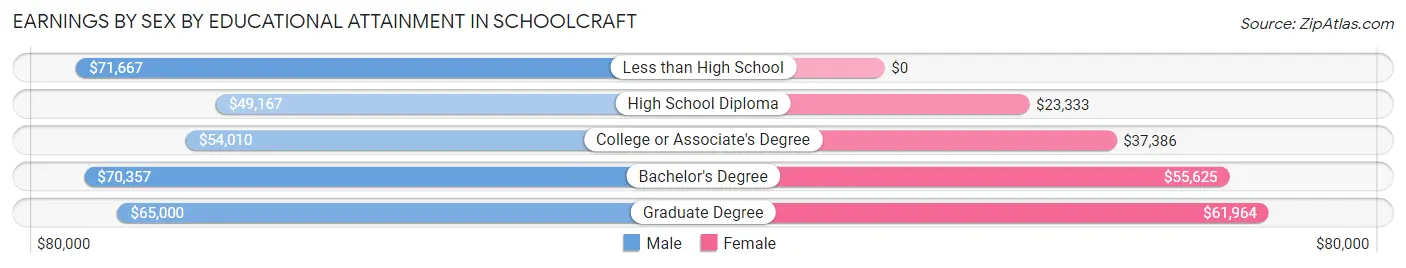
Earnings by Sex by Educational Attainment in Schoolcraft
Average earnings in Schoolcraft are $62,610 for men and $39,750 for women, a difference of 36.5%. Men with an educational attainment of less than high school enjoy the highest average annual earnings of $71,667, while those with high school diploma education earn the least with $49,167. Women with an educational attainment of graduate degree earn the most with the average annual earnings of $61,964, while those with high school diploma education have the smallest earnings of $23,333.
| Educational Attainment | Male Income | Female Income |
| Less than High School | $71,667 | $0 |
| High School Diploma | $49,167 | $23,333 |
| College or Associate's Degree | $54,010 | $37,386 |
| Bachelor's Degree | $70,357 | $55,625 |
| Graduate Degree | $65,000 | $61,964 |
| Total | $62,610 | $39,750 |
Family Income in Schoolcraft
Family Income Brackets in Schoolcraft
According to the Schoolcraft family income data, there are 104 families falling into the $100,000 to $149,999 income range, which is the most common income bracket and makes up 31.1% of all families.
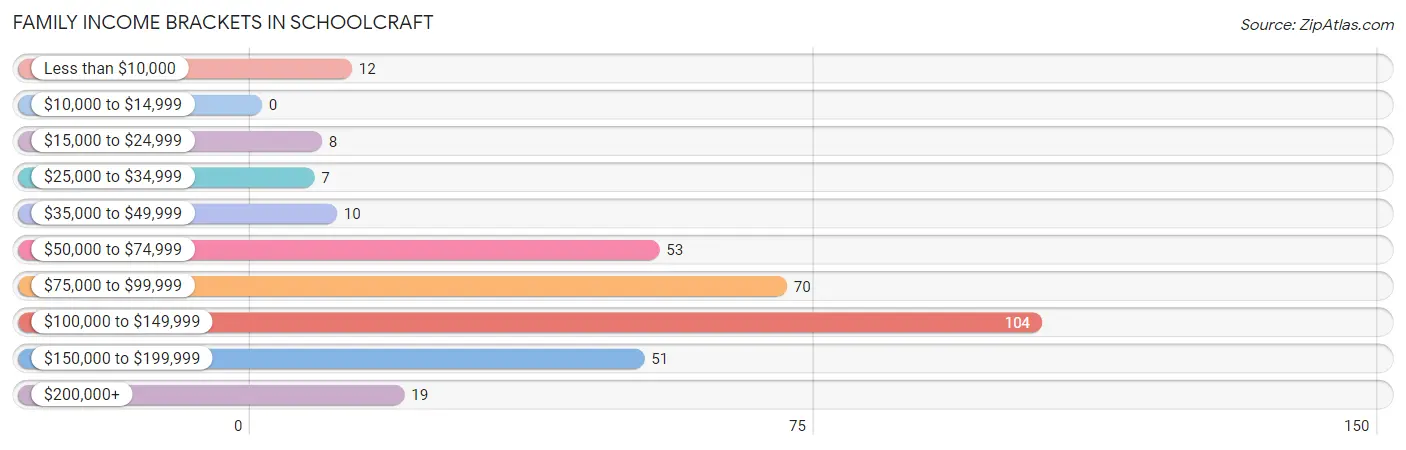
| Income Bracket | # Families | % Families |
| Less than $10,000 | 12 | 3.6% |
| $10,000 to $14,999 | 0 | 0.0% |
| $15,000 to $24,999 | 8 | 2.4% |
| $25,000 to $34,999 | 7 | 2.1% |
| $35,000 to $49,999 | 10 | 3.0% |
| $50,000 to $74,999 | 53 | 15.9% |
| $75,000 to $99,999 | 70 | 21.0% |
| $100,000 to $149,999 | 104 | 31.1% |
| $150,000 to $199,999 | 51 | 15.3% |
| $200,000+ | 19 | 5.7% |
Family Income by Famaliy Size in Schoolcraft
5-person families (46 | 13.8%) account for the highest median family income in Schoolcraft with $150,500 per family, while 2-person families (106 | 31.7%) have the highest median income of $47,812 per family member.
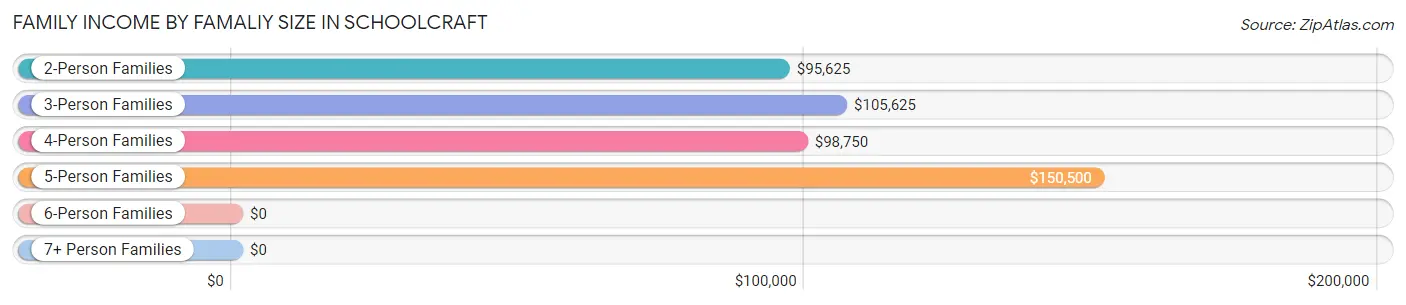
| Income Bracket | # Families | Median Income |
| 2-Person Families | 106 (31.7%) | $95,625 |
| 3-Person Families | 101 (30.2%) | $105,625 |
| 4-Person Families | 68 (20.4%) | $98,750 |
| 5-Person Families | 46 (13.8%) | $150,500 |
| 6-Person Families | 13 (3.9%) | $0 |
| 7+ Person Families | 0 (0.0%) | $0 |
| Total | 334 (100.0%) | $102,917 |
Family Income by Number of Earners in Schoolcraft
The median family income in Schoolcraft is $102,917, with families comprising 3+ earners (64) having the highest median family income of $148,333, while families with no earners (12) have the lowest median family income of $71,250, accounting for 19.2% and 3.6% of families, respectively.
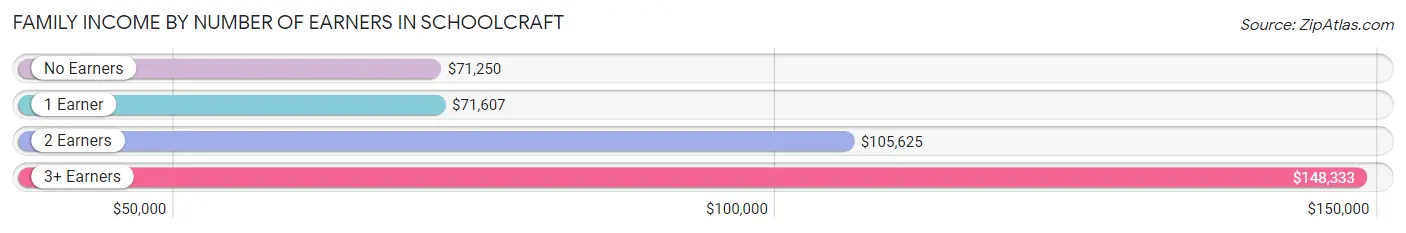
| Number of Earners | # Families | Median Income |
| No Earners | 12 (3.6%) | $71,250 |
| 1 Earner | 93 (27.8%) | $71,607 |
| 2 Earners | 165 (49.4%) | $105,625 |
| 3+ Earners | 64 (19.2%) | $148,333 |
| Total | 334 (100.0%) | $102,917 |
Household Income in Schoolcraft
Household Income Brackets in Schoolcraft
With 130 households falling in the category, the $100,000 to $149,999 income range is the most frequent in Schoolcraft, accounting for 23.8% of all households. In contrast, only 17 households (3.1%) fall into the less than $10,000 income bracket, making it the least populous group.
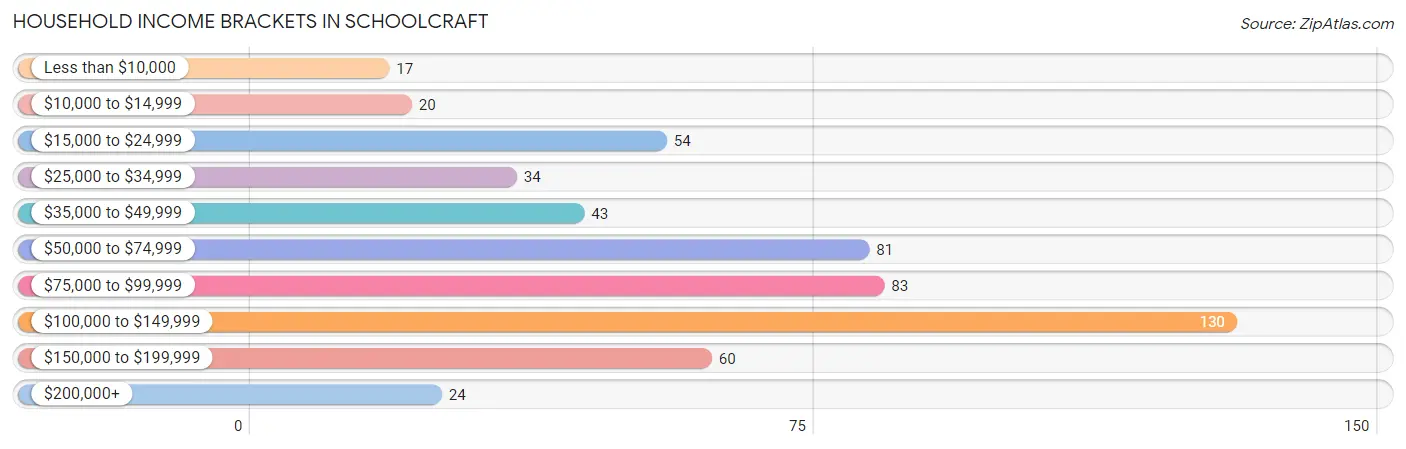
| Income Bracket | # Households | % Households |
| Less than $10,000 | 17 | 3.1% |
| $10,000 to $14,999 | 20 | 3.7% |
| $15,000 to $24,999 | 54 | 9.9% |
| $25,000 to $34,999 | 34 | 6.2% |
| $35,000 to $49,999 | 43 | 7.9% |
| $50,000 to $74,999 | 81 | 14.8% |
| $75,000 to $99,999 | 83 | 15.2% |
| $100,000 to $149,999 | 130 | 23.8% |
| $150,000 to $199,999 | 60 | 11.0% |
| $200,000+ | 24 | 4.4% |
Household Income by Householder Age in Schoolcraft
The median household income in Schoolcraft is $82,500, with the highest median household income of $95,625 found in the 45 to 64 years age bracket for the primary householder. A total of 185 households (33.9%) fall into this category.
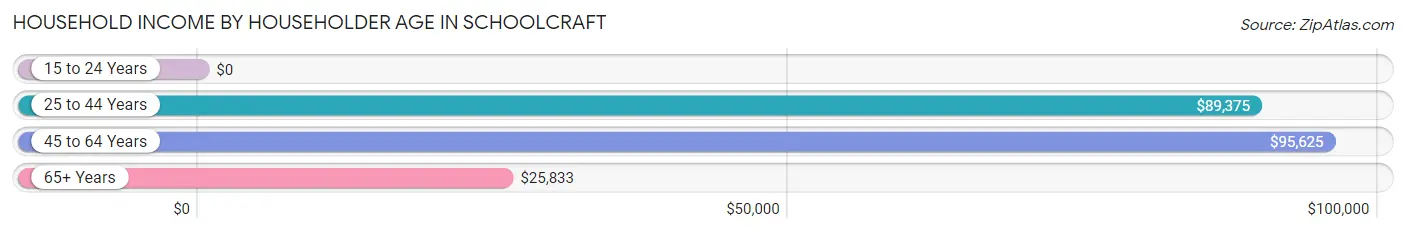
| Income Bracket | # Households | Median Income |
| 15 to 24 Years | 0 (0.0%) | $0 |
| 25 to 44 Years | 237 (43.4%) | $89,375 |
| 45 to 64 Years | 185 (33.9%) | $95,625 |
| 65+ Years | 124 (22.7%) | $25,833 |
| Total | 546 (100.0%) | $82,500 |
Poverty in Schoolcraft
Income Below Poverty by Sex and Age in Schoolcraft
With 6.6% poverty level for males and 10.4% for females among the residents of Schoolcraft, 15 year old males and 5 year old females are the most vulnerable to poverty, with 5 males (33.3%) and 3 females (42.9%) in their respective age groups living below the poverty level.
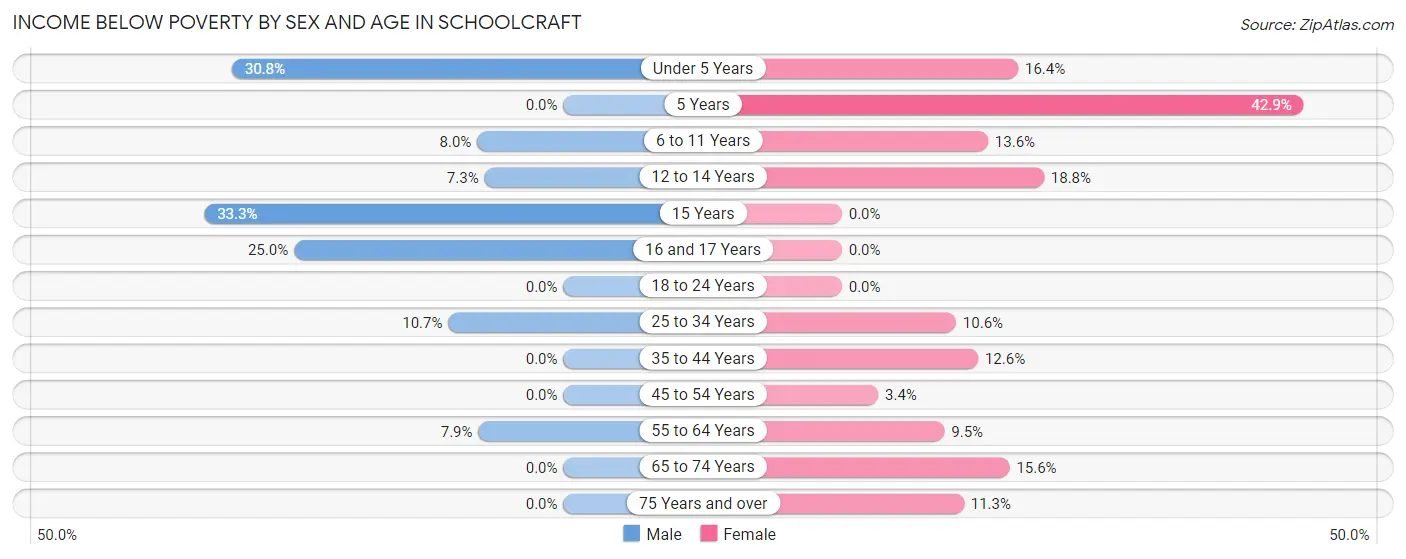
| Age Bracket | Male | Female |
| Under 5 Years | 12 (30.8%) | 9 (16.4%) |
| 5 Years | 0 (0.0%) | 3 (42.9%) |
| 6 to 11 Years | 6 (8.0%) | 8 (13.6%) |
| 12 to 14 Years | 6 (7.3%) | 3 (18.8%) |
| 15 Years | 5 (33.3%) | 0 (0.0%) |
| 16 and 17 Years | 5 (25.0%) | 0 (0.0%) |
| 18 to 24 Years | 0 (0.0%) | 0 (0.0%) |
| 25 to 34 Years | 11 (10.7%) | 9 (10.6%) |
| 35 to 44 Years | 0 (0.0%) | 11 (12.6%) |
| 45 to 54 Years | 0 (0.0%) | 3 (3.4%) |
| 55 to 64 Years | 6 (7.9%) | 6 (9.5%) |
| 65 to 74 Years | 0 (0.0%) | 7 (15.6%) |
| 75 Years and over | 0 (0.0%) | 6 (11.3%) |
| Total | 51 (6.6%) | 65 (10.4%) |
Income Above Poverty by Sex and Age in Schoolcraft
According to the poverty statistics in Schoolcraft, males aged 5 years and females aged 15 years are the age groups that are most secure financially, with 100.0% of males and 100.0% of females in these age groups living above the poverty line.
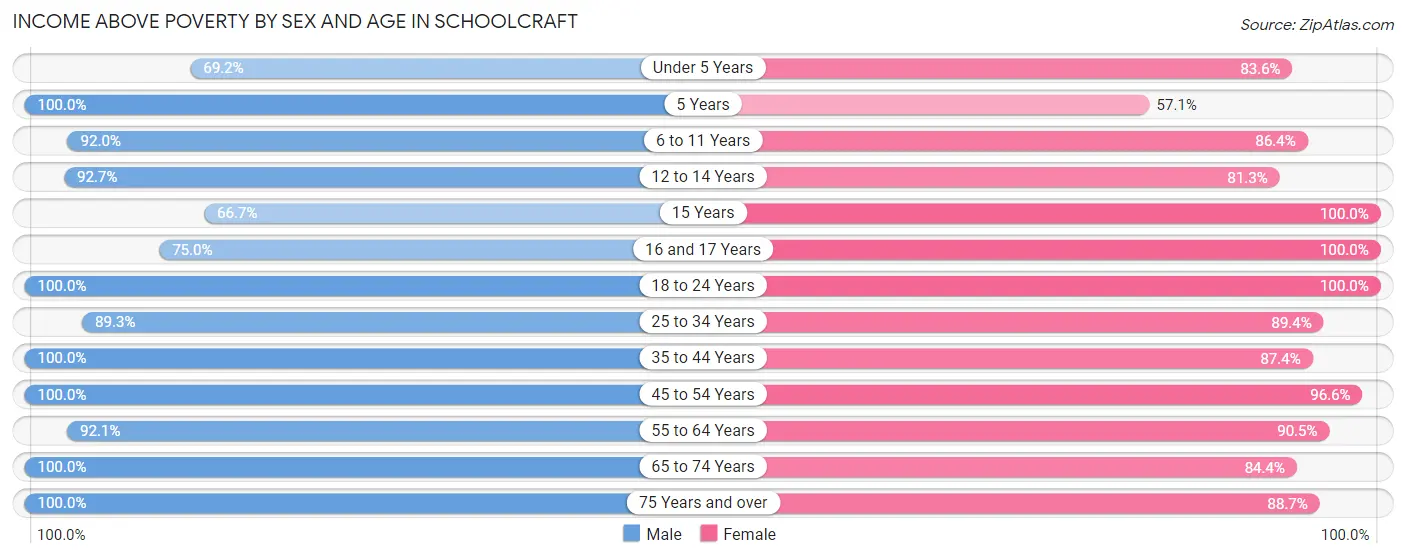
| Age Bracket | Male | Female |
| Under 5 Years | 27 (69.2%) | 46 (83.6%) |
| 5 Years | 6 (100.0%) | 4 (57.1%) |
| 6 to 11 Years | 69 (92.0%) | 51 (86.4%) |
| 12 to 14 Years | 76 (92.7%) | 13 (81.2%) |
| 15 Years | 10 (66.7%) | 4 (100.0%) |
| 16 and 17 Years | 15 (75.0%) | 13 (100.0%) |
| 18 to 24 Years | 73 (100.0%) | 51 (100.0%) |
| 25 to 34 Years | 92 (89.3%) | 76 (89.4%) |
| 35 to 44 Years | 136 (100.0%) | 76 (87.4%) |
| 45 to 54 Years | 87 (100.0%) | 86 (96.6%) |
| 55 to 64 Years | 70 (92.1%) | 57 (90.5%) |
| 65 to 74 Years | 48 (100.0%) | 38 (84.4%) |
| 75 Years and over | 12 (100.0%) | 47 (88.7%) |
| Total | 721 (93.4%) | 562 (89.6%) |
Income Below Poverty Among Married-Couple Families in Schoolcraft
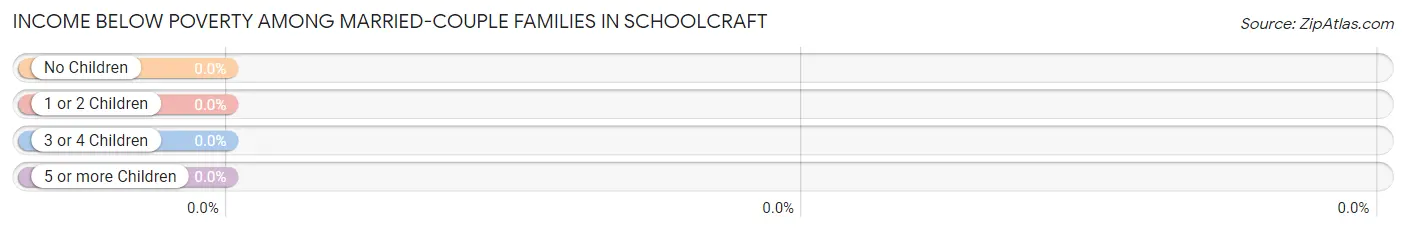
| Children | Above Poverty | Below Poverty |
| No Children | 140 (100.0%) | 0 (0.0%) |
| 1 or 2 Children | 96 (100.0%) | 0 (0.0%) |
| 3 or 4 Children | 40 (100.0%) | 0 (0.0%) |
| 5 or more Children | 0 (0.0%) | 0 (0.0%) |
| Total | 276 (100.0%) | 0 (0.0%) |
Income Below Poverty Among Single-Parent Households in Schoolcraft
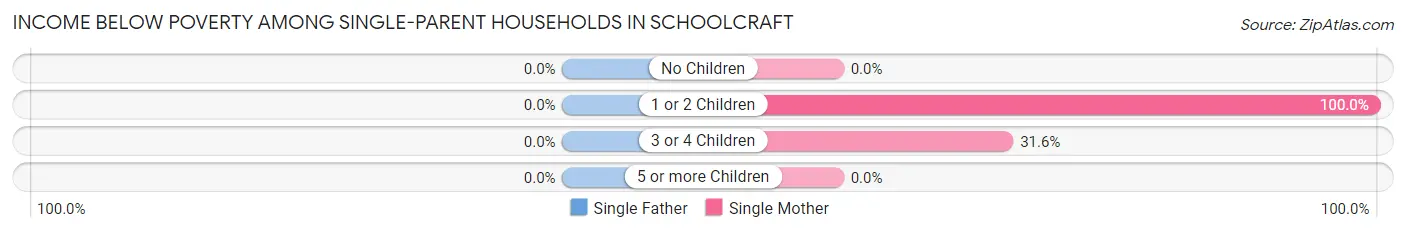
| Children | Single Father | Single Mother |
| No Children | 0 (0.0%) | 0 (0.0%) |
| 1 or 2 Children | 0 (0.0%) | 14 (100.0%) |
| 3 or 4 Children | 0 (0.0%) | 6 (31.6%) |
| 5 or more Children | 0 (0.0%) | 0 (0.0%) |
| Total | 0 (0.0%) | 20 (60.6%) |
Income Below Poverty Among Married-Couple vs Single-Parent Households in Schoolcraft
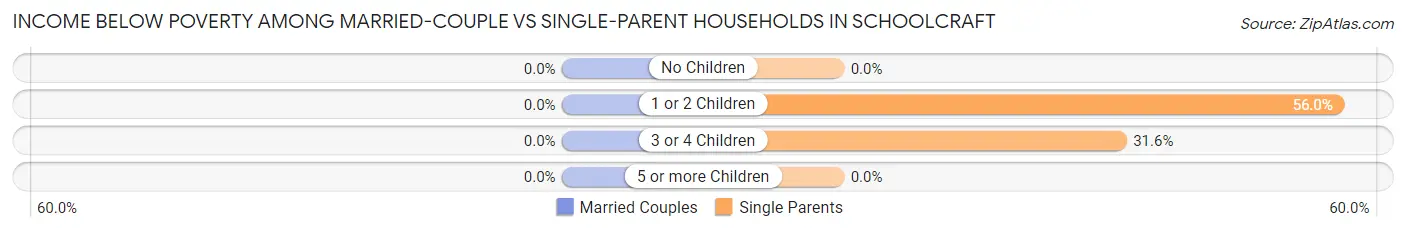
| Children | Married-Couple Families | Single-Parent Households |
| No Children | 0 (0.0%) | 0 (0.0%) |
| 1 or 2 Children | 0 (0.0%) | 14 (56.0%) |
| 3 or 4 Children | 0 (0.0%) | 6 (31.6%) |
| 5 or more Children | 0 (0.0%) | 0 (0.0%) |
| Total | 0 (0.0%) | 20 (34.5%) |
Race in Schoolcraft
The most populous races in Schoolcraft are White / Caucasian (1,337 | 94.9%), Two or more Races (36 | 2.6%), and Hispanic or Latino (23 | 1.6%).
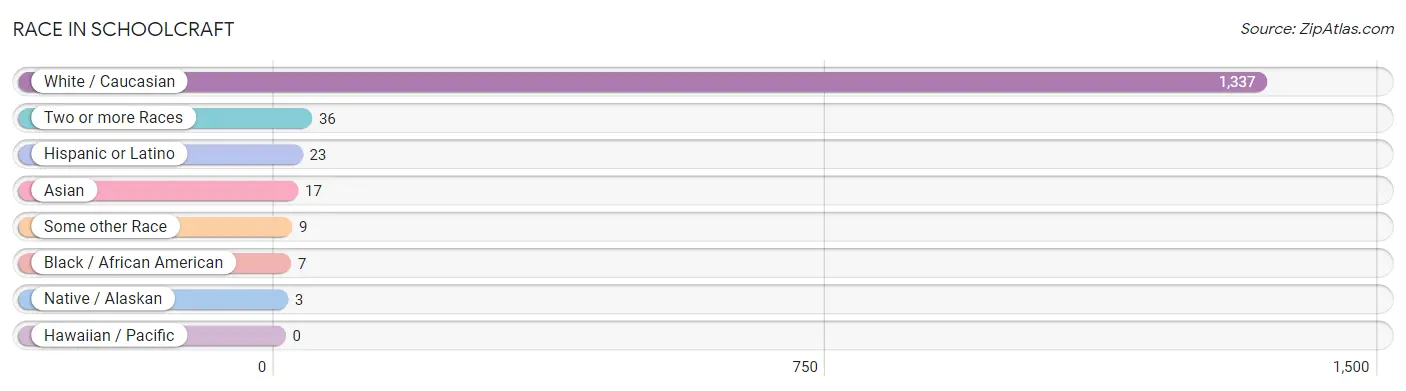
| Race | # Population | % Population |
| Asian | 17 | 1.2% |
| Black / African American | 7 | 0.5% |
| Hawaiian / Pacific | 0 | 0.0% |
| Hispanic or Latino | 23 | 1.6% |
| Native / Alaskan | 3 | 0.2% |
| White / Caucasian | 1,337 | 94.9% |
| Two or more Races | 36 | 2.6% |
| Some other Race | 9 | 0.6% |
| Total | 1,409 | 100.0% |
Ancestry in Schoolcraft
The most populous ancestries reported in Schoolcraft are English (280 | 19.9%), German (262 | 18.6%), Dutch (180 | 12.8%), Irish (166 | 11.8%), and American (134 | 9.5%), together accounting for 72.5% of all Schoolcraft residents.
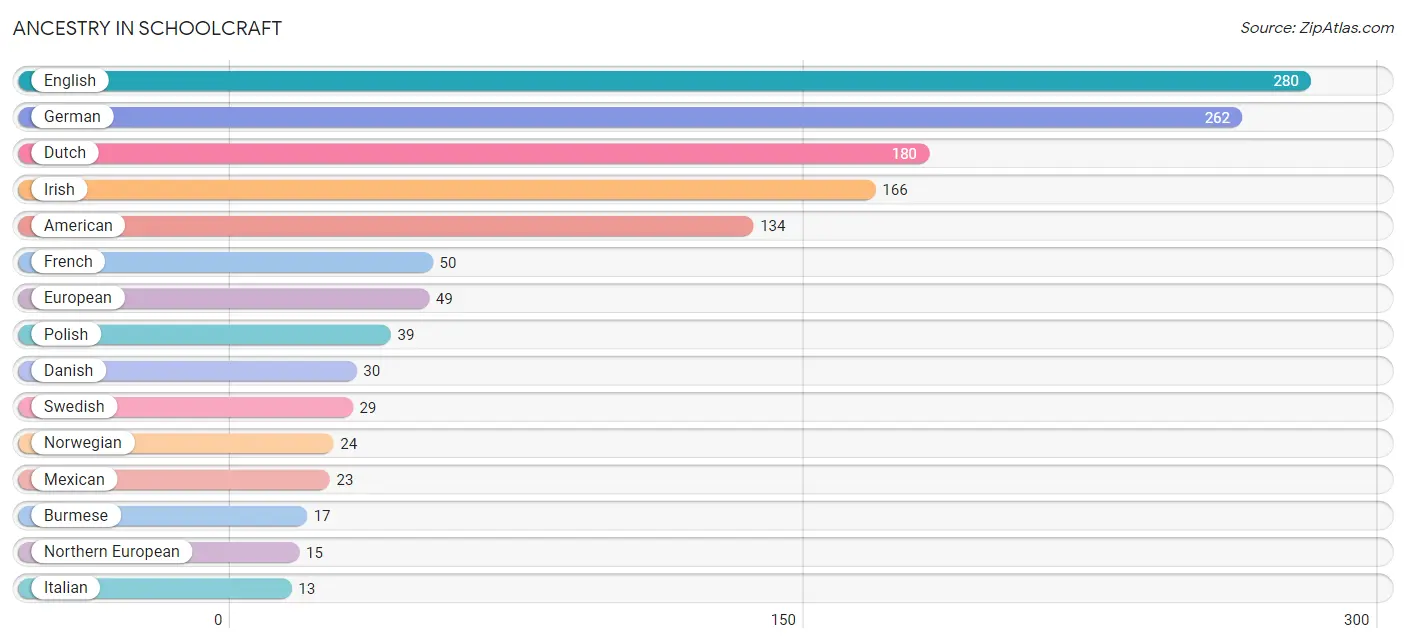
| Ancestry | # Population | % Population |
| American | 134 | 9.5% |
| Apache | 12 | 0.9% |
| Belgian | 2 | 0.1% |
| British | 5 | 0.4% |
| Burmese | 17 | 1.2% |
| Danish | 30 | 2.1% |
| Dutch | 180 | 12.8% |
| English | 280 | 19.9% |
| European | 49 | 3.5% |
| Finnish | 8 | 0.6% |
| French | 50 | 3.5% |
| French Canadian | 4 | 0.3% |
| German | 262 | 18.6% |
| Greek | 12 | 0.9% |
| Hungarian | 12 | 0.9% |
| Irish | 166 | 11.8% |
| Italian | 13 | 0.9% |
| Lithuanian | 12 | 0.9% |
| Mexican | 23 | 1.6% |
| Northern European | 15 | 1.1% |
| Norwegian | 24 | 1.7% |
| Polish | 39 | 2.8% |
| Scotch-Irish | 8 | 0.6% |
| Scottish | 6 | 0.4% |
| Slavic | 3 | 0.2% |
| Slovak | 2 | 0.1% |
| Swedish | 29 | 2.1% | View All 27 Rows |
Immigrants in Schoolcraft
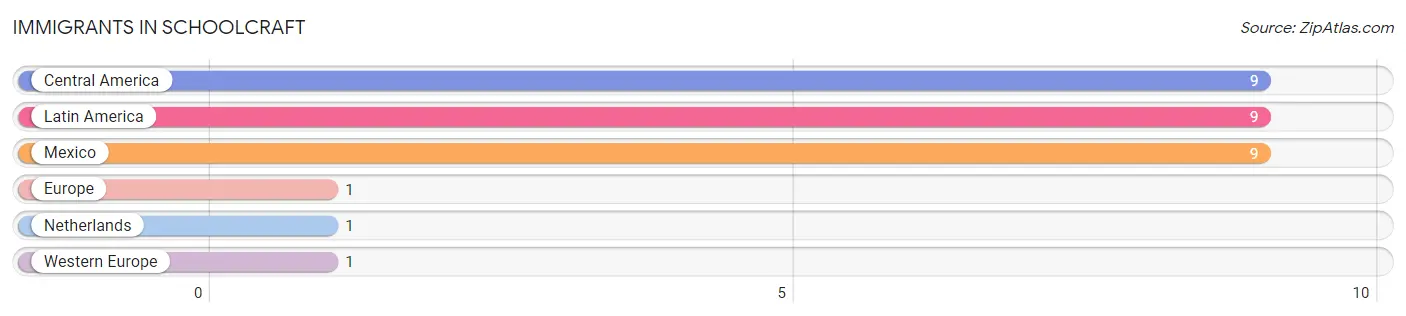
The most numerous immigrant groups reported in Schoolcraft came from Central America (9 | 0.6%), Latin America (9 | 0.6%), Mexico (9 | 0.6%), Europe (1 | 0.1%), and Netherlands (1 | 0.1%), together accounting for 2.1% of all Schoolcraft residents.
| Immigration Origin | # Population | % Population |
| Central America | 9 | 0.6% |
| Europe | 1 | 0.1% |
| Latin America | 9 | 0.6% |
| Mexico | 9 | 0.6% |
| Netherlands | 1 | 0.1% |
| Western Europe | 1 | 0.1% | View All 6 Rows |
Sex and Age in Schoolcraft
Sex and Age in Schoolcraft
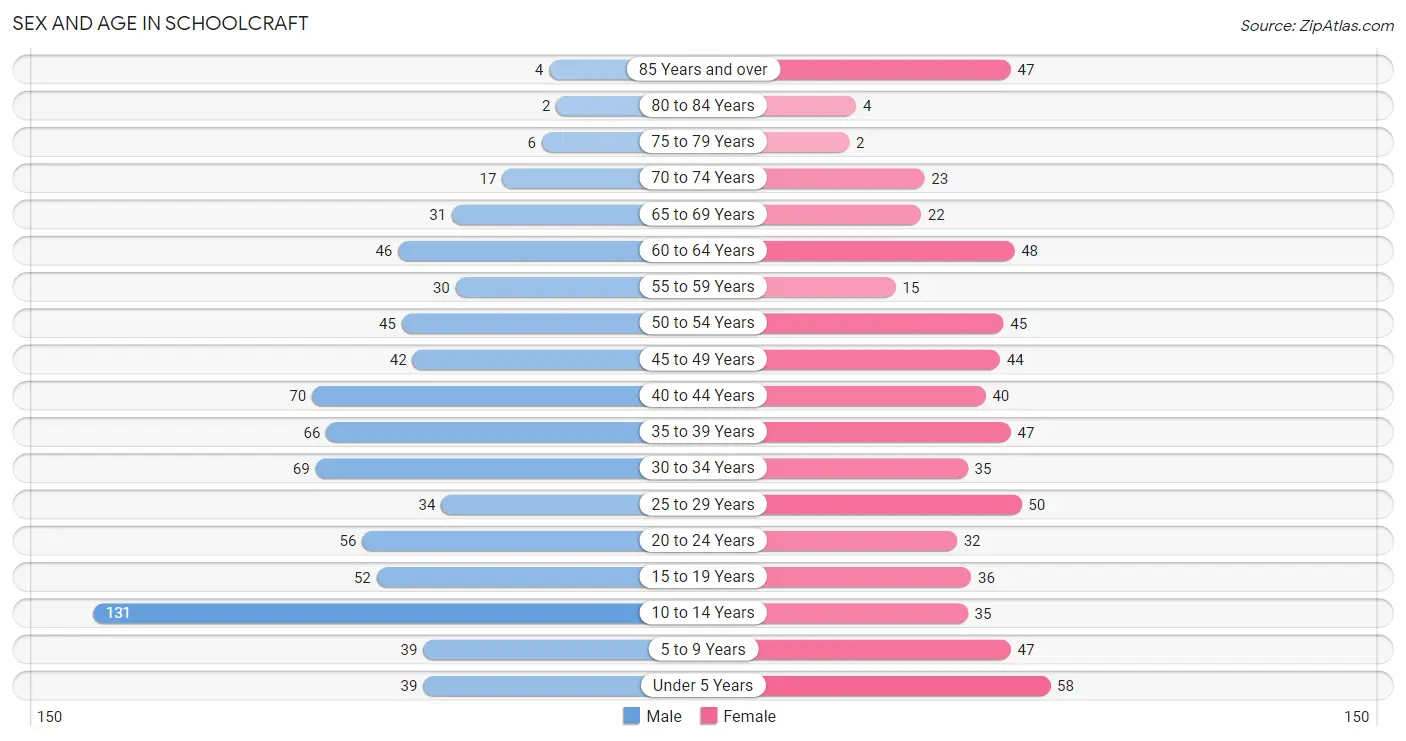
The most populous age groups in Schoolcraft are 10 to 14 Years (131 | 16.8%) for men and Under 5 Years (58 | 9.2%) for women.
| Age Bracket | Male | Female |
| Under 5 Years | 39 (5.0%) | 58 (9.2%) |
| 5 to 9 Years | 39 (5.0%) | 47 (7.5%) |
| 10 to 14 Years | 131 (16.8%) | 35 (5.6%) |
| 15 to 19 Years | 52 (6.7%) | 36 (5.7%) |
| 20 to 24 Years | 56 (7.2%) | 32 (5.1%) |
| 25 to 29 Years | 34 (4.4%) | 50 (7.9%) |
| 30 to 34 Years | 69 (8.9%) | 35 (5.6%) |
| 35 to 39 Years | 66 (8.5%) | 47 (7.5%) |
| 40 to 44 Years | 70 (9.0%) | 40 (6.4%) |
| 45 to 49 Years | 42 (5.4%) | 44 (7.0%) |
| 50 to 54 Years | 45 (5.8%) | 45 (7.1%) |
| 55 to 59 Years | 30 (3.8%) | 15 (2.4%) |
| 60 to 64 Years | 46 (5.9%) | 48 (7.6%) |
| 65 to 69 Years | 31 (4.0%) | 22 (3.5%) |
| 70 to 74 Years | 17 (2.2%) | 23 (3.6%) |
| 75 to 79 Years | 6 (0.8%) | 2 (0.3%) |
| 80 to 84 Years | 2 (0.3%) | 4 (0.6%) |
| 85 Years and over | 4 (0.5%) | 47 (7.5%) |
| Total | 779 (100.0%) | 630 (100.0%) |
Families and Households in Schoolcraft
Median Family Size in Schoolcraft
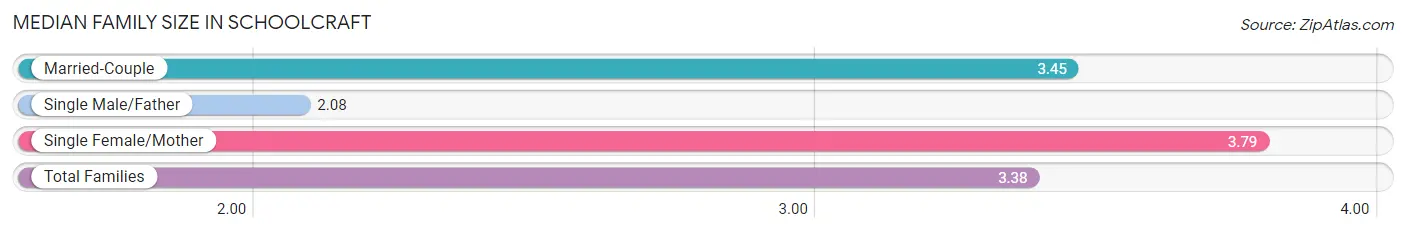
The median family size in Schoolcraft is 3.38 persons per family, with single female/mother families (33 | 9.9%) accounting for the largest median family size of 3.79 persons per family. On the other hand, single male/father families (25 | 7.5%) represent the smallest median family size with 2.08 persons per family.
| Family Type | # Families | Family Size |
| Married-Couple | 276 (82.6%) | 3.45 |
| Single Male/Father | 25 (7.5%) | 2.08 |
| Single Female/Mother | 33 (9.9%) | 3.79 |
| Total Families | 334 (100.0%) | 3.38 |
Median Household Size in Schoolcraft
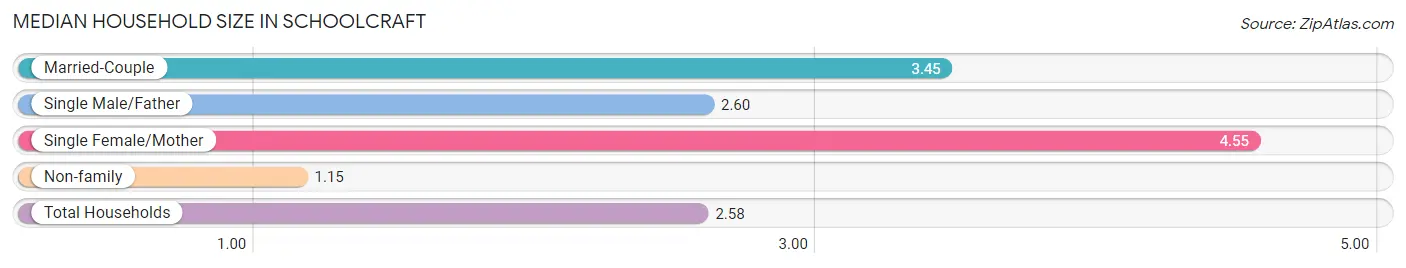
The median household size in Schoolcraft is 2.58 persons per household, with single female/mother households (33 | 6.0%) accounting for the largest median household size of 4.55 persons per household. non-family households (212 | 38.8%) represent the smallest median household size with 1.15 persons per household.
| Household Type | # Households | Household Size |
| Married-Couple | 276 (50.5%) | 3.45 |
| Single Male/Father | 25 (4.6%) | 2.60 |
| Single Female/Mother | 33 (6.0%) | 4.55 |
| Non-family | 212 (38.8%) | 1.15 |
| Total Households | 546 (100.0%) | 2.58 |
Household Size by Marriage Status in Schoolcraft
Out of a total of 546 households in Schoolcraft, 334 (61.2%) are family households, while 212 (38.8%) are nonfamily households. The most numerous type of family households are 2-person households, comprising 103, and the most common type of nonfamily households are 1-person households, comprising 176.
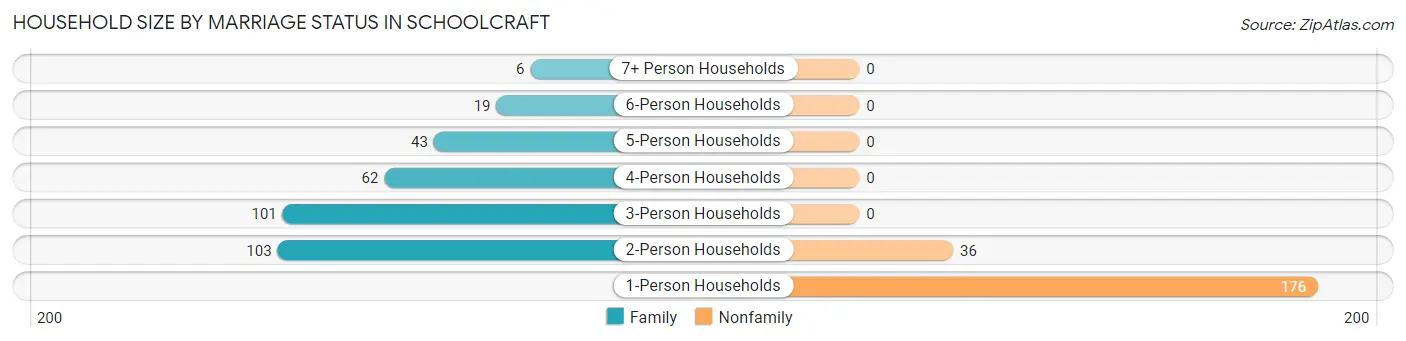
| Household Size | Family Households | Nonfamily Households |
| 1-Person Households | - | 176 (32.2%) |
| 2-Person Households | 103 (18.9%) | 36 (6.6%) |
| 3-Person Households | 101 (18.5%) | 0 (0.0%) |
| 4-Person Households | 62 (11.4%) | 0 (0.0%) |
| 5-Person Households | 43 (7.9%) | 0 (0.0%) |
| 6-Person Households | 19 (3.5%) | 0 (0.0%) |
| 7+ Person Households | 6 (1.1%) | 0 (0.0%) |
| Total | 334 (61.2%) | 212 (38.8%) |
Female Fertility in Schoolcraft
Fertility by Age in Schoolcraft
Average fertility rate in Schoolcraft is 83.0 births per 1,000 women. Women in the age bracket of 20 to 34 years have the highest fertility rate with 171.0 births per 1,000 women. Women in the age bracket of 20 to 34 years acount for 80.0% of all women with births.

| Age Bracket | Women with Births | Births / 1,000 Women |
| 15 to 19 years | 0 (0.0%) | 0.0 |
| 20 to 34 years | 20 (80.0%) | 171.0 |
| 35 to 50 years | 5 (20.0%) | 34.0 |
| Total | 25 (100.0%) | 83.0 |
Fertility by Age by Marriage Status in Schoolcraft
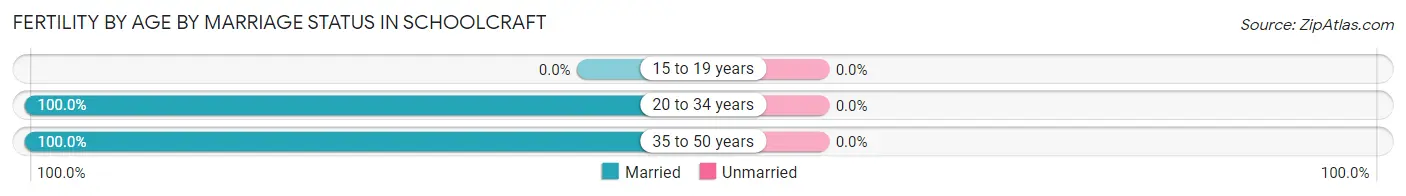
| Age Bracket | Married | Unmarried |
| 15 to 19 years | 0 (0.0%) | 0 (0.0%) |
| 20 to 34 years | 20 (100.0%) | 0 (0.0%) |
| 35 to 50 years | 5 (100.0%) | 0 (0.0%) |
| Total | 25 (100.0%) | 0 (0.0%) |
Fertility by Education in Schoolcraft
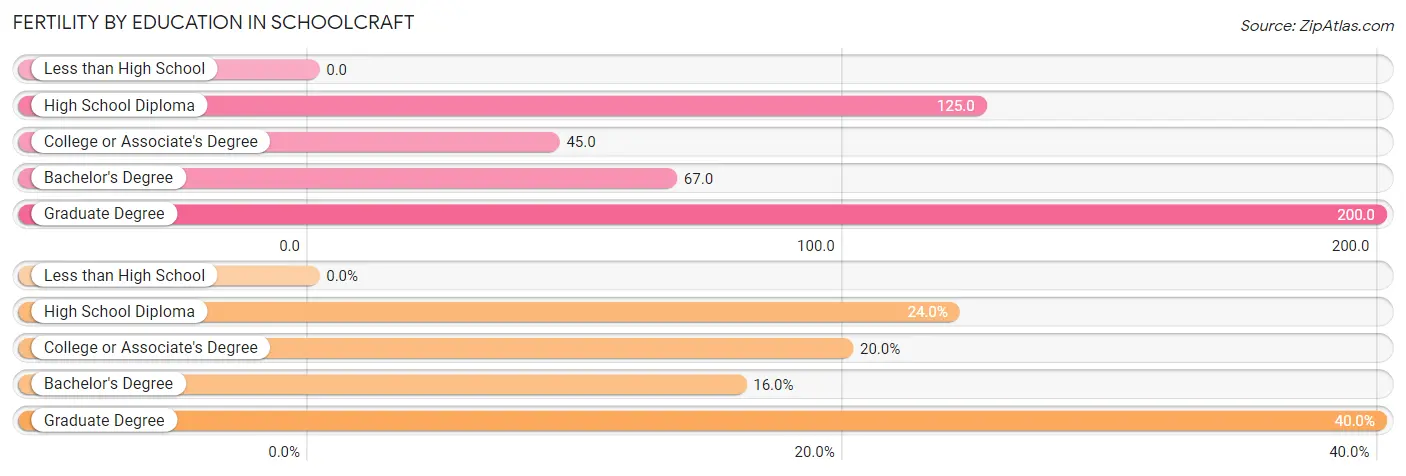
| Educational Attainment | Women with Births | Births / 1,000 Women |
| Less than High School | 0 (0.0%) | 0.0 |
| High School Diploma | 6 (24.0%) | 125.0 |
| College or Associate's Degree | 5 (20.0%) | 45.0 |
| Bachelor's Degree | 4 (16.0%) | 67.0 |
| Graduate Degree | 10 (40.0%) | 200.0 |
| Total | 25 (100.0%) | 83.0 |
Fertility by Education by Marriage Status in Schoolcraft
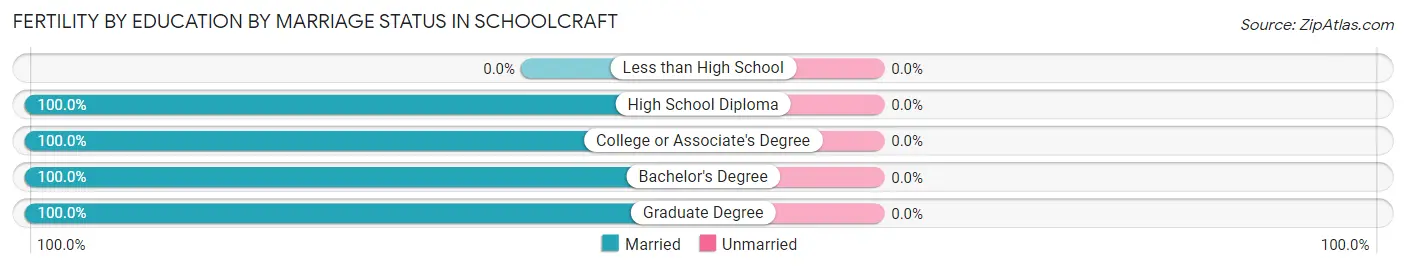
| Educational Attainment | Married | Unmarried |
| Less than High School | 0 (0.0%) | 0 (0.0%) |
| High School Diploma | 6 (100.0%) | 0 (0.0%) |
| College or Associate's Degree | 5 (100.0%) | 0 (0.0%) |
| Bachelor's Degree | 4 (100.0%) | 0 (0.0%) |
| Graduate Degree | 10 (100.0%) | 0 (0.0%) |
| Total | 25 (100.0%) | 0 (0.0%) |
Employment Characteristics in Schoolcraft
Employment by Class of Employer in Schoolcraft
Among the 761 employed individuals in Schoolcraft, private company employees (579 | 76.1%), local government employees (68 | 8.9%), and not-for-profit organizations (49 | 6.4%) make up the most common classes of employment.
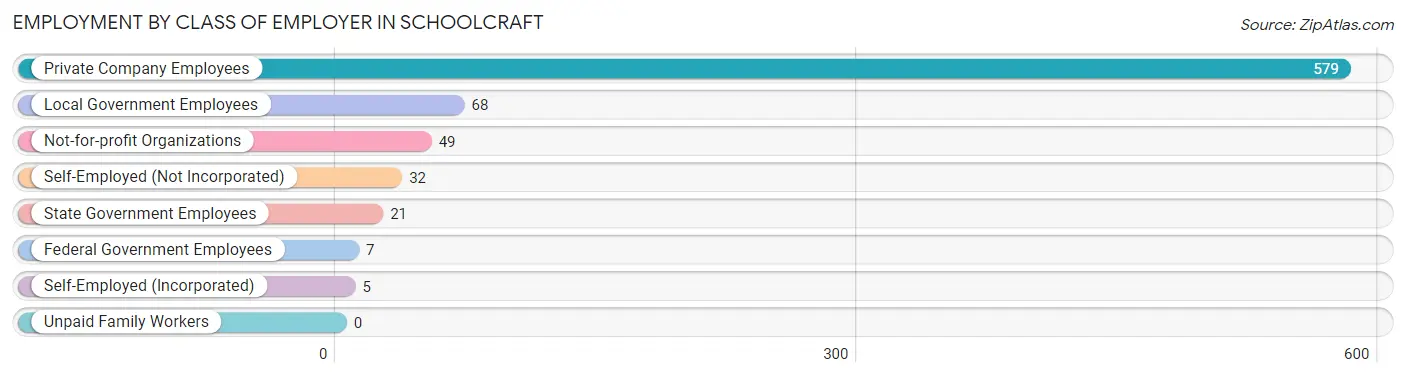
| Employer Class | # Employees | % Employees |
| Private Company Employees | 579 | 76.1% |
| Self-Employed (Incorporated) | 5 | 0.7% |
| Self-Employed (Not Incorporated) | 32 | 4.2% |
| Not-for-profit Organizations | 49 | 6.4% |
| Local Government Employees | 68 | 8.9% |
| State Government Employees | 21 | 2.8% |
| Federal Government Employees | 7 | 0.9% |
| Unpaid Family Workers | 0 | 0.0% |
| Total | 761 | 100.0% |
Employment Status by Age in Schoolcraft
According to the labor force statistics for Schoolcraft, out of the total population over 16 years of age (1,041), 75.7% or 788 individuals are in the labor force, with 1.9% or 15 of them unemployed. The age group with the highest labor force participation rate is 20 to 24 years, with 95.5% or 84 individuals in the labor force. Within the labor force, the 45 to 54 years age range has the highest percentage of unemployed individuals, with 5.5% or 9 of them being unemployed.
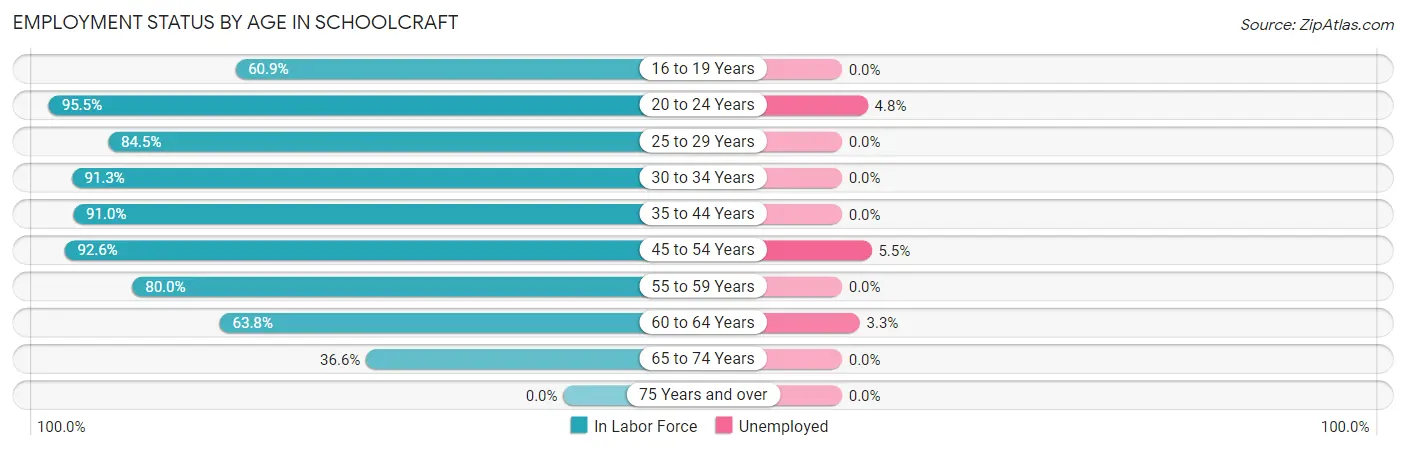
| Age Bracket | In Labor Force | Unemployed |
| 16 to 19 Years | 42 (60.9%) | 0 (0.0%) |
| 20 to 24 Years | 84 (95.5%) | 4 (4.8%) |
| 25 to 29 Years | 71 (84.5%) | 0 (0.0%) |
| 30 to 34 Years | 95 (91.3%) | 0 (0.0%) |
| 35 to 44 Years | 203 (91.0%) | 0 (0.0%) |
| 45 to 54 Years | 163 (92.6%) | 9 (5.5%) |
| 55 to 59 Years | 36 (80.0%) | 0 (0.0%) |
| 60 to 64 Years | 60 (63.8%) | 2 (3.3%) |
| 65 to 74 Years | 34 (36.6%) | 0 (0.0%) |
| 75 Years and over | 0 (0.0%) | 0 (0.0%) |
| Total | 788 (75.7%) | 15 (1.9%) |
Employment Status by Educational Attainment in Schoolcraft
According to labor force statistics for Schoolcraft, 86.5% of individuals (628) out of the total population between 25 and 64 years of age (726) are in the labor force, with 1.8% or 11 of them being unemployed. The group with the highest labor force participation rate are those with the educational attainment of bachelor's degree or higher, with 91.5% or 204 individuals in the labor force. Within the labor force, individuals with less than high school education have the highest percentage of unemployment, with 45.0% or 9 of them being unemployed.
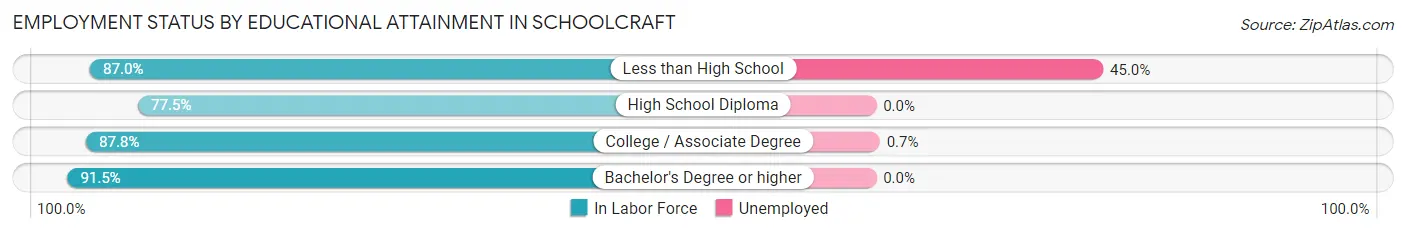
| Educational Attainment | In Labor Force | Unemployed |
| Less than High School | 20 (87.0%) | 10 (45.0%) |
| High School Diploma | 131 (77.5%) | 0 (0.0%) |
| College / Associate Degree | 273 (87.8%) | 2 (0.7%) |
| Bachelor's Degree or higher | 204 (91.5%) | 0 (0.0%) |
| Total | 628 (86.5%) | 13 (1.8%) |
Employment Occupations by Sex in Schoolcraft
Management, Business, Science and Arts Occupations
The most common Management, Business, Science and Arts occupations in Schoolcraft are Community & Social Service (112 | 14.5%), Management (88 | 11.4%), Education Instruction & Library (80 | 10.3%), Computers, Engineering & Science (61 | 7.9%), and Health Diagnosing & Treating (47 | 6.1%).
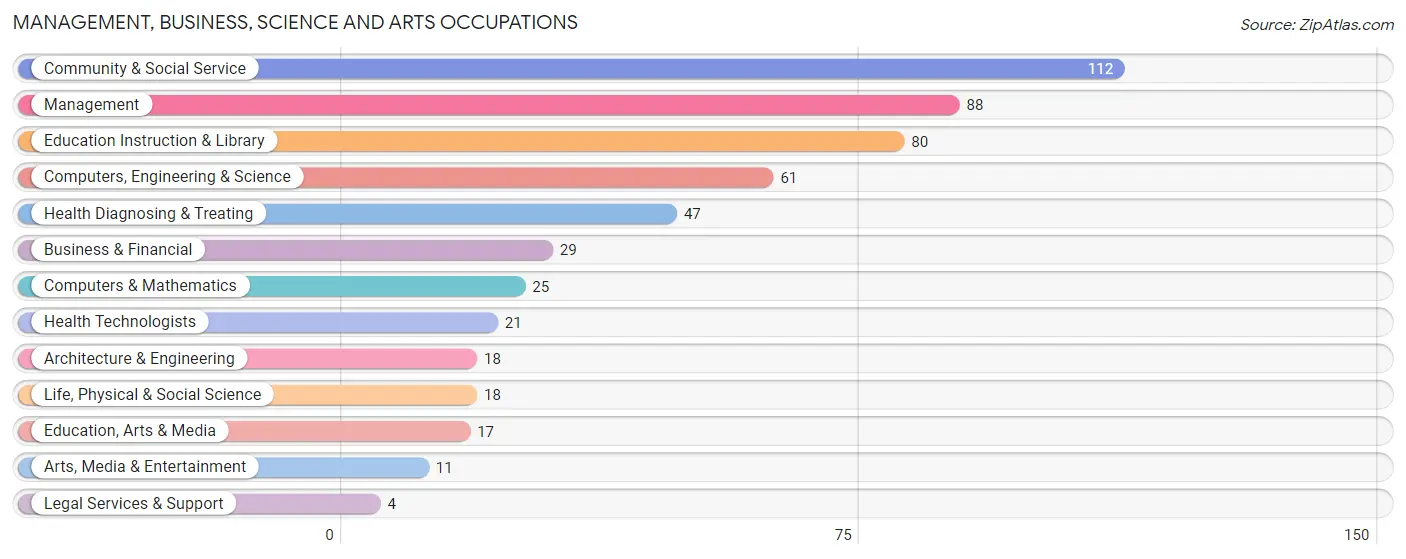
Management, Business, Science and Arts Occupations by Sex
Within the Management, Business, Science and Arts occupations in Schoolcraft, the most male-oriented occupations are Architecture & Engineering (100.0%), Legal Services & Support (100.0%), and Computers & Mathematics (80.0%), while the most female-oriented occupations are Education, Arts & Media (100.0%), Health Diagnosing & Treating (85.1%), and Arts, Media & Entertainment (81.8%).
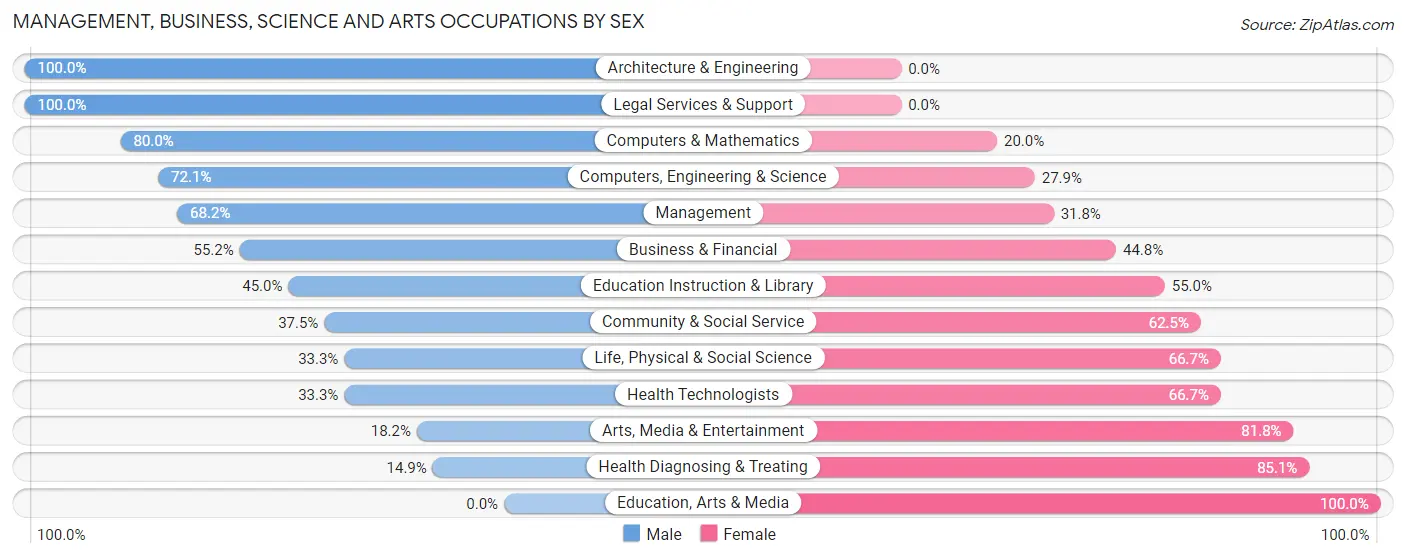
| Occupation | Male | Female |
| Management | 60 (68.2%) | 28 (31.8%) |
| Business & Financial | 16 (55.2%) | 13 (44.8%) |
| Computers, Engineering & Science | 44 (72.1%) | 17 (27.9%) |
| Computers & Mathematics | 20 (80.0%) | 5 (20.0%) |
| Architecture & Engineering | 18 (100.0%) | 0 (0.0%) |
| Life, Physical & Social Science | 6 (33.3%) | 12 (66.7%) |
| Community & Social Service | 42 (37.5%) | 70 (62.5%) |
| Education, Arts & Media | 0 (0.0%) | 17 (100.0%) |
| Legal Services & Support | 4 (100.0%) | 0 (0.0%) |
| Education Instruction & Library | 36 (45.0%) | 44 (55.0%) |
| Arts, Media & Entertainment | 2 (18.2%) | 9 (81.8%) |
| Health Diagnosing & Treating | 7 (14.9%) | 40 (85.1%) |
| Health Technologists | 7 (33.3%) | 14 (66.7%) |
| Total (Category) | 169 (50.1%) | 168 (49.8%) |
| Total (Overall) | 458 (59.3%) | 315 (40.7%) |
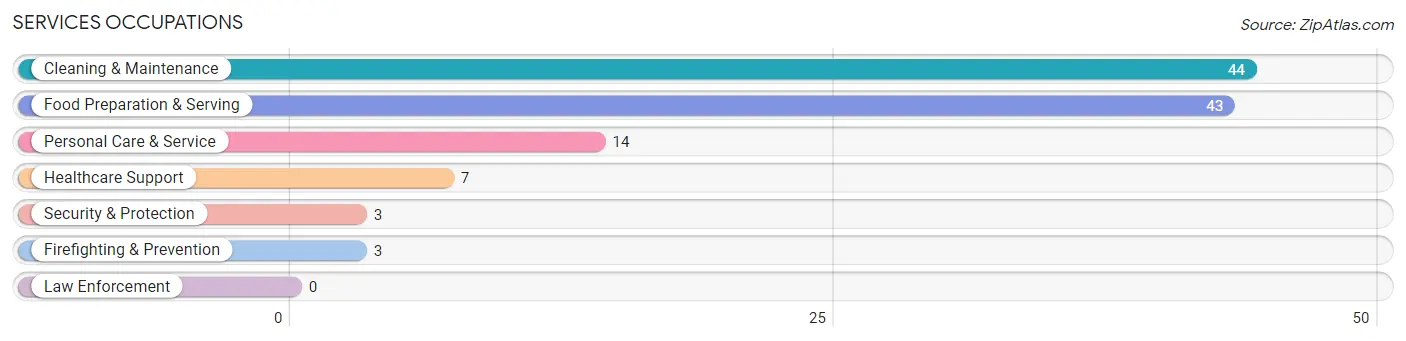
Services Occupations
The most common Services occupations in Schoolcraft are Cleaning & Maintenance (44 | 5.7%), Food Preparation & Serving (43 | 5.6%), Personal Care & Service (14 | 1.8%), Healthcare Support (7 | 0.9%), and Security & Protection (3 | 0.4%).
Services Occupations by Sex
Within the Services occupations in Schoolcraft, the most male-oriented occupations are Healthcare Support (100.0%), Cleaning & Maintenance (93.2%), and Food Preparation & Serving (58.1%), while the most female-oriented occupations are Personal Care & Service (85.7%), Security & Protection (66.7%), and Firefighting & Prevention (66.7%).
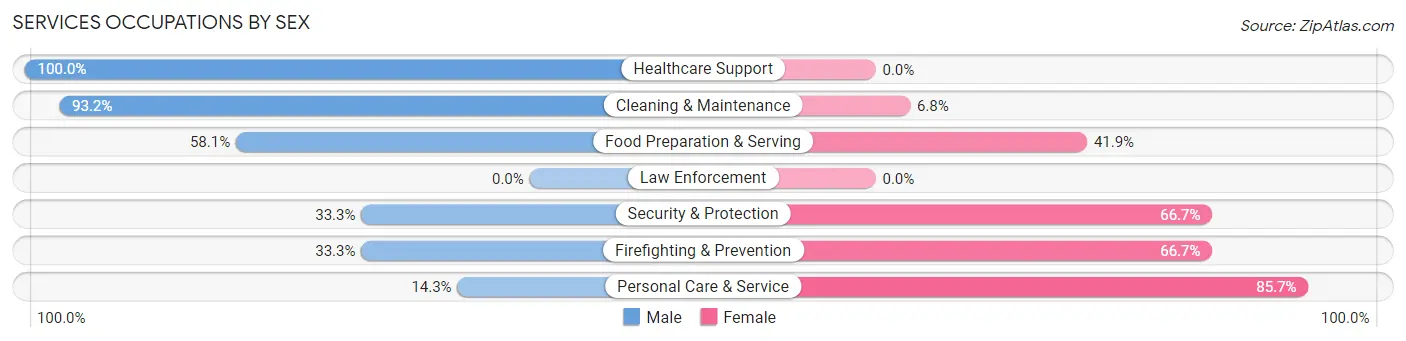
| Occupation | Male | Female |
| Healthcare Support | 7 (100.0%) | 0 (0.0%) |
| Security & Protection | 1 (33.3%) | 2 (66.7%) |
| Firefighting & Prevention | 1 (33.3%) | 2 (66.7%) |
| Law Enforcement | 0 (0.0%) | 0 (0.0%) |
| Food Preparation & Serving | 25 (58.1%) | 18 (41.9%) |
| Cleaning & Maintenance | 41 (93.2%) | 3 (6.8%) |
| Personal Care & Service | 2 (14.3%) | 12 (85.7%) |
| Total (Category) | 76 (68.5%) | 35 (31.5%) |
| Total (Overall) | 458 (59.3%) | 315 (40.7%) |
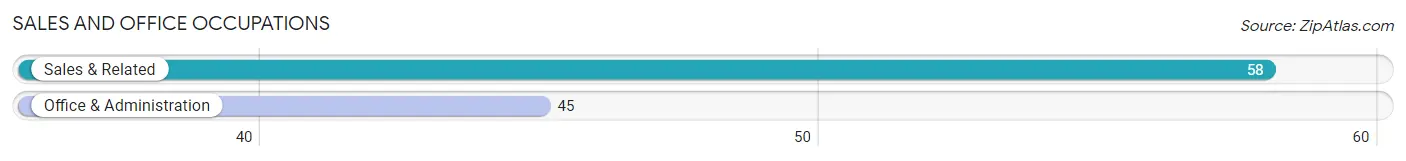
Sales and Office Occupations
The most common Sales and Office occupations in Schoolcraft are Sales & Related (58 | 7.5%), and Office & Administration (45 | 5.8%).
Sales and Office Occupations by Sex
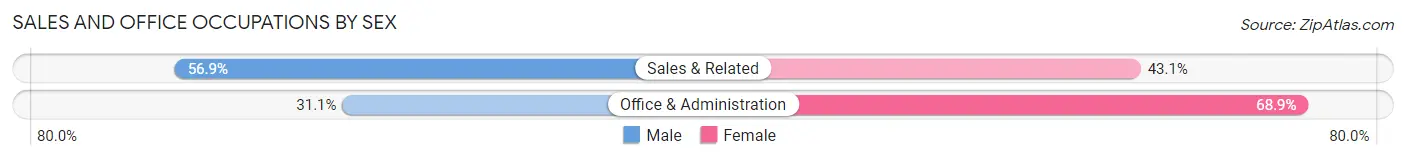
| Occupation | Male | Female |
| Sales & Related | 33 (56.9%) | 25 (43.1%) |
| Office & Administration | 14 (31.1%) | 31 (68.9%) |
| Total (Category) | 47 (45.6%) | 56 (54.4%) |
| Total (Overall) | 458 (59.3%) | 315 (40.7%) |
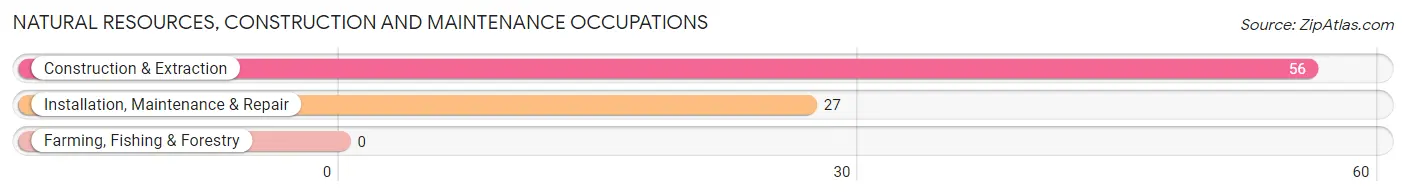
Natural Resources, Construction and Maintenance Occupations
The most common Natural Resources, Construction and Maintenance occupations in Schoolcraft are Construction & Extraction (56 | 7.2%), and Installation, Maintenance & Repair (27 | 3.5%).
Natural Resources, Construction and Maintenance Occupations by Sex
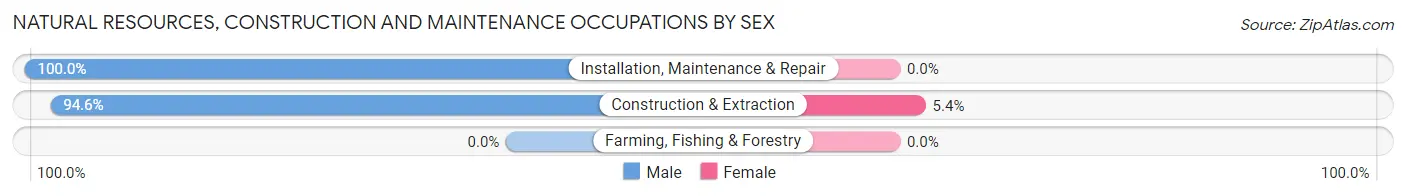
| Occupation | Male | Female |
| Farming, Fishing & Forestry | 0 (0.0%) | 0 (0.0%) |
| Construction & Extraction | 53 (94.6%) | 3 (5.4%) |
| Installation, Maintenance & Repair | 27 (100.0%) | 0 (0.0%) |
| Total (Category) | 80 (96.4%) | 3 (3.6%) |
| Total (Overall) | 458 (59.3%) | 315 (40.7%) |
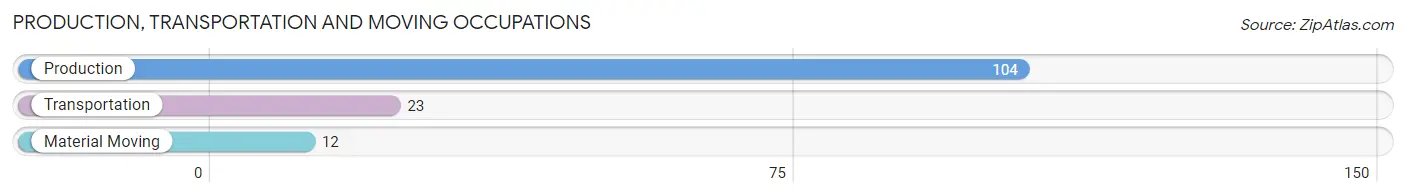
Production, Transportation and Moving Occupations
The most common Production, Transportation and Moving occupations in Schoolcraft are Production (104 | 13.5%), Transportation (23 | 3.0%), and Material Moving (12 | 1.5%).
Production, Transportation and Moving Occupations by Sex
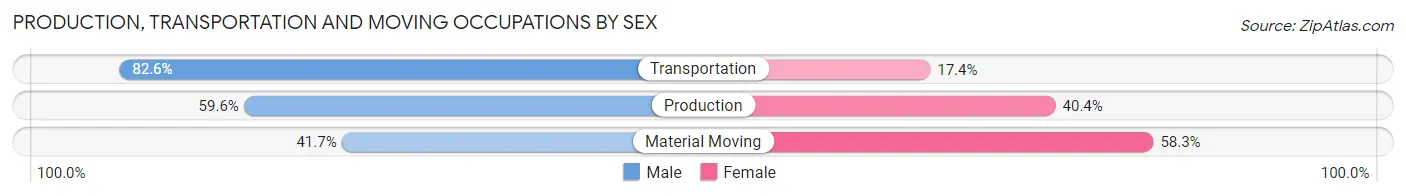
| Occupation | Male | Female |
| Production | 62 (59.6%) | 42 (40.4%) |
| Transportation | 19 (82.6%) | 4 (17.4%) |
| Material Moving | 5 (41.7%) | 7 (58.3%) |
| Total (Category) | 86 (61.9%) | 53 (38.1%) |
| Total (Overall) | 458 (59.3%) | 315 (40.7%) |
Employment Industries by Sex in Schoolcraft
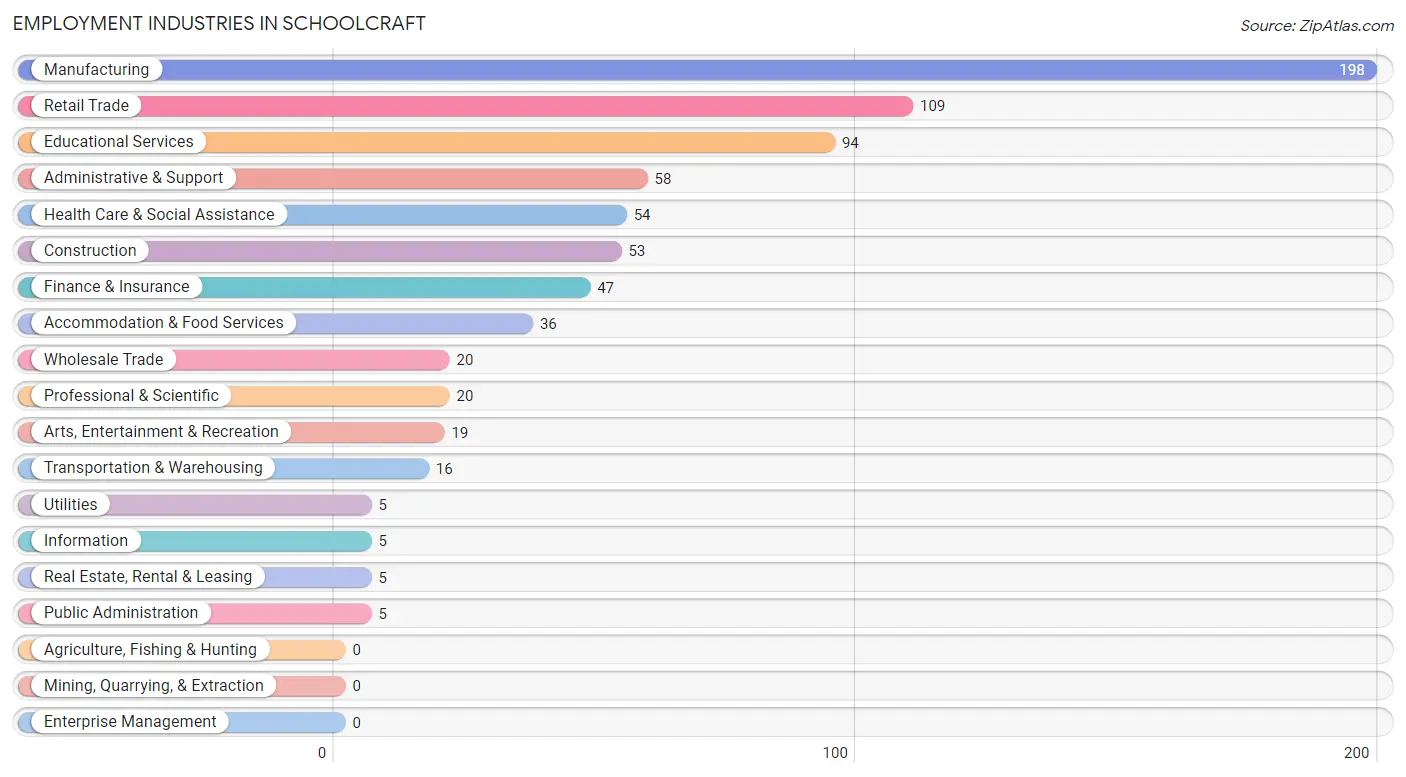
Employment Industries in Schoolcraft
The major employment industries in Schoolcraft include Manufacturing (198 | 25.6%), Retail Trade (109 | 14.1%), Educational Services (94 | 12.2%), Administrative & Support (58 | 7.5%), and Health Care & Social Assistance (54 | 7.0%).
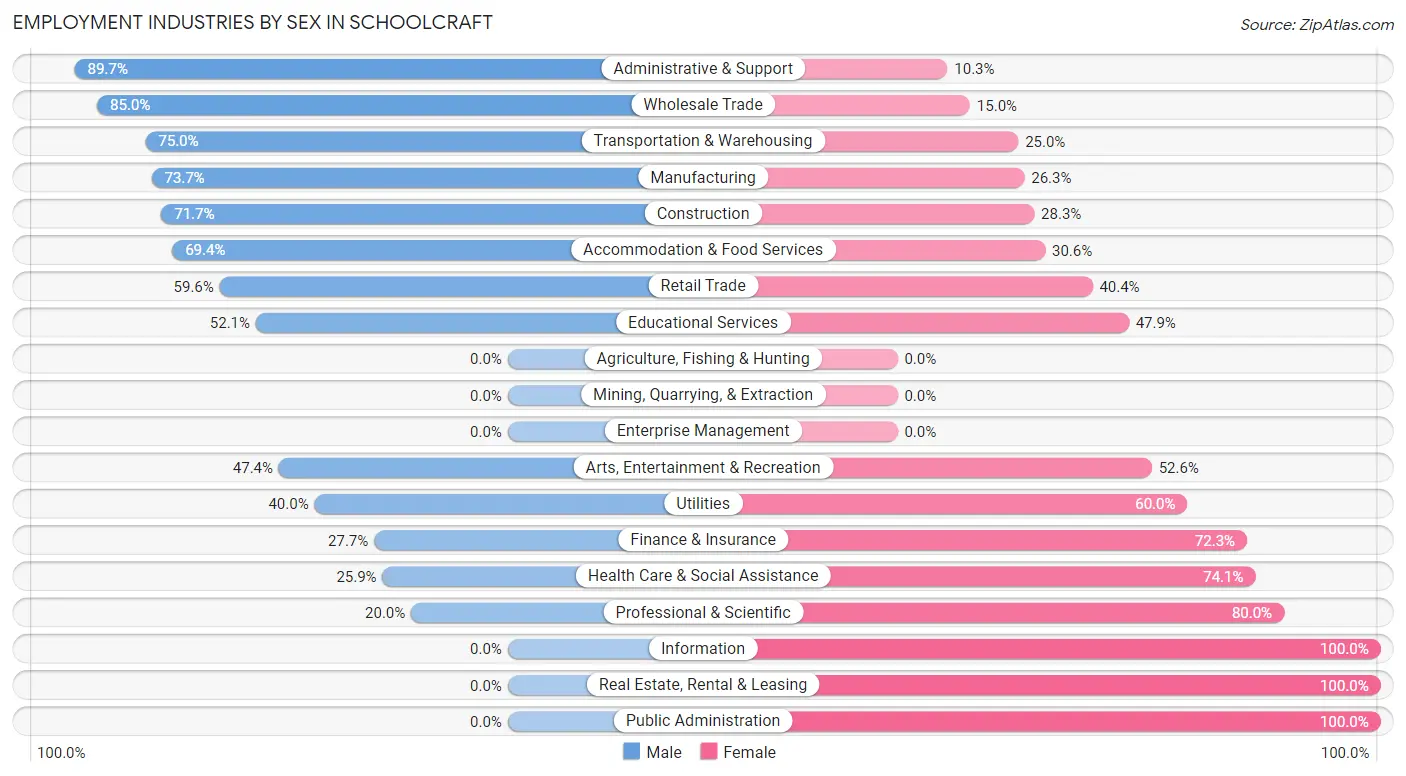
Employment Industries by Sex in Schoolcraft
The Schoolcraft industries that see more men than women are Administrative & Support (89.7%), Wholesale Trade (85.0%), and Transportation & Warehousing (75.0%), whereas the industries that tend to have a higher number of women are Information (100.0%), Real Estate, Rental & Leasing (100.0%), and Public Administration (100.0%).
| Industry | Male | Female |
| Agriculture, Fishing & Hunting | 0 (0.0%) | 0 (0.0%) |
| Mining, Quarrying, & Extraction | 0 (0.0%) | 0 (0.0%) |
| Construction | 38 (71.7%) | 15 (28.3%) |
| Manufacturing | 146 (73.7%) | 52 (26.3%) |
| Wholesale Trade | 17 (85.0%) | 3 (15.0%) |
| Retail Trade | 65 (59.6%) | 44 (40.4%) |
| Transportation & Warehousing | 12 (75.0%) | 4 (25.0%) |
| Utilities | 2 (40.0%) | 3 (60.0%) |
| Information | 0 (0.0%) | 5 (100.0%) |
| Finance & Insurance | 13 (27.7%) | 34 (72.3%) |
| Real Estate, Rental & Leasing | 0 (0.0%) | 5 (100.0%) |
| Professional & Scientific | 4 (20.0%) | 16 (80.0%) |
| Enterprise Management | 0 (0.0%) | 0 (0.0%) |
| Administrative & Support | 52 (89.7%) | 6 (10.3%) |
| Educational Services | 49 (52.1%) | 45 (47.9%) |
| Health Care & Social Assistance | 14 (25.9%) | 40 (74.1%) |
| Arts, Entertainment & Recreation | 9 (47.4%) | 10 (52.6%) |
| Accommodation & Food Services | 25 (69.4%) | 11 (30.6%) |
| Public Administration | 0 (0.0%) | 5 (100.0%) |
| Total | 458 (59.3%) | 315 (40.7%) |
Education in Schoolcraft
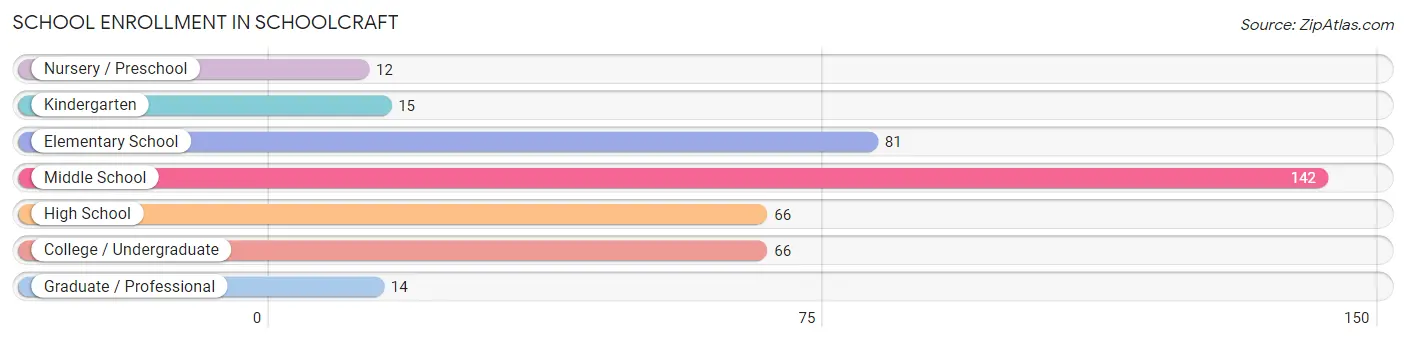
School Enrollment in Schoolcraft
The most common levels of schooling among the 396 students in Schoolcraft are middle school (142 | 35.9%), elementary school (81 | 20.4%), and high school (66 | 16.7%).
| School Level | # Students | % Students |
| Nursery / Preschool | 12 | 3.0% |
| Kindergarten | 15 | 3.8% |
| Elementary School | 81 | 20.4% |
| Middle School | 142 | 35.9% |
| High School | 66 | 16.7% |
| College / Undergraduate | 66 | 16.7% |
| Graduate / Professional | 14 | 3.5% |
| Total | 396 | 100.0% |
School Enrollment by Age by Funding Source in Schoolcraft
Out of a total of 396 students who are enrolled in schools in Schoolcraft, 41 (10.4%) attend a private institution, while the remaining 355 (89.6%) are enrolled in public schools. The age group of 35 years and over has the highest likelihood of being enrolled in private schools, with 7 (33.3% in the age bracket) enrolled. Conversely, the age group of 3 to 4 year olds has the lowest likelihood of being enrolled in a private school, with 6 (100.0% in the age bracket) attending a public institution.
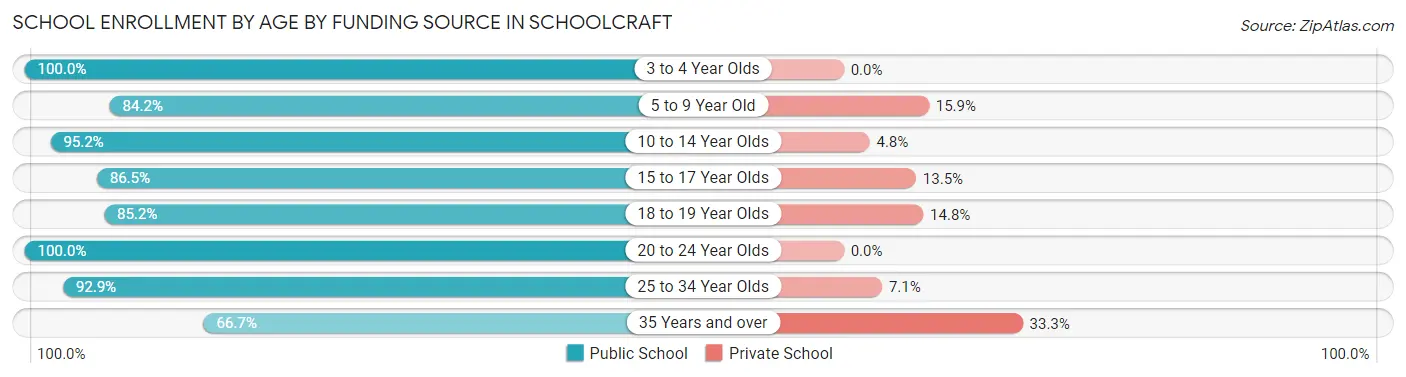
| Age Bracket | Public School | Private School |
| 3 to 4 Year Olds | 6 (100.0%) | 0 (0.0%) |
| 5 to 9 Year Old | 69 (84.2%) | 13 (15.9%) |
| 10 to 14 Year Olds | 158 (95.2%) | 8 (4.8%) |
| 15 to 17 Year Olds | 45 (86.5%) | 7 (13.5%) |
| 18 to 19 Year Olds | 23 (85.2%) | 4 (14.8%) |
| 20 to 24 Year Olds | 14 (100.0%) | 0 (0.0%) |
| 25 to 34 Year Olds | 26 (92.9%) | 2 (7.1%) |
| 35 Years and over | 14 (66.7%) | 7 (33.3%) |
| Total | 355 (89.6%) | 41 (10.4%) |
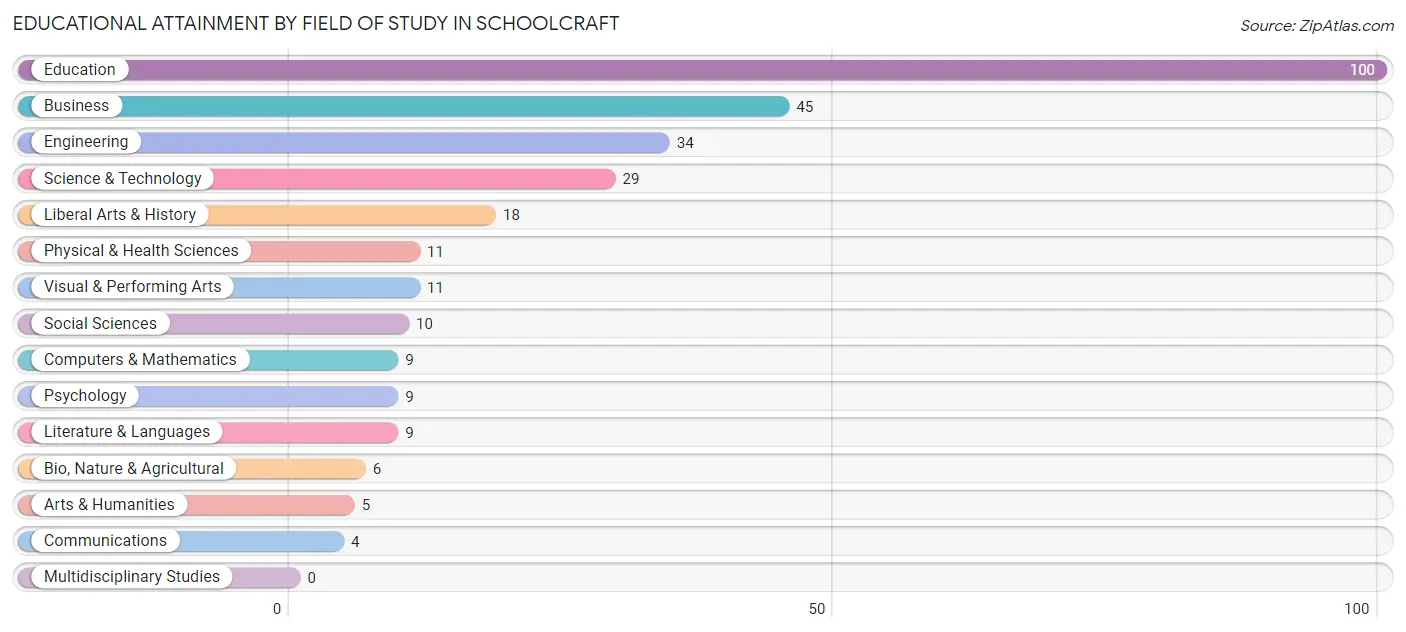
Educational Attainment by Field of Study in Schoolcraft
Education (100 | 33.3%), business (45 | 15.0%), engineering (34 | 11.3%), science & technology (29 | 9.7%), and liberal arts & history (18 | 6.0%) are the most common fields of study among 300 individuals in Schoolcraft who have obtained a bachelor's degree or higher.
| Field of Study | # Graduates | % Graduates |
| Computers & Mathematics | 9 | 3.0% |
| Bio, Nature & Agricultural | 6 | 2.0% |
| Physical & Health Sciences | 11 | 3.7% |
| Psychology | 9 | 3.0% |
| Social Sciences | 10 | 3.3% |
| Engineering | 34 | 11.3% |
| Multidisciplinary Studies | 0 | 0.0% |
| Science & Technology | 29 | 9.7% |
| Business | 45 | 15.0% |
| Education | 100 | 33.3% |
| Literature & Languages | 9 | 3.0% |
| Liberal Arts & History | 18 | 6.0% |
| Visual & Performing Arts | 11 | 3.7% |
| Communications | 4 | 1.3% |
| Arts & Humanities | 5 | 1.7% |
| Total | 300 | 100.0% |
Transportation & Commute in Schoolcraft
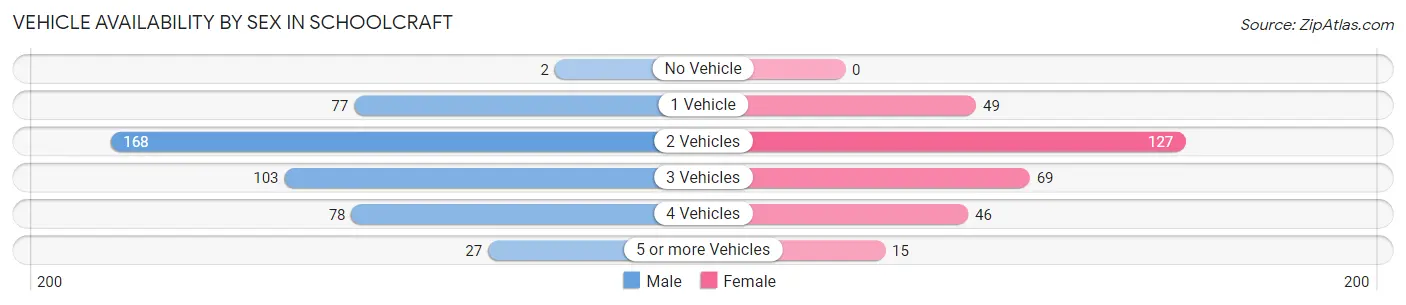
Vehicle Availability by Sex in Schoolcraft
The most prevalent vehicle ownership categories in Schoolcraft are males with 2 vehicles (168, accounting for 36.9%) and females with 2 vehicles (127, making up 54.9%).
| Vehicles Available | Male | Female |
| No Vehicle | 2 (0.4%) | 0 (0.0%) |
| 1 Vehicle | 77 (16.9%) | 49 (16.0%) |
| 2 Vehicles | 168 (36.9%) | 127 (41.5%) |
| 3 Vehicles | 103 (22.6%) | 69 (22.6%) |
| 4 Vehicles | 78 (17.1%) | 46 (15.0%) |
| 5 or more Vehicles | 27 (5.9%) | 15 (4.9%) |
| Total | 455 (100.0%) | 306 (100.0%) |
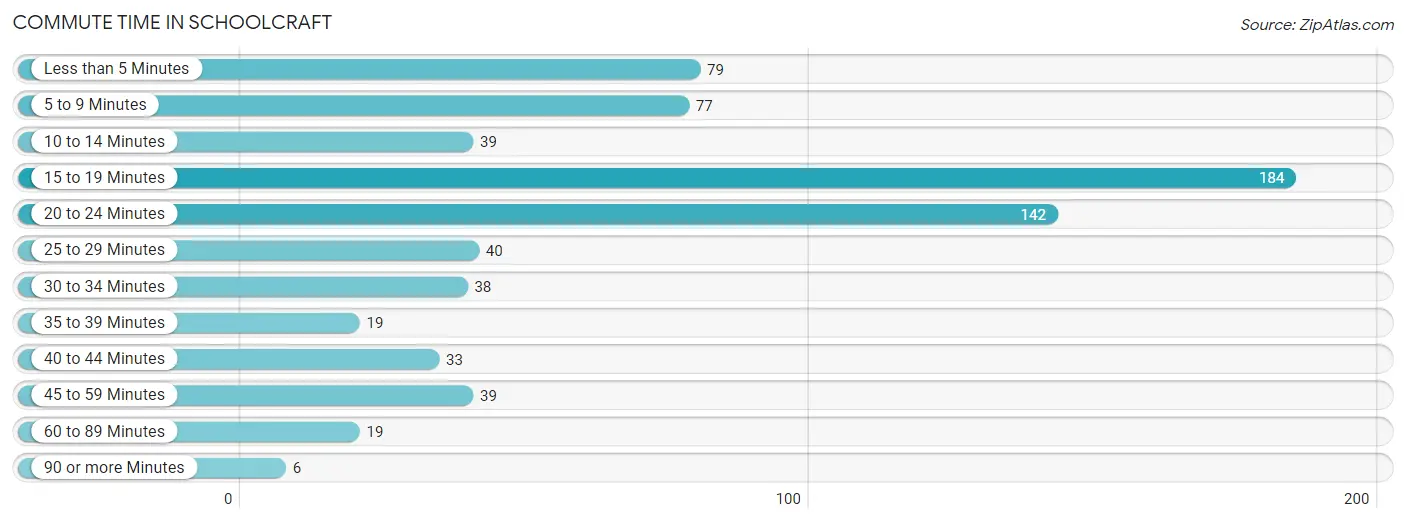
Commute Time in Schoolcraft
The most frequently occuring commute durations in Schoolcraft are 15 to 19 minutes (184 commuters, 25.7%), 20 to 24 minutes (142 commuters, 19.9%), and less than 5 minutes (79 commuters, 11.1%).
| Commute Time | # Commuters | % Commuters |
| Less than 5 Minutes | 79 | 11.1% |
| 5 to 9 Minutes | 77 | 10.8% |
| 10 to 14 Minutes | 39 | 5.4% |
| 15 to 19 Minutes | 184 | 25.7% |
| 20 to 24 Minutes | 142 | 19.9% |
| 25 to 29 Minutes | 40 | 5.6% |
| 30 to 34 Minutes | 38 | 5.3% |
| 35 to 39 Minutes | 19 | 2.7% |
| 40 to 44 Minutes | 33 | 4.6% |
| 45 to 59 Minutes | 39 | 5.4% |
| 60 to 89 Minutes | 19 | 2.7% |
| 90 or more Minutes | 6 | 0.8% |
Commute Time by Sex in Schoolcraft
The most common commute times in Schoolcraft are 20 to 24 minutes (115 commuters, 27.0%) for males and 15 to 19 minutes (93 commuters, 32.2%) for females.
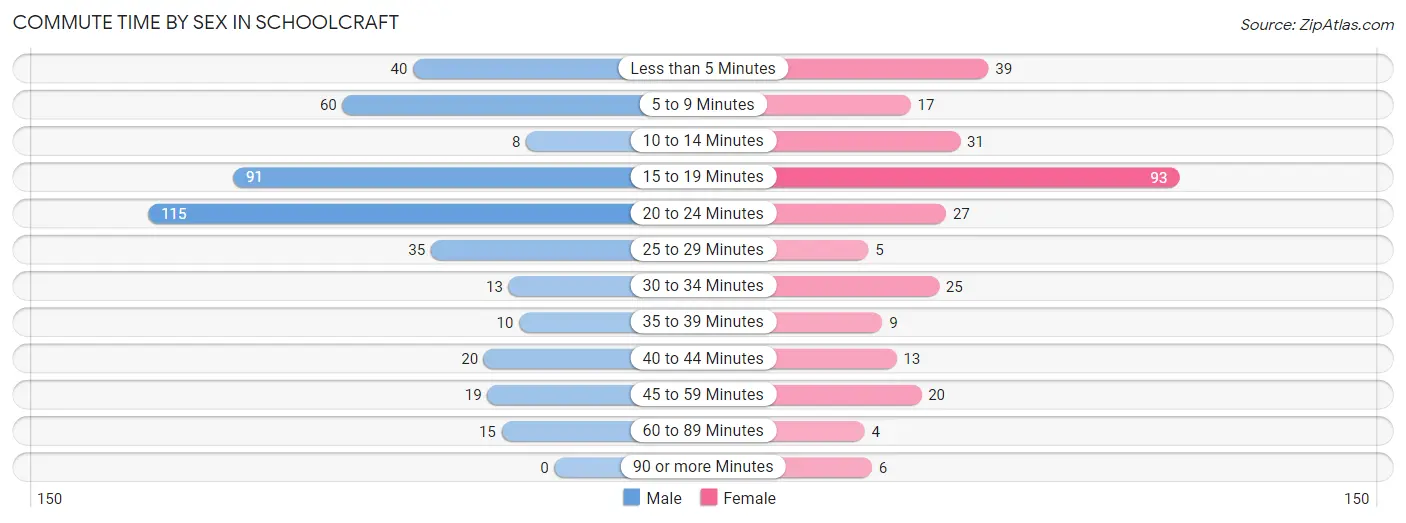
| Commute Time | Male | Female |
| Less than 5 Minutes | 40 (9.4%) | 39 (13.5%) |
| 5 to 9 Minutes | 60 (14.1%) | 17 (5.9%) |
| 10 to 14 Minutes | 8 (1.9%) | 31 (10.7%) |
| 15 to 19 Minutes | 91 (21.4%) | 93 (32.2%) |
| 20 to 24 Minutes | 115 (27.0%) | 27 (9.3%) |
| 25 to 29 Minutes | 35 (8.2%) | 5 (1.7%) |
| 30 to 34 Minutes | 13 (3.0%) | 25 (8.6%) |
| 35 to 39 Minutes | 10 (2.4%) | 9 (3.1%) |
| 40 to 44 Minutes | 20 (4.7%) | 13 (4.5%) |
| 45 to 59 Minutes | 19 (4.5%) | 20 (6.9%) |
| 60 to 89 Minutes | 15 (3.5%) | 4 (1.4%) |
| 90 or more Minutes | 0 (0.0%) | 6 (2.1%) |
Time of Departure to Work by Sex in Schoolcraft
The most frequent times of departure to work in Schoolcraft are 6:00 AM to 6:29 AM (79, 18.5%) for males and 7:30 AM to 7:59 AM (46, 15.9%) for females.
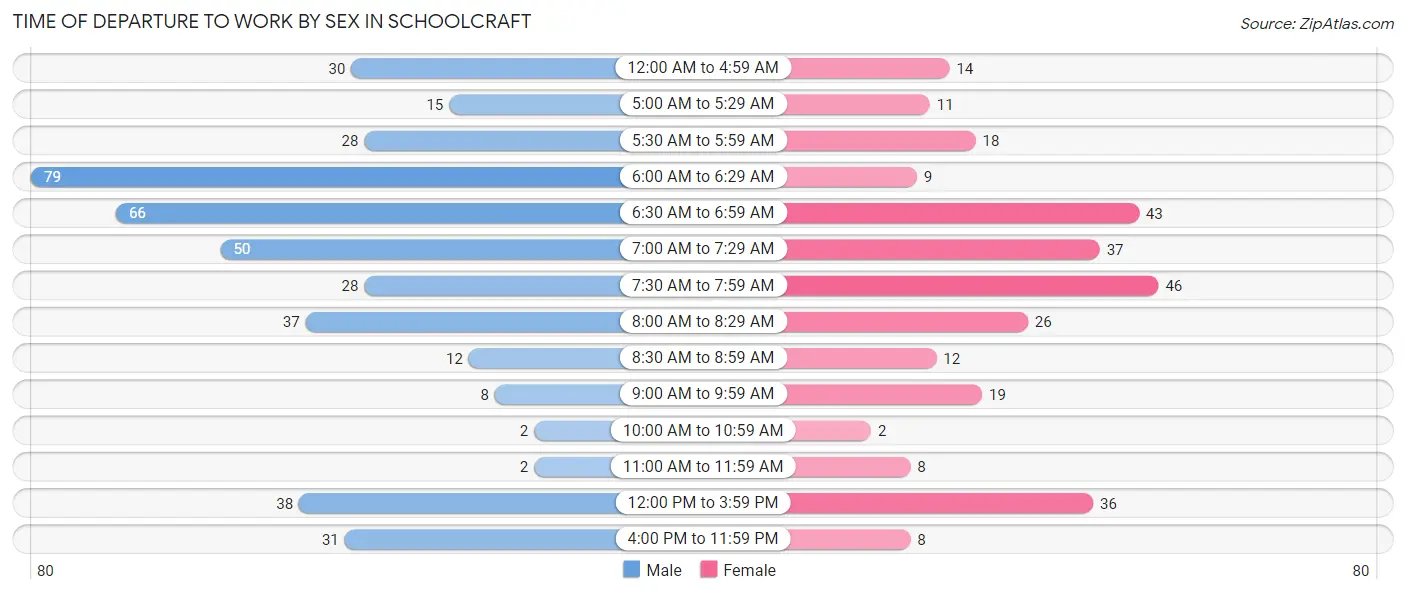
| Time of Departure | Male | Female |
| 12:00 AM to 4:59 AM | 30 (7.0%) | 14 (4.8%) |
| 5:00 AM to 5:29 AM | 15 (3.5%) | 11 (3.8%) |
| 5:30 AM to 5:59 AM | 28 (6.6%) | 18 (6.2%) |
| 6:00 AM to 6:29 AM | 79 (18.5%) | 9 (3.1%) |
| 6:30 AM to 6:59 AM | 66 (15.5%) | 43 (14.9%) |
| 7:00 AM to 7:29 AM | 50 (11.7%) | 37 (12.8%) |
| 7:30 AM to 7:59 AM | 28 (6.6%) | 46 (15.9%) |
| 8:00 AM to 8:29 AM | 37 (8.7%) | 26 (9.0%) |
| 8:30 AM to 8:59 AM | 12 (2.8%) | 12 (4.2%) |
| 9:00 AM to 9:59 AM | 8 (1.9%) | 19 (6.6%) |
| 10:00 AM to 10:59 AM | 2 (0.5%) | 2 (0.7%) |
| 11:00 AM to 11:59 AM | 2 (0.5%) | 8 (2.8%) |
| 12:00 PM to 3:59 PM | 38 (8.9%) | 36 (12.5%) |
| 4:00 PM to 11:59 PM | 31 (7.3%) | 8 (2.8%) |
| Total | 426 (100.0%) | 289 (100.0%) |
Housing Occupancy in Schoolcraft
Occupancy by Ownership in Schoolcraft
Of the total 546 dwellings in Schoolcraft, owner-occupied units account for 411 (75.3%), while renter-occupied units make up 135 (24.7%).
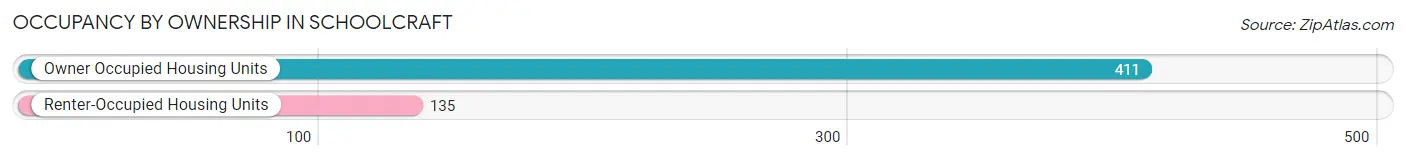
| Occupancy | # Housing Units | % Housing Units |
| Owner Occupied Housing Units | 411 | 75.3% |
| Renter-Occupied Housing Units | 135 | 24.7% |
| Total Occupied Housing Units | 546 | 100.0% |
Occupancy by Household Size in Schoolcraft
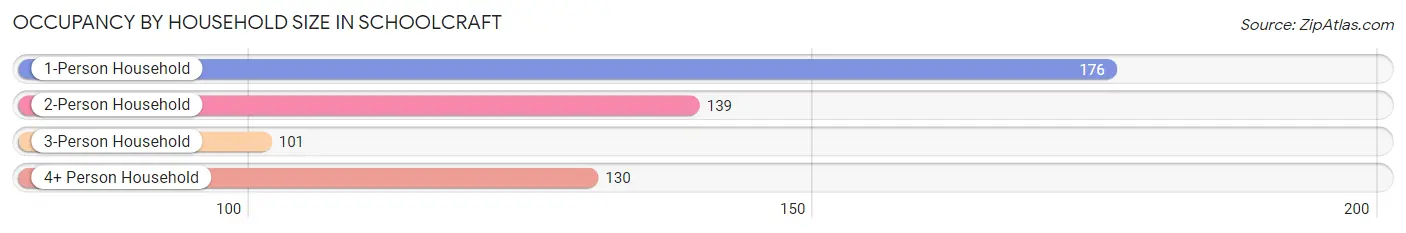
| Household Size | # Housing Units | % Housing Units |
| 1-Person Household | 176 | 32.2% |
| 2-Person Household | 139 | 25.5% |
| 3-Person Household | 101 | 18.5% |
| 4+ Person Household | 130 | 23.8% |
| Total Housing Units | 546 | 100.0% |
Occupancy by Ownership by Household Size in Schoolcraft
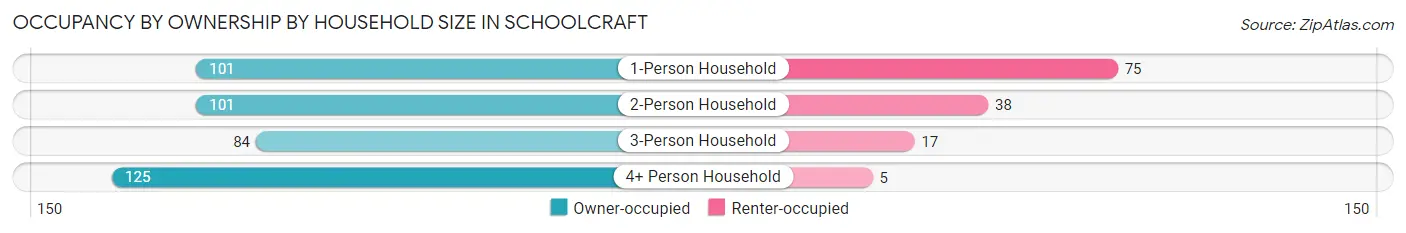
| Household Size | Owner-occupied | Renter-occupied |
| 1-Person Household | 101 (57.4%) | 75 (42.6%) |
| 2-Person Household | 101 (72.7%) | 38 (27.3%) |
| 3-Person Household | 84 (83.2%) | 17 (16.8%) |
| 4+ Person Household | 125 (96.2%) | 5 (3.8%) |
| Total Housing Units | 411 (75.3%) | 135 (24.7%) |
Occupancy by Educational Attainment in Schoolcraft
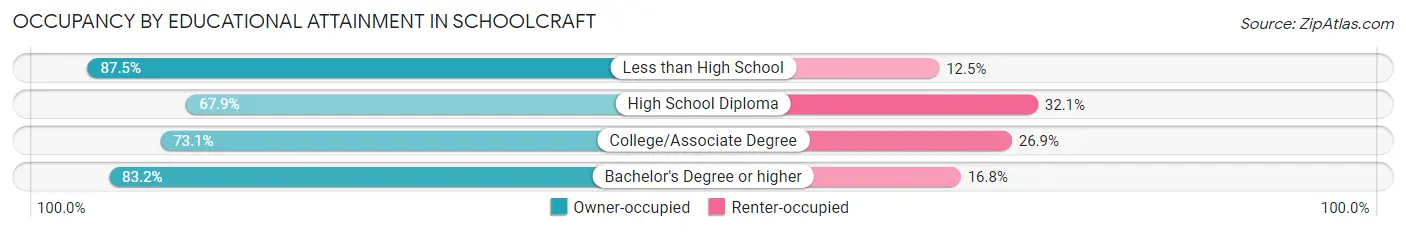
| Household Size | Owner-occupied | Renter-occupied |
| Less than High School | 14 (87.5%) | 2 (12.5%) |
| High School Diploma | 89 (67.9%) | 42 (32.1%) |
| College/Associate Degree | 174 (73.1%) | 64 (26.9%) |
| Bachelor's Degree or higher | 134 (83.2%) | 27 (16.8%) |
Occupancy by Age of Householder in Schoolcraft
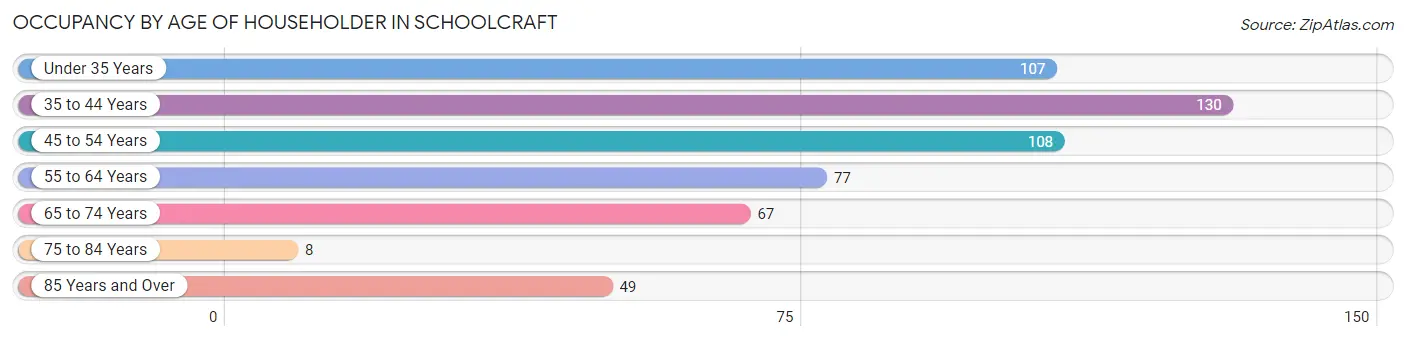
| Age Bracket | # Households | % Households |
| Under 35 Years | 107 | 19.6% |
| 35 to 44 Years | 130 | 23.8% |
| 45 to 54 Years | 108 | 19.8% |
| 55 to 64 Years | 77 | 14.1% |
| 65 to 74 Years | 67 | 12.3% |
| 75 to 84 Years | 8 | 1.5% |
| 85 Years and Over | 49 | 9.0% |
| Total | 546 | 100.0% |
Housing Finances in Schoolcraft
Median Income by Occupancy in Schoolcraft
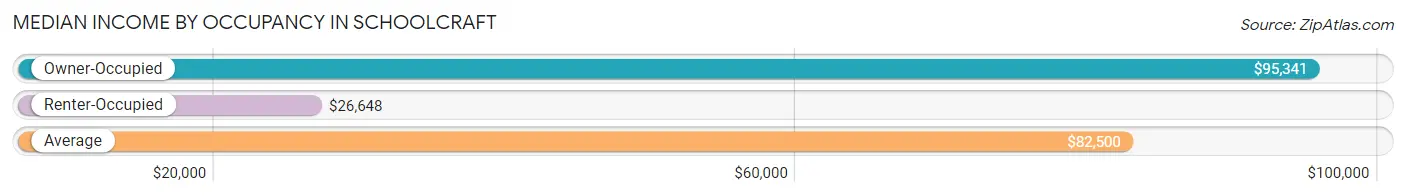
| Occupancy Type | # Households | Median Income |
| Owner-Occupied | 411 (75.3%) | $95,341 |
| Renter-Occupied | 135 (24.7%) | $26,648 |
| Average | 546 (100.0%) | $82,500 |
Occupancy by Householder Income Bracket in Schoolcraft
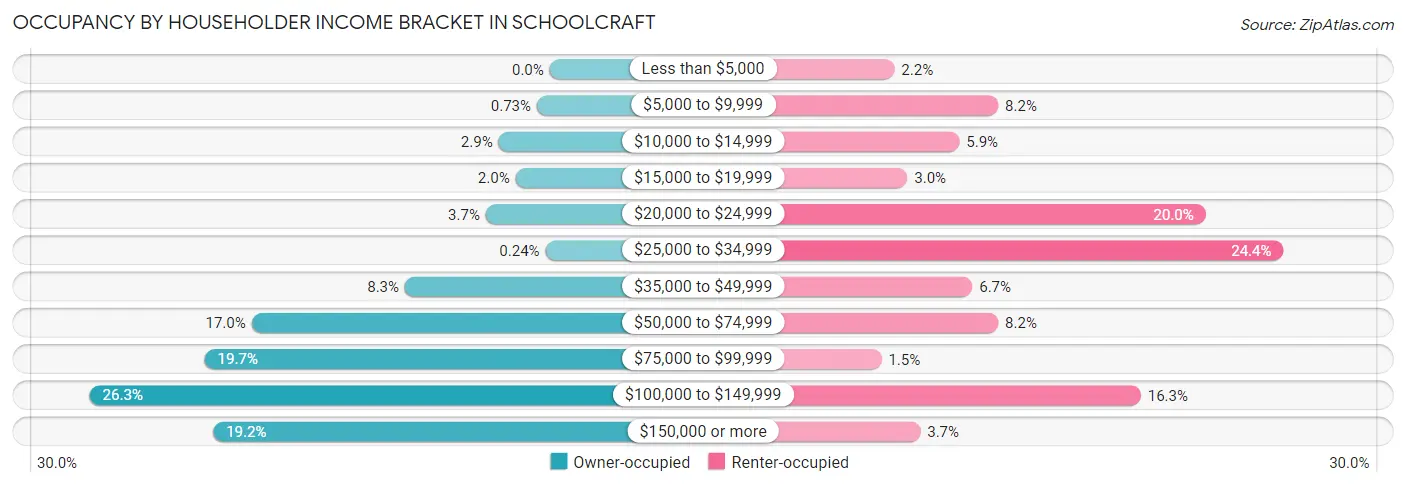
| Income Bracket | Owner-occupied | Renter-occupied |
| Less than $5,000 | 0 (0.0%) | 3 (2.2%) |
| $5,000 to $9,999 | 3 (0.7%) | 11 (8.2%) |
| $10,000 to $14,999 | 12 (2.9%) | 8 (5.9%) |
| $15,000 to $19,999 | 8 (1.9%) | 4 (3.0%) |
| $20,000 to $24,999 | 15 (3.6%) | 27 (20.0%) |
| $25,000 to $34,999 | 1 (0.2%) | 33 (24.4%) |
| $35,000 to $49,999 | 34 (8.3%) | 9 (6.7%) |
| $50,000 to $74,999 | 70 (17.0%) | 11 (8.2%) |
| $75,000 to $99,999 | 81 (19.7%) | 2 (1.5%) |
| $100,000 to $149,999 | 108 (26.3%) | 22 (16.3%) |
| $150,000 or more | 79 (19.2%) | 5 (3.7%) |
| Total | 411 (100.0%) | 135 (100.0%) |
Monthly Housing Cost Tiers in Schoolcraft
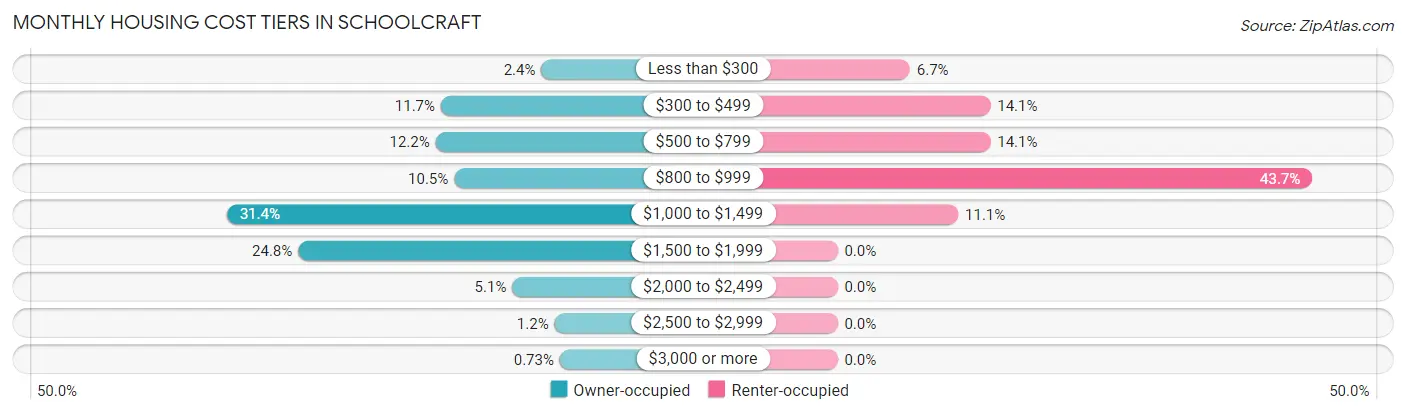
| Monthly Cost | Owner-occupied | Renter-occupied |
| Less than $300 | 10 (2.4%) | 9 (6.7%) |
| $300 to $499 | 48 (11.7%) | 19 (14.1%) |
| $500 to $799 | 50 (12.2%) | 19 (14.1%) |
| $800 to $999 | 43 (10.5%) | 59 (43.7%) |
| $1,000 to $1,499 | 129 (31.4%) | 15 (11.1%) |
| $1,500 to $1,999 | 102 (24.8%) | 0 (0.0%) |
| $2,000 to $2,499 | 21 (5.1%) | 0 (0.0%) |
| $2,500 to $2,999 | 5 (1.2%) | 0 (0.0%) |
| $3,000 or more | 3 (0.7%) | 0 (0.0%) |
| Total | 411 (100.0%) | 135 (100.0%) |
Physical Housing Characteristics in Schoolcraft
Housing Structures in Schoolcraft
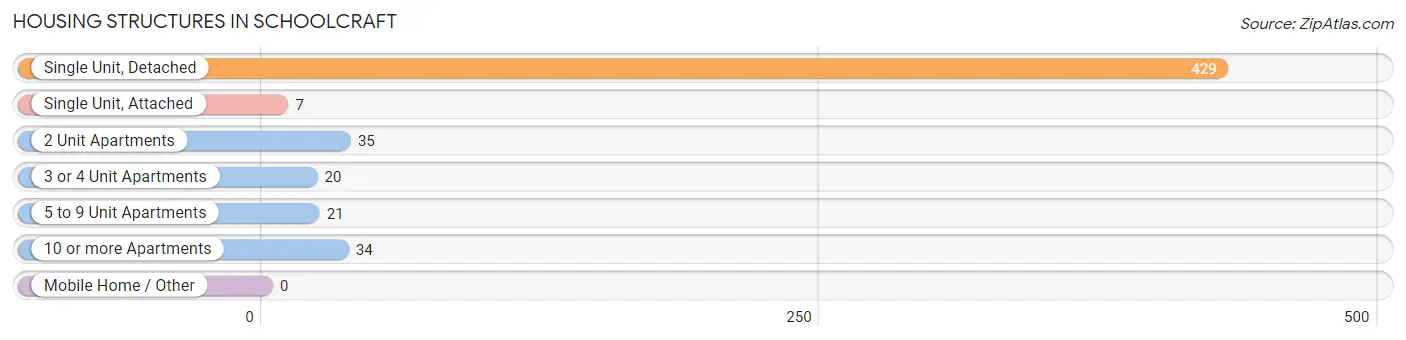
| Structure Type | # Housing Units | % Housing Units |
| Single Unit, Detached | 429 | 78.6% |
| Single Unit, Attached | 7 | 1.3% |
| 2 Unit Apartments | 35 | 6.4% |
| 3 or 4 Unit Apartments | 20 | 3.7% |
| 5 to 9 Unit Apartments | 21 | 3.8% |
| 10 or more Apartments | 34 | 6.2% |
| Mobile Home / Other | 0 | 0.0% |
| Total | 546 | 100.0% |
Housing Structures by Occupancy in Schoolcraft
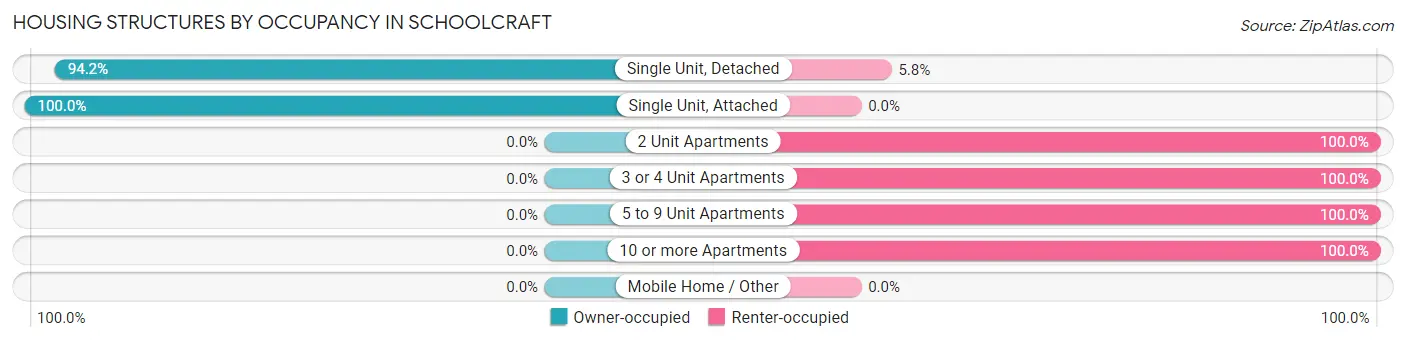
| Structure Type | Owner-occupied | Renter-occupied |
| Single Unit, Detached | 404 (94.2%) | 25 (5.8%) |
| Single Unit, Attached | 7 (100.0%) | 0 (0.0%) |
| 2 Unit Apartments | 0 (0.0%) | 35 (100.0%) |
| 3 or 4 Unit Apartments | 0 (0.0%) | 20 (100.0%) |
| 5 to 9 Unit Apartments | 0 (0.0%) | 21 (100.0%) |
| 10 or more Apartments | 0 (0.0%) | 34 (100.0%) |
| Mobile Home / Other | 0 (0.0%) | 0 (0.0%) |
| Total | 411 (75.3%) | 135 (24.7%) |
Housing Structures by Number of Rooms in Schoolcraft
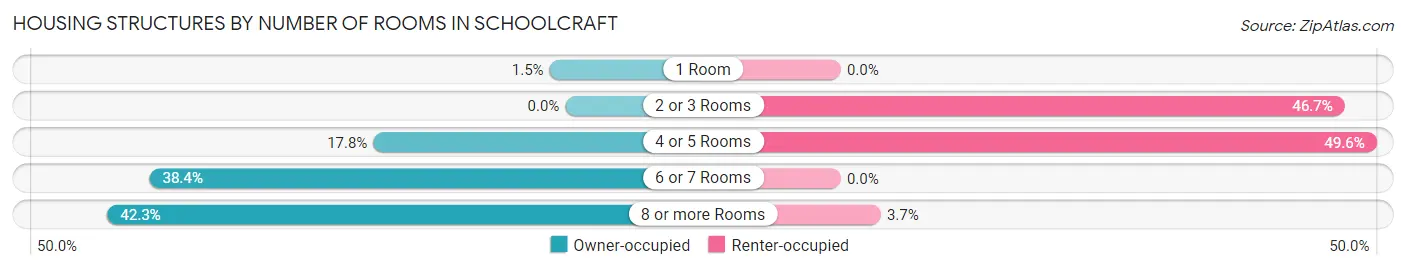
| Number of Rooms | Owner-occupied | Renter-occupied |
| 1 Room | 6 (1.5%) | 0 (0.0%) |
| 2 or 3 Rooms | 0 (0.0%) | 63 (46.7%) |
| 4 or 5 Rooms | 73 (17.8%) | 67 (49.6%) |
| 6 or 7 Rooms | 158 (38.4%) | 0 (0.0%) |
| 8 or more Rooms | 174 (42.3%) | 5 (3.7%) |
| Total | 411 (100.0%) | 135 (100.0%) |
Housing Structure by Heating Type in Schoolcraft
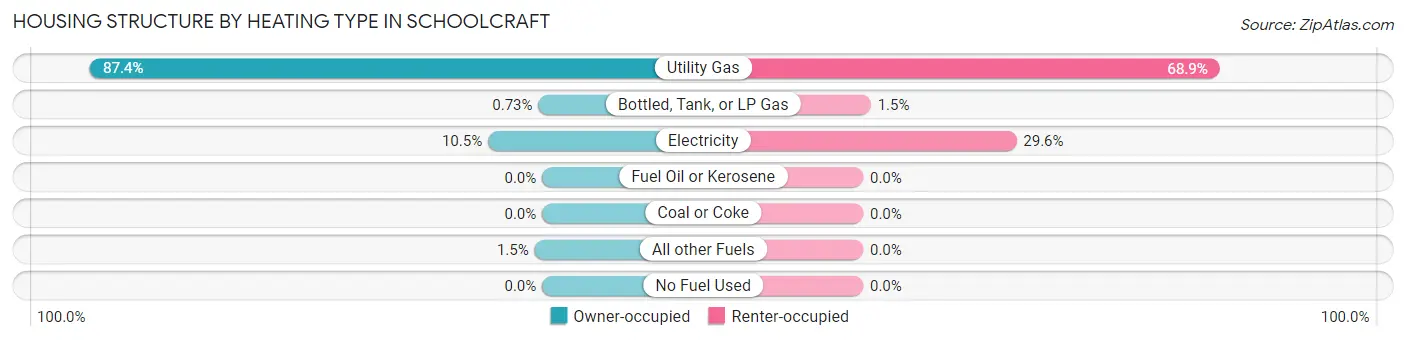
| Heating Type | Owner-occupied | Renter-occupied |
| Utility Gas | 359 (87.4%) | 93 (68.9%) |
| Bottled, Tank, or LP Gas | 3 (0.7%) | 2 (1.5%) |
| Electricity | 43 (10.5%) | 40 (29.6%) |
| Fuel Oil or Kerosene | 0 (0.0%) | 0 (0.0%) |
| Coal or Coke | 0 (0.0%) | 0 (0.0%) |
| All other Fuels | 6 (1.5%) | 0 (0.0%) |
| No Fuel Used | 0 (0.0%) | 0 (0.0%) |
| Total | 411 (100.0%) | 135 (100.0%) |
Household Vehicle Usage in Schoolcraft
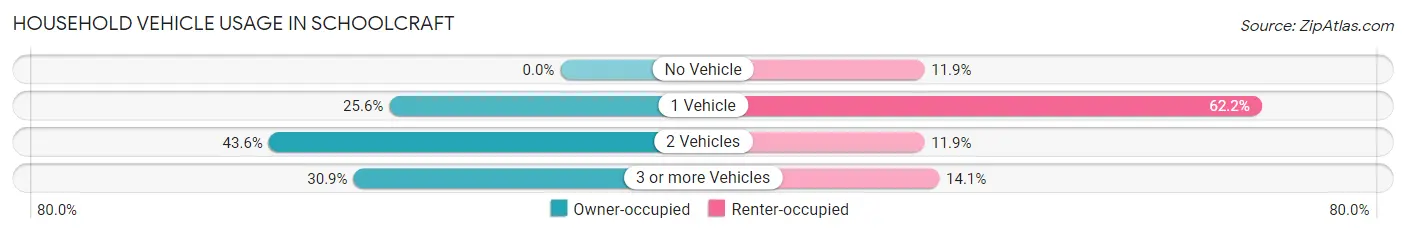
| Vehicles per Household | Owner-occupied | Renter-occupied |
| No Vehicle | 0 (0.0%) | 16 (11.8%) |
| 1 Vehicle | 105 (25.6%) | 84 (62.2%) |
| 2 Vehicles | 179 (43.5%) | 16 (11.8%) |
| 3 or more Vehicles | 127 (30.9%) | 19 (14.1%) |
| Total | 411 (100.0%) | 135 (100.0%) |
Real Estate & Mortgages in Schoolcraft
Real Estate and Mortgage Overview in Schoolcraft
| Characteristic | Without Mortgage | With Mortgage |
| Housing Units | 96 | 315 |
| Median Property Value | $137,500 | $196,100 |
| Median Household Income | $71,250 | $67 |
| Monthly Housing Costs | $473 | $3 |
| Real Estate Taxes | $2,433 | $4 |
Property Value by Mortgage Status in Schoolcraft
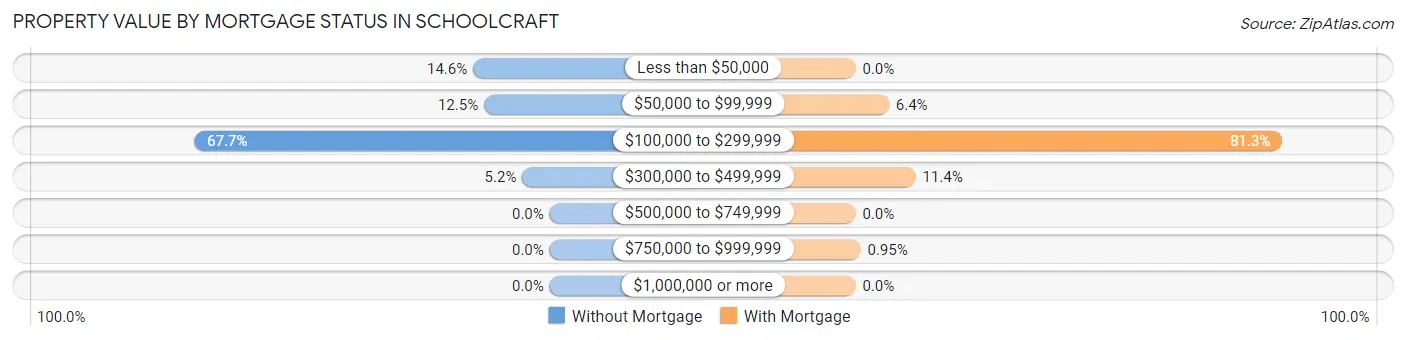
| Property Value | Without Mortgage | With Mortgage |
| Less than $50,000 | 14 (14.6%) | 0 (0.0%) |
| $50,000 to $99,999 | 12 (12.5%) | 20 (6.4%) |
| $100,000 to $299,999 | 65 (67.7%) | 256 (81.3%) |
| $300,000 to $499,999 | 5 (5.2%) | 36 (11.4%) |
| $500,000 to $749,999 | 0 (0.0%) | 0 (0.0%) |
| $750,000 to $999,999 | 0 (0.0%) | 3 (0.9%) |
| $1,000,000 or more | 0 (0.0%) | 0 (0.0%) |
| Total | 96 (100.0%) | 315 (100.0%) |
Household Income by Mortgage Status in Schoolcraft
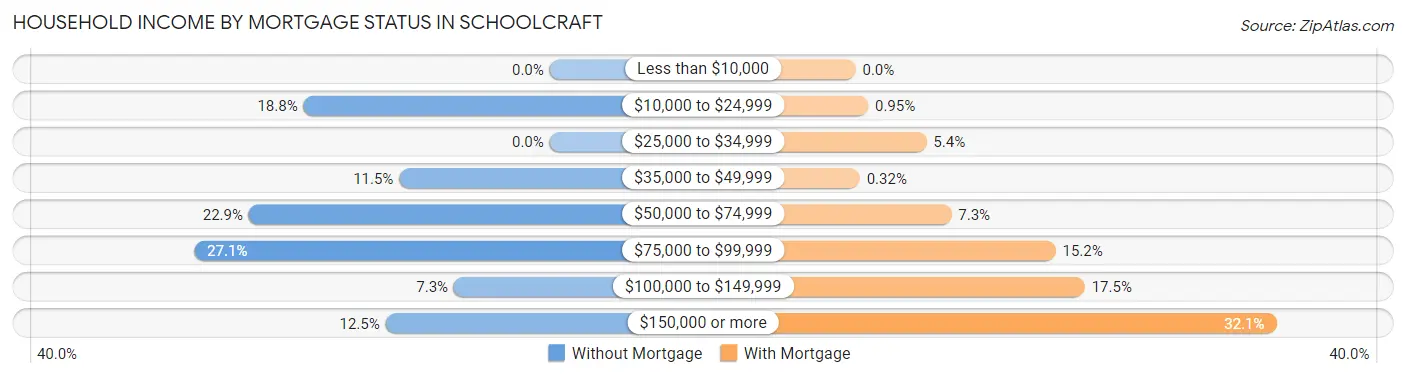
| Household Income | Without Mortgage | With Mortgage |
| Less than $10,000 | 0 (0.0%) | 0 (0.0%) |
| $10,000 to $24,999 | 18 (18.8%) | 3 (0.9%) |
| $25,000 to $34,999 | 0 (0.0%) | 17 (5.4%) |
| $35,000 to $49,999 | 11 (11.5%) | 1 (0.3%) |
| $50,000 to $74,999 | 22 (22.9%) | 23 (7.3%) |
| $75,000 to $99,999 | 26 (27.1%) | 48 (15.2%) |
| $100,000 to $149,999 | 7 (7.3%) | 55 (17.5%) |
| $150,000 or more | 12 (12.5%) | 101 (32.1%) |
| Total | 96 (100.0%) | 315 (100.0%) |
Property Value to Household Income Ratio in Schoolcraft
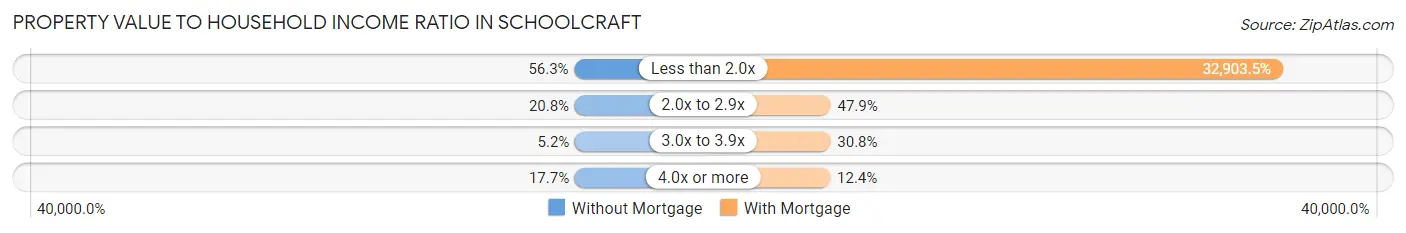
| Value-to-Income Ratio | Without Mortgage | With Mortgage |
| Less than 2.0x | 54 (56.2%) | 103,646 (32,903.5%) |
| 2.0x to 2.9x | 20 (20.8%) | 151 (47.9%) |
| 3.0x to 3.9x | 5 (5.2%) | 97 (30.8%) |
| 4.0x or more | 17 (17.7%) | 39 (12.4%) |
| Total | 96 (100.0%) | 315 (100.0%) |
Real Estate Taxes by Mortgage Status in Schoolcraft
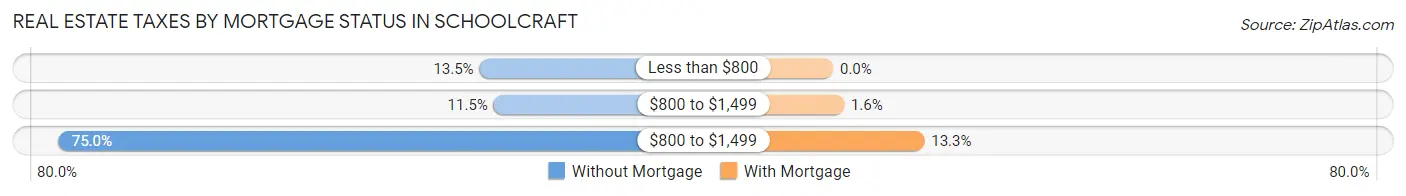
| Property Taxes | Without Mortgage | With Mortgage |
| Less than $800 | 13 (13.5%) | 0 (0.0%) |
| $800 to $1,499 | 11 (11.5%) | 5 (1.6%) |
| $800 to $1,499 | 72 (75.0%) | 42 (13.3%) |
| Total | 96 (100.0%) | 315 (100.0%) |
Health & Disability in Schoolcraft
Health Insurance Coverage by Age in Schoolcraft
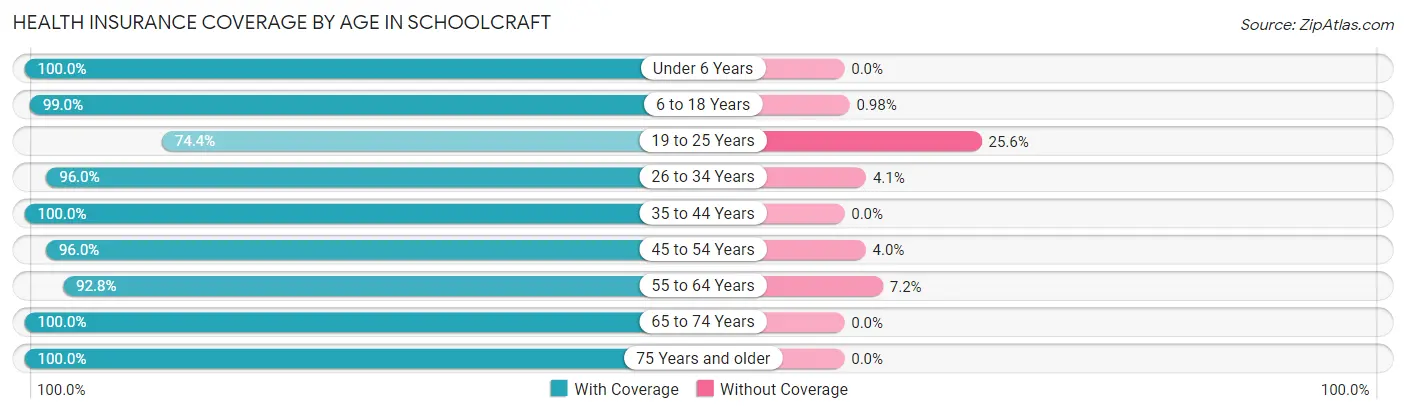
| Age Bracket | With Coverage | Without Coverage |
| Under 6 Years | 110 (100.0%) | 0 (0.0%) |
| 6 to 18 Years | 302 (99.0%) | 3 (1.0%) |
| 19 to 25 Years | 93 (74.4%) | 32 (25.6%) |
| 26 to 34 Years | 166 (96.0%) | 7 (4.1%) |
| 35 to 44 Years | 223 (100.0%) | 0 (0.0%) |
| 45 to 54 Years | 169 (96.0%) | 7 (4.0%) |
| 55 to 64 Years | 129 (92.8%) | 10 (7.2%) |
| 65 to 74 Years | 93 (100.0%) | 0 (0.0%) |
| 75 Years and older | 65 (100.0%) | 0 (0.0%) |
| Total | 1,350 (95.8%) | 59 (4.2%) |
Health Insurance Coverage by Citizenship Status in Schoolcraft

| Citizenship Status | With Coverage | Without Coverage |
| Native Born | 110 (100.0%) | 0 (0.0%) |
| Foreign Born, Citizen | 302 (99.0%) | 3 (1.0%) |
| Foreign Born, not a Citizen | 93 (74.4%) | 32 (25.6%) |
Health Insurance Coverage by Household Income in Schoolcraft
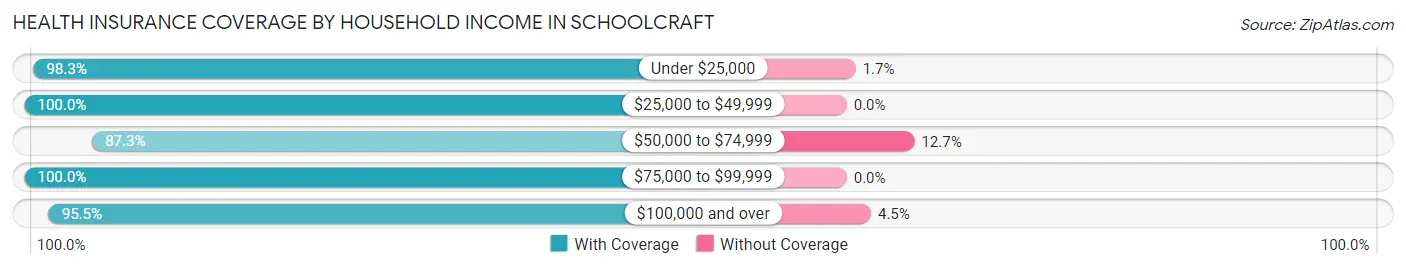
| Household Income | With Coverage | Without Coverage |
| Under $25,000 | 118 (98.3%) | 2 (1.7%) |
| $25,000 to $49,999 | 110 (100.0%) | 0 (0.0%) |
| $50,000 to $74,999 | 186 (87.3%) | 27 (12.7%) |
| $75,000 to $99,999 | 305 (100.0%) | 0 (0.0%) |
| $100,000 and over | 631 (95.5%) | 30 (4.5%) |
Public vs Private Health Insurance Coverage by Age in Schoolcraft
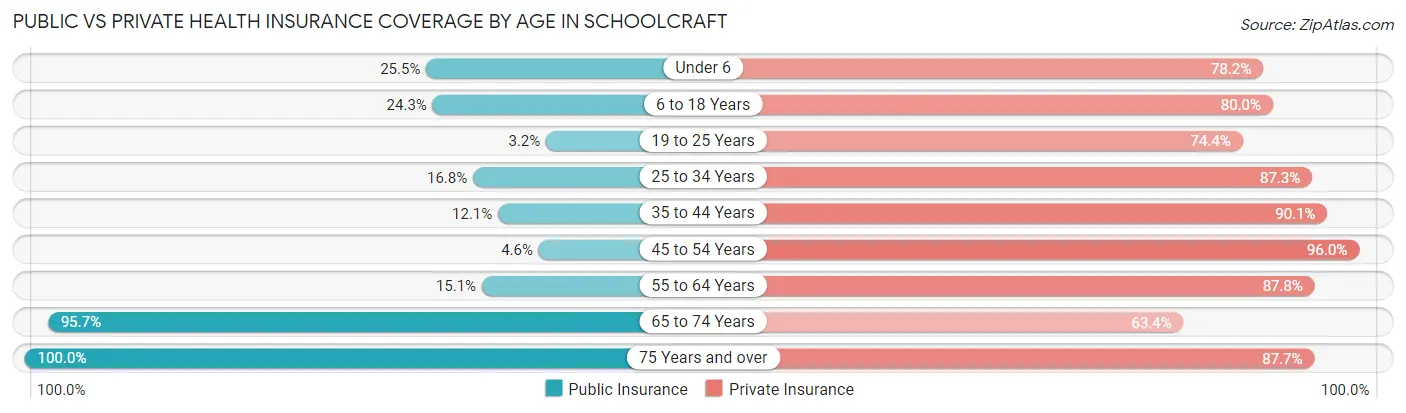
| Age Bracket | Public Insurance | Private Insurance |
| Under 6 | 28 (25.5%) | 86 (78.2%) |
| 6 to 18 Years | 74 (24.3%) | 244 (80.0%) |
| 19 to 25 Years | 4 (3.2%) | 93 (74.4%) |
| 25 to 34 Years | 29 (16.8%) | 151 (87.3%) |
| 35 to 44 Years | 27 (12.1%) | 201 (90.1%) |
| 45 to 54 Years | 8 (4.5%) | 169 (96.0%) |
| 55 to 64 Years | 21 (15.1%) | 122 (87.8%) |
| 65 to 74 Years | 89 (95.7%) | 59 (63.4%) |
| 75 Years and over | 65 (100.0%) | 57 (87.7%) |
| Total | 345 (24.5%) | 1,182 (83.9%) |
Disability Status by Sex by Age in Schoolcraft
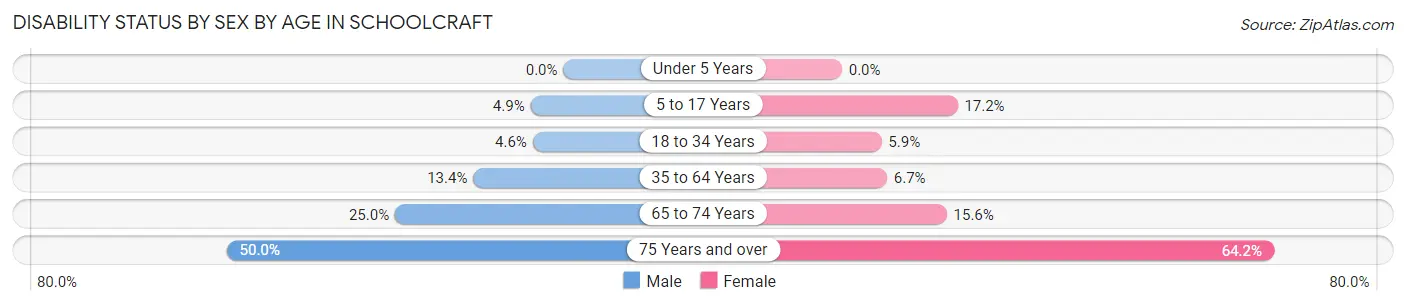
| Age Bracket | Male | Female |
| Under 5 Years | 0 (0.0%) | 0 (0.0%) |
| 5 to 17 Years | 10 (4.9%) | 17 (17.2%) |
| 18 to 34 Years | 8 (4.5%) | 8 (5.9%) |
| 35 to 64 Years | 40 (13.4%) | 16 (6.7%) |
| 65 to 74 Years | 12 (25.0%) | 7 (15.6%) |
| 75 Years and over | 6 (50.0%) | 34 (64.1%) |
Disability Class by Sex by Age in Schoolcraft
Disability Class: Hearing Difficulty
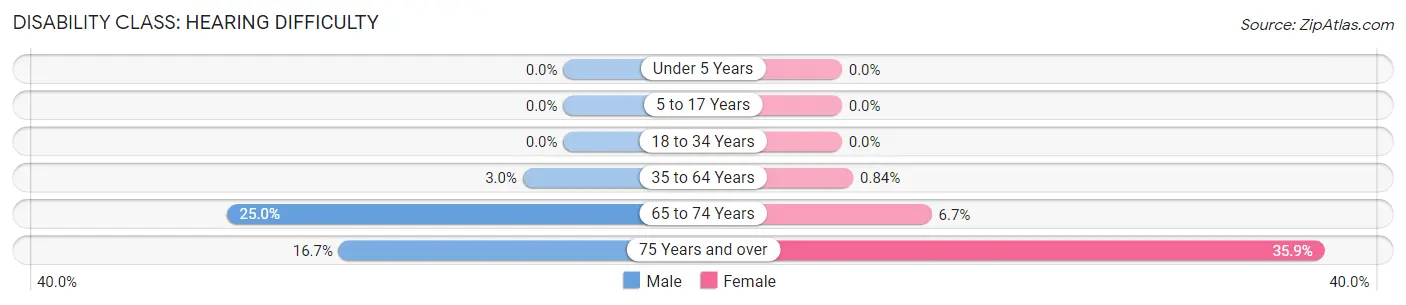
| Age Bracket | Male | Female |
| Under 5 Years | 0 (0.0%) | 0 (0.0%) |
| 5 to 17 Years | 0 (0.0%) | 0 (0.0%) |
| 18 to 34 Years | 0 (0.0%) | 0 (0.0%) |
| 35 to 64 Years | 9 (3.0%) | 2 (0.8%) |
| 65 to 74 Years | 12 (25.0%) | 3 (6.7%) |
| 75 Years and over | 2 (16.7%) | 19 (35.8%) |
Disability Class: Vision Difficulty
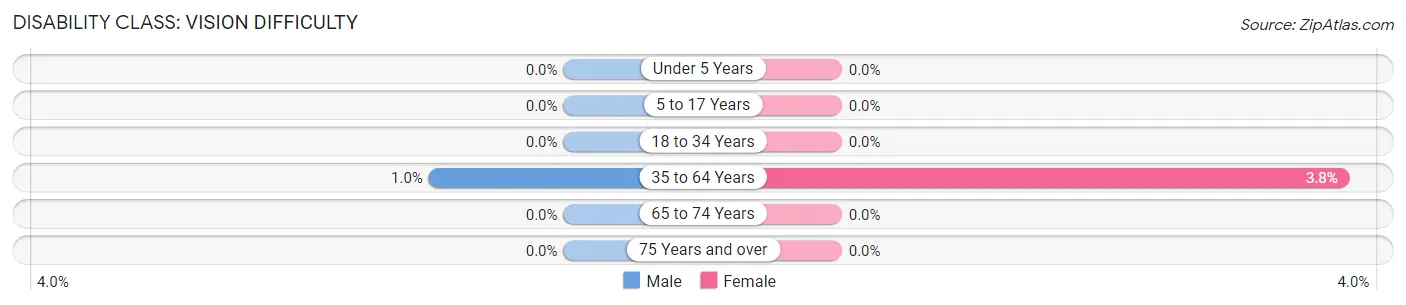
| Age Bracket | Male | Female |
| Under 5 Years | 0 (0.0%) | 0 (0.0%) |
| 5 to 17 Years | 0 (0.0%) | 0 (0.0%) |
| 18 to 34 Years | 0 (0.0%) | 0 (0.0%) |
| 35 to 64 Years | 3 (1.0%) | 9 (3.8%) |
| 65 to 74 Years | 0 (0.0%) | 0 (0.0%) |
| 75 Years and over | 0 (0.0%) | 0 (0.0%) |
Disability Class: Cognitive Difficulty
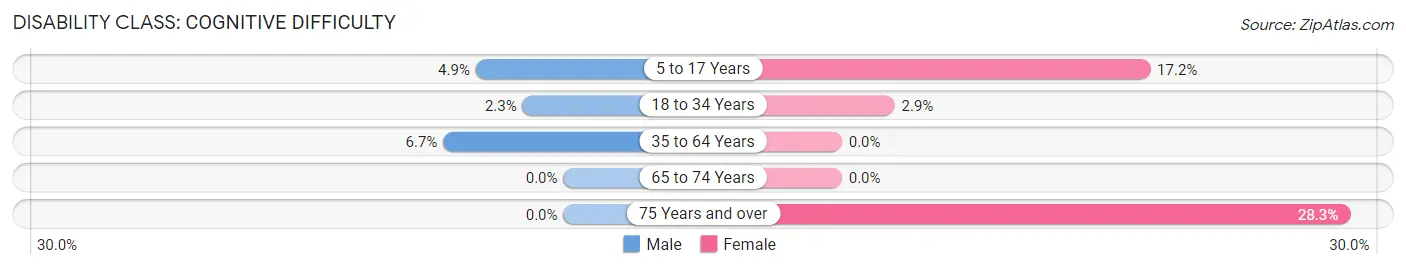
| Age Bracket | Male | Female |
| 5 to 17 Years | 10 (4.9%) | 17 (17.2%) |
| 18 to 34 Years | 4 (2.3%) | 4 (2.9%) |
| 35 to 64 Years | 20 (6.7%) | 0 (0.0%) |
| 65 to 74 Years | 0 (0.0%) | 0 (0.0%) |
| 75 Years and over | 0 (0.0%) | 15 (28.3%) |
Disability Class: Ambulatory Difficulty
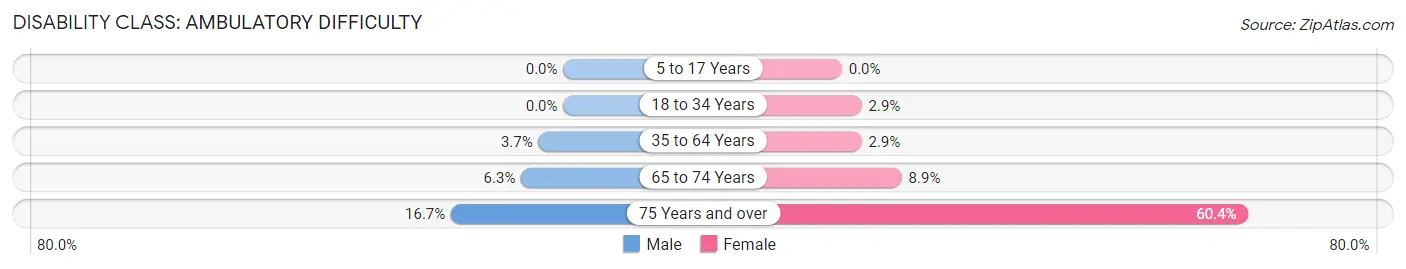
| Age Bracket | Male | Female |
| 5 to 17 Years | 0 (0.0%) | 0 (0.0%) |
| 18 to 34 Years | 0 (0.0%) | 4 (2.9%) |
| 35 to 64 Years | 11 (3.7%) | 7 (2.9%) |
| 65 to 74 Years | 3 (6.2%) | 4 (8.9%) |
| 75 Years and over | 2 (16.7%) | 32 (60.4%) |
Disability Class: Self-Care Difficulty
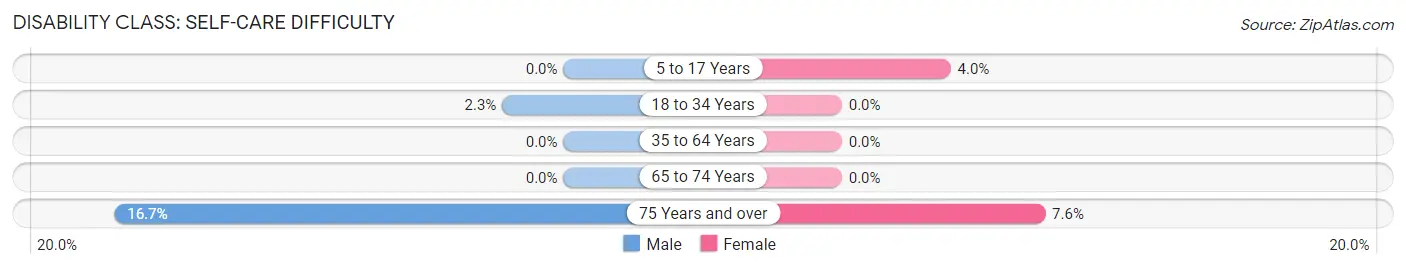
| Age Bracket | Male | Female |
| 5 to 17 Years | 0 (0.0%) | 4 (4.0%) |
| 18 to 34 Years | 4 (2.3%) | 0 (0.0%) |
| 35 to 64 Years | 0 (0.0%) | 0 (0.0%) |
| 65 to 74 Years | 0 (0.0%) | 0 (0.0%) |
| 75 Years and over | 2 (16.7%) | 4 (7.5%) |
Technology Access in Schoolcraft
Computing Device Access in Schoolcraft
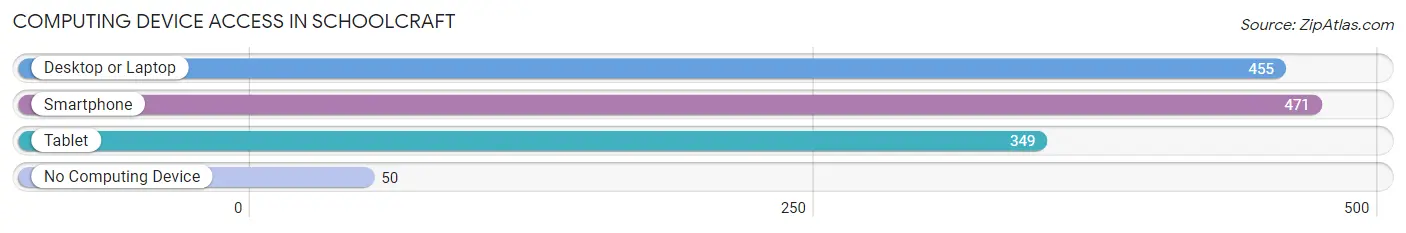
| Device Type | # Households | % Households |
| Desktop or Laptop | 455 | 83.3% |
| Smartphone | 471 | 86.3% |
| Tablet | 349 | 63.9% |
| No Computing Device | 50 | 9.2% |
| Total | 546 | 100.0% |
Internet Access in Schoolcraft
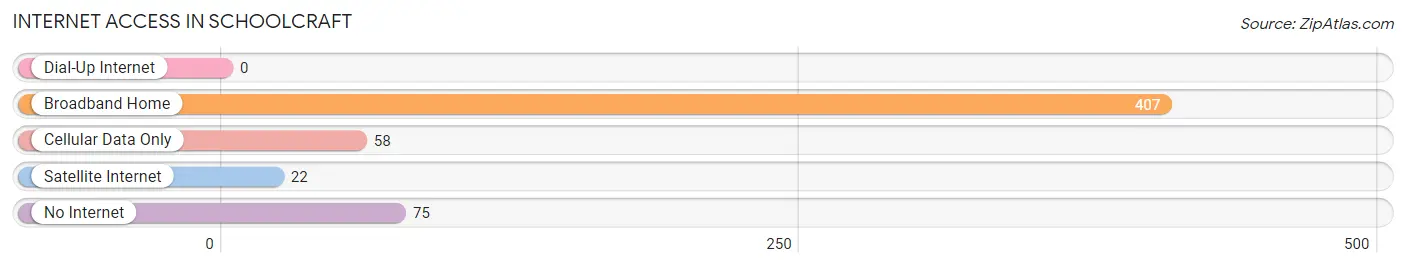
| Internet Type | # Households | % Households |
| Dial-Up Internet | 0 | 0.0% |
| Broadband Home | 407 | 74.5% |
| Cellular Data Only | 58 | 10.6% |
| Satellite Internet | 22 | 4.0% |
| No Internet | 75 | 13.7% |
| Total | 546 | 100.0% |
Schoolcraft Summary
History
The area now known as Schoolcraft, Michigan was first inhabited by the Potawatomi Native Americans. The first white settlers arrived in the area in the early 1800s, and the first permanent settler was a man named John Schoolcraft, who arrived in 1829. Schoolcraft was a surveyor and a veteran of the War of 1812, and he was the first to recognize the potential of the area for farming and timber. He purchased a large tract of land and began to develop it, and the area eventually became known as Schoolcraft.
In 1836, Schoolcraft was incorporated as a village, and it quickly grew in size and population. The village was home to a variety of businesses, including a sawmill, a grist mill, a blacksmith shop, and a general store. The village also had a post office, a school, and a church.
In the late 1800s, the village began to experience a period of growth and prosperity. The railroad arrived in 1871, and this allowed for the transportation of goods and people to and from the village. The village also became a popular tourist destination, as it was located near several lakes and rivers.
In the early 1900s, the village continued to grow and prosper. The population increased, and new businesses opened up. The village also became home to several factories, including a paper mill, a furniture factory, and a canning factory.
In the 1950s, the village began to experience a period of decline. Many of the factories closed, and the population began to decline. In the late 1970s, the village was in danger of becoming a ghost town. However, in the 1980s, the village began to experience a period of revitalization. New businesses opened up, and the population began to increase.
Today, Schoolcraft is a small village with a population of about 1,500 people. The village is home to several businesses, including a grocery store, a hardware store, and a few restaurants. The village also has a post office, a library, and a museum.
Geography
Schoolcraft is located in southwestern Michigan, in Kalamazoo County. The village is situated on the banks of the Kalamazoo River, and it is surrounded by rolling hills and farmland. The village is located about 25 miles south of Kalamazoo, and it is about 50 miles east of Grand Rapids.
The village is located in a temperate climate, with hot summers and cold winters. The average temperature in the summer is around 75 degrees Fahrenheit, and the average temperature in the winter is around 25 degrees Fahrenheit. The village receives an average of 36 inches of precipitation per year.
Economy
The economy of Schoolcraft is largely based on agriculture and tourism. The village is home to several farms, and the surrounding area is known for its production of corn, soybeans, and wheat. The village is also home to several wineries, and it is a popular destination for wine tours.
The village is also home to several small businesses, including a grocery store, a hardware store, and a few restaurants. The village also has a post office, a library, and a museum.
Demographics
As of the 2010 census, the population of Schoolcraft was 1,521. The population is predominantly white (94.3%), with small percentages of African American (2.2%), Hispanic (1.7%), and Asian (0.8%) residents. The median household income is $45,000, and the median home value is $125,000. The village has a high school graduation rate of 95%, and the unemployment rate is 4.2%.
Common Questions
What is Per Capita Income in Schoolcraft?
Per Capita income in Schoolcraft is $34,545.
What is the Median Family Income in Schoolcraft?
Median Family Income in Schoolcraft is $102,917.
What is the Median Household income in Schoolcraft?
Median Household Income in Schoolcraft is $82,500.
What is Income or Wage Gap in Schoolcraft?
Income or Wage Gap in Schoolcraft is 33.8%.
Women in Schoolcraft earn 66.2 cents for every dollar earned by a man.
What is Family Income Deficit in Schoolcraft?
Family Income Deficit in Schoolcraft is $11,780.
Families that are below poverty line in Schoolcraft earn $11,780 less on average than the poverty threshold level.
What is Inequality or Gini Index in Schoolcraft?
Inequality or Gini Index in Schoolcraft is 0.38.
What is the Total Population of Schoolcraft?
Total Population of Schoolcraft is 1,409.
What is the Total Male Population of Schoolcraft?
Total Male Population of Schoolcraft is 779.
What is the Total Female Population of Schoolcraft?
Total Female Population of Schoolcraft is 630.
What is the Ratio of Males per 100 Females in Schoolcraft?
There are 123.65 Males per 100 Females in Schoolcraft.
What is the Ratio of Females per 100 Males in Schoolcraft?
There are 80.87 Females per 100 Males in Schoolcraft.
What is the Median Population Age in Schoolcraft?
Median Population Age in Schoolcraft is 34.5 Years.
What is the Average Family Size in Schoolcraft
Average Family Size in Schoolcraft is 3.4 People.
What is the Average Household Size in Schoolcraft
Average Household Size in Schoolcraft is 2.6 People.
How Large is the Labor Force in Schoolcraft?
There are 788 People in the Labor Forcein in Schoolcraft.
What is the Percentage of People in the Labor Force in Schoolcraft?
75.7% of People are in the Labor Force in Schoolcraft.
What is the Unemployment Rate in Schoolcraft?
Unemployment Rate in Schoolcraft is 1.9%.