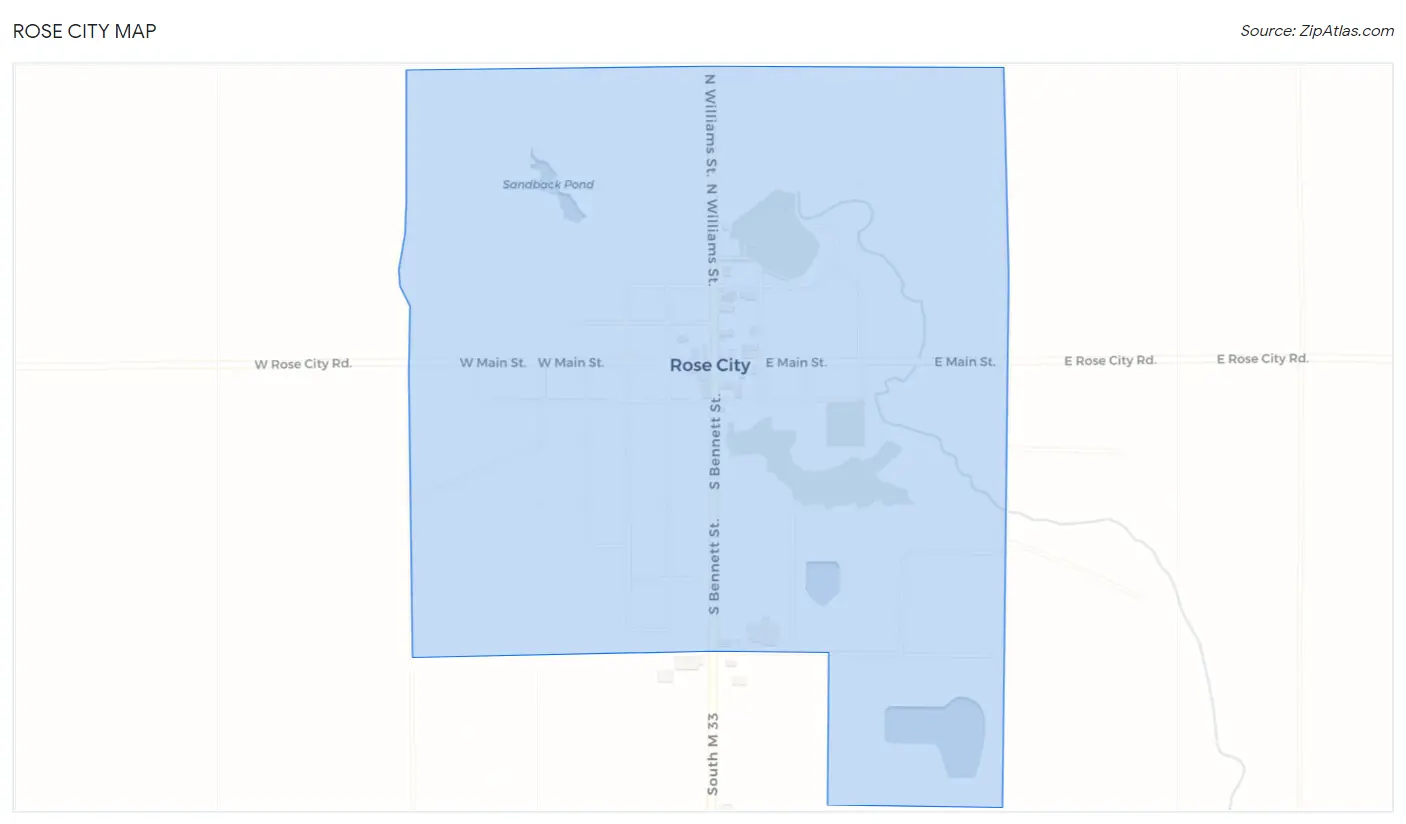
Rose City, MI Map & Demographics
Rose City Map
Rose City Overview
$20,869
PER CAPITA INCOME
$26,429
AVG HOUSEHOLD INCOME
10.4%
WAGE / INCOME GAP [ % ]
89.6¢/ $1
WAGE / INCOME GAP [ $ ]
$10,376
FAMILY INCOME DEFICIT
0.48
INEQUALITY / GINI INDEX
573
TOTAL POPULATION
259
MALE POPULATION
314
FEMALE POPULATION
82.48
MALES / 100 FEMALES
121.24
FEMALES / 100 MALES
44.2
MEDIAN AGE
3.2
AVG FAMILY SIZE
2.4
AVG HOUSEHOLD SIZE
260
LABOR FORCE [ PEOPLE ]
54.4%
PERCENT IN LABOR FORCE
16.9%
UNEMPLOYMENT RATE
Rose City Zip Codes
Rose City Area Codes
Income in Rose City
Income Overview in Rose City
| Characteristic | Number | Measure |
| Per Capita Income | 573 | $20,869 |
| Median Family Income | 110 | $0 |
| Mean Family Income | 110 | $56,224 |
| Median Household Income | 204 | $26,429 |
| Mean Household Income | 204 | $45,333 |
| Income Deficit | 110 | $10,376 |
| Wage / Income Gap (%) | 573 | 10.37% |
| Wage / Income Gap ($) | 573 | 89.63¢ per $1 |
| Gini / Inequality Index | 573 | 0.48 |
Earnings by Sex in Rose City
Average Earnings in Rose City are $21,354, $19,886 for men and $22,188 for women, a difference of 10.4%.
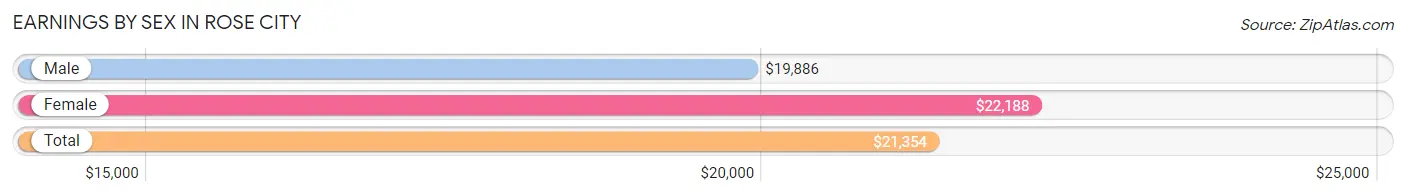
| Sex | Number | Average Earnings |
| Male | 101 (39.6%) | $19,886 |
| Female | 154 (60.4%) | $22,188 |
| Total | 255 (100.0%) | $21,354 |
Earnings by Sex by Income Bracket in Rose City
The most common earnings brackets in Rose City are $55,000 to $64,999 for men (14 | 13.9%) and $75,000 to $99,999 for women (18 | 11.7%).
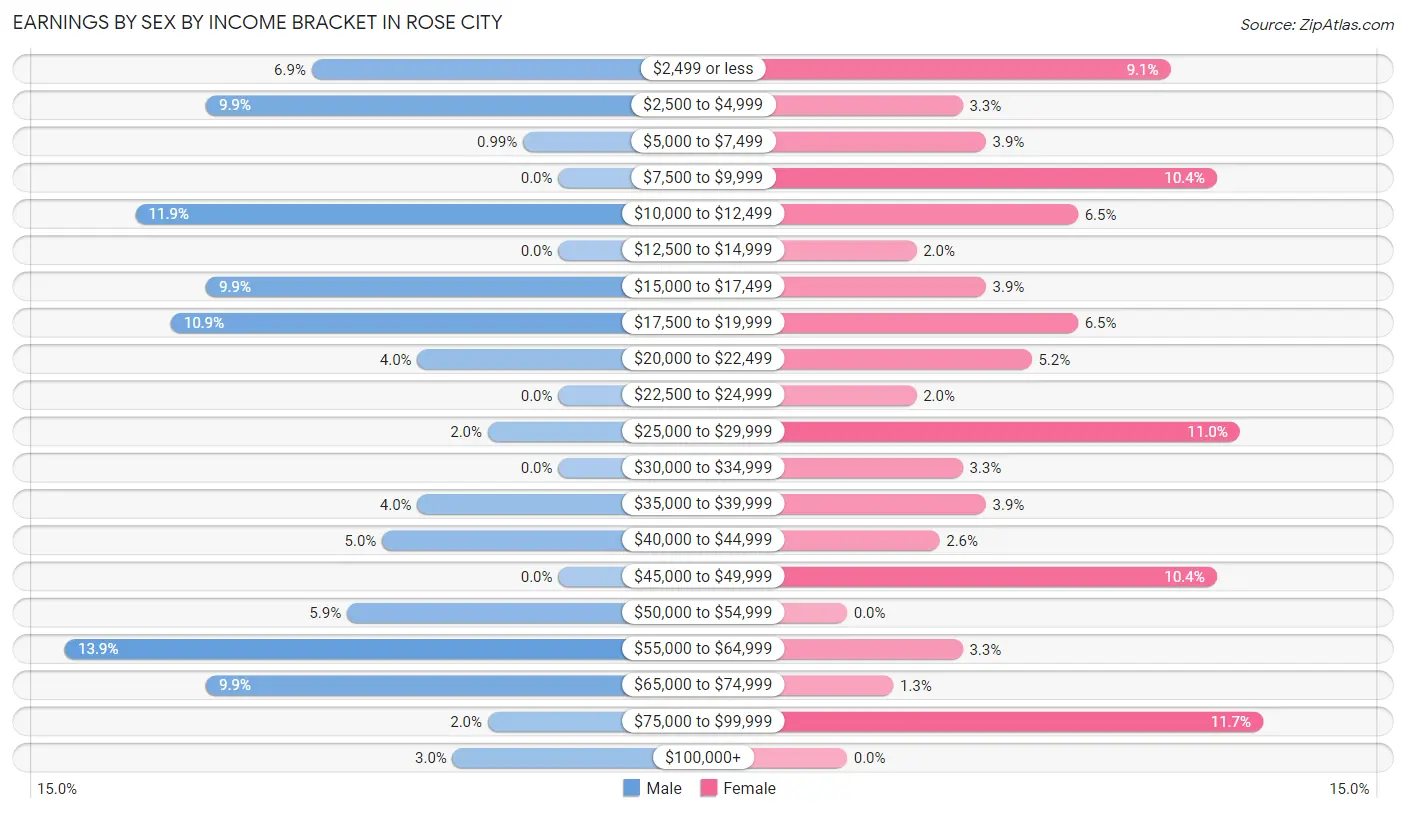
| Income | Male | Female |
| $2,499 or less | 7 (6.9%) | 14 (9.1%) |
| $2,500 to $4,999 | 10 (9.9%) | 5 (3.3%) |
| $5,000 to $7,499 | 1 (1.0%) | 6 (3.9%) |
| $7,500 to $9,999 | 0 (0.0%) | 16 (10.4%) |
| $10,000 to $12,499 | 12 (11.9%) | 10 (6.5%) |
| $12,500 to $14,999 | 0 (0.0%) | 3 (1.9%) |
| $15,000 to $17,499 | 10 (9.9%) | 6 (3.9%) |
| $17,500 to $19,999 | 11 (10.9%) | 10 (6.5%) |
| $20,000 to $22,499 | 4 (4.0%) | 8 (5.2%) |
| $22,500 to $24,999 | 0 (0.0%) | 3 (1.9%) |
| $25,000 to $29,999 | 2 (2.0%) | 17 (11.0%) |
| $30,000 to $34,999 | 0 (0.0%) | 5 (3.3%) |
| $35,000 to $39,999 | 4 (4.0%) | 6 (3.9%) |
| $40,000 to $44,999 | 5 (5.0%) | 4 (2.6%) |
| $45,000 to $49,999 | 0 (0.0%) | 16 (10.4%) |
| $50,000 to $54,999 | 6 (5.9%) | 0 (0.0%) |
| $55,000 to $64,999 | 14 (13.9%) | 5 (3.3%) |
| $65,000 to $74,999 | 10 (9.9%) | 2 (1.3%) |
| $75,000 to $99,999 | 2 (2.0%) | 18 (11.7%) |
| $100,000+ | 3 (3.0%) | 0 (0.0%) |
| Total | 101 (100.0%) | 154 (100.0%) |
Earnings by Sex by Educational Attainment in Rose City
Average earnings in Rose City are $40,833 for men and $29,375 for women, a difference of 28.1%. Men with an educational attainment of college or associate's degree enjoy the highest average annual earnings of $55,000, while those with high school diploma education earn the least with $38,125. Women with an educational attainment of graduate degree earn the most with the average annual earnings of $55,833, while those with college or associate's degree education have the smallest earnings of $19,875.
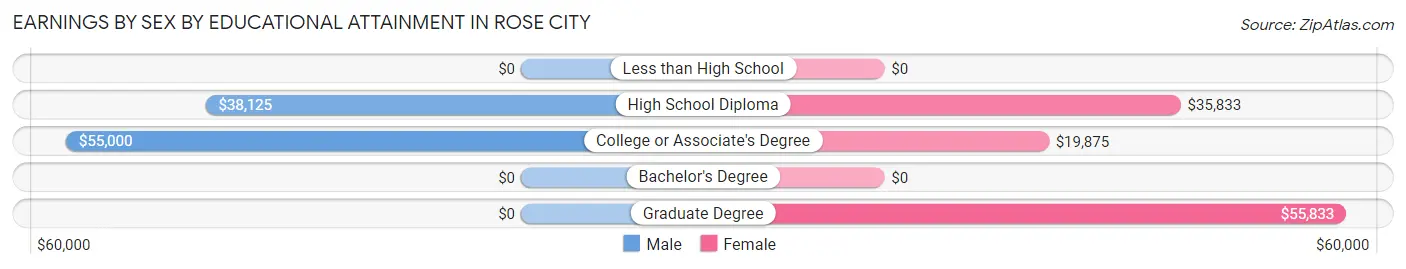
| Educational Attainment | Male Income | Female Income |
| Less than High School | - | - |
| High School Diploma | $38,125 | $35,833 |
| College or Associate's Degree | $55,000 | $19,875 |
| Bachelor's Degree | - | - |
| Graduate Degree | - | - |
| Total | $40,833 | $29,375 |
Family Income in Rose City
Family Income Brackets in Rose City
According to the Rose City family income data, there are 24 families falling into the $100,000 to $149,999 income range, which is the most common income bracket and makes up 21.8% of all families.
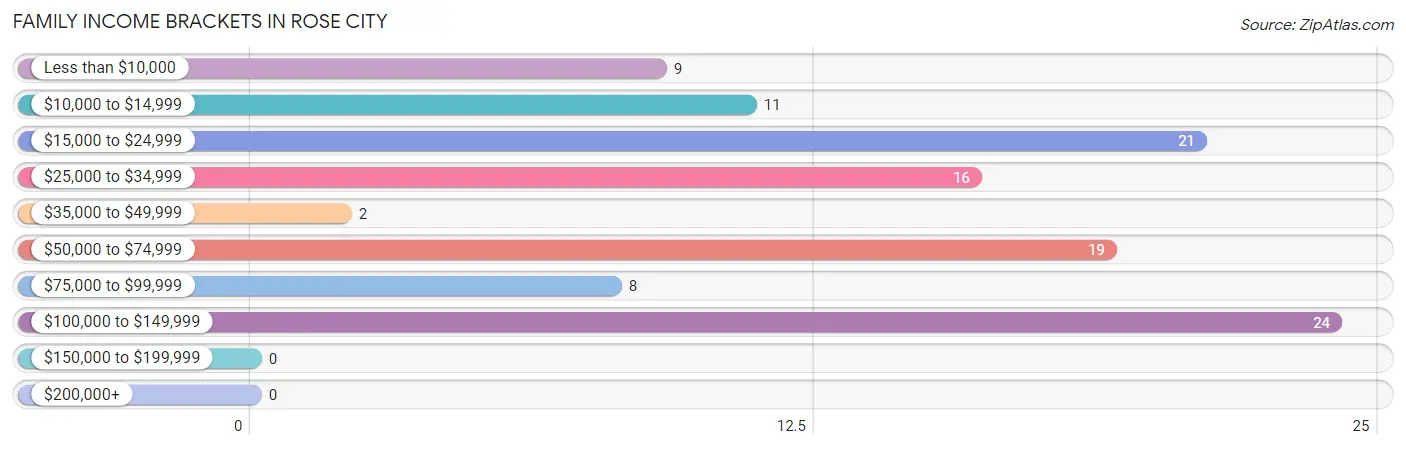
| Income Bracket | # Families | % Families |
| Less than $10,000 | 9 | 8.2% |
| $10,000 to $14,999 | 11 | 10.0% |
| $15,000 to $24,999 | 21 | 19.1% |
| $25,000 to $34,999 | 16 | 14.5% |
| $35,000 to $49,999 | 2 | 1.8% |
| $50,000 to $74,999 | 19 | 17.3% |
| $75,000 to $99,999 | 8 | 7.3% |
| $100,000 to $149,999 | 24 | 21.8% |
| $150,000 to $199,999 | 0 | 0.0% |
| $200,000+ | 0 | 0.0% |
Family Income by Famaliy Size in Rose City
4-person families (18 | 16.4%) account for the highest median family income in Rose City with $73,750 per family, while 4-person families (18 | 16.4%) have the highest median income of $18,438 per family member.
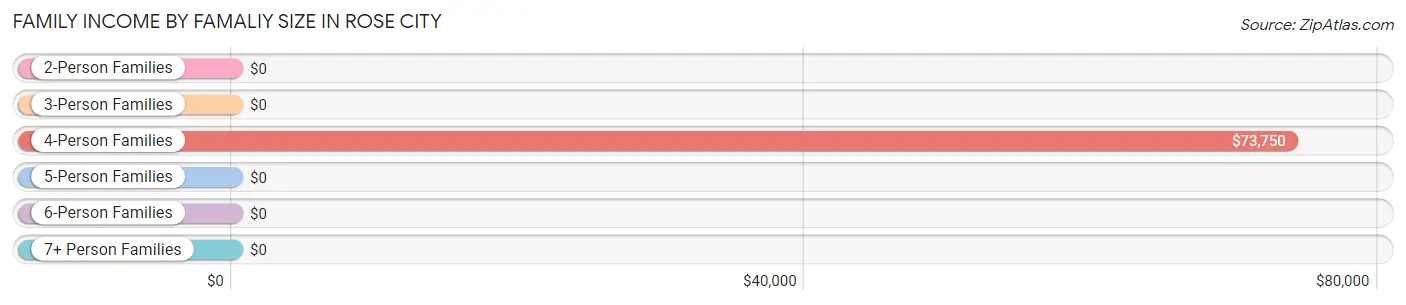
| Income Bracket | # Families | Median Income |
| 2-Person Families | 52 (47.3%) | $0 |
| 3-Person Families | 31 (28.2%) | $0 |
| 4-Person Families | 18 (16.4%) | $73,750 |
| 5-Person Families | 7 (6.4%) | $0 |
| 6-Person Families | 2 (1.8%) | $0 |
| 7+ Person Families | 0 (0.0%) | $0 |
| Total | 110 (100.0%) | $0 |
Family Income by Number of Earners in Rose City
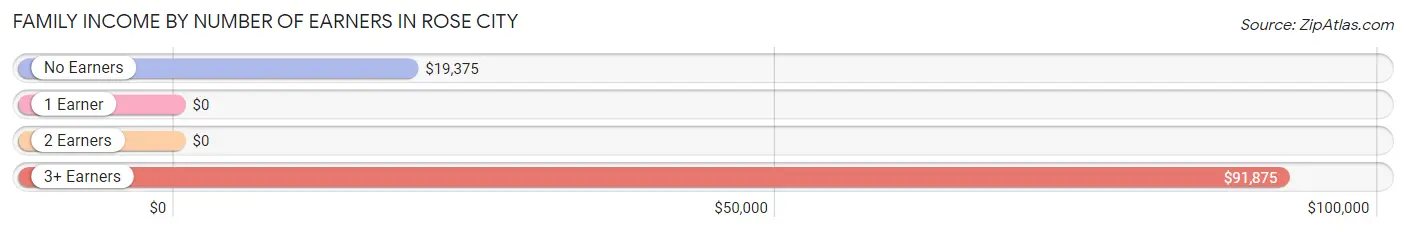
| Number of Earners | # Families | Median Income |
| No Earners | 19 (17.3%) | $19,375 |
| 1 Earner | 44 (40.0%) | $0 |
| 2 Earners | 28 (25.5%) | $0 |
| 3+ Earners | 19 (17.3%) | $91,875 |
| Total | 110 (100.0%) | $0 |
Household Income in Rose City
Household Income Brackets in Rose City
With 48 households falling in the category, the $10,000 to $14,999 income range is the most frequent in Rose City, accounting for 23.5% of all households.
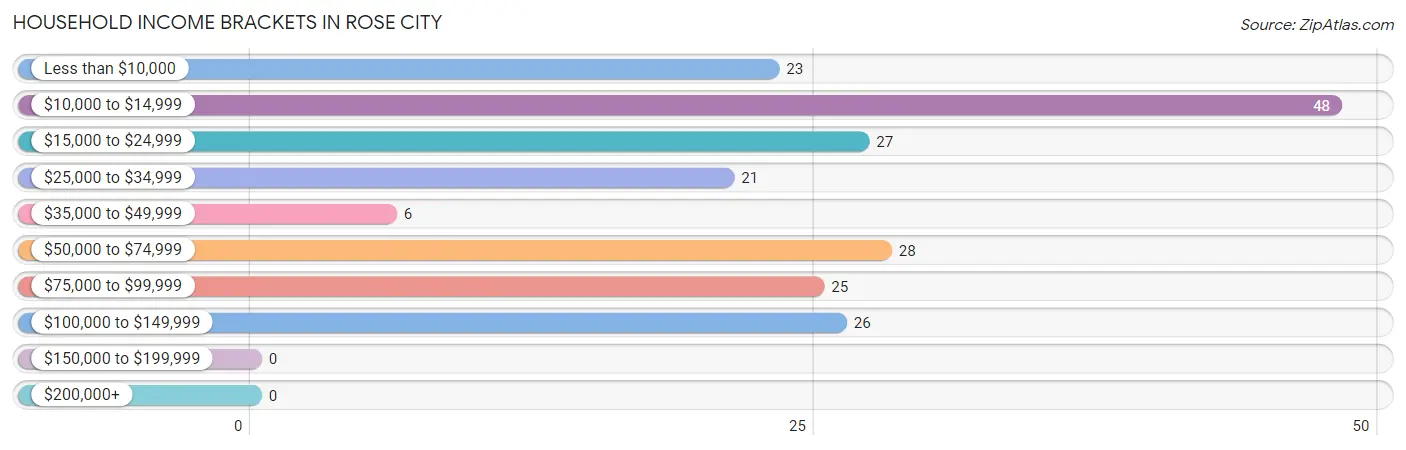
| Income Bracket | # Households | % Households |
| Less than $10,000 | 23 | 11.3% |
| $10,000 to $14,999 | 48 | 23.5% |
| $15,000 to $24,999 | 27 | 13.2% |
| $25,000 to $34,999 | 21 | 10.3% |
| $35,000 to $49,999 | 6 | 2.9% |
| $50,000 to $74,999 | 28 | 13.7% |
| $75,000 to $99,999 | 25 | 12.3% |
| $100,000 to $149,999 | 26 | 12.7% |
| $150,000 to $199,999 | 0 | 0.0% |
| $200,000+ | 0 | 0.0% |
Household Income by Householder Age in Rose City
The median household income in Rose City is $26,429, with the highest median household income of $57,500 found in the 65+ years age bracket for the primary householder. A total of 38 households (18.6%) fall into this category. Meanwhile, the 15 to 24 years age bracket for the primary householder has the lowest median household income of $0, with 6 households (2.9%) in this group.
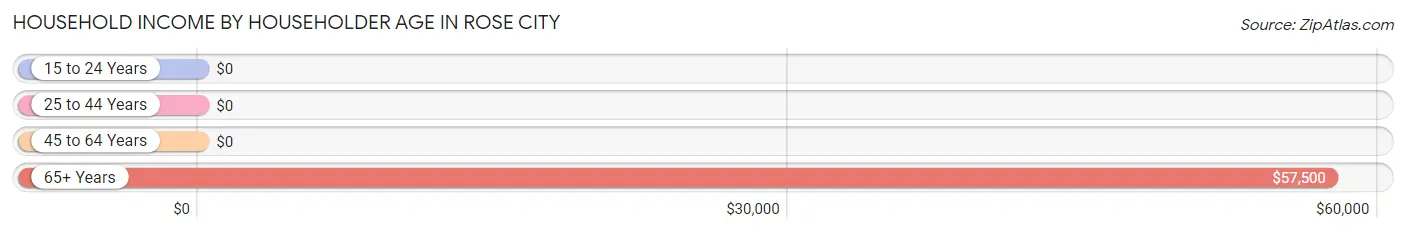
| Income Bracket | # Households | Median Income |
| 15 to 24 Years | 6 (2.9%) | $0 |
| 25 to 44 Years | 78 (38.2%) | $0 |
| 45 to 64 Years | 82 (40.2%) | $0 |
| 65+ Years | 38 (18.6%) | $57,500 |
| Total | 204 (100.0%) | $26,429 |
Poverty in Rose City
Income Below Poverty by Sex and Age in Rose City
With 36.1% poverty level for males and 35.1% for females among the residents of Rose City, 55 to 64 year old males and 6 to 11 year old females are the most vulnerable to poverty, with 31 males (70.5%) and 13 females (100.0%) in their respective age groups living below the poverty level.
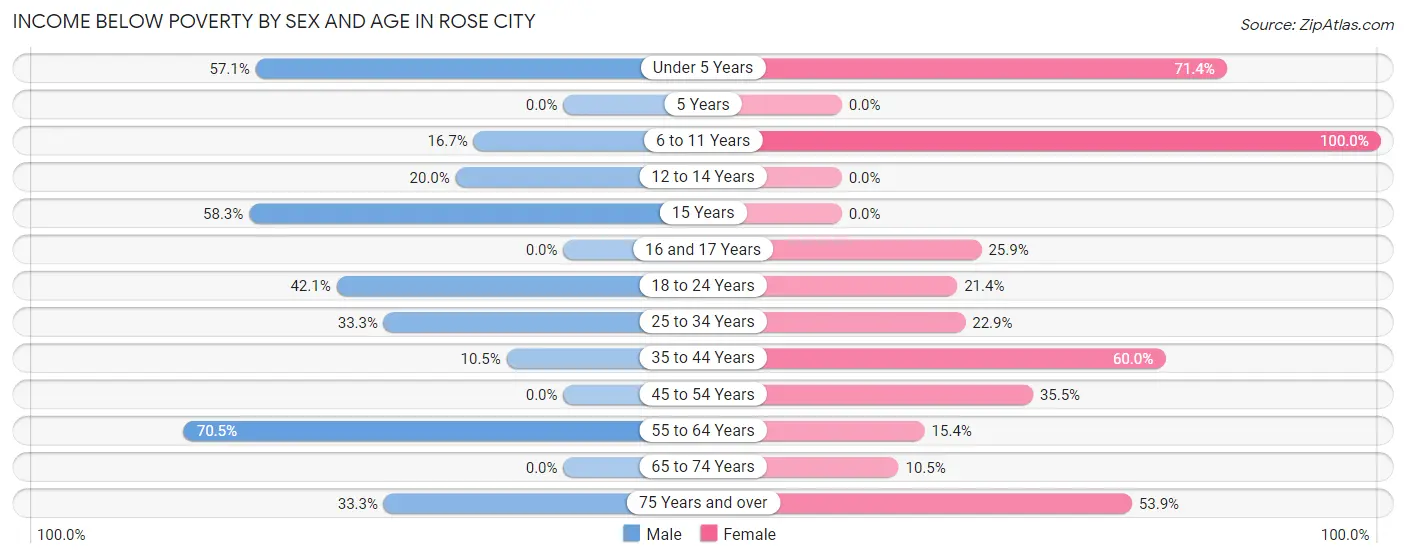
| Age Bracket | Male | Female |
| Under 5 Years | 8 (57.1%) | 10 (71.4%) |
| 5 Years | 0 (0.0%) | 0 (0.0%) |
| 6 to 11 Years | 2 (16.7%) | 13 (100.0%) |
| 12 to 14 Years | 2 (20.0%) | 0 (0.0%) |
| 15 Years | 7 (58.3%) | 0 (0.0%) |
| 16 and 17 Years | 0 (0.0%) | 7 (25.9%) |
| 18 to 24 Years | 16 (42.1%) | 3 (21.4%) |
| 25 to 34 Years | 7 (33.3%) | 11 (22.9%) |
| 35 to 44 Years | 2 (10.5%) | 21 (60.0%) |
| 45 to 54 Years | 0 (0.0%) | 11 (35.5%) |
| 55 to 64 Years | 31 (70.5%) | 6 (15.4%) |
| 65 to 74 Years | 0 (0.0%) | 2 (10.5%) |
| 75 Years and over | 3 (33.3%) | 7 (53.8%) |
| Total | 78 (36.1%) | 91 (35.1%) |
Income Above Poverty by Sex and Age in Rose City
According to the poverty statistics in Rose City, males aged 16 and 17 years and females aged 12 to 14 years are the age groups that are most secure financially, with 100.0% of males and 100.0% of females in these age groups living above the poverty line.
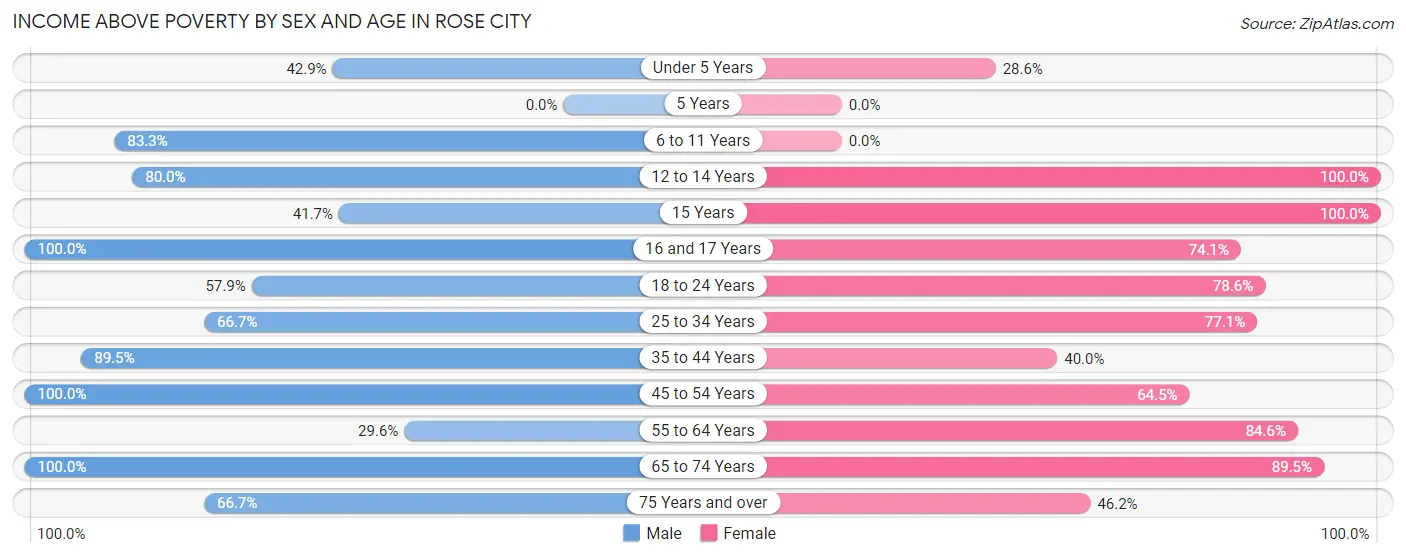
| Age Bracket | Male | Female |
| Under 5 Years | 6 (42.9%) | 4 (28.6%) |
| 5 Years | 0 (0.0%) | 0 (0.0%) |
| 6 to 11 Years | 10 (83.3%) | 0 (0.0%) |
| 12 to 14 Years | 8 (80.0%) | 2 (100.0%) |
| 15 Years | 5 (41.7%) | 4 (100.0%) |
| 16 and 17 Years | 1 (100.0%) | 20 (74.1%) |
| 18 to 24 Years | 22 (57.9%) | 11 (78.6%) |
| 25 to 34 Years | 14 (66.7%) | 37 (77.1%) |
| 35 to 44 Years | 17 (89.5%) | 14 (40.0%) |
| 45 to 54 Years | 17 (100.0%) | 20 (64.5%) |
| 55 to 64 Years | 13 (29.5%) | 33 (84.6%) |
| 65 to 74 Years | 19 (100.0%) | 17 (89.5%) |
| 75 Years and over | 6 (66.7%) | 6 (46.2%) |
| Total | 138 (63.9%) | 168 (64.9%) |
Income Below Poverty Among Married-Couple Families in Rose City
The poverty statistics for married-couple families in Rose City show that 21.4% or 12 of the total 56 families live below the poverty line. Families with 3 or 4 children have the highest poverty rate of 55.6%, comprising of 5 families. On the other hand, families with 1 or 2 children have the lowest poverty rate of 14.3%, which includes 2 families.
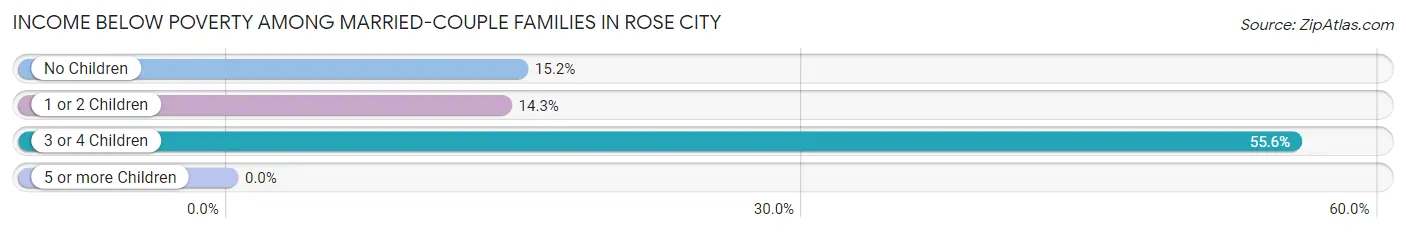
| Children | Above Poverty | Below Poverty |
| No Children | 28 (84.9%) | 5 (15.1%) |
| 1 or 2 Children | 12 (85.7%) | 2 (14.3%) |
| 3 or 4 Children | 4 (44.4%) | 5 (55.6%) |
| 5 or more Children | 0 (0.0%) | 0 (0.0%) |
| Total | 44 (78.6%) | 12 (21.4%) |
Income Below Poverty Among Single-Parent Households in Rose City
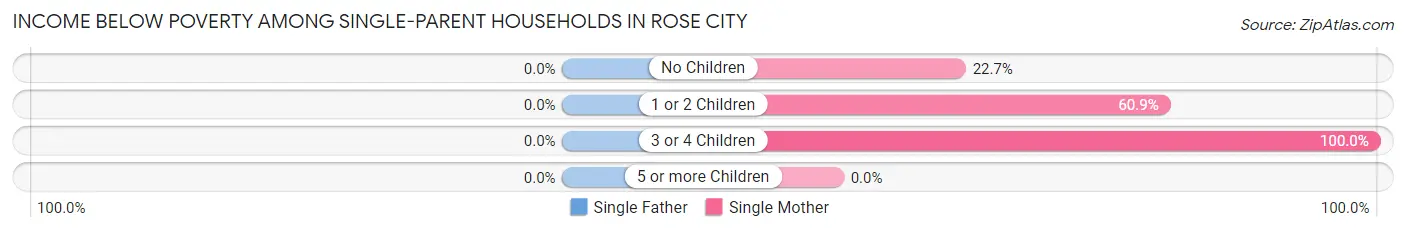
| Children | Single Father | Single Mother |
| No Children | 0 (0.0%) | 5 (22.7%) |
| 1 or 2 Children | 0 (0.0%) | 14 (60.9%) |
| 3 or 4 Children | 0 (0.0%) | 2 (100.0%) |
| 5 or more Children | 0 (0.0%) | 0 (0.0%) |
| Total | 0 (0.0%) | 21 (44.7%) |
Income Below Poverty Among Married-Couple vs Single-Parent Households in Rose City
The poverty data for Rose City shows that 12 of the married-couple family households (21.4%) and 21 of the single-parent households (38.9%) are living below the poverty level. Within the married-couple family households, those with 3 or 4 children have the highest poverty rate, with 5 households (55.6%) falling below the poverty line. Among the single-parent households, those with 3 or 4 children have the highest poverty rate, with 2 household (100.0%) living below poverty.
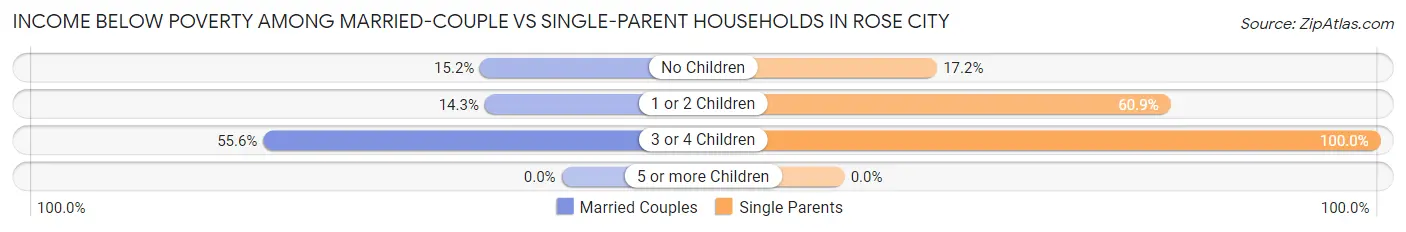
| Children | Married-Couple Families | Single-Parent Households |
| No Children | 5 (15.1%) | 5 (17.2%) |
| 1 or 2 Children | 2 (14.3%) | 14 (60.9%) |
| 3 or 4 Children | 5 (55.6%) | 2 (100.0%) |
| 5 or more Children | 0 (0.0%) | 0 (0.0%) |
| Total | 12 (21.4%) | 21 (38.9%) |
Race in Rose City
The most populous races in Rose City are White / Caucasian (554 | 96.7%), Hispanic or Latino (13 | 2.3%), and Black / African American (10 | 1.8%).
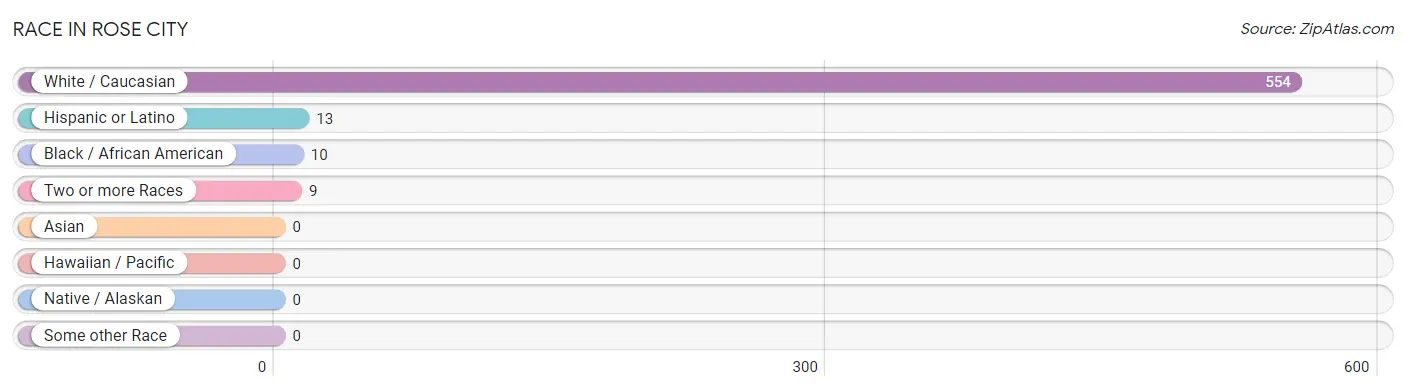
| Race | # Population | % Population |
| Asian | 0 | 0.0% |
| Black / African American | 10 | 1.8% |
| Hawaiian / Pacific | 0 | 0.0% |
| Hispanic or Latino | 13 | 2.3% |
| Native / Alaskan | 0 | 0.0% |
| White / Caucasian | 554 | 96.7% |
| Two or more Races | 9 | 1.6% |
| Some other Race | 0 | 0.0% |
| Total | 573 | 100.0% |
Ancestry in Rose City
The most populous ancestries reported in Rose City are English (61 | 10.6%), Irish (60 | 10.5%), German (56 | 9.8%), French Canadian (27 | 4.7%), and French (26 | 4.5%), together accounting for 40.1% of all Rose City residents.
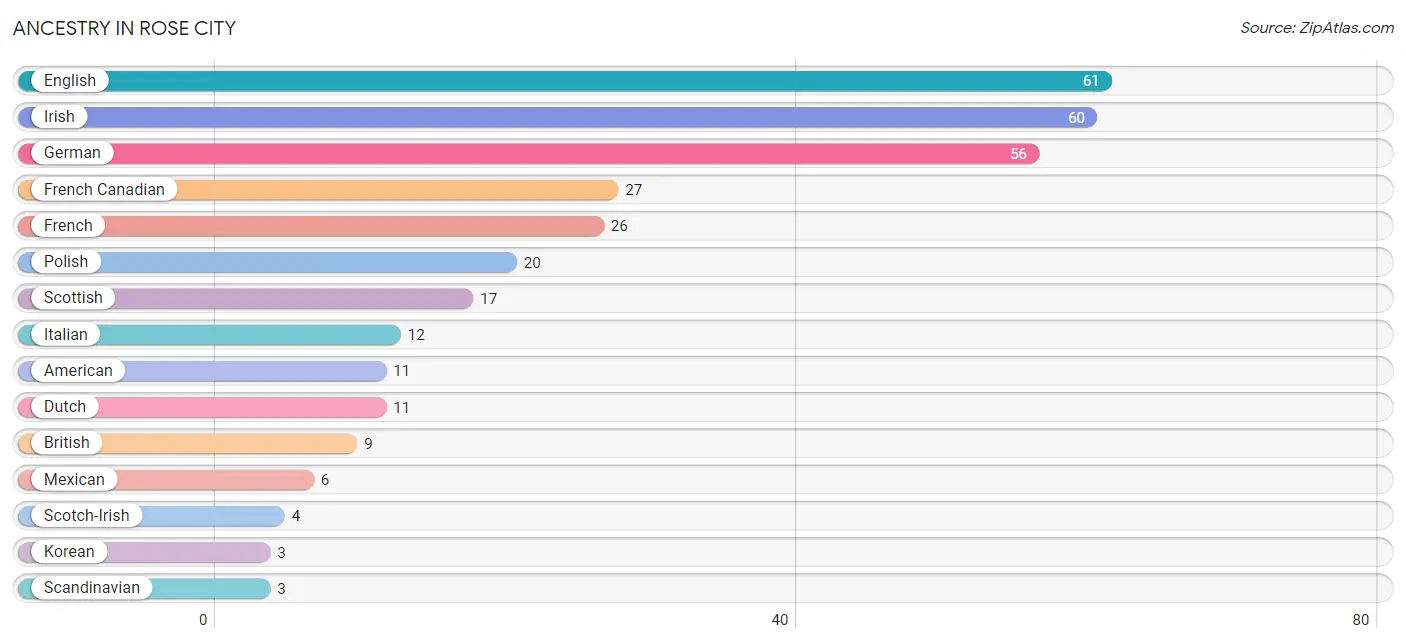
| Ancestry | # Population | % Population |
| American | 11 | 1.9% |
| British | 9 | 1.6% |
| Cuban | 2 | 0.4% |
| Dutch | 11 | 1.9% |
| English | 61 | 10.6% |
| French | 26 | 4.5% |
| French Canadian | 27 | 4.7% |
| German | 56 | 9.8% |
| Irish | 60 | 10.5% |
| Italian | 12 | 2.1% |
| Korean | 3 | 0.5% |
| Mexican | 6 | 1.1% |
| Polish | 20 | 3.5% |
| Puerto Rican | 1 | 0.2% |
| Russian | 2 | 0.4% |
| Scandinavian | 3 | 0.5% |
| Scotch-Irish | 4 | 0.7% |
| Scottish | 17 | 3.0% |
| Welsh | 1 | 0.2% | View All 19 Rows |
Immigrants in Rose City
The most numerous immigrant groups reported in Rose City came from , and Canada (2 | 0.4%), together accounting for 0.4% of all Rose City residents.

| Immigration Origin | # Population | % Population |
| Canada | 2 | 0.4% | View All 1 Rows |
Sex and Age in Rose City
Sex and Age in Rose City
The most populous age groups in Rose City are 60 to 64 Years (33 | 12.7%) for men and 25 to 29 Years (35 | 11.2%) for women.
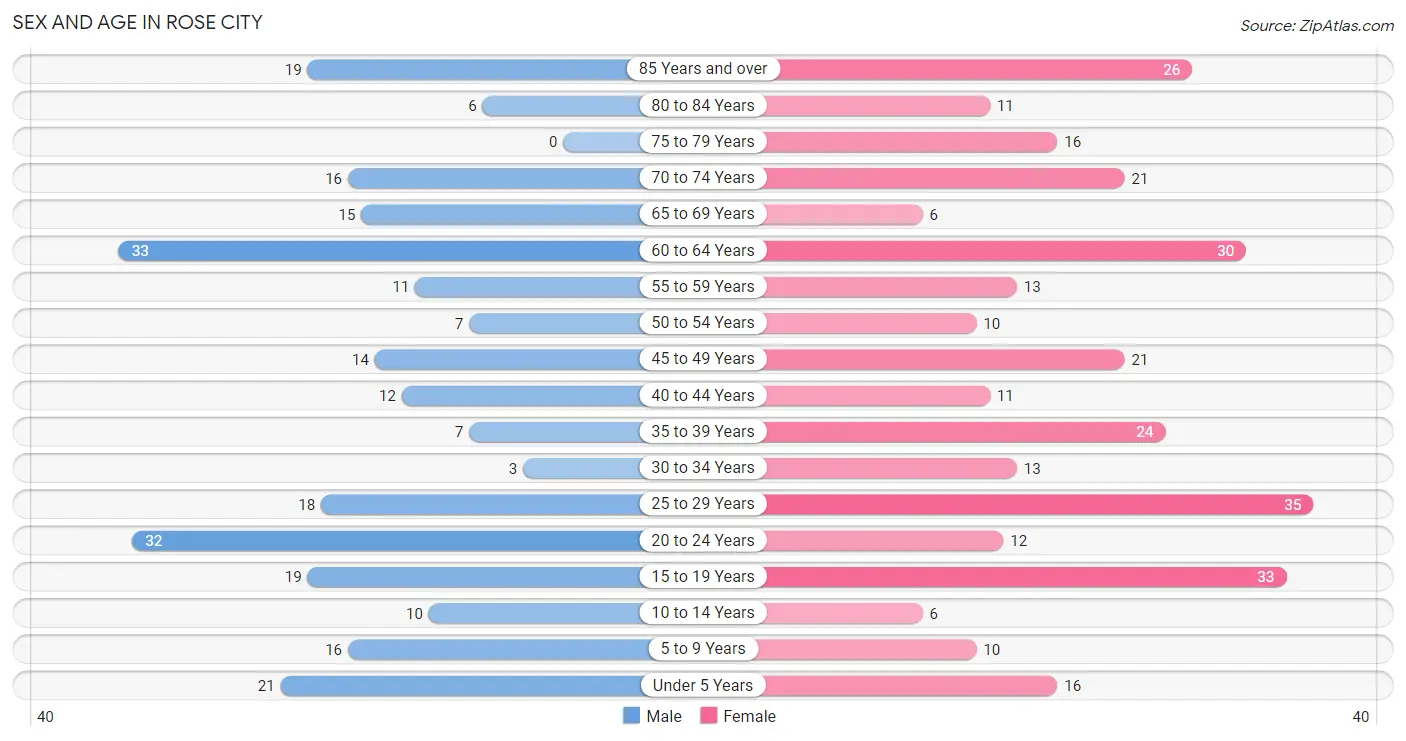
| Age Bracket | Male | Female |
| Under 5 Years | 21 (8.1%) | 16 (5.1%) |
| 5 to 9 Years | 16 (6.2%) | 10 (3.2%) |
| 10 to 14 Years | 10 (3.9%) | 6 (1.9%) |
| 15 to 19 Years | 19 (7.3%) | 33 (10.5%) |
| 20 to 24 Years | 32 (12.4%) | 12 (3.8%) |
| 25 to 29 Years | 18 (7.0%) | 35 (11.2%) |
| 30 to 34 Years | 3 (1.2%) | 13 (4.1%) |
| 35 to 39 Years | 7 (2.7%) | 24 (7.6%) |
| 40 to 44 Years | 12 (4.6%) | 11 (3.5%) |
| 45 to 49 Years | 14 (5.4%) | 21 (6.7%) |
| 50 to 54 Years | 7 (2.7%) | 10 (3.2%) |
| 55 to 59 Years | 11 (4.3%) | 13 (4.1%) |
| 60 to 64 Years | 33 (12.7%) | 30 (9.6%) |
| 65 to 69 Years | 15 (5.8%) | 6 (1.9%) |
| 70 to 74 Years | 16 (6.2%) | 21 (6.7%) |
| 75 to 79 Years | 0 (0.0%) | 16 (5.1%) |
| 80 to 84 Years | 6 (2.3%) | 11 (3.5%) |
| 85 Years and over | 19 (7.3%) | 26 (8.3%) |
| Total | 259 (100.0%) | 314 (100.0%) |
Families and Households in Rose City
Median Family Size in Rose City
The median family size in Rose City is 3.19 persons per family, with married-couple families (56 | 50.9%) accounting for the largest median family size of 3.57 persons per family. On the other hand, single male/father families (7 | 6.4%) represent the smallest median family size with 2.00 persons per family.
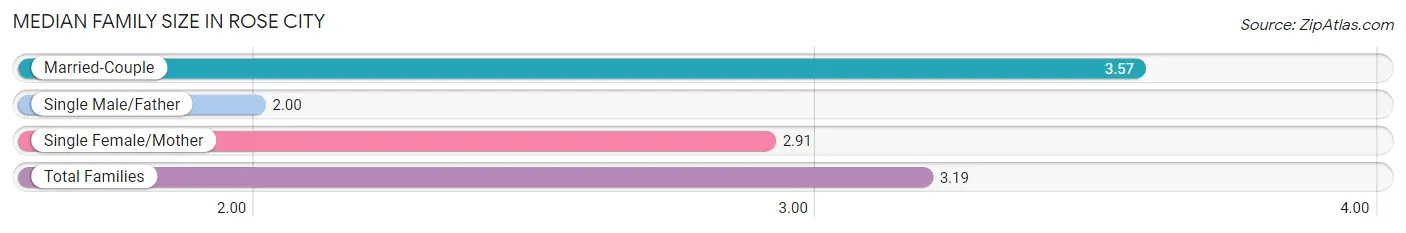
| Family Type | # Families | Family Size |
| Married-Couple | 56 (50.9%) | 3.57 |
| Single Male/Father | 7 (6.4%) | 2.00 |
| Single Female/Mother | 47 (42.7%) | 2.91 |
| Total Families | 110 (100.0%) | 3.19 |
Median Household Size in Rose City
The median household size in Rose City is 2.40 persons per household, with single female/mother households (47 | 23.0%) accounting for the largest median household size of 3.62 persons per household. non-family households (94 | 46.1%) represent the smallest median household size with 1.12 persons per household.
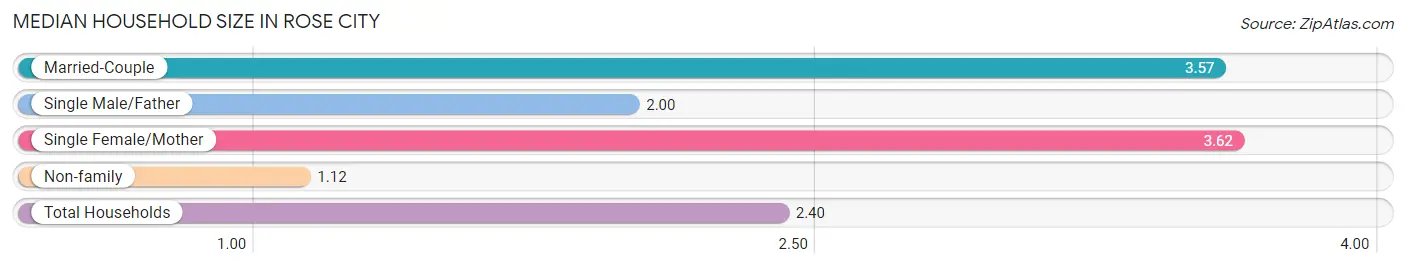
| Household Type | # Households | Household Size |
| Married-Couple | 56 (27.5%) | 3.57 |
| Single Male/Father | 7 (3.4%) | 2.00 |
| Single Female/Mother | 47 (23.0%) | 3.62 |
| Non-family | 94 (46.1%) | 1.12 |
| Total Households | 204 (100.0%) | 2.40 |
Household Size by Marriage Status in Rose City
Out of a total of 204 households in Rose City, 110 (53.9%) are family households, while 94 (46.1%) are nonfamily households. The most numerous type of family households are 2-person households, comprising 52, and the most common type of nonfamily households are 1-person households, comprising 86.
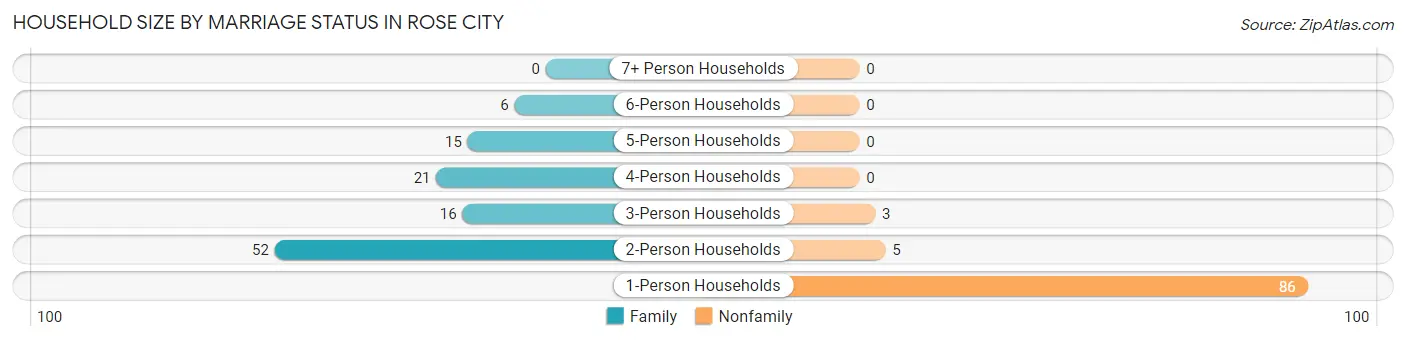
| Household Size | Family Households | Nonfamily Households |
| 1-Person Households | - | 86 (42.2%) |
| 2-Person Households | 52 (25.5%) | 5 (2.5%) |
| 3-Person Households | 16 (7.8%) | 3 (1.5%) |
| 4-Person Households | 21 (10.3%) | 0 (0.0%) |
| 5-Person Households | 15 (7.3%) | 0 (0.0%) |
| 6-Person Households | 6 (2.9%) | 0 (0.0%) |
| 7+ Person Households | 0 (0.0%) | 0 (0.0%) |
| Total | 110 (53.9%) | 94 (46.1%) |
Female Fertility in Rose City
Fertility by Age in Rose City
Average fertility rate in Rose City is 90.0 births per 1,000 women. Women in the age bracket of 20 to 34 years have the highest fertility rate with 233.0 births per 1,000 women. Women in the age bracket of 20 to 34 years acount for 100.0% of all women with births.
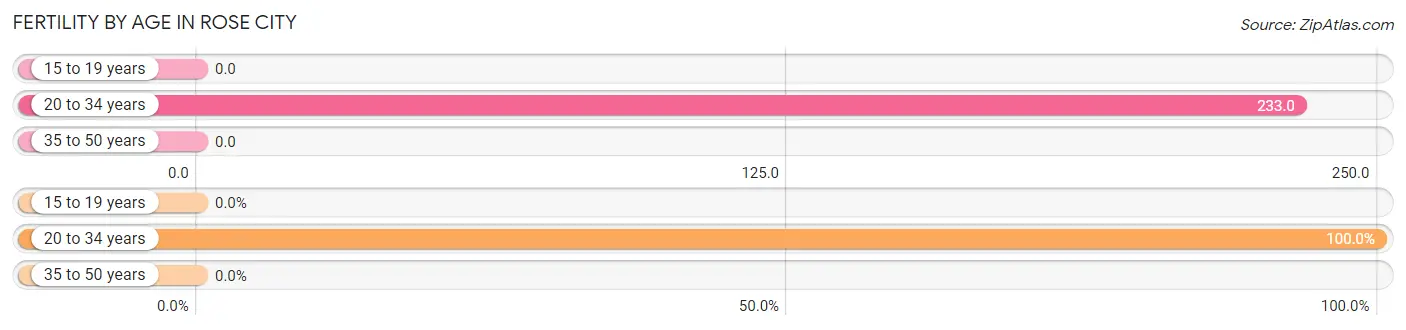
| Age Bracket | Women with Births | Births / 1,000 Women |
| 15 to 19 years | 0 (0.0%) | 0.0 |
| 20 to 34 years | 14 (100.0%) | 233.0 |
| 35 to 50 years | 0 (0.0%) | 0.0 |
| Total | 14 (100.0%) | 90.0 |
Fertility by Age by Marriage Status in Rose City
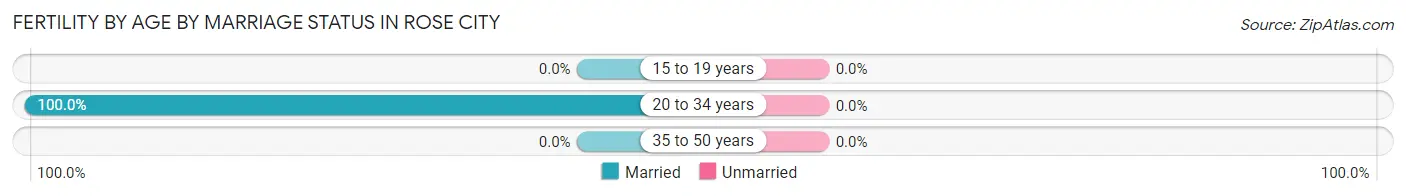
| Age Bracket | Married | Unmarried |
| 15 to 19 years | 0 (0.0%) | 0 (0.0%) |
| 20 to 34 years | 14 (100.0%) | 0 (0.0%) |
| 35 to 50 years | 0 (0.0%) | 0 (0.0%) |
| Total | 14 (100.0%) | 0 (0.0%) |
Fertility by Education in Rose City
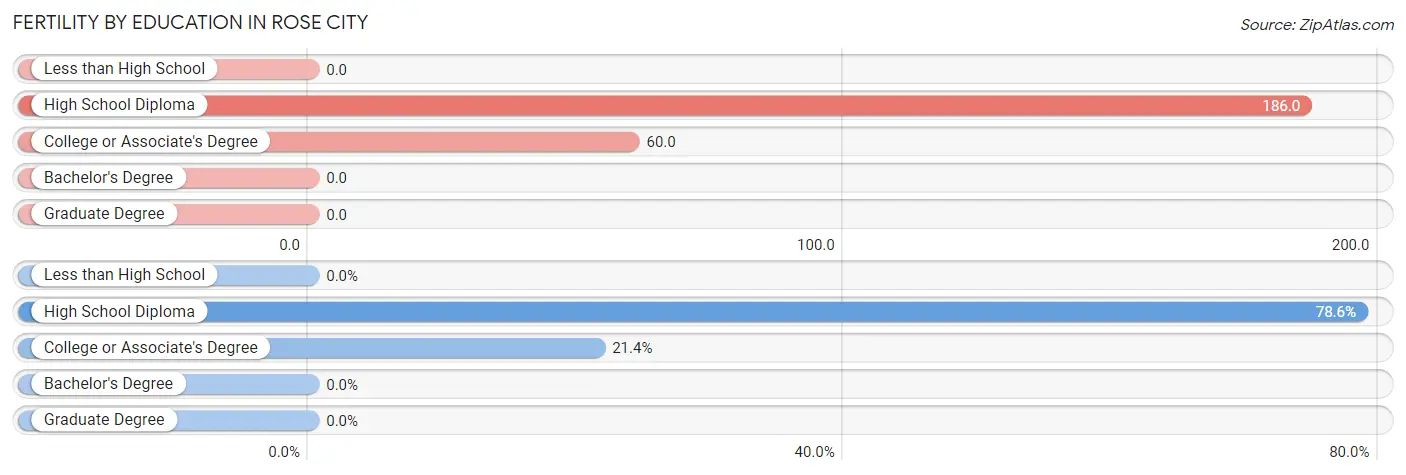
| Educational Attainment | Women with Births | Births / 1,000 Women |
| Less than High School | 0 (0.0%) | 0.0 |
| High School Diploma | 11 (78.6%) | 186.0 |
| College or Associate's Degree | 3 (21.4%) | 60.0 |
| Bachelor's Degree | 0 (0.0%) | 0.0 |
| Graduate Degree | 0 (0.0%) | 0.0 |
| Total | 14 (100.0%) | 90.0 |
Fertility by Education by Marriage Status in Rose City
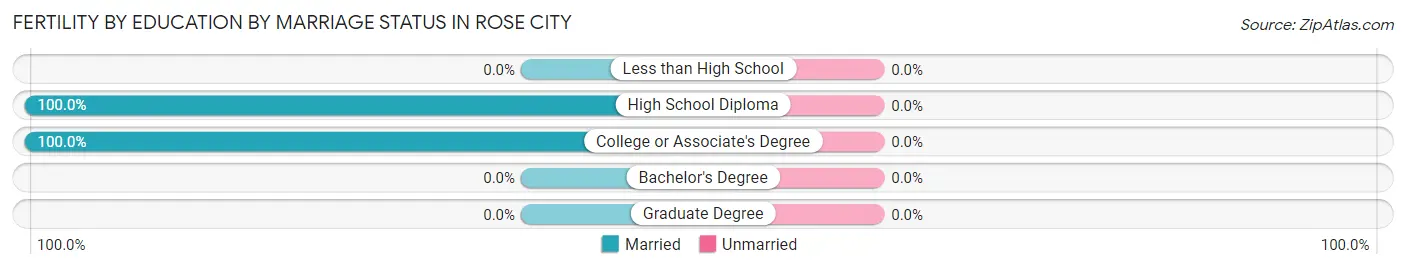
| Educational Attainment | Married | Unmarried |
| Less than High School | 0 (0.0%) | 0 (0.0%) |
| High School Diploma | 11 (100.0%) | 0 (0.0%) |
| College or Associate's Degree | 3 (100.0%) | 0 (0.0%) |
| Bachelor's Degree | 0 (0.0%) | 0 (0.0%) |
| Graduate Degree | 0 (0.0%) | 0 (0.0%) |
| Total | 14 (100.0%) | 0 (0.0%) |
Employment Characteristics in Rose City
Employment by Class of Employer in Rose City
Among the 211 employed individuals in Rose City, private company employees (159 | 75.4%), self-employed (incorporated) (20 | 9.5%), and local government employees (14 | 6.6%) make up the most common classes of employment.
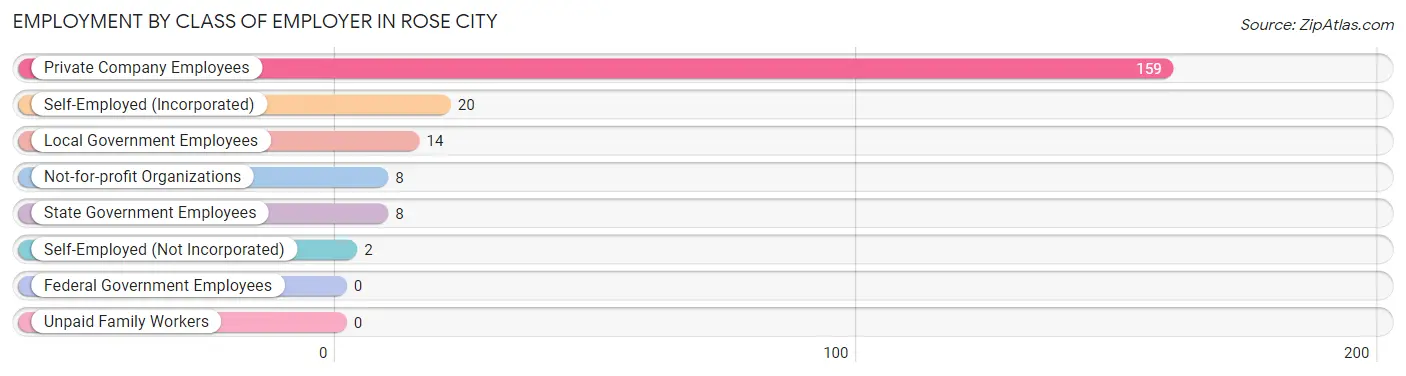
| Employer Class | # Employees | % Employees |
| Private Company Employees | 159 | 75.4% |
| Self-Employed (Incorporated) | 20 | 9.5% |
| Self-Employed (Not Incorporated) | 2 | 0.9% |
| Not-for-profit Organizations | 8 | 3.8% |
| Local Government Employees | 14 | 6.6% |
| State Government Employees | 8 | 3.8% |
| Federal Government Employees | 0 | 0.0% |
| Unpaid Family Workers | 0 | 0.0% |
| Total | 211 | 100.0% |
Employment Status by Age in Rose City
According to the labor force statistics for Rose City, out of the total population over 16 years of age (478), 54.4% or 260 individuals are in the labor force, with 16.9% or 44 of them unemployed. The age group with the highest labor force participation rate is 30 to 34 years, with 100.0% or 16 individuals in the labor force. Within the labor force, the 25 to 29 years age range has the highest percentage of unemployed individuals, with 51.2% or 21 of them being unemployed.
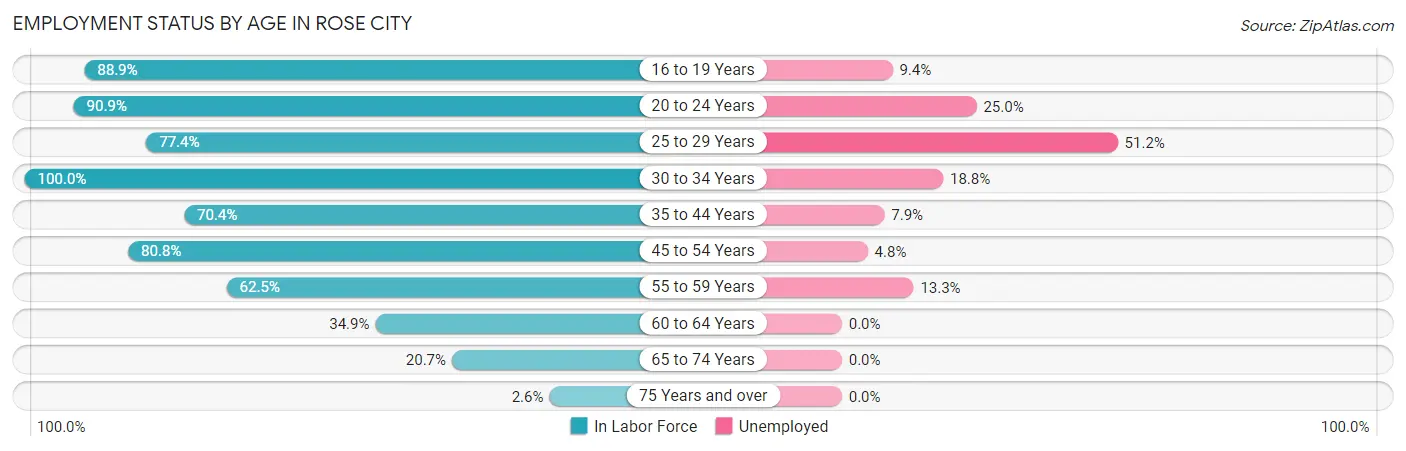
| Age Bracket | In Labor Force | Unemployed |
| 16 to 19 Years | 32 (88.9%) | 3 (9.4%) |
| 20 to 24 Years | 40 (90.9%) | 10 (25.0%) |
| 25 to 29 Years | 41 (77.4%) | 21 (51.2%) |
| 30 to 34 Years | 16 (100.0%) | 3 (18.8%) |
| 35 to 44 Years | 38 (70.4%) | 3 (7.9%) |
| 45 to 54 Years | 42 (80.8%) | 2 (4.8%) |
| 55 to 59 Years | 15 (62.5%) | 2 (13.3%) |
| 60 to 64 Years | 22 (34.9%) | 0 (0.0%) |
| 65 to 74 Years | 12 (20.7%) | 0 (0.0%) |
| 75 Years and over | 2 (2.6%) | 0 (0.0%) |
| Total | 260 (54.4%) | 44 (16.9%) |
Employment Status by Educational Attainment in Rose City
According to labor force statistics for Rose City, 66.4% of individuals (174) out of the total population between 25 and 64 years of age (262) are in the labor force, with 17.8% or 31 of them being unemployed. The group with the highest labor force participation rate are those with the educational attainment of bachelor's degree or higher, with 100.0% or 10 individuals in the labor force. Within the labor force, individuals with college / associate degree education have the highest percentage of unemployment, with 21.3% or 13 of them being unemployed.
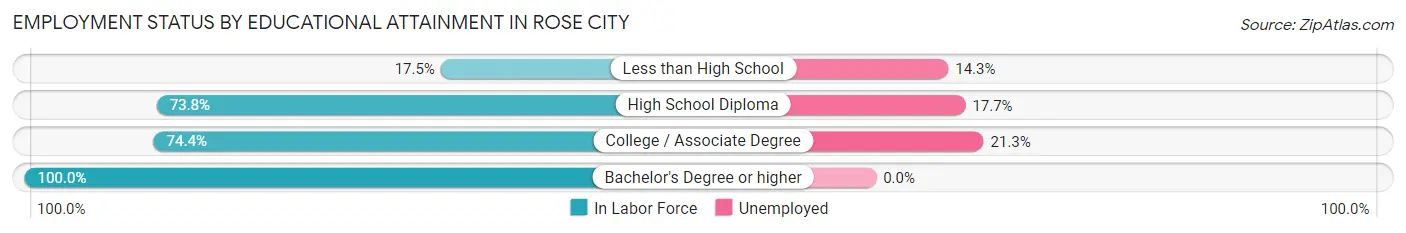
| Educational Attainment | In Labor Force | Unemployed |
| Less than High School | 7 (17.5%) | 6 (14.3%) |
| High School Diploma | 96 (73.8%) | 23 (17.7%) |
| College / Associate Degree | 61 (74.4%) | 17 (21.3%) |
| Bachelor's Degree or higher | 10 (100.0%) | 0 (0.0%) |
| Total | 174 (66.4%) | 47 (17.8%) |
Employment Occupations by Sex in Rose City
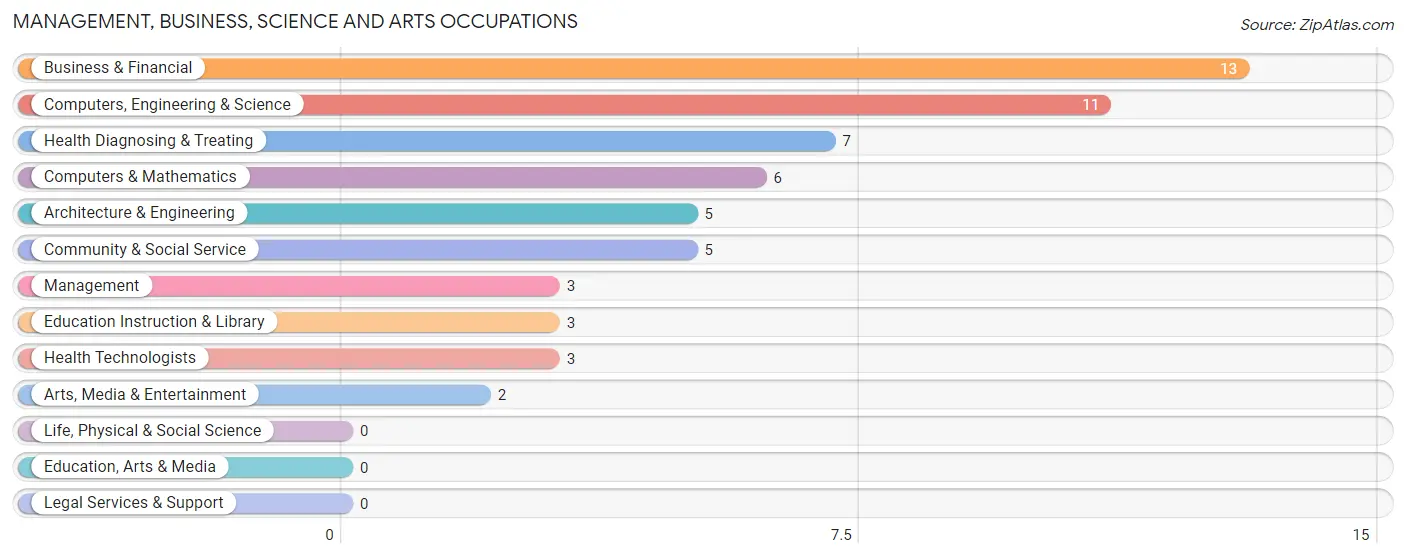
Management, Business, Science and Arts Occupations
The most common Management, Business, Science and Arts occupations in Rose City are Business & Financial (13 | 6.0%), Computers, Engineering & Science (11 | 5.1%), Health Diagnosing & Treating (7 | 3.2%), Computers & Mathematics (6 | 2.8%), and Architecture & Engineering (5 | 2.3%).
Management, Business, Science and Arts Occupations by Sex
Within the Management, Business, Science and Arts occupations in Rose City, the most male-oriented occupations are Architecture & Engineering (100.0%), Computers, Engineering & Science (90.9%), and Computers & Mathematics (83.3%), while the most female-oriented occupations are Management (100.0%), Community & Social Service (100.0%), and Education Instruction & Library (100.0%).
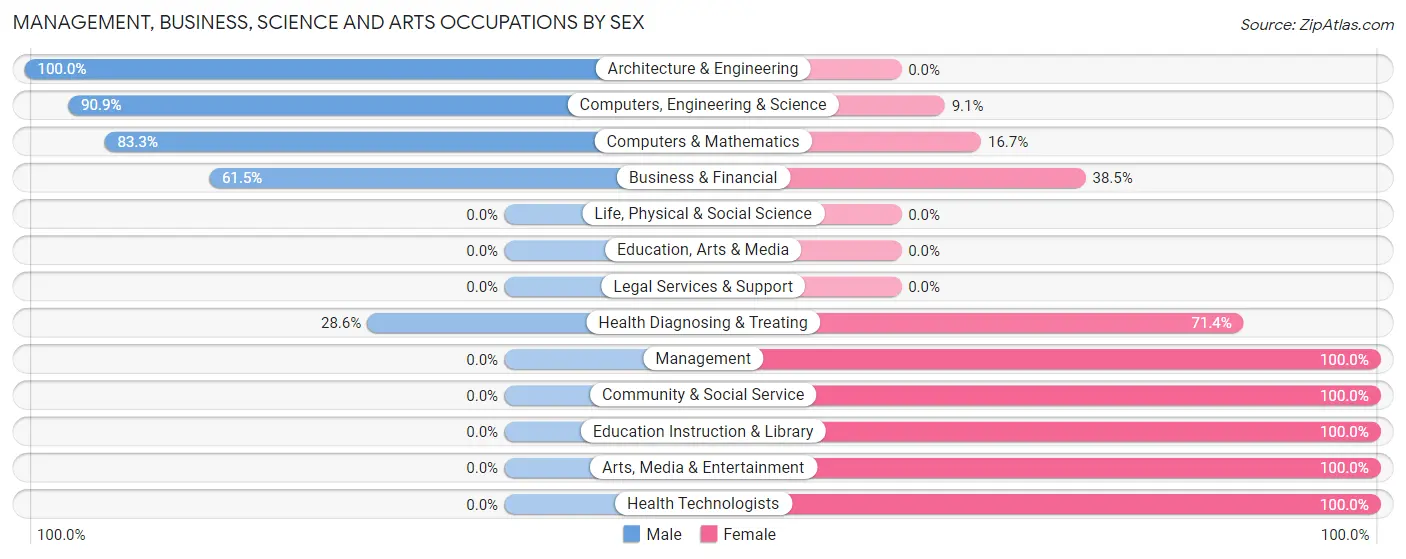
| Occupation | Male | Female |
| Management | 0 (0.0%) | 3 (100.0%) |
| Business & Financial | 8 (61.5%) | 5 (38.5%) |
| Computers, Engineering & Science | 10 (90.9%) | 1 (9.1%) |
| Computers & Mathematics | 5 (83.3%) | 1 (16.7%) |
| Architecture & Engineering | 5 (100.0%) | 0 (0.0%) |
| Life, Physical & Social Science | 0 (0.0%) | 0 (0.0%) |
| Community & Social Service | 0 (0.0%) | 5 (100.0%) |
| Education, Arts & Media | 0 (0.0%) | 0 (0.0%) |
| Legal Services & Support | 0 (0.0%) | 0 (0.0%) |
| Education Instruction & Library | 0 (0.0%) | 3 (100.0%) |
| Arts, Media & Entertainment | 0 (0.0%) | 2 (100.0%) |
| Health Diagnosing & Treating | 2 (28.6%) | 5 (71.4%) |
| Health Technologists | 0 (0.0%) | 3 (100.0%) |
| Total (Category) | 20 (51.3%) | 19 (48.7%) |
| Total (Overall) | 90 (41.7%) | 126 (58.3%) |
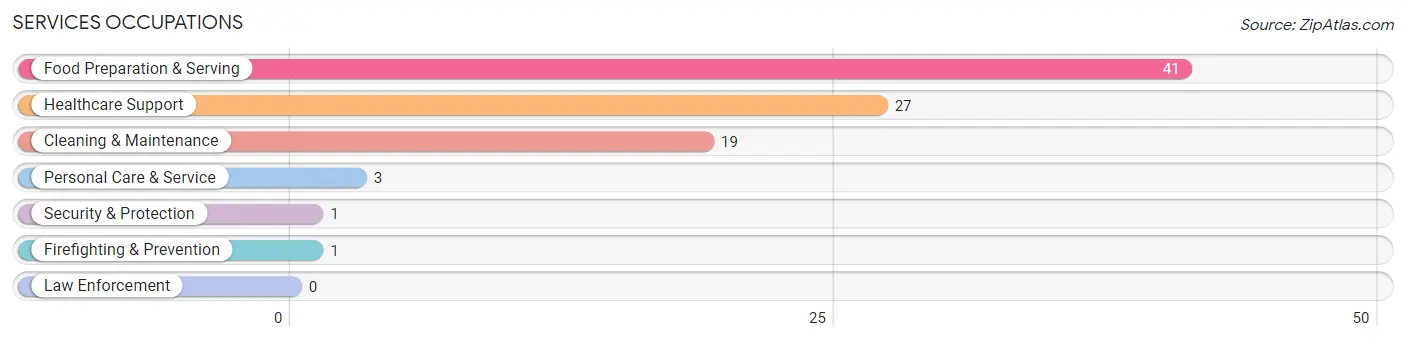
Services Occupations
The most common Services occupations in Rose City are Food Preparation & Serving (41 | 19.0%), Healthcare Support (27 | 12.5%), Cleaning & Maintenance (19 | 8.8%), Personal Care & Service (3 | 1.4%), and Security & Protection (1 | 0.5%).
Services Occupations by Sex
Within the Services occupations in Rose City, the most male-oriented occupations are Security & Protection (100.0%), Firefighting & Prevention (100.0%), and Food Preparation & Serving (19.5%), while the most female-oriented occupations are Personal Care & Service (100.0%), Cleaning & Maintenance (89.5%), and Healthcare Support (81.5%).
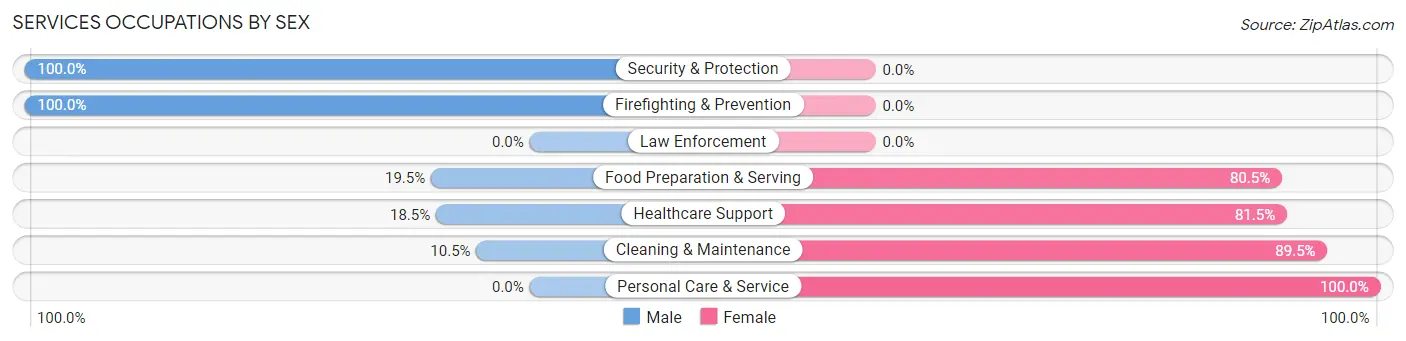
| Occupation | Male | Female |
| Healthcare Support | 5 (18.5%) | 22 (81.5%) |
| Security & Protection | 1 (100.0%) | 0 (0.0%) |
| Firefighting & Prevention | 1 (100.0%) | 0 (0.0%) |
| Law Enforcement | 0 (0.0%) | 0 (0.0%) |
| Food Preparation & Serving | 8 (19.5%) | 33 (80.5%) |
| Cleaning & Maintenance | 2 (10.5%) | 17 (89.5%) |
| Personal Care & Service | 0 (0.0%) | 3 (100.0%) |
| Total (Category) | 16 (17.6%) | 75 (82.4%) |
| Total (Overall) | 90 (41.7%) | 126 (58.3%) |
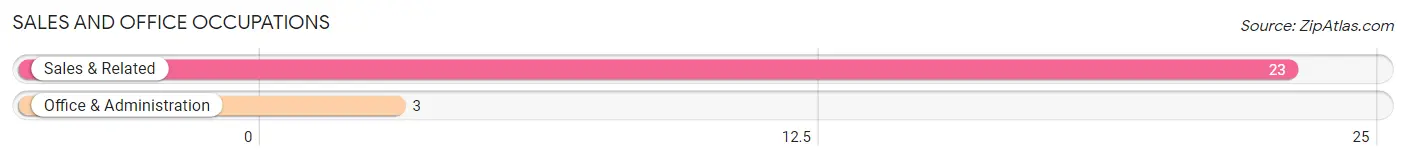
Sales and Office Occupations
The most common Sales and Office occupations in Rose City are Sales & Related (23 | 10.6%), and Office & Administration (3 | 1.4%).
Sales and Office Occupations by Sex
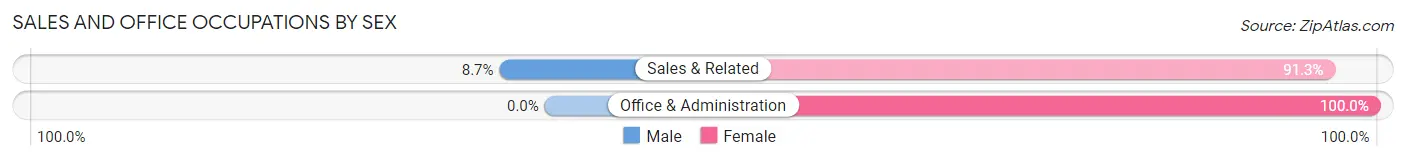
| Occupation | Male | Female |
| Sales & Related | 2 (8.7%) | 21 (91.3%) |
| Office & Administration | 0 (0.0%) | 3 (100.0%) |
| Total (Category) | 2 (7.7%) | 24 (92.3%) |
| Total (Overall) | 90 (41.7%) | 126 (58.3%) |
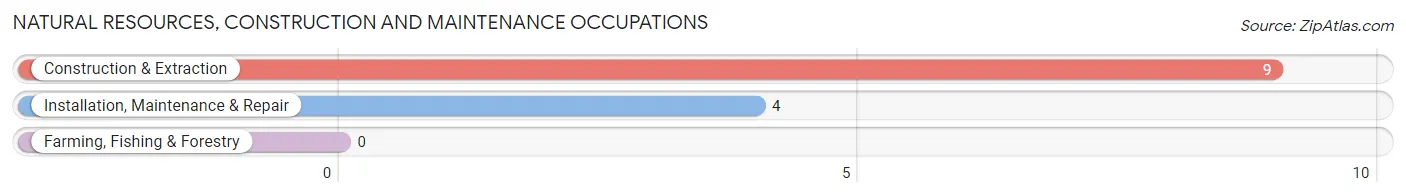
Natural Resources, Construction and Maintenance Occupations
The most common Natural Resources, Construction and Maintenance occupations in Rose City are Construction & Extraction (9 | 4.2%), and Installation, Maintenance & Repair (4 | 1.8%).
Natural Resources, Construction and Maintenance Occupations by Sex
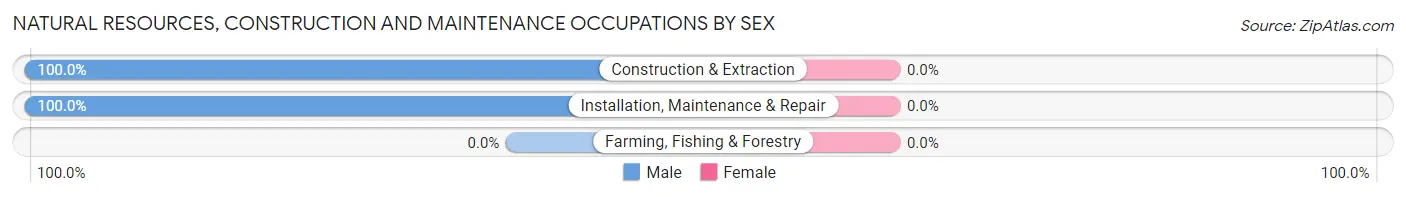
| Occupation | Male | Female |
| Farming, Fishing & Forestry | 0 (0.0%) | 0 (0.0%) |
| Construction & Extraction | 9 (100.0%) | 0 (0.0%) |
| Installation, Maintenance & Repair | 4 (100.0%) | 0 (0.0%) |
| Total (Category) | 13 (100.0%) | 0 (0.0%) |
| Total (Overall) | 90 (41.7%) | 126 (58.3%) |
Production, Transportation and Moving Occupations
The most common Production, Transportation and Moving occupations in Rose City are Production (27 | 12.5%), and Transportation (20 | 9.3%).
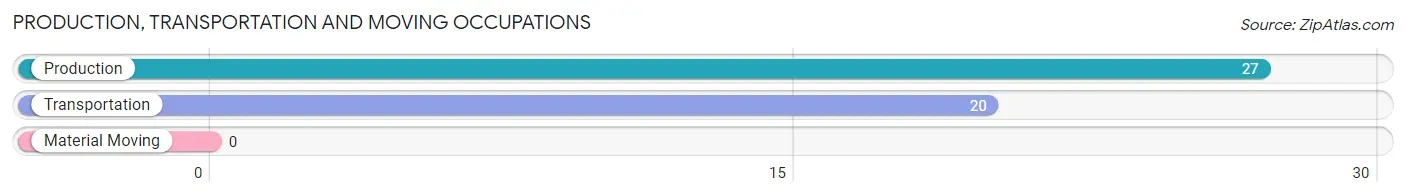
Production, Transportation and Moving Occupations by Sex
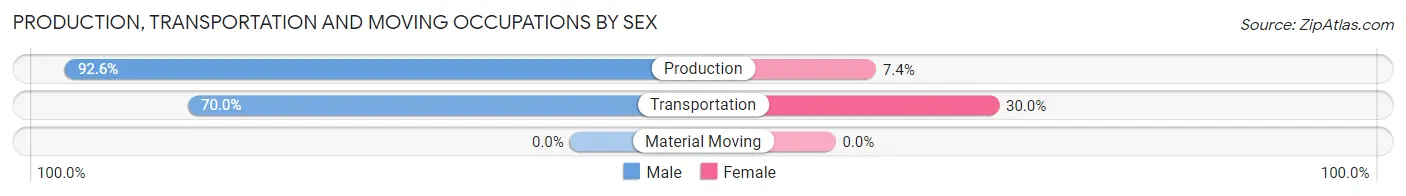
| Occupation | Male | Female |
| Production | 25 (92.6%) | 2 (7.4%) |
| Transportation | 14 (70.0%) | 6 (30.0%) |
| Material Moving | 0 (0.0%) | 0 (0.0%) |
| Total (Category) | 39 (83.0%) | 8 (17.0%) |
| Total (Overall) | 90 (41.7%) | 126 (58.3%) |
Employment Industries by Sex in Rose City
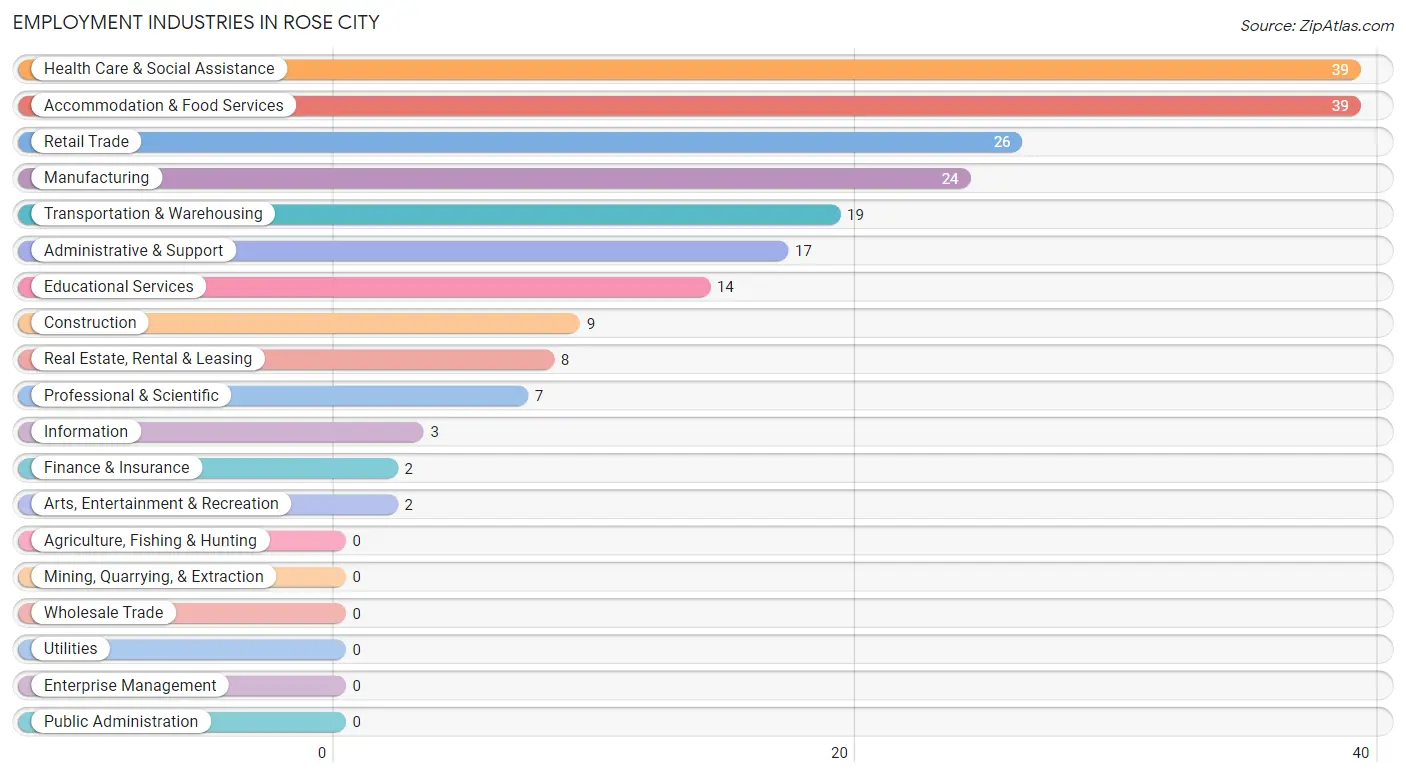
Employment Industries in Rose City
The major employment industries in Rose City include Health Care & Social Assistance (39 | 18.1%), Accommodation & Food Services (39 | 18.1%), Retail Trade (26 | 12.0%), Manufacturing (24 | 11.1%), and Transportation & Warehousing (19 | 8.8%).
Employment Industries by Sex in Rose City
The Rose City industries that see more men than women are Construction (100.0%), Real Estate, Rental & Leasing (100.0%), and Manufacturing (91.7%), whereas the industries that tend to have a higher number of women are Information (100.0%), Finance & Insurance (100.0%), and Arts, Entertainment & Recreation (100.0%).
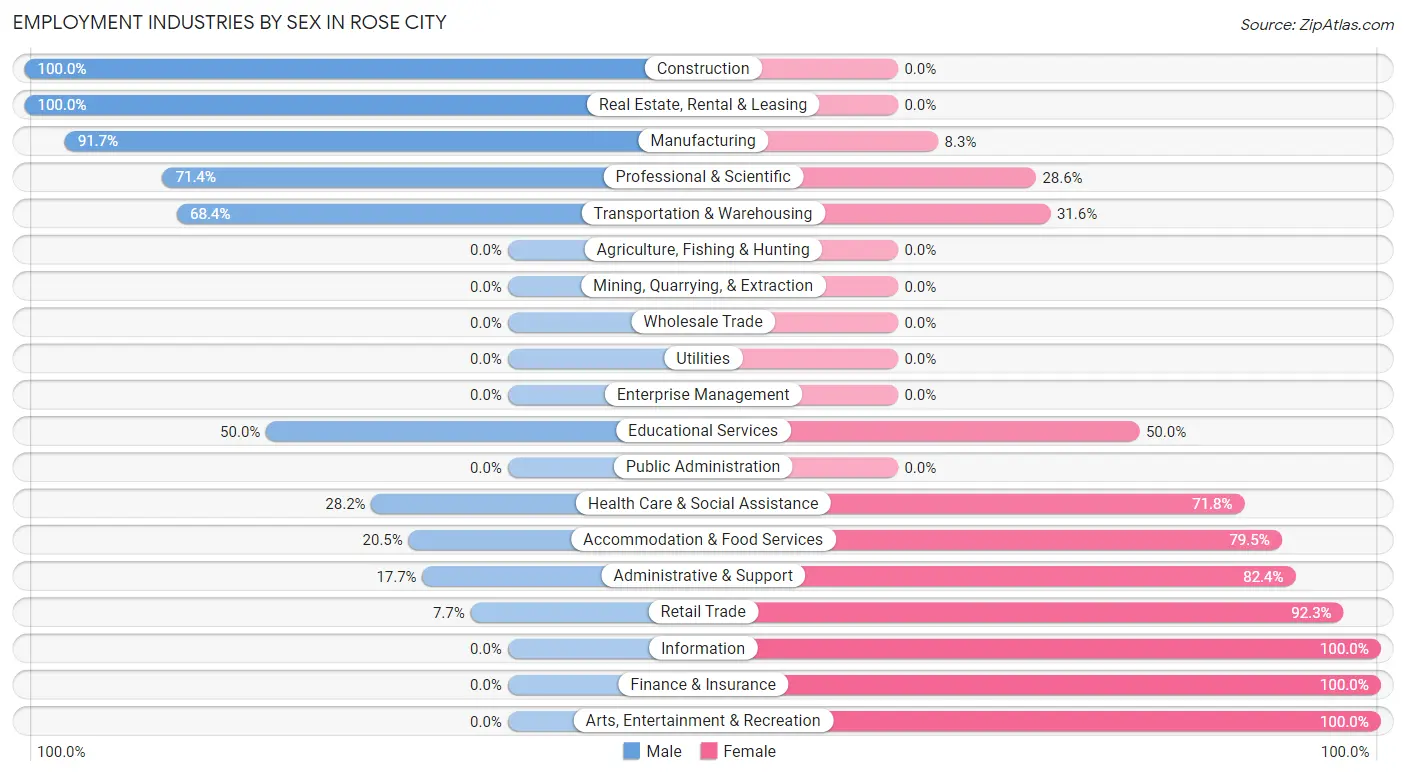
| Industry | Male | Female |
| Agriculture, Fishing & Hunting | 0 (0.0%) | 0 (0.0%) |
| Mining, Quarrying, & Extraction | 0 (0.0%) | 0 (0.0%) |
| Construction | 9 (100.0%) | 0 (0.0%) |
| Manufacturing | 22 (91.7%) | 2 (8.3%) |
| Wholesale Trade | 0 (0.0%) | 0 (0.0%) |
| Retail Trade | 2 (7.7%) | 24 (92.3%) |
| Transportation & Warehousing | 13 (68.4%) | 6 (31.6%) |
| Utilities | 0 (0.0%) | 0 (0.0%) |
| Information | 0 (0.0%) | 3 (100.0%) |
| Finance & Insurance | 0 (0.0%) | 2 (100.0%) |
| Real Estate, Rental & Leasing | 8 (100.0%) | 0 (0.0%) |
| Professional & Scientific | 5 (71.4%) | 2 (28.6%) |
| Enterprise Management | 0 (0.0%) | 0 (0.0%) |
| Administrative & Support | 3 (17.6%) | 14 (82.4%) |
| Educational Services | 7 (50.0%) | 7 (50.0%) |
| Health Care & Social Assistance | 11 (28.2%) | 28 (71.8%) |
| Arts, Entertainment & Recreation | 0 (0.0%) | 2 (100.0%) |
| Accommodation & Food Services | 8 (20.5%) | 31 (79.5%) |
| Public Administration | 0 (0.0%) | 0 (0.0%) |
| Total | 90 (41.7%) | 126 (58.3%) |
Education in Rose City
School Enrollment in Rose City
The most common levels of schooling among the 122 students in Rose City are high school (47 | 38.5%), kindergarten (17 | 13.9%), and middle school (16 | 13.1%).
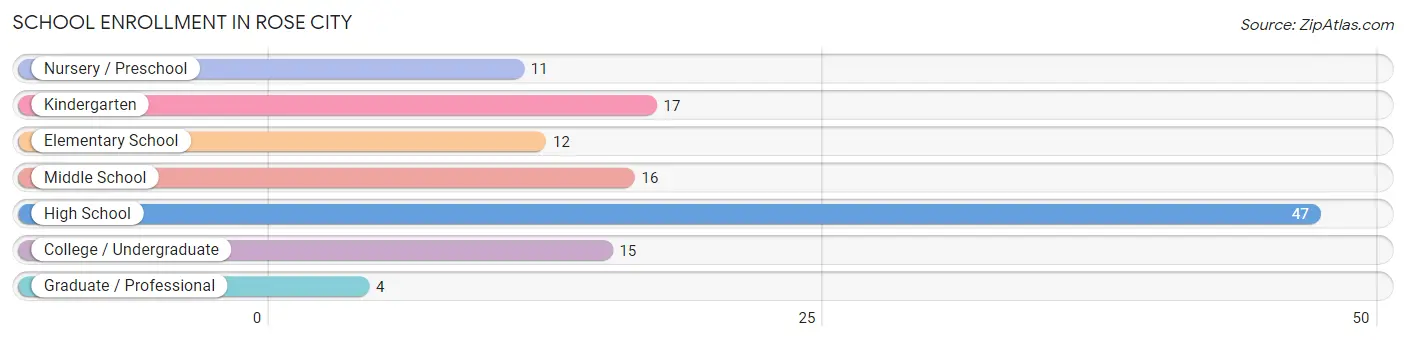
| School Level | # Students | % Students |
| Nursery / Preschool | 11 | 9.0% |
| Kindergarten | 17 | 13.9% |
| Elementary School | 12 | 9.8% |
| Middle School | 16 | 13.1% |
| High School | 47 | 38.5% |
| College / Undergraduate | 15 | 12.3% |
| Graduate / Professional | 4 | 3.3% |
| Total | 122 | 100.0% |
School Enrollment by Age by Funding Source in Rose City
Out of a total of 122 students who are enrolled in schools in Rose City, 19 (15.6%) attend a private institution, while the remaining 103 (84.4%) are enrolled in public schools. The age group of 35 years and over has the highest likelihood of being enrolled in private schools, with 4 (33.3% in the age bracket) enrolled. Conversely, the age group of 3 to 4 year olds has the lowest likelihood of being enrolled in a private school, with 11 (100.0% in the age bracket) attending a public institution.
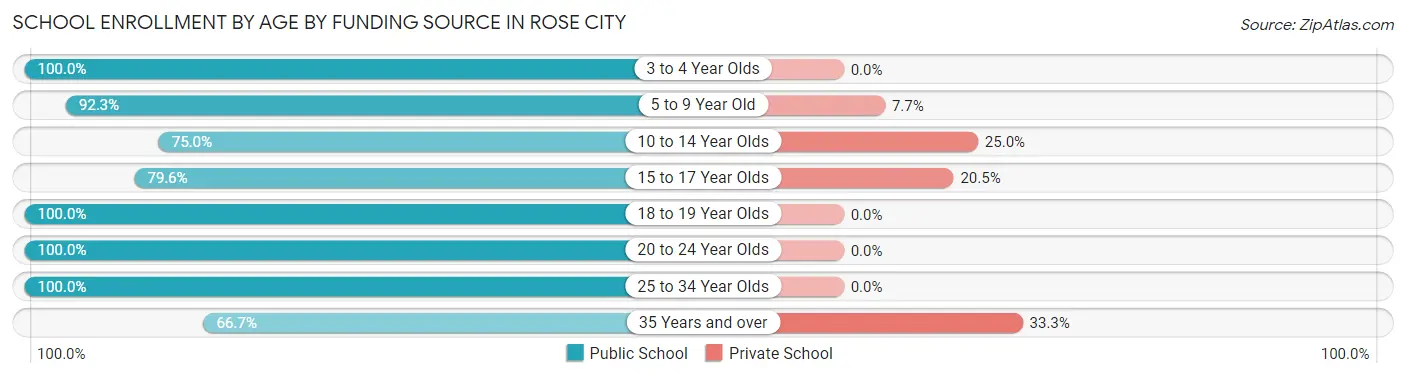
| Age Bracket | Public School | Private School |
| 3 to 4 Year Olds | 11 (100.0%) | 0 (0.0%) |
| 5 to 9 Year Old | 24 (92.3%) | 2 (7.7%) |
| 10 to 14 Year Olds | 12 (75.0%) | 4 (25.0%) |
| 15 to 17 Year Olds | 35 (79.5%) | 9 (20.4%) |
| 18 to 19 Year Olds | 6 (100.0%) | 0 (0.0%) |
| 20 to 24 Year Olds | 5 (100.0%) | 0 (0.0%) |
| 25 to 34 Year Olds | 2 (100.0%) | 0 (0.0%) |
| 35 Years and over | 8 (66.7%) | 4 (33.3%) |
| Total | 103 (84.4%) | 19 (15.6%) |
Educational Attainment by Field of Study in Rose City
Bio, nature & agricultural (9 | 28.1%), education (8 | 25.0%), business (6 | 18.8%), psychology (3 | 9.4%), and engineering (2 | 6.2%) are the most common fields of study among 32 individuals in Rose City who have obtained a bachelor's degree or higher.
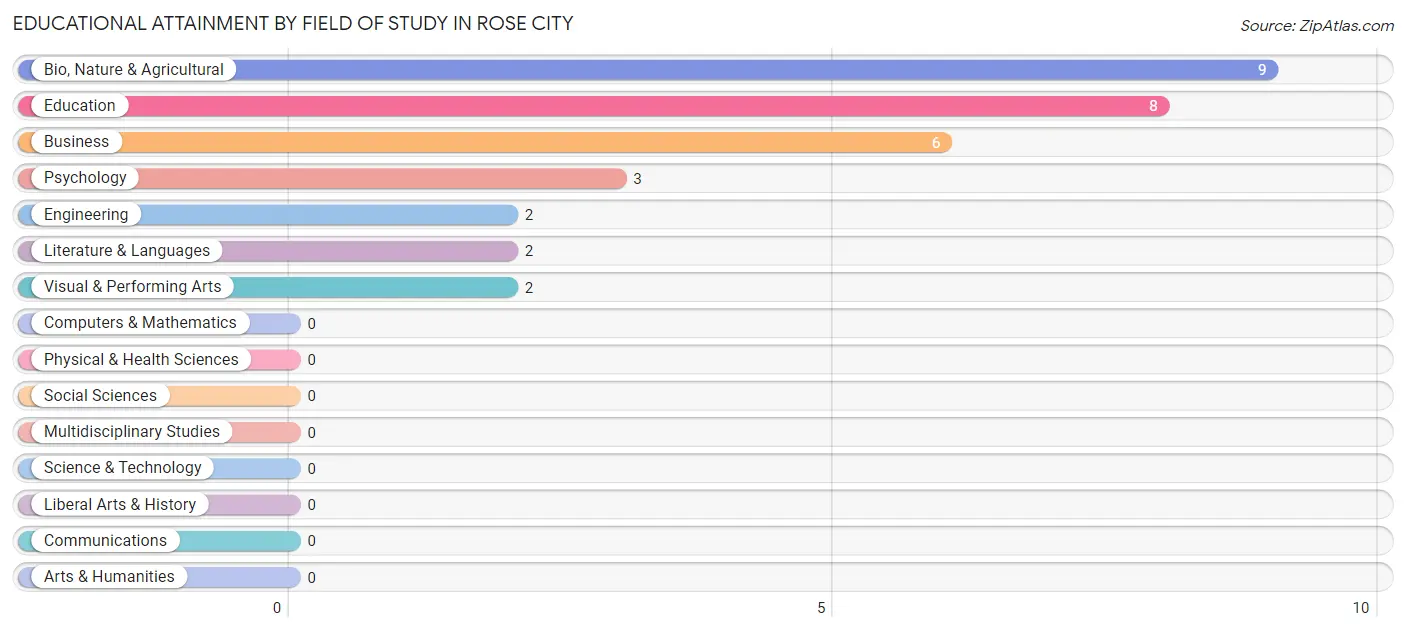
| Field of Study | # Graduates | % Graduates |
| Computers & Mathematics | 0 | 0.0% |
| Bio, Nature & Agricultural | 9 | 28.1% |
| Physical & Health Sciences | 0 | 0.0% |
| Psychology | 3 | 9.4% |
| Social Sciences | 0 | 0.0% |
| Engineering | 2 | 6.2% |
| Multidisciplinary Studies | 0 | 0.0% |
| Science & Technology | 0 | 0.0% |
| Business | 6 | 18.8% |
| Education | 8 | 25.0% |
| Literature & Languages | 2 | 6.2% |
| Liberal Arts & History | 0 | 0.0% |
| Visual & Performing Arts | 2 | 6.2% |
| Communications | 0 | 0.0% |
| Arts & Humanities | 0 | 0.0% |
| Total | 32 | 100.0% |
Transportation & Commute in Rose City
Vehicle Availability by Sex in Rose City
The most prevalent vehicle ownership categories in Rose City are males with 2 vehicles (37, accounting for 42.5%) and females with 2 vehicles (34, making up 29.8%).
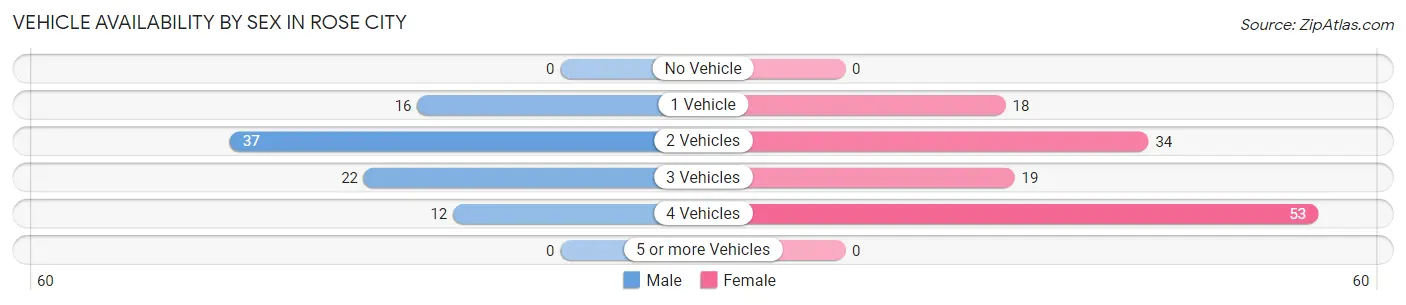
| Vehicles Available | Male | Female |
| No Vehicle | 0 (0.0%) | 0 (0.0%) |
| 1 Vehicle | 16 (18.4%) | 18 (14.5%) |
| 2 Vehicles | 37 (42.5%) | 34 (27.4%) |
| 3 Vehicles | 22 (25.3%) | 19 (15.3%) |
| 4 Vehicles | 12 (13.8%) | 53 (42.7%) |
| 5 or more Vehicles | 0 (0.0%) | 0 (0.0%) |
| Total | 87 (100.0%) | 124 (100.0%) |
Commute Time in Rose City
The most frequently occuring commute durations in Rose City are 5 to 9 minutes (45 commuters, 21.3%), 30 to 34 minutes (35 commuters, 16.6%), and 20 to 24 minutes (32 commuters, 15.2%).
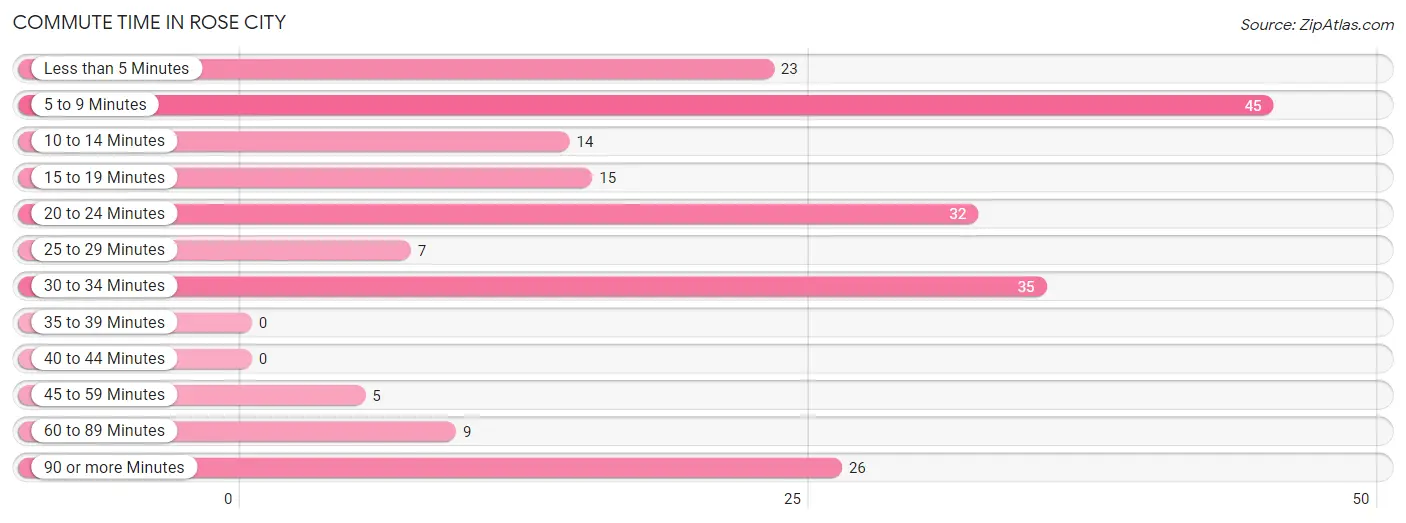
| Commute Time | # Commuters | % Commuters |
| Less than 5 Minutes | 23 | 10.9% |
| 5 to 9 Minutes | 45 | 21.3% |
| 10 to 14 Minutes | 14 | 6.6% |
| 15 to 19 Minutes | 15 | 7.1% |
| 20 to 24 Minutes | 32 | 15.2% |
| 25 to 29 Minutes | 7 | 3.3% |
| 30 to 34 Minutes | 35 | 16.6% |
| 35 to 39 Minutes | 0 | 0.0% |
| 40 to 44 Minutes | 0 | 0.0% |
| 45 to 59 Minutes | 5 | 2.4% |
| 60 to 89 Minutes | 9 | 4.3% |
| 90 or more Minutes | 26 | 12.3% |
Commute Time by Sex in Rose City
The most common commute times in Rose City are less than 5 minutes (16 commuters, 18.4%) for males and 5 to 9 minutes (29 commuters, 23.4%) for females.
| Commute Time | Male | Female |
| Less than 5 Minutes | 16 (18.4%) | 7 (5.7%) |
| 5 to 9 Minutes | 16 (18.4%) | 29 (23.4%) |
| 10 to 14 Minutes | 0 (0.0%) | 14 (11.3%) |
| 15 to 19 Minutes | 4 (4.6%) | 11 (8.9%) |
| 20 to 24 Minutes | 14 (16.1%) | 18 (14.5%) |
| 25 to 29 Minutes | 2 (2.3%) | 5 (4.0%) |
| 30 to 34 Minutes | 16 (18.4%) | 19 (15.3%) |
| 35 to 39 Minutes | 0 (0.0%) | 0 (0.0%) |
| 40 to 44 Minutes | 0 (0.0%) | 0 (0.0%) |
| 45 to 59 Minutes | 4 (4.6%) | 1 (0.8%) |
| 60 to 89 Minutes | 6 (6.9%) | 3 (2.4%) |
| 90 or more Minutes | 9 (10.3%) | 17 (13.7%) |
Time of Departure to Work by Sex in Rose City
The most frequent times of departure to work in Rose City are 6:30 AM to 6:59 AM (21, 24.1%) for males and 7:30 AM to 7:59 AM (37, 29.8%) for females.
| Time of Departure | Male | Female |
| 12:00 AM to 4:59 AM | 2 (2.3%) | 2 (1.6%) |
| 5:00 AM to 5:29 AM | 9 (10.3%) | 0 (0.0%) |
| 5:30 AM to 5:59 AM | 4 (4.6%) | 0 (0.0%) |
| 6:00 AM to 6:29 AM | 10 (11.5%) | 7 (5.7%) |
| 6:30 AM to 6:59 AM | 21 (24.1%) | 4 (3.2%) |
| 7:00 AM to 7:29 AM | 0 (0.0%) | 7 (5.7%) |
| 7:30 AM to 7:59 AM | 8 (9.2%) | 37 (29.8%) |
| 8:00 AM to 8:29 AM | 21 (24.1%) | 6 (4.8%) |
| 8:30 AM to 8:59 AM | 0 (0.0%) | 36 (29.0%) |
| 9:00 AM to 9:59 AM | 2 (2.3%) | 5 (4.0%) |
| 10:00 AM to 10:59 AM | 0 (0.0%) | 7 (5.7%) |
| 11:00 AM to 11:59 AM | 0 (0.0%) | 0 (0.0%) |
| 12:00 PM to 3:59 PM | 4 (4.6%) | 7 (5.7%) |
| 4:00 PM to 11:59 PM | 6 (6.9%) | 6 (4.8%) |
| Total | 87 (100.0%) | 124 (100.0%) |
Housing Occupancy in Rose City
Occupancy by Ownership in Rose City
Of the total 204 dwellings in Rose City, owner-occupied units account for 107 (52.4%), while renter-occupied units make up 97 (47.5%).
| Occupancy | # Housing Units | % Housing Units |
| Owner Occupied Housing Units | 107 | 52.4% |
| Renter-Occupied Housing Units | 97 | 47.5% |
| Total Occupied Housing Units | 204 | 100.0% |
Occupancy by Household Size in Rose City
| Household Size | # Housing Units | % Housing Units |
| 1-Person Household | 86 | 42.2% |
| 2-Person Household | 57 | 27.9% |
| 3-Person Household | 19 | 9.3% |
| 4+ Person Household | 42 | 20.6% |
| Total Housing Units | 204 | 100.0% |
Occupancy by Ownership by Household Size in Rose City
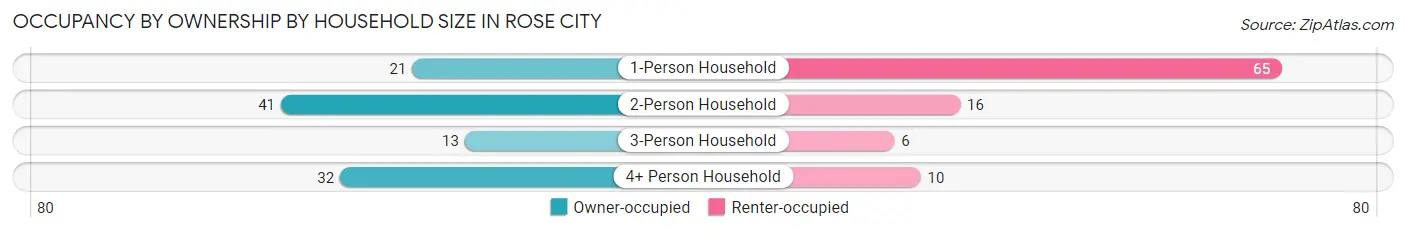
| Household Size | Owner-occupied | Renter-occupied |
| 1-Person Household | 21 (24.4%) | 65 (75.6%) |
| 2-Person Household | 41 (71.9%) | 16 (28.1%) |
| 3-Person Household | 13 (68.4%) | 6 (31.6%) |
| 4+ Person Household | 32 (76.2%) | 10 (23.8%) |
| Total Housing Units | 107 (52.4%) | 97 (47.5%) |
Occupancy by Educational Attainment in Rose City
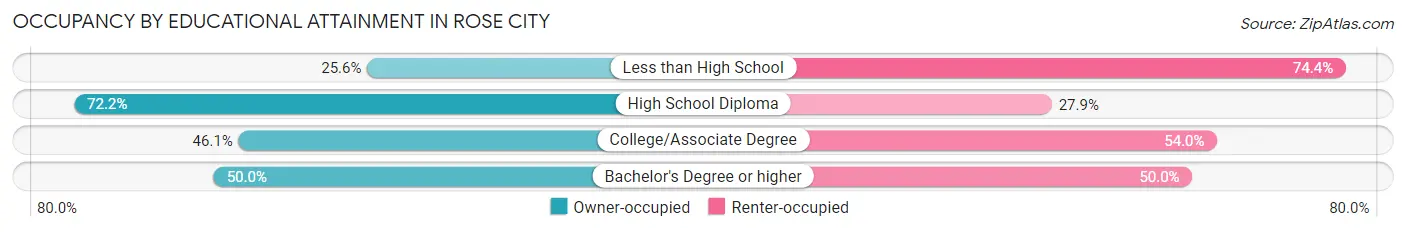
| Household Size | Owner-occupied | Renter-occupied |
| Less than High School | 10 (25.6%) | 29 (74.4%) |
| High School Diploma | 57 (72.2%) | 22 (27.9%) |
| College/Associate Degree | 35 (46.1%) | 41 (53.9%) |
| Bachelor's Degree or higher | 5 (50.0%) | 5 (50.0%) |
Occupancy by Age of Householder in Rose City
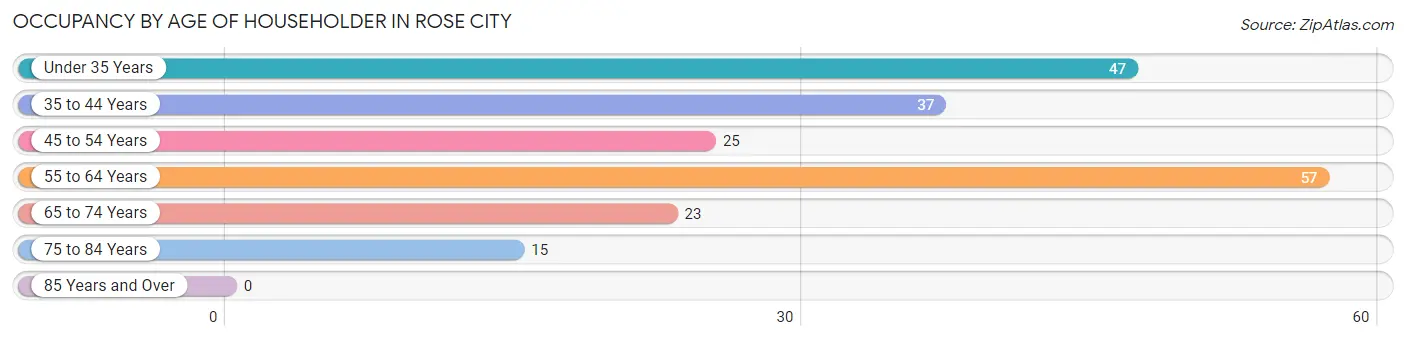
| Age Bracket | # Households | % Households |
| Under 35 Years | 47 | 23.0% |
| 35 to 44 Years | 37 | 18.1% |
| 45 to 54 Years | 25 | 12.2% |
| 55 to 64 Years | 57 | 27.9% |
| 65 to 74 Years | 23 | 11.3% |
| 75 to 84 Years | 15 | 7.3% |
| 85 Years and Over | 0 | 0.0% |
| Total | 204 | 100.0% |
Housing Finances in Rose City
Median Income by Occupancy in Rose City
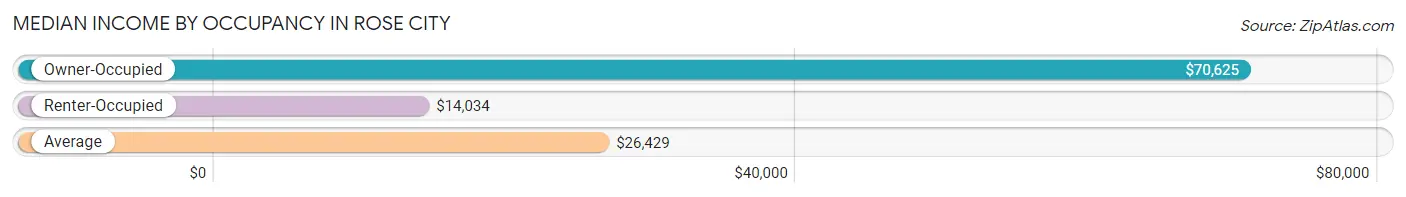
| Occupancy Type | # Households | Median Income |
| Owner-Occupied | 107 (52.4%) | $70,625 |
| Renter-Occupied | 97 (47.5%) | $14,034 |
| Average | 204 (100.0%) | $26,429 |
Occupancy by Householder Income Bracket in Rose City
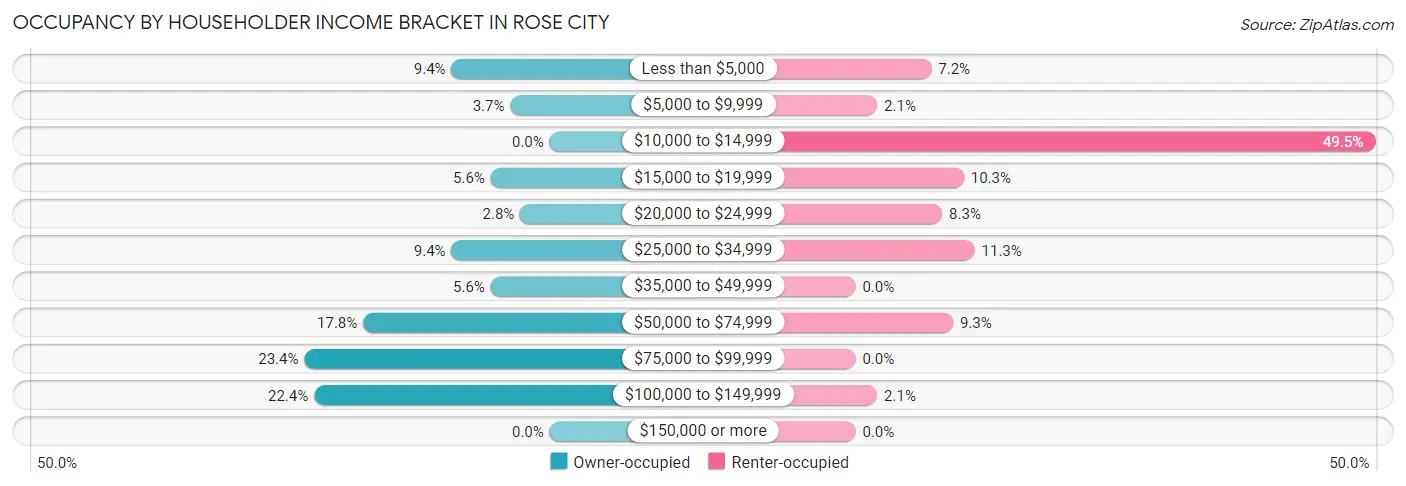
| Income Bracket | Owner-occupied | Renter-occupied |
| Less than $5,000 | 10 (9.3%) | 7 (7.2%) |
| $5,000 to $9,999 | 4 (3.7%) | 2 (2.1%) |
| $10,000 to $14,999 | 0 (0.0%) | 48 (49.5%) |
| $15,000 to $19,999 | 6 (5.6%) | 10 (10.3%) |
| $20,000 to $24,999 | 3 (2.8%) | 8 (8.3%) |
| $25,000 to $34,999 | 10 (9.3%) | 11 (11.3%) |
| $35,000 to $49,999 | 6 (5.6%) | 0 (0.0%) |
| $50,000 to $74,999 | 19 (17.8%) | 9 (9.3%) |
| $75,000 to $99,999 | 25 (23.4%) | 0 (0.0%) |
| $100,000 to $149,999 | 24 (22.4%) | 2 (2.1%) |
| $150,000 or more | 0 (0.0%) | 0 (0.0%) |
| Total | 107 (100.0%) | 97 (100.0%) |
Monthly Housing Cost Tiers in Rose City
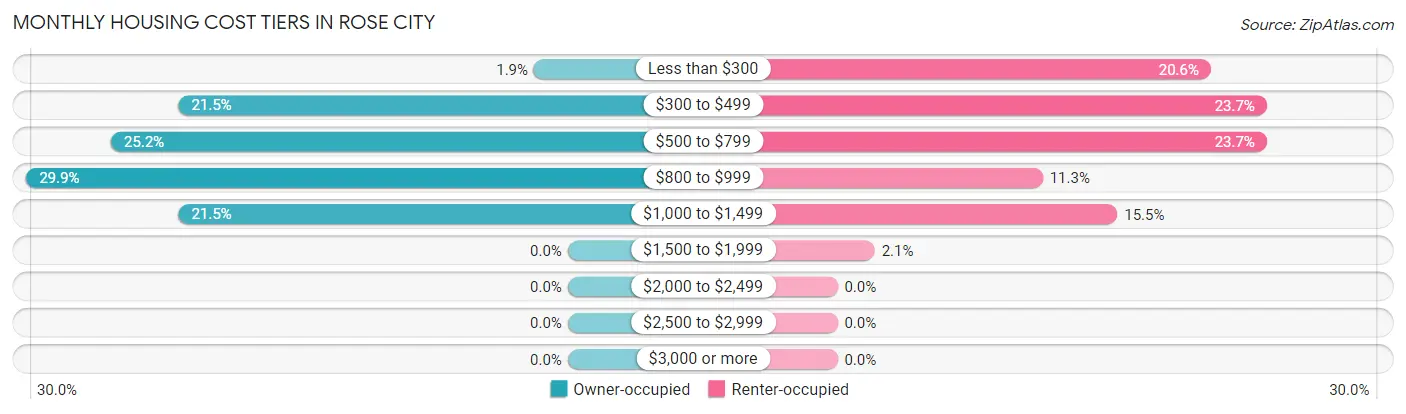
| Monthly Cost | Owner-occupied | Renter-occupied |
| Less than $300 | 2 (1.9%) | 20 (20.6%) |
| $300 to $499 | 23 (21.5%) | 23 (23.7%) |
| $500 to $799 | 27 (25.2%) | 23 (23.7%) |
| $800 to $999 | 32 (29.9%) | 11 (11.3%) |
| $1,000 to $1,499 | 23 (21.5%) | 15 (15.5%) |
| $1,500 to $1,999 | 0 (0.0%) | 2 (2.1%) |
| $2,000 to $2,499 | 0 (0.0%) | 0 (0.0%) |
| $2,500 to $2,999 | 0 (0.0%) | 0 (0.0%) |
| $3,000 or more | 0 (0.0%) | 0 (0.0%) |
| Total | 107 (100.0%) | 97 (100.0%) |
Physical Housing Characteristics in Rose City
Housing Structures in Rose City
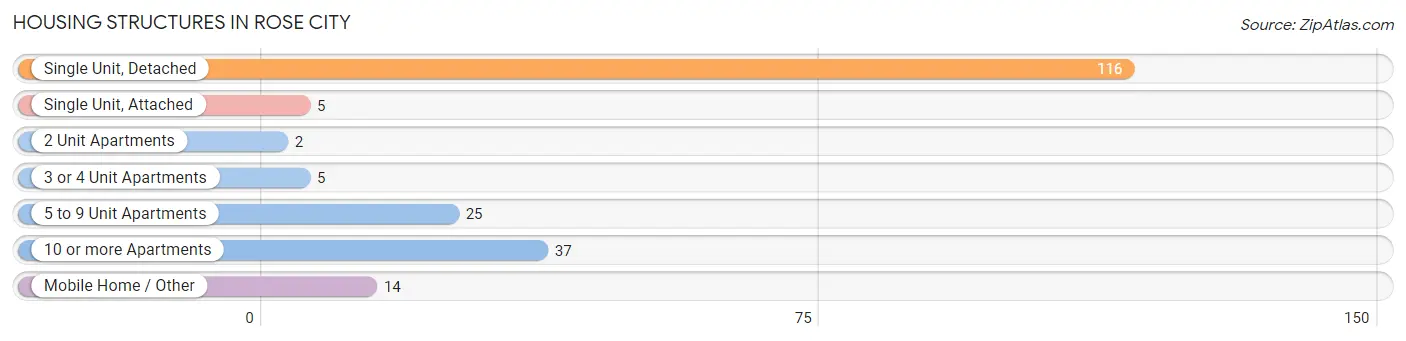
| Structure Type | # Housing Units | % Housing Units |
| Single Unit, Detached | 116 | 56.9% |
| Single Unit, Attached | 5 | 2.5% |
| 2 Unit Apartments | 2 | 1.0% |
| 3 or 4 Unit Apartments | 5 | 2.5% |
| 5 to 9 Unit Apartments | 25 | 12.2% |
| 10 or more Apartments | 37 | 18.1% |
| Mobile Home / Other | 14 | 6.9% |
| Total | 204 | 100.0% |
Housing Structures by Occupancy in Rose City
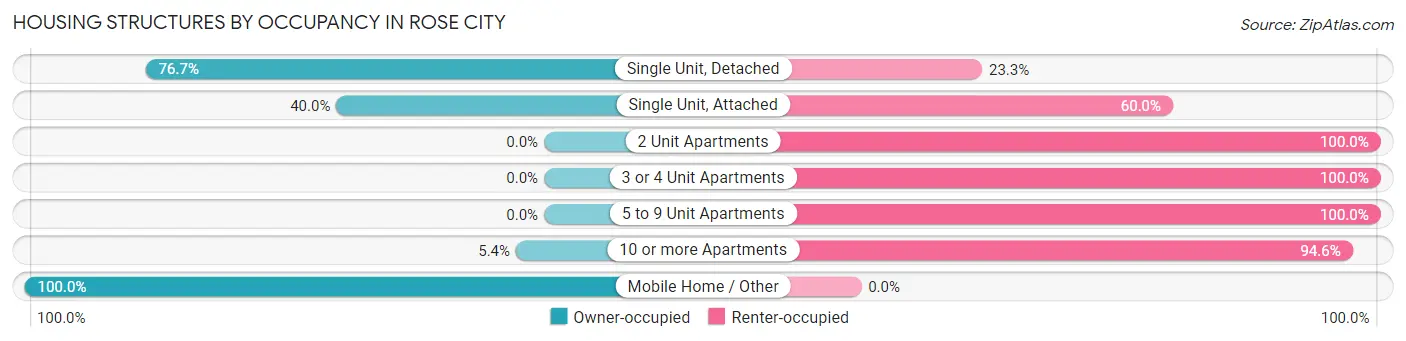
| Structure Type | Owner-occupied | Renter-occupied |
| Single Unit, Detached | 89 (76.7%) | 27 (23.3%) |
| Single Unit, Attached | 2 (40.0%) | 3 (60.0%) |
| 2 Unit Apartments | 0 (0.0%) | 2 (100.0%) |
| 3 or 4 Unit Apartments | 0 (0.0%) | 5 (100.0%) |
| 5 to 9 Unit Apartments | 0 (0.0%) | 25 (100.0%) |
| 10 or more Apartments | 2 (5.4%) | 35 (94.6%) |
| Mobile Home / Other | 14 (100.0%) | 0 (0.0%) |
| Total | 107 (52.4%) | 97 (47.5%) |
Housing Structures by Number of Rooms in Rose City
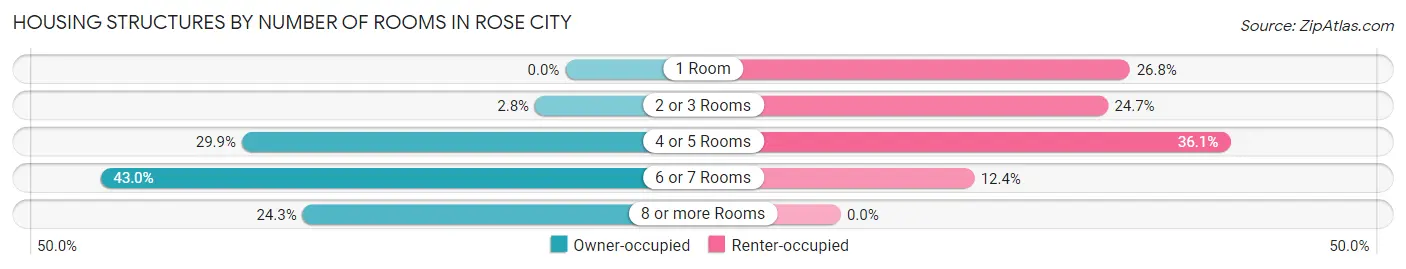
| Number of Rooms | Owner-occupied | Renter-occupied |
| 1 Room | 0 (0.0%) | 26 (26.8%) |
| 2 or 3 Rooms | 3 (2.8%) | 24 (24.7%) |
| 4 or 5 Rooms | 32 (29.9%) | 35 (36.1%) |
| 6 or 7 Rooms | 46 (43.0%) | 12 (12.4%) |
| 8 or more Rooms | 26 (24.3%) | 0 (0.0%) |
| Total | 107 (100.0%) | 97 (100.0%) |
Housing Structure by Heating Type in Rose City
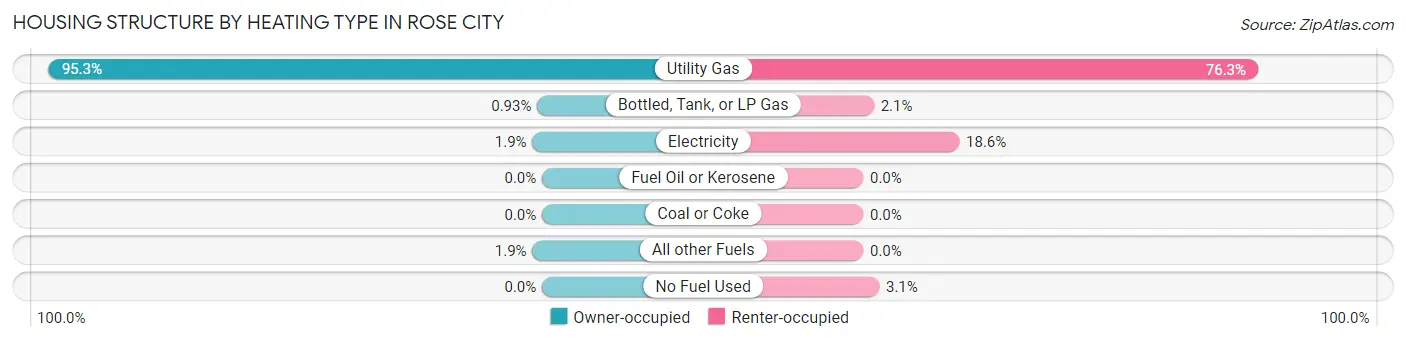
| Heating Type | Owner-occupied | Renter-occupied |
| Utility Gas | 102 (95.3%) | 74 (76.3%) |
| Bottled, Tank, or LP Gas | 1 (0.9%) | 2 (2.1%) |
| Electricity | 2 (1.9%) | 18 (18.6%) |
| Fuel Oil or Kerosene | 0 (0.0%) | 0 (0.0%) |
| Coal or Coke | 0 (0.0%) | 0 (0.0%) |
| All other Fuels | 2 (1.9%) | 0 (0.0%) |
| No Fuel Used | 0 (0.0%) | 3 (3.1%) |
| Total | 107 (100.0%) | 97 (100.0%) |
Household Vehicle Usage in Rose City
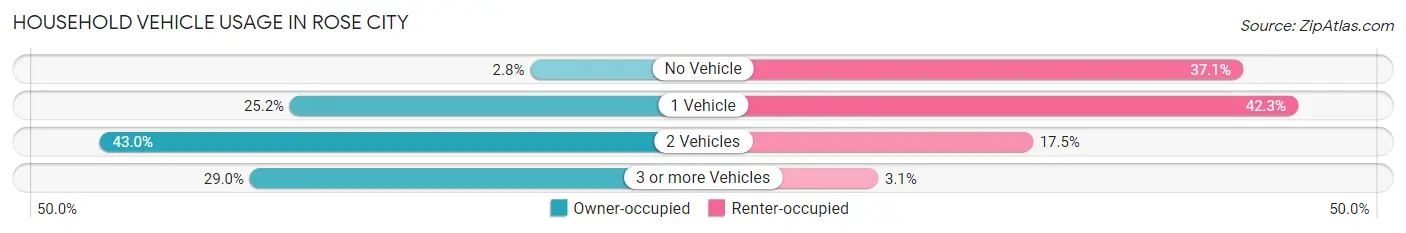
| Vehicles per Household | Owner-occupied | Renter-occupied |
| No Vehicle | 3 (2.8%) | 36 (37.1%) |
| 1 Vehicle | 27 (25.2%) | 41 (42.3%) |
| 2 Vehicles | 46 (43.0%) | 17 (17.5%) |
| 3 or more Vehicles | 31 (29.0%) | 3 (3.1%) |
| Total | 107 (100.0%) | 97 (100.0%) |
Real Estate & Mortgages in Rose City
Real Estate and Mortgage Overview in Rose City
| Characteristic | Without Mortgage | With Mortgage |
| Housing Units | 32 | 75 |
| Median Property Value | $50,000 | $61,500 |
| Median Household Income | $43,750 | $0 |
| Monthly Housing Costs | $471 | $0 |
| Real Estate Taxes | $1,313 | $5 |
Property Value by Mortgage Status in Rose City
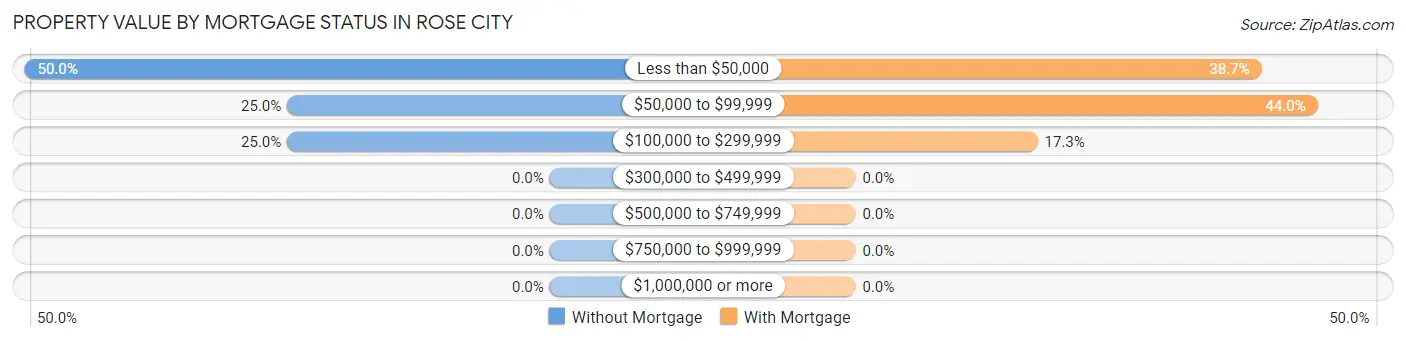
| Property Value | Without Mortgage | With Mortgage |
| Less than $50,000 | 16 (50.0%) | 29 (38.7%) |
| $50,000 to $99,999 | 8 (25.0%) | 33 (44.0%) |
| $100,000 to $299,999 | 8 (25.0%) | 13 (17.3%) |
| $300,000 to $499,999 | 0 (0.0%) | 0 (0.0%) |
| $500,000 to $749,999 | 0 (0.0%) | 0 (0.0%) |
| $750,000 to $999,999 | 0 (0.0%) | 0 (0.0%) |
| $1,000,000 or more | 0 (0.0%) | 0 (0.0%) |
| Total | 32 (100.0%) | 75 (100.0%) |
Household Income by Mortgage Status in Rose City
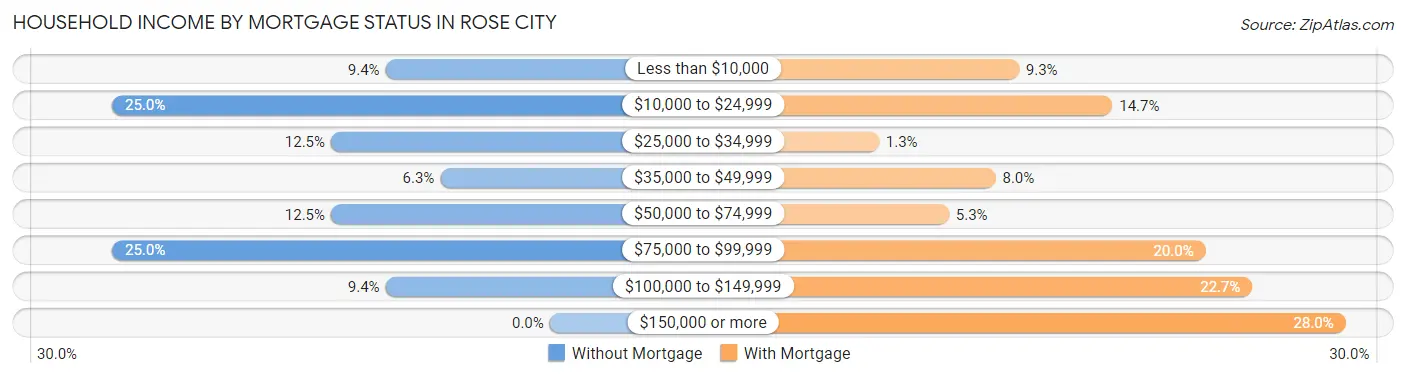
| Household Income | Without Mortgage | With Mortgage |
| Less than $10,000 | 3 (9.4%) | 7 (9.3%) |
| $10,000 to $24,999 | 8 (25.0%) | 11 (14.7%) |
| $25,000 to $34,999 | 4 (12.5%) | 1 (1.3%) |
| $35,000 to $49,999 | 2 (6.2%) | 6 (8.0%) |
| $50,000 to $74,999 | 4 (12.5%) | 4 (5.3%) |
| $75,000 to $99,999 | 8 (25.0%) | 15 (20.0%) |
| $100,000 to $149,999 | 3 (9.4%) | 17 (22.7%) |
| $150,000 or more | 0 (0.0%) | 21 (28.0%) |
| Total | 32 (100.0%) | 75 (100.0%) |
Property Value to Household Income Ratio in Rose City
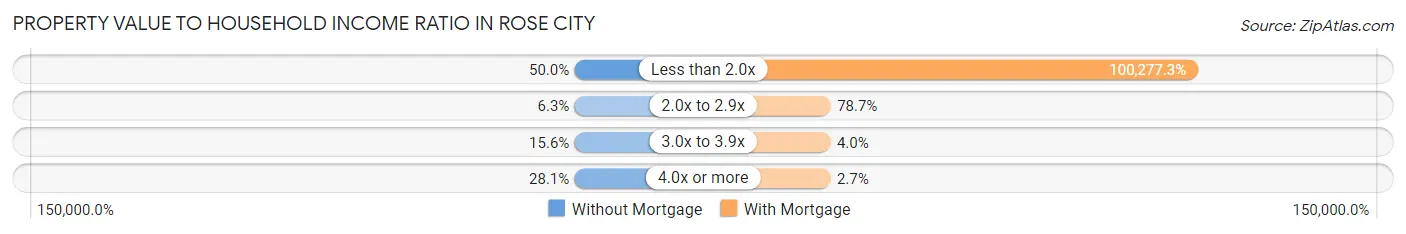
| Value-to-Income Ratio | Without Mortgage | With Mortgage |
| Less than 2.0x | 16 (50.0%) | 75,208 (100,277.3%) |
| 2.0x to 2.9x | 2 (6.2%) | 59 (78.7%) |
| 3.0x to 3.9x | 5 (15.6%) | 3 (4.0%) |
| 4.0x or more | 9 (28.1%) | 2 (2.7%) |
| Total | 32 (100.0%) | 75 (100.0%) |
Real Estate Taxes by Mortgage Status in Rose City
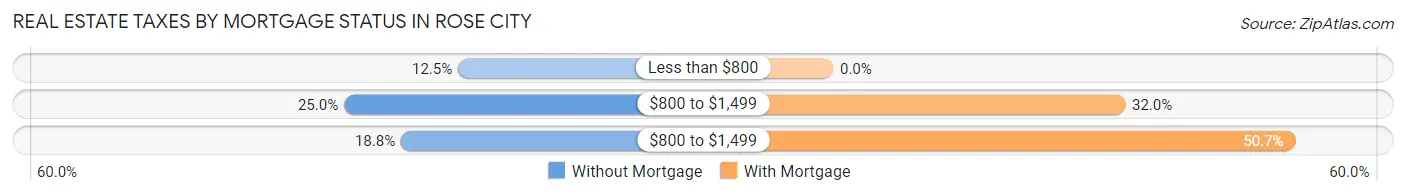
| Property Taxes | Without Mortgage | With Mortgage |
| Less than $800 | 4 (12.5%) | 0 (0.0%) |
| $800 to $1,499 | 8 (25.0%) | 24 (32.0%) |
| $800 to $1,499 | 6 (18.8%) | 38 (50.7%) |
| Total | 32 (100.0%) | 75 (100.0%) |
Health & Disability in Rose City
Health Insurance Coverage by Age in Rose City
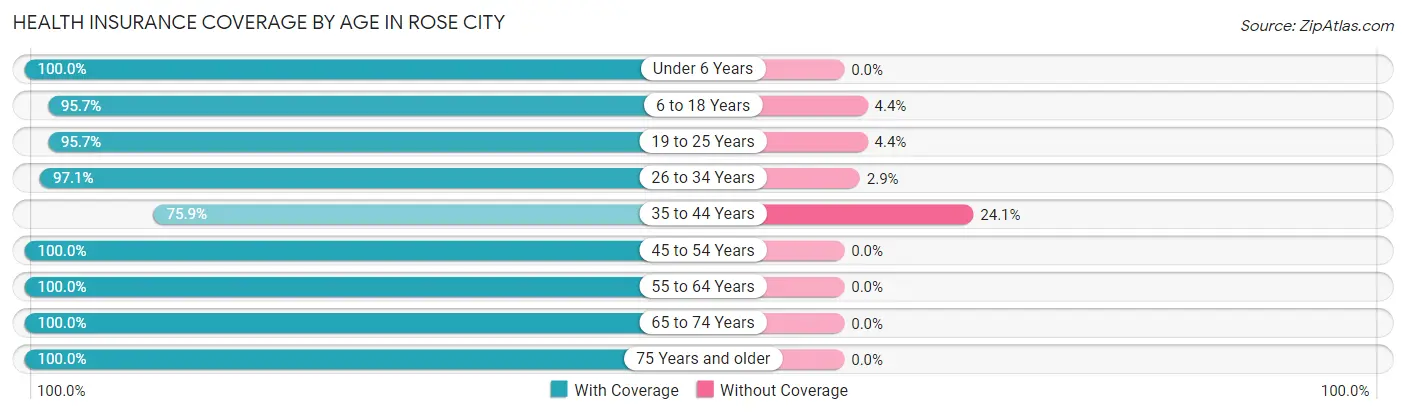
| Age Bracket | With Coverage | Without Coverage |
| Under 6 Years | 37 (100.0%) | 0 (0.0%) |
| 6 to 18 Years | 88 (95.7%) | 4 (4.3%) |
| 19 to 25 Years | 44 (95.7%) | 2 (4.3%) |
| 26 to 34 Years | 67 (97.1%) | 2 (2.9%) |
| 35 to 44 Years | 41 (75.9%) | 13 (24.1%) |
| 45 to 54 Years | 48 (100.0%) | 0 (0.0%) |
| 55 to 64 Years | 83 (100.0%) | 0 (0.0%) |
| 65 to 74 Years | 38 (100.0%) | 0 (0.0%) |
| 75 Years and older | 22 (100.0%) | 0 (0.0%) |
| Total | 468 (95.7%) | 21 (4.3%) |
Health Insurance Coverage by Citizenship Status in Rose City
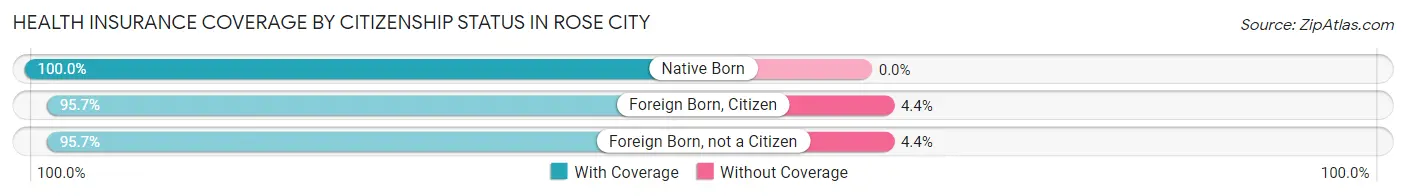
| Citizenship Status | With Coverage | Without Coverage |
| Native Born | 37 (100.0%) | 0 (0.0%) |
| Foreign Born, Citizen | 88 (95.7%) | 4 (4.3%) |
| Foreign Born, not a Citizen | 44 (95.7%) | 2 (4.3%) |
Health Insurance Coverage by Household Income in Rose City
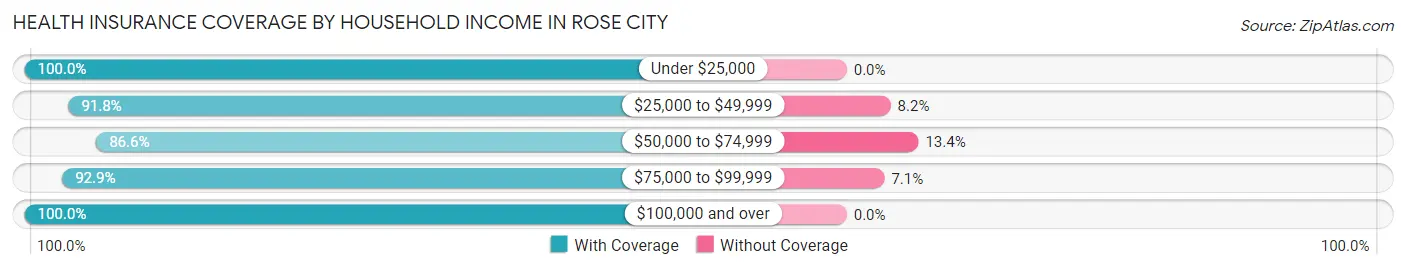
| Household Income | With Coverage | Without Coverage |
| Under $25,000 | 163 (100.0%) | 0 (0.0%) |
| $25,000 to $49,999 | 67 (91.8%) | 6 (8.2%) |
| $50,000 to $74,999 | 58 (86.6%) | 9 (13.4%) |
| $75,000 to $99,999 | 79 (92.9%) | 6 (7.1%) |
| $100,000 and over | 101 (100.0%) | 0 (0.0%) |
Public vs Private Health Insurance Coverage by Age in Rose City
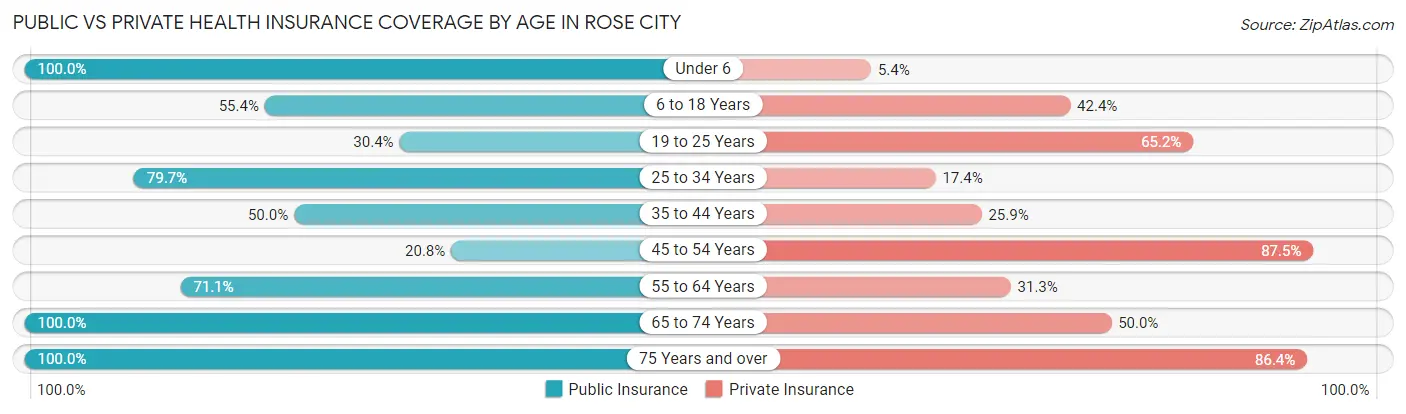
| Age Bracket | Public Insurance | Private Insurance |
| Under 6 | 37 (100.0%) | 2 (5.4%) |
| 6 to 18 Years | 51 (55.4%) | 39 (42.4%) |
| 19 to 25 Years | 14 (30.4%) | 30 (65.2%) |
| 25 to 34 Years | 55 (79.7%) | 12 (17.4%) |
| 35 to 44 Years | 27 (50.0%) | 14 (25.9%) |
| 45 to 54 Years | 10 (20.8%) | 42 (87.5%) |
| 55 to 64 Years | 59 (71.1%) | 26 (31.3%) |
| 65 to 74 Years | 38 (100.0%) | 19 (50.0%) |
| 75 Years and over | 22 (100.0%) | 19 (86.4%) |
| Total | 313 (64.0%) | 203 (41.5%) |
Disability Status by Sex by Age in Rose City
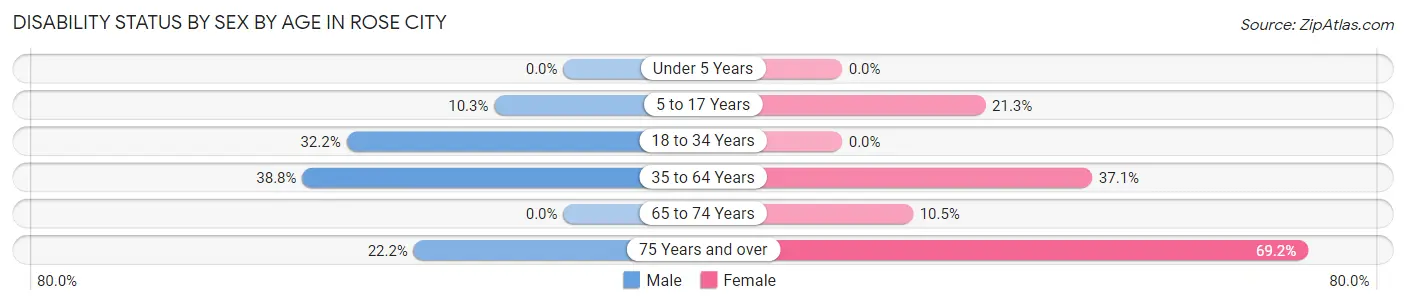
| Age Bracket | Male | Female |
| Under 5 Years | 0 (0.0%) | 0 (0.0%) |
| 5 to 17 Years | 4 (10.3%) | 10 (21.3%) |
| 18 to 34 Years | 19 (32.2%) | 0 (0.0%) |
| 35 to 64 Years | 31 (38.8%) | 39 (37.1%) |
| 65 to 74 Years | 0 (0.0%) | 2 (10.5%) |
| 75 Years and over | 2 (22.2%) | 9 (69.2%) |
Disability Class by Sex by Age in Rose City
Disability Class: Hearing Difficulty
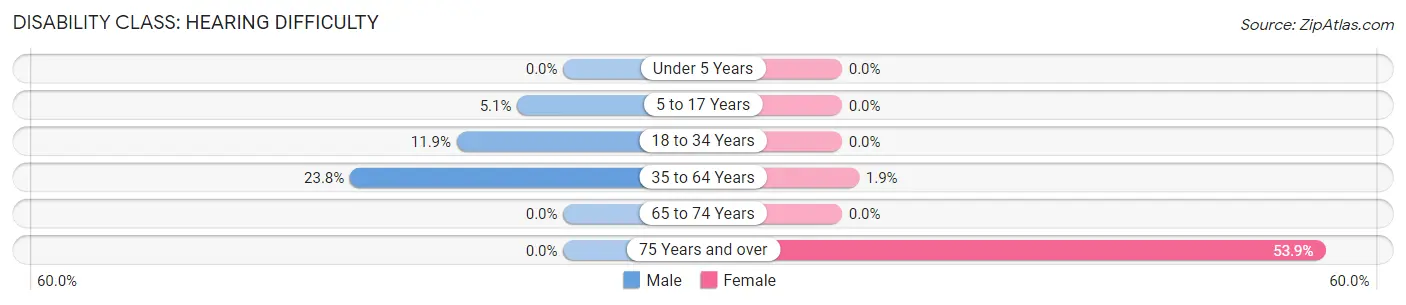
| Age Bracket | Male | Female |
| Under 5 Years | 0 (0.0%) | 0 (0.0%) |
| 5 to 17 Years | 2 (5.1%) | 0 (0.0%) |
| 18 to 34 Years | 7 (11.9%) | 0 (0.0%) |
| 35 to 64 Years | 19 (23.7%) | 2 (1.9%) |
| 65 to 74 Years | 0 (0.0%) | 0 (0.0%) |
| 75 Years and over | 0 (0.0%) | 7 (53.8%) |
Disability Class: Vision Difficulty
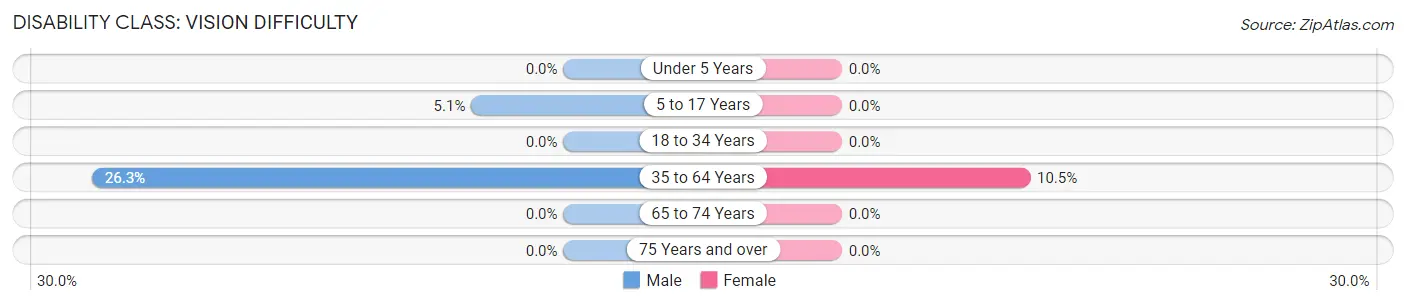
| Age Bracket | Male | Female |
| Under 5 Years | 0 (0.0%) | 0 (0.0%) |
| 5 to 17 Years | 2 (5.1%) | 0 (0.0%) |
| 18 to 34 Years | 0 (0.0%) | 0 (0.0%) |
| 35 to 64 Years | 21 (26.3%) | 11 (10.5%) |
| 65 to 74 Years | 0 (0.0%) | 0 (0.0%) |
| 75 Years and over | 0 (0.0%) | 0 (0.0%) |
Disability Class: Cognitive Difficulty
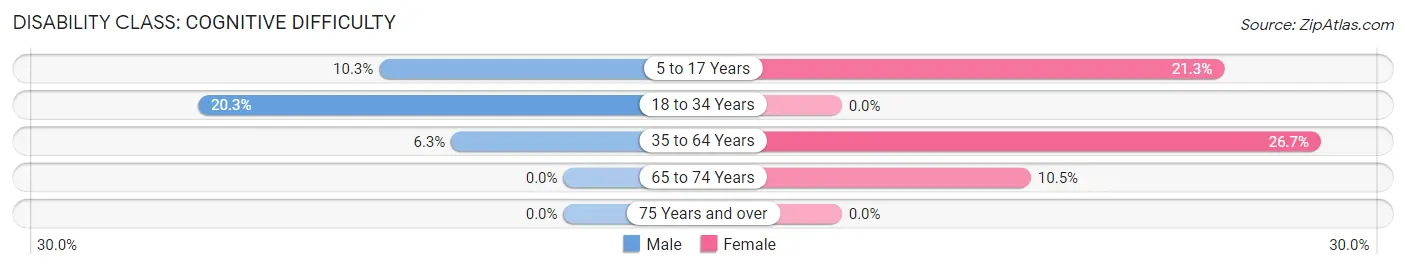
| Age Bracket | Male | Female |
| 5 to 17 Years | 4 (10.3%) | 10 (21.3%) |
| 18 to 34 Years | 12 (20.3%) | 0 (0.0%) |
| 35 to 64 Years | 5 (6.2%) | 28 (26.7%) |
| 65 to 74 Years | 0 (0.0%) | 2 (10.5%) |
| 75 Years and over | 0 (0.0%) | 0 (0.0%) |
Disability Class: Ambulatory Difficulty
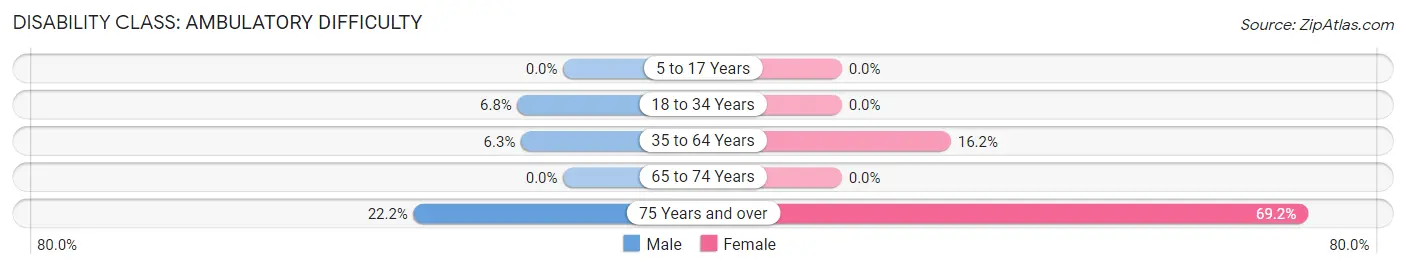
| Age Bracket | Male | Female |
| 5 to 17 Years | 0 (0.0%) | 0 (0.0%) |
| 18 to 34 Years | 4 (6.8%) | 0 (0.0%) |
| 35 to 64 Years | 5 (6.2%) | 17 (16.2%) |
| 65 to 74 Years | 0 (0.0%) | 0 (0.0%) |
| 75 Years and over | 2 (22.2%) | 9 (69.2%) |
Disability Class: Self-Care Difficulty
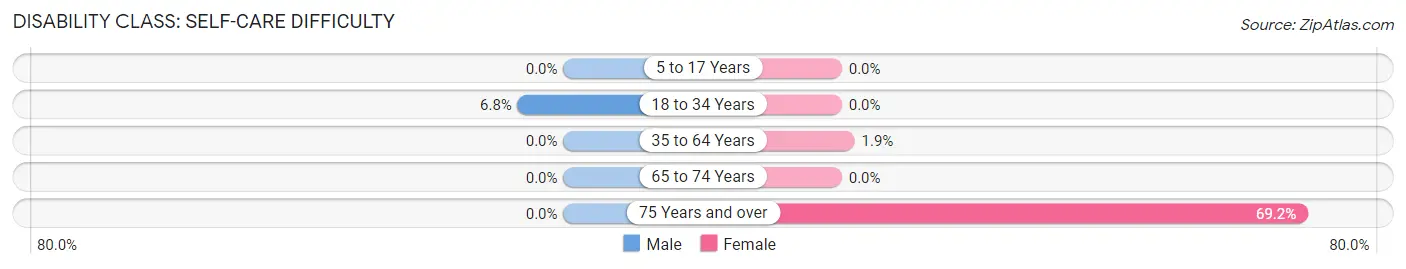
| Age Bracket | Male | Female |
| 5 to 17 Years | 0 (0.0%) | 0 (0.0%) |
| 18 to 34 Years | 4 (6.8%) | 0 (0.0%) |
| 35 to 64 Years | 0 (0.0%) | 2 (1.9%) |
| 65 to 74 Years | 0 (0.0%) | 0 (0.0%) |
| 75 Years and over | 0 (0.0%) | 9 (69.2%) |
Technology Access in Rose City
Computing Device Access in Rose City

| Device Type | # Households | % Households |
| Desktop or Laptop | 127 | 62.3% |
| Smartphone | 146 | 71.6% |
| Tablet | 88 | 43.1% |
| No Computing Device | 39 | 19.1% |
| Total | 204 | 100.0% |
Internet Access in Rose City
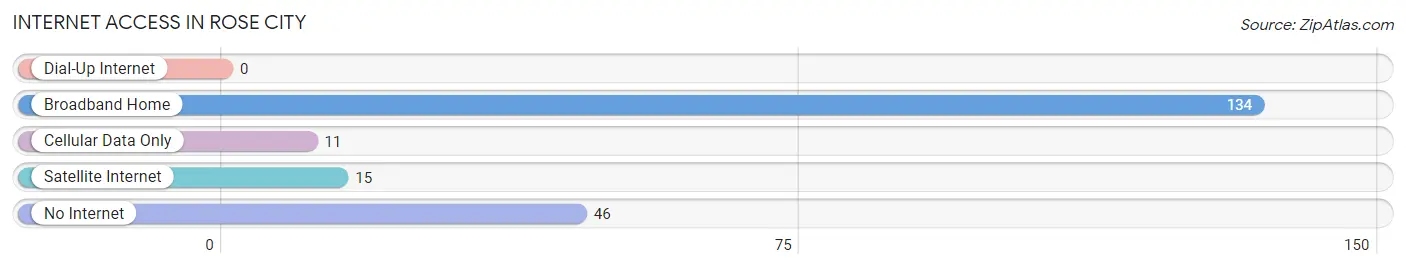
| Internet Type | # Households | % Households |
| Dial-Up Internet | 0 | 0.0% |
| Broadband Home | 134 | 65.7% |
| Cellular Data Only | 11 | 5.4% |
| Satellite Internet | 15 | 7.3% |
| No Internet | 46 | 22.6% |
| Total | 204 | 100.0% |
Rose City Summary
Rose City, Michigan is a small city located in Ogemaw County in the northern part of the Lower Peninsula of Michigan. The city is situated on the banks of the Rifle River, which is a tributary of the Au Sable River. The city is located approximately 30 miles east of West Branch and about 40 miles west of Alpena. The city is home to a population of approximately 1,400 people, according to the 2010 census.
History
The area that is now Rose City was first settled in the late 1800s by a group of lumberjacks. The lumberjacks were attracted to the area due to the abundance of white pine trees in the area. The lumberjacks built a sawmill and a small village was established. The village was named Rose City after the abundance of wild roses that grew in the area.
In the early 1900s, the village began to grow and the population increased. The village was incorporated as a city in 1908. The city was home to a variety of businesses, including a hotel, a bank, a general store, a post office, and a variety of other businesses.
In the 1920s, the city began to decline due to the Great Depression and the decline of the lumber industry. The city was able to survive the depression and the population began to increase again in the 1940s. The city was home to a variety of businesses, including a furniture factory, a canning factory, and a variety of other businesses.
Geography
Rose City is located in Ogemaw County in the northern part of the Lower Peninsula of Michigan. The city is situated on the banks of the Rifle River, which is a tributary of the Au Sable River. The city is located approximately 30 miles east of West Branch and about 40 miles west of Alpena.
The city is located in a rural area and is surrounded by forests and rolling hills. The city is located in a temperate climate and experiences four distinct seasons. The average temperature in the summer is around 75 degrees Fahrenheit and the average temperature in the winter is around 25 degrees Fahrenheit.
Economy
The economy of Rose City is largely based on agriculture and tourism. The city is home to a variety of farms, including dairy farms, beef farms, and vegetable farms. The city is also home to a variety of tourist attractions, including the Rifle River State Recreation Area, which is a popular destination for camping, fishing, and other outdoor activities.
The city is also home to a variety of businesses, including a furniture factory, a canning factory, and a variety of other businesses. The city is also home to a variety of restaurants, shops, and other businesses.
Demographics
According to the 2010 census, the population of Rose City was 1,400 people. The population is largely white, with approximately 95% of the population being white. The median age of the population is 44 years old. The median household income is $37,000 and the median home value is $90,000. The city has a low unemployment rate of 4.2%.
Common Questions
What is Per Capita Income in Rose City?
Per Capita income in Rose City is $20,869.
What is the Median Household income in Rose City?
Median Household Income in Rose City is $26,429.
What is Income or Wage Gap in Rose City?
Income or Wage Gap in Rose City is 10.4%.
Women in Rose City earn 89.6 cents for every dollar earned by a man.
What is Family Income Deficit in Rose City?
Family Income Deficit in Rose City is $10,376.
Families that are below poverty line in Rose City earn $10,376 less on average than the poverty threshold level.
What is Inequality or Gini Index in Rose City?
Inequality or Gini Index in Rose City is 0.48.
What is the Total Population of Rose City?
Total Population of Rose City is 573.
What is the Total Male Population of Rose City?
Total Male Population of Rose City is 259.
What is the Total Female Population of Rose City?
Total Female Population of Rose City is 314.
What is the Ratio of Males per 100 Females in Rose City?
There are 82.48 Males per 100 Females in Rose City.
What is the Ratio of Females per 100 Males in Rose City?
There are 121.24 Females per 100 Males in Rose City.
What is the Median Population Age in Rose City?
Median Population Age in Rose City is 44.2 Years.
What is the Average Family Size in Rose City
Average Family Size in Rose City is 3.2 People.
What is the Average Household Size in Rose City
Average Household Size in Rose City is 2.4 People.
How Large is the Labor Force in Rose City?
There are 260 People in the Labor Forcein in Rose City.
What is the Percentage of People in the Labor Force in Rose City?
54.4% of People are in the Labor Force in Rose City.
What is the Unemployment Rate in Rose City?
Unemployment Rate in Rose City is 16.9%.