River Rouge, MI Map & Demographics
River Rouge Map
River Rouge Overview
$20,541
PER CAPITA INCOME
$38,619
AVG FAMILY INCOME
$26,343
AVG HOUSEHOLD INCOME
57.4%
WAGE / INCOME GAP [ % ]
42.6¢/ $1
WAGE / INCOME GAP [ $ ]
$11,856
FAMILY INCOME DEFICIT
0.57
INEQUALITY / GINI INDEX
7,200
TOTAL POPULATION
3,719
MALE POPULATION
3,481
FEMALE POPULATION
106.84
MALES / 100 FEMALES
93.60
FEMALES / 100 MALES
34.9
MEDIAN AGE
3.8
AVG FAMILY SIZE
2.5
AVG HOUSEHOLD SIZE
2,821
LABOR FORCE [ PEOPLE ]
50.2%
PERCENT IN LABOR FORCE
12.9%
UNEMPLOYMENT RATE
River Rouge Zip Codes
River Rouge Area Codes
Income in River Rouge
Income Overview in River Rouge
Per Capita Income in River Rouge is $20,541, while median incomes of families and households are $38,619 and $26,343 respectively.
| Characteristic | Number | Measure |
| Per Capita Income | 7,200 | $20,541 |
| Median Family Income | 1,360 | $38,619 |
| Mean Family Income | 1,360 | $63,170 |
| Median Household Income | 2,900 | $26,343 |
| Mean Household Income | 2,900 | $46,985 |
| Income Deficit | 1,360 | $11,856 |
| Wage / Income Gap (%) | 7,200 | 57.37% |
| Wage / Income Gap ($) | 7,200 | 42.63¢ per $1 |
| Gini / Inequality Index | 7,200 | 0.57 |
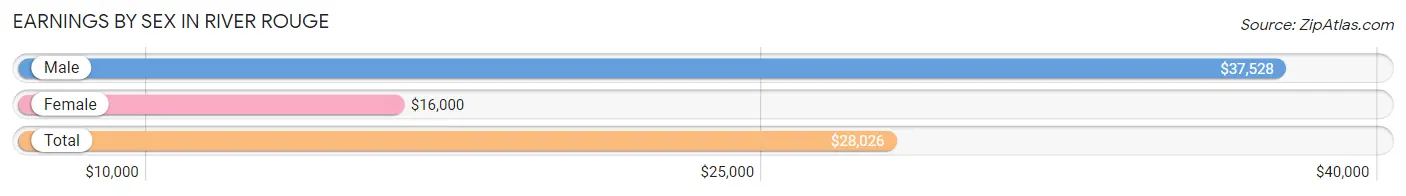
Earnings by Sex in River Rouge
Average Earnings in River Rouge are $28,026, $37,528 for men and $16,000 for women, a difference of 57.4%.
| Sex | Number | Average Earnings |
| Male | 1,258 (45.4%) | $37,528 |
| Female | 1,516 (54.6%) | $16,000 |
| Total | 2,774 (100.0%) | $28,026 |
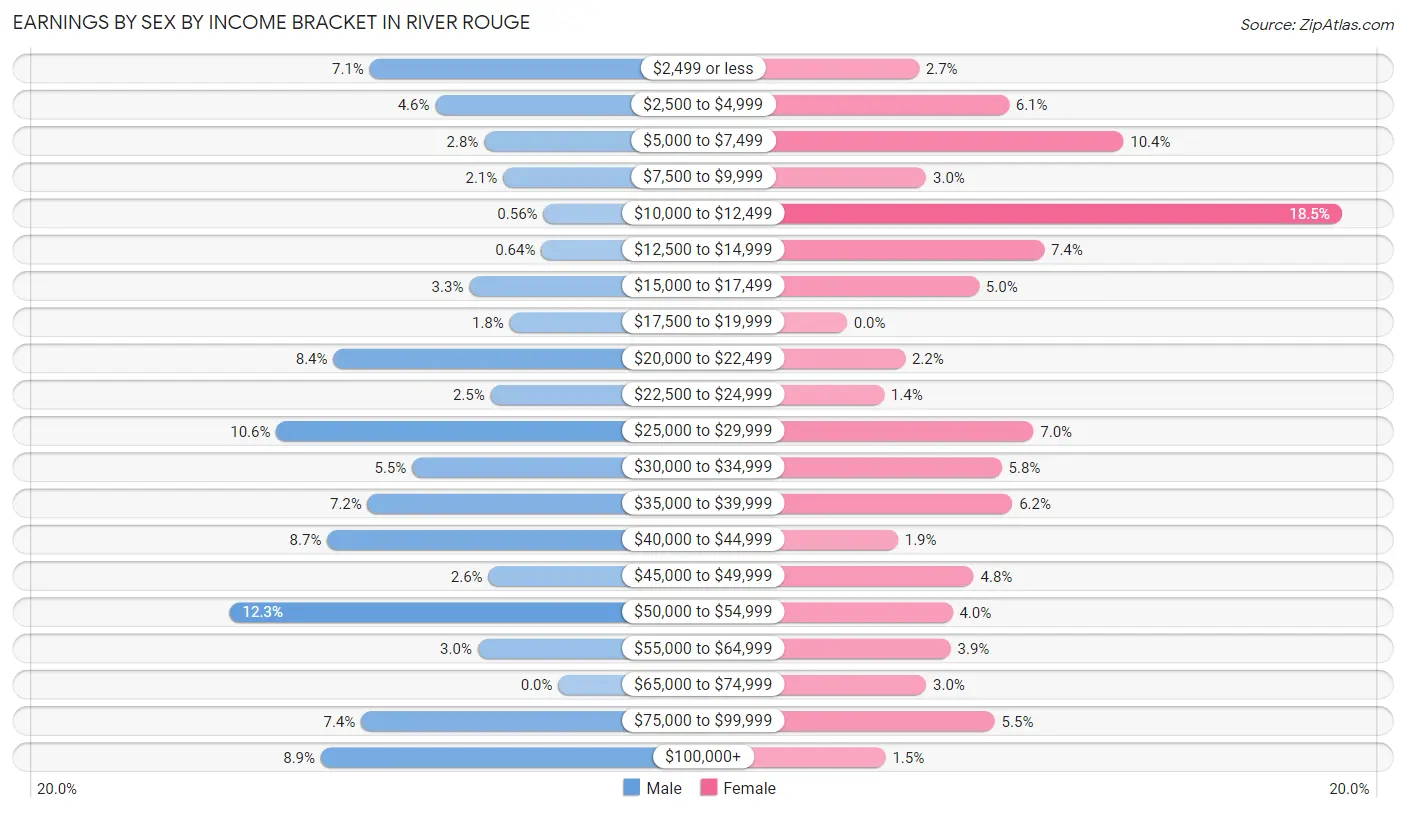
Earnings by Sex by Income Bracket in River Rouge
The most common earnings brackets in River Rouge are $50,000 to $54,999 for men (155 | 12.3%) and $10,000 to $12,499 for women (281 | 18.5%).
| Income | Male | Female |
| $2,499 or less | 89 (7.1%) | 41 (2.7%) |
| $2,500 to $4,999 | 58 (4.6%) | 92 (6.1%) |
| $5,000 to $7,499 | 35 (2.8%) | 157 (10.4%) |
| $7,500 to $9,999 | 26 (2.1%) | 45 (3.0%) |
| $10,000 to $12,499 | 7 (0.6%) | 281 (18.5%) |
| $12,500 to $14,999 | 8 (0.6%) | 112 (7.4%) |
| $15,000 to $17,499 | 42 (3.3%) | 75 (5.0%) |
| $17,500 to $19,999 | 23 (1.8%) | 0 (0.0%) |
| $20,000 to $22,499 | 106 (8.4%) | 33 (2.2%) |
| $22,500 to $24,999 | 32 (2.5%) | 21 (1.4%) |
| $25,000 to $29,999 | 133 (10.6%) | 106 (7.0%) |
| $30,000 to $34,999 | 69 (5.5%) | 88 (5.8%) |
| $35,000 to $39,999 | 90 (7.1%) | 94 (6.2%) |
| $40,000 to $44,999 | 109 (8.7%) | 29 (1.9%) |
| $45,000 to $49,999 | 33 (2.6%) | 72 (4.8%) |
| $50,000 to $54,999 | 155 (12.3%) | 60 (4.0%) |
| $55,000 to $64,999 | 38 (3.0%) | 59 (3.9%) |
| $65,000 to $74,999 | 0 (0.0%) | 45 (3.0%) |
| $75,000 to $99,999 | 93 (7.4%) | 84 (5.5%) |
| $100,000+ | 112 (8.9%) | 22 (1.5%) |
| Total | 1,258 (100.0%) | 1,516 (100.0%) |
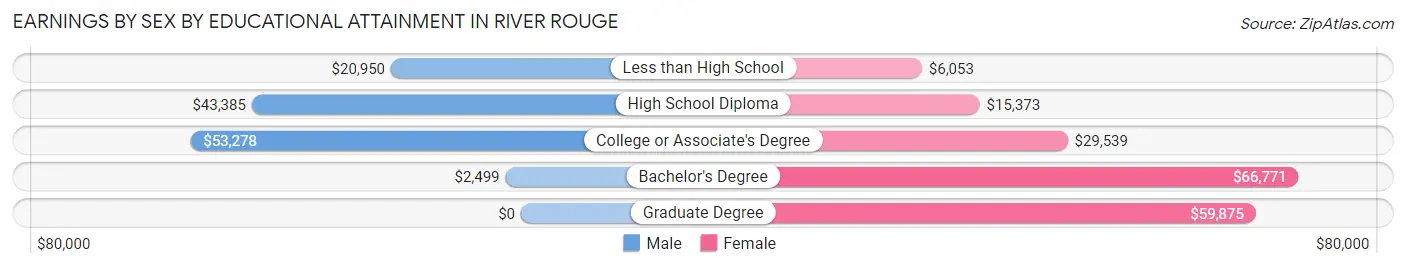
Earnings by Sex by Educational Attainment in River Rouge
Average earnings in River Rouge are $39,650 for men and $21,402 for women, a difference of 46.0%. Men with an educational attainment of college or associate's degree enjoy the highest average annual earnings of $53,278, while those with bachelor's degree education earn the least with $2,499. Women with an educational attainment of bachelor's degree earn the most with the average annual earnings of $66,771, while those with less than high school education have the smallest earnings of $6,053.
| Educational Attainment | Male Income | Female Income |
| Less than High School | $20,950 | $6,053 |
| High School Diploma | $43,385 | $15,373 |
| College or Associate's Degree | $53,278 | $29,539 |
| Bachelor's Degree | $2,499 | $66,771 |
| Graduate Degree | - | - |
| Total | $39,650 | $21,402 |
Family Income in River Rouge
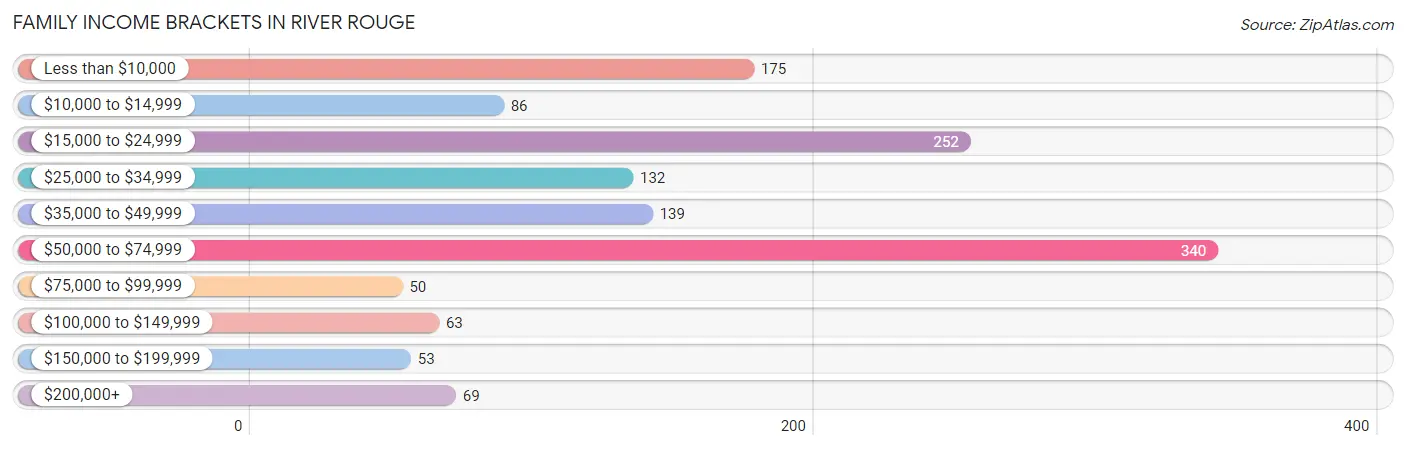
Family Income Brackets in River Rouge
According to the River Rouge family income data, there are 340 families falling into the $50,000 to $74,999 income range, which is the most common income bracket and makes up 25.0% of all families. Conversely, the $75,000 to $99,999 income bracket is the least frequent group with only 50 families (3.7%) belonging to this category.
| Income Bracket | # Families | % Families |
| Less than $10,000 | 175 | 12.9% |
| $10,000 to $14,999 | 86 | 6.3% |
| $15,000 to $24,999 | 252 | 18.5% |
| $25,000 to $34,999 | 132 | 9.7% |
| $35,000 to $49,999 | 139 | 10.2% |
| $50,000 to $74,999 | 340 | 25.0% |
| $75,000 to $99,999 | 50 | 3.7% |
| $100,000 to $149,999 | 63 | 4.6% |
| $150,000 to $199,999 | 53 | 3.9% |
| $200,000+ | 69 | 5.1% |
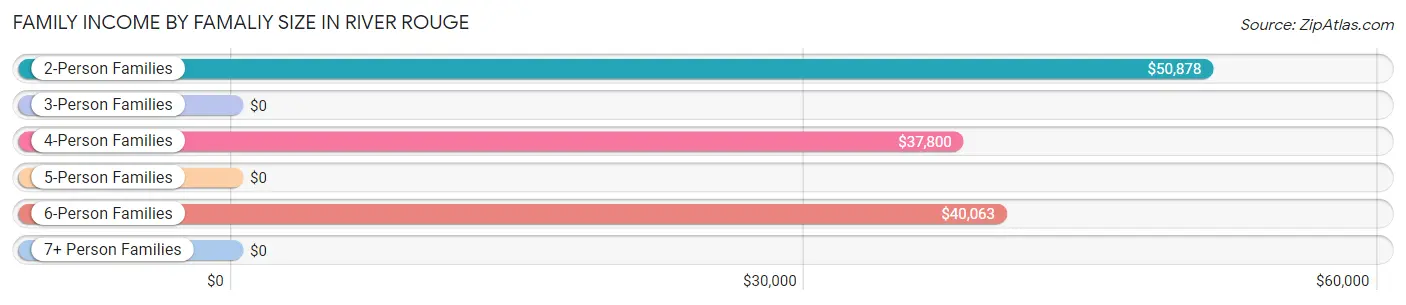
Family Income by Famaliy Size in River Rouge
2-person families (630 | 46.3%) account for the highest median family income in River Rouge with $50,878 per family, while 2-person families (630 | 46.3%) have the highest median income of $25,439 per family member.
| Income Bracket | # Families | Median Income |
| 2-Person Families | 630 (46.3%) | $50,878 |
| 3-Person Families | 255 (18.8%) | $0 |
| 4-Person Families | 222 (16.3%) | $37,800 |
| 5-Person Families | 64 (4.7%) | $0 |
| 6-Person Families | 147 (10.8%) | $40,063 |
| 7+ Person Families | 42 (3.1%) | $0 |
| Total | 1,360 (100.0%) | $38,619 |
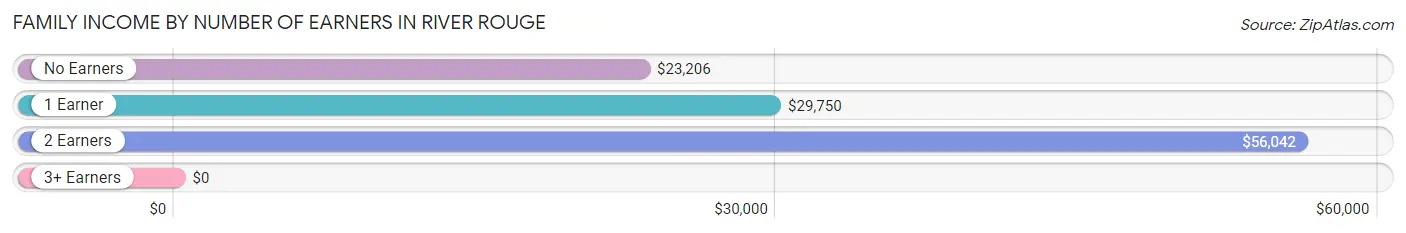
Family Income by Number of Earners in River Rouge
| Number of Earners | # Families | Median Income |
| No Earners | 300 (22.1%) | $23,206 |
| 1 Earner | 554 (40.7%) | $29,750 |
| 2 Earners | 482 (35.4%) | $56,042 |
| 3+ Earners | 24 (1.8%) | $0 |
| Total | 1,360 (100.0%) | $38,619 |
Household Income in River Rouge
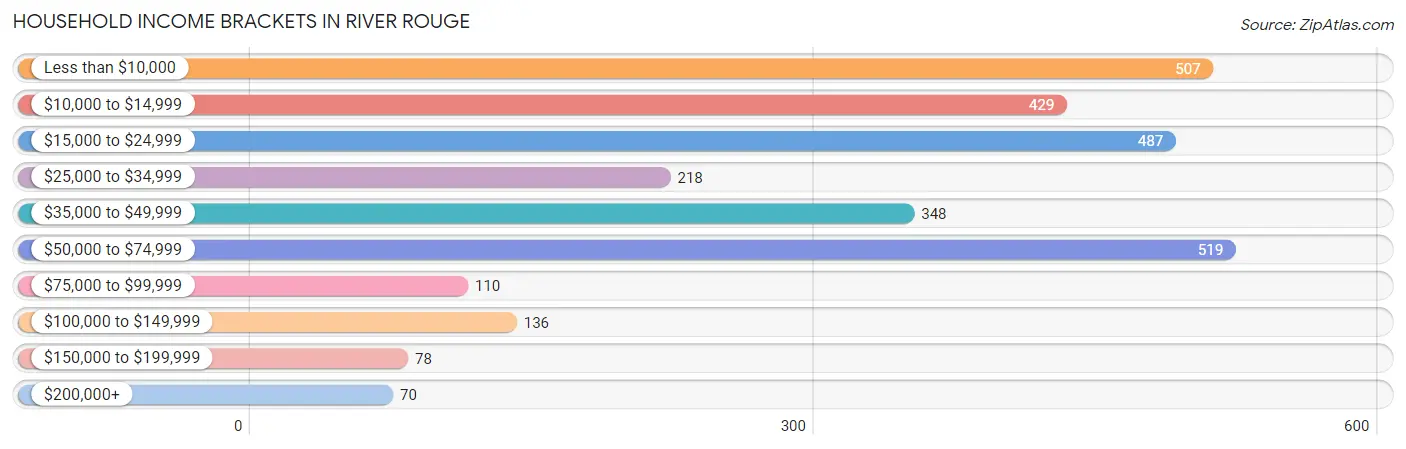
Household Income Brackets in River Rouge
With 519 households falling in the category, the $50,000 to $74,999 income range is the most frequent in River Rouge, accounting for 17.9% of all households. In contrast, only 70 households (2.4%) fall into the $200,000+ income bracket, making it the least populous group.
| Income Bracket | # Households | % Households |
| Less than $10,000 | 507 | 17.5% |
| $10,000 to $14,999 | 429 | 14.8% |
| $15,000 to $24,999 | 487 | 16.8% |
| $25,000 to $34,999 | 218 | 7.5% |
| $35,000 to $49,999 | 348 | 12.0% |
| $50,000 to $74,999 | 519 | 17.9% |
| $75,000 to $99,999 | 110 | 3.8% |
| $100,000 to $149,999 | 136 | 4.7% |
| $150,000 to $199,999 | 78 | 2.7% |
| $200,000+ | 70 | 2.4% |
Household Income by Householder Age in River Rouge
The median household income in River Rouge is $26,343, with the highest median household income of $33,917 found in the 25 to 44 years age bracket for the primary householder. A total of 822 households (28.3%) fall into this category. Meanwhile, the 15 to 24 years age bracket for the primary householder has the lowest median household income of $0, with 96 households (3.3%) in this group.
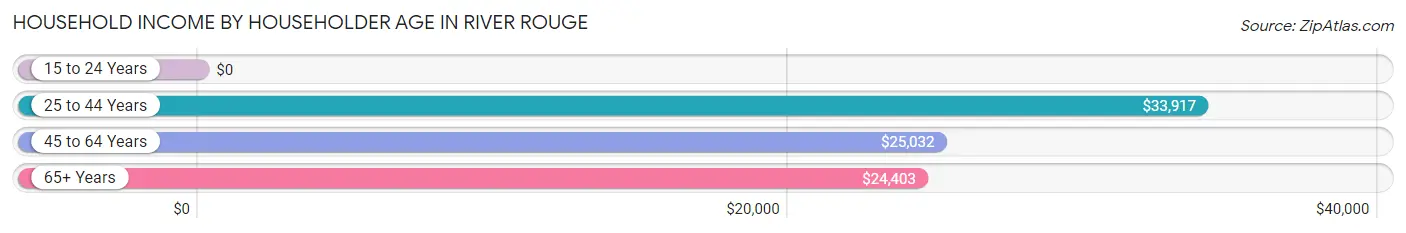
| Income Bracket | # Households | Median Income |
| 15 to 24 Years | 96 (3.3%) | $0 |
| 25 to 44 Years | 822 (28.3%) | $33,917 |
| 45 to 64 Years | 1,373 (47.3%) | $25,032 |
| 65+ Years | 609 (21.0%) | $24,403 |
| Total | 2,900 (100.0%) | $26,343 |
Poverty in River Rouge
Income Below Poverty by Sex and Age in River Rouge
With 42.7% poverty level for males and 45.1% for females among the residents of River Rouge, 5 year old males and 16 and 17 year old females are the most vulnerable to poverty, with 52 males (100.0%) and 24 females (82.8%) in their respective age groups living below the poverty level.
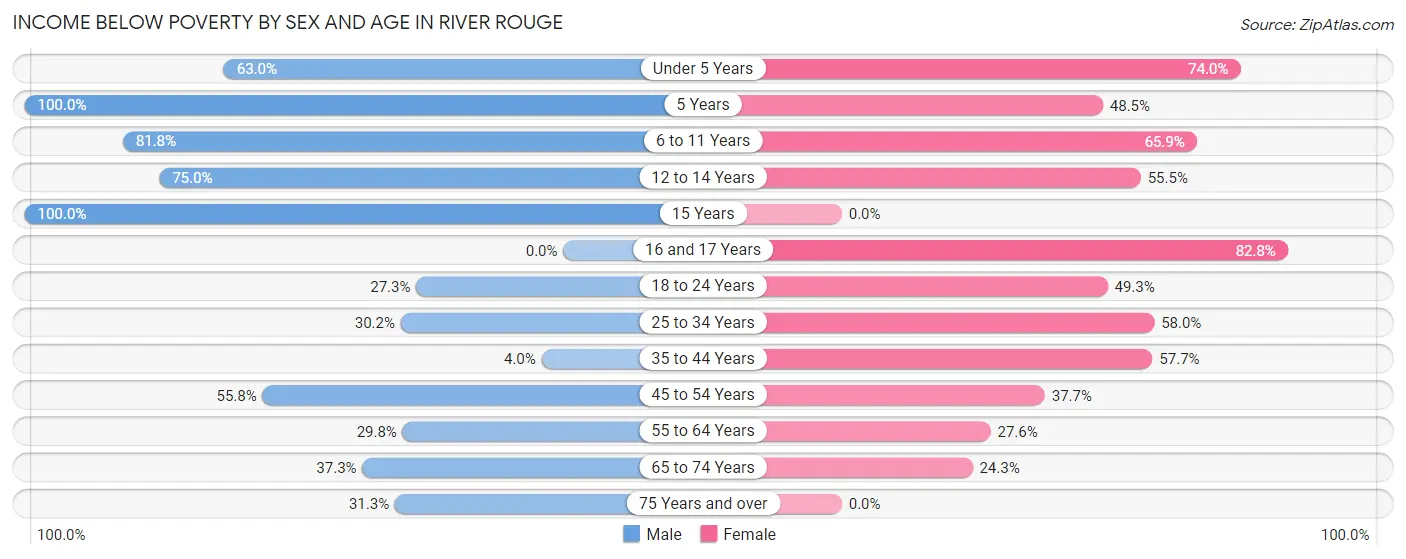
| Age Bracket | Male | Female |
| Under 5 Years | 121 (63.0%) | 108 (74.0%) |
| 5 Years | 52 (100.0%) | 63 (48.5%) |
| 6 to 11 Years | 287 (81.8%) | 83 (65.9%) |
| 12 to 14 Years | 228 (75.0%) | 91 (55.5%) |
| 15 Years | 46 (100.0%) | 0 (0.0%) |
| 16 and 17 Years | 0 (0.0%) | 24 (82.8%) |
| 18 to 24 Years | 110 (27.3%) | 180 (49.3%) |
| 25 to 34 Years | 169 (30.2%) | 399 (58.0%) |
| 35 to 44 Years | 18 (4.0%) | 211 (57.7%) |
| 45 to 54 Years | 258 (55.8%) | 188 (37.7%) |
| 55 to 64 Years | 133 (29.8%) | 148 (27.6%) |
| 65 to 74 Years | 141 (37.3%) | 74 (24.3%) |
| 75 Years and over | 25 (31.2%) | 0 (0.0%) |
| Total | 1,588 (42.7%) | 1,569 (45.1%) |
Income Above Poverty by Sex and Age in River Rouge
According to the poverty statistics in River Rouge, males aged 35 to 44 years and females aged 15 years are the age groups that are most secure financially, with 96.0% of males and 100.0% of females in these age groups living above the poverty line.
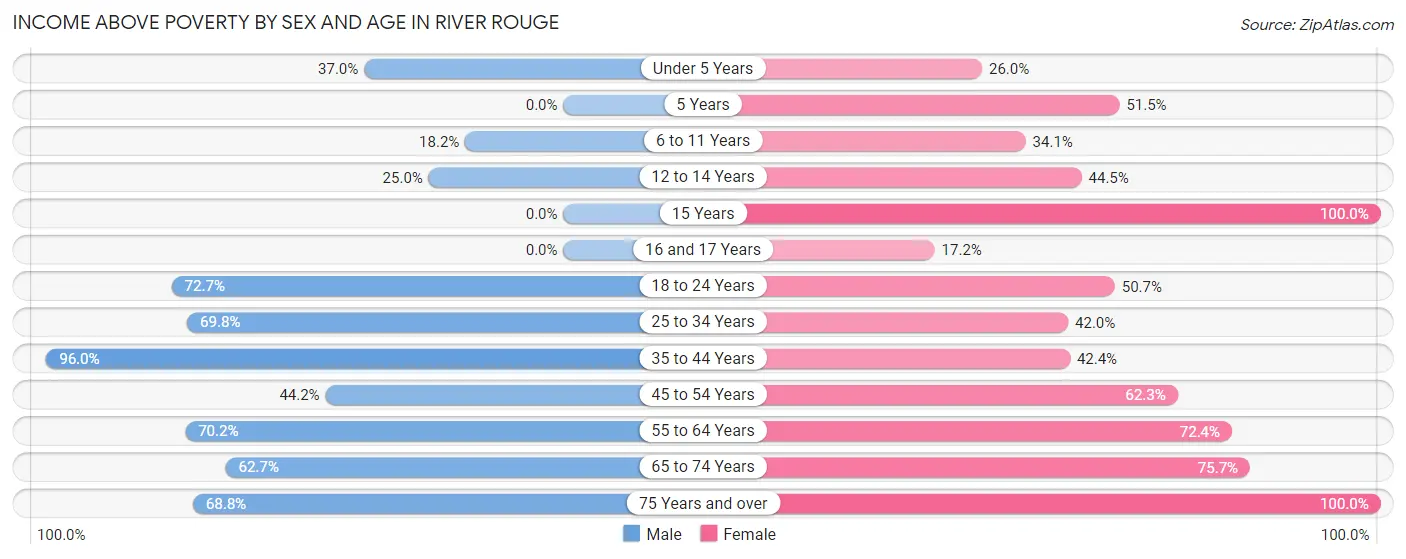
| Age Bracket | Male | Female |
| Under 5 Years | 71 (37.0%) | 38 (26.0%) |
| 5 Years | 0 (0.0%) | 67 (51.5%) |
| 6 to 11 Years | 64 (18.2%) | 43 (34.1%) |
| 12 to 14 Years | 76 (25.0%) | 73 (44.5%) |
| 15 Years | 0 (0.0%) | 69 (100.0%) |
| 16 and 17 Years | 0 (0.0%) | 5 (17.2%) |
| 18 to 24 Years | 293 (72.7%) | 185 (50.7%) |
| 25 to 34 Years | 391 (69.8%) | 289 (42.0%) |
| 35 to 44 Years | 427 (96.0%) | 155 (42.3%) |
| 45 to 54 Years | 204 (44.2%) | 311 (62.3%) |
| 55 to 64 Years | 313 (70.2%) | 388 (72.4%) |
| 65 to 74 Years | 237 (62.7%) | 231 (75.7%) |
| 75 Years and over | 55 (68.8%) | 58 (100.0%) |
| Total | 2,131 (57.3%) | 1,912 (54.9%) |
Income Below Poverty Among Married-Couple Families in River Rouge
The poverty statistics for married-couple families in River Rouge show that 16.1% or 98 of the total 608 families live below the poverty line. Families with 1 or 2 children have the highest poverty rate of 40.8%, comprising of 29 families. On the other hand, families with no children have the lowest poverty rate of 11.2%, which includes 52 families.
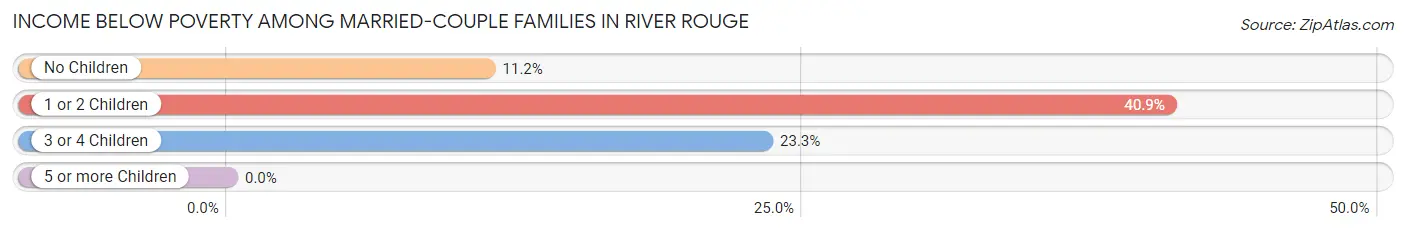
| Children | Above Poverty | Below Poverty |
| No Children | 412 (88.8%) | 52 (11.2%) |
| 1 or 2 Children | 42 (59.2%) | 29 (40.8%) |
| 3 or 4 Children | 56 (76.7%) | 17 (23.3%) |
| 5 or more Children | 0 (0.0%) | 0 (0.0%) |
| Total | 510 (83.9%) | 98 (16.1%) |
Income Below Poverty Among Single-Parent Households in River Rouge
According to the poverty data in River Rouge, 44.8% or 103 single-father households and 57.1% or 298 single-mother households are living below the poverty line. Among single-father households, those with 1 or 2 children have the highest poverty rate, with 57 households (100.0%) experiencing poverty. Likewise, among single-mother households, those with 3 or 4 children have the highest poverty rate, with 148 households (100.0%) falling below the poverty line.
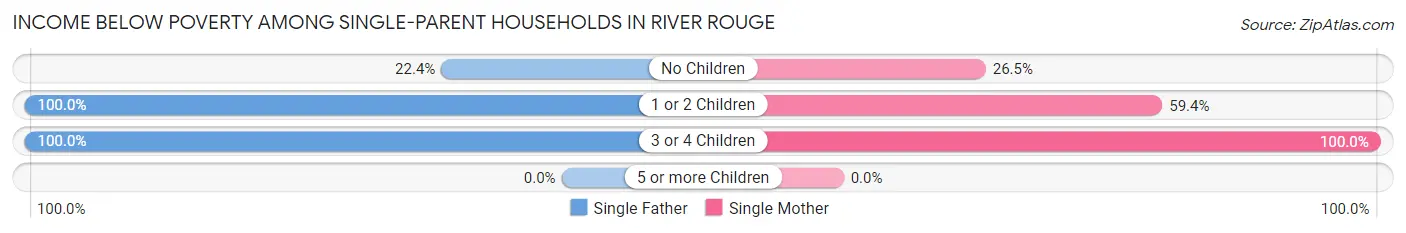
| Children | Single Father | Single Mother |
| No Children | 26 (22.4%) | 58 (26.5%) |
| 1 or 2 Children | 57 (100.0%) | 92 (59.4%) |
| 3 or 4 Children | 20 (100.0%) | 148 (100.0%) |
| 5 or more Children | 0 (0.0%) | 0 (0.0%) |
| Total | 103 (44.8%) | 298 (57.1%) |
Income Below Poverty Among Married-Couple vs Single-Parent Households in River Rouge
The poverty data for River Rouge shows that 98 of the married-couple family households (16.1%) and 401 of the single-parent households (53.3%) are living below the poverty level. Within the married-couple family households, those with 1 or 2 children have the highest poverty rate, with 29 households (40.8%) falling below the poverty line. Among the single-parent households, those with 3 or 4 children have the highest poverty rate, with 168 household (100.0%) living below poverty.
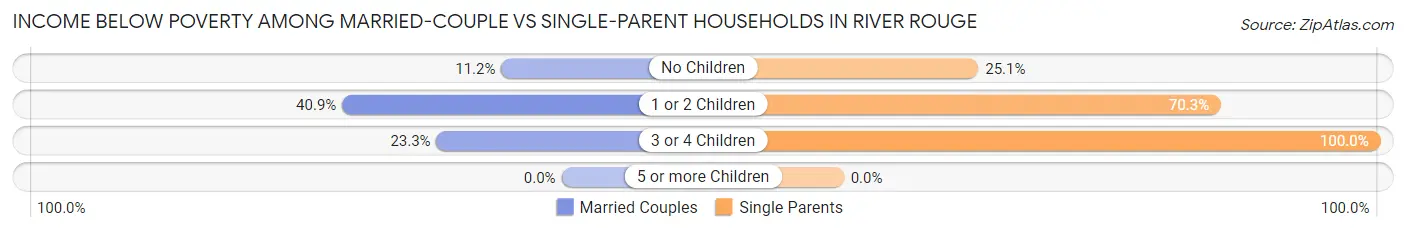
| Children | Married-Couple Families | Single-Parent Households |
| No Children | 52 (11.2%) | 84 (25.1%) |
| 1 or 2 Children | 29 (40.8%) | 149 (70.3%) |
| 3 or 4 Children | 17 (23.3%) | 168 (100.0%) |
| 5 or more Children | 0 (0.0%) | 0 (0.0%) |
| Total | 98 (16.1%) | 401 (53.3%) |
Race in River Rouge
The most populous races in River Rouge are Black / African American (3,330 | 46.3%), White / Caucasian (2,633 | 36.6%), and Two or more Races (1,160 | 16.1%).
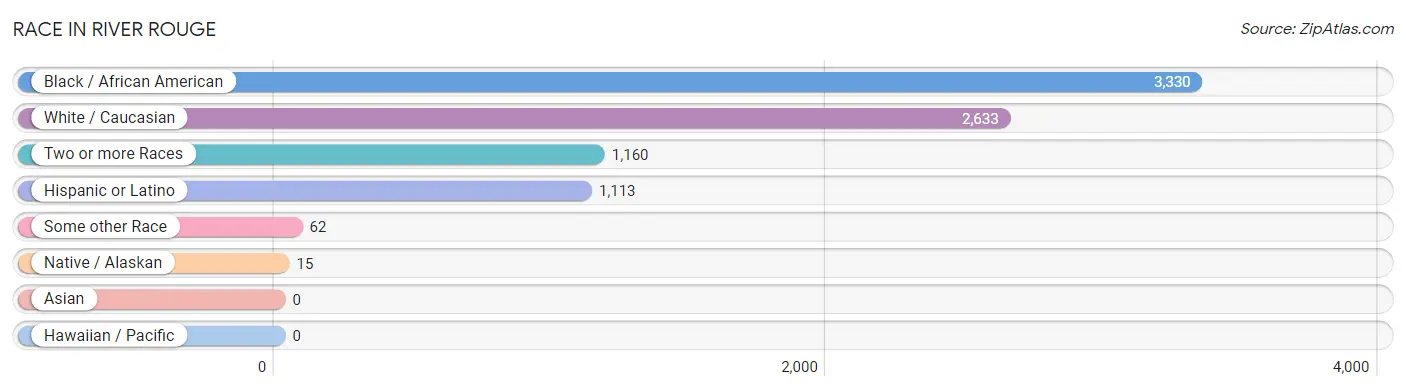
| Race | # Population | % Population |
| Asian | 0 | 0.0% |
| Black / African American | 3,330 | 46.3% |
| Hawaiian / Pacific | 0 | 0.0% |
| Hispanic or Latino | 1,113 | 15.5% |
| Native / Alaskan | 15 | 0.2% |
| White / Caucasian | 2,633 | 36.6% |
| Two or more Races | 1,160 | 16.1% |
| Some other Race | 62 | 0.9% |
| Total | 7,200 | 100.0% |
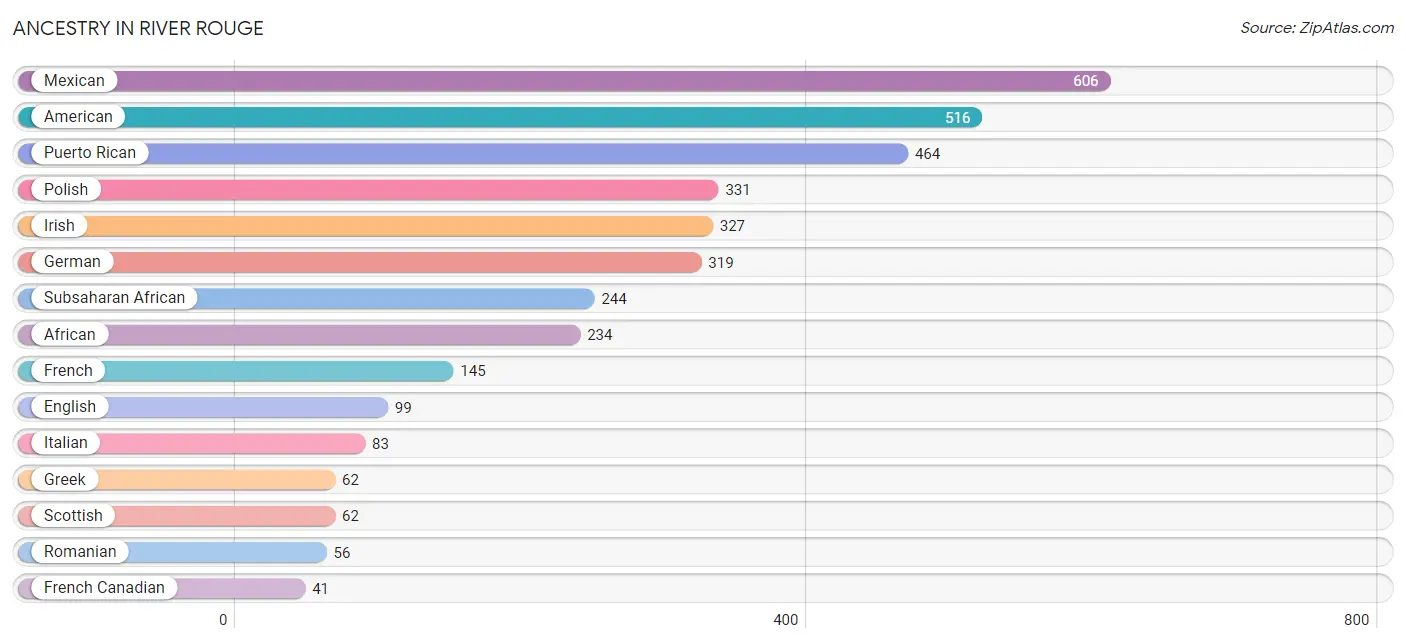
Ancestry in River Rouge
The most populous ancestries reported in River Rouge are Mexican (606 | 8.4%), American (516 | 7.2%), Puerto Rican (464 | 6.4%), Polish (331 | 4.6%), and Irish (327 | 4.5%), together accounting for 31.2% of all River Rouge residents.
| Ancestry | # Population | % Population |
| African | 234 | 3.3% |
| American | 516 | 7.2% |
| Central American | 16 | 0.2% |
| Cherokee | 6 | 0.1% |
| Chippewa | 3 | 0.0% |
| Danish | 26 | 0.4% |
| English | 99 | 1.4% |
| Finnish | 7 | 0.1% |
| French | 145 | 2.0% |
| French Canadian | 41 | 0.6% |
| German | 319 | 4.4% |
| Greek | 62 | 0.9% |
| Guatemalan | 16 | 0.2% |
| Indian (Asian) | 35 | 0.5% |
| Irish | 327 | 4.5% |
| Italian | 83 | 1.1% |
| Korean | 25 | 0.4% |
| Mexican | 606 | 8.4% |
| Native Hawaiian | 25 | 0.4% |
| Nigerian | 10 | 0.1% |
| Polish | 331 | 4.6% |
| Puerto Rican | 464 | 6.4% |
| Romanian | 56 | 0.8% |
| Scotch-Irish | 38 | 0.5% |
| Scottish | 62 | 0.9% |
| Slovak | 1 | 0.0% |
| Spaniard | 27 | 0.4% |
| Sri Lankan | 25 | 0.4% |
| Subsaharan African | 244 | 3.4% |
| Swedish | 7 | 0.1% |
| Thai | 25 | 0.4% |
| Welsh | 7 | 0.1% |
| Yugoslavian | 25 | 0.4% | View All 33 Rows |
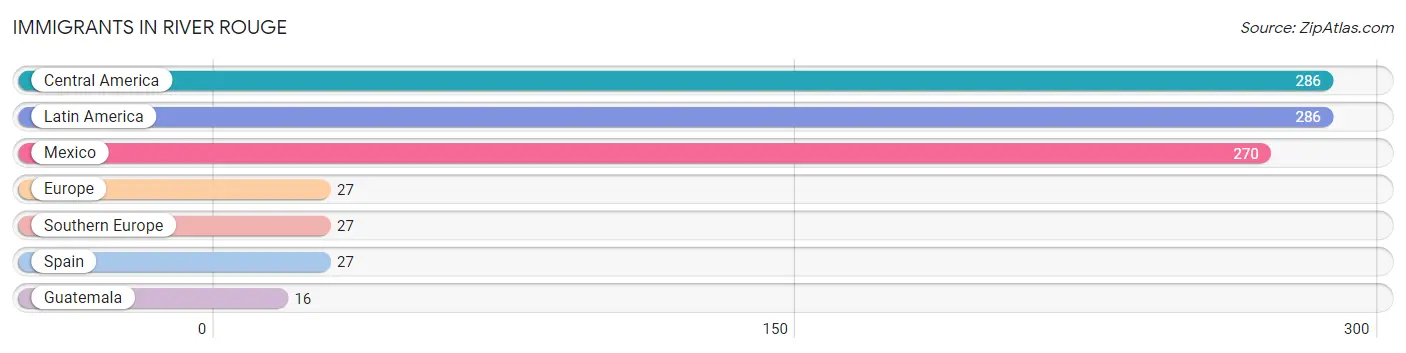
Immigrants in River Rouge
The most numerous immigrant groups reported in River Rouge came from Central America (286 | 4.0%), Latin America (286 | 4.0%), Mexico (270 | 3.7%), Europe (27 | 0.4%), and Southern Europe (27 | 0.4%), together accounting for 12.4% of all River Rouge residents.
| Immigration Origin | # Population | % Population |
| Central America | 286 | 4.0% |
| Europe | 27 | 0.4% |
| Guatemala | 16 | 0.2% |
| Latin America | 286 | 4.0% |
| Mexico | 270 | 3.7% |
| Southern Europe | 27 | 0.4% |
| Spain | 27 | 0.4% | View All 7 Rows |
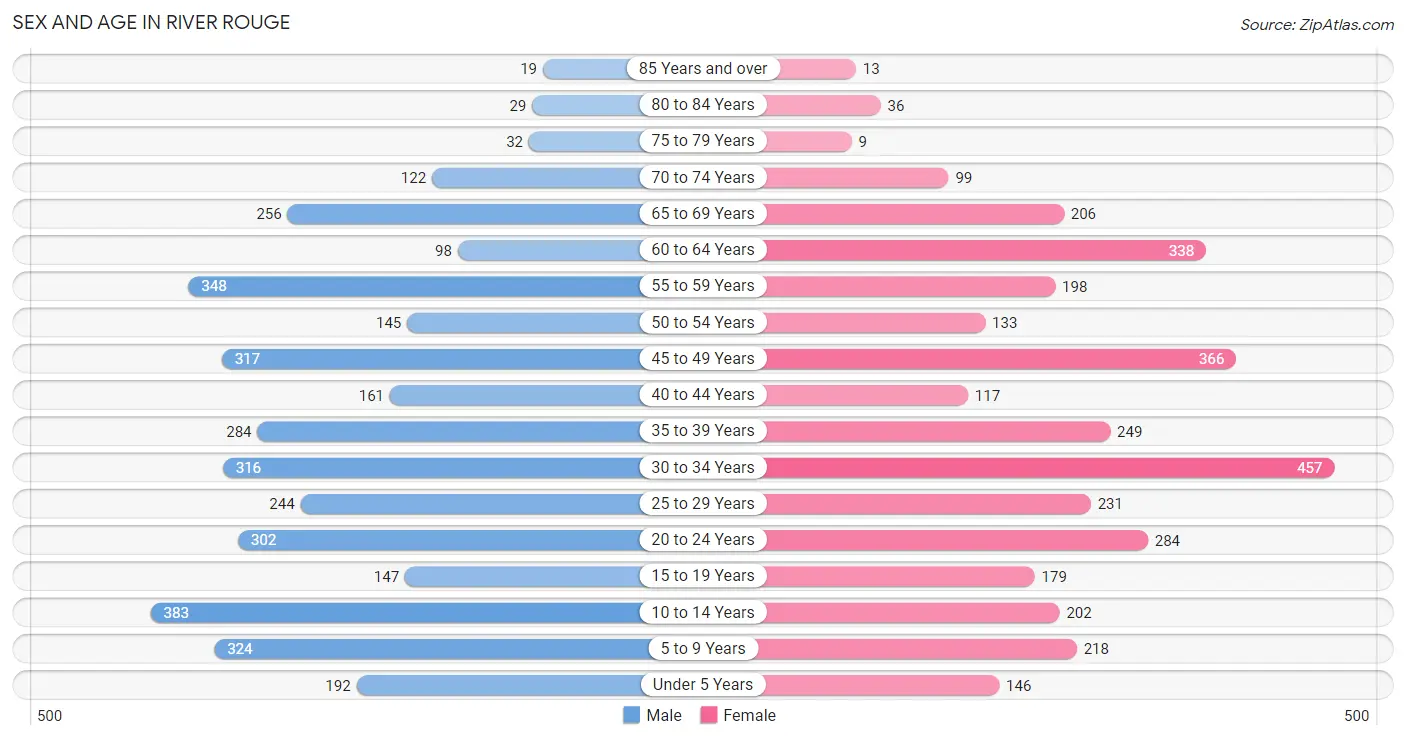
Sex and Age in River Rouge
Sex and Age in River Rouge
The most populous age groups in River Rouge are 10 to 14 Years (383 | 10.3%) for men and 30 to 34 Years (457 | 13.1%) for women.
| Age Bracket | Male | Female |
| Under 5 Years | 192 (5.2%) | 146 (4.2%) |
| 5 to 9 Years | 324 (8.7%) | 218 (6.3%) |
| 10 to 14 Years | 383 (10.3%) | 202 (5.8%) |
| 15 to 19 Years | 147 (4.0%) | 179 (5.1%) |
| 20 to 24 Years | 302 (8.1%) | 284 (8.2%) |
| 25 to 29 Years | 244 (6.6%) | 231 (6.6%) |
| 30 to 34 Years | 316 (8.5%) | 457 (13.1%) |
| 35 to 39 Years | 284 (7.6%) | 249 (7.1%) |
| 40 to 44 Years | 161 (4.3%) | 117 (3.4%) |
| 45 to 49 Years | 317 (8.5%) | 366 (10.5%) |
| 50 to 54 Years | 145 (3.9%) | 133 (3.8%) |
| 55 to 59 Years | 348 (9.4%) | 198 (5.7%) |
| 60 to 64 Years | 98 (2.6%) | 338 (9.7%) |
| 65 to 69 Years | 256 (6.9%) | 206 (5.9%) |
| 70 to 74 Years | 122 (3.3%) | 99 (2.8%) |
| 75 to 79 Years | 32 (0.9%) | 9 (0.3%) |
| 80 to 84 Years | 29 (0.8%) | 36 (1.0%) |
| 85 Years and over | 19 (0.5%) | 13 (0.4%) |
| Total | 3,719 (100.0%) | 3,481 (100.0%) |
Families and Households in River Rouge
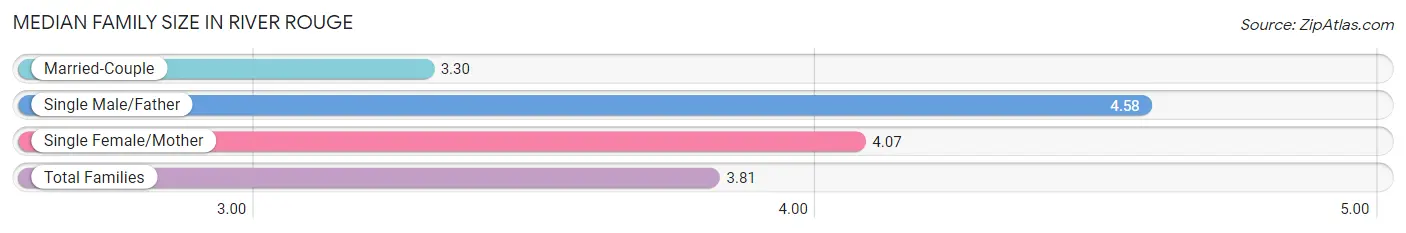
Median Family Size in River Rouge
The median family size in River Rouge is 3.81 persons per family, with single male/father families (230 | 16.9%) accounting for the largest median family size of 4.58 persons per family. On the other hand, married-couple families (608 | 44.7%) represent the smallest median family size with 3.30 persons per family.
| Family Type | # Families | Family Size |
| Married-Couple | 608 (44.7%) | 3.30 |
| Single Male/Father | 230 (16.9%) | 4.58 |
| Single Female/Mother | 522 (38.4%) | 4.07 |
| Total Families | 1,360 (100.0%) | 3.81 |
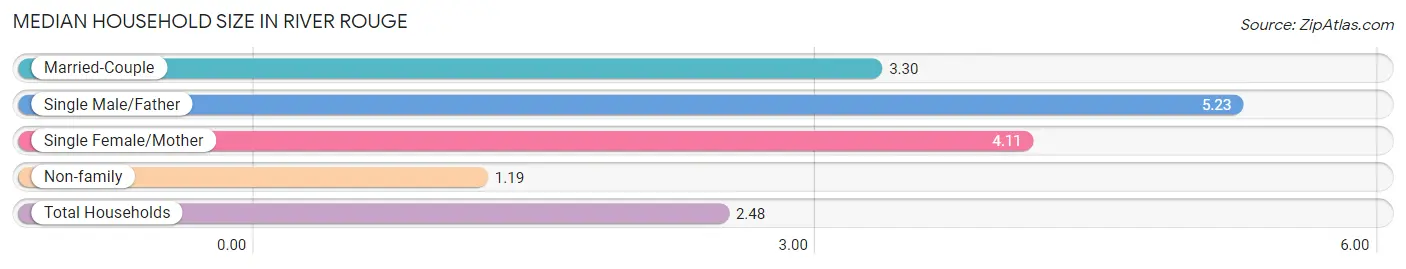
Median Household Size in River Rouge
The median household size in River Rouge is 2.48 persons per household, with single male/father households (230 | 7.9%) accounting for the largest median household size of 5.23 persons per household. non-family households (1,540 | 53.1%) represent the smallest median household size with 1.19 persons per household.
| Household Type | # Households | Household Size |
| Married-Couple | 608 (21.0%) | 3.30 |
| Single Male/Father | 230 (7.9%) | 5.23 |
| Single Female/Mother | 522 (18.0%) | 4.11 |
| Non-family | 1,540 (53.1%) | 1.19 |
| Total Households | 2,900 (100.0%) | 2.48 |
Household Size by Marriage Status in River Rouge
Out of a total of 2,900 households in River Rouge, 1,360 (46.9%) are family households, while 1,540 (53.1%) are nonfamily households. The most numerous type of family households are 2-person households, comprising 588, and the most common type of nonfamily households are 1-person households, comprising 1,377.
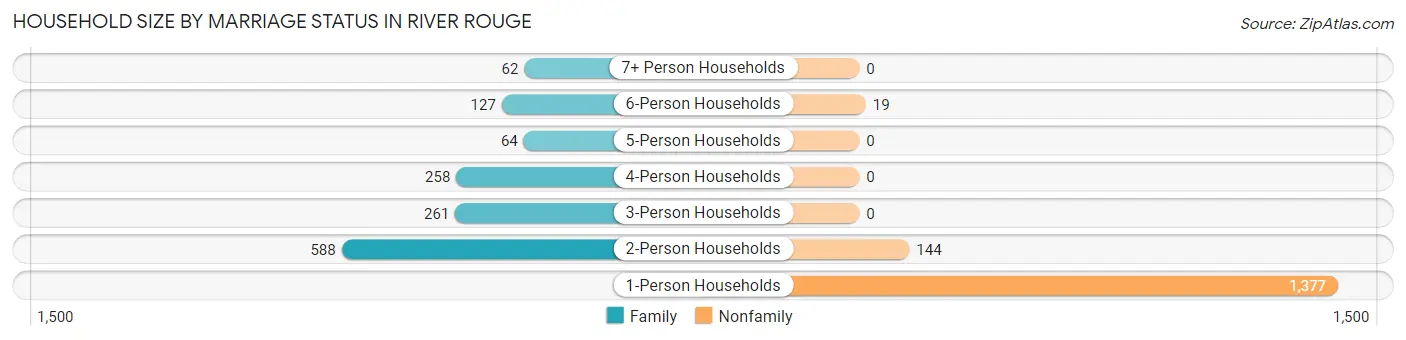
| Household Size | Family Households | Nonfamily Households |
| 1-Person Households | - | 1,377 (47.5%) |
| 2-Person Households | 588 (20.3%) | 144 (5.0%) |
| 3-Person Households | 261 (9.0%) | 0 (0.0%) |
| 4-Person Households | 258 (8.9%) | 0 (0.0%) |
| 5-Person Households | 64 (2.2%) | 0 (0.0%) |
| 6-Person Households | 127 (4.4%) | 19 (0.7%) |
| 7+ Person Households | 62 (2.1%) | 0 (0.0%) |
| Total | 1,360 (46.9%) | 1,540 (53.1%) |
Female Fertility in River Rouge
Fertility by Age in River Rouge
Average fertility rate in River Rouge is 28.0 births per 1,000 women. Women in the age bracket of 20 to 34 years have the highest fertility rate with 56.0 births per 1,000 women. Women in the age bracket of 20 to 34 years acount for 100.0% of all women with births.
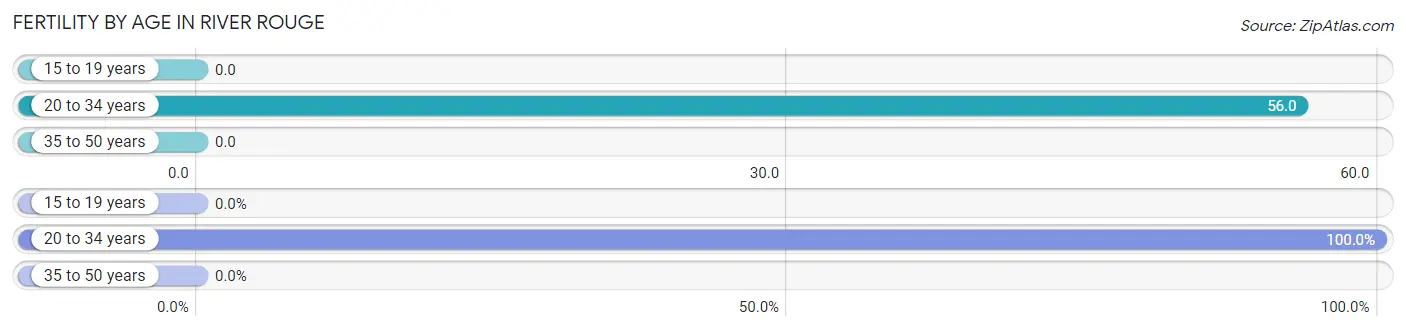
| Age Bracket | Women with Births | Births / 1,000 Women |
| 15 to 19 years | 0 (0.0%) | 0.0 |
| 20 to 34 years | 54 (100.0%) | 56.0 |
| 35 to 50 years | 0 (0.0%) | 0.0 |
| Total | 54 (100.0%) | 28.0 |
Fertility by Age by Marriage Status in River Rouge
31.5% of women with births (54) in River Rouge are married. The highest percentage of unmarried women with births falls into 20 to 34 years age bracket with 68.5% of them unmarried at the time of birth, while the lowest percentage of unmarried women with births belong to 20 to 34 years age bracket with 68.5% of them unmarried.
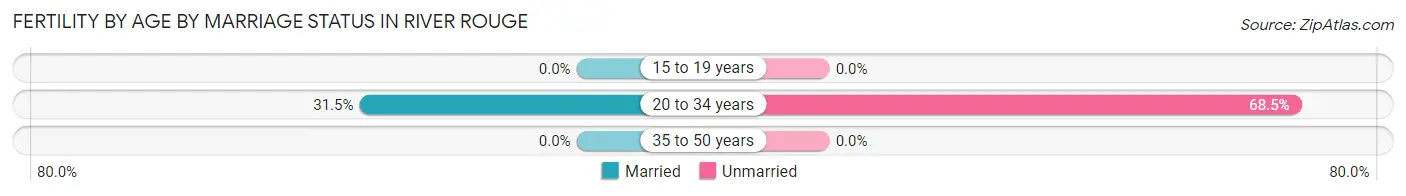
| Age Bracket | Married | Unmarried |
| 15 to 19 years | 0 (0.0%) | 0 (0.0%) |
| 20 to 34 years | 17 (31.5%) | 37 (68.5%) |
| 35 to 50 years | 0 (0.0%) | 0 (0.0%) |
| Total | 17 (31.5%) | 37 (68.5%) |
Fertility by Education in River Rouge
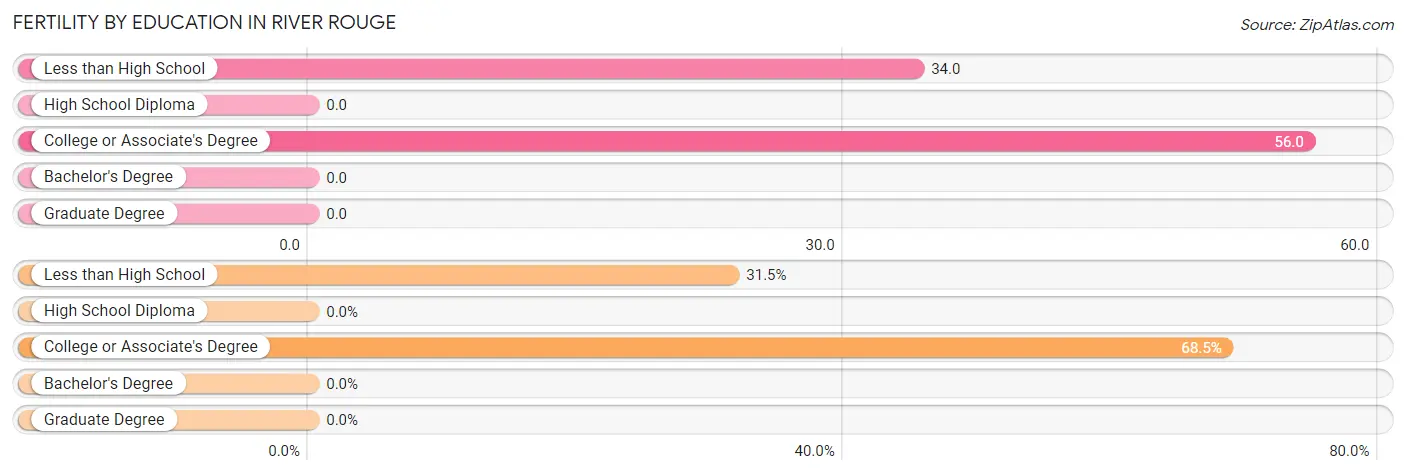
| Educational Attainment | Women with Births | Births / 1,000 Women |
| Less than High School | 17 (31.5%) | 34.0 |
| High School Diploma | 0 (0.0%) | 0.0 |
| College or Associate's Degree | 37 (68.5%) | 56.0 |
| Bachelor's Degree | 0 (0.0%) | 0.0 |
| Graduate Degree | 0 (0.0%) | 0.0 |
| Total | 54 (100.0%) | 28.0 |
Fertility by Education by Marriage Status in River Rouge
68.5% of women with births in River Rouge are unmarried. Women with the educational attainment of less than high school are most likely to be married with 100.0% of them married at childbirth, while women with the educational attainment of college or associate's degree are least likely to be married with 100.0% of them unmarried at childbirth.
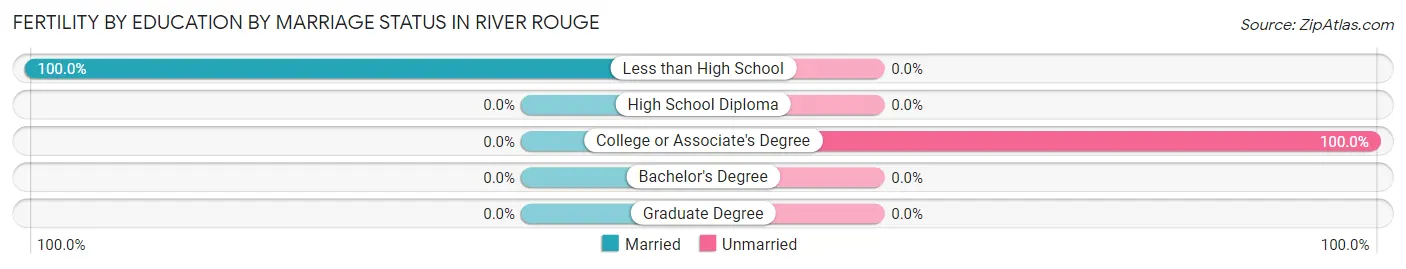
| Educational Attainment | Married | Unmarried |
| Less than High School | 17 (100.0%) | 0 (0.0%) |
| High School Diploma | 0 (0.0%) | 0 (0.0%) |
| College or Associate's Degree | 0 (0.0%) | 37 (100.0%) |
| Bachelor's Degree | 0 (0.0%) | 0 (0.0%) |
| Graduate Degree | 0 (0.0%) | 0 (0.0%) |
| Total | 17 (31.5%) | 37 (68.5%) |
Employment Characteristics in River Rouge
Employment by Class of Employer in River Rouge
Among the 2,368 employed individuals in River Rouge, private company employees (1,839 | 77.7%), state government employees (131 | 5.5%), and not-for-profit organizations (128 | 5.4%) make up the most common classes of employment.
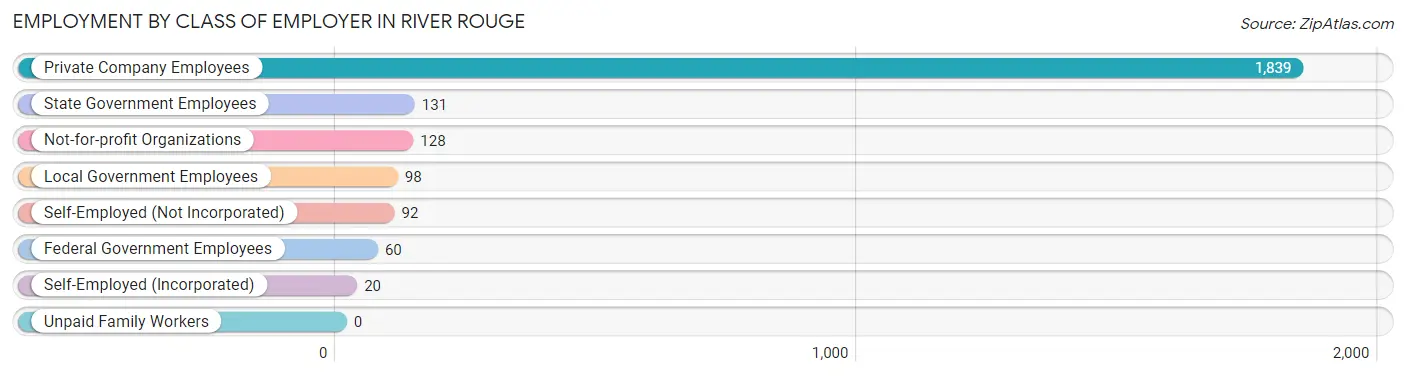
| Employer Class | # Employees | % Employees |
| Private Company Employees | 1,839 | 77.7% |
| Self-Employed (Incorporated) | 20 | 0.8% |
| Self-Employed (Not Incorporated) | 92 | 3.9% |
| Not-for-profit Organizations | 128 | 5.4% |
| Local Government Employees | 98 | 4.1% |
| State Government Employees | 131 | 5.5% |
| Federal Government Employees | 60 | 2.5% |
| Unpaid Family Workers | 0 | 0.0% |
| Total | 2,368 | 100.0% |
Employment Status by Age in River Rouge
According to the labor force statistics for River Rouge, out of the total population over 16 years of age (5,620), 50.2% or 2,821 individuals are in the labor force, with 12.9% or 364 of them unemployed. The age group with the highest labor force participation rate is 35 to 44 years, with 74.1% or 601 individuals in the labor force. Within the labor force, the 65 to 74 years age range has the highest percentage of unemployed individuals, with 36.4% or 39 of them being unemployed.
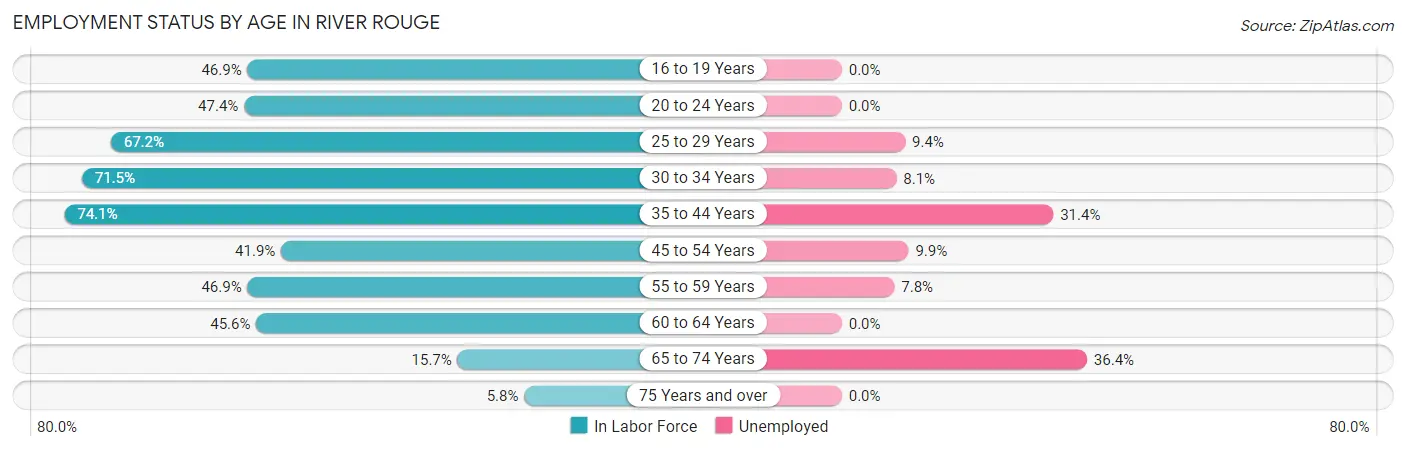
| Age Bracket | In Labor Force | Unemployed |
| 16 to 19 Years | 99 (46.9%) | 0 (0.0%) |
| 20 to 24 Years | 278 (47.4%) | 0 (0.0%) |
| 25 to 29 Years | 319 (67.2%) | 30 (9.4%) |
| 30 to 34 Years | 553 (71.5%) | 45 (8.1%) |
| 35 to 44 Years | 601 (74.1%) | 189 (31.4%) |
| 45 to 54 Years | 403 (41.9%) | 40 (9.9%) |
| 55 to 59 Years | 256 (46.9%) | 20 (7.8%) |
| 60 to 64 Years | 199 (45.6%) | 0 (0.0%) |
| 65 to 74 Years | 107 (15.7%) | 39 (36.4%) |
| 75 Years and over | 8 (5.8%) | 0 (0.0%) |
| Total | 2,821 (50.2%) | 364 (12.9%) |
Employment Status by Educational Attainment in River Rouge
According to labor force statistics for River Rouge, 58.2% of individuals (2,329) out of the total population between 25 and 64 years of age (4,002) are in the labor force, with 13.9% or 324 of them being unemployed. The group with the highest labor force participation rate are those with the educational attainment of college / associate degree, with 70.2% or 896 individuals in the labor force. Within the labor force, individuals with less than high school education have the highest percentage of unemployment, with 30.0% or 92 of them being unemployed.
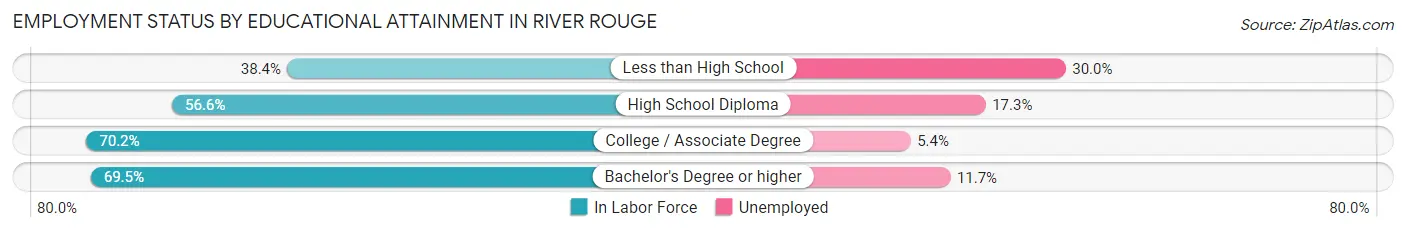
| Educational Attainment | In Labor Force | Unemployed |
| Less than High School | 307 (38.4%) | 240 (30.0%) |
| High School Diploma | 923 (56.6%) | 282 (17.3%) |
| College / Associate Degree | 896 (70.2%) | 69 (5.4%) |
| Bachelor's Degree or higher | 205 (69.5%) | 35 (11.7%) |
| Total | 2,329 (58.2%) | 556 (13.9%) |
Employment Occupations by Sex in River Rouge
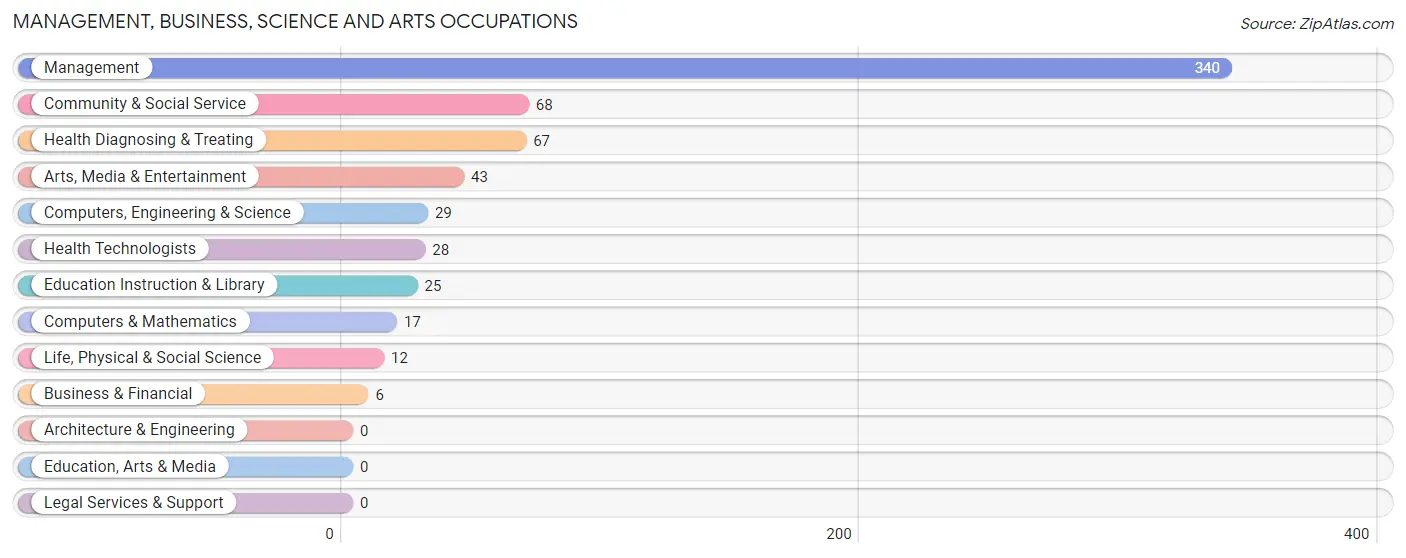
Management, Business, Science and Arts Occupations
The most common Management, Business, Science and Arts occupations in River Rouge are Management (340 | 13.8%), Community & Social Service (68 | 2.8%), Health Diagnosing & Treating (67 | 2.7%), Arts, Media & Entertainment (43 | 1.8%), and Computers, Engineering & Science (29 | 1.2%).
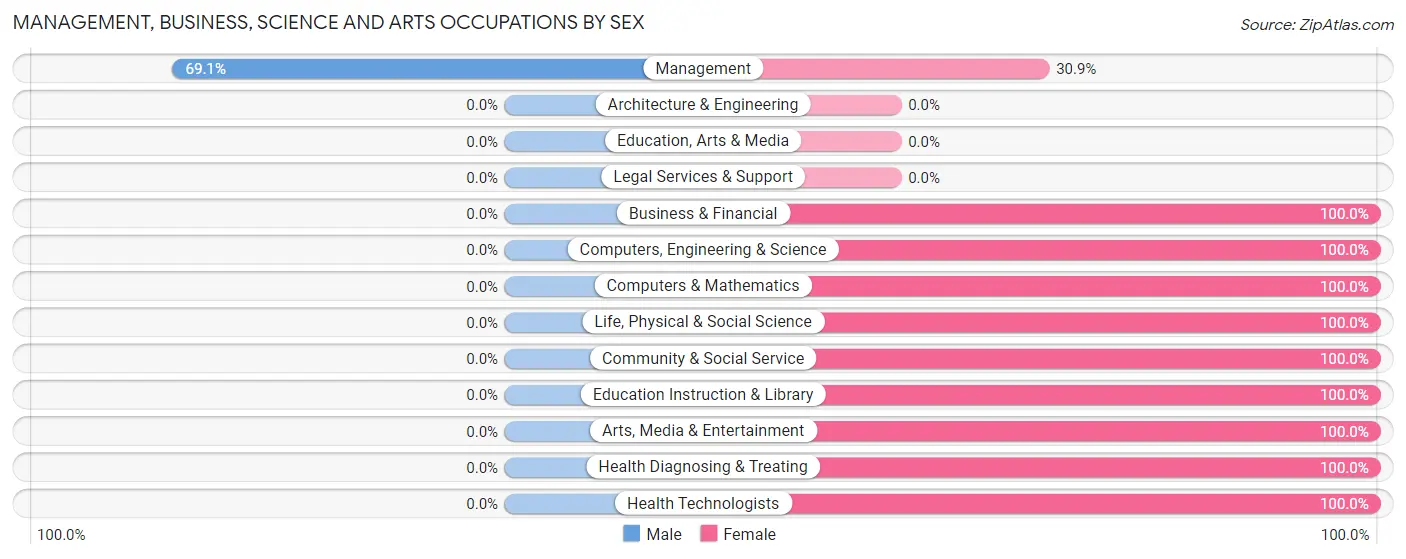
Management, Business, Science and Arts Occupations by Sex
| Occupation | Male | Female |
| Management | 235 (69.1%) | 105 (30.9%) |
| Business & Financial | 0 (0.0%) | 6 (100.0%) |
| Computers, Engineering & Science | 0 (0.0%) | 29 (100.0%) |
| Computers & Mathematics | 0 (0.0%) | 17 (100.0%) |
| Architecture & Engineering | 0 (0.0%) | 0 (0.0%) |
| Life, Physical & Social Science | 0 (0.0%) | 12 (100.0%) |
| Community & Social Service | 0 (0.0%) | 68 (100.0%) |
| Education, Arts & Media | 0 (0.0%) | 0 (0.0%) |
| Legal Services & Support | 0 (0.0%) | 0 (0.0%) |
| Education Instruction & Library | 0 (0.0%) | 25 (100.0%) |
| Arts, Media & Entertainment | 0 (0.0%) | 43 (100.0%) |
| Health Diagnosing & Treating | 0 (0.0%) | 67 (100.0%) |
| Health Technologists | 0 (0.0%) | 28 (100.0%) |
| Total (Category) | 235 (46.1%) | 275 (53.9%) |
| Total (Overall) | 1,098 (44.6%) | 1,362 (55.4%) |
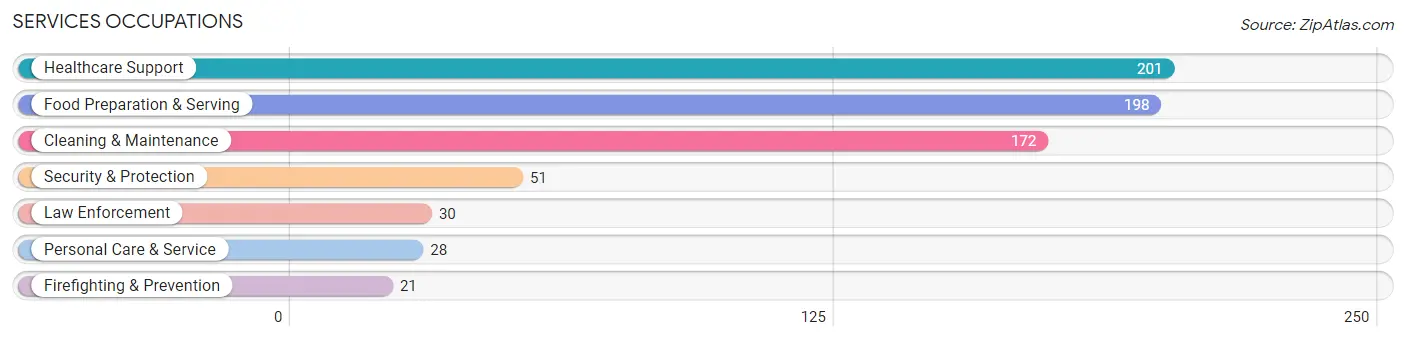
Services Occupations
The most common Services occupations in River Rouge are Healthcare Support (201 | 8.2%), Food Preparation & Serving (198 | 8.1%), Cleaning & Maintenance (172 | 7.0%), Security & Protection (51 | 2.1%), and Law Enforcement (30 | 1.2%).
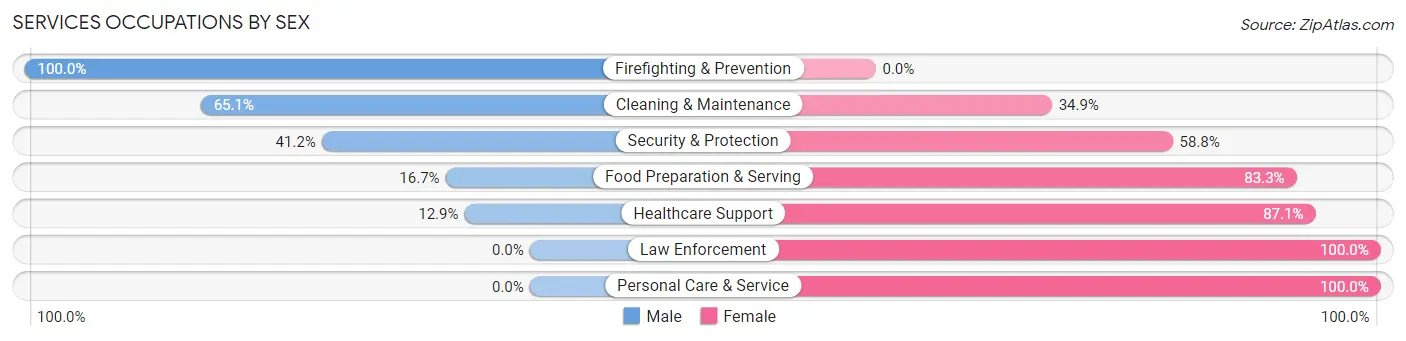
Services Occupations by Sex
Within the Services occupations in River Rouge, the most male-oriented occupations are Firefighting & Prevention (100.0%), Cleaning & Maintenance (65.1%), and Security & Protection (41.2%), while the most female-oriented occupations are Law Enforcement (100.0%), Personal Care & Service (100.0%), and Healthcare Support (87.1%).
| Occupation | Male | Female |
| Healthcare Support | 26 (12.9%) | 175 (87.1%) |
| Security & Protection | 21 (41.2%) | 30 (58.8%) |
| Firefighting & Prevention | 21 (100.0%) | 0 (0.0%) |
| Law Enforcement | 0 (0.0%) | 30 (100.0%) |
| Food Preparation & Serving | 33 (16.7%) | 165 (83.3%) |
| Cleaning & Maintenance | 112 (65.1%) | 60 (34.9%) |
| Personal Care & Service | 0 (0.0%) | 28 (100.0%) |
| Total (Category) | 192 (29.5%) | 458 (70.5%) |
| Total (Overall) | 1,098 (44.6%) | 1,362 (55.4%) |
Sales and Office Occupations
The most common Sales and Office occupations in River Rouge are Office & Administration (274 | 11.1%), and Sales & Related (140 | 5.7%).

Sales and Office Occupations by Sex

| Occupation | Male | Female |
| Sales & Related | 19 (13.6%) | 121 (86.4%) |
| Office & Administration | 22 (8.0%) | 252 (92.0%) |
| Total (Category) | 41 (9.9%) | 373 (90.1%) |
| Total (Overall) | 1,098 (44.6%) | 1,362 (55.4%) |
Natural Resources, Construction and Maintenance Occupations
The most common Natural Resources, Construction and Maintenance occupations in River Rouge are Installation, Maintenance & Repair (112 | 4.5%), and Construction & Extraction (66 | 2.7%).
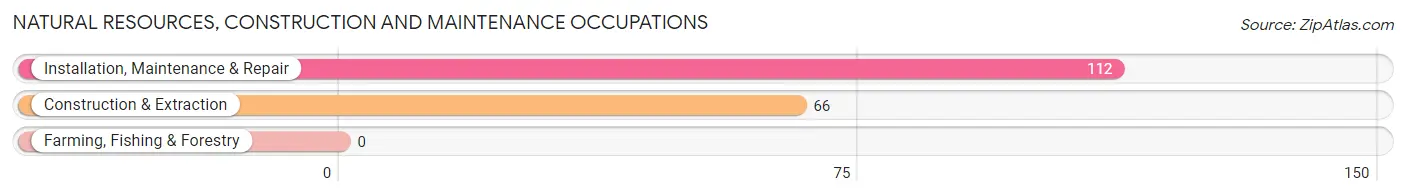
Natural Resources, Construction and Maintenance Occupations by Sex
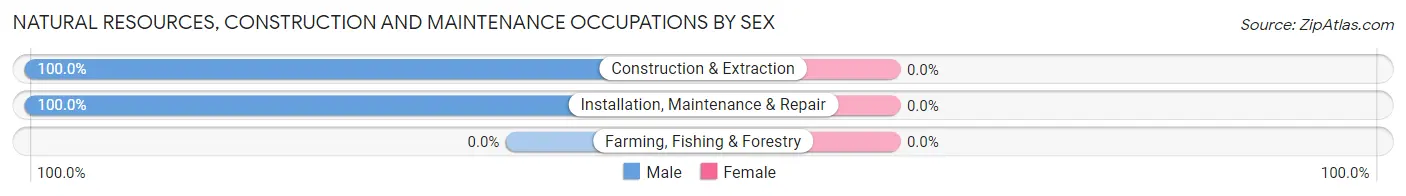
| Occupation | Male | Female |
| Farming, Fishing & Forestry | 0 (0.0%) | 0 (0.0%) |
| Construction & Extraction | 66 (100.0%) | 0 (0.0%) |
| Installation, Maintenance & Repair | 112 (100.0%) | 0 (0.0%) |
| Total (Category) | 178 (100.0%) | 0 (0.0%) |
| Total (Overall) | 1,098 (44.6%) | 1,362 (55.4%) |
Production, Transportation and Moving Occupations
The most common Production, Transportation and Moving occupations in River Rouge are Production (380 | 15.4%), Transportation (178 | 7.2%), and Material Moving (150 | 6.1%).
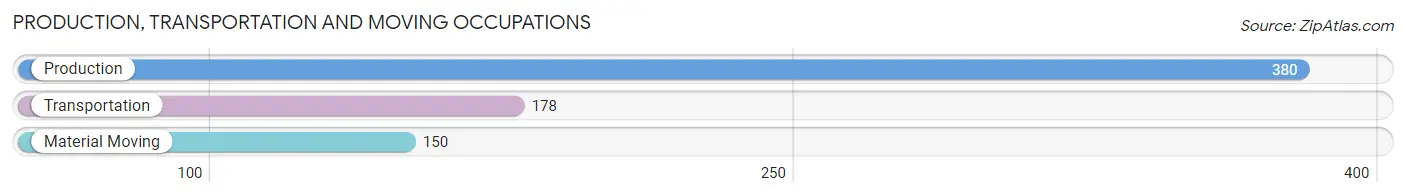
Production, Transportation and Moving Occupations by Sex
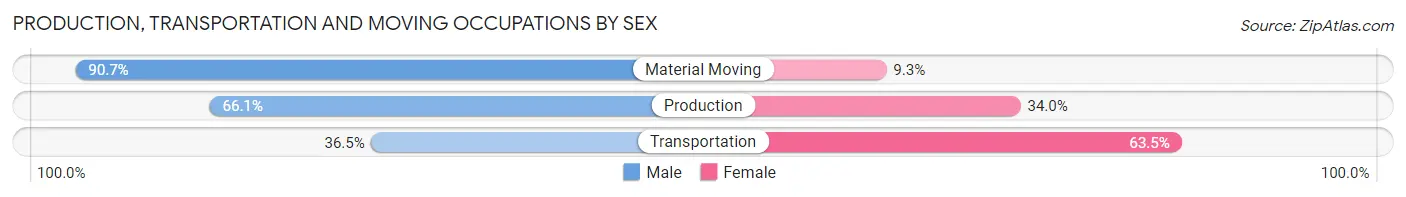
| Occupation | Male | Female |
| Production | 251 (66.0%) | 129 (34.0%) |
| Transportation | 65 (36.5%) | 113 (63.5%) |
| Material Moving | 136 (90.7%) | 14 (9.3%) |
| Total (Category) | 452 (63.8%) | 256 (36.2%) |
| Total (Overall) | 1,098 (44.6%) | 1,362 (55.4%) |
Employment Industries by Sex in River Rouge
Employment Industries in River Rouge
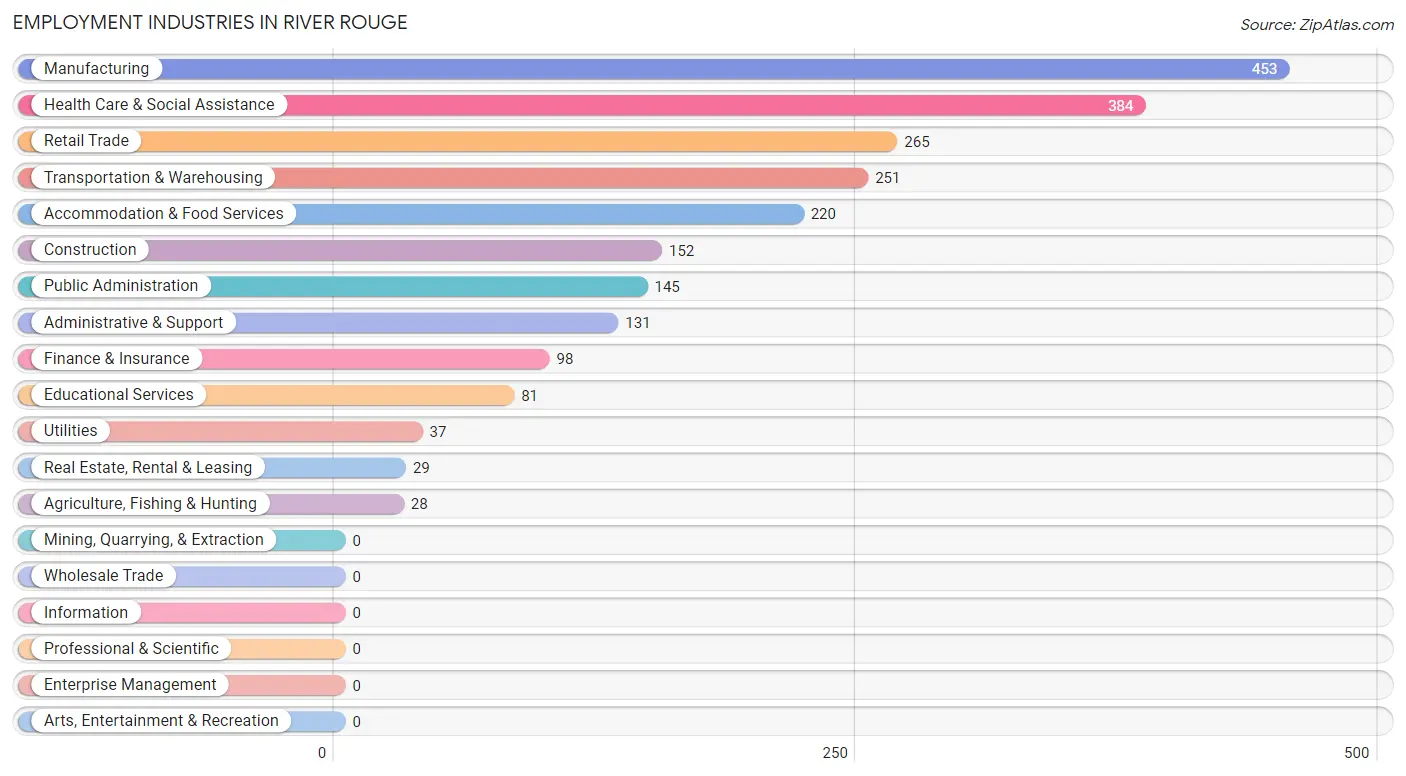
The major employment industries in River Rouge include Manufacturing (453 | 18.4%), Health Care & Social Assistance (384 | 15.6%), Retail Trade (265 | 10.8%), Transportation & Warehousing (251 | 10.2%), and Accommodation & Food Services (220 | 8.9%).
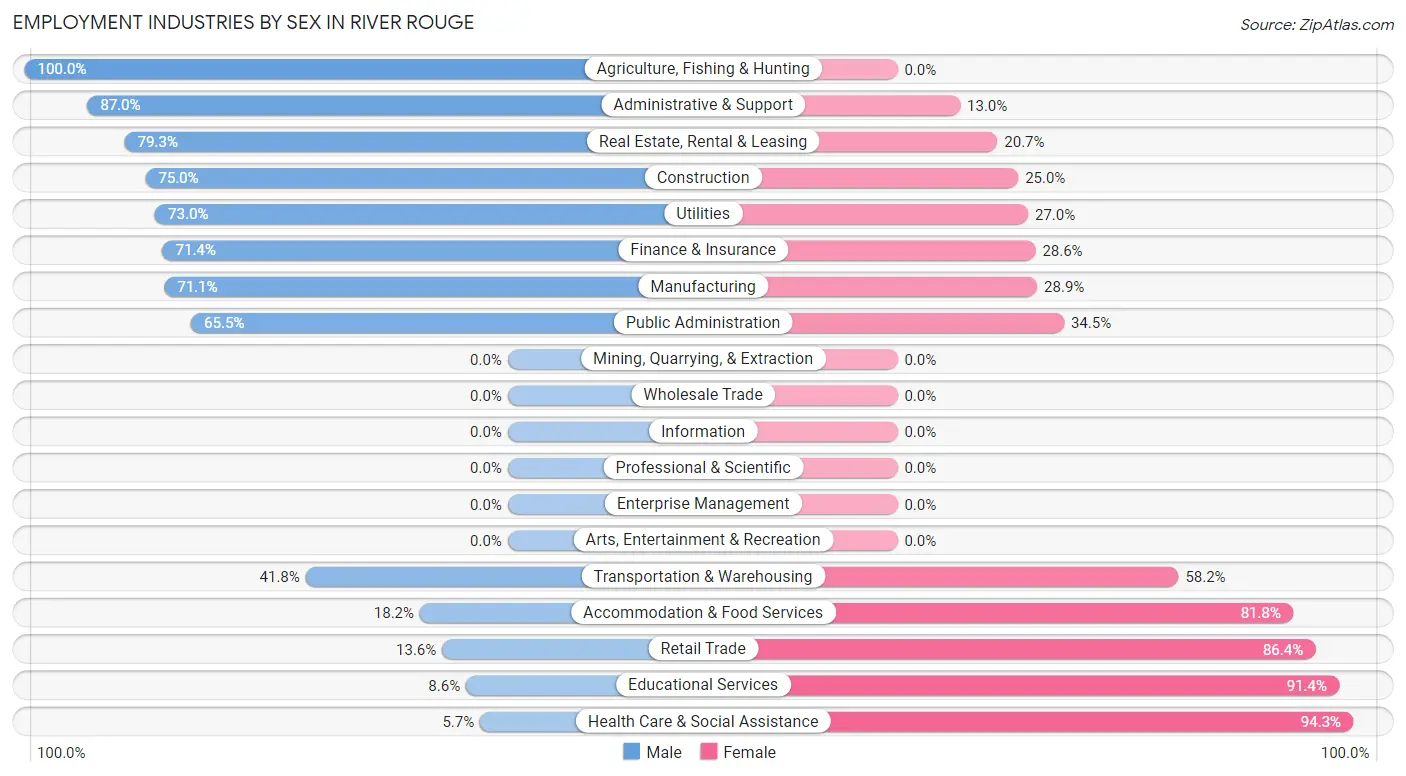
Employment Industries by Sex in River Rouge
The River Rouge industries that see more men than women are Agriculture, Fishing & Hunting (100.0%), Administrative & Support (87.0%), and Real Estate, Rental & Leasing (79.3%), whereas the industries that tend to have a higher number of women are Health Care & Social Assistance (94.3%), Educational Services (91.4%), and Retail Trade (86.4%).
| Industry | Male | Female |
| Agriculture, Fishing & Hunting | 28 (100.0%) | 0 (0.0%) |
| Mining, Quarrying, & Extraction | 0 (0.0%) | 0 (0.0%) |
| Construction | 114 (75.0%) | 38 (25.0%) |
| Manufacturing | 322 (71.1%) | 131 (28.9%) |
| Wholesale Trade | 0 (0.0%) | 0 (0.0%) |
| Retail Trade | 36 (13.6%) | 229 (86.4%) |
| Transportation & Warehousing | 105 (41.8%) | 146 (58.2%) |
| Utilities | 27 (73.0%) | 10 (27.0%) |
| Information | 0 (0.0%) | 0 (0.0%) |
| Finance & Insurance | 70 (71.4%) | 28 (28.6%) |
| Real Estate, Rental & Leasing | 23 (79.3%) | 6 (20.7%) |
| Professional & Scientific | 0 (0.0%) | 0 (0.0%) |
| Enterprise Management | 0 (0.0%) | 0 (0.0%) |
| Administrative & Support | 114 (87.0%) | 17 (13.0%) |
| Educational Services | 7 (8.6%) | 74 (91.4%) |
| Health Care & Social Assistance | 22 (5.7%) | 362 (94.3%) |
| Arts, Entertainment & Recreation | 0 (0.0%) | 0 (0.0%) |
| Accommodation & Food Services | 40 (18.2%) | 180 (81.8%) |
| Public Administration | 95 (65.5%) | 50 (34.5%) |
| Total | 1,098 (44.6%) | 1,362 (55.4%) |
Education in River Rouge
School Enrollment in River Rouge
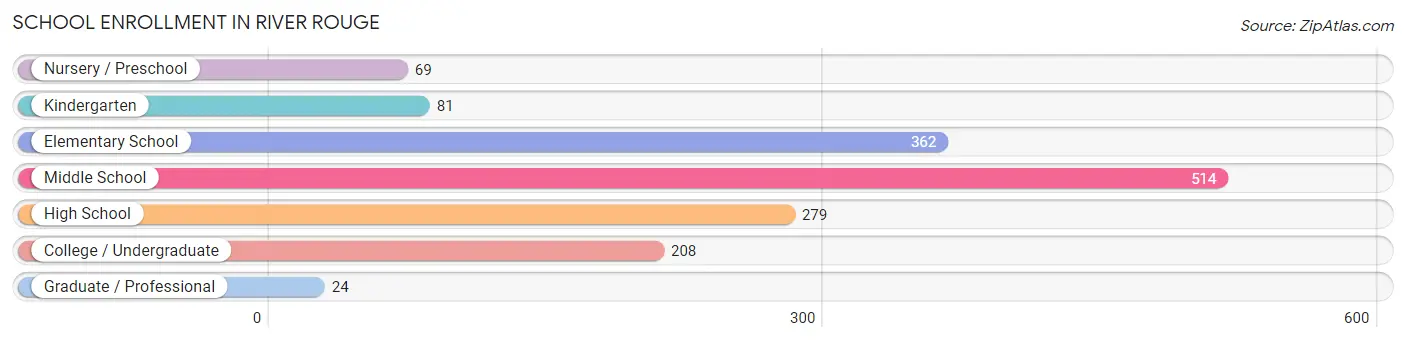
The most common levels of schooling among the 1,537 students in River Rouge are middle school (514 | 33.4%), elementary school (362 | 23.5%), and high school (279 | 18.1%).
| School Level | # Students | % Students |
| Nursery / Preschool | 69 | 4.5% |
| Kindergarten | 81 | 5.3% |
| Elementary School | 362 | 23.5% |
| Middle School | 514 | 33.4% |
| High School | 279 | 18.1% |
| College / Undergraduate | 208 | 13.5% |
| Graduate / Professional | 24 | 1.6% |
| Total | 1,537 | 100.0% |
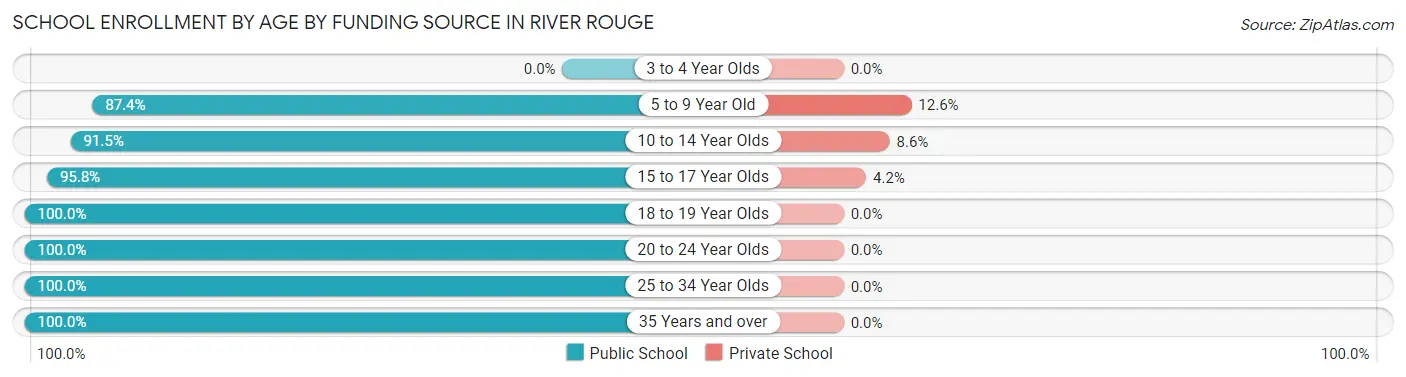
School Enrollment by Age by Funding Source in River Rouge
Out of a total of 1,537 students who are enrolled in schools in River Rouge, 120 (7.8%) attend a private institution, while the remaining 1,417 (92.2%) are enrolled in public schools. The age group of 5 to 9 year old has the highest likelihood of being enrolled in private schools, with 64 (12.6% in the age bracket) enrolled. Conversely, the age group of 18 to 19 year olds has the lowest likelihood of being enrolled in a private school, with 33 (100.0% in the age bracket) attending a public institution.
| Age Bracket | Public School | Private School |
| 3 to 4 Year Olds | 0 (0.0%) | 0 (0.0%) |
| 5 to 9 Year Old | 443 (87.4%) | 64 (12.6%) |
| 10 to 14 Year Olds | 535 (91.4%) | 50 (8.6%) |
| 15 to 17 Year Olds | 138 (95.8%) | 6 (4.2%) |
| 18 to 19 Year Olds | 33 (100.0%) | 0 (0.0%) |
| 20 to 24 Year Olds | 70 (100.0%) | 0 (0.0%) |
| 25 to 34 Year Olds | 70 (100.0%) | 0 (0.0%) |
| 35 Years and over | 128 (100.0%) | 0 (0.0%) |
| Total | 1,417 (92.2%) | 120 (7.8%) |
Educational Attainment by Field of Study in River Rouge
Business (114 | 28.1%), arts & humanities (90 | 22.2%), education (70 | 17.2%), social sciences (34 | 8.4%), and science & technology (26 | 6.4%) are the most common fields of study among 406 individuals in River Rouge who have obtained a bachelor's degree or higher.
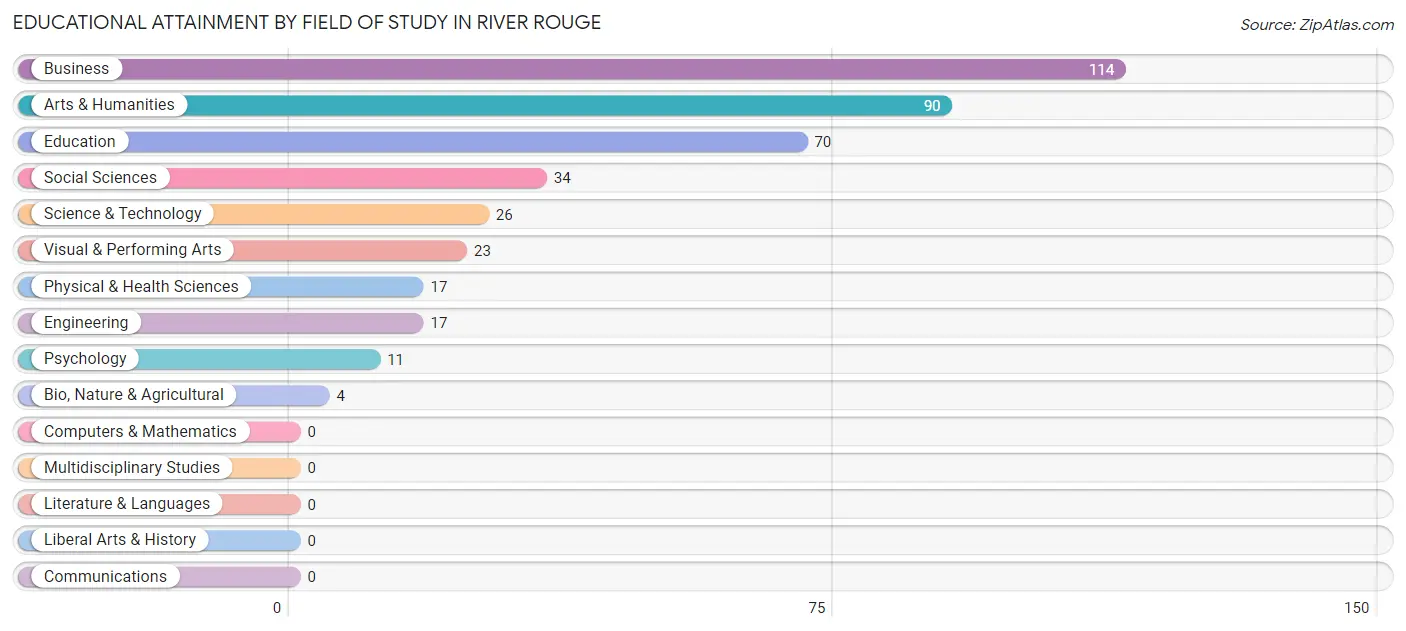
| Field of Study | # Graduates | % Graduates |
| Computers & Mathematics | 0 | 0.0% |
| Bio, Nature & Agricultural | 4 | 1.0% |
| Physical & Health Sciences | 17 | 4.2% |
| Psychology | 11 | 2.7% |
| Social Sciences | 34 | 8.4% |
| Engineering | 17 | 4.2% |
| Multidisciplinary Studies | 0 | 0.0% |
| Science & Technology | 26 | 6.4% |
| Business | 114 | 28.1% |
| Education | 70 | 17.2% |
| Literature & Languages | 0 | 0.0% |
| Liberal Arts & History | 0 | 0.0% |
| Visual & Performing Arts | 23 | 5.7% |
| Communications | 0 | 0.0% |
| Arts & Humanities | 90 | 22.2% |
| Total | 406 | 100.0% |
Transportation & Commute in River Rouge
Vehicle Availability by Sex in River Rouge
The most prevalent vehicle ownership categories in River Rouge are males with 2 vehicles (546, accounting for 49.7%) and females with 2 vehicles (596, making up 43.0%).
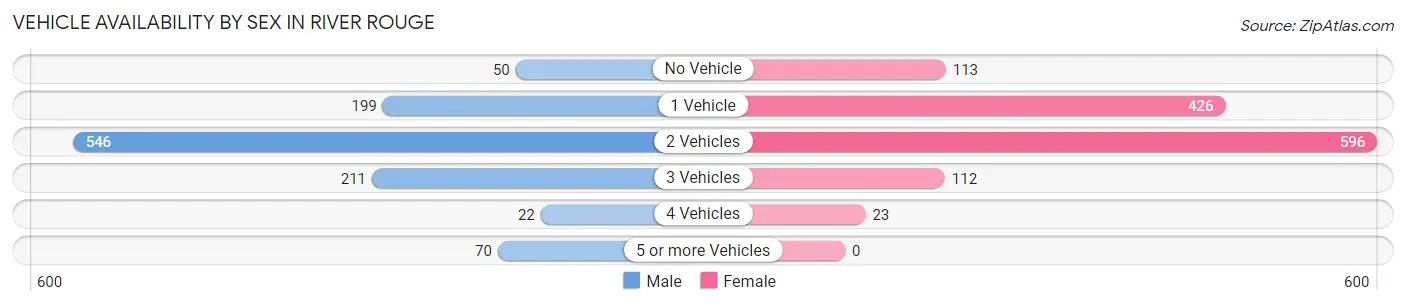
| Vehicles Available | Male | Female |
| No Vehicle | 50 (4.5%) | 113 (8.9%) |
| 1 Vehicle | 199 (18.1%) | 426 (33.5%) |
| 2 Vehicles | 546 (49.7%) | 596 (46.9%) |
| 3 Vehicles | 211 (19.2%) | 112 (8.8%) |
| 4 Vehicles | 22 (2.0%) | 23 (1.8%) |
| 5 or more Vehicles | 70 (6.4%) | 0 (0.0%) |
| Total | 1,098 (100.0%) | 1,270 (100.0%) |
Commute Time in River Rouge
The most frequently occuring commute durations in River Rouge are 15 to 19 minutes (663 commuters, 29.9%), 20 to 24 minutes (465 commuters, 20.9%), and 30 to 34 minutes (362 commuters, 16.3%).
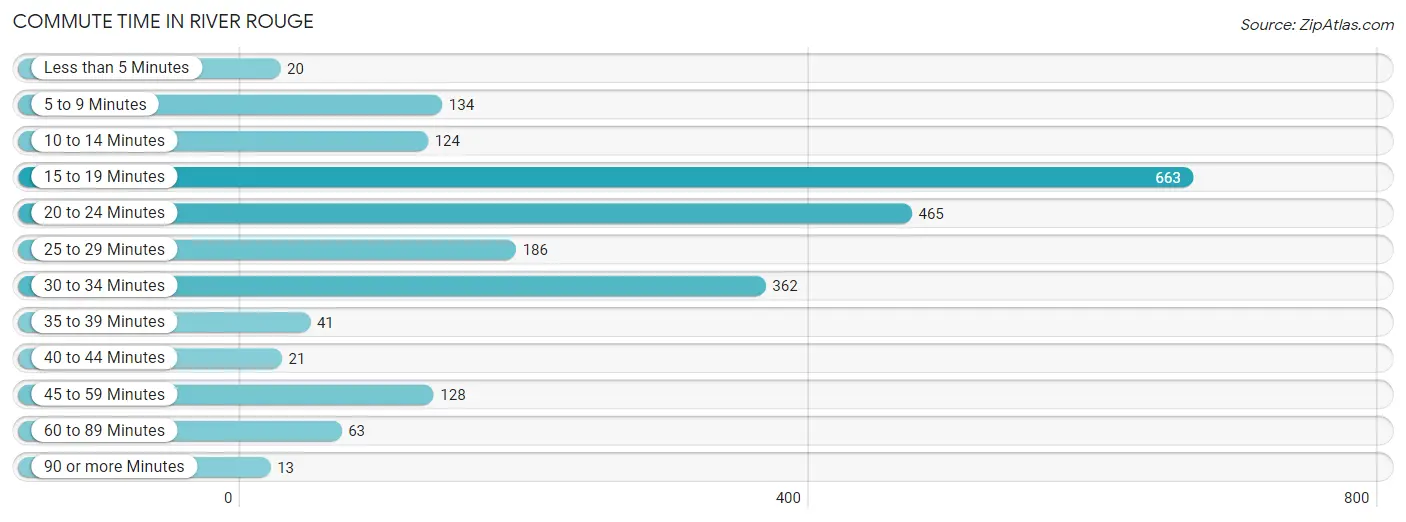
| Commute Time | # Commuters | % Commuters |
| Less than 5 Minutes | 20 | 0.9% |
| 5 to 9 Minutes | 134 | 6.0% |
| 10 to 14 Minutes | 124 | 5.6% |
| 15 to 19 Minutes | 663 | 29.9% |
| 20 to 24 Minutes | 465 | 20.9% |
| 25 to 29 Minutes | 186 | 8.4% |
| 30 to 34 Minutes | 362 | 16.3% |
| 35 to 39 Minutes | 41 | 1.8% |
| 40 to 44 Minutes | 21 | 0.9% |
| 45 to 59 Minutes | 128 | 5.8% |
| 60 to 89 Minutes | 63 | 2.8% |
| 90 or more Minutes | 13 | 0.6% |
Commute Time by Sex in River Rouge
The most common commute times in River Rouge are 20 to 24 minutes (293 commuters, 27.8%) for males and 15 to 19 minutes (408 commuters, 35.0%) for females.
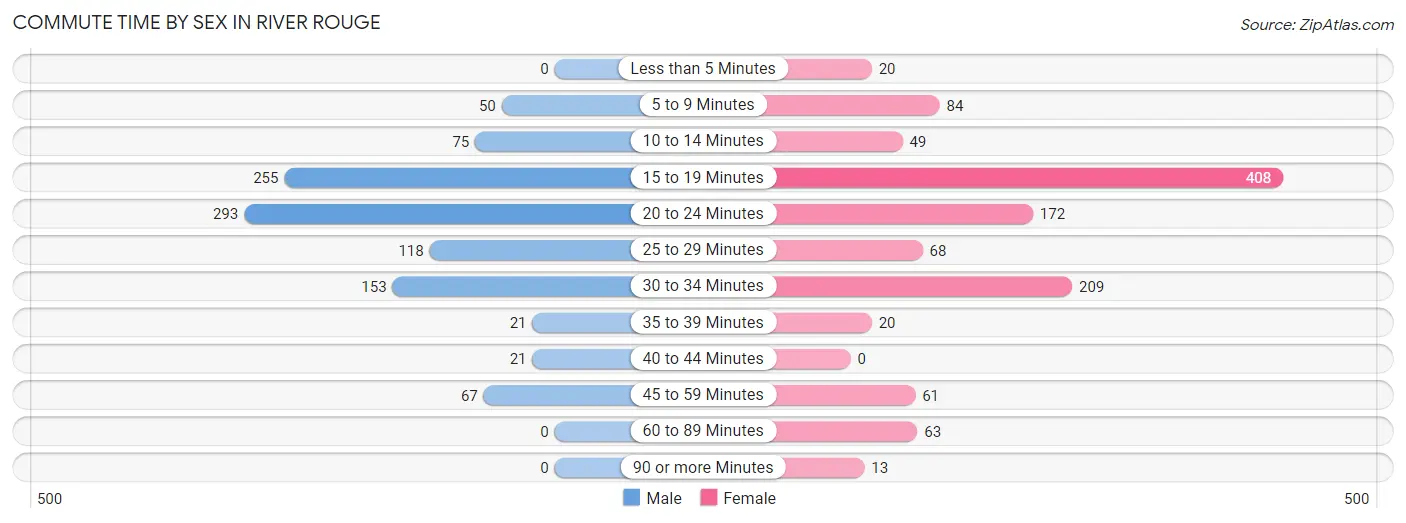
| Commute Time | Male | Female |
| Less than 5 Minutes | 0 (0.0%) | 20 (1.7%) |
| 5 to 9 Minutes | 50 (4.8%) | 84 (7.2%) |
| 10 to 14 Minutes | 75 (7.1%) | 49 (4.2%) |
| 15 to 19 Minutes | 255 (24.2%) | 408 (35.0%) |
| 20 to 24 Minutes | 293 (27.8%) | 172 (14.7%) |
| 25 to 29 Minutes | 118 (11.2%) | 68 (5.8%) |
| 30 to 34 Minutes | 153 (14.5%) | 209 (17.9%) |
| 35 to 39 Minutes | 21 (2.0%) | 20 (1.7%) |
| 40 to 44 Minutes | 21 (2.0%) | 0 (0.0%) |
| 45 to 59 Minutes | 67 (6.4%) | 61 (5.2%) |
| 60 to 89 Minutes | 0 (0.0%) | 63 (5.4%) |
| 90 or more Minutes | 0 (0.0%) | 13 (1.1%) |
Time of Departure to Work by Sex in River Rouge
The most frequent times of departure to work in River Rouge are 12:00 PM to 3:59 PM (153, 14.5%) for males and 9:00 AM to 9:59 AM (207, 17.7%) for females.
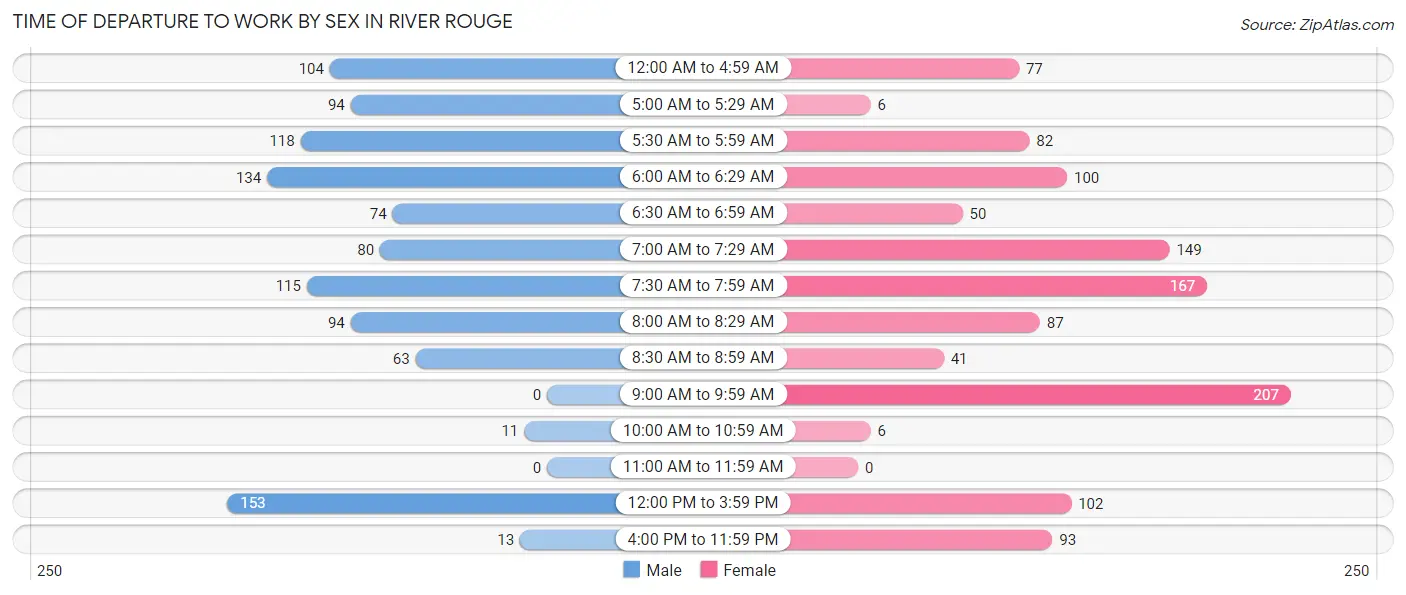
| Time of Departure | Male | Female |
| 12:00 AM to 4:59 AM | 104 (9.9%) | 77 (6.6%) |
| 5:00 AM to 5:29 AM | 94 (8.9%) | 6 (0.5%) |
| 5:30 AM to 5:59 AM | 118 (11.2%) | 82 (7.0%) |
| 6:00 AM to 6:29 AM | 134 (12.7%) | 100 (8.6%) |
| 6:30 AM to 6:59 AM | 74 (7.0%) | 50 (4.3%) |
| 7:00 AM to 7:29 AM | 80 (7.6%) | 149 (12.8%) |
| 7:30 AM to 7:59 AM | 115 (10.9%) | 167 (14.3%) |
| 8:00 AM to 8:29 AM | 94 (8.9%) | 87 (7.5%) |
| 8:30 AM to 8:59 AM | 63 (6.0%) | 41 (3.5%) |
| 9:00 AM to 9:59 AM | 0 (0.0%) | 207 (17.7%) |
| 10:00 AM to 10:59 AM | 11 (1.0%) | 6 (0.5%) |
| 11:00 AM to 11:59 AM | 0 (0.0%) | 0 (0.0%) |
| 12:00 PM to 3:59 PM | 153 (14.5%) | 102 (8.7%) |
| 4:00 PM to 11:59 PM | 13 (1.2%) | 93 (8.0%) |
| Total | 1,053 (100.0%) | 1,167 (100.0%) |
Housing Occupancy in River Rouge
Occupancy by Ownership in River Rouge
Of the total 2,900 dwellings in River Rouge, owner-occupied units account for 1,464 (50.5%), while renter-occupied units make up 1,436 (49.5%).
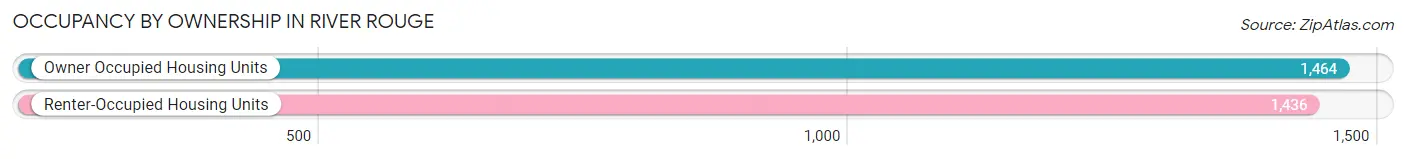
| Occupancy | # Housing Units | % Housing Units |
| Owner Occupied Housing Units | 1,464 | 50.5% |
| Renter-Occupied Housing Units | 1,436 | 49.5% |
| Total Occupied Housing Units | 2,900 | 100.0% |
Occupancy by Household Size in River Rouge
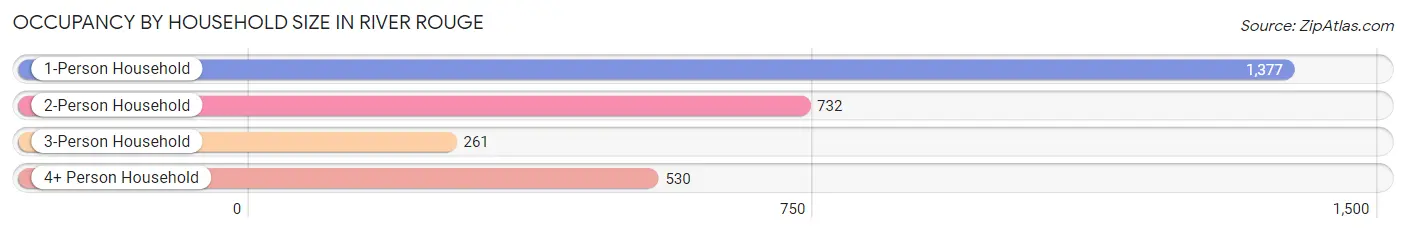
| Household Size | # Housing Units | % Housing Units |
| 1-Person Household | 1,377 | 47.5% |
| 2-Person Household | 732 | 25.2% |
| 3-Person Household | 261 | 9.0% |
| 4+ Person Household | 530 | 18.3% |
| Total Housing Units | 2,900 | 100.0% |
Occupancy by Ownership by Household Size in River Rouge
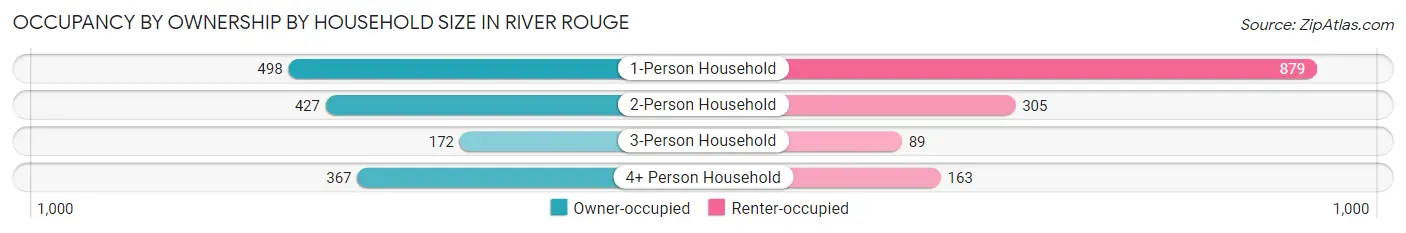
| Household Size | Owner-occupied | Renter-occupied |
| 1-Person Household | 498 (36.2%) | 879 (63.8%) |
| 2-Person Household | 427 (58.3%) | 305 (41.7%) |
| 3-Person Household | 172 (65.9%) | 89 (34.1%) |
| 4+ Person Household | 367 (69.3%) | 163 (30.7%) |
| Total Housing Units | 1,464 (50.5%) | 1,436 (49.5%) |
Occupancy by Educational Attainment in River Rouge
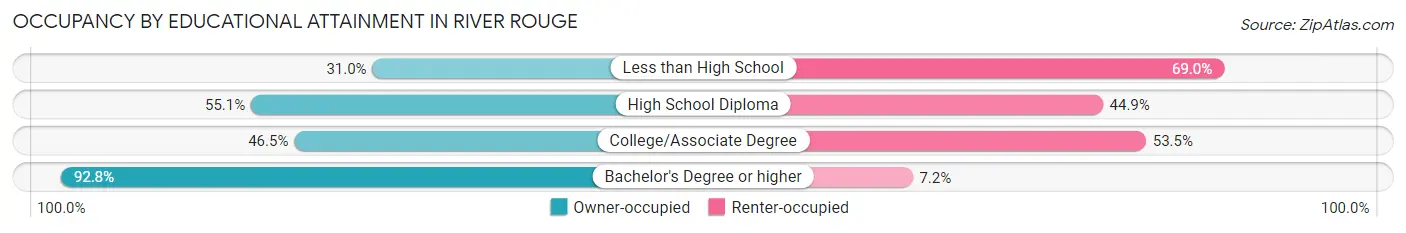
| Household Size | Owner-occupied | Renter-occupied |
| Less than High School | 171 (31.0%) | 380 (69.0%) |
| High School Diploma | 583 (55.1%) | 475 (44.9%) |
| College/Associate Degree | 491 (46.5%) | 564 (53.5%) |
| Bachelor's Degree or higher | 219 (92.8%) | 17 (7.2%) |
Occupancy by Age of Householder in River Rouge
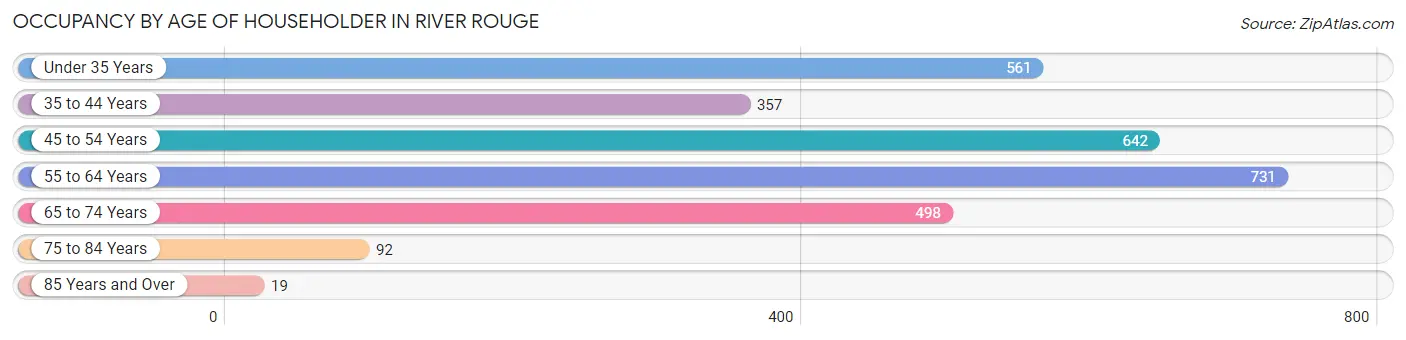
| Age Bracket | # Households | % Households |
| Under 35 Years | 561 | 19.3% |
| 35 to 44 Years | 357 | 12.3% |
| 45 to 54 Years | 642 | 22.1% |
| 55 to 64 Years | 731 | 25.2% |
| 65 to 74 Years | 498 | 17.2% |
| 75 to 84 Years | 92 | 3.2% |
| 85 Years and Over | 19 | 0.7% |
| Total | 2,900 | 100.0% |
Housing Finances in River Rouge
Median Income by Occupancy in River Rouge
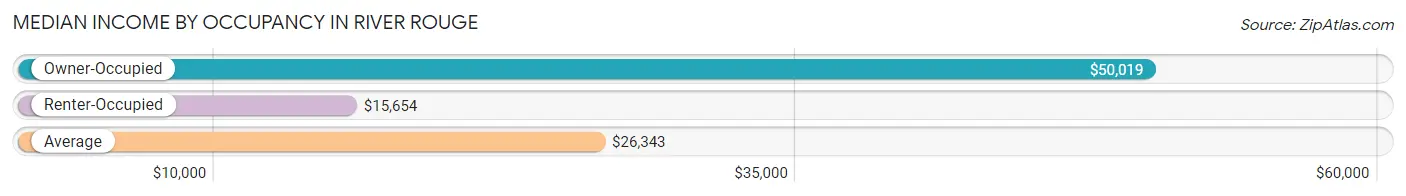
| Occupancy Type | # Households | Median Income |
| Owner-Occupied | 1,464 (50.5%) | $50,019 |
| Renter-Occupied | 1,436 (49.5%) | $15,654 |
| Average | 2,900 (100.0%) | $26,343 |
Occupancy by Householder Income Bracket in River Rouge
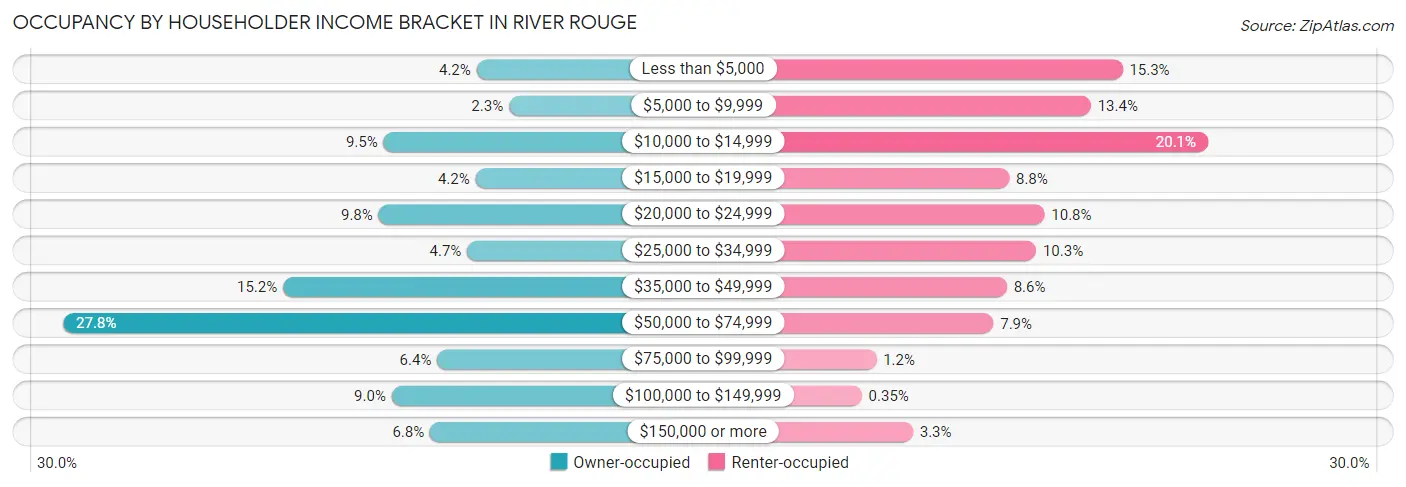
| Income Bracket | Owner-occupied | Renter-occupied |
| Less than $5,000 | 61 (4.2%) | 219 (15.2%) |
| $5,000 to $9,999 | 34 (2.3%) | 193 (13.4%) |
| $10,000 to $14,999 | 139 (9.5%) | 289 (20.1%) |
| $15,000 to $19,999 | 62 (4.2%) | 126 (8.8%) |
| $20,000 to $24,999 | 143 (9.8%) | 155 (10.8%) |
| $25,000 to $34,999 | 69 (4.7%) | 148 (10.3%) |
| $35,000 to $49,999 | 223 (15.2%) | 124 (8.6%) |
| $50,000 to $74,999 | 407 (27.8%) | 113 (7.9%) |
| $75,000 to $99,999 | 94 (6.4%) | 17 (1.2%) |
| $100,000 to $149,999 | 132 (9.0%) | 5 (0.4%) |
| $150,000 or more | 100 (6.8%) | 47 (3.3%) |
| Total | 1,464 (100.0%) | 1,436 (100.0%) |
Monthly Housing Cost Tiers in River Rouge
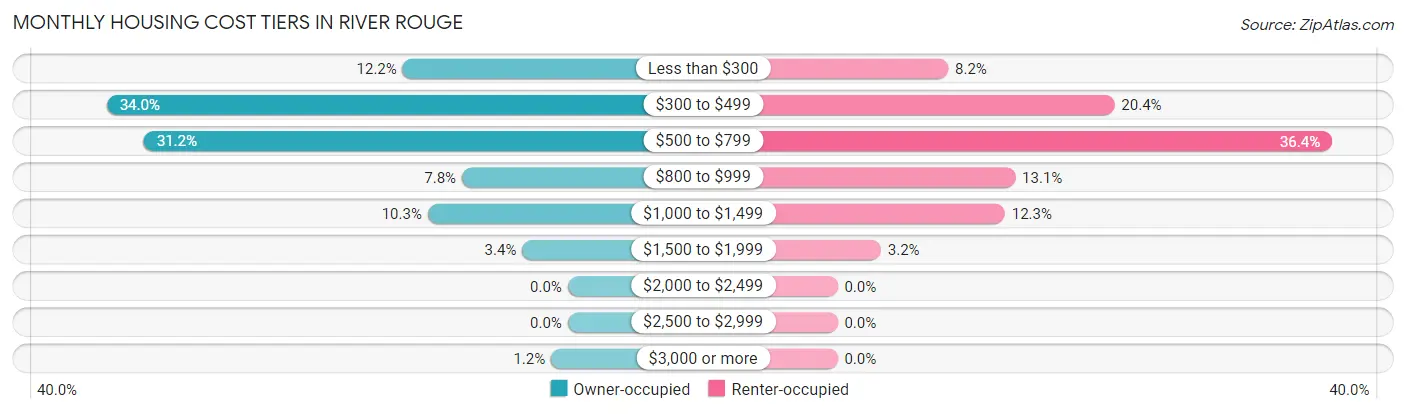
| Monthly Cost | Owner-occupied | Renter-occupied |
| Less than $300 | 178 (12.2%) | 117 (8.2%) |
| $300 to $499 | 497 (34.0%) | 293 (20.4%) |
| $500 to $799 | 457 (31.2%) | 523 (36.4%) |
| $800 to $999 | 114 (7.8%) | 188 (13.1%) |
| $1,000 to $1,499 | 151 (10.3%) | 177 (12.3%) |
| $1,500 to $1,999 | 49 (3.4%) | 46 (3.2%) |
| $2,000 to $2,499 | 0 (0.0%) | 0 (0.0%) |
| $2,500 to $2,999 | 0 (0.0%) | 0 (0.0%) |
| $3,000 or more | 18 (1.2%) | 0 (0.0%) |
| Total | 1,464 (100.0%) | 1,436 (100.0%) |
Physical Housing Characteristics in River Rouge
Housing Structures in River Rouge
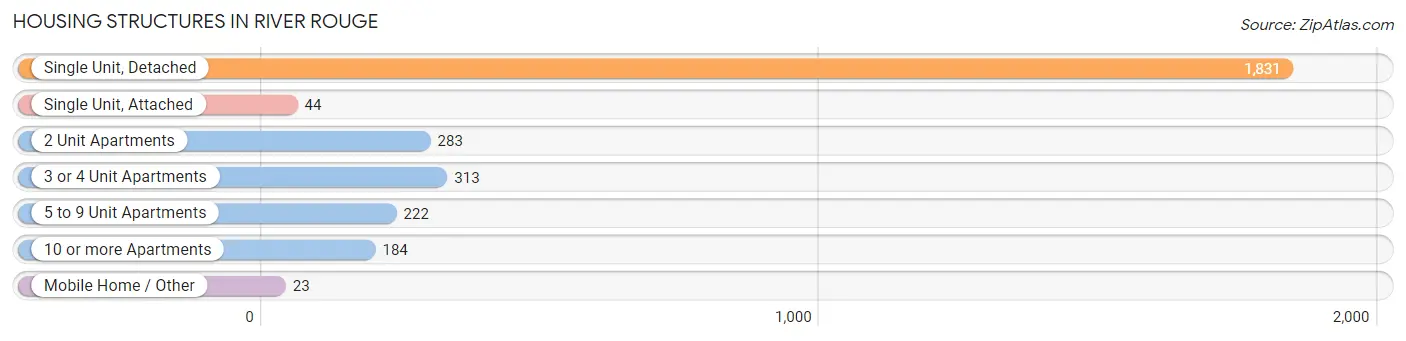
| Structure Type | # Housing Units | % Housing Units |
| Single Unit, Detached | 1,831 | 63.1% |
| Single Unit, Attached | 44 | 1.5% |
| 2 Unit Apartments | 283 | 9.8% |
| 3 or 4 Unit Apartments | 313 | 10.8% |
| 5 to 9 Unit Apartments | 222 | 7.7% |
| 10 or more Apartments | 184 | 6.3% |
| Mobile Home / Other | 23 | 0.8% |
| Total | 2,900 | 100.0% |
Housing Structures by Occupancy in River Rouge
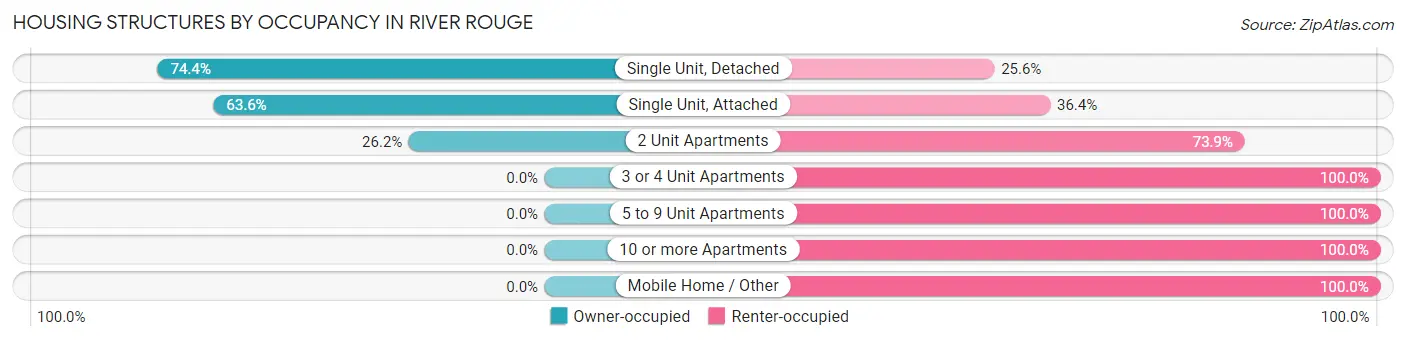
| Structure Type | Owner-occupied | Renter-occupied |
| Single Unit, Detached | 1,362 (74.4%) | 469 (25.6%) |
| Single Unit, Attached | 28 (63.6%) | 16 (36.4%) |
| 2 Unit Apartments | 74 (26.2%) | 209 (73.9%) |
| 3 or 4 Unit Apartments | 0 (0.0%) | 313 (100.0%) |
| 5 to 9 Unit Apartments | 0 (0.0%) | 222 (100.0%) |
| 10 or more Apartments | 0 (0.0%) | 184 (100.0%) |
| Mobile Home / Other | 0 (0.0%) | 23 (100.0%) |
| Total | 1,464 (50.5%) | 1,436 (49.5%) |
Housing Structures by Number of Rooms in River Rouge
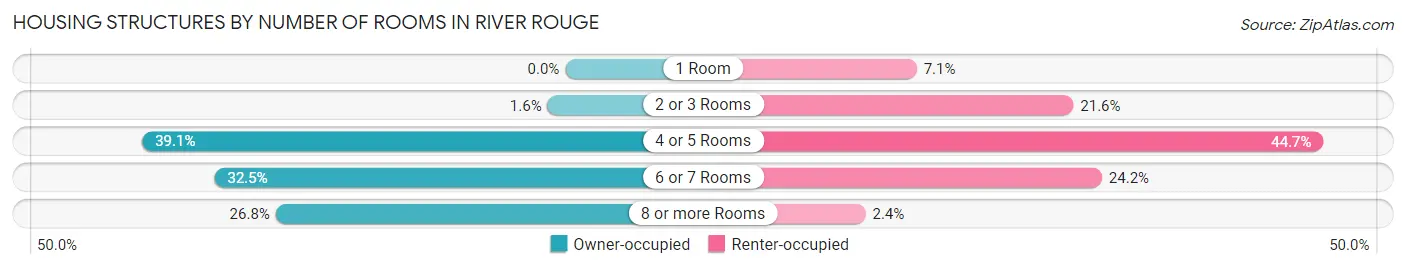
| Number of Rooms | Owner-occupied | Renter-occupied |
| 1 Room | 0 (0.0%) | 102 (7.1%) |
| 2 or 3 Rooms | 24 (1.6%) | 310 (21.6%) |
| 4 or 5 Rooms | 573 (39.1%) | 642 (44.7%) |
| 6 or 7 Rooms | 475 (32.5%) | 348 (24.2%) |
| 8 or more Rooms | 392 (26.8%) | 34 (2.4%) |
| Total | 1,464 (100.0%) | 1,436 (100.0%) |
Housing Structure by Heating Type in River Rouge
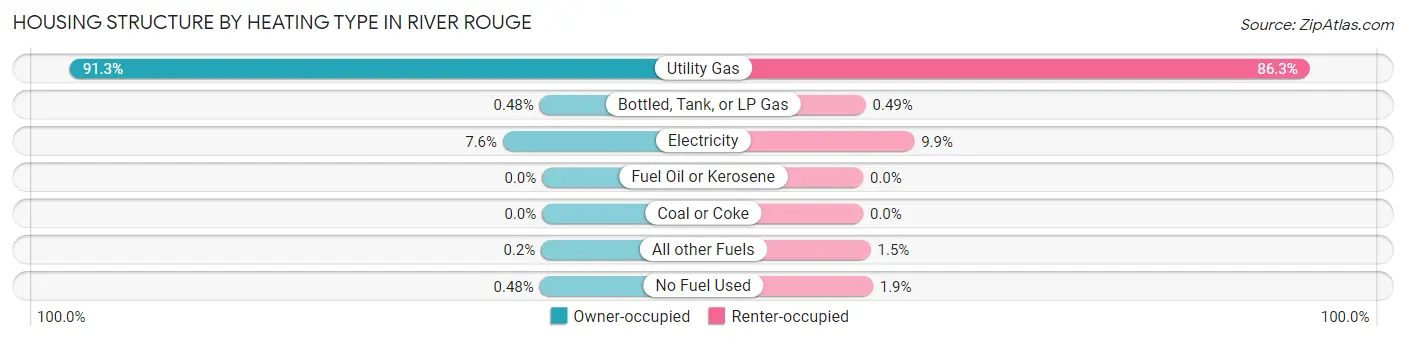
| Heating Type | Owner-occupied | Renter-occupied |
| Utility Gas | 1,336 (91.3%) | 1,239 (86.3%) |
| Bottled, Tank, or LP Gas | 7 (0.5%) | 7 (0.5%) |
| Electricity | 111 (7.6%) | 142 (9.9%) |
| Fuel Oil or Kerosene | 0 (0.0%) | 0 (0.0%) |
| Coal or Coke | 0 (0.0%) | 0 (0.0%) |
| All other Fuels | 3 (0.2%) | 21 (1.5%) |
| No Fuel Used | 7 (0.5%) | 27 (1.9%) |
| Total | 1,464 (100.0%) | 1,436 (100.0%) |
Household Vehicle Usage in River Rouge
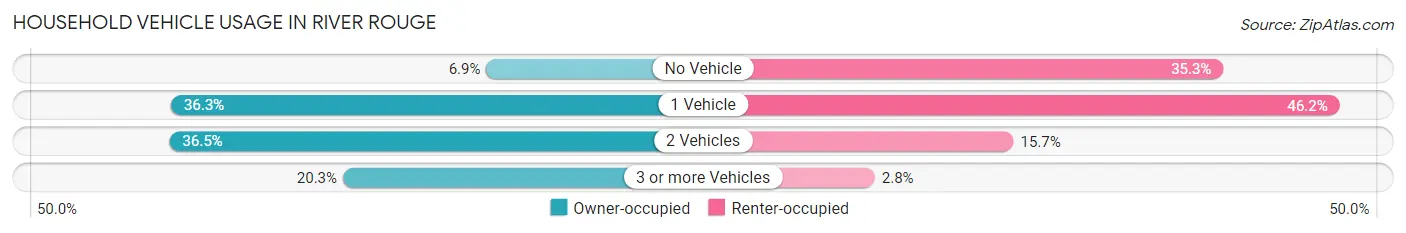
| Vehicles per Household | Owner-occupied | Renter-occupied |
| No Vehicle | 101 (6.9%) | 507 (35.3%) |
| 1 Vehicle | 532 (36.3%) | 663 (46.2%) |
| 2 Vehicles | 534 (36.5%) | 226 (15.7%) |
| 3 or more Vehicles | 297 (20.3%) | 40 (2.8%) |
| Total | 1,464 (100.0%) | 1,436 (100.0%) |
Real Estate & Mortgages in River Rouge
Real Estate and Mortgage Overview in River Rouge
| Characteristic | Without Mortgage | With Mortgage |
| Housing Units | 1,097 | 367 |
| Median Property Value | $44,600 | $78,600 |
| Median Household Income | $46,587 | $35 |
| Monthly Housing Costs | $448 | $18 |
| Real Estate Taxes | $1,394 | $30 |
Property Value by Mortgage Status in River Rouge
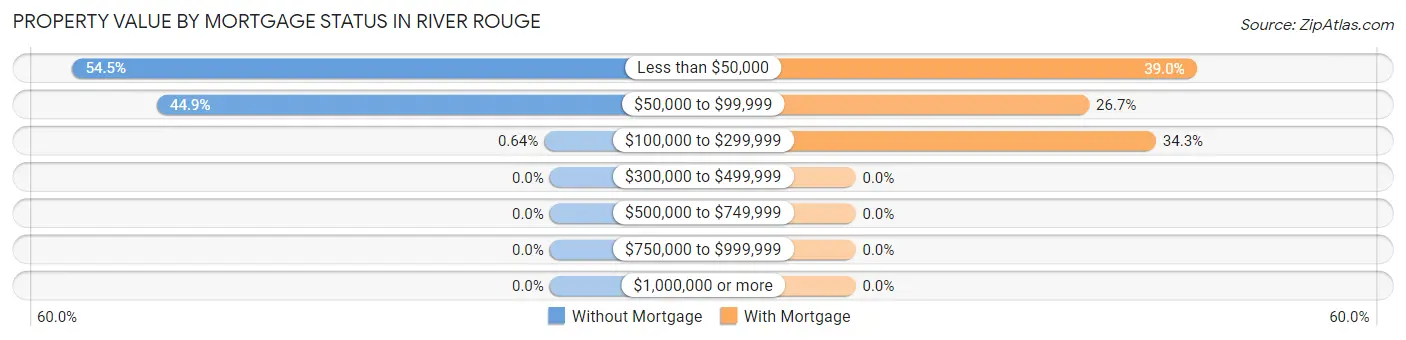
| Property Value | Without Mortgage | With Mortgage |
| Less than $50,000 | 598 (54.5%) | 143 (39.0%) |
| $50,000 to $99,999 | 492 (44.9%) | 98 (26.7%) |
| $100,000 to $299,999 | 7 (0.6%) | 126 (34.3%) |
| $300,000 to $499,999 | 0 (0.0%) | 0 (0.0%) |
| $500,000 to $749,999 | 0 (0.0%) | 0 (0.0%) |
| $750,000 to $999,999 | 0 (0.0%) | 0 (0.0%) |
| $1,000,000 or more | 0 (0.0%) | 0 (0.0%) |
| Total | 1,097 (100.0%) | 367 (100.0%) |
Household Income by Mortgage Status in River Rouge
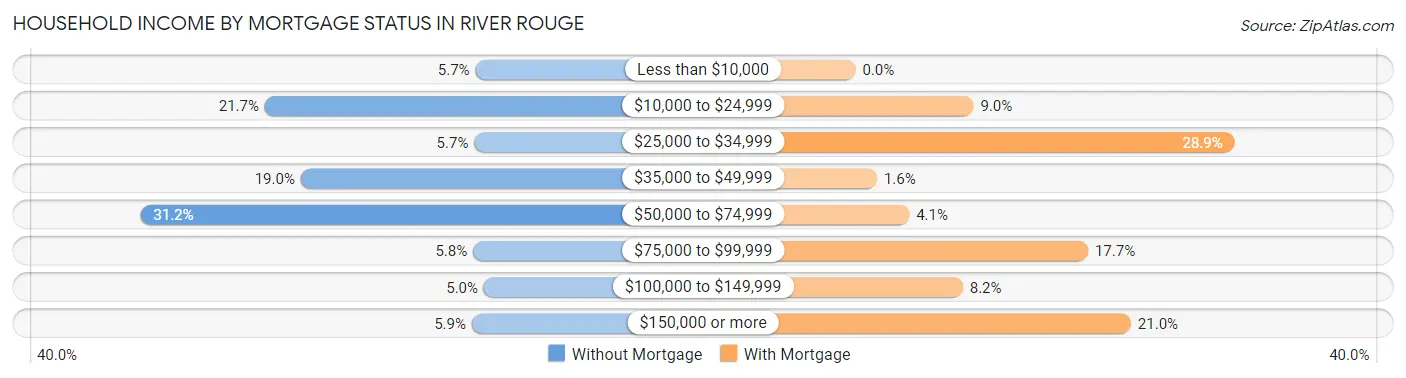
| Household Income | Without Mortgage | With Mortgage |
| Less than $10,000 | 62 (5.7%) | 0 (0.0%) |
| $10,000 to $24,999 | 238 (21.7%) | 33 (9.0%) |
| $25,000 to $34,999 | 63 (5.7%) | 106 (28.9%) |
| $35,000 to $49,999 | 208 (19.0%) | 6 (1.6%) |
| $50,000 to $74,999 | 342 (31.2%) | 15 (4.1%) |
| $75,000 to $99,999 | 64 (5.8%) | 65 (17.7%) |
| $100,000 to $149,999 | 55 (5.0%) | 30 (8.2%) |
| $150,000 or more | 65 (5.9%) | 77 (21.0%) |
| Total | 1,097 (100.0%) | 367 (100.0%) |
Property Value to Household Income Ratio in River Rouge
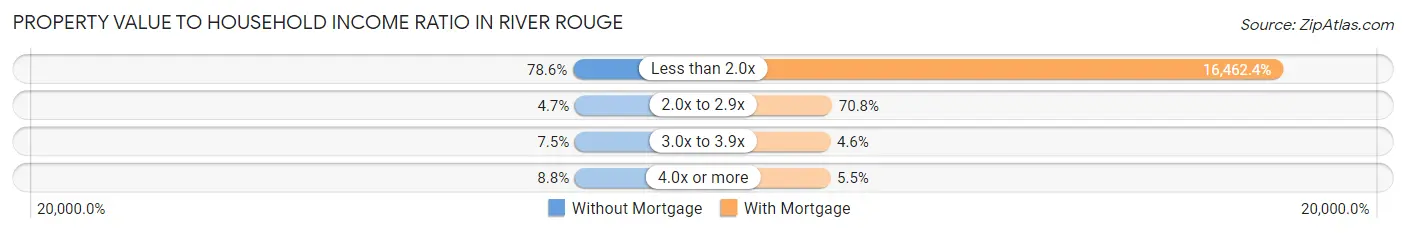
| Value-to-Income Ratio | Without Mortgage | With Mortgage |
| Less than 2.0x | 862 (78.6%) | 60,417 (16,462.4%) |
| 2.0x to 2.9x | 52 (4.7%) | 260 (70.8%) |
| 3.0x to 3.9x | 82 (7.5%) | 17 (4.6%) |
| 4.0x or more | 96 (8.7%) | 20 (5.4%) |
| Total | 1,097 (100.0%) | 367 (100.0%) |
Real Estate Taxes by Mortgage Status in River Rouge
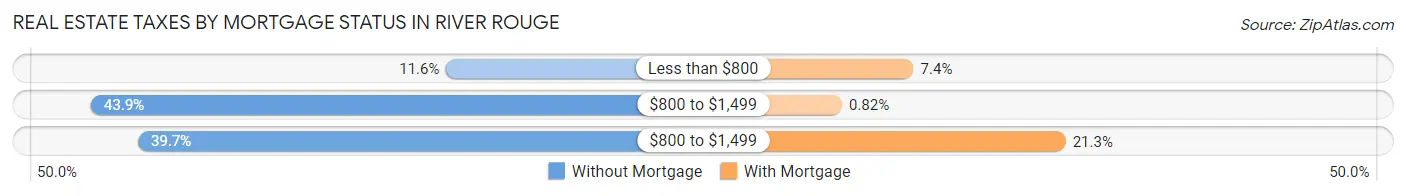
| Property Taxes | Without Mortgage | With Mortgage |
| Less than $800 | 127 (11.6%) | 27 (7.4%) |
| $800 to $1,499 | 482 (43.9%) | 3 (0.8%) |
| $800 to $1,499 | 435 (39.7%) | 78 (21.2%) |
| Total | 1,097 (100.0%) | 367 (100.0%) |
Health & Disability in River Rouge
Health Insurance Coverage by Age in River Rouge
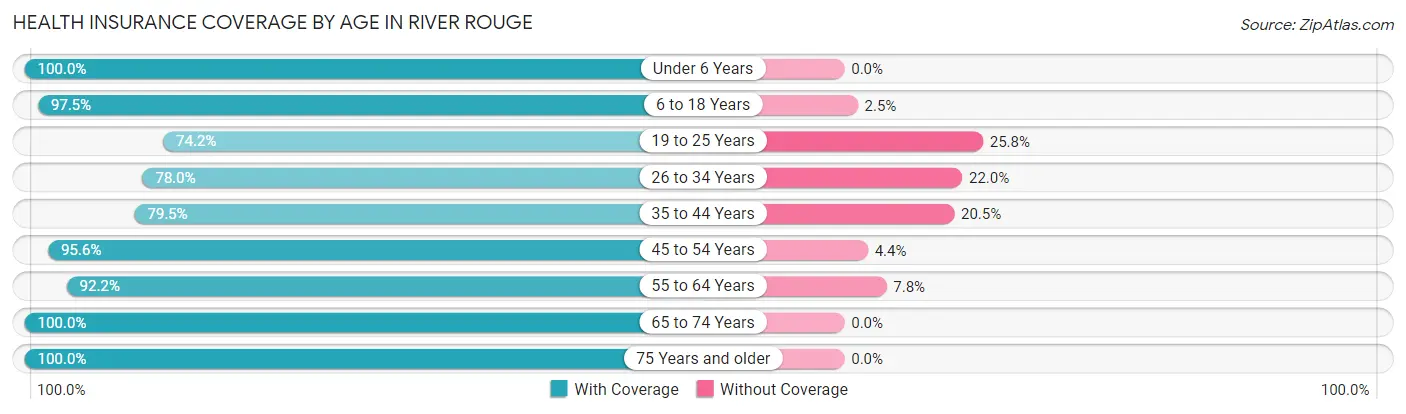
| Age Bracket | With Coverage | Without Coverage |
| Under 6 Years | 520 (100.0%) | 0 (0.0%) |
| 6 to 18 Years | 1,182 (97.5%) | 30 (2.5%) |
| 19 to 25 Years | 543 (74.2%) | 189 (25.8%) |
| 26 to 34 Years | 906 (78.0%) | 255 (22.0%) |
| 35 to 44 Years | 645 (79.5%) | 166 (20.5%) |
| 45 to 54 Years | 919 (95.6%) | 42 (4.4%) |
| 55 to 64 Years | 905 (92.2%) | 77 (7.8%) |
| 65 to 74 Years | 683 (100.0%) | 0 (0.0%) |
| 75 Years and older | 138 (100.0%) | 0 (0.0%) |
| Total | 6,441 (89.5%) | 759 (10.5%) |
Health Insurance Coverage by Citizenship Status in River Rouge
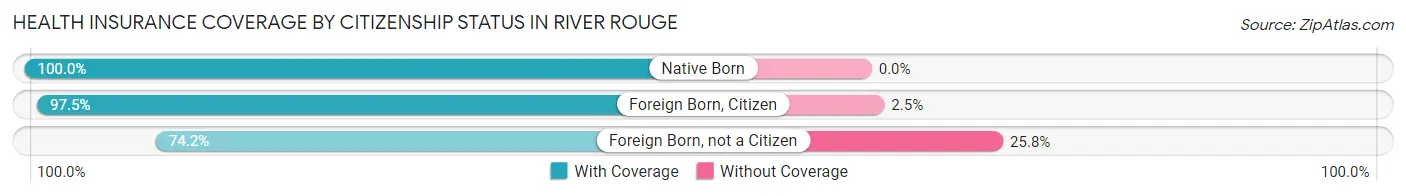
| Citizenship Status | With Coverage | Without Coverage |
| Native Born | 520 (100.0%) | 0 (0.0%) |
| Foreign Born, Citizen | 1,182 (97.5%) | 30 (2.5%) |
| Foreign Born, not a Citizen | 543 (74.2%) | 189 (25.8%) |
Health Insurance Coverage by Household Income in River Rouge
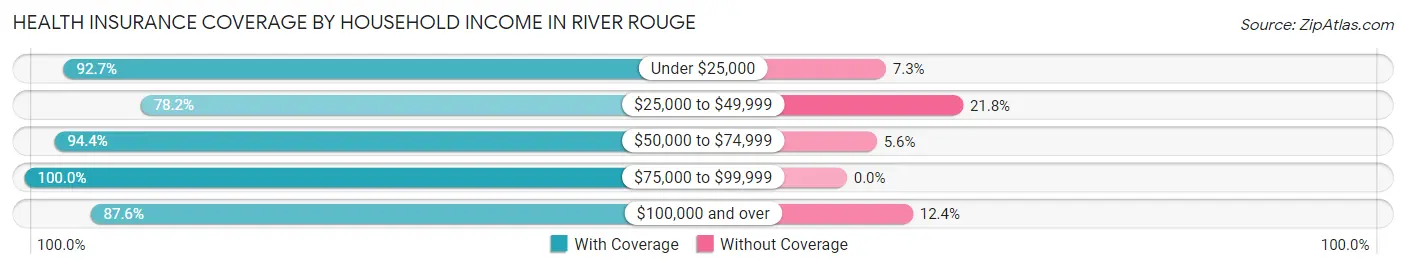
| Household Income | With Coverage | Without Coverage |
| Under $25,000 | 2,469 (92.7%) | 195 (7.3%) |
| $25,000 to $49,999 | 1,248 (78.2%) | 347 (21.8%) |
| $50,000 to $74,999 | 1,703 (94.4%) | 101 (5.6%) |
| $75,000 to $99,999 | 196 (100.0%) | 0 (0.0%) |
| $100,000 and over | 822 (87.6%) | 116 (12.4%) |
Public vs Private Health Insurance Coverage by Age in River Rouge
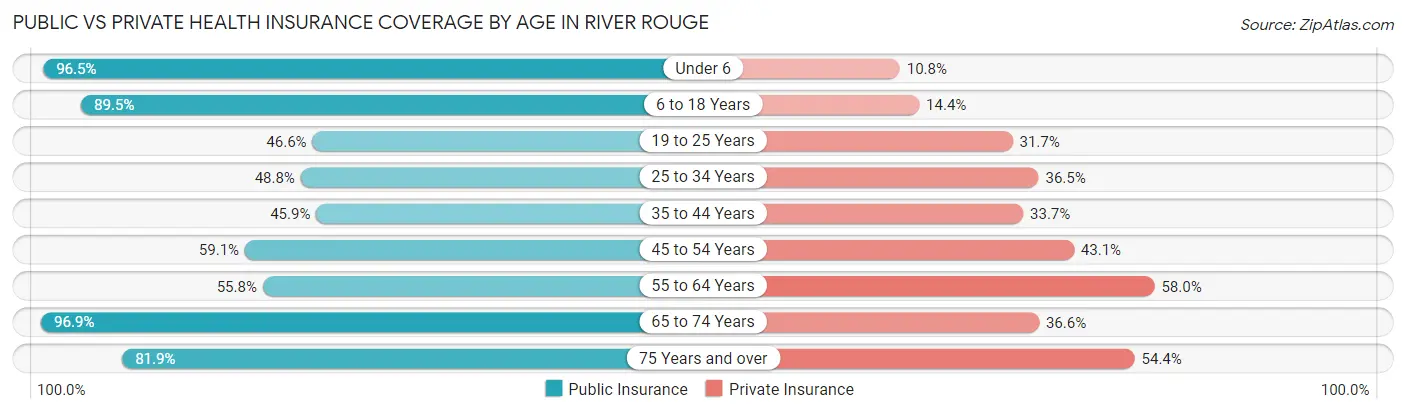
| Age Bracket | Public Insurance | Private Insurance |
| Under 6 | 502 (96.5%) | 56 (10.8%) |
| 6 to 18 Years | 1,085 (89.5%) | 174 (14.4%) |
| 19 to 25 Years | 341 (46.6%) | 232 (31.7%) |
| 25 to 34 Years | 566 (48.7%) | 424 (36.5%) |
| 35 to 44 Years | 372 (45.9%) | 273 (33.7%) |
| 45 to 54 Years | 568 (59.1%) | 414 (43.1%) |
| 55 to 64 Years | 548 (55.8%) | 570 (58.0%) |
| 65 to 74 Years | 662 (96.9%) | 250 (36.6%) |
| 75 Years and over | 113 (81.9%) | 75 (54.3%) |
| Total | 4,757 (66.1%) | 2,468 (34.3%) |
Disability Status by Sex by Age in River Rouge
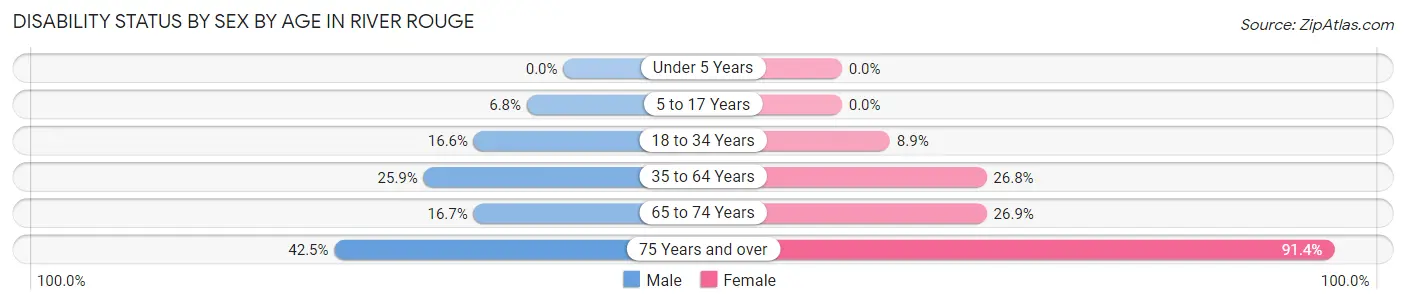
| Age Bracket | Male | Female |
| Under 5 Years | 0 (0.0%) | 0 (0.0%) |
| 5 to 17 Years | 51 (6.8%) | 0 (0.0%) |
| 18 to 34 Years | 160 (16.6%) | 94 (8.9%) |
| 35 to 64 Years | 351 (25.9%) | 376 (26.8%) |
| 65 to 74 Years | 63 (16.7%) | 82 (26.9%) |
| 75 Years and over | 34 (42.5%) | 53 (91.4%) |
Disability Class by Sex by Age in River Rouge
Disability Class: Hearing Difficulty
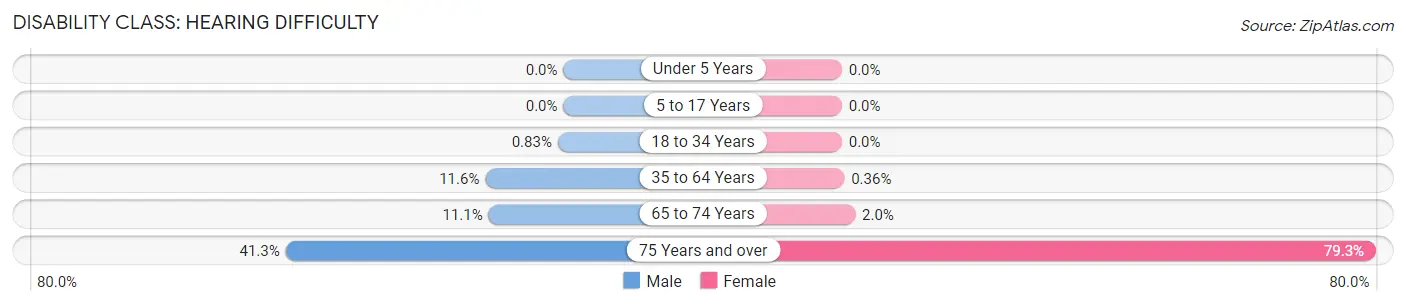
| Age Bracket | Male | Female |
| Under 5 Years | 0 (0.0%) | 0 (0.0%) |
| 5 to 17 Years | 0 (0.0%) | 0 (0.0%) |
| 18 to 34 Years | 8 (0.8%) | 0 (0.0%) |
| 35 to 64 Years | 157 (11.6%) | 5 (0.4%) |
| 65 to 74 Years | 42 (11.1%) | 6 (2.0%) |
| 75 Years and over | 33 (41.2%) | 46 (79.3%) |
Disability Class: Vision Difficulty
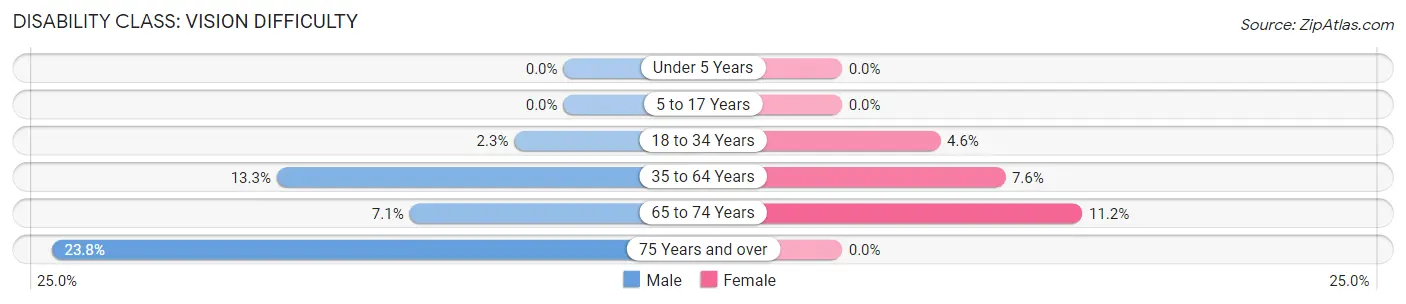
| Age Bracket | Male | Female |
| Under 5 Years | 0 (0.0%) | 0 (0.0%) |
| 5 to 17 Years | 0 (0.0%) | 0 (0.0%) |
| 18 to 34 Years | 22 (2.3%) | 48 (4.6%) |
| 35 to 64 Years | 180 (13.3%) | 106 (7.6%) |
| 65 to 74 Years | 27 (7.1%) | 34 (11.2%) |
| 75 Years and over | 19 (23.7%) | 0 (0.0%) |
Disability Class: Cognitive Difficulty
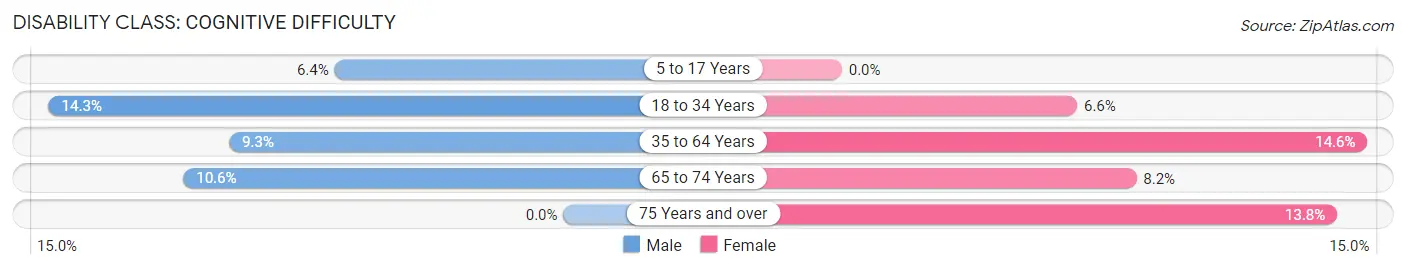
| Age Bracket | Male | Female |
| 5 to 17 Years | 48 (6.4%) | 0 (0.0%) |
| 18 to 34 Years | 138 (14.3%) | 69 (6.6%) |
| 35 to 64 Years | 126 (9.3%) | 205 (14.6%) |
| 65 to 74 Years | 40 (10.6%) | 25 (8.2%) |
| 75 Years and over | 0 (0.0%) | 8 (13.8%) |
Disability Class: Ambulatory Difficulty
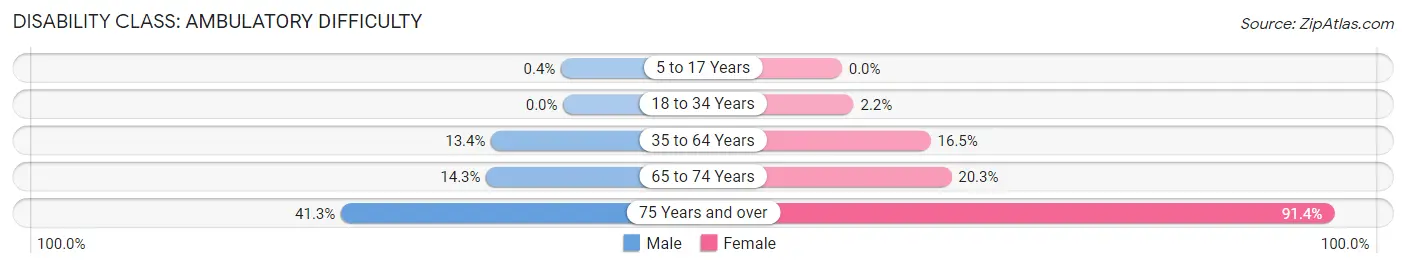
| Age Bracket | Male | Female |
| 5 to 17 Years | 3 (0.4%) | 0 (0.0%) |
| 18 to 34 Years | 0 (0.0%) | 23 (2.2%) |
| 35 to 64 Years | 181 (13.4%) | 231 (16.5%) |
| 65 to 74 Years | 54 (14.3%) | 62 (20.3%) |
| 75 Years and over | 33 (41.2%) | 53 (91.4%) |
Disability Class: Self-Care Difficulty
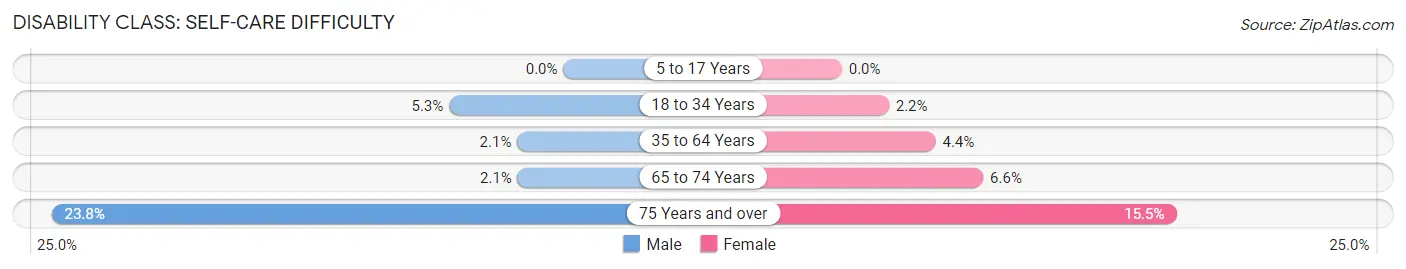
| Age Bracket | Male | Female |
| 5 to 17 Years | 0 (0.0%) | 0 (0.0%) |
| 18 to 34 Years | 51 (5.3%) | 23 (2.2%) |
| 35 to 64 Years | 29 (2.1%) | 61 (4.3%) |
| 65 to 74 Years | 8 (2.1%) | 20 (6.6%) |
| 75 Years and over | 19 (23.7%) | 9 (15.5%) |
Technology Access in River Rouge
Computing Device Access in River Rouge
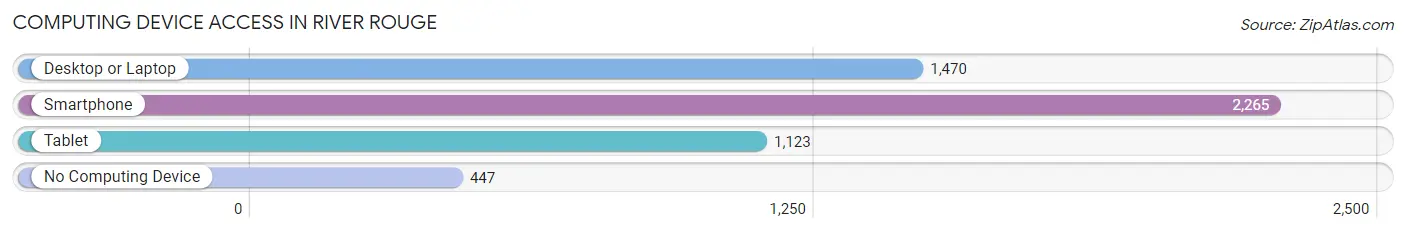
| Device Type | # Households | % Households |
| Desktop or Laptop | 1,470 | 50.7% |
| Smartphone | 2,265 | 78.1% |
| Tablet | 1,123 | 38.7% |
| No Computing Device | 447 | 15.4% |
| Total | 2,900 | 100.0% |
Internet Access in River Rouge
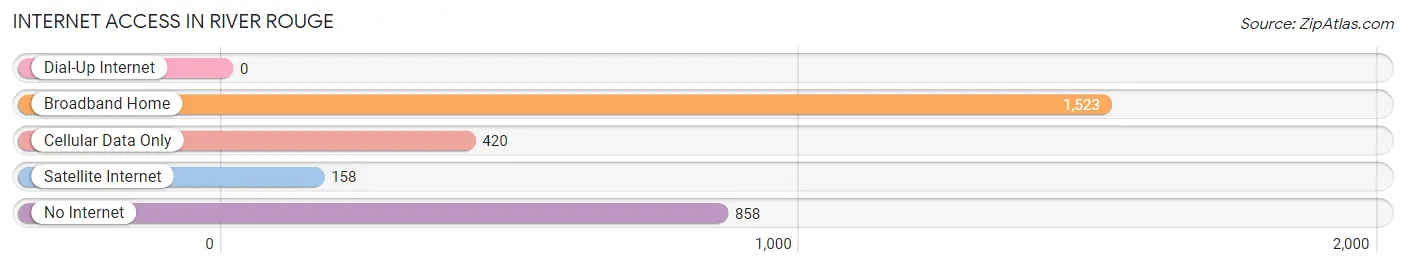
| Internet Type | # Households | % Households |
| Dial-Up Internet | 0 | 0.0% |
| Broadband Home | 1,523 | 52.5% |
| Cellular Data Only | 420 | 14.5% |
| Satellite Internet | 158 | 5.4% |
| No Internet | 858 | 29.6% |
| Total | 2,900 | 100.0% |
River Rouge Summary
History
River Rouge is a city located in Wayne County, Michigan. It is situated along the Detroit River, just south of the city of Detroit. The city was founded in 1922 and was named after the nearby River Rouge, which was named by French explorers in the 17th century. The city has a population of 7,903 as of the 2010 census.
River Rouge has a long and interesting history. The area was originally inhabited by the Potawatomi Native Americans, who used the area for hunting and fishing. The first European settlers arrived in the area in the late 1700s, and the area was eventually incorporated as a village in 1837. The village was named after the nearby River Rouge, which was named by French explorers in the 17th century.
In the late 1800s, the area began to experience rapid industrial growth. The Detroit River was an important transportation route for goods and materials, and the area became a hub for manufacturing and industry. The Ford Motor Company opened a plant in River Rouge in 1917, and the city was officially incorporated as a city in 1922.
The city experienced a period of growth and prosperity in the mid-20th century, but the city began to decline in the late 1960s and early 1970s. The city was hit hard by the recession of the 1980s, and the population declined significantly. The city has since experienced a resurgence, and the population has been steadily increasing since the 1990s.
Geography
River Rouge is located in Wayne County, Michigan, along the Detroit River. The city is situated just south of the city of Detroit, and is bordered by the cities of Ecorse and Wyandotte. The city has a total area of 2.2 square miles, all of which is land.
The city is located in a humid continental climate zone, with hot, humid summers and cold, snowy winters. The average temperature in the summer is around 75 degrees Fahrenheit, and the average temperature in the winter is around 25 degrees Fahrenheit. The city receives an average of 33 inches of precipitation per year.
Economy
River Rouge has a diverse economy, with a mix of manufacturing, retail, and service industries. The city is home to several large manufacturing companies, including Ford Motor Company, which has a plant in the city. Other major employers in the city include the Detroit Public Schools, the City of River Rouge, and the River Rouge School District.
The city also has a thriving retail sector, with several shopping centers and malls located in the city. The city also has a vibrant arts and culture scene, with several museums, galleries, and theaters located in the city.
Demographics
As of the 2010 census, the population of River Rouge was 7,903. The racial makeup of the city was 79.3% African American, 15.2% White, 0.7% Asian, 0.3% Native American, and 4.5% from other races. The median household income in the city was $30,945, and the median family income was $35,945. The per capita income in the city was $15,945.
The city has a high rate of poverty, with 28.3% of the population living below the poverty line. The city also has a high rate of unemployment, with an unemployment rate of 11.3%. The city has a high rate of crime, with a crime rate that is higher than the national average.
Common Questions
What is Per Capita Income in River Rouge?
Per Capita income in River Rouge is $20,541.
What is the Median Family Income in River Rouge?
Median Family Income in River Rouge is $38,619.
What is the Median Household income in River Rouge?
Median Household Income in River Rouge is $26,343.
What is Income or Wage Gap in River Rouge?
Income or Wage Gap in River Rouge is 57.4%.
Women in River Rouge earn 42.6 cents for every dollar earned by a man.
What is Family Income Deficit in River Rouge?
Family Income Deficit in River Rouge is $11,856.
Families that are below poverty line in River Rouge earn $11,856 less on average than the poverty threshold level.
What is Inequality or Gini Index in River Rouge?
Inequality or Gini Index in River Rouge is 0.57.
What is the Total Population of River Rouge?
Total Population of River Rouge is 7,200.
What is the Total Male Population of River Rouge?
Total Male Population of River Rouge is 3,719.
What is the Total Female Population of River Rouge?
Total Female Population of River Rouge is 3,481.
What is the Ratio of Males per 100 Females in River Rouge?
There are 106.84 Males per 100 Females in River Rouge.
What is the Ratio of Females per 100 Males in River Rouge?
There are 93.60 Females per 100 Males in River Rouge.
What is the Median Population Age in River Rouge?
Median Population Age in River Rouge is 34.9 Years.
What is the Average Family Size in River Rouge
Average Family Size in River Rouge is 3.8 People.
What is the Average Household Size in River Rouge
Average Household Size in River Rouge is 2.5 People.
How Large is the Labor Force in River Rouge?
There are 2,821 People in the Labor Forcein in River Rouge.
What is the Percentage of People in the Labor Force in River Rouge?
50.2% of People are in the Labor Force in River Rouge.
What is the Unemployment Rate in River Rouge?
Unemployment Rate in River Rouge is 12.9%.