Reading, MI Map & Demographics
Reading Map
Reading Overview
$18,199
PER CAPITA INCOME
$53,884
AVG FAMILY INCOME
$46,681
AVG HOUSEHOLD INCOME
6.6%
WAGE / INCOME GAP [ % ]
93.4¢/ $1
WAGE / INCOME GAP [ $ ]
0.41
INEQUALITY / GINI INDEX
1,207
TOTAL POPULATION
594
MALE POPULATION
613
FEMALE POPULATION
96.90
MALES / 100 FEMALES
103.20
FEMALES / 100 MALES
33.5
MEDIAN AGE
4.0
AVG FAMILY SIZE
3.3
AVG HOUSEHOLD SIZE
461
LABOR FORCE [ PEOPLE ]
56.7%
PERCENT IN LABOR FORCE
4.3%
UNEMPLOYMENT RATE
Reading Zip Codes
Reading Area Codes
Income in Reading
Income Overview in Reading
Per Capita Income in Reading is $18,199, while median incomes of families and households are $53,884 and $46,681 respectively.
| Characteristic | Number | Measure |
| Per Capita Income | 1,207 | $18,199 |
| Median Family Income | 259 | $53,884 |
| Mean Family Income | 259 | $65,034 |
| Median Household Income | 367 | $46,681 |
| Mean Household Income | 367 | $57,353 |
| Income Deficit | 259 | $0 |
| Wage / Income Gap (%) | 1,207 | 6.58% |
| Wage / Income Gap ($) | 1,207 | 93.42¢ per $1 |
| Gini / Inequality Index | 1,207 | 0.41 |
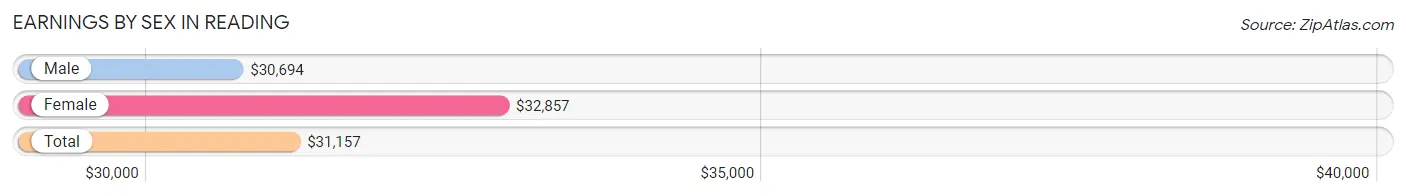
Earnings by Sex in Reading
Average Earnings in Reading are $31,157, $30,694 for men and $32,857 for women, a difference of 6.6%.
| Sex | Number | Average Earnings |
| Male | 245 (50.3%) | $30,694 |
| Female | 242 (49.7%) | $32,857 |
| Total | 487 (100.0%) | $31,157 |
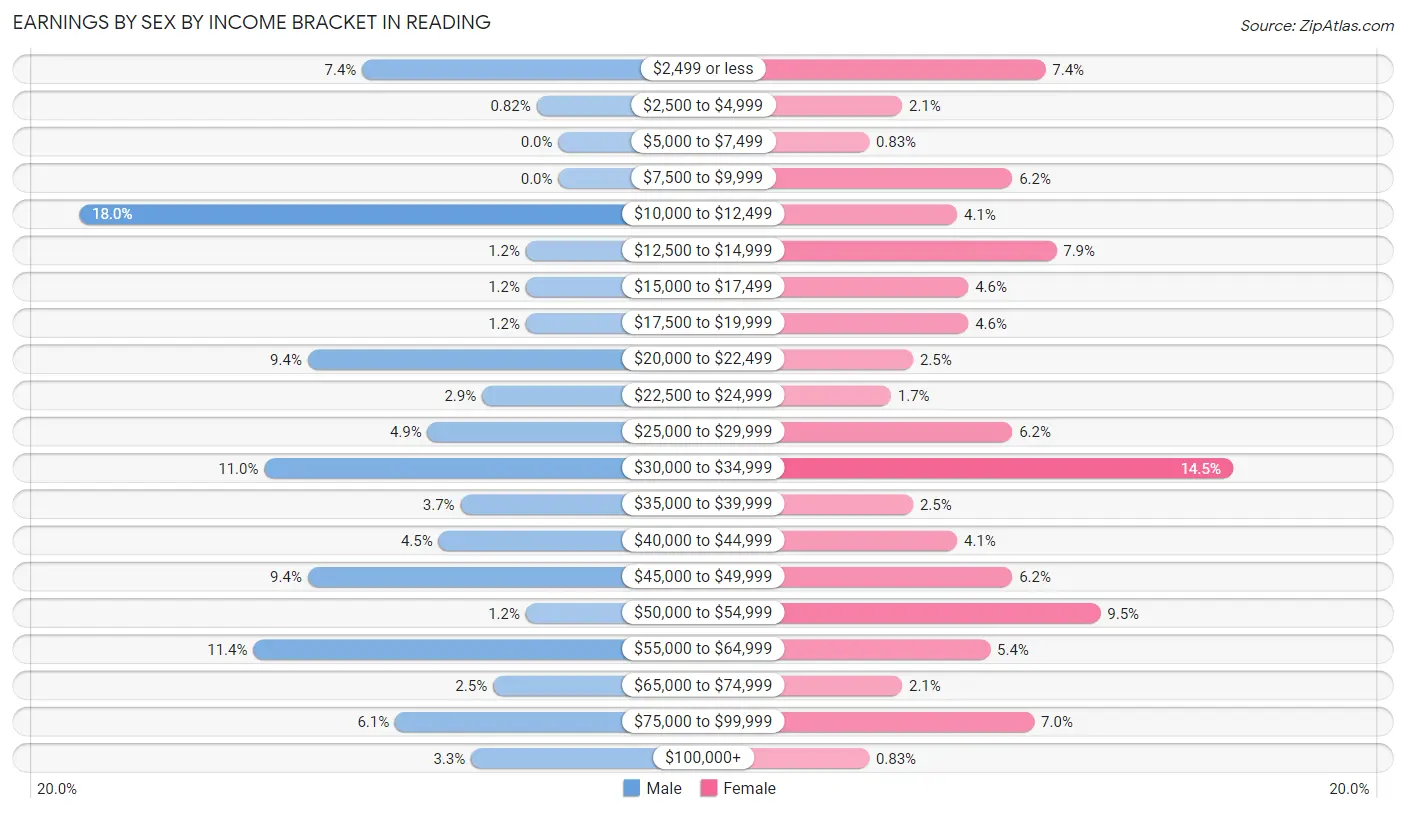
Earnings by Sex by Income Bracket in Reading
The most common earnings brackets in Reading are $10,000 to $12,499 for men (44 | 18.0%) and $30,000 to $34,999 for women (35 | 14.5%).
| Income | Male | Female |
| $2,499 or less | 18 (7.3%) | 18 (7.4%) |
| $2,500 to $4,999 | 2 (0.8%) | 5 (2.1%) |
| $5,000 to $7,499 | 0 (0.0%) | 2 (0.8%) |
| $7,500 to $9,999 | 0 (0.0%) | 15 (6.2%) |
| $10,000 to $12,499 | 44 (18.0%) | 10 (4.1%) |
| $12,500 to $14,999 | 3 (1.2%) | 19 (7.9%) |
| $15,000 to $17,499 | 3 (1.2%) | 11 (4.5%) |
| $17,500 to $19,999 | 3 (1.2%) | 11 (4.5%) |
| $20,000 to $22,499 | 23 (9.4%) | 6 (2.5%) |
| $22,500 to $24,999 | 7 (2.9%) | 4 (1.7%) |
| $25,000 to $29,999 | 12 (4.9%) | 15 (6.2%) |
| $30,000 to $34,999 | 27 (11.0%) | 35 (14.5%) |
| $35,000 to $39,999 | 9 (3.7%) | 6 (2.5%) |
| $40,000 to $44,999 | 11 (4.5%) | 10 (4.1%) |
| $45,000 to $49,999 | 23 (9.4%) | 15 (6.2%) |
| $50,000 to $54,999 | 3 (1.2%) | 23 (9.5%) |
| $55,000 to $64,999 | 28 (11.4%) | 13 (5.4%) |
| $65,000 to $74,999 | 6 (2.5%) | 5 (2.1%) |
| $75,000 to $99,999 | 15 (6.1%) | 17 (7.0%) |
| $100,000+ | 8 (3.3%) | 2 (0.8%) |
| Total | 245 (100.0%) | 242 (100.0%) |
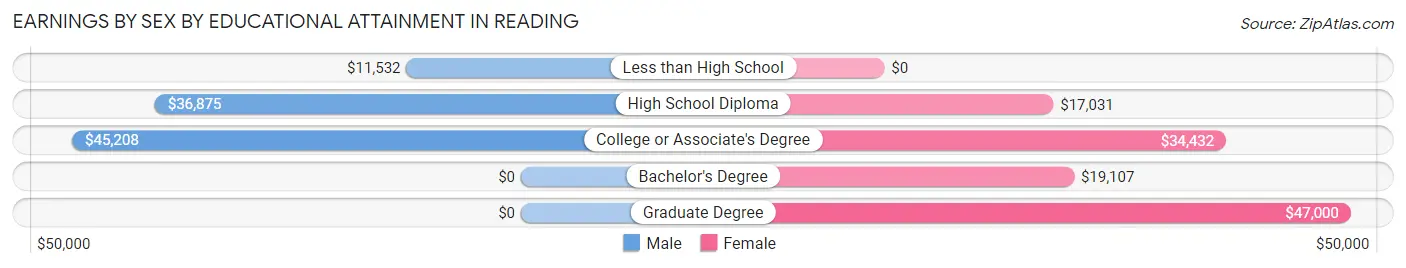
Earnings by Sex by Educational Attainment in Reading
Average earnings in Reading are $31,700 for men and $33,500 for women, a difference of 5.4%. Men with an educational attainment of college or associate's degree enjoy the highest average annual earnings of $45,208, while those with less than high school education earn the least with $11,532. Women with an educational attainment of graduate degree earn the most with the average annual earnings of $47,000, while those with high school diploma education have the smallest earnings of $17,031.
| Educational Attainment | Male Income | Female Income |
| Less than High School | $11,532 | $0 |
| High School Diploma | $36,875 | $17,031 |
| College or Associate's Degree | $45,208 | $34,432 |
| Bachelor's Degree | - | - |
| Graduate Degree | - | - |
| Total | $31,700 | $33,500 |
Family Income in Reading
Family Income Brackets in Reading
According to the Reading family income data, there are 74 families falling into the $50,000 to $74,999 income range, which is the most common income bracket and makes up 28.6% of all families. Conversely, the less than $10,000 income bracket is the least frequent group with only 5 families (1.9%) belonging to this category.
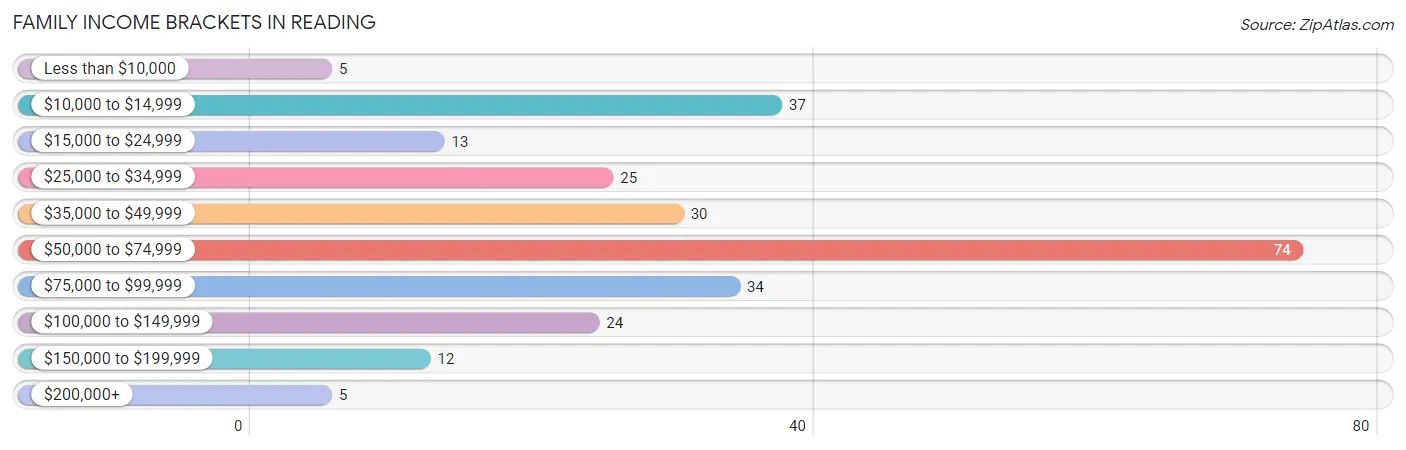
| Income Bracket | # Families | % Families |
| Less than $10,000 | 5 | 1.9% |
| $10,000 to $14,999 | 37 | 14.3% |
| $15,000 to $24,999 | 13 | 5.0% |
| $25,000 to $34,999 | 25 | 9.7% |
| $35,000 to $49,999 | 30 | 11.6% |
| $50,000 to $74,999 | 74 | 28.6% |
| $75,000 to $99,999 | 34 | 13.1% |
| $100,000 to $149,999 | 24 | 9.3% |
| $150,000 to $199,999 | 12 | 4.6% |
| $200,000+ | 5 | 1.9% |
Family Income by Famaliy Size in Reading
4-person families (43 | 16.6%) account for the highest median family income in Reading with $87,083 per family, while 2-person families (102 | 39.4%) have the highest median income of $26,800 per family member.
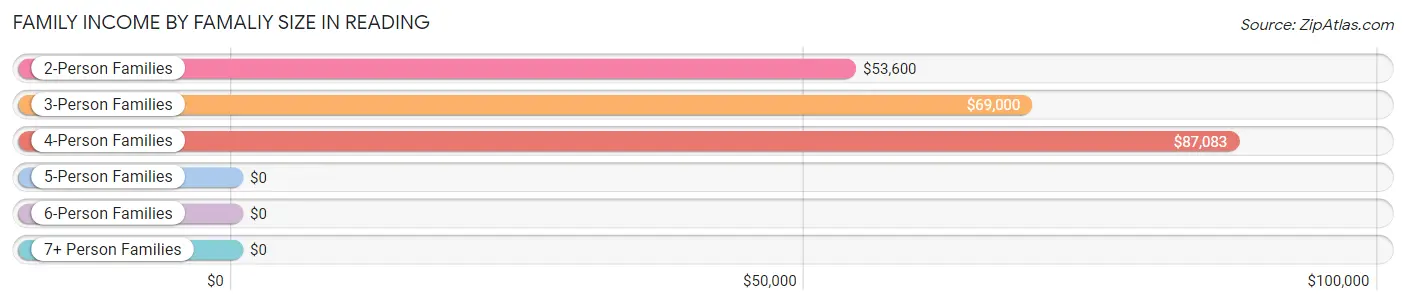
| Income Bracket | # Families | Median Income |
| 2-Person Families | 102 (39.4%) | $53,600 |
| 3-Person Families | 52 (20.1%) | $69,000 |
| 4-Person Families | 43 (16.6%) | $87,083 |
| 5-Person Families | 23 (8.9%) | $0 |
| 6-Person Families | 5 (1.9%) | $0 |
| 7+ Person Families | 34 (13.1%) | $0 |
| Total | 259 (100.0%) | $53,884 |
Family Income by Number of Earners in Reading
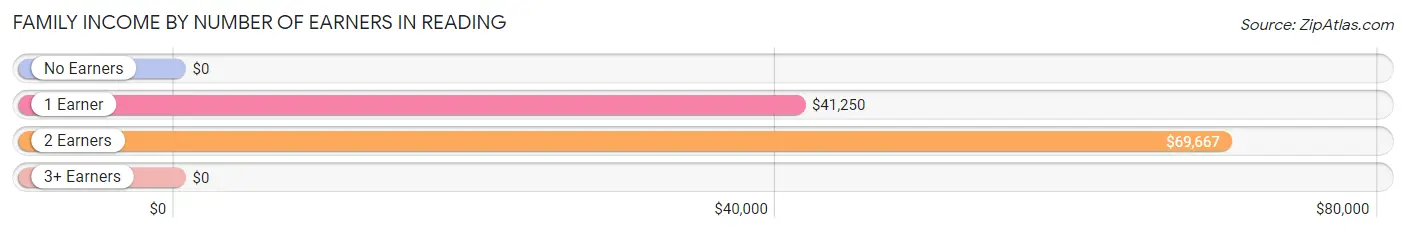
| Number of Earners | # Families | Median Income |
| No Earners | 29 (11.2%) | $0 |
| 1 Earner | 103 (39.8%) | $41,250 |
| 2 Earners | 114 (44.0%) | $69,667 |
| 3+ Earners | 13 (5.0%) | $0 |
| Total | 259 (100.0%) | $53,884 |
Household Income in Reading
Household Income Brackets in Reading
With 92 households falling in the category, the $50,000 to $74,999 income range is the most frequent in Reading, accounting for 25.1% of all households. In contrast, only 8 households (2.2%) fall into the less than $10,000 income bracket, making it the least populous group.
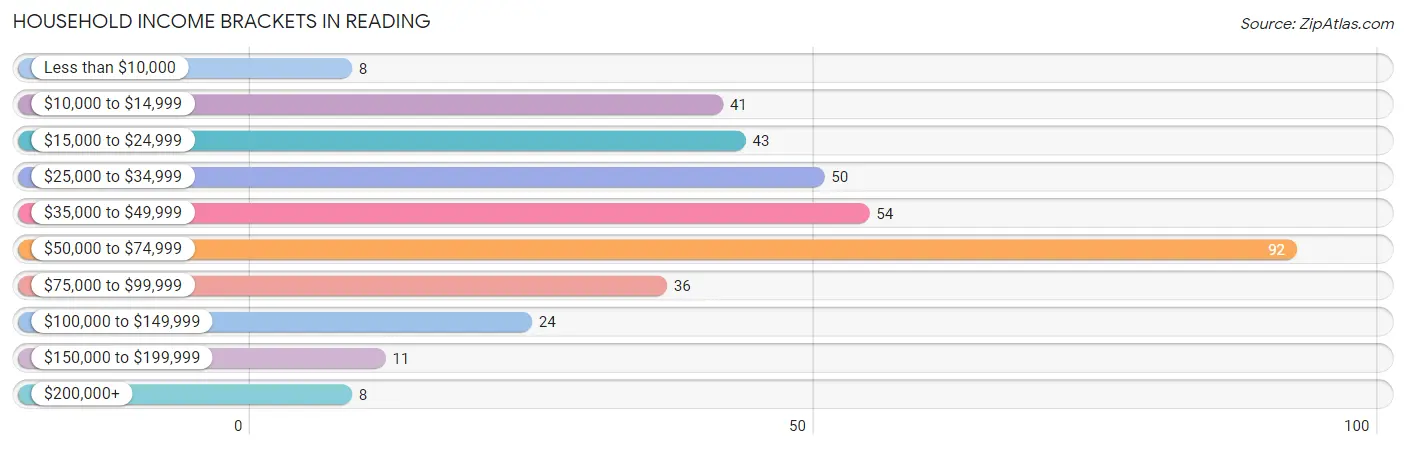
| Income Bracket | # Households | % Households |
| Less than $10,000 | 8 | 2.2% |
| $10,000 to $14,999 | 41 | 11.2% |
| $15,000 to $24,999 | 43 | 11.7% |
| $25,000 to $34,999 | 50 | 13.6% |
| $35,000 to $49,999 | 54 | 14.7% |
| $50,000 to $74,999 | 92 | 25.1% |
| $75,000 to $99,999 | 36 | 9.8% |
| $100,000 to $149,999 | 24 | 6.5% |
| $150,000 to $199,999 | 11 | 3.0% |
| $200,000+ | 8 | 2.2% |
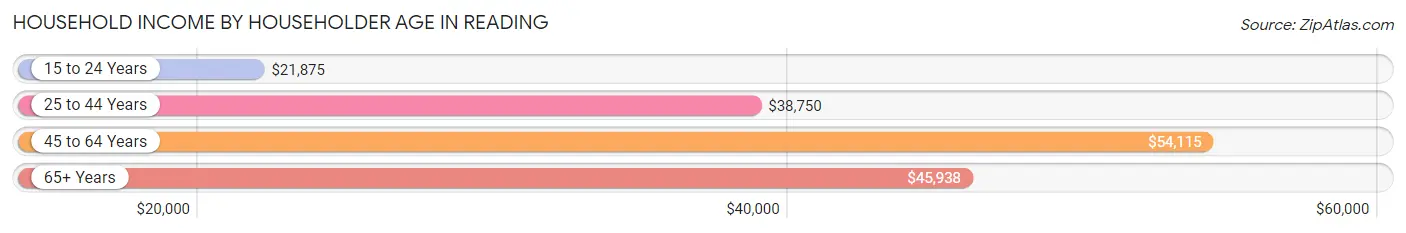
Household Income by Householder Age in Reading
The median household income in Reading is $46,681, with the highest median household income of $54,115 found in the 45 to 64 years age bracket for the primary householder. A total of 155 households (42.2%) fall into this category. Meanwhile, the 15 to 24 years age bracket for the primary householder has the lowest median household income of $21,875, with 15 households (4.1%) in this group.
| Income Bracket | # Households | Median Income |
| 15 to 24 Years | 15 (4.1%) | $21,875 |
| 25 to 44 Years | 124 (33.8%) | $38,750 |
| 45 to 64 Years | 155 (42.2%) | $54,115 |
| 65+ Years | 73 (19.9%) | $45,938 |
| Total | 367 (100.0%) | $46,681 |
Poverty in Reading
Income Below Poverty by Sex and Age in Reading
With 33.8% poverty level for males and 45.0% for females among the residents of Reading, 15 year old males and under 5 year old females are the most vulnerable to poverty, with 18 males (90.0%) and 41 females (95.4%) in their respective age groups living below the poverty level.
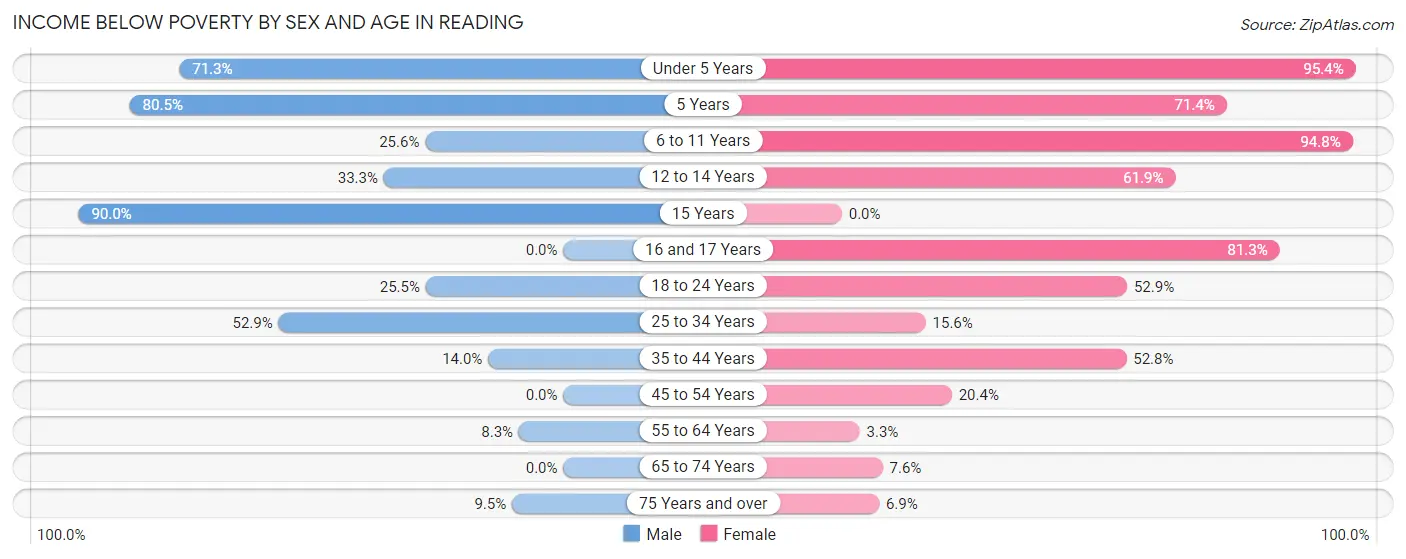
| Age Bracket | Male | Female |
| Under 5 Years | 67 (71.3%) | 41 (95.4%) |
| 5 Years | 33 (80.5%) | 5 (71.4%) |
| 6 to 11 Years | 10 (25.6%) | 109 (94.8%) |
| 12 to 14 Years | 2 (33.3%) | 13 (61.9%) |
| 15 Years | 18 (90.0%) | 0 (0.0%) |
| 16 and 17 Years | 0 (0.0%) | 13 (81.2%) |
| 18 to 24 Years | 12 (25.5%) | 18 (52.9%) |
| 25 to 34 Years | 37 (52.9%) | 7 (15.6%) |
| 35 to 44 Years | 12 (14.0%) | 47 (52.8%) |
| 45 to 54 Years | 0 (0.0%) | 10 (20.4%) |
| 55 to 64 Years | 8 (8.3%) | 3 (3.3%) |
| 65 to 74 Years | 0 (0.0%) | 5 (7.6%) |
| 75 Years and over | 2 (9.5%) | 2 (6.9%) |
| Total | 201 (33.8%) | 273 (45.0%) |
Income Above Poverty by Sex and Age in Reading
According to the poverty statistics in Reading, males aged 16 and 17 years and females aged 15 years are the age groups that are most secure financially, with 100.0% of males and 100.0% of females in these age groups living above the poverty line.
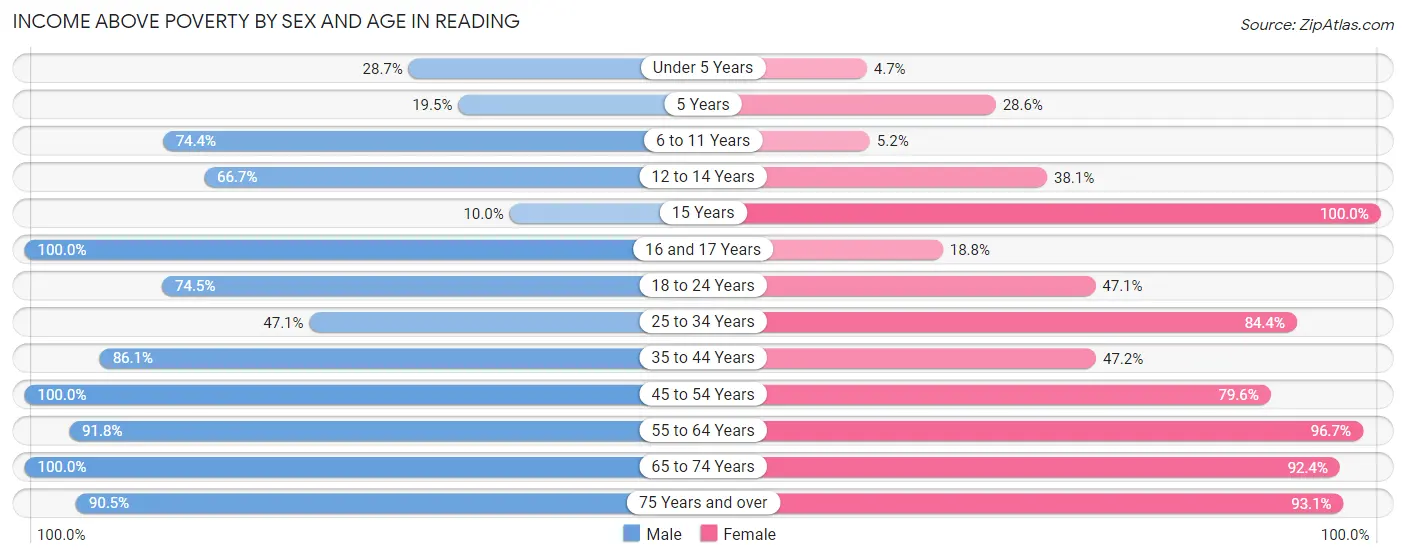
| Age Bracket | Male | Female |
| Under 5 Years | 27 (28.7%) | 2 (4.6%) |
| 5 Years | 8 (19.5%) | 2 (28.6%) |
| 6 to 11 Years | 29 (74.4%) | 6 (5.2%) |
| 12 to 14 Years | 4 (66.7%) | 8 (38.1%) |
| 15 Years | 2 (10.0%) | 2 (100.0%) |
| 16 and 17 Years | 17 (100.0%) | 3 (18.8%) |
| 18 to 24 Years | 35 (74.5%) | 16 (47.1%) |
| 25 to 34 Years | 33 (47.1%) | 38 (84.4%) |
| 35 to 44 Years | 74 (86.1%) | 42 (47.2%) |
| 45 to 54 Years | 26 (100.0%) | 39 (79.6%) |
| 55 to 64 Years | 89 (91.7%) | 88 (96.7%) |
| 65 to 74 Years | 30 (100.0%) | 61 (92.4%) |
| 75 Years and over | 19 (90.5%) | 27 (93.1%) |
| Total | 393 (66.2%) | 334 (55.0%) |
Income Below Poverty Among Married-Couple Families in Reading
The poverty statistics for married-couple families in Reading show that 17.5% or 33 of the total 189 families live below the poverty line. Families with 5 or more children have the highest poverty rate of 91.2%, comprising of 31 families. On the other hand, families with no children have the lowest poverty rate of 0.0%, which includes 0 families.
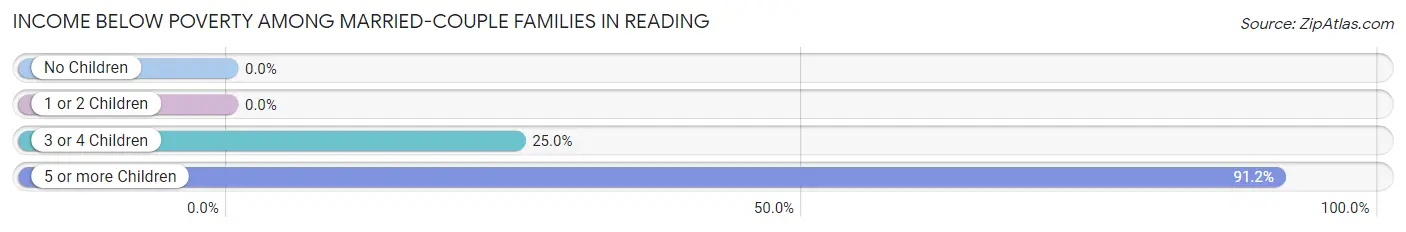
| Children | Above Poverty | Below Poverty |
| No Children | 116 (100.0%) | 0 (0.0%) |
| 1 or 2 Children | 31 (100.0%) | 0 (0.0%) |
| 3 or 4 Children | 6 (75.0%) | 2 (25.0%) |
| 5 or more Children | 3 (8.8%) | 31 (91.2%) |
| Total | 156 (82.5%) | 33 (17.5%) |
Income Below Poverty Among Single-Parent Households in Reading
According to the poverty data in Reading, 61.5% or 8 single-father households and 43.9% or 25 single-mother households are living below the poverty line. Among single-father households, those with no children have the highest poverty rate, with 6 households (85.7%) experiencing poverty. Likewise, among single-mother households, those with 3 or 4 children have the highest poverty rate, with 16 households (100.0%) falling below the poverty line.
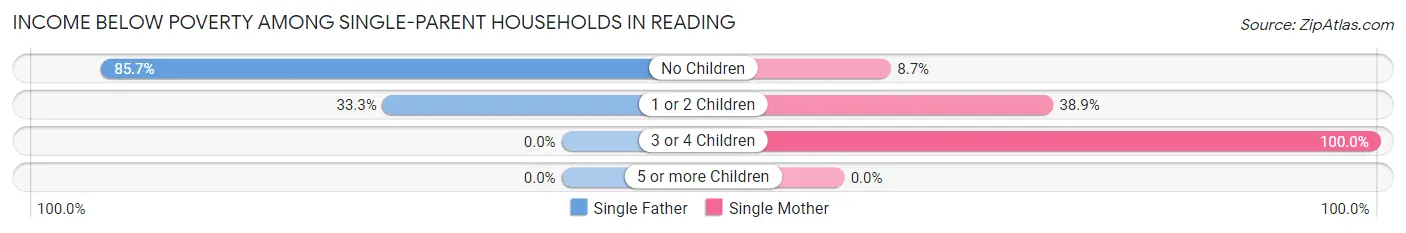
| Children | Single Father | Single Mother |
| No Children | 6 (85.7%) | 2 (8.7%) |
| 1 or 2 Children | 2 (33.3%) | 7 (38.9%) |
| 3 or 4 Children | 0 (0.0%) | 16 (100.0%) |
| 5 or more Children | 0 (0.0%) | 0 (0.0%) |
| Total | 8 (61.5%) | 25 (43.9%) |
Income Below Poverty Among Married-Couple vs Single-Parent Households in Reading
The poverty data for Reading shows that 33 of the married-couple family households (17.5%) and 33 of the single-parent households (47.1%) are living below the poverty level. Within the married-couple family households, those with 5 or more children have the highest poverty rate, with 31 households (91.2%) falling below the poverty line. Among the single-parent households, those with 3 or 4 children have the highest poverty rate, with 16 household (100.0%) living below poverty.
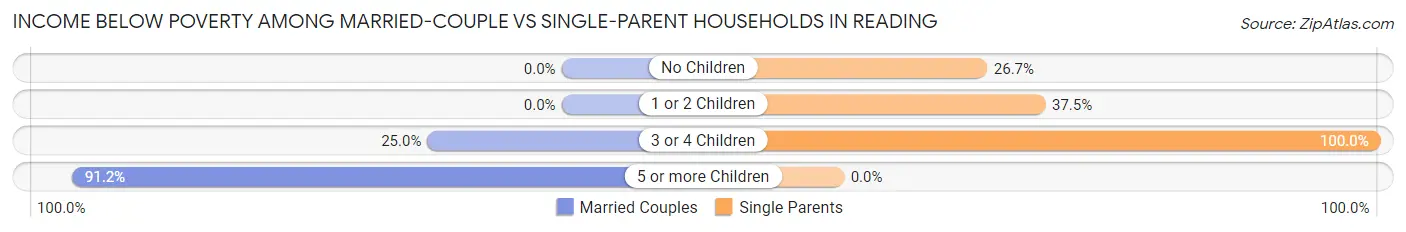
| Children | Married-Couple Families | Single-Parent Households |
| No Children | 0 (0.0%) | 8 (26.7%) |
| 1 or 2 Children | 0 (0.0%) | 9 (37.5%) |
| 3 or 4 Children | 2 (25.0%) | 16 (100.0%) |
| 5 or more Children | 31 (91.2%) | 0 (0.0%) |
| Total | 33 (17.5%) | 33 (47.1%) |
Race in Reading
The most populous races in Reading are White / Caucasian (1,178 | 97.6%), Hispanic or Latino (16 | 1.3%), and Two or more Races (13 | 1.1%).
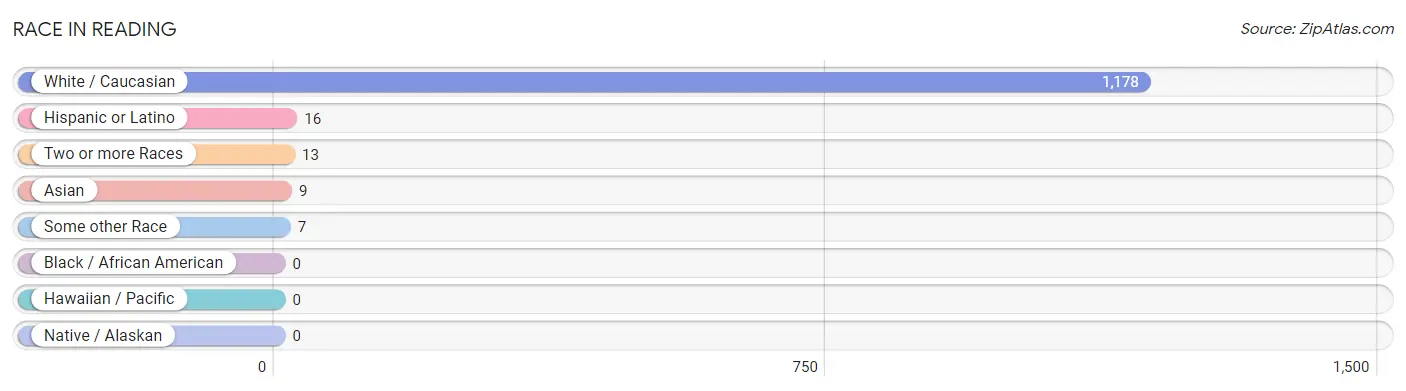
| Race | # Population | % Population |
| Asian | 9 | 0.7% |
| Black / African American | 0 | 0.0% |
| Hawaiian / Pacific | 0 | 0.0% |
| Hispanic or Latino | 16 | 1.3% |
| Native / Alaskan | 0 | 0.0% |
| White / Caucasian | 1,178 | 97.6% |
| Two or more Races | 13 | 1.1% |
| Some other Race | 7 | 0.6% |
| Total | 1,207 | 100.0% |
Ancestry in Reading
The most populous ancestries reported in Reading are German (499 | 41.3%), English (145 | 12.0%), Swedish (59 | 4.9%), Irish (47 | 3.9%), and Polish (39 | 3.2%), together accounting for 65.4% of all Reading residents.
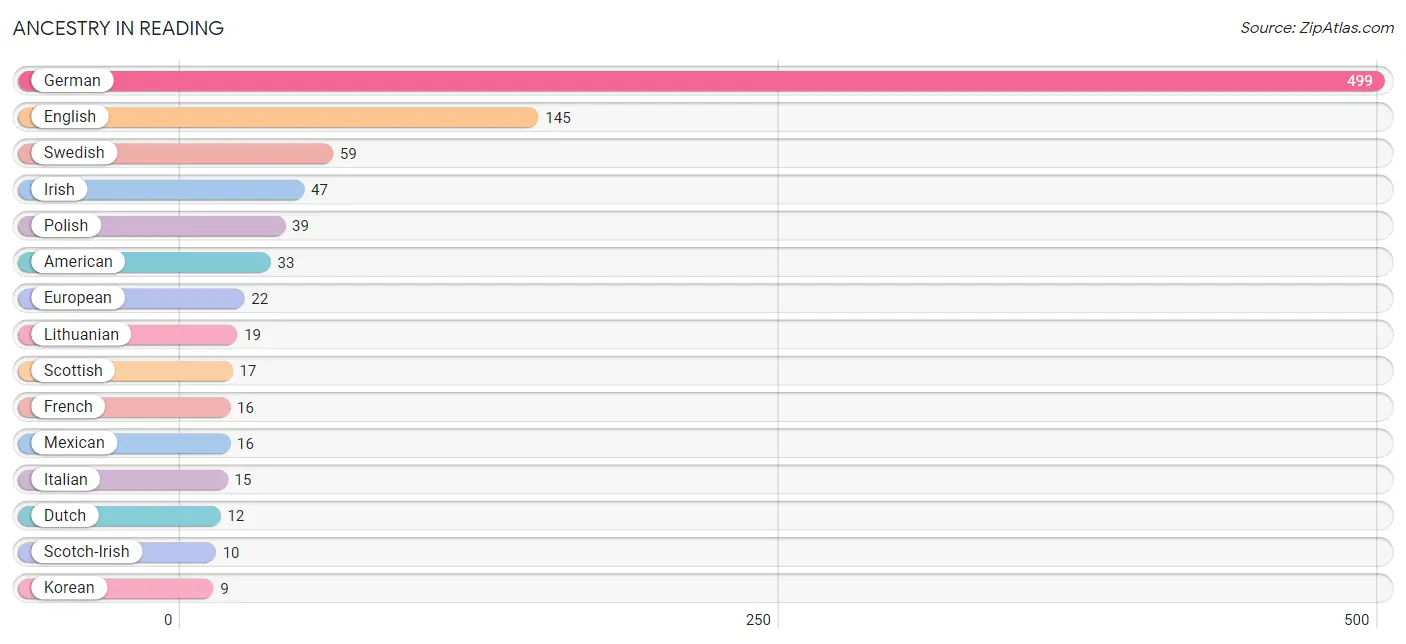
| Ancestry | # Population | % Population |
| American | 33 | 2.7% |
| Apache | 3 | 0.3% |
| British | 3 | 0.3% |
| Czech | 2 | 0.2% |
| Danish | 8 | 0.7% |
| Dutch | 12 | 1.0% |
| English | 145 | 12.0% |
| European | 22 | 1.8% |
| French | 16 | 1.3% |
| French Canadian | 2 | 0.2% |
| German | 499 | 41.3% |
| Irish | 47 | 3.9% |
| Italian | 15 | 1.2% |
| Korean | 9 | 0.7% |
| Lithuanian | 19 | 1.6% |
| Mexican | 16 | 1.3% |
| Pakistani | 1 | 0.1% |
| Polish | 39 | 3.2% |
| Russian | 1 | 0.1% |
| Scotch-Irish | 10 | 0.8% |
| Scottish | 17 | 1.4% |
| Swedish | 59 | 4.9% |
| Welsh | 4 | 0.3% | View All 23 Rows |
Immigrants in Reading
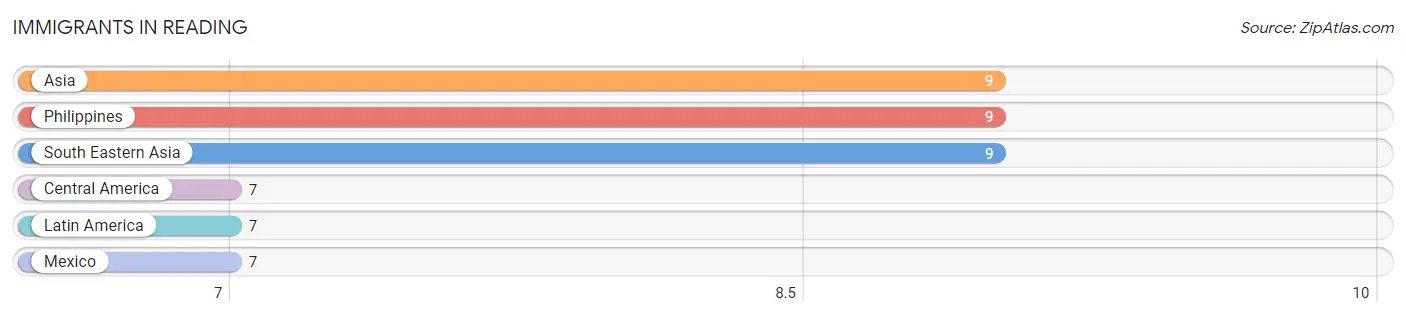
The most numerous immigrant groups reported in Reading came from Asia (9 | 0.7%), Philippines (9 | 0.7%), South Eastern Asia (9 | 0.7%), Central America (7 | 0.6%), and Latin America (7 | 0.6%), together accounting for 3.4% of all Reading residents.
| Immigration Origin | # Population | % Population |
| Asia | 9 | 0.7% |
| Central America | 7 | 0.6% |
| Latin America | 7 | 0.6% |
| Mexico | 7 | 0.6% |
| Philippines | 9 | 0.7% |
| South Eastern Asia | 9 | 0.7% | View All 6 Rows |
Sex and Age in Reading
Sex and Age in Reading
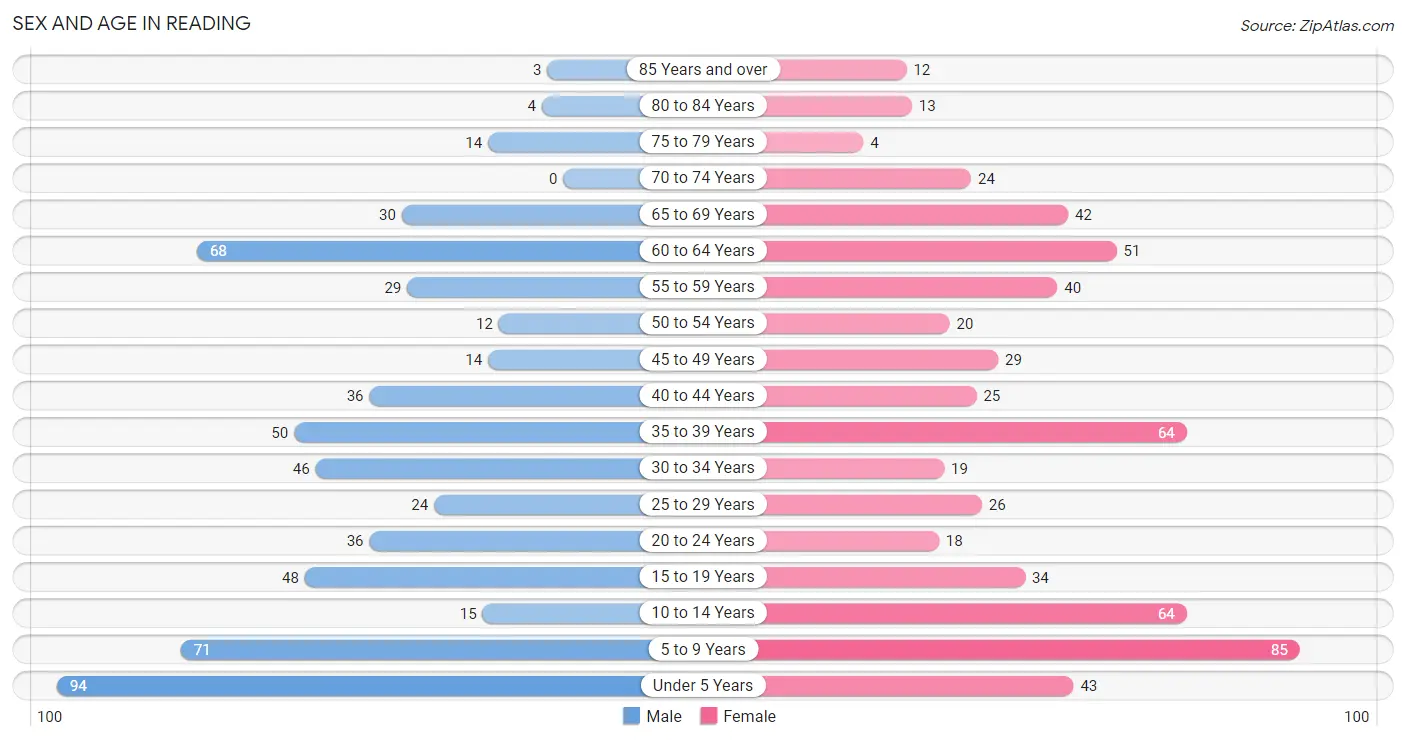
The most populous age groups in Reading are Under 5 Years (94 | 15.8%) for men and 5 to 9 Years (85 | 13.9%) for women.
| Age Bracket | Male | Female |
| Under 5 Years | 94 (15.8%) | 43 (7.0%) |
| 5 to 9 Years | 71 (11.9%) | 85 (13.9%) |
| 10 to 14 Years | 15 (2.5%) | 64 (10.4%) |
| 15 to 19 Years | 48 (8.1%) | 34 (5.6%) |
| 20 to 24 Years | 36 (6.1%) | 18 (2.9%) |
| 25 to 29 Years | 24 (4.0%) | 26 (4.2%) |
| 30 to 34 Years | 46 (7.7%) | 19 (3.1%) |
| 35 to 39 Years | 50 (8.4%) | 64 (10.4%) |
| 40 to 44 Years | 36 (6.1%) | 25 (4.1%) |
| 45 to 49 Years | 14 (2.4%) | 29 (4.7%) |
| 50 to 54 Years | 12 (2.0%) | 20 (3.3%) |
| 55 to 59 Years | 29 (4.9%) | 40 (6.5%) |
| 60 to 64 Years | 68 (11.5%) | 51 (8.3%) |
| 65 to 69 Years | 30 (5.1%) | 42 (6.9%) |
| 70 to 74 Years | 0 (0.0%) | 24 (3.9%) |
| 75 to 79 Years | 14 (2.4%) | 4 (0.6%) |
| 80 to 84 Years | 4 (0.7%) | 13 (2.1%) |
| 85 Years and over | 3 (0.5%) | 12 (2.0%) |
| Total | 594 (100.0%) | 613 (100.0%) |
Families and Households in Reading
Median Family Size in Reading
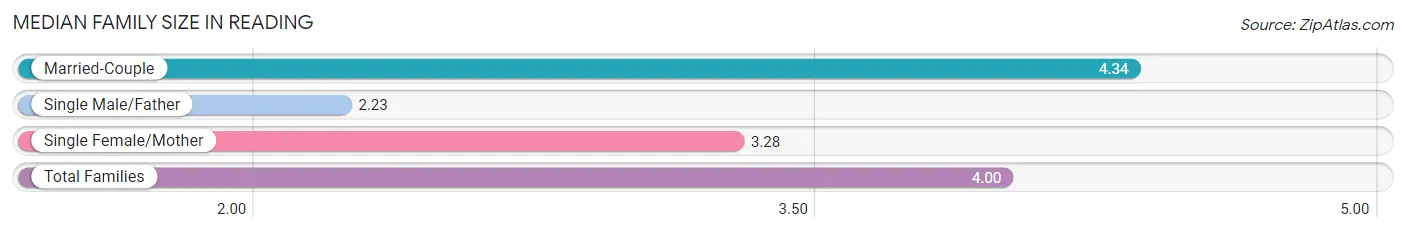
The median family size in Reading is 4.00 persons per family, with married-couple families (189 | 73.0%) accounting for the largest median family size of 4.34 persons per family. On the other hand, single male/father families (13 | 5.0%) represent the smallest median family size with 2.23 persons per family.
| Family Type | # Families | Family Size |
| Married-Couple | 189 (73.0%) | 4.34 |
| Single Male/Father | 13 (5.0%) | 2.23 |
| Single Female/Mother | 57 (22.0%) | 3.28 |
| Total Families | 259 (100.0%) | 4.00 |
Median Household Size in Reading
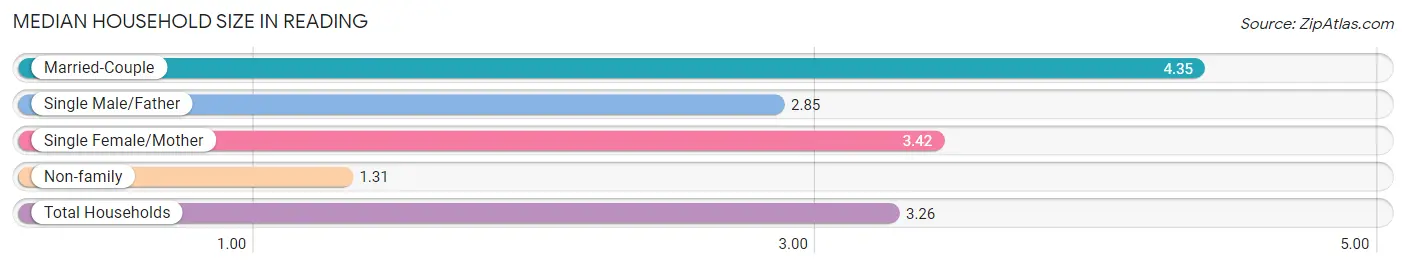
The median household size in Reading is 3.26 persons per household, with married-couple households (189 | 51.5%) accounting for the largest median household size of 4.35 persons per household. non-family households (108 | 29.4%) represent the smallest median household size with 1.31 persons per household.
| Household Type | # Households | Household Size |
| Married-Couple | 189 (51.5%) | 4.35 |
| Single Male/Father | 13 (3.5%) | 2.85 |
| Single Female/Mother | 57 (15.5%) | 3.42 |
| Non-family | 108 (29.4%) | 1.31 |
| Total Households | 367 (100.0%) | 3.26 |
Household Size by Marriage Status in Reading
Out of a total of 367 households in Reading, 259 (70.6%) are family households, while 108 (29.4%) are nonfamily households. The most numerous type of family households are 2-person households, comprising 97, and the most common type of nonfamily households are 1-person households, comprising 74.
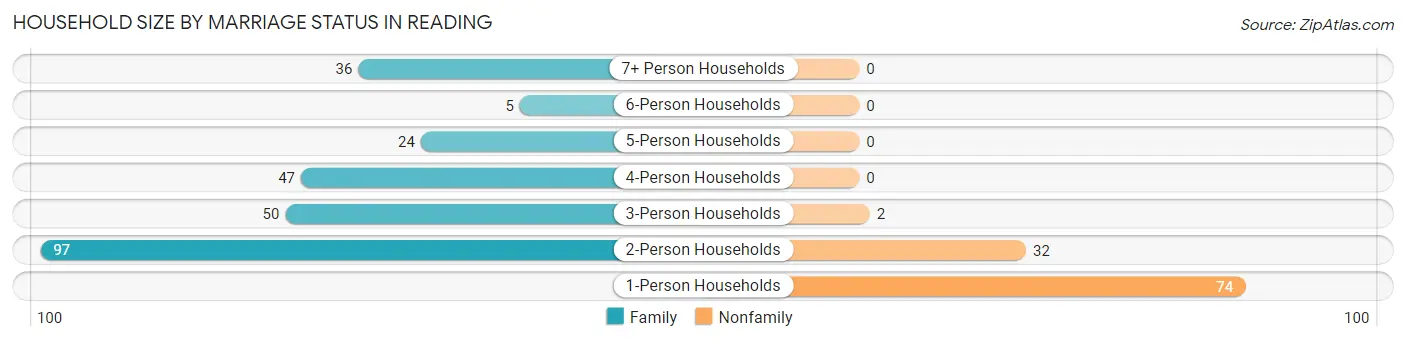
| Household Size | Family Households | Nonfamily Households |
| 1-Person Households | - | 74 (20.2%) |
| 2-Person Households | 97 (26.4%) | 32 (8.7%) |
| 3-Person Households | 50 (13.6%) | 2 (0.5%) |
| 4-Person Households | 47 (12.8%) | 0 (0.0%) |
| 5-Person Households | 24 (6.5%) | 0 (0.0%) |
| 6-Person Households | 5 (1.4%) | 0 (0.0%) |
| 7+ Person Households | 36 (9.8%) | 0 (0.0%) |
| Total | 259 (70.6%) | 108 (29.4%) |
Female Fertility in Reading
Fertility by Age in Reading
Average fertility rate in Reading is 195.0 births per 1,000 women. Women in the age bracket of 35 to 50 years have the highest fertility rate with 271.0 births per 1,000 women. Women in the age bracket of 35 to 50 years acount for 76.2% of all women with births.
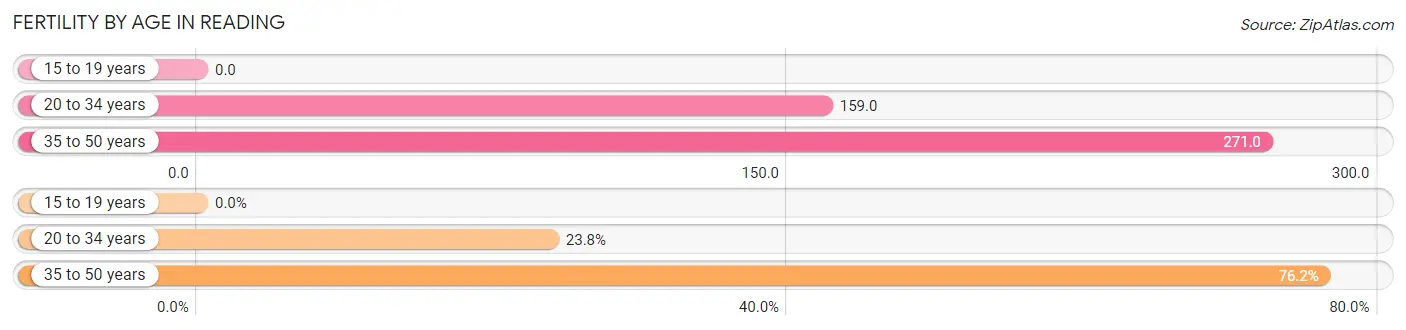
| Age Bracket | Women with Births | Births / 1,000 Women |
| 15 to 19 years | 0 (0.0%) | 0.0 |
| 20 to 34 years | 10 (23.8%) | 159.0 |
| 35 to 50 years | 32 (76.2%) | 271.0 |
| Total | 42 (100.0%) | 195.0 |
Fertility by Age by Marriage Status in Reading
76.2% of women with births (42) in Reading are married. The highest percentage of unmarried women with births falls into 20 to 34 years age bracket with 100.0% of them unmarried at the time of birth, while the lowest percentage of unmarried women with births belong to 35 to 50 years age bracket with 0.0% of them unmarried.
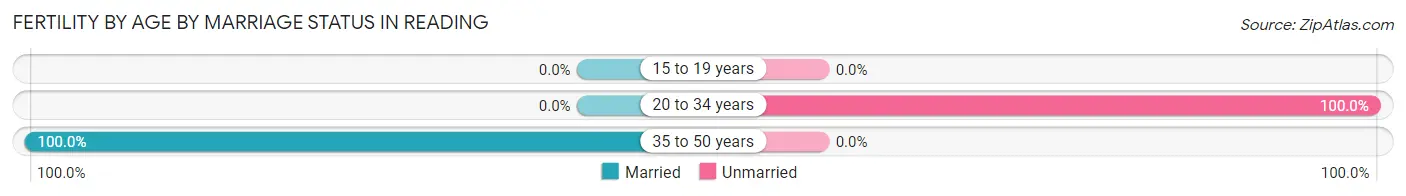
| Age Bracket | Married | Unmarried |
| 15 to 19 years | 0 (0.0%) | 0 (0.0%) |
| 20 to 34 years | 0 (0.0%) | 10 (100.0%) |
| 35 to 50 years | 32 (100.0%) | 0 (0.0%) |
| Total | 32 (76.2%) | 10 (23.8%) |
Fertility by Education in Reading
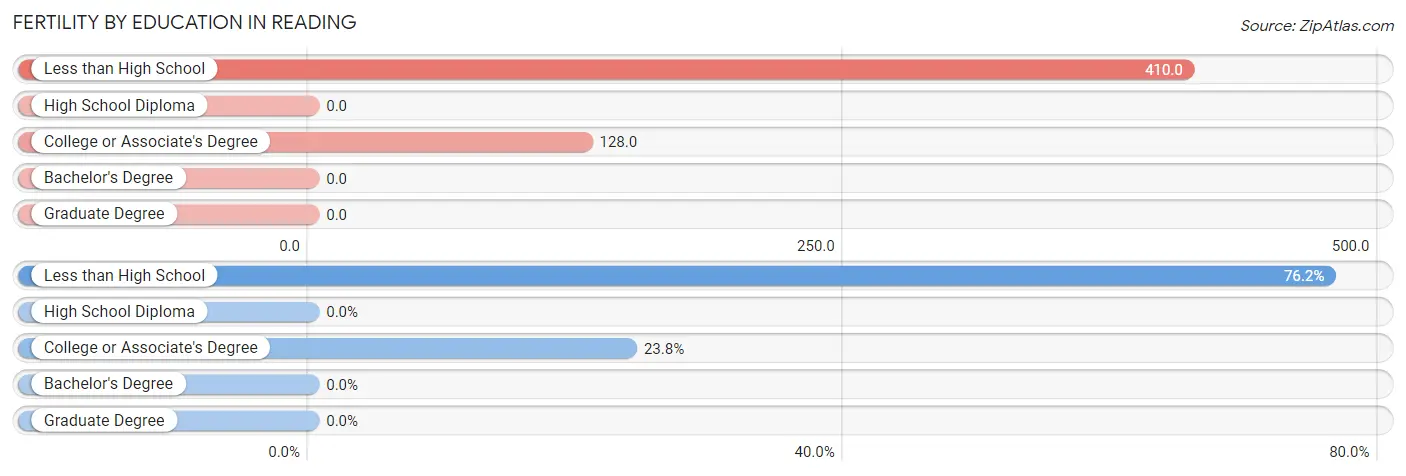
| Educational Attainment | Women with Births | Births / 1,000 Women |
| Less than High School | 32 (76.2%) | 410.0 |
| High School Diploma | 0 (0.0%) | 0.0 |
| College or Associate's Degree | 10 (23.8%) | 128.0 |
| Bachelor's Degree | 0 (0.0%) | 0.0 |
| Graduate Degree | 0 (0.0%) | 0.0 |
| Total | 42 (100.0%) | 195.0 |
Fertility by Education by Marriage Status in Reading
23.8% of women with births in Reading are unmarried. Women with the educational attainment of less than high school are most likely to be married with 100.0% of them married at childbirth, while women with the educational attainment of college or associate's degree are least likely to be married with 100.0% of them unmarried at childbirth.
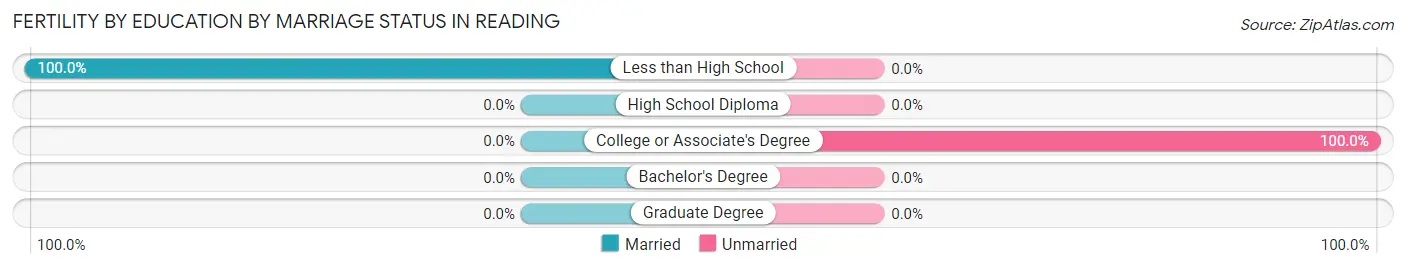
| Educational Attainment | Married | Unmarried |
| Less than High School | 32 (100.0%) | 0 (0.0%) |
| High School Diploma | 0 (0.0%) | 0 (0.0%) |
| College or Associate's Degree | 0 (0.0%) | 10 (100.0%) |
| Bachelor's Degree | 0 (0.0%) | 0 (0.0%) |
| Graduate Degree | 0 (0.0%) | 0 (0.0%) |
| Total | 32 (76.2%) | 10 (23.8%) |
Employment Characteristics in Reading
Employment by Class of Employer in Reading
Among the 439 employed individuals in Reading, private company employees (300 | 68.3%), self-employed (not incorporated) (49 | 11.2%), and local government employees (39 | 8.9%) make up the most common classes of employment.
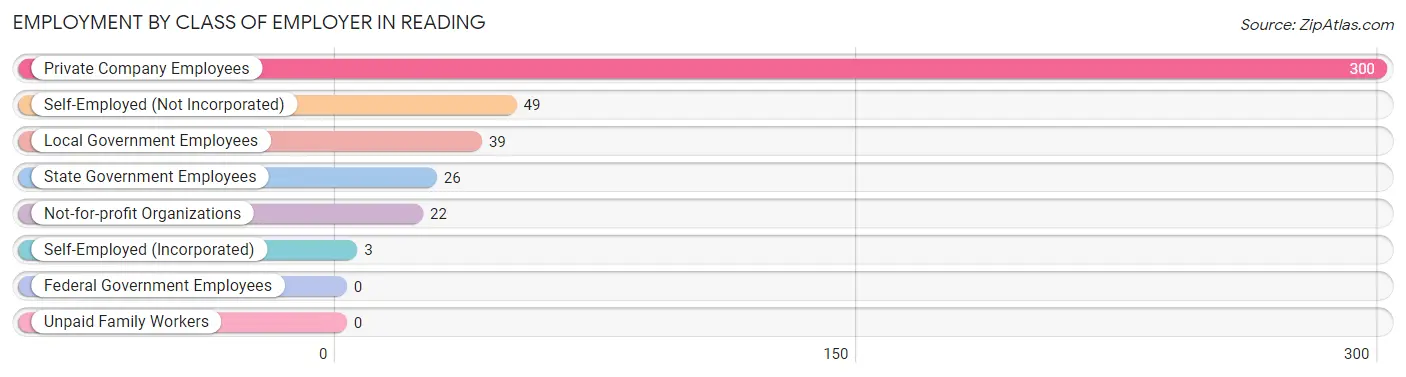
| Employer Class | # Employees | % Employees |
| Private Company Employees | 300 | 68.3% |
| Self-Employed (Incorporated) | 3 | 0.7% |
| Self-Employed (Not Incorporated) | 49 | 11.2% |
| Not-for-profit Organizations | 22 | 5.0% |
| Local Government Employees | 39 | 8.9% |
| State Government Employees | 26 | 5.9% |
| Federal Government Employees | 0 | 0.0% |
| Unpaid Family Workers | 0 | 0.0% |
| Total | 439 | 100.0% |
Employment Status by Age in Reading
According to the labor force statistics for Reading, out of the total population over 16 years of age (813), 56.7% or 461 individuals are in the labor force, with 4.3% or 20 of them unemployed. The age group with the highest labor force participation rate is 30 to 34 years, with 87.7% or 57 individuals in the labor force. Within the labor force, the 16 to 19 years age range has the highest percentage of unemployed individuals, with 21.1% or 4 of them being unemployed.
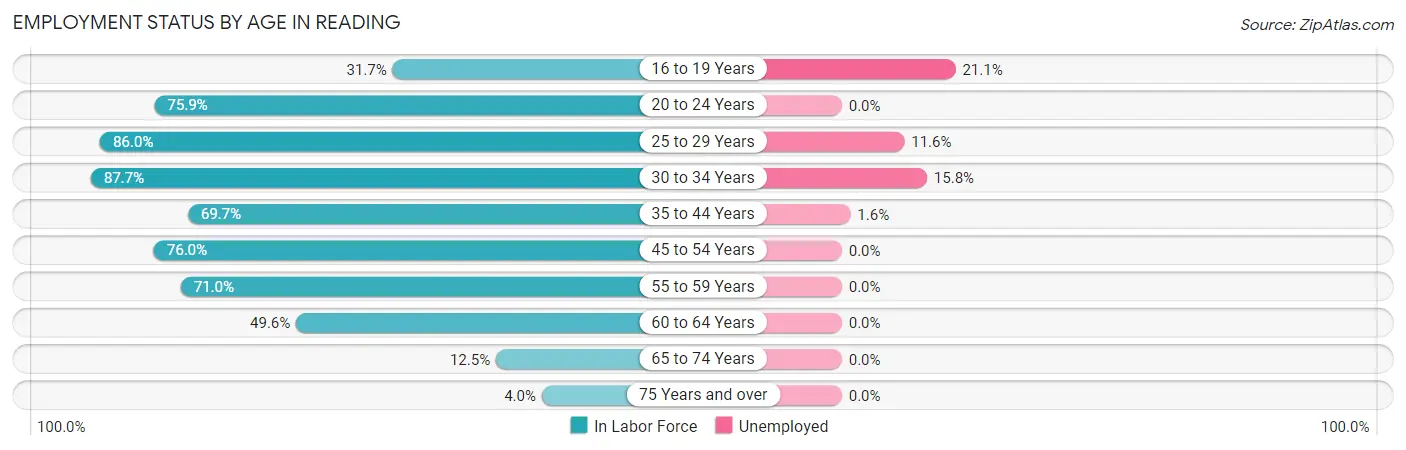
| Age Bracket | In Labor Force | Unemployed |
| 16 to 19 Years | 19 (31.7%) | 4 (21.1%) |
| 20 to 24 Years | 41 (75.9%) | 0 (0.0%) |
| 25 to 29 Years | 43 (86.0%) | 5 (11.6%) |
| 30 to 34 Years | 57 (87.7%) | 9 (15.8%) |
| 35 to 44 Years | 122 (69.7%) | 2 (1.6%) |
| 45 to 54 Years | 57 (76.0%) | 0 (0.0%) |
| 55 to 59 Years | 49 (71.0%) | 0 (0.0%) |
| 60 to 64 Years | 59 (49.6%) | 0 (0.0%) |
| 65 to 74 Years | 12 (12.5%) | 0 (0.0%) |
| 75 Years and over | 2 (4.0%) | 0 (0.0%) |
| Total | 461 (56.7%) | 20 (4.3%) |
Employment Status by Educational Attainment in Reading
According to labor force statistics for Reading, 70.0% of individuals (387) out of the total population between 25 and 64 years of age (553) are in the labor force, with 4.1% or 16 of them being unemployed. The group with the highest labor force participation rate are those with the educational attainment of bachelor's degree or higher, with 88.3% or 53 individuals in the labor force. Within the labor force, individuals with less than high school education have the highest percentage of unemployment, with 20.3% or 13 of them being unemployed.
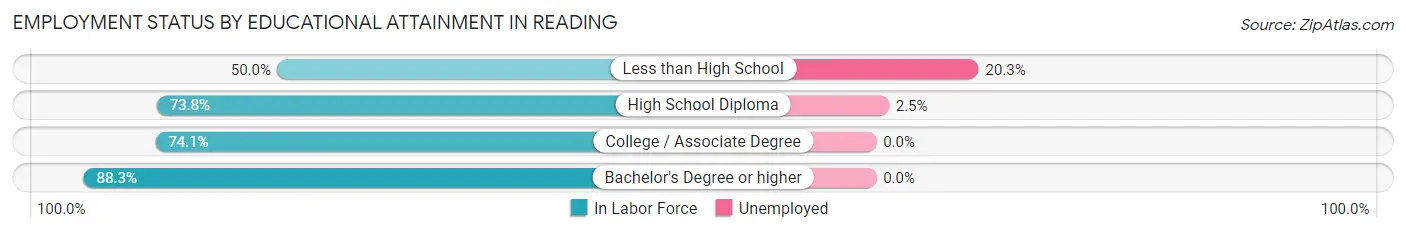
| Educational Attainment | In Labor Force | Unemployed |
| Less than High School | 64 (50.0%) | 26 (20.3%) |
| High School Diploma | 121 (73.8%) | 4 (2.5%) |
| College / Associate Degree | 149 (74.1%) | 0 (0.0%) |
| Bachelor's Degree or higher | 53 (88.3%) | 0 (0.0%) |
| Total | 387 (70.0%) | 23 (4.1%) |
Employment Occupations by Sex in Reading
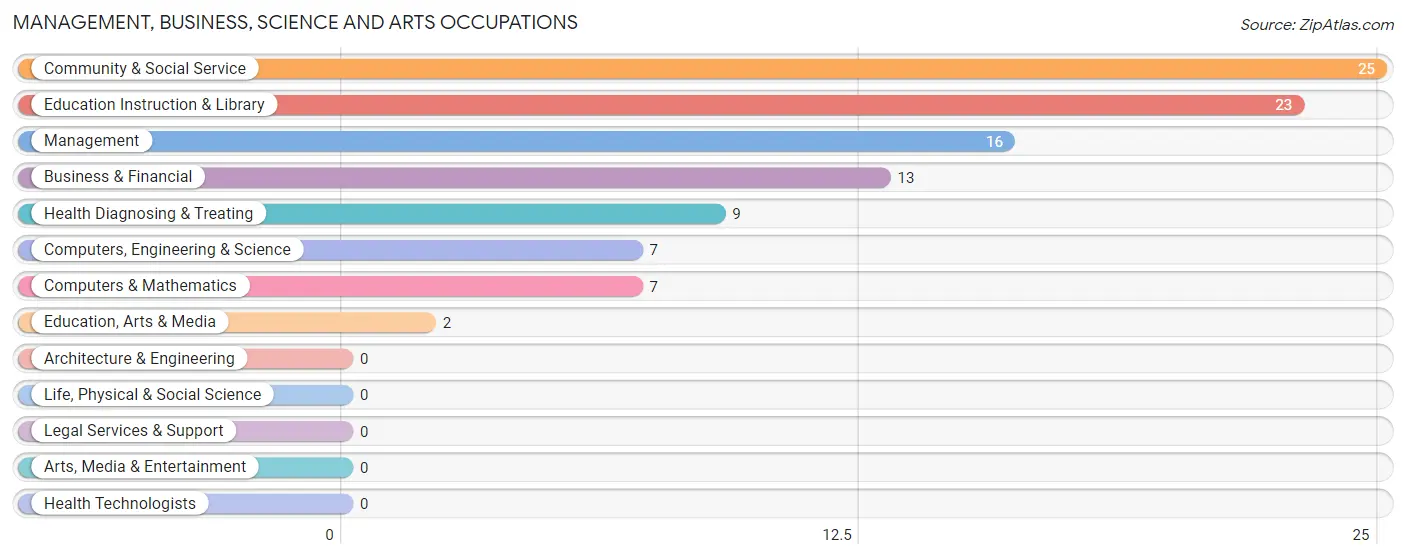
Management, Business, Science and Arts Occupations
The most common Management, Business, Science and Arts occupations in Reading are Community & Social Service (25 | 5.7%), Education Instruction & Library (23 | 5.2%), Management (16 | 3.6%), Business & Financial (13 | 2.9%), and Health Diagnosing & Treating (9 | 2.0%).
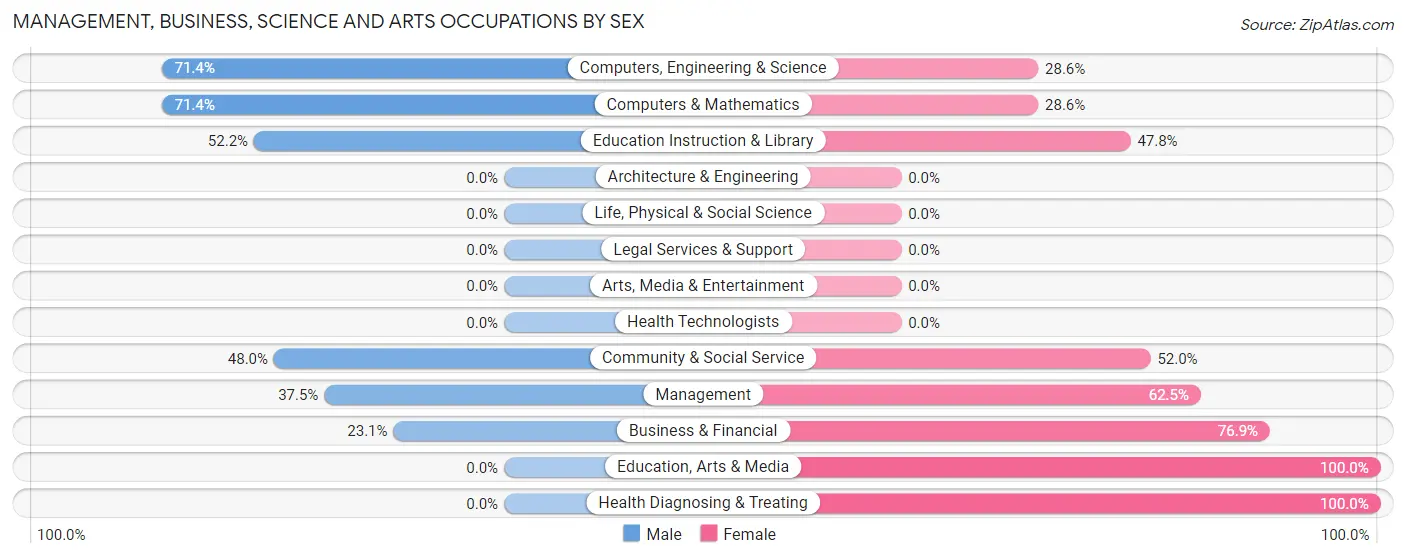
Management, Business, Science and Arts Occupations by Sex
Within the Management, Business, Science and Arts occupations in Reading, the most male-oriented occupations are Computers, Engineering & Science (71.4%), Computers & Mathematics (71.4%), and Education Instruction & Library (52.2%), while the most female-oriented occupations are Education, Arts & Media (100.0%), Health Diagnosing & Treating (100.0%), and Business & Financial (76.9%).
| Occupation | Male | Female |
| Management | 6 (37.5%) | 10 (62.5%) |
| Business & Financial | 3 (23.1%) | 10 (76.9%) |
| Computers, Engineering & Science | 5 (71.4%) | 2 (28.6%) |
| Computers & Mathematics | 5 (71.4%) | 2 (28.6%) |
| Architecture & Engineering | 0 (0.0%) | 0 (0.0%) |
| Life, Physical & Social Science | 0 (0.0%) | 0 (0.0%) |
| Community & Social Service | 12 (48.0%) | 13 (52.0%) |
| Education, Arts & Media | 0 (0.0%) | 2 (100.0%) |
| Legal Services & Support | 0 (0.0%) | 0 (0.0%) |
| Education Instruction & Library | 12 (52.2%) | 11 (47.8%) |
| Arts, Media & Entertainment | 0 (0.0%) | 0 (0.0%) |
| Health Diagnosing & Treating | 0 (0.0%) | 9 (100.0%) |
| Health Technologists | 0 (0.0%) | 0 (0.0%) |
| Total (Category) | 26 (37.1%) | 44 (62.9%) |
| Total (Overall) | 213 (48.3%) | 228 (51.7%) |
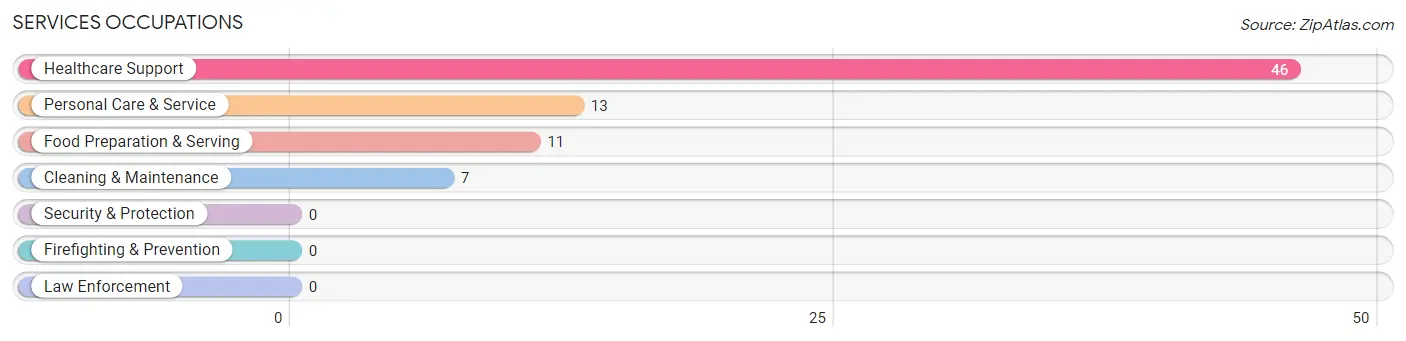
Services Occupations
The most common Services occupations in Reading are Healthcare Support (46 | 10.4%), Personal Care & Service (13 | 2.9%), Food Preparation & Serving (11 | 2.5%), and Cleaning & Maintenance (7 | 1.6%).
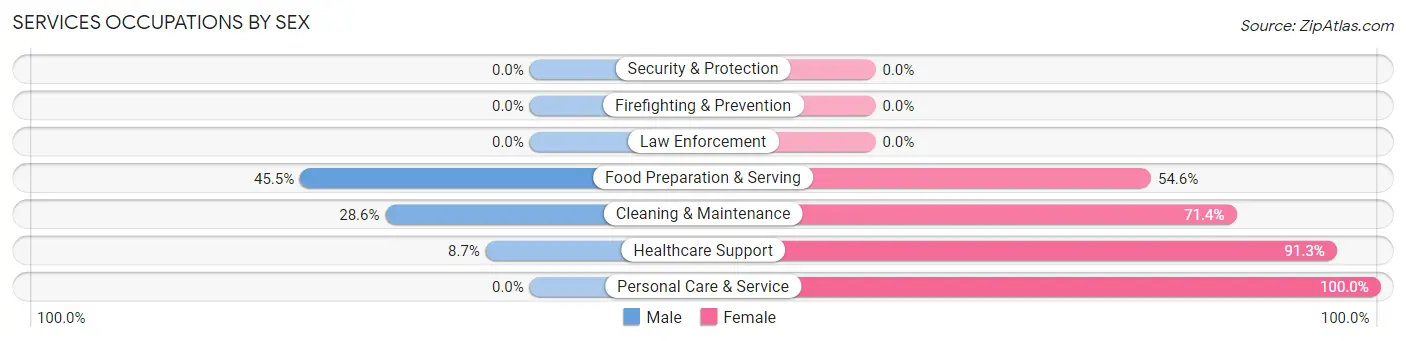
Services Occupations by Sex
Within the Services occupations in Reading, the most male-oriented occupations are Food Preparation & Serving (45.5%), Cleaning & Maintenance (28.6%), and Healthcare Support (8.7%), while the most female-oriented occupations are Personal Care & Service (100.0%), Healthcare Support (91.3%), and Cleaning & Maintenance (71.4%).
| Occupation | Male | Female |
| Healthcare Support | 4 (8.7%) | 42 (91.3%) |
| Security & Protection | 0 (0.0%) | 0 (0.0%) |
| Firefighting & Prevention | 0 (0.0%) | 0 (0.0%) |
| Law Enforcement | 0 (0.0%) | 0 (0.0%) |
| Food Preparation & Serving | 5 (45.5%) | 6 (54.5%) |
| Cleaning & Maintenance | 2 (28.6%) | 5 (71.4%) |
| Personal Care & Service | 0 (0.0%) | 13 (100.0%) |
| Total (Category) | 11 (14.3%) | 66 (85.7%) |
| Total (Overall) | 213 (48.3%) | 228 (51.7%) |
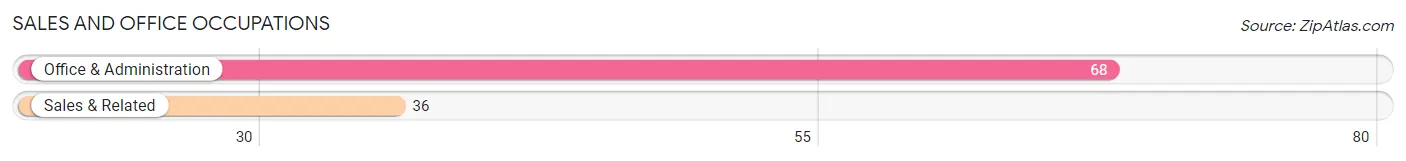
Sales and Office Occupations
The most common Sales and Office occupations in Reading are Office & Administration (68 | 15.4%), and Sales & Related (36 | 8.2%).
Sales and Office Occupations by Sex
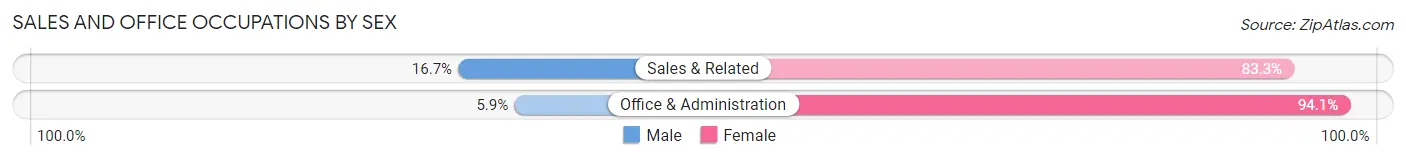
| Occupation | Male | Female |
| Sales & Related | 6 (16.7%) | 30 (83.3%) |
| Office & Administration | 4 (5.9%) | 64 (94.1%) |
| Total (Category) | 10 (9.6%) | 94 (90.4%) |
| Total (Overall) | 213 (48.3%) | 228 (51.7%) |
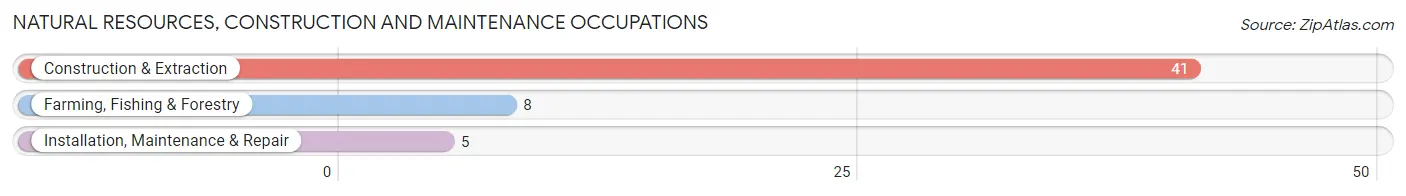
Natural Resources, Construction and Maintenance Occupations
The most common Natural Resources, Construction and Maintenance occupations in Reading are Construction & Extraction (41 | 9.3%), Farming, Fishing & Forestry (8 | 1.8%), and Installation, Maintenance & Repair (5 | 1.1%).
Natural Resources, Construction and Maintenance Occupations by Sex
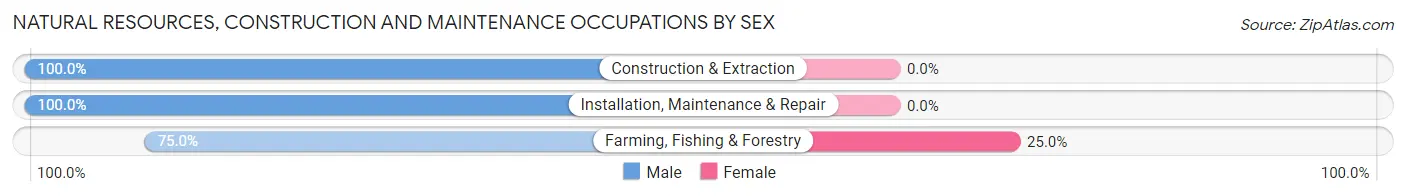
| Occupation | Male | Female |
| Farming, Fishing & Forestry | 6 (75.0%) | 2 (25.0%) |
| Construction & Extraction | 41 (100.0%) | 0 (0.0%) |
| Installation, Maintenance & Repair | 5 (100.0%) | 0 (0.0%) |
| Total (Category) | 52 (96.3%) | 2 (3.7%) |
| Total (Overall) | 213 (48.3%) | 228 (51.7%) |
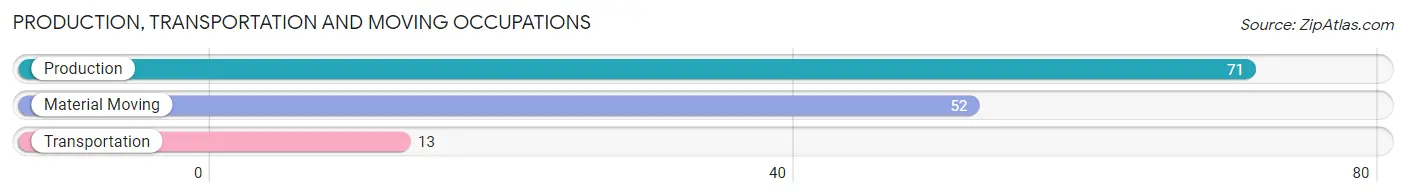
Production, Transportation and Moving Occupations
The most common Production, Transportation and Moving occupations in Reading are Production (71 | 16.1%), Material Moving (52 | 11.8%), and Transportation (13 | 2.9%).
Production, Transportation and Moving Occupations by Sex
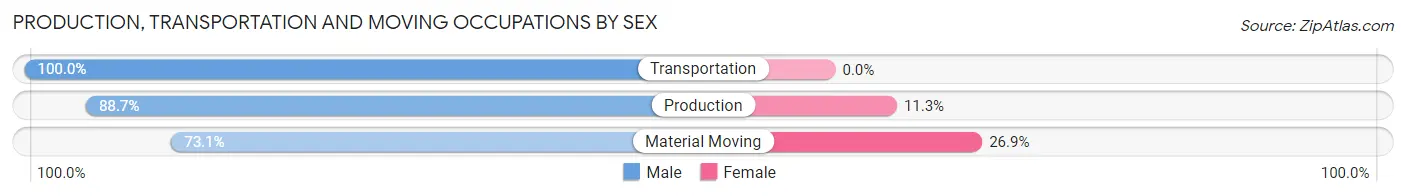
| Occupation | Male | Female |
| Production | 63 (88.7%) | 8 (11.3%) |
| Transportation | 13 (100.0%) | 0 (0.0%) |
| Material Moving | 38 (73.1%) | 14 (26.9%) |
| Total (Category) | 114 (83.8%) | 22 (16.2%) |
| Total (Overall) | 213 (48.3%) | 228 (51.7%) |
Employment Industries by Sex in Reading
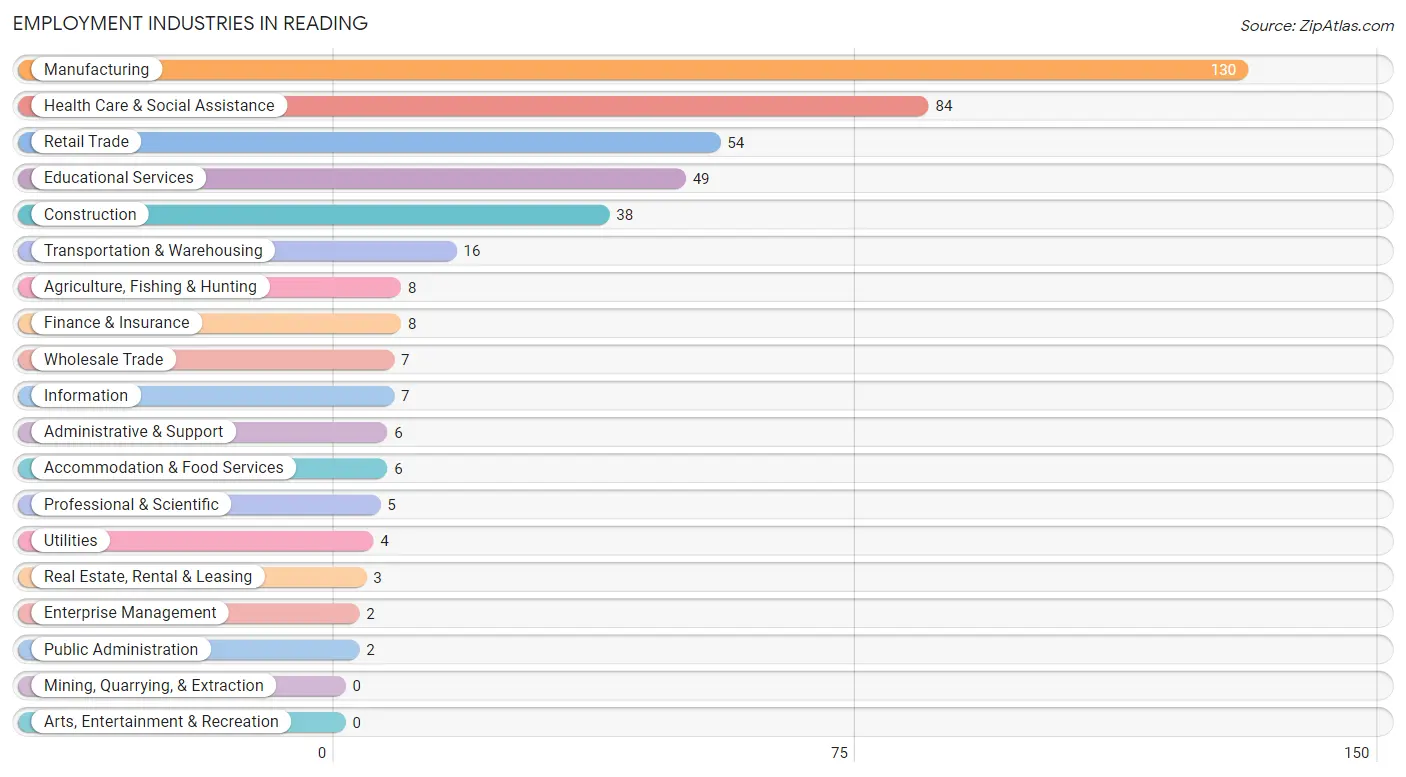
Employment Industries in Reading
The major employment industries in Reading include Manufacturing (130 | 29.5%), Health Care & Social Assistance (84 | 19.1%), Retail Trade (54 | 12.2%), Educational Services (49 | 11.1%), and Construction (38 | 8.6%).
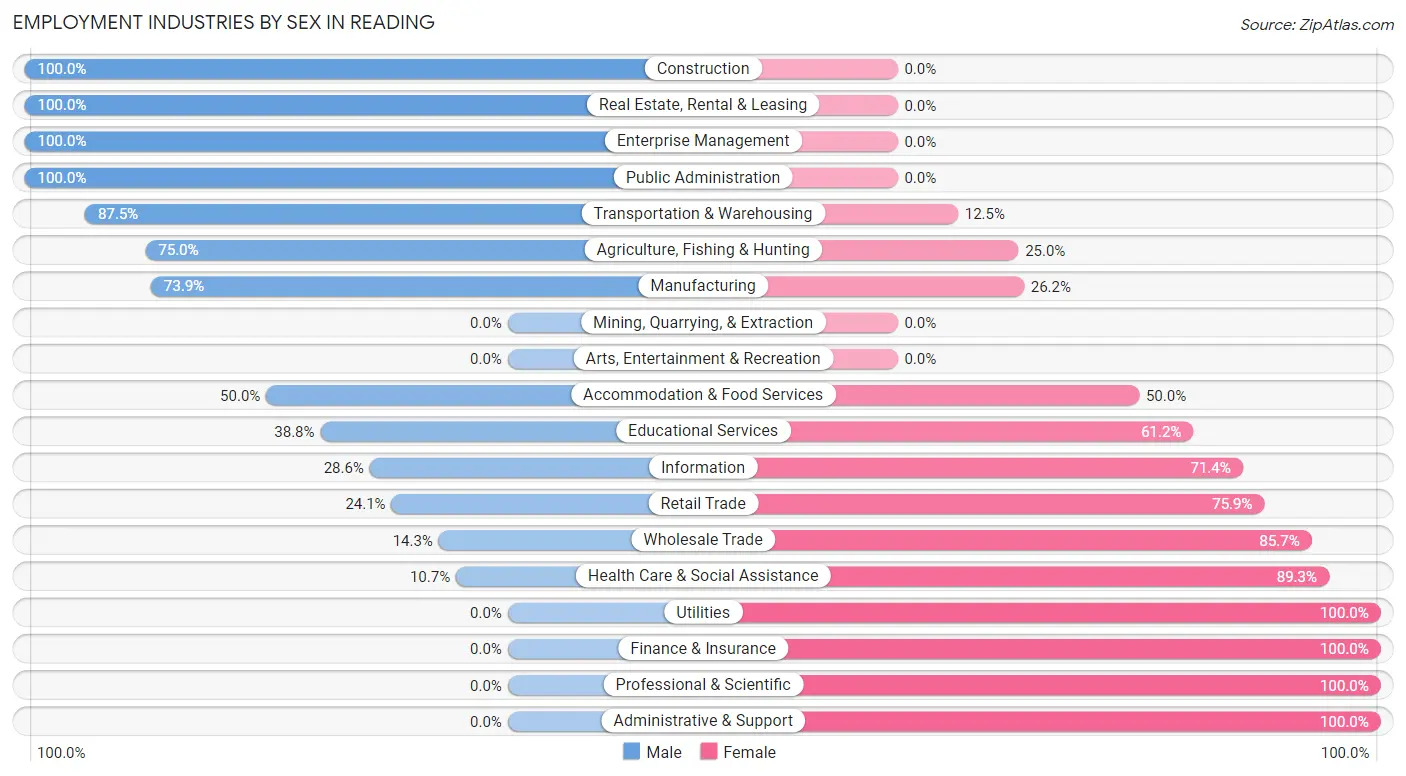
Employment Industries by Sex in Reading
The Reading industries that see more men than women are Construction (100.0%), Real Estate, Rental & Leasing (100.0%), and Enterprise Management (100.0%), whereas the industries that tend to have a higher number of women are Utilities (100.0%), Finance & Insurance (100.0%), and Professional & Scientific (100.0%).
| Industry | Male | Female |
| Agriculture, Fishing & Hunting | 6 (75.0%) | 2 (25.0%) |
| Mining, Quarrying, & Extraction | 0 (0.0%) | 0 (0.0%) |
| Construction | 38 (100.0%) | 0 (0.0%) |
| Manufacturing | 96 (73.9%) | 34 (26.2%) |
| Wholesale Trade | 1 (14.3%) | 6 (85.7%) |
| Retail Trade | 13 (24.1%) | 41 (75.9%) |
| Transportation & Warehousing | 14 (87.5%) | 2 (12.5%) |
| Utilities | 0 (0.0%) | 4 (100.0%) |
| Information | 2 (28.6%) | 5 (71.4%) |
| Finance & Insurance | 0 (0.0%) | 8 (100.0%) |
| Real Estate, Rental & Leasing | 3 (100.0%) | 0 (0.0%) |
| Professional & Scientific | 0 (0.0%) | 5 (100.0%) |
| Enterprise Management | 2 (100.0%) | 0 (0.0%) |
| Administrative & Support | 0 (0.0%) | 6 (100.0%) |
| Educational Services | 19 (38.8%) | 30 (61.2%) |
| Health Care & Social Assistance | 9 (10.7%) | 75 (89.3%) |
| Arts, Entertainment & Recreation | 0 (0.0%) | 0 (0.0%) |
| Accommodation & Food Services | 3 (50.0%) | 3 (50.0%) |
| Public Administration | 2 (100.0%) | 0 (0.0%) |
| Total | 213 (48.3%) | 228 (51.7%) |
Education in Reading
School Enrollment in Reading
The most common levels of schooling among the 274 students in Reading are elementary school (142 | 51.8%), high school (60 | 21.9%), and middle school (40 | 14.6%).
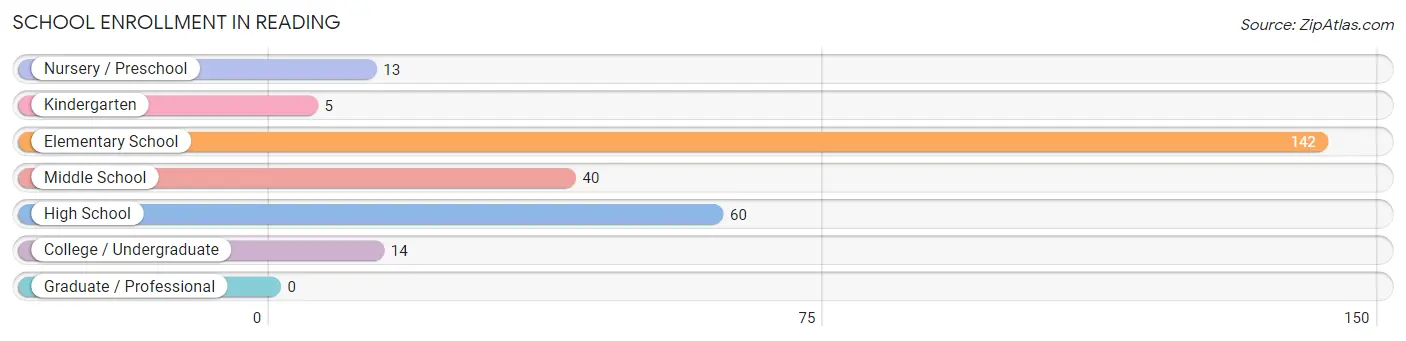
| School Level | # Students | % Students |
| Nursery / Preschool | 13 | 4.7% |
| Kindergarten | 5 | 1.8% |
| Elementary School | 142 | 51.8% |
| Middle School | 40 | 14.6% |
| High School | 60 | 21.9% |
| College / Undergraduate | 14 | 5.1% |
| Graduate / Professional | 0 | 0.0% |
| Total | 274 | 100.0% |
School Enrollment by Age by Funding Source in Reading
Out of a total of 274 students who are enrolled in schools in Reading, 119 (43.4%) attend a private institution, while the remaining 155 (56.6%) are enrolled in public schools. The age group of 5 to 9 year old has the highest likelihood of being enrolled in private schools, with 75 (62.0% in the age bracket) enrolled. Conversely, the age group of 3 to 4 year olds has the lowest likelihood of being enrolled in a private school, with 2 (100.0% in the age bracket) attending a public institution.
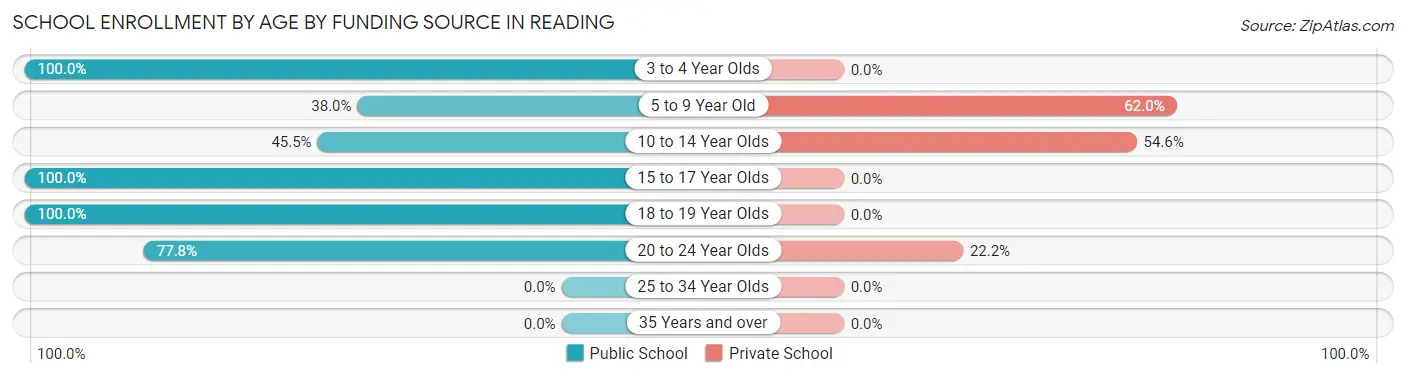
| Age Bracket | Public School | Private School |
| 3 to 4 Year Olds | 2 (100.0%) | 0 (0.0%) |
| 5 to 9 Year Old | 46 (38.0%) | 75 (62.0%) |
| 10 to 14 Year Olds | 35 (45.5%) | 42 (54.5%) |
| 15 to 17 Year Olds | 53 (100.0%) | 0 (0.0%) |
| 18 to 19 Year Olds | 12 (100.0%) | 0 (0.0%) |
| 20 to 24 Year Olds | 7 (77.8%) | 2 (22.2%) |
| 25 to 34 Year Olds | 0 (0.0%) | 0 (0.0%) |
| 35 Years and over | 0 (0.0%) | 0 (0.0%) |
| Total | 155 (56.6%) | 119 (43.4%) |
Educational Attainment by Field of Study in Reading
Education (15 | 16.1%), liberal arts & history (12 | 12.9%), arts & humanities (12 | 12.9%), bio, nature & agricultural (11 | 11.8%), and science & technology (9 | 9.7%) are the most common fields of study among 93 individuals in Reading who have obtained a bachelor's degree or higher.
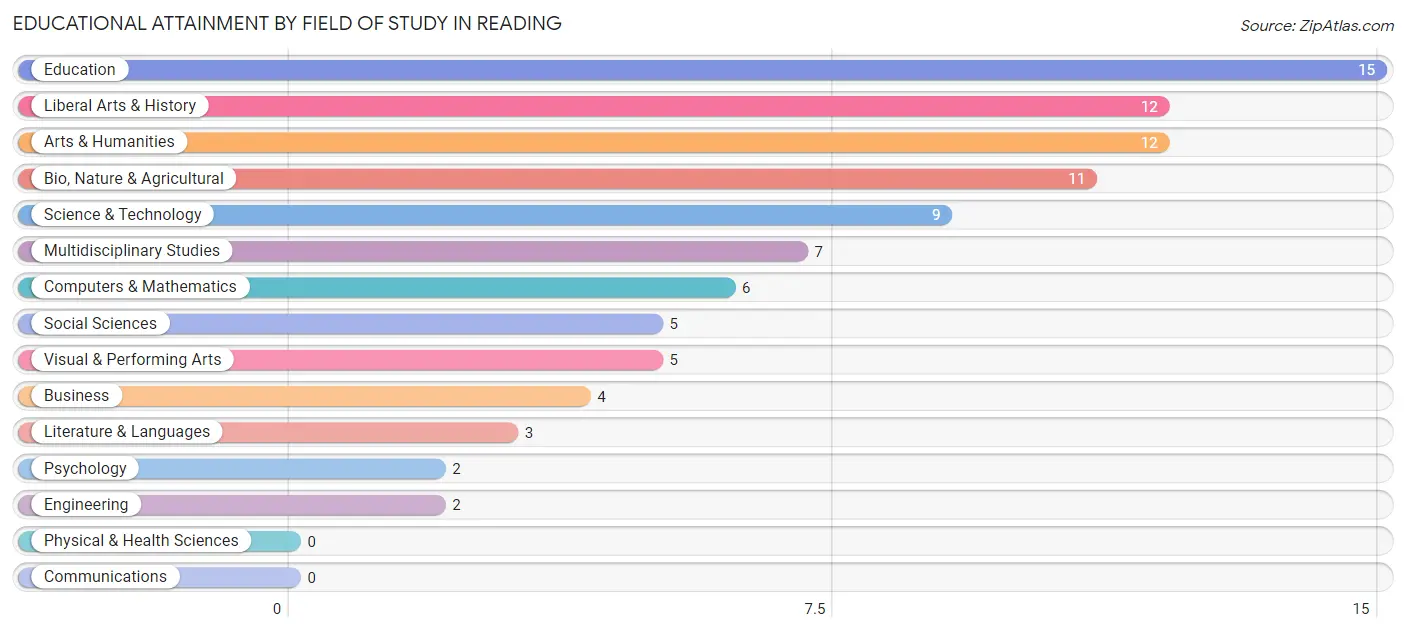
| Field of Study | # Graduates | % Graduates |
| Computers & Mathematics | 6 | 6.5% |
| Bio, Nature & Agricultural | 11 | 11.8% |
| Physical & Health Sciences | 0 | 0.0% |
| Psychology | 2 | 2.1% |
| Social Sciences | 5 | 5.4% |
| Engineering | 2 | 2.1% |
| Multidisciplinary Studies | 7 | 7.5% |
| Science & Technology | 9 | 9.7% |
| Business | 4 | 4.3% |
| Education | 15 | 16.1% |
| Literature & Languages | 3 | 3.2% |
| Liberal Arts & History | 12 | 12.9% |
| Visual & Performing Arts | 5 | 5.4% |
| Communications | 0 | 0.0% |
| Arts & Humanities | 12 | 12.9% |
| Total | 93 | 100.0% |
Transportation & Commute in Reading
Vehicle Availability by Sex in Reading
The most prevalent vehicle ownership categories in Reading are males with 2 vehicles (72, accounting for 34.0%) and females with 2 vehicles (126, making up 31.9%).
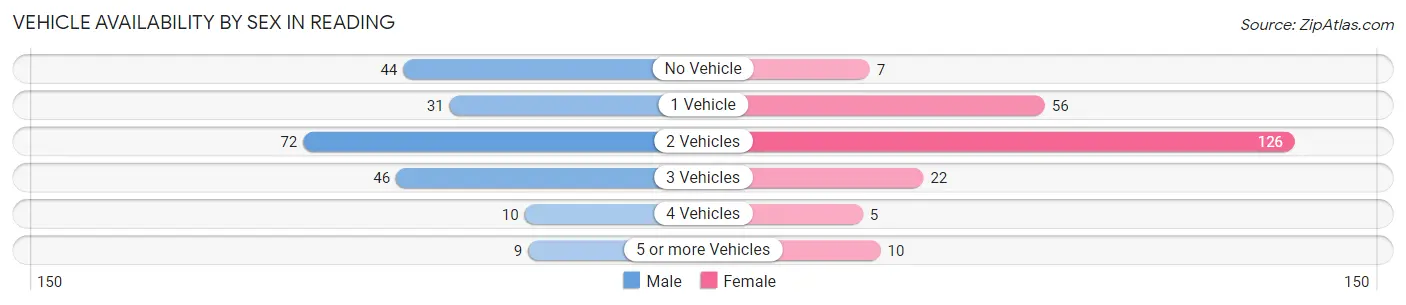
| Vehicles Available | Male | Female |
| No Vehicle | 44 (20.7%) | 7 (3.1%) |
| 1 Vehicle | 31 (14.6%) | 56 (24.8%) |
| 2 Vehicles | 72 (34.0%) | 126 (55.7%) |
| 3 Vehicles | 46 (21.7%) | 22 (9.7%) |
| 4 Vehicles | 10 (4.7%) | 5 (2.2%) |
| 5 or more Vehicles | 9 (4.3%) | 10 (4.4%) |
| Total | 212 (100.0%) | 226 (100.0%) |
Commute Time in Reading
The most frequently occuring commute durations in Reading are 20 to 24 minutes (118 commuters, 30.5%), 30 to 34 minutes (67 commuters, 17.3%), and less than 5 minutes (66 commuters, 17.1%).
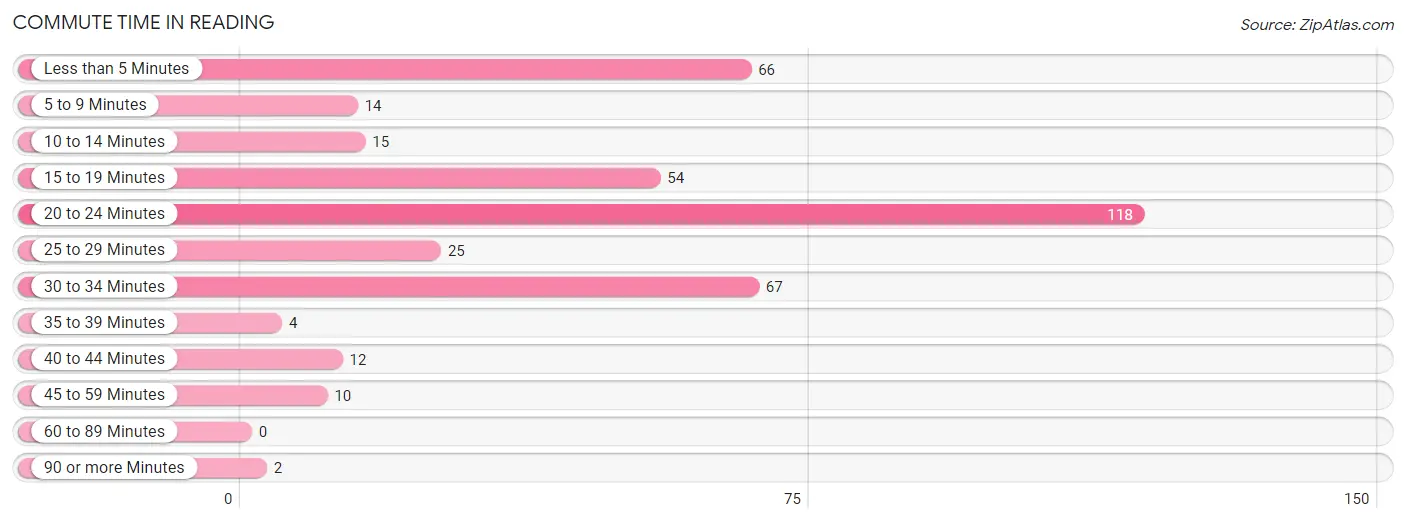
| Commute Time | # Commuters | % Commuters |
| Less than 5 Minutes | 66 | 17.1% |
| 5 to 9 Minutes | 14 | 3.6% |
| 10 to 14 Minutes | 15 | 3.9% |
| 15 to 19 Minutes | 54 | 14.0% |
| 20 to 24 Minutes | 118 | 30.5% |
| 25 to 29 Minutes | 25 | 6.5% |
| 30 to 34 Minutes | 67 | 17.3% |
| 35 to 39 Minutes | 4 | 1.0% |
| 40 to 44 Minutes | 12 | 3.1% |
| 45 to 59 Minutes | 10 | 2.6% |
| 60 to 89 Minutes | 0 | 0.0% |
| 90 or more Minutes | 2 | 0.5% |
Commute Time by Sex in Reading
The most common commute times in Reading are 20 to 24 minutes (47 commuters, 27.0%) for males and 20 to 24 minutes (71 commuters, 33.3%) for females.
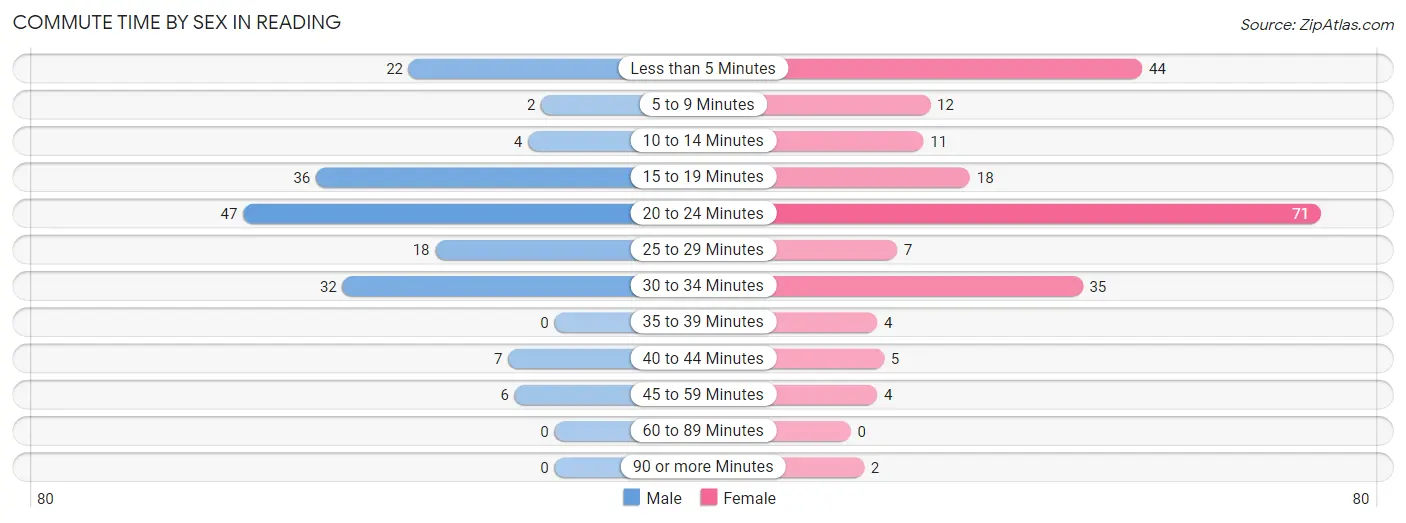
| Commute Time | Male | Female |
| Less than 5 Minutes | 22 (12.6%) | 44 (20.7%) |
| 5 to 9 Minutes | 2 (1.1%) | 12 (5.6%) |
| 10 to 14 Minutes | 4 (2.3%) | 11 (5.2%) |
| 15 to 19 Minutes | 36 (20.7%) | 18 (8.5%) |
| 20 to 24 Minutes | 47 (27.0%) | 71 (33.3%) |
| 25 to 29 Minutes | 18 (10.3%) | 7 (3.3%) |
| 30 to 34 Minutes | 32 (18.4%) | 35 (16.4%) |
| 35 to 39 Minutes | 0 (0.0%) | 4 (1.9%) |
| 40 to 44 Minutes | 7 (4.0%) | 5 (2.4%) |
| 45 to 59 Minutes | 6 (3.5%) | 4 (1.9%) |
| 60 to 89 Minutes | 0 (0.0%) | 0 (0.0%) |
| 90 or more Minutes | 0 (0.0%) | 2 (0.9%) |
Time of Departure to Work by Sex in Reading
The most frequent times of departure to work in Reading are 4:00 PM to 11:59 PM (42, 24.1%) for males and 7:30 AM to 7:59 AM (40, 18.8%) for females.
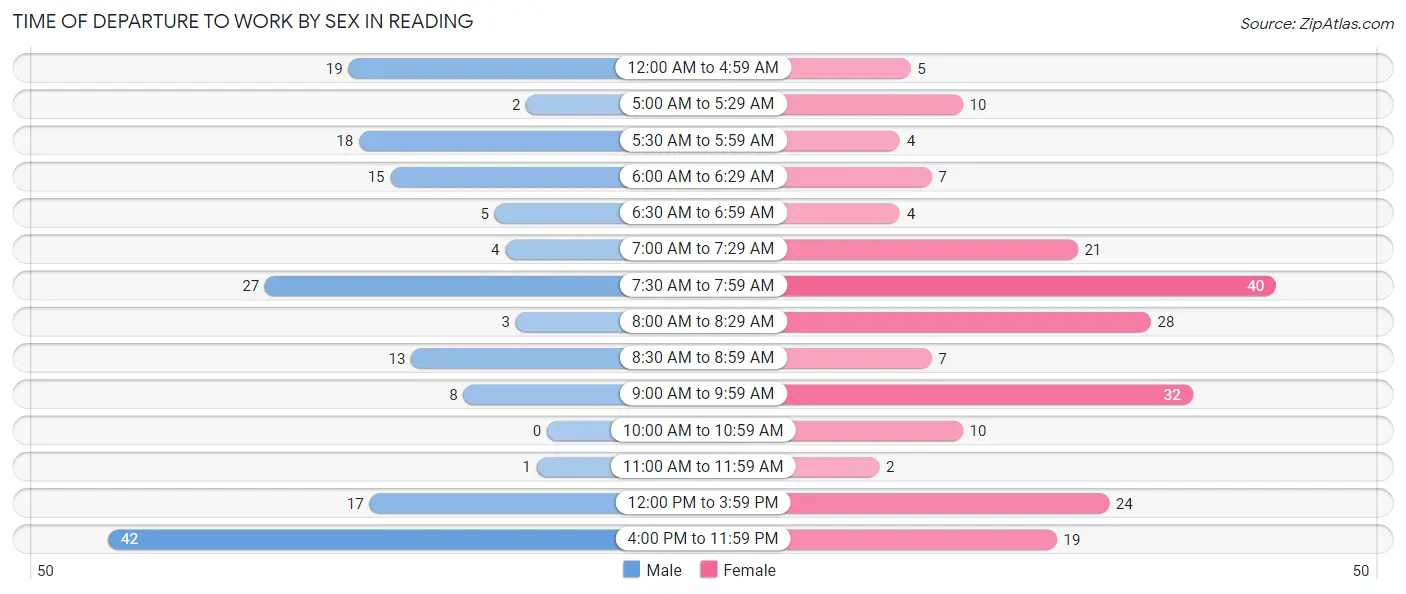
| Time of Departure | Male | Female |
| 12:00 AM to 4:59 AM | 19 (10.9%) | 5 (2.4%) |
| 5:00 AM to 5:29 AM | 2 (1.1%) | 10 (4.7%) |
| 5:30 AM to 5:59 AM | 18 (10.3%) | 4 (1.9%) |
| 6:00 AM to 6:29 AM | 15 (8.6%) | 7 (3.3%) |
| 6:30 AM to 6:59 AM | 5 (2.9%) | 4 (1.9%) |
| 7:00 AM to 7:29 AM | 4 (2.3%) | 21 (9.9%) |
| 7:30 AM to 7:59 AM | 27 (15.5%) | 40 (18.8%) |
| 8:00 AM to 8:29 AM | 3 (1.7%) | 28 (13.2%) |
| 8:30 AM to 8:59 AM | 13 (7.5%) | 7 (3.3%) |
| 9:00 AM to 9:59 AM | 8 (4.6%) | 32 (15.0%) |
| 10:00 AM to 10:59 AM | 0 (0.0%) | 10 (4.7%) |
| 11:00 AM to 11:59 AM | 1 (0.6%) | 2 (0.9%) |
| 12:00 PM to 3:59 PM | 17 (9.8%) | 24 (11.3%) |
| 4:00 PM to 11:59 PM | 42 (24.1%) | 19 (8.9%) |
| Total | 174 (100.0%) | 213 (100.0%) |
Housing Occupancy in Reading
Occupancy by Ownership in Reading
Of the total 367 dwellings in Reading, owner-occupied units account for 243 (66.2%), while renter-occupied units make up 124 (33.8%).
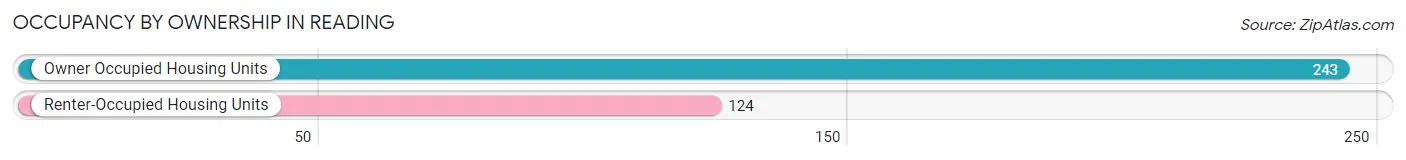
| Occupancy | # Housing Units | % Housing Units |
| Owner Occupied Housing Units | 243 | 66.2% |
| Renter-Occupied Housing Units | 124 | 33.8% |
| Total Occupied Housing Units | 367 | 100.0% |
Occupancy by Household Size in Reading
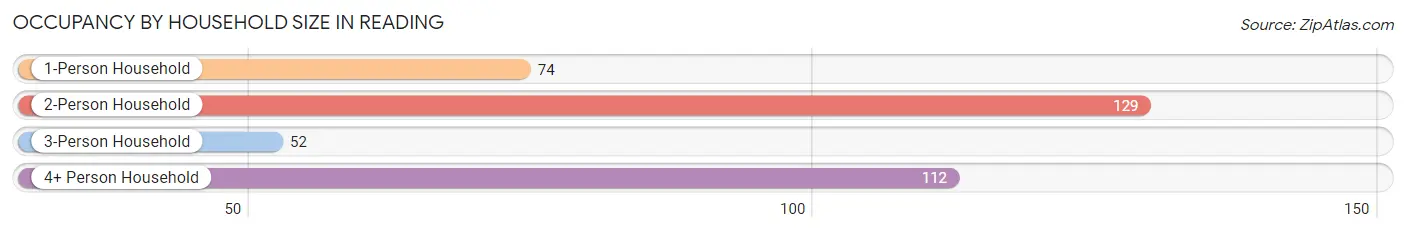
| Household Size | # Housing Units | % Housing Units |
| 1-Person Household | 74 | 20.2% |
| 2-Person Household | 129 | 35.1% |
| 3-Person Household | 52 | 14.2% |
| 4+ Person Household | 112 | 30.5% |
| Total Housing Units | 367 | 100.0% |
Occupancy by Ownership by Household Size in Reading
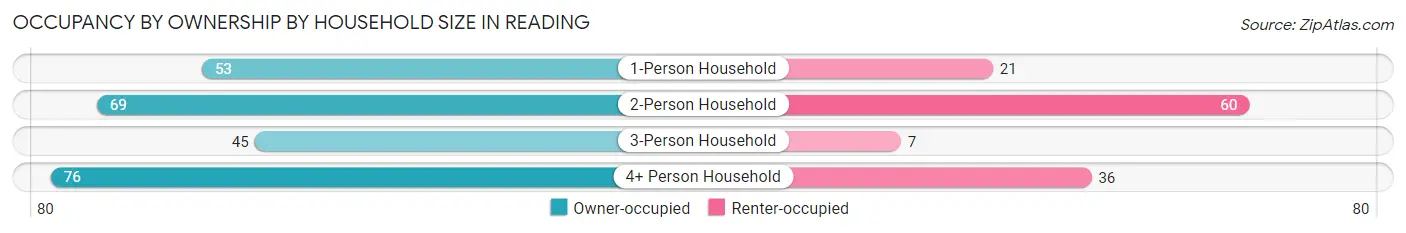
| Household Size | Owner-occupied | Renter-occupied |
| 1-Person Household | 53 (71.6%) | 21 (28.4%) |
| 2-Person Household | 69 (53.5%) | 60 (46.5%) |
| 3-Person Household | 45 (86.5%) | 7 (13.5%) |
| 4+ Person Household | 76 (67.9%) | 36 (32.1%) |
| Total Housing Units | 243 (66.2%) | 124 (33.8%) |
Occupancy by Educational Attainment in Reading
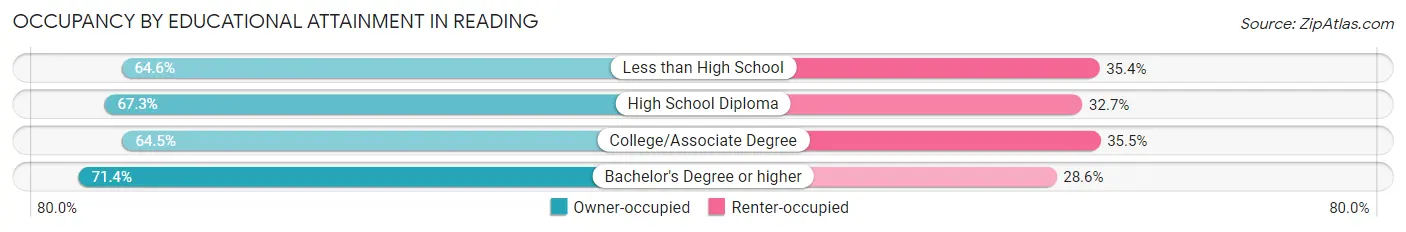
| Household Size | Owner-occupied | Renter-occupied |
| Less than High School | 42 (64.6%) | 23 (35.4%) |
| High School Diploma | 68 (67.3%) | 33 (32.7%) |
| College/Associate Degree | 98 (64.5%) | 54 (35.5%) |
| Bachelor's Degree or higher | 35 (71.4%) | 14 (28.6%) |
Occupancy by Age of Householder in Reading
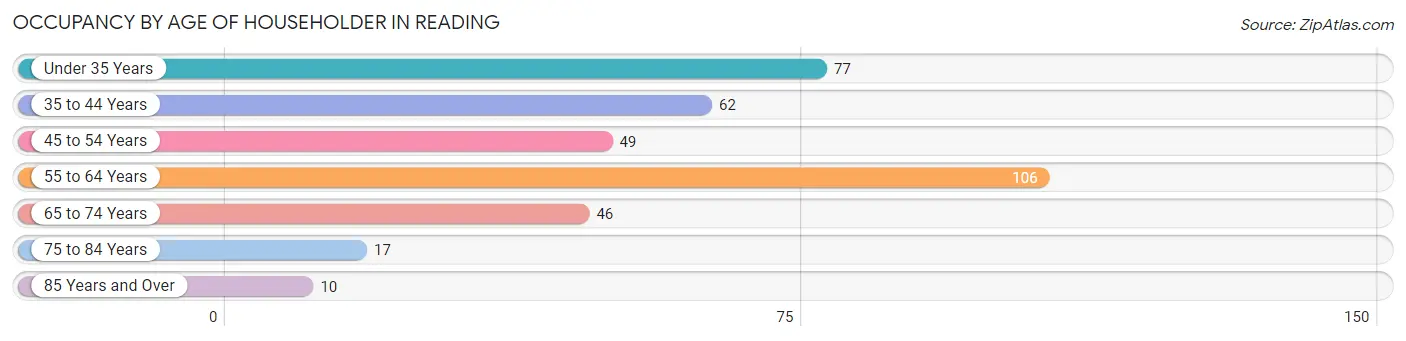
| Age Bracket | # Households | % Households |
| Under 35 Years | 77 | 21.0% |
| 35 to 44 Years | 62 | 16.9% |
| 45 to 54 Years | 49 | 13.4% |
| 55 to 64 Years | 106 | 28.9% |
| 65 to 74 Years | 46 | 12.5% |
| 75 to 84 Years | 17 | 4.6% |
| 85 Years and Over | 10 | 2.7% |
| Total | 367 | 100.0% |
Housing Finances in Reading
Median Income by Occupancy in Reading
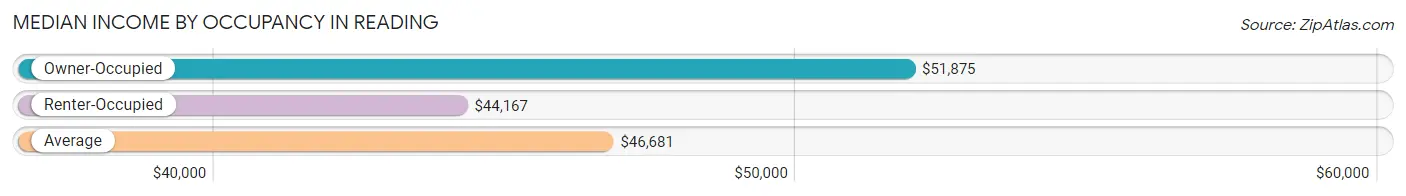
| Occupancy Type | # Households | Median Income |
| Owner-Occupied | 243 (66.2%) | $51,875 |
| Renter-Occupied | 124 (33.8%) | $44,167 |
| Average | 367 (100.0%) | $46,681 |
Occupancy by Householder Income Bracket in Reading
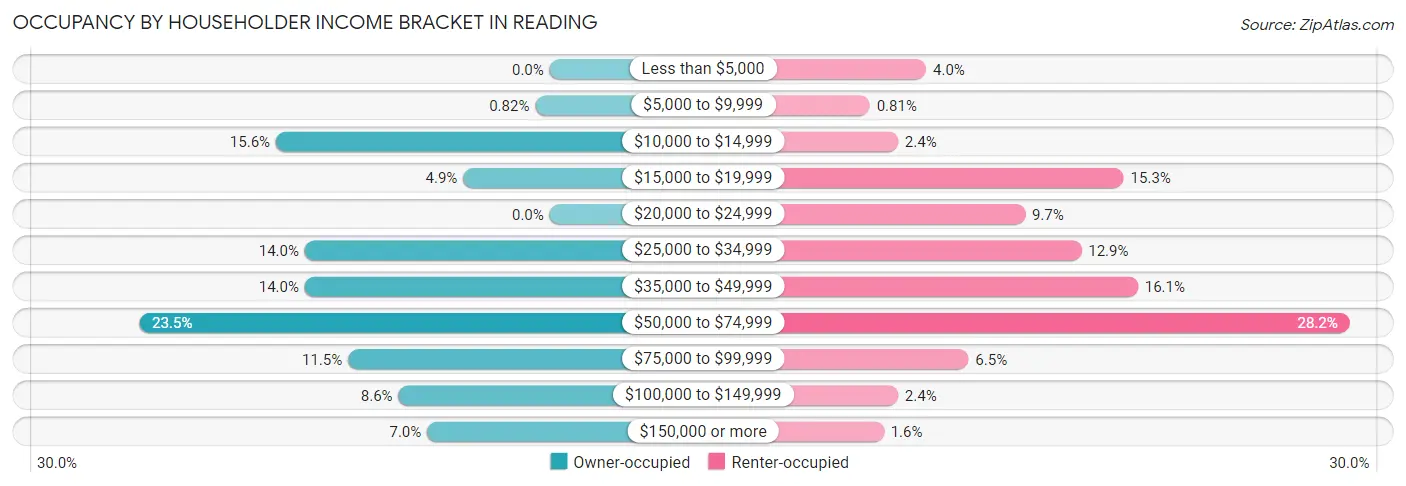
| Income Bracket | Owner-occupied | Renter-occupied |
| Less than $5,000 | 0 (0.0%) | 5 (4.0%) |
| $5,000 to $9,999 | 2 (0.8%) | 1 (0.8%) |
| $10,000 to $14,999 | 38 (15.6%) | 3 (2.4%) |
| $15,000 to $19,999 | 12 (4.9%) | 19 (15.3%) |
| $20,000 to $24,999 | 0 (0.0%) | 12 (9.7%) |
| $25,000 to $34,999 | 34 (14.0%) | 16 (12.9%) |
| $35,000 to $49,999 | 34 (14.0%) | 20 (16.1%) |
| $50,000 to $74,999 | 57 (23.5%) | 35 (28.2%) |
| $75,000 to $99,999 | 28 (11.5%) | 8 (6.5%) |
| $100,000 to $149,999 | 21 (8.6%) | 3 (2.4%) |
| $150,000 or more | 17 (7.0%) | 2 (1.6%) |
| Total | 243 (100.0%) | 124 (100.0%) |
Monthly Housing Cost Tiers in Reading
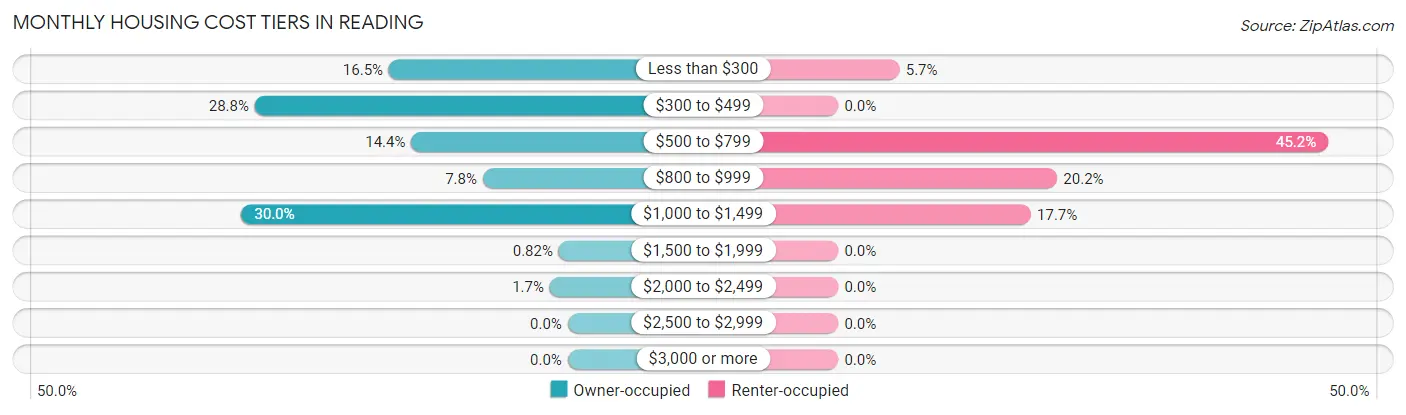
| Monthly Cost | Owner-occupied | Renter-occupied |
| Less than $300 | 40 (16.5%) | 7 (5.7%) |
| $300 to $499 | 70 (28.8%) | 0 (0.0%) |
| $500 to $799 | 35 (14.4%) | 56 (45.2%) |
| $800 to $999 | 19 (7.8%) | 25 (20.2%) |
| $1,000 to $1,499 | 73 (30.0%) | 22 (17.7%) |
| $1,500 to $1,999 | 2 (0.8%) | 0 (0.0%) |
| $2,000 to $2,499 | 4 (1.7%) | 0 (0.0%) |
| $2,500 to $2,999 | 0 (0.0%) | 0 (0.0%) |
| $3,000 or more | 0 (0.0%) | 0 (0.0%) |
| Total | 243 (100.0%) | 124 (100.0%) |
Physical Housing Characteristics in Reading
Housing Structures in Reading
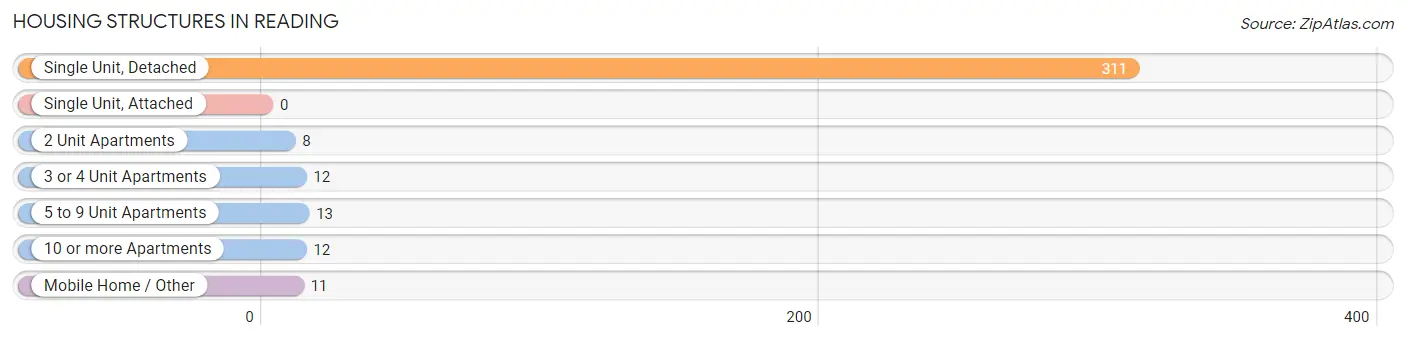
| Structure Type | # Housing Units | % Housing Units |
| Single Unit, Detached | 311 | 84.7% |
| Single Unit, Attached | 0 | 0.0% |
| 2 Unit Apartments | 8 | 2.2% |
| 3 or 4 Unit Apartments | 12 | 3.3% |
| 5 to 9 Unit Apartments | 13 | 3.5% |
| 10 or more Apartments | 12 | 3.3% |
| Mobile Home / Other | 11 | 3.0% |
| Total | 367 | 100.0% |
Housing Structures by Occupancy in Reading
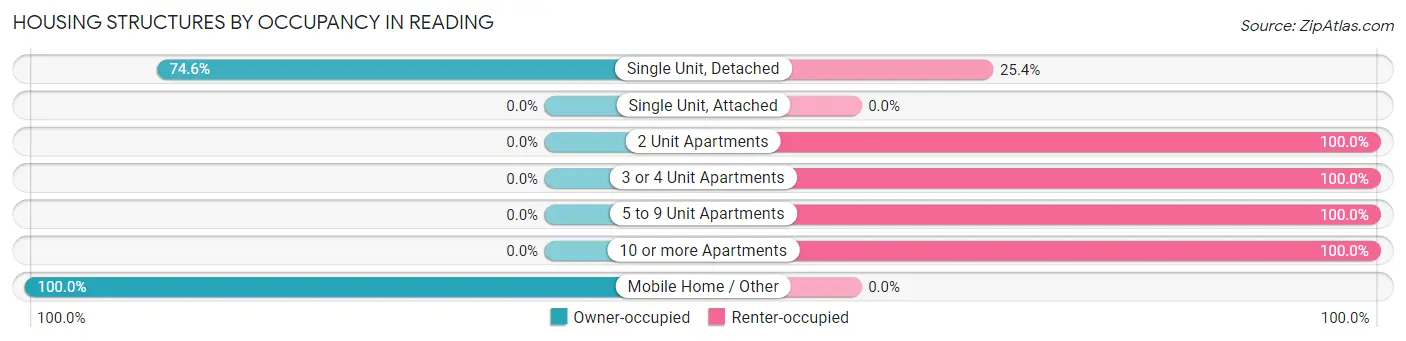
| Structure Type | Owner-occupied | Renter-occupied |
| Single Unit, Detached | 232 (74.6%) | 79 (25.4%) |
| Single Unit, Attached | 0 (0.0%) | 0 (0.0%) |
| 2 Unit Apartments | 0 (0.0%) | 8 (100.0%) |
| 3 or 4 Unit Apartments | 0 (0.0%) | 12 (100.0%) |
| 5 to 9 Unit Apartments | 0 (0.0%) | 13 (100.0%) |
| 10 or more Apartments | 0 (0.0%) | 12 (100.0%) |
| Mobile Home / Other | 11 (100.0%) | 0 (0.0%) |
| Total | 243 (66.2%) | 124 (33.8%) |
Housing Structures by Number of Rooms in Reading
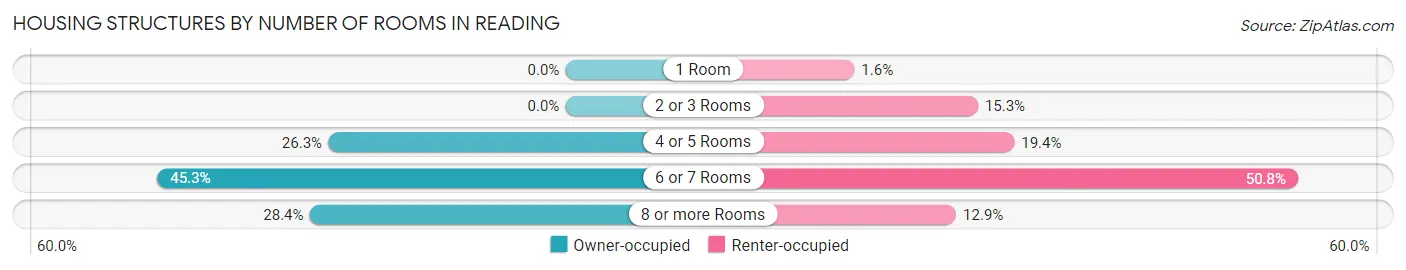
| Number of Rooms | Owner-occupied | Renter-occupied |
| 1 Room | 0 (0.0%) | 2 (1.6%) |
| 2 or 3 Rooms | 0 (0.0%) | 19 (15.3%) |
| 4 or 5 Rooms | 64 (26.3%) | 24 (19.4%) |
| 6 or 7 Rooms | 110 (45.3%) | 63 (50.8%) |
| 8 or more Rooms | 69 (28.4%) | 16 (12.9%) |
| Total | 243 (100.0%) | 124 (100.0%) |
Housing Structure by Heating Type in Reading
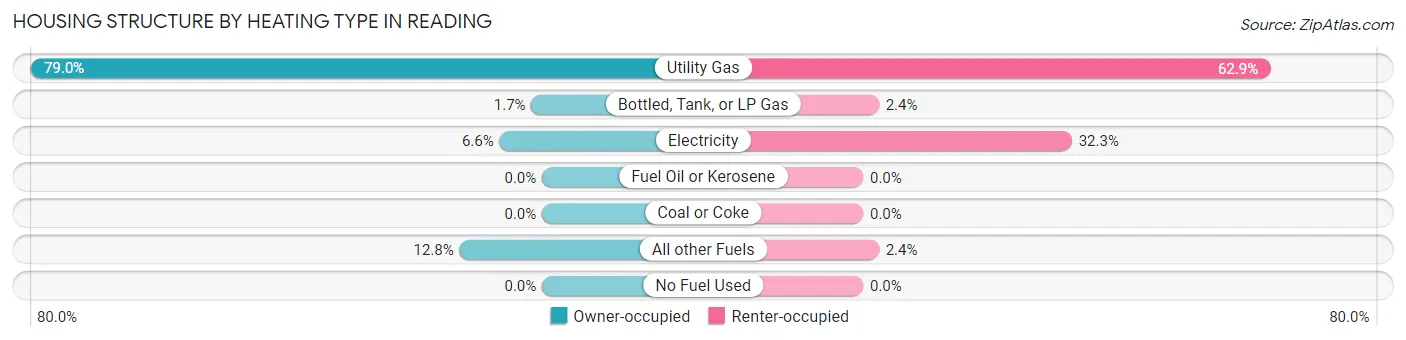
| Heating Type | Owner-occupied | Renter-occupied |
| Utility Gas | 192 (79.0%) | 78 (62.9%) |
| Bottled, Tank, or LP Gas | 4 (1.7%) | 3 (2.4%) |
| Electricity | 16 (6.6%) | 40 (32.3%) |
| Fuel Oil or Kerosene | 0 (0.0%) | 0 (0.0%) |
| Coal or Coke | 0 (0.0%) | 0 (0.0%) |
| All other Fuels | 31 (12.8%) | 3 (2.4%) |
| No Fuel Used | 0 (0.0%) | 0 (0.0%) |
| Total | 243 (100.0%) | 124 (100.0%) |
Household Vehicle Usage in Reading
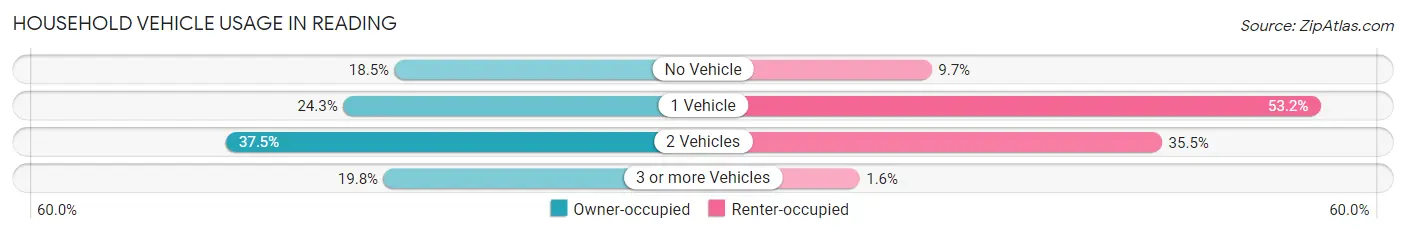
| Vehicles per Household | Owner-occupied | Renter-occupied |
| No Vehicle | 45 (18.5%) | 12 (9.7%) |
| 1 Vehicle | 59 (24.3%) | 66 (53.2%) |
| 2 Vehicles | 91 (37.4%) | 44 (35.5%) |
| 3 or more Vehicles | 48 (19.8%) | 2 (1.6%) |
| Total | 243 (100.0%) | 124 (100.0%) |
Real Estate & Mortgages in Reading
Real Estate and Mortgage Overview in Reading
| Characteristic | Without Mortgage | With Mortgage |
| Housing Units | 129 | 114 |
| Median Property Value | $100,900 | $80,600 |
| Median Household Income | $33,750 | $14 |
| Monthly Housing Costs | $412 | $0 |
| Real Estate Taxes | $1,033 | $5 |
Property Value by Mortgage Status in Reading
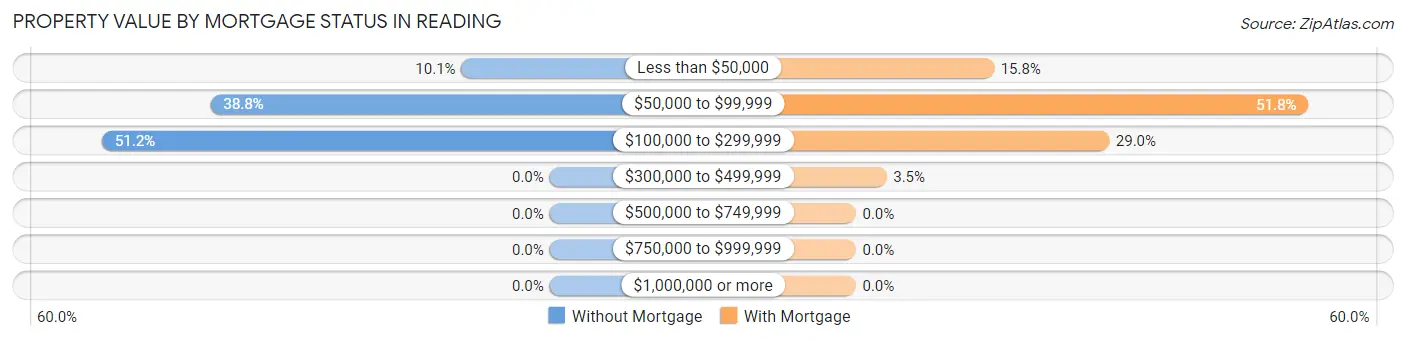
| Property Value | Without Mortgage | With Mortgage |
| Less than $50,000 | 13 (10.1%) | 18 (15.8%) |
| $50,000 to $99,999 | 50 (38.8%) | 59 (51.7%) |
| $100,000 to $299,999 | 66 (51.2%) | 33 (28.9%) |
| $300,000 to $499,999 | 0 (0.0%) | 4 (3.5%) |
| $500,000 to $749,999 | 0 (0.0%) | 0 (0.0%) |
| $750,000 to $999,999 | 0 (0.0%) | 0 (0.0%) |
| $1,000,000 or more | 0 (0.0%) | 0 (0.0%) |
| Total | 129 (100.0%) | 114 (100.0%) |
Household Income by Mortgage Status in Reading
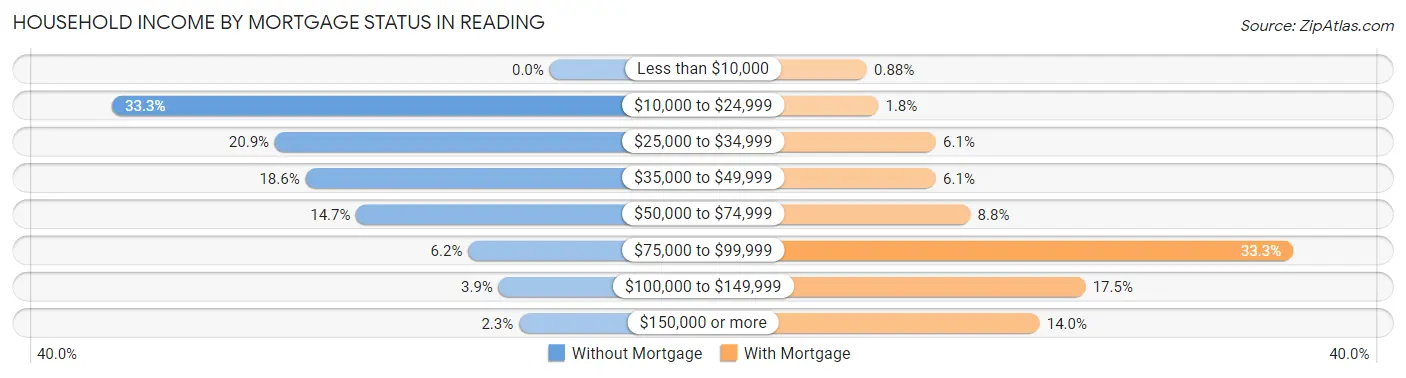
| Household Income | Without Mortgage | With Mortgage |
| Less than $10,000 | 0 (0.0%) | 1 (0.9%) |
| $10,000 to $24,999 | 43 (33.3%) | 2 (1.8%) |
| $25,000 to $34,999 | 27 (20.9%) | 7 (6.1%) |
| $35,000 to $49,999 | 24 (18.6%) | 7 (6.1%) |
| $50,000 to $74,999 | 19 (14.7%) | 10 (8.8%) |
| $75,000 to $99,999 | 8 (6.2%) | 38 (33.3%) |
| $100,000 to $149,999 | 5 (3.9%) | 20 (17.5%) |
| $150,000 or more | 3 (2.3%) | 16 (14.0%) |
| Total | 129 (100.0%) | 114 (100.0%) |
Property Value to Household Income Ratio in Reading
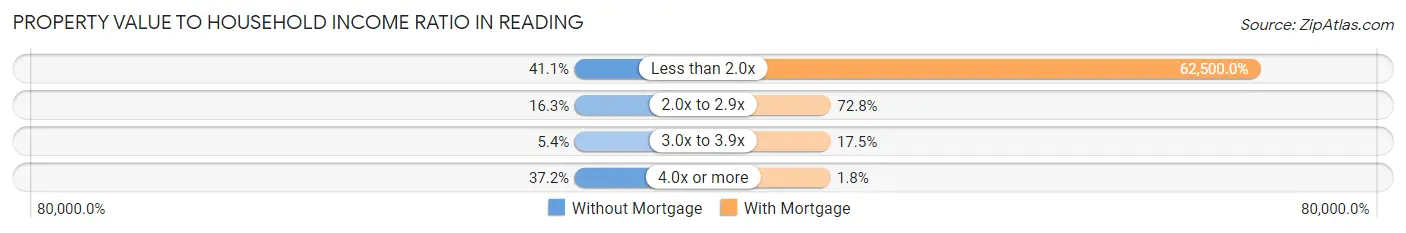
| Value-to-Income Ratio | Without Mortgage | With Mortgage |
| Less than 2.0x | 53 (41.1%) | 71,250 (62,500.0%) |
| 2.0x to 2.9x | 21 (16.3%) | 83 (72.8%) |
| 3.0x to 3.9x | 7 (5.4%) | 20 (17.5%) |
| 4.0x or more | 48 (37.2%) | 2 (1.8%) |
| Total | 129 (100.0%) | 114 (100.0%) |
Real Estate Taxes by Mortgage Status in Reading
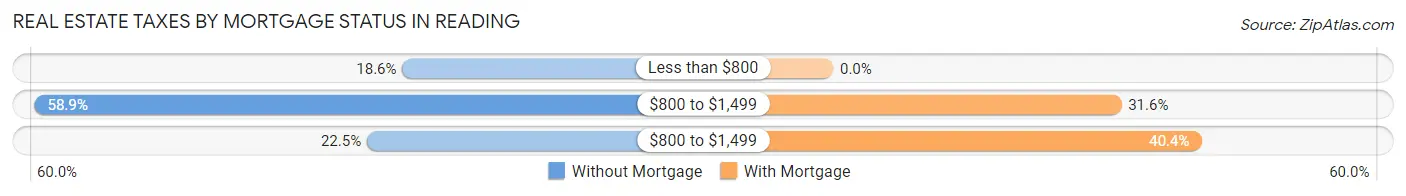
| Property Taxes | Without Mortgage | With Mortgage |
| Less than $800 | 24 (18.6%) | 0 (0.0%) |
| $800 to $1,499 | 76 (58.9%) | 36 (31.6%) |
| $800 to $1,499 | 29 (22.5%) | 46 (40.4%) |
| Total | 129 (100.0%) | 114 (100.0%) |
Health & Disability in Reading
Health Insurance Coverage by Age in Reading
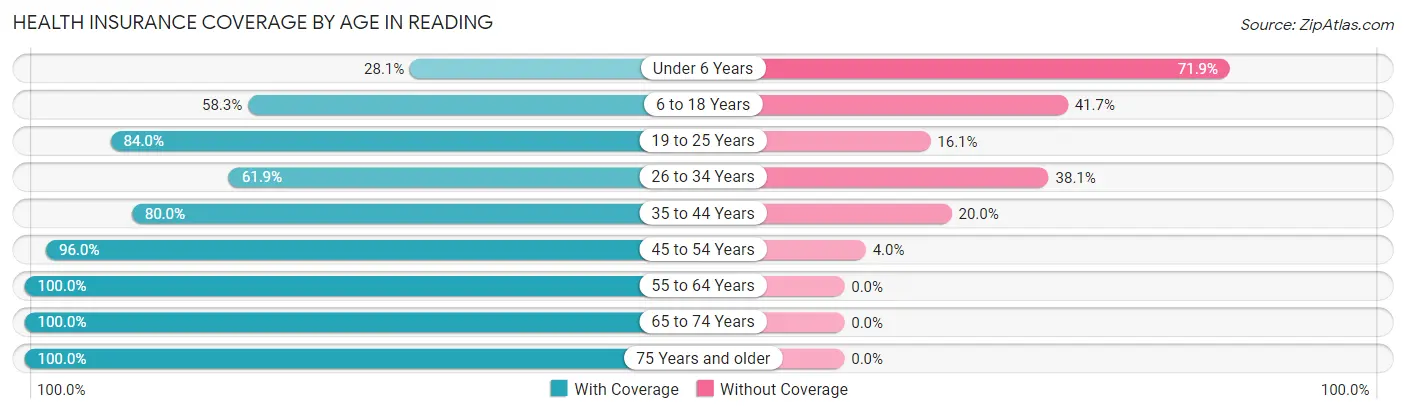
| Age Bracket | With Coverage | Without Coverage |
| Under 6 Years | 52 (28.1%) | 133 (71.9%) |
| 6 to 18 Years | 147 (58.3%) | 105 (41.7%) |
| 19 to 25 Years | 68 (84.0%) | 13 (16.1%) |
| 26 to 34 Years | 65 (61.9%) | 40 (38.1%) |
| 35 to 44 Years | 140 (80.0%) | 35 (20.0%) |
| 45 to 54 Years | 72 (96.0%) | 3 (4.0%) |
| 55 to 64 Years | 188 (100.0%) | 0 (0.0%) |
| 65 to 74 Years | 96 (100.0%) | 0 (0.0%) |
| 75 Years and older | 50 (100.0%) | 0 (0.0%) |
| Total | 878 (72.7%) | 329 (27.3%) |
Health Insurance Coverage by Citizenship Status in Reading
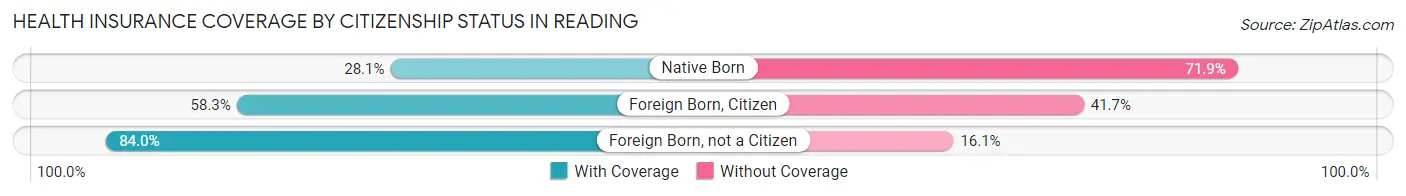
| Citizenship Status | With Coverage | Without Coverage |
| Native Born | 52 (28.1%) | 133 (71.9%) |
| Foreign Born, Citizen | 147 (58.3%) | 105 (41.7%) |
| Foreign Born, not a Citizen | 68 (84.0%) | 13 (16.1%) |
Health Insurance Coverage by Household Income in Reading
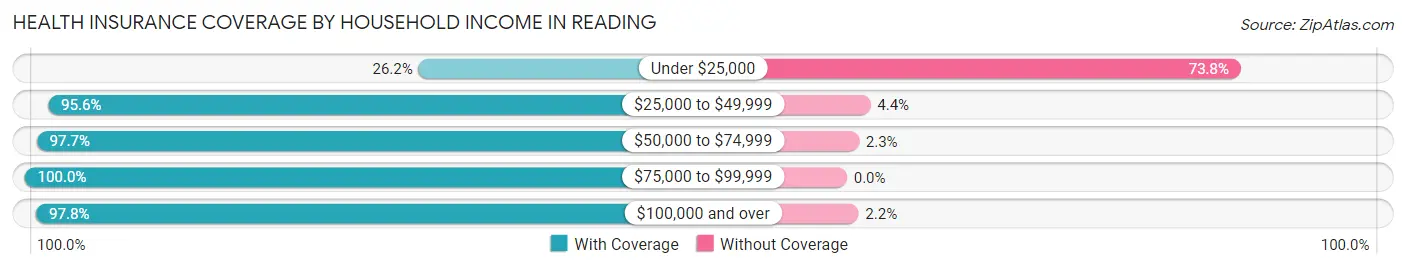
| Household Income | With Coverage | Without Coverage |
| Under $25,000 | 110 (26.2%) | 310 (73.8%) |
| $25,000 to $49,999 | 216 (95.6%) | 10 (4.4%) |
| $50,000 to $74,999 | 260 (97.7%) | 6 (2.3%) |
| $75,000 to $99,999 | 146 (100.0%) | 0 (0.0%) |
| $100,000 and over | 135 (97.8%) | 3 (2.2%) |
Public vs Private Health Insurance Coverage by Age in Reading
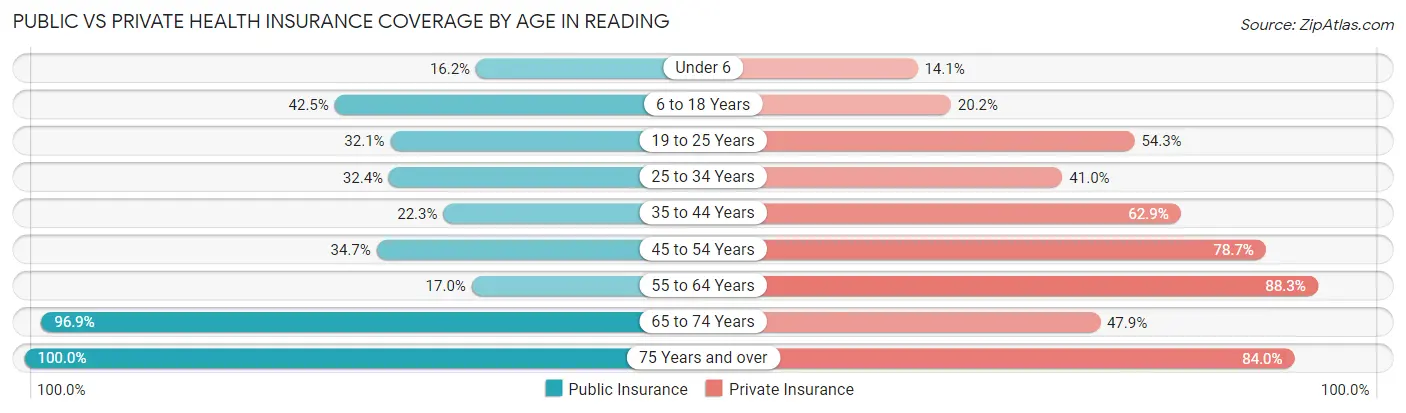
| Age Bracket | Public Insurance | Private Insurance |
| Under 6 | 30 (16.2%) | 26 (14.1%) |
| 6 to 18 Years | 107 (42.5%) | 51 (20.2%) |
| 19 to 25 Years | 26 (32.1%) | 44 (54.3%) |
| 25 to 34 Years | 34 (32.4%) | 43 (40.9%) |
| 35 to 44 Years | 39 (22.3%) | 110 (62.9%) |
| 45 to 54 Years | 26 (34.7%) | 59 (78.7%) |
| 55 to 64 Years | 32 (17.0%) | 166 (88.3%) |
| 65 to 74 Years | 93 (96.9%) | 46 (47.9%) |
| 75 Years and over | 50 (100.0%) | 42 (84.0%) |
| Total | 437 (36.2%) | 587 (48.6%) |
Disability Status by Sex by Age in Reading
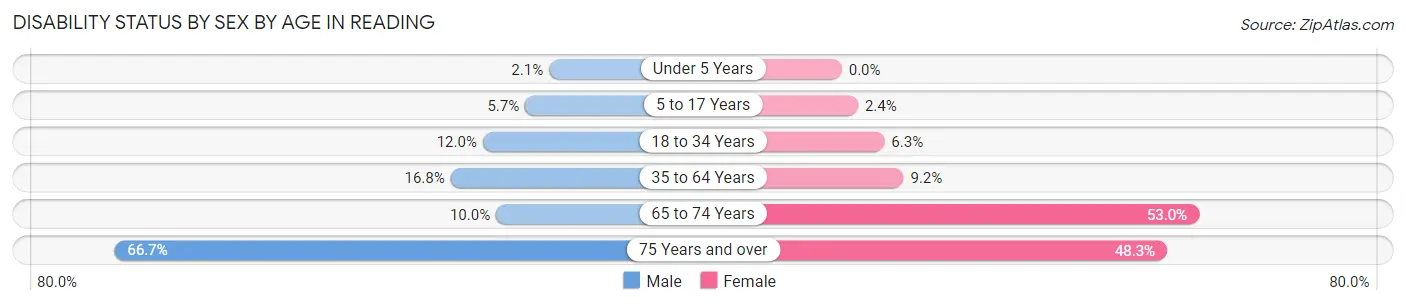
| Age Bracket | Male | Female |
| Under 5 Years | 2 (2.1%) | 0 (0.0%) |
| 5 to 17 Years | 7 (5.7%) | 4 (2.4%) |
| 18 to 34 Years | 14 (12.0%) | 5 (6.3%) |
| 35 to 64 Years | 35 (16.8%) | 21 (9.2%) |
| 65 to 74 Years | 3 (10.0%) | 35 (53.0%) |
| 75 Years and over | 14 (66.7%) | 14 (48.3%) |
Disability Class by Sex by Age in Reading
Disability Class: Hearing Difficulty
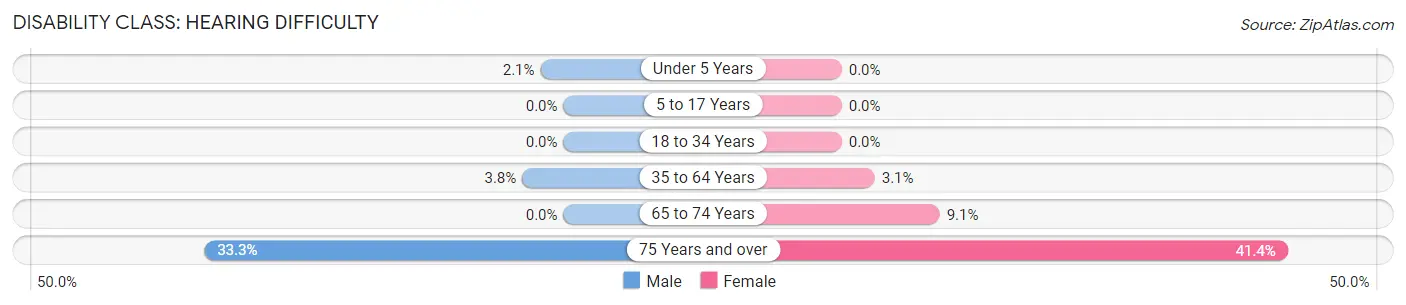
| Age Bracket | Male | Female |
| Under 5 Years | 2 (2.1%) | 0 (0.0%) |
| 5 to 17 Years | 0 (0.0%) | 0 (0.0%) |
| 18 to 34 Years | 0 (0.0%) | 0 (0.0%) |
| 35 to 64 Years | 8 (3.8%) | 7 (3.1%) |
| 65 to 74 Years | 0 (0.0%) | 6 (9.1%) |
| 75 Years and over | 7 (33.3%) | 12 (41.4%) |
Disability Class: Vision Difficulty
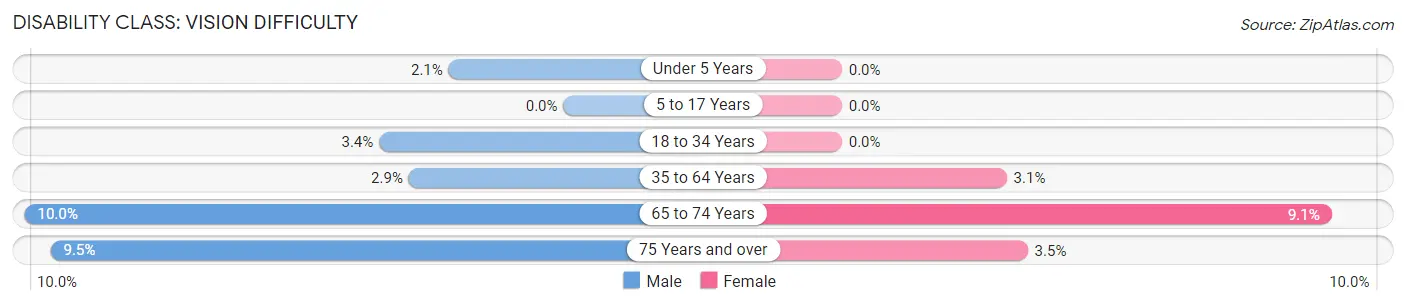
| Age Bracket | Male | Female |
| Under 5 Years | 2 (2.1%) | 0 (0.0%) |
| 5 to 17 Years | 0 (0.0%) | 0 (0.0%) |
| 18 to 34 Years | 4 (3.4%) | 0 (0.0%) |
| 35 to 64 Years | 6 (2.9%) | 7 (3.1%) |
| 65 to 74 Years | 3 (10.0%) | 6 (9.1%) |
| 75 Years and over | 2 (9.5%) | 1 (3.5%) |
Disability Class: Cognitive Difficulty
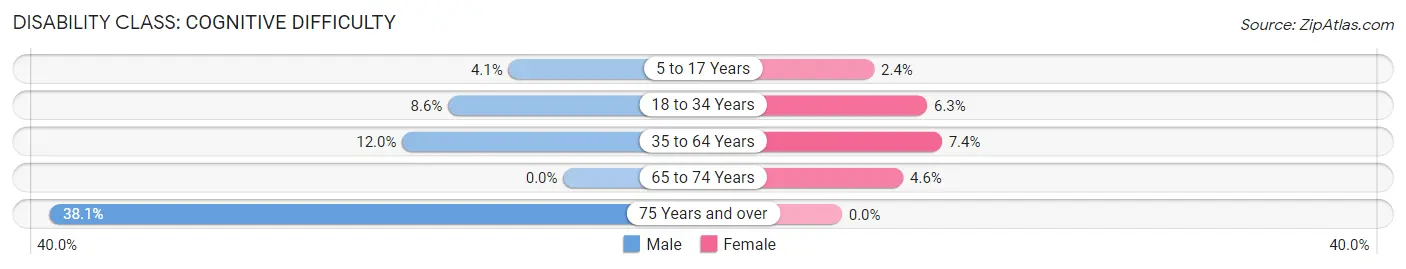
| Age Bracket | Male | Female |
| 5 to 17 Years | 5 (4.1%) | 4 (2.4%) |
| 18 to 34 Years | 10 (8.6%) | 5 (6.3%) |
| 35 to 64 Years | 25 (12.0%) | 17 (7.4%) |
| 65 to 74 Years | 0 (0.0%) | 3 (4.5%) |
| 75 Years and over | 8 (38.1%) | 0 (0.0%) |
Disability Class: Ambulatory Difficulty
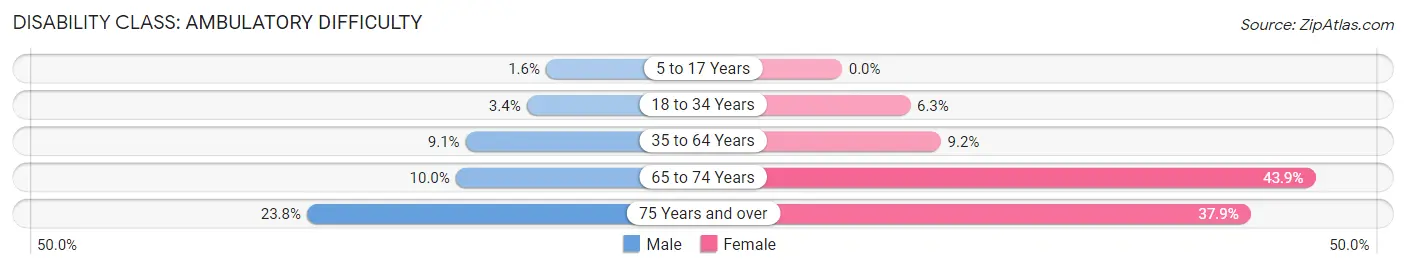
| Age Bracket | Male | Female |
| 5 to 17 Years | 2 (1.6%) | 0 (0.0%) |
| 18 to 34 Years | 4 (3.4%) | 5 (6.3%) |
| 35 to 64 Years | 19 (9.1%) | 21 (9.2%) |
| 65 to 74 Years | 3 (10.0%) | 29 (43.9%) |
| 75 Years and over | 5 (23.8%) | 11 (37.9%) |
Disability Class: Self-Care Difficulty
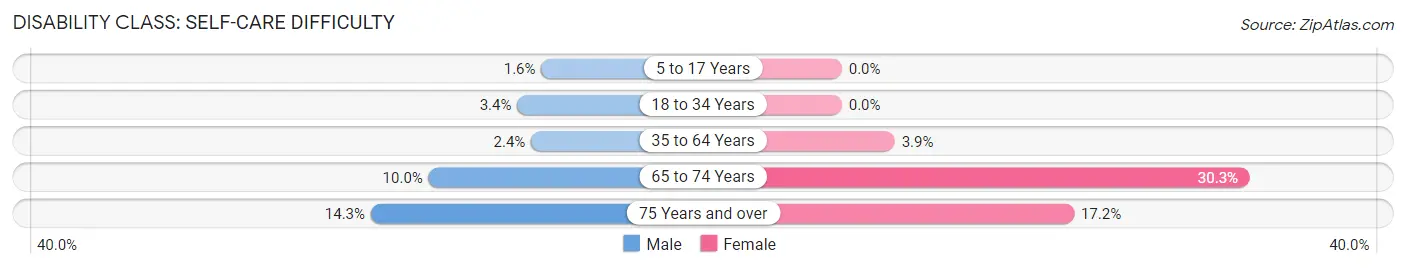
| Age Bracket | Male | Female |
| 5 to 17 Years | 2 (1.6%) | 0 (0.0%) |
| 18 to 34 Years | 4 (3.4%) | 0 (0.0%) |
| 35 to 64 Years | 5 (2.4%) | 9 (3.9%) |
| 65 to 74 Years | 3 (10.0%) | 20 (30.3%) |
| 75 Years and over | 3 (14.3%) | 5 (17.2%) |
Technology Access in Reading
Computing Device Access in Reading
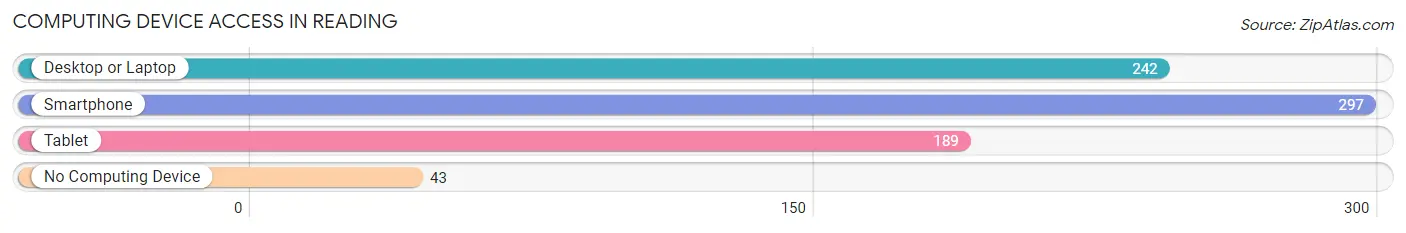
| Device Type | # Households | % Households |
| Desktop or Laptop | 242 | 65.9% |
| Smartphone | 297 | 80.9% |
| Tablet | 189 | 51.5% |
| No Computing Device | 43 | 11.7% |
| Total | 367 | 100.0% |
Internet Access in Reading
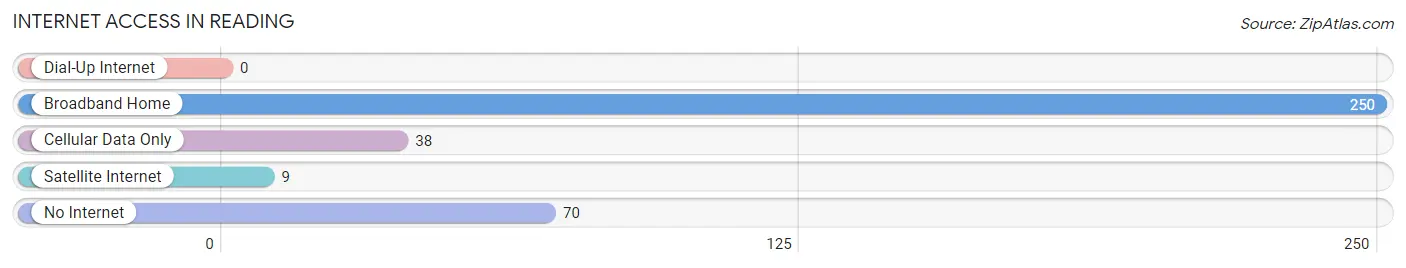
| Internet Type | # Households | % Households |
| Dial-Up Internet | 0 | 0.0% |
| Broadband Home | 250 | 68.1% |
| Cellular Data Only | 38 | 10.3% |
| Satellite Internet | 9 | 2.5% |
| No Internet | 70 | 19.1% |
| Total | 367 | 100.0% |
Reading Summary
Reading, located in the county of Berkshire in the south of England, is a large town with a population of over 160,000 people. It is situated on the River Thames and is the largest town in the county. The town has a long and varied history, with evidence of human settlement dating back to the Iron Age.
Geography
Reading is situated in the Thames Valley, on the banks of the River Thames. The town is surrounded by the Chiltern Hills to the north and the Berkshire Downs to the south. The town is located approximately 40 miles west of London and is connected to the capital by the M4 motorway. The town is also served by the Great Western Railway, with regular services to London Paddington.
Economy
Reading has a diverse economy, with a range of industries represented in the town. The town is home to a number of large companies, including Microsoft, Oracle, Prudential, and the University of Reading. The town is also home to a number of smaller businesses, including a number of independent shops and restaurants. The town is also a major centre for the IT and telecommunications industries, with a number of large companies based in the town.
Demographics
Reading has a diverse population, with a range of ethnic backgrounds represented in the town. The largest ethnic group in the town is White British, accounting for around 70% of the population. Other ethnic groups represented in the town include Asian, Black, and Mixed. The town also has a large student population, with the University of Reading being the largest employer in the town.
Reading is a vibrant and diverse town, with a range of attractions and activities to suit all tastes. The town is home to a number of cultural attractions, including the Reading Museum, the Museum of English Rural Life, and the Reading Abbey. The town also has a number of parks and open spaces, including Prospect Park and Forbury Gardens. The town is also home to a number of festivals and events, including the Reading Festival and the Reading Fringe Festival.
Common Questions
What is Per Capita Income in Reading?
Per Capita income in Reading is $18,199.
What is the Median Family Income in Reading?
Median Family Income in Reading is $53,884.
What is the Median Household income in Reading?
Median Household Income in Reading is $46,681.
What is Income or Wage Gap in Reading?
Income or Wage Gap in Reading is 6.6%.
Women in Reading earn 93.4 cents for every dollar earned by a man.
What is Inequality or Gini Index in Reading?
Inequality or Gini Index in Reading is 0.41.
What is the Total Population of Reading?
Total Population of Reading is 1,207.
What is the Total Male Population of Reading?
Total Male Population of Reading is 594.
What is the Total Female Population of Reading?
Total Female Population of Reading is 613.
What is the Ratio of Males per 100 Females in Reading?
There are 96.90 Males per 100 Females in Reading.
What is the Ratio of Females per 100 Males in Reading?
There are 103.20 Females per 100 Males in Reading.
What is the Median Population Age in Reading?
Median Population Age in Reading is 33.5 Years.
What is the Average Family Size in Reading
Average Family Size in Reading is 4.0 People.
What is the Average Household Size in Reading
Average Household Size in Reading is 3.3 People.
How Large is the Labor Force in Reading?
There are 461 People in the Labor Forcein in Reading.
What is the Percentage of People in the Labor Force in Reading?
56.7% of People are in the Labor Force in Reading.
What is the Unemployment Rate in Reading?
Unemployment Rate in Reading is 4.3%.