Quinnesec, MI Map & Demographics
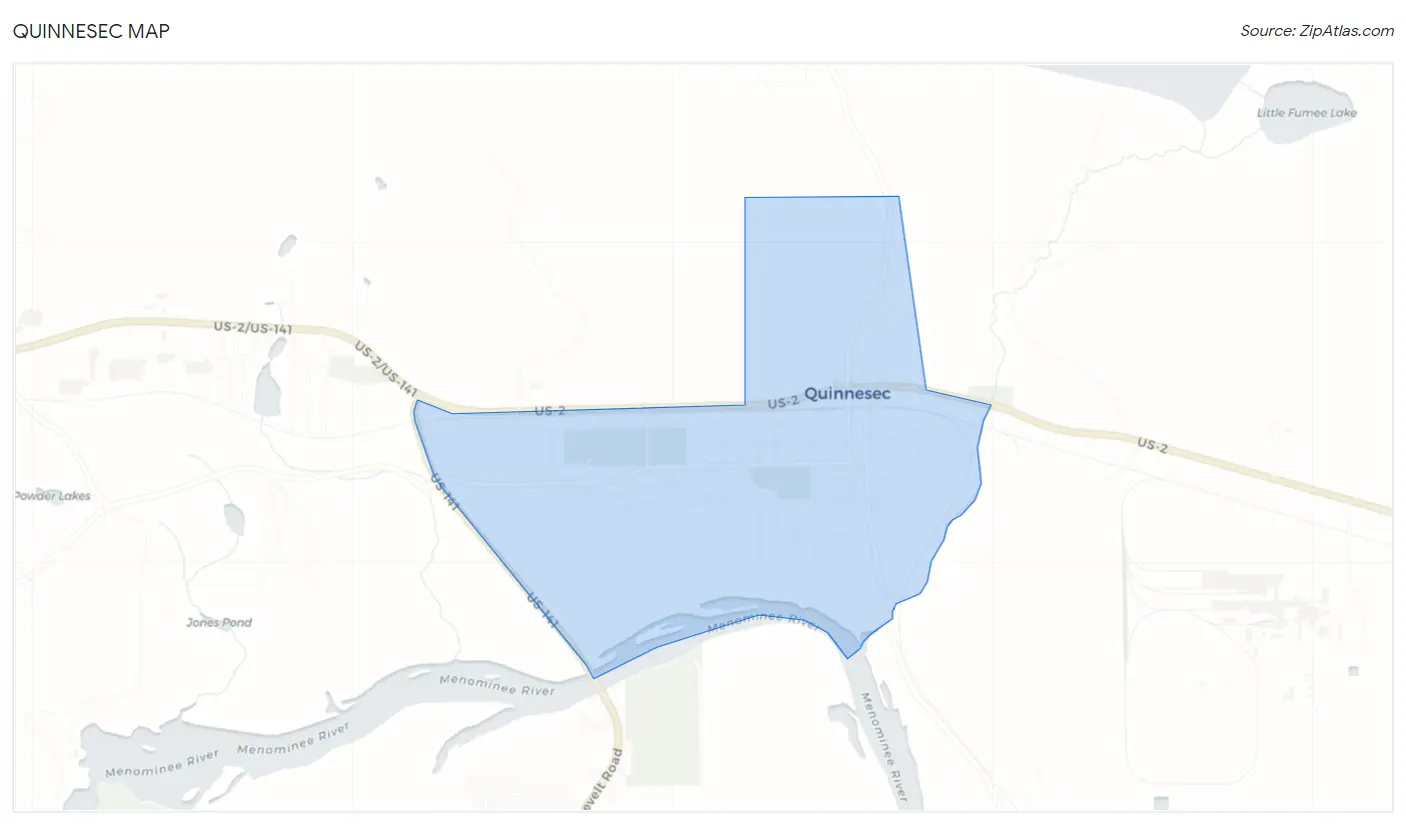
Quinnesec Map
Quinnesec Overview
$34,268
PER CAPITA INCOME
$68,462
AVG FAMILY INCOME
$66,715
AVG HOUSEHOLD INCOME
41.9%
WAGE / INCOME GAP [ % ]
58.1¢/ $1
WAGE / INCOME GAP [ $ ]
0.35
INEQUALITY / GINI INDEX
1,262
TOTAL POPULATION
619
MALE POPULATION
643
FEMALE POPULATION
96.27
MALES / 100 FEMALES
103.88
FEMALES / 100 MALES
52.0
MEDIAN AGE
2.4
AVG FAMILY SIZE
2.4
AVG HOUSEHOLD SIZE
881
LABOR FORCE [ PEOPLE ]
73.7%
PERCENT IN LABOR FORCE
2.8%
UNEMPLOYMENT RATE
Quinnesec Zip Codes
Quinnesec Area Codes
Income in Quinnesec
Income Overview in Quinnesec
Per Capita Income in Quinnesec is $34,268, while median incomes of families and households are $68,462 and $66,715 respectively.
| Characteristic | Number | Measure |
| Per Capita Income | 1,262 | $34,268 |
| Median Family Income | 436 | $68,462 |
| Mean Family Income | 436 | $91,460 |
| Median Household Income | 526 | $66,715 |
| Mean Household Income | 526 | $84,508 |
| Income Deficit | 436 | $0 |
| Wage / Income Gap (%) | 1,262 | 41.91% |
| Wage / Income Gap ($) | 1,262 | 58.09¢ per $1 |
| Gini / Inequality Index | 1,262 | 0.35 |
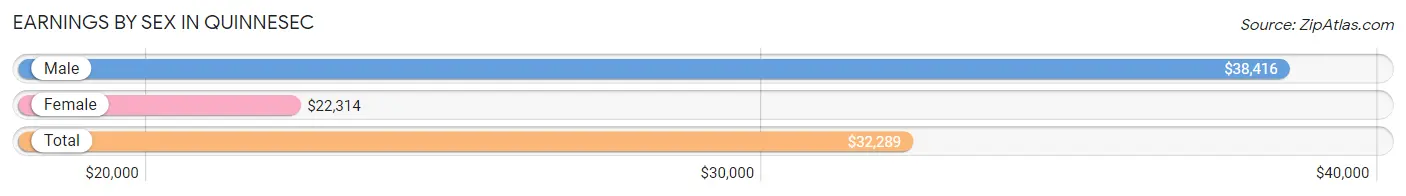
Earnings by Sex in Quinnesec
Average Earnings in Quinnesec are $32,289, $38,416 for men and $22,314 for women, a difference of 41.9%.
| Sex | Number | Average Earnings |
| Male | 493 (54.8%) | $38,416 |
| Female | 407 (45.2%) | $22,314 |
| Total | 900 (100.0%) | $32,289 |
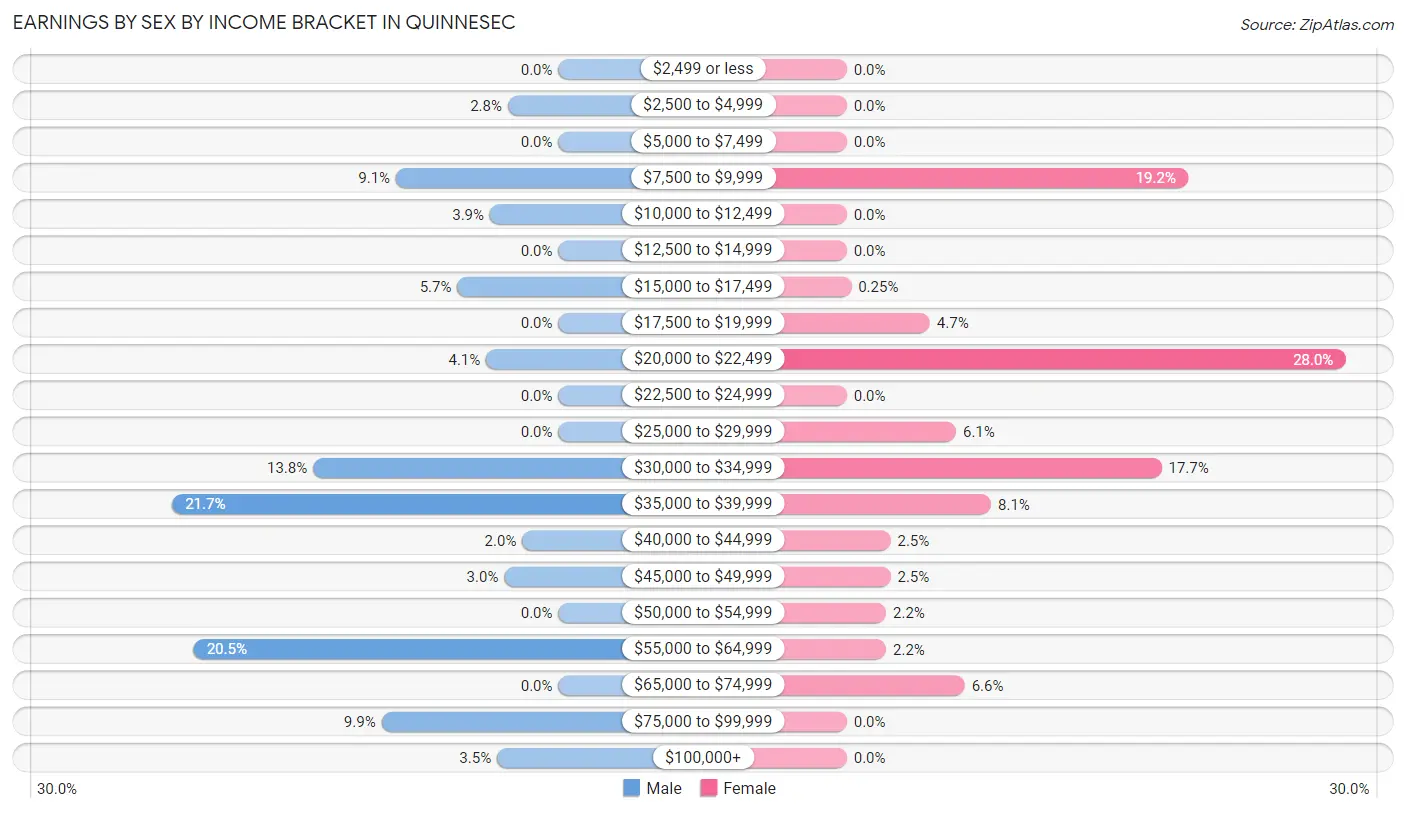
Earnings by Sex by Income Bracket in Quinnesec
The most common earnings brackets in Quinnesec are $35,000 to $39,999 for men (107 | 21.7%) and $20,000 to $22,499 for women (114 | 28.0%).
| Income | Male | Female |
| $2,499 or less | 0 (0.0%) | 0 (0.0%) |
| $2,500 to $4,999 | 14 (2.8%) | 0 (0.0%) |
| $5,000 to $7,499 | 0 (0.0%) | 0 (0.0%) |
| $7,500 to $9,999 | 45 (9.1%) | 78 (19.2%) |
| $10,000 to $12,499 | 19 (3.8%) | 0 (0.0%) |
| $12,500 to $14,999 | 0 (0.0%) | 0 (0.0%) |
| $15,000 to $17,499 | 28 (5.7%) | 1 (0.3%) |
| $17,500 to $19,999 | 0 (0.0%) | 19 (4.7%) |
| $20,000 to $22,499 | 20 (4.1%) | 114 (28.0%) |
| $22,500 to $24,999 | 0 (0.0%) | 0 (0.0%) |
| $25,000 to $29,999 | 0 (0.0%) | 25 (6.1%) |
| $30,000 to $34,999 | 68 (13.8%) | 72 (17.7%) |
| $35,000 to $39,999 | 107 (21.7%) | 33 (8.1%) |
| $40,000 to $44,999 | 10 (2.0%) | 10 (2.5%) |
| $45,000 to $49,999 | 15 (3.0%) | 10 (2.5%) |
| $50,000 to $54,999 | 0 (0.0%) | 9 (2.2%) |
| $55,000 to $64,999 | 101 (20.5%) | 9 (2.2%) |
| $65,000 to $74,999 | 0 (0.0%) | 27 (6.6%) |
| $75,000 to $99,999 | 49 (9.9%) | 0 (0.0%) |
| $100,000+ | 17 (3.5%) | 0 (0.0%) |
| Total | 493 (100.0%) | 407 (100.0%) |
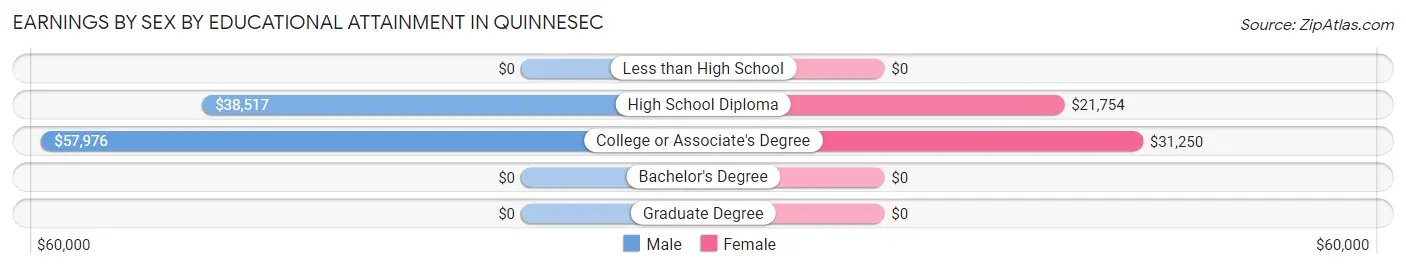
Earnings by Sex by Educational Attainment in Quinnesec
Average earnings in Quinnesec are $39,462 for men and $29,900 for women, a difference of 24.2%. Men with an educational attainment of college or associate's degree enjoy the highest average annual earnings of $57,976, while those with high school diploma education earn the least with $38,517. Women with an educational attainment of college or associate's degree earn the most with the average annual earnings of $31,250, while those with high school diploma education have the smallest earnings of $21,754.
| Educational Attainment | Male Income | Female Income |
| Less than High School | - | - |
| High School Diploma | $38,517 | $21,754 |
| College or Associate's Degree | $57,976 | $31,250 |
| Bachelor's Degree | - | - |
| Graduate Degree | - | - |
| Total | $39,462 | $29,900 |
Family Income in Quinnesec
Family Income Brackets in Quinnesec
According to the Quinnesec family income data, there are 140 families falling into the $100,000 to $149,999 income range, which is the most common income bracket and makes up 32.1% of all families.
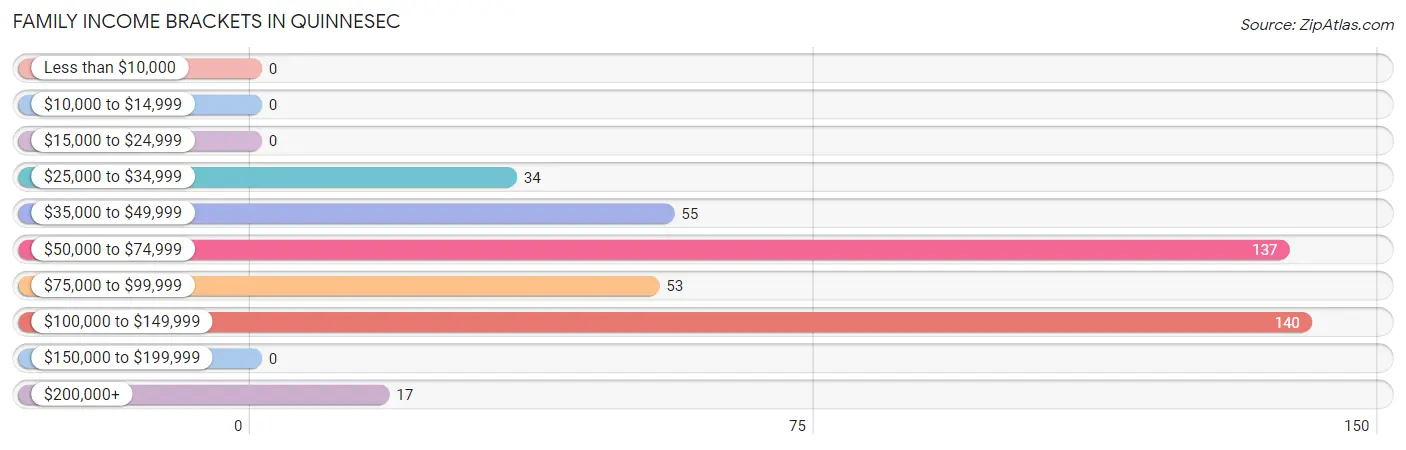
| Income Bracket | # Families | % Families |
| Less than $10,000 | 0 | 0.0% |
| $10,000 to $14,999 | 0 | 0.0% |
| $15,000 to $24,999 | 0 | 0.0% |
| $25,000 to $34,999 | 34 | 7.8% |
| $35,000 to $49,999 | 55 | 12.6% |
| $50,000 to $74,999 | 137 | 31.4% |
| $75,000 to $99,999 | 53 | 12.2% |
| $100,000 to $149,999 | 140 | 32.1% |
| $150,000 to $199,999 | 0 | 0.0% |
| $200,000+ | 17 | 3.9% |
Family Income by Famaliy Size in Quinnesec
4-person families (72 | 16.5%) account for the highest median family income in Quinnesec with $102,115 per family, while 2-person families (333 | 76.4%) have the highest median income of $33,074 per family member.
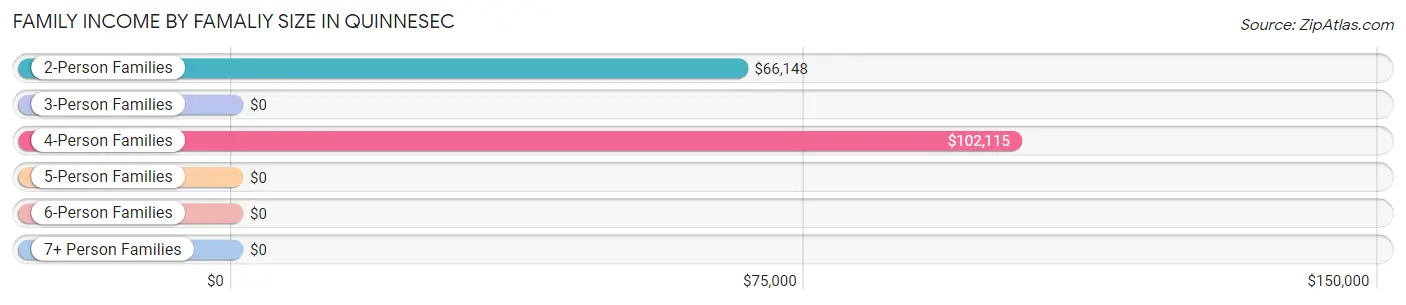
| Income Bracket | # Families | Median Income |
| 2-Person Families | 333 (76.4%) | $66,148 |
| 3-Person Families | 18 (4.1%) | $0 |
| 4-Person Families | 72 (16.5%) | $102,115 |
| 5-Person Families | 13 (3.0%) | $0 |
| 6-Person Families | 0 (0.0%) | $0 |
| 7+ Person Families | 0 (0.0%) | $0 |
| Total | 436 (100.0%) | $68,462 |
Family Income by Number of Earners in Quinnesec
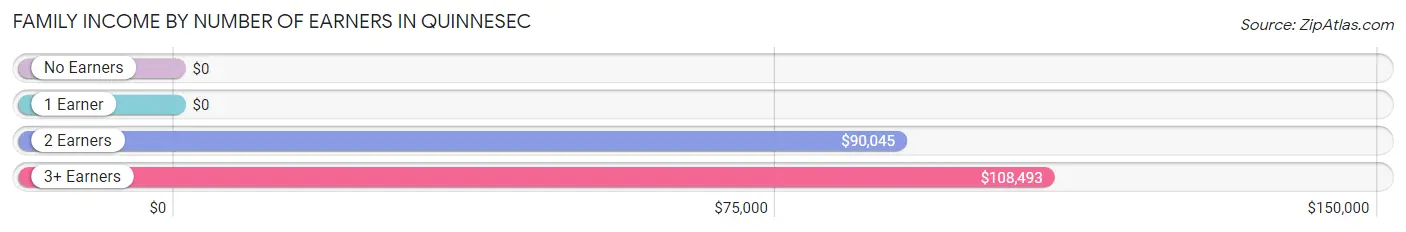
| Number of Earners | # Families | Median Income |
| No Earners | 28 (6.4%) | $0 |
| 1 Earner | 66 (15.1%) | $0 |
| 2 Earners | 265 (60.8%) | $90,045 |
| 3+ Earners | 77 (17.7%) | $108,493 |
| Total | 436 (100.0%) | $68,462 |
Household Income in Quinnesec
Household Income Brackets in Quinnesec
With 156 households falling in the category, the $50,000 to $74,999 income range is the most frequent in Quinnesec, accounting for 29.7% of all households.
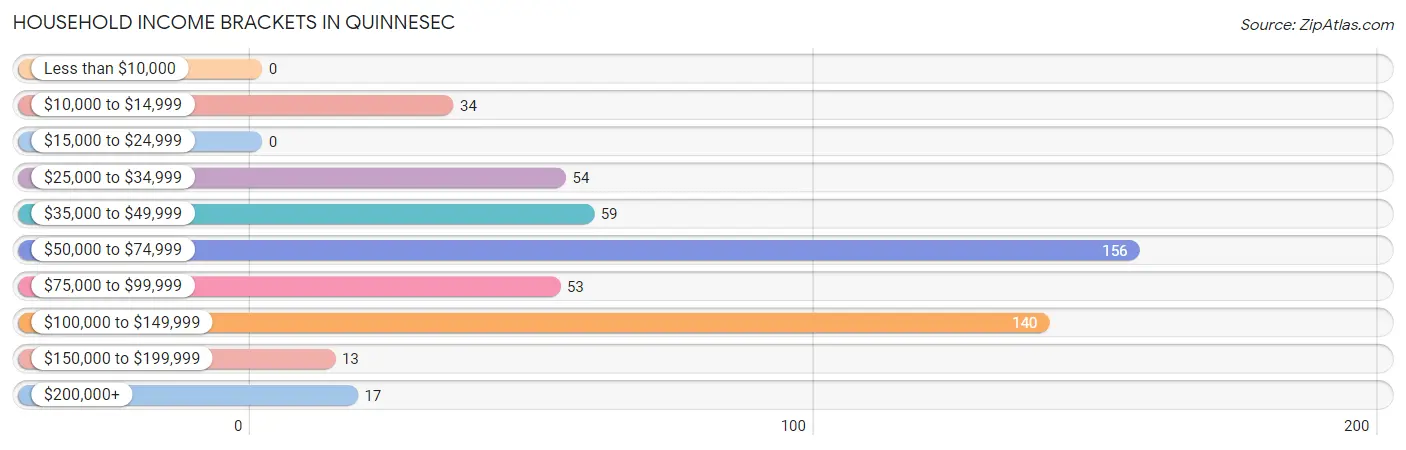
| Income Bracket | # Households | % Households |
| Less than $10,000 | 0 | 0.0% |
| $10,000 to $14,999 | 34 | 6.5% |
| $15,000 to $24,999 | 0 | 0.0% |
| $25,000 to $34,999 | 54 | 10.3% |
| $35,000 to $49,999 | 59 | 11.2% |
| $50,000 to $74,999 | 156 | 29.7% |
| $75,000 to $99,999 | 53 | 10.1% |
| $100,000 to $149,999 | 140 | 26.6% |
| $150,000 to $199,999 | 13 | 2.5% |
| $200,000+ | 17 | 3.2% |
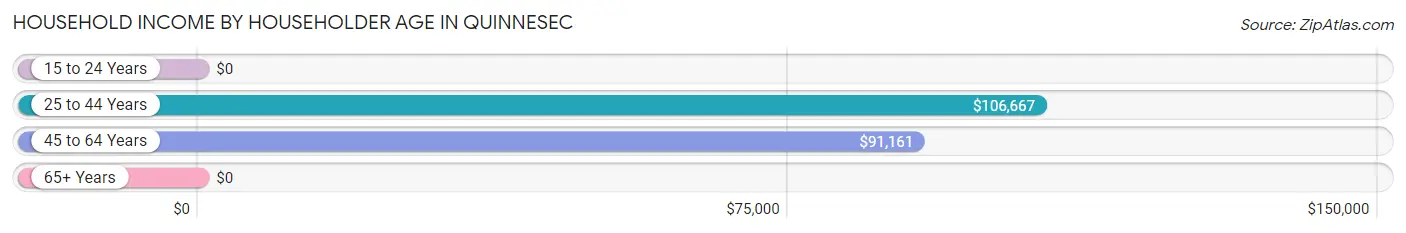
Household Income by Householder Age in Quinnesec
The median household income in Quinnesec is $66,715, with the highest median household income of $106,667 found in the 25 to 44 years age bracket for the primary householder. A total of 80 households (15.2%) fall into this category. Meanwhile, the 15 to 24 years age bracket for the primary householder has the lowest median household income of $0, with 34 households (6.5%) in this group.
| Income Bracket | # Households | Median Income |
| 15 to 24 Years | 34 (6.5%) | $0 |
| 25 to 44 Years | 80 (15.2%) | $106,667 |
| 45 to 64 Years | 320 (60.8%) | $91,161 |
| 65+ Years | 92 (17.5%) | $0 |
| Total | 526 (100.0%) | $66,715 |
Poverty in Quinnesec
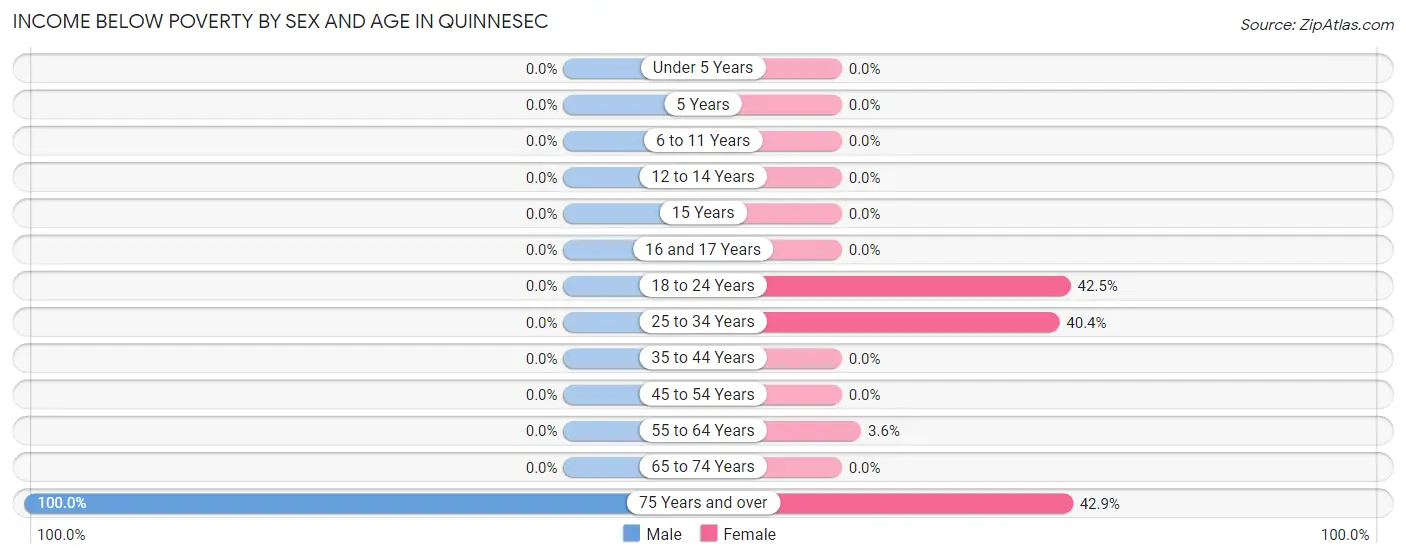
Income Below Poverty by Sex and Age in Quinnesec
With 3.1% poverty level for males and 14.5% for females among the residents of Quinnesec, 75 year old and over males and 75 year old and over females are the most vulnerable to poverty, with 19 males (100.0%) and 15 females (42.9%) in their respective age groups living below the poverty level.
| Age Bracket | Male | Female |
| Under 5 Years | 0 (0.0%) | 0 (0.0%) |
| 5 Years | 0 (0.0%) | 0 (0.0%) |
| 6 to 11 Years | 0 (0.0%) | 0 (0.0%) |
| 12 to 14 Years | 0 (0.0%) | 0 (0.0%) |
| 15 Years | 0 (0.0%) | 0 (0.0%) |
| 16 and 17 Years | 0 (0.0%) | 0 (0.0%) |
| 18 to 24 Years | 0 (0.0%) | 48 (42.5%) |
| 25 to 34 Years | 0 (0.0%) | 21 (40.4%) |
| 35 to 44 Years | 0 (0.0%) | 0 (0.0%) |
| 45 to 54 Years | 0 (0.0%) | 0 (0.0%) |
| 55 to 64 Years | 0 (0.0%) | 9 (3.6%) |
| 65 to 74 Years | 0 (0.0%) | 0 (0.0%) |
| 75 Years and over | 19 (100.0%) | 15 (42.9%) |
| Total | 19 (3.1%) | 93 (14.5%) |
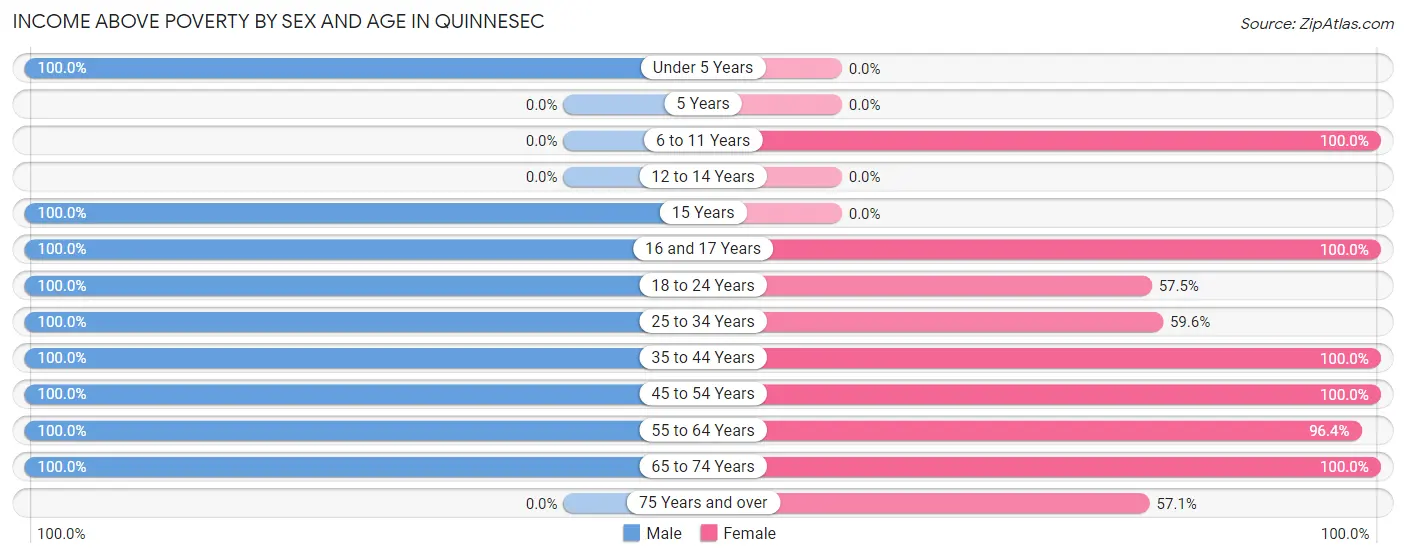
Income Above Poverty by Sex and Age in Quinnesec
According to the poverty statistics in Quinnesec, males aged under 5 years and females aged 6 to 11 years are the age groups that are most secure financially, with 100.0% of males and 100.0% of females in these age groups living above the poverty line.
| Age Bracket | Male | Female |
| Under 5 Years | 26 (100.0%) | 0 (0.0%) |
| 5 Years | 0 (0.0%) | 0 (0.0%) |
| 6 to 11 Years | 0 (0.0%) | 22 (100.0%) |
| 12 to 14 Years | 0 (0.0%) | 0 (0.0%) |
| 15 Years | 18 (100.0%) | 0 (0.0%) |
| 16 and 17 Years | 37 (100.0%) | 29 (100.0%) |
| 18 to 24 Years | 72 (100.0%) | 65 (57.5%) |
| 25 to 34 Years | 42 (100.0%) | 31 (59.6%) |
| 35 to 44 Years | 32 (100.0%) | 65 (100.0%) |
| 45 to 54 Years | 92 (100.0%) | 41 (100.0%) |
| 55 to 64 Years | 241 (100.0%) | 242 (96.4%) |
| 65 to 74 Years | 40 (100.0%) | 35 (100.0%) |
| 75 Years and over | 0 (0.0%) | 20 (57.1%) |
| Total | 600 (96.9%) | 550 (85.5%) |
Income Below Poverty Among Married-Couple Families in Quinnesec
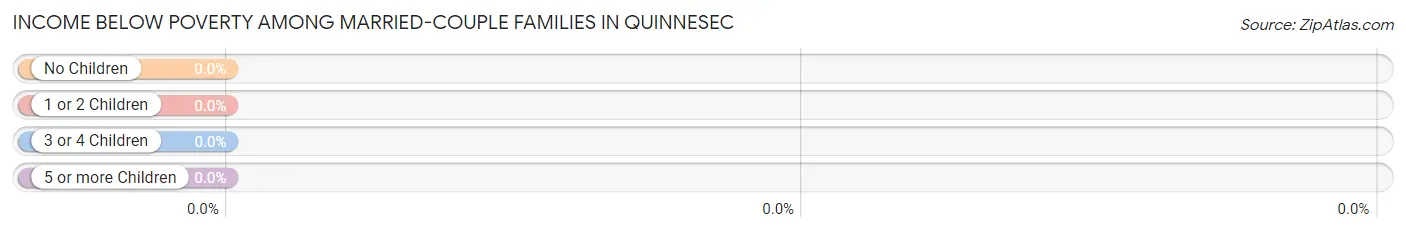
| Children | Above Poverty | Below Poverty |
| No Children | 263 (100.0%) | 0 (0.0%) |
| 1 or 2 Children | 72 (100.0%) | 0 (0.0%) |
| 3 or 4 Children | 13 (100.0%) | 0 (0.0%) |
| 5 or more Children | 0 (0.0%) | 0 (0.0%) |
| Total | 348 (100.0%) | 0 (0.0%) |
Income Below Poverty Among Single-Parent Households in Quinnesec
| Children | Single Father | Single Mother |
| No Children | 0 (0.0%) | 0 (0.0%) |
| 1 or 2 Children | 0 (0.0%) | 0 (0.0%) |
| 3 or 4 Children | 0 (0.0%) | 0 (0.0%) |
| 5 or more Children | 0 (0.0%) | 0 (0.0%) |
| Total | 0 (0.0%) | 0 (0.0%) |
Income Below Poverty Among Married-Couple vs Single-Parent Households in Quinnesec
| Children | Married-Couple Families | Single-Parent Households |
| No Children | 0 (0.0%) | 0 (0.0%) |
| 1 or 2 Children | 0 (0.0%) | 0 (0.0%) |
| 3 or 4 Children | 0 (0.0%) | 0 (0.0%) |
| 5 or more Children | 0 (0.0%) | 0 (0.0%) |
| Total | 0 (0.0%) | 0 (0.0%) |
Race in Quinnesec
The most populous races in Quinnesec are White / Caucasian (1,262 | 100.0%), and Hispanic or Latino (26 | 2.1%).
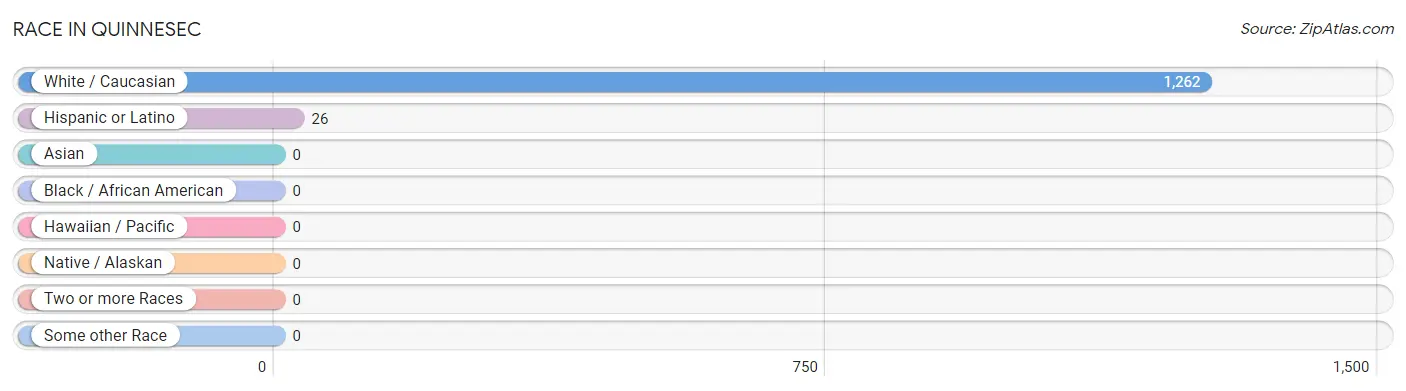
| Race | # Population | % Population |
| Asian | 0 | 0.0% |
| Black / African American | 0 | 0.0% |
| Hawaiian / Pacific | 0 | 0.0% |
| Hispanic or Latino | 26 | 2.1% |
| Native / Alaskan | 0 | 0.0% |
| White / Caucasian | 1,262 | 100.0% |
| Two or more Races | 0 | 0.0% |
| Some other Race | 0 | 0.0% |
| Total | 1,262 | 100.0% |
Ancestry in Quinnesec
The most populous ancestries reported in Quinnesec are German (399 | 31.6%), French (224 | 17.7%), Irish (185 | 14.7%), French Canadian (177 | 14.0%), and Polish (101 | 8.0%), together accounting for 86.1% of all Quinnesec residents.
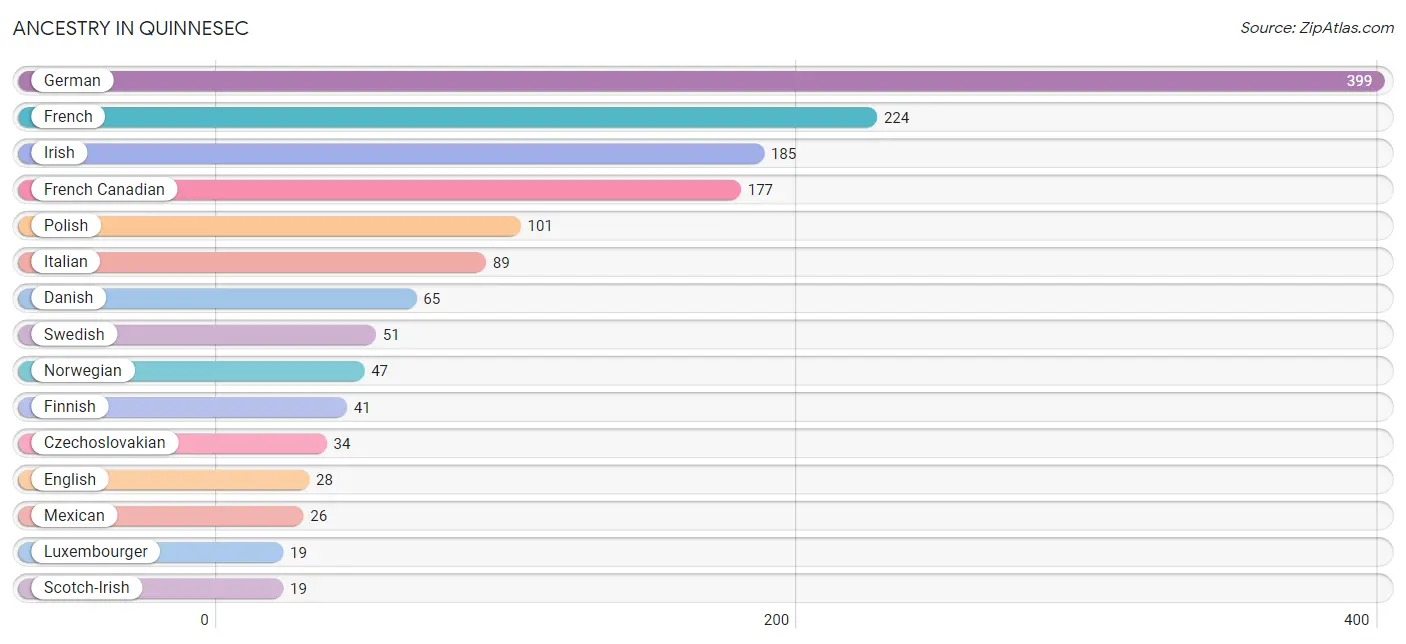
| Ancestry | # Population | % Population |
| Czechoslovakian | 34 | 2.7% |
| Danish | 65 | 5.1% |
| English | 28 | 2.2% |
| Finnish | 41 | 3.3% |
| French | 224 | 17.7% |
| French Canadian | 177 | 14.0% |
| German | 399 | 31.6% |
| Irish | 185 | 14.7% |
| Italian | 89 | 7.0% |
| Luxembourger | 19 | 1.5% |
| Mexican | 26 | 2.1% |
| Norwegian | 47 | 3.7% |
| Polish | 101 | 8.0% |
| Scotch-Irish | 19 | 1.5% |
| Swedish | 51 | 4.0% | View All 15 Rows |
Immigrants in Quinnesec

| Immigration Origin | # Population | % Population | View All 0 Rows |
Sex and Age in Quinnesec
Sex and Age in Quinnesec
The most populous age groups in Quinnesec are 60 to 64 Years (122 | 19.7%) for men and 60 to 64 Years (165 | 25.7%) for women.
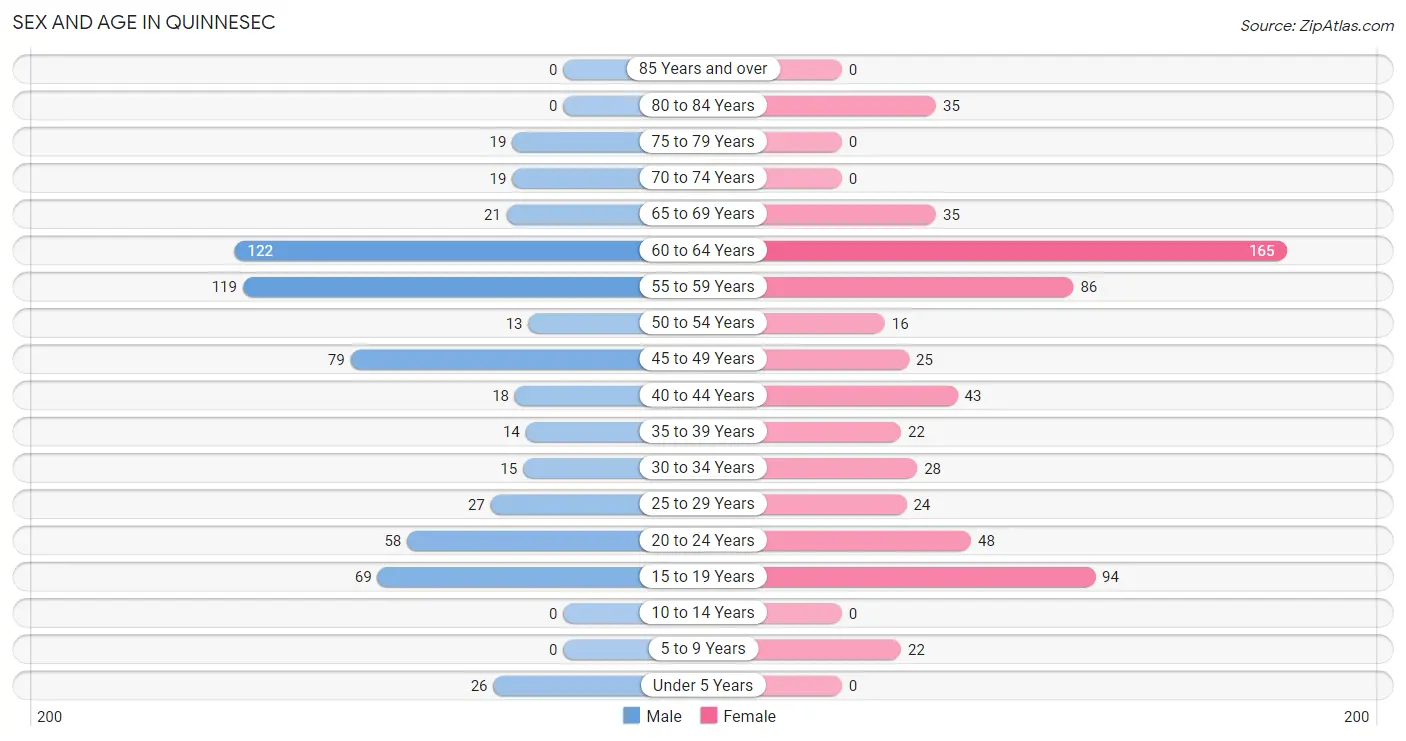
| Age Bracket | Male | Female |
| Under 5 Years | 26 (4.2%) | 0 (0.0%) |
| 5 to 9 Years | 0 (0.0%) | 22 (3.4%) |
| 10 to 14 Years | 0 (0.0%) | 0 (0.0%) |
| 15 to 19 Years | 69 (11.2%) | 94 (14.6%) |
| 20 to 24 Years | 58 (9.4%) | 48 (7.5%) |
| 25 to 29 Years | 27 (4.4%) | 24 (3.7%) |
| 30 to 34 Years | 15 (2.4%) | 28 (4.3%) |
| 35 to 39 Years | 14 (2.3%) | 22 (3.4%) |
| 40 to 44 Years | 18 (2.9%) | 43 (6.7%) |
| 45 to 49 Years | 79 (12.8%) | 25 (3.9%) |
| 50 to 54 Years | 13 (2.1%) | 16 (2.5%) |
| 55 to 59 Years | 119 (19.2%) | 86 (13.4%) |
| 60 to 64 Years | 122 (19.7%) | 165 (25.7%) |
| 65 to 69 Years | 21 (3.4%) | 35 (5.4%) |
| 70 to 74 Years | 19 (3.1%) | 0 (0.0%) |
| 75 to 79 Years | 19 (3.1%) | 0 (0.0%) |
| 80 to 84 Years | 0 (0.0%) | 35 (5.4%) |
| 85 Years and over | 0 (0.0%) | 0 (0.0%) |
| Total | 619 (100.0%) | 643 (100.0%) |
Families and Households in Quinnesec
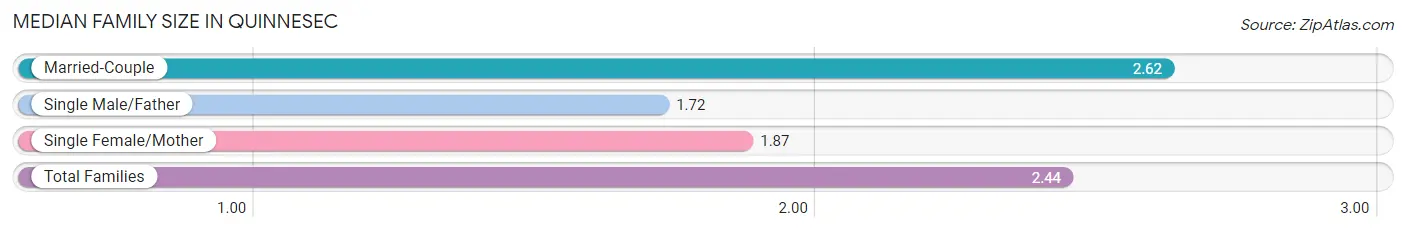
Median Family Size in Quinnesec
The median family size in Quinnesec is 2.44 persons per family, with married-couple families (348 | 79.8%) accounting for the largest median family size of 2.62 persons per family. On the other hand, single male/father families (65 | 14.9%) represent the smallest median family size with 1.72 persons per family.
| Family Type | # Families | Family Size |
| Married-Couple | 348 (79.8%) | 2.62 |
| Single Male/Father | 65 (14.9%) | 1.72 |
| Single Female/Mother | 23 (5.3%) | 1.87 |
| Total Families | 436 (100.0%) | 2.44 |
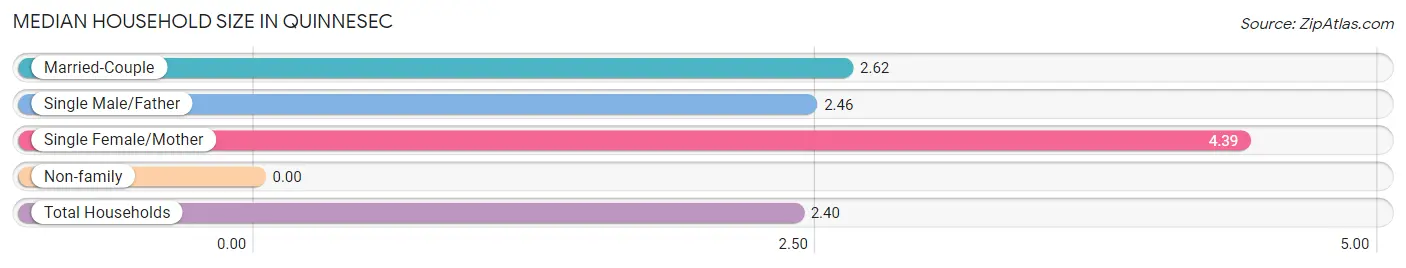
Median Household Size in Quinnesec
| Household Type | # Households | Household Size |
| Married-Couple | 348 (66.2%) | 2.62 |
| Single Male/Father | 65 (12.4%) | 2.46 |
| Single Female/Mother | 23 (4.4%) | 4.39 |
| Non-family | 90 (17.1%) | - |
| Total Households | 526 (100.0%) | 2.40 |
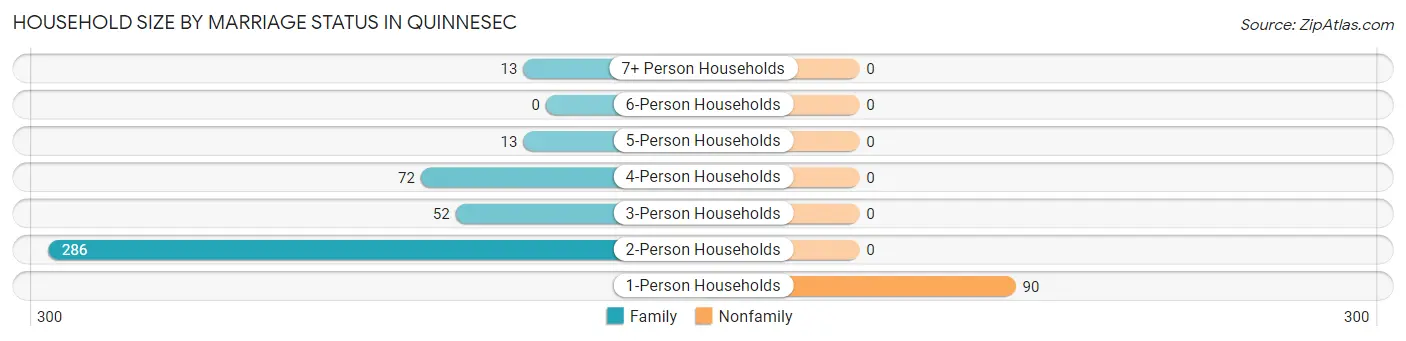
Household Size by Marriage Status in Quinnesec
Out of a total of 526 households in Quinnesec, 436 (82.9%) are family households, while 90 (17.1%) are nonfamily households. The most numerous type of family households are 2-person households, comprising 286, and the most common type of nonfamily households are 1-person households, comprising 90.
| Household Size | Family Households | Nonfamily Households |
| 1-Person Households | - | 90 (17.1%) |
| 2-Person Households | 286 (54.4%) | 0 (0.0%) |
| 3-Person Households | 52 (9.9%) | 0 (0.0%) |
| 4-Person Households | 72 (13.7%) | 0 (0.0%) |
| 5-Person Households | 13 (2.5%) | 0 (0.0%) |
| 6-Person Households | 0 (0.0%) | 0 (0.0%) |
| 7+ Person Households | 13 (2.5%) | 0 (0.0%) |
| Total | 436 (82.9%) | 90 (17.1%) |
Female Fertility in Quinnesec
Fertility by Age in Quinnesec
| Age Bracket | Women with Births | Births / 1,000 Women |
| 15 to 19 years | 0 (0.0%) | 0.0 |
| 20 to 34 years | 0 (0.0%) | 0.0 |
| 35 to 50 years | 0 (0.0%) | 0.0 |
| Total | 0 (0.0%) | 0.0 |
Fertility by Age by Marriage Status in Quinnesec
| Age Bracket | Married | Unmarried |
| 15 to 19 years | 0 (0.0%) | 0 (0.0%) |
| 20 to 34 years | 0 (0.0%) | 0 (0.0%) |
| 35 to 50 years | 0 (0.0%) | 0 (0.0%) |
| Total | 0 (0.0%) | 0 (0.0%) |
Fertility by Education in Quinnesec
| Educational Attainment | Women with Births | Births / 1,000 Women |
| Less than High School | 0 (0.0%) | 0.0 |
| High School Diploma | 0 (0.0%) | 0.0 |
| College or Associate's Degree | 0 (0.0%) | 0.0 |
| Bachelor's Degree | 0 (0.0%) | 0.0 |
| Graduate Degree | 0 (0.0%) | 0.0 |
| Total | 0 (0.0%) | 0.0 |
Fertility by Education by Marriage Status in Quinnesec
| Educational Attainment | Married | Unmarried |
| Less than High School | 0 (0.0%) | 0 (0.0%) |
| High School Diploma | 0 (0.0%) | 0 (0.0%) |
| College or Associate's Degree | 0 (0.0%) | 0 (0.0%) |
| Bachelor's Degree | 0 (0.0%) | 0 (0.0%) |
| Graduate Degree | 0 (0.0%) | 0 (0.0%) |
| Total | 0 (0.0%) | 0 (0.0%) |
Employment Characteristics in Quinnesec
Employment by Class of Employer in Quinnesec
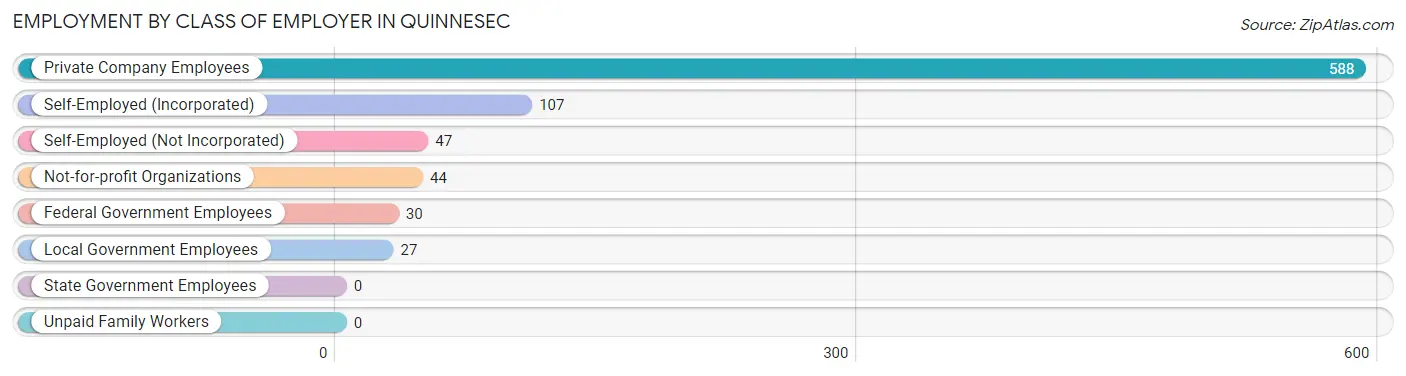
Among the 843 employed individuals in Quinnesec, private company employees (588 | 69.8%), self-employed (incorporated) (107 | 12.7%), and self-employed (not incorporated) (47 | 5.6%) make up the most common classes of employment.
| Employer Class | # Employees | % Employees |
| Private Company Employees | 588 | 69.8% |
| Self-Employed (Incorporated) | 107 | 12.7% |
| Self-Employed (Not Incorporated) | 47 | 5.6% |
| Not-for-profit Organizations | 44 | 5.2% |
| Local Government Employees | 27 | 3.2% |
| State Government Employees | 0 | 0.0% |
| Federal Government Employees | 30 | 3.6% |
| Unpaid Family Workers | 0 | 0.0% |
| Total | 843 | 100.0% |
Employment Status by Age in Quinnesec
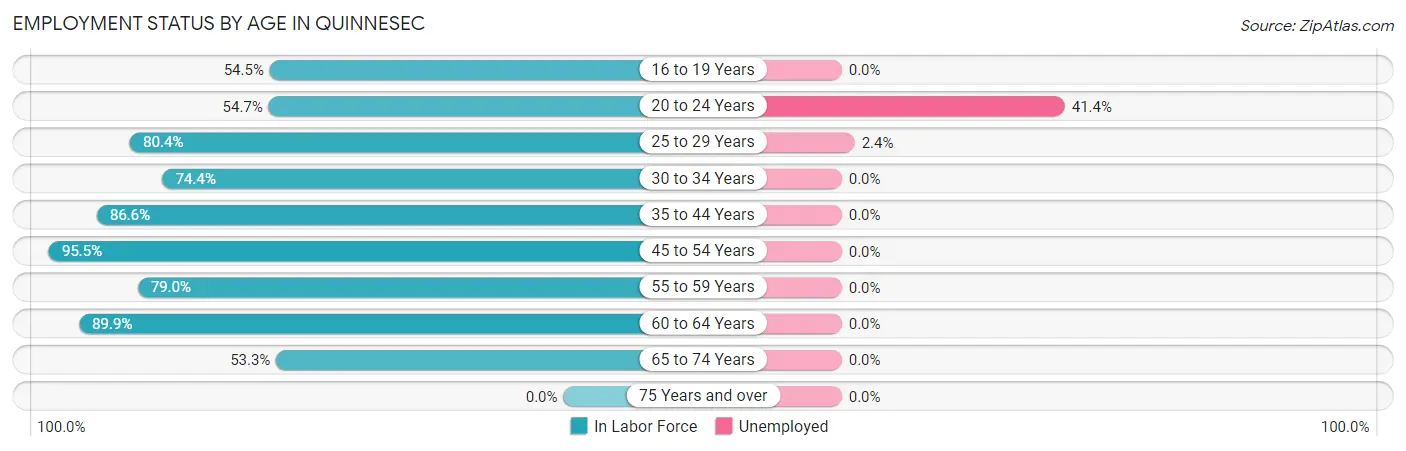
According to the labor force statistics for Quinnesec, out of the total population over 16 years of age (1,196), 73.7% or 881 individuals are in the labor force, with 2.8% or 25 of them unemployed. The age group with the highest labor force participation rate is 45 to 54 years, with 95.5% or 127 individuals in the labor force. Within the labor force, the 20 to 24 years age range has the highest percentage of unemployed individuals, with 41.4% or 24 of them being unemployed.
| Age Bracket | In Labor Force | Unemployed |
| 16 to 19 Years | 79 (54.5%) | 0 (0.0%) |
| 20 to 24 Years | 58 (54.7%) | 24 (41.4%) |
| 25 to 29 Years | 41 (80.4%) | 1 (2.4%) |
| 30 to 34 Years | 32 (74.4%) | 0 (0.0%) |
| 35 to 44 Years | 84 (86.6%) | 0 (0.0%) |
| 45 to 54 Years | 127 (95.5%) | 0 (0.0%) |
| 55 to 59 Years | 162 (79.0%) | 0 (0.0%) |
| 60 to 64 Years | 258 (89.9%) | 0 (0.0%) |
| 65 to 74 Years | 40 (53.3%) | 0 (0.0%) |
| 75 Years and over | 0 (0.0%) | 0 (0.0%) |
| Total | 881 (73.7%) | 25 (2.8%) |
Employment Status by Educational Attainment in Quinnesec
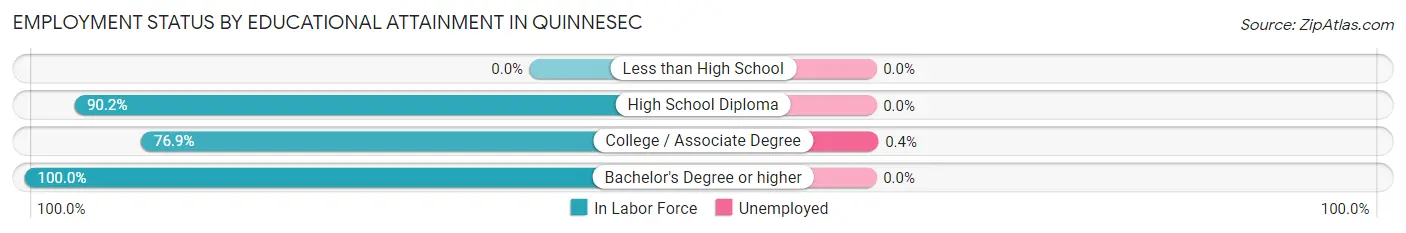
According to labor force statistics for Quinnesec, 86.3% of individuals (704) out of the total population between 25 and 64 years of age (816) are in the labor force, with 0.1% or 1 of them being unemployed. The group with the highest labor force participation rate are those with the educational attainment of bachelor's degree or higher, with 100.0% or 120 individuals in the labor force. Within the labor force, individuals with college / associate degree education have the highest percentage of unemployment, with 0.4% or 1 of them being unemployed.
| Educational Attainment | In Labor Force | Unemployed |
| Less than High School | 0 (0.0%) | 0 (0.0%) |
| High School Diploma | 331 (90.2%) | 0 (0.0%) |
| College / Associate Degree | 253 (76.9%) | 1 (0.4%) |
| Bachelor's Degree or higher | 120 (100.0%) | 0 (0.0%) |
| Total | 704 (86.3%) | 1 (0.1%) |
Employment Occupations by Sex in Quinnesec
Management, Business, Science and Arts Occupations
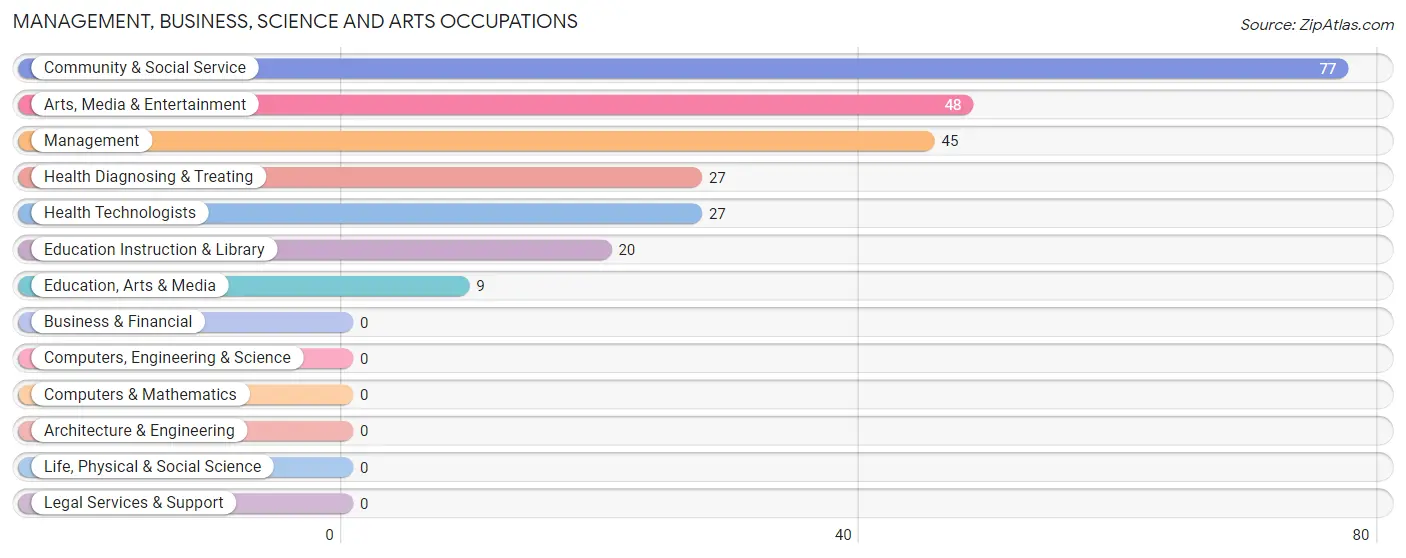
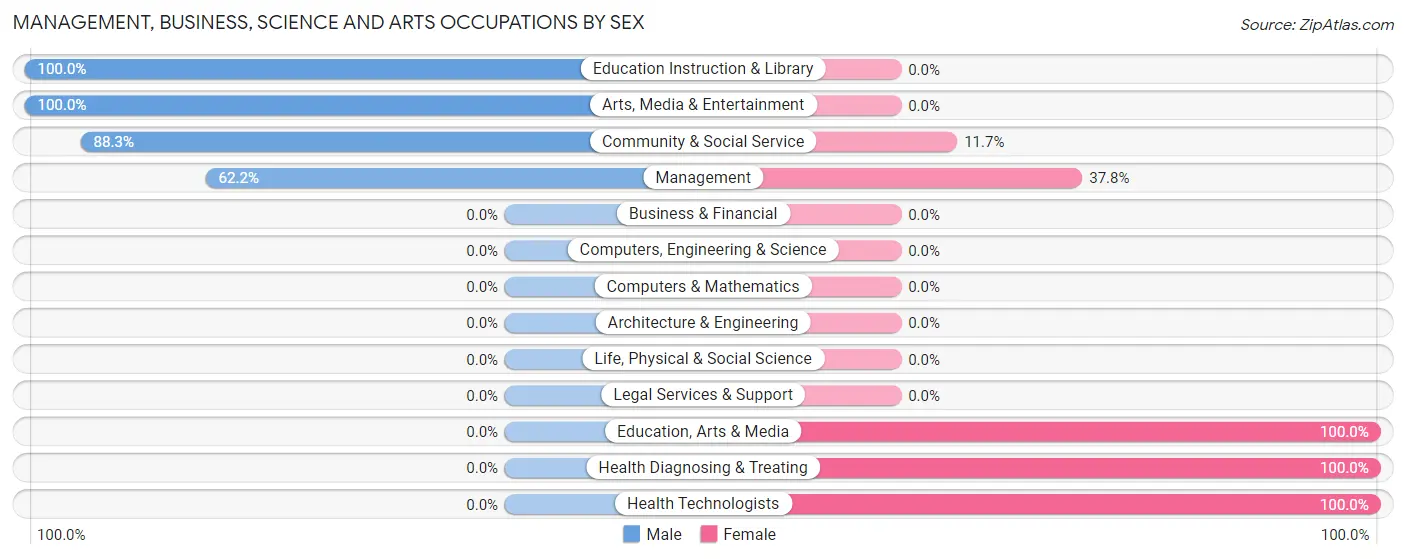
The most common Management, Business, Science and Arts occupations in Quinnesec are Community & Social Service (77 | 9.0%), Arts, Media & Entertainment (48 | 5.6%), Management (45 | 5.3%), Health Diagnosing & Treating (27 | 3.2%), and Health Technologists (27 | 3.2%).
Management, Business, Science and Arts Occupations by Sex
Within the Management, Business, Science and Arts occupations in Quinnesec, the most male-oriented occupations are Education Instruction & Library (100.0%), Arts, Media & Entertainment (100.0%), and Community & Social Service (88.3%), while the most female-oriented occupations are Education, Arts & Media (100.0%), Health Diagnosing & Treating (100.0%), and Health Technologists (100.0%).
| Occupation | Male | Female |
| Management | 28 (62.2%) | 17 (37.8%) |
| Business & Financial | 0 (0.0%) | 0 (0.0%) |
| Computers, Engineering & Science | 0 (0.0%) | 0 (0.0%) |
| Computers & Mathematics | 0 (0.0%) | 0 (0.0%) |
| Architecture & Engineering | 0 (0.0%) | 0 (0.0%) |
| Life, Physical & Social Science | 0 (0.0%) | 0 (0.0%) |
| Community & Social Service | 68 (88.3%) | 9 (11.7%) |
| Education, Arts & Media | 0 (0.0%) | 9 (100.0%) |
| Legal Services & Support | 0 (0.0%) | 0 (0.0%) |
| Education Instruction & Library | 20 (100.0%) | 0 (0.0%) |
| Arts, Media & Entertainment | 48 (100.0%) | 0 (0.0%) |
| Health Diagnosing & Treating | 0 (0.0%) | 27 (100.0%) |
| Health Technologists | 0 (0.0%) | 27 (100.0%) |
| Total (Category) | 96 (64.4%) | 53 (35.6%) |
| Total (Overall) | 450 (52.6%) | 406 (47.4%) |
Services Occupations
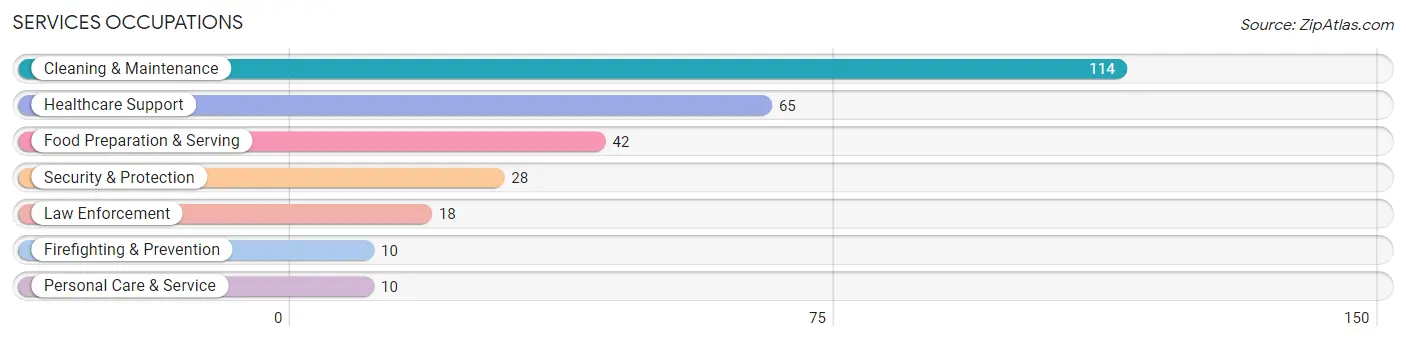
The most common Services occupations in Quinnesec are Cleaning & Maintenance (114 | 13.3%), Healthcare Support (65 | 7.6%), Food Preparation & Serving (42 | 4.9%), Security & Protection (28 | 3.3%), and Law Enforcement (18 | 2.1%).
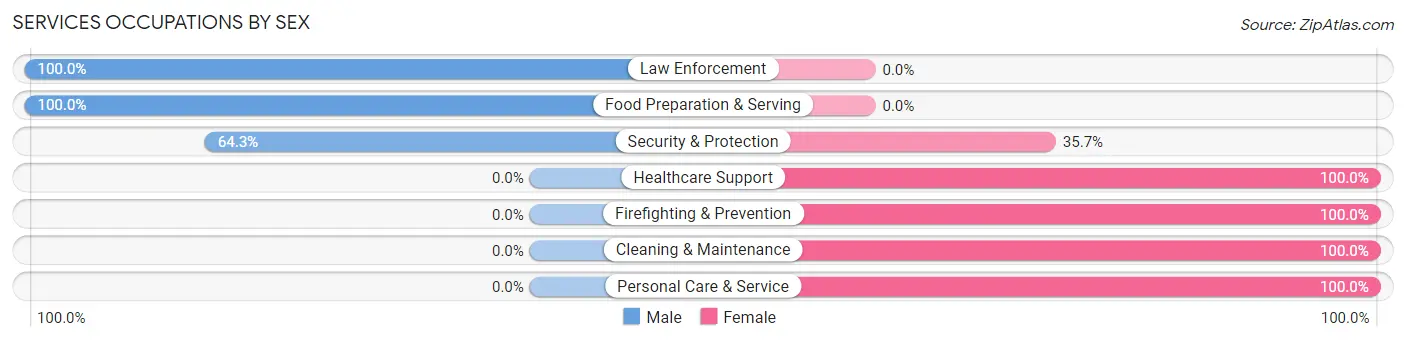
Services Occupations by Sex
Within the Services occupations in Quinnesec, the most male-oriented occupations are Law Enforcement (100.0%), Food Preparation & Serving (100.0%), and Security & Protection (64.3%), while the most female-oriented occupations are Healthcare Support (100.0%), Firefighting & Prevention (100.0%), and Cleaning & Maintenance (100.0%).
| Occupation | Male | Female |
| Healthcare Support | 0 (0.0%) | 65 (100.0%) |
| Security & Protection | 18 (64.3%) | 10 (35.7%) |
| Firefighting & Prevention | 0 (0.0%) | 10 (100.0%) |
| Law Enforcement | 18 (100.0%) | 0 (0.0%) |
| Food Preparation & Serving | 42 (100.0%) | 0 (0.0%) |
| Cleaning & Maintenance | 0 (0.0%) | 114 (100.0%) |
| Personal Care & Service | 0 (0.0%) | 10 (100.0%) |
| Total (Category) | 60 (23.2%) | 199 (76.8%) |
| Total (Overall) | 450 (52.6%) | 406 (47.4%) |
Sales and Office Occupations
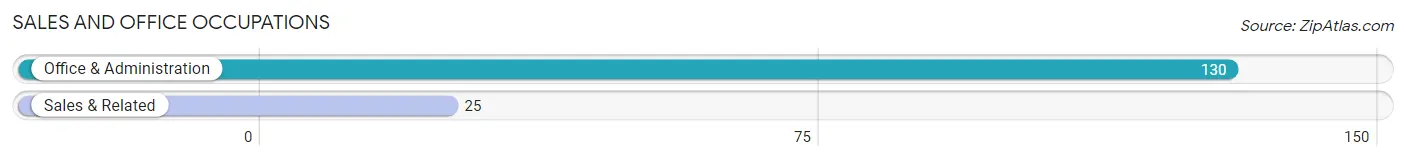
The most common Sales and Office occupations in Quinnesec are Office & Administration (130 | 15.2%), and Sales & Related (25 | 2.9%).
Sales and Office Occupations by Sex
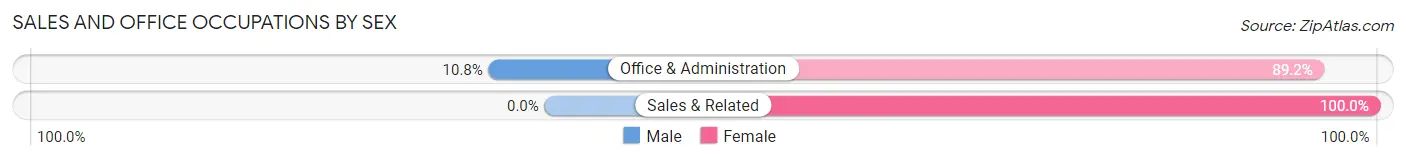
| Occupation | Male | Female |
| Sales & Related | 0 (0.0%) | 25 (100.0%) |
| Office & Administration | 14 (10.8%) | 116 (89.2%) |
| Total (Category) | 14 (9.0%) | 141 (91.0%) |
| Total (Overall) | 450 (52.6%) | 406 (47.4%) |
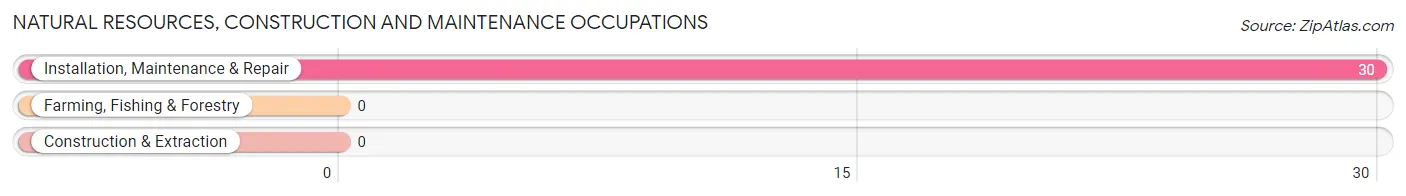
Natural Resources, Construction and Maintenance Occupations
The most common Natural Resources, Construction and Maintenance occupations in Quinnesec are , and Installation, Maintenance & Repair (30 | 3.5%).
Natural Resources, Construction and Maintenance Occupations by Sex
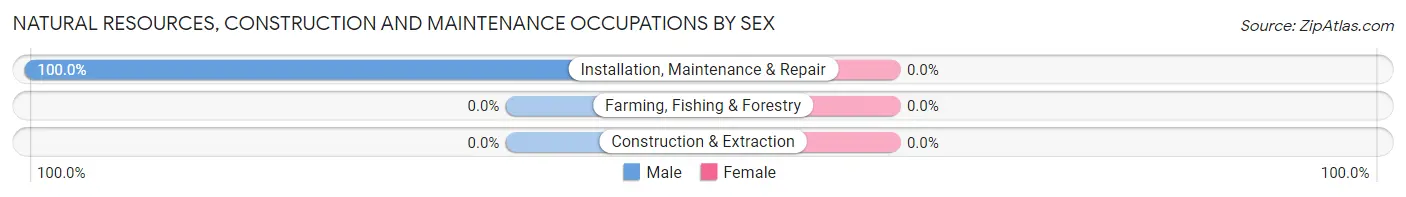
| Occupation | Male | Female |
| Farming, Fishing & Forestry | 0 (0.0%) | 0 (0.0%) |
| Construction & Extraction | 0 (0.0%) | 0 (0.0%) |
| Installation, Maintenance & Repair | 30 (100.0%) | 0 (0.0%) |
| Total (Category) | 30 (100.0%) | 0 (0.0%) |
| Total (Overall) | 450 (52.6%) | 406 (47.4%) |
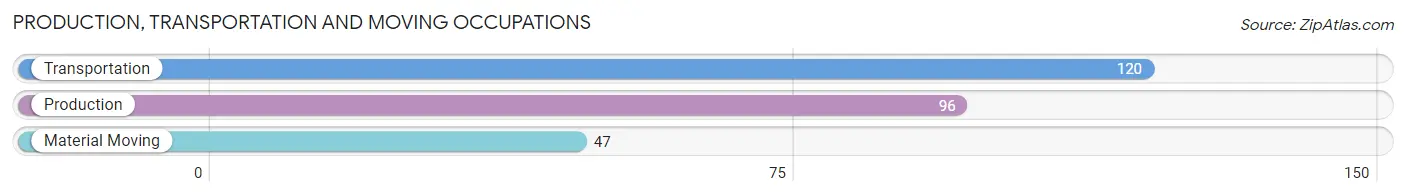
Production, Transportation and Moving Occupations
The most common Production, Transportation and Moving occupations in Quinnesec are Transportation (120 | 14.0%), Production (96 | 11.2%), and Material Moving (47 | 5.5%).
Production, Transportation and Moving Occupations by Sex
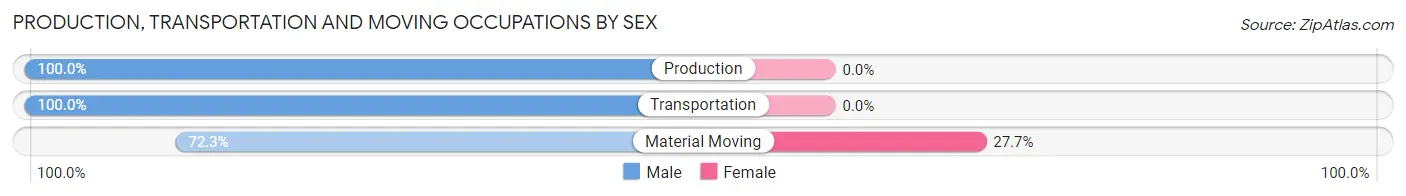
| Occupation | Male | Female |
| Production | 96 (100.0%) | 0 (0.0%) |
| Transportation | 120 (100.0%) | 0 (0.0%) |
| Material Moving | 34 (72.3%) | 13 (27.7%) |
| Total (Category) | 250 (95.1%) | 13 (4.9%) |
| Total (Overall) | 450 (52.6%) | 406 (47.4%) |
Employment Industries by Sex in Quinnesec
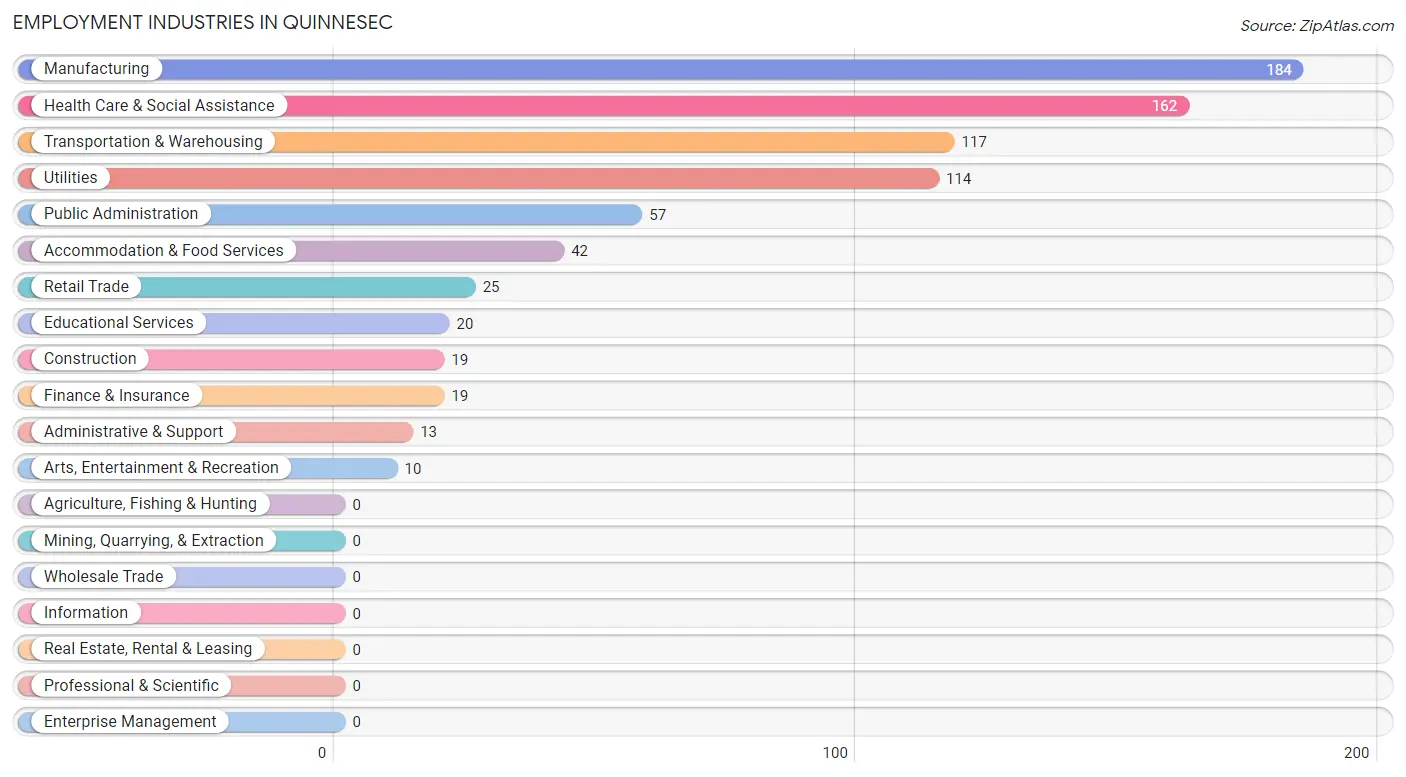
Employment Industries in Quinnesec
The major employment industries in Quinnesec include Manufacturing (184 | 21.5%), Health Care & Social Assistance (162 | 18.9%), Transportation & Warehousing (117 | 13.7%), Utilities (114 | 13.3%), and Public Administration (57 | 6.7%).
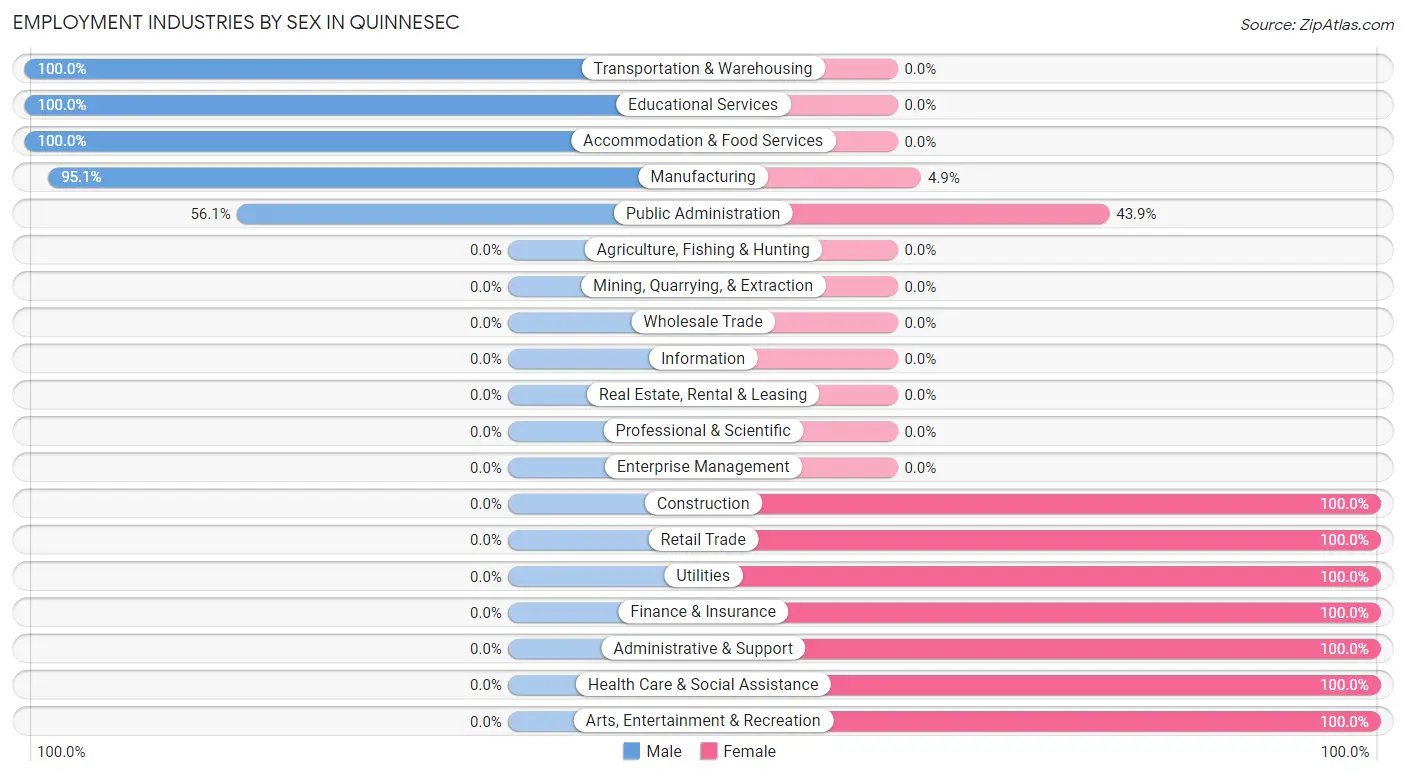
Employment Industries by Sex in Quinnesec
The Quinnesec industries that see more men than women are Transportation & Warehousing (100.0%), Educational Services (100.0%), and Accommodation & Food Services (100.0%), whereas the industries that tend to have a higher number of women are Construction (100.0%), Retail Trade (100.0%), and Utilities (100.0%).
| Industry | Male | Female |
| Agriculture, Fishing & Hunting | 0 (0.0%) | 0 (0.0%) |
| Mining, Quarrying, & Extraction | 0 (0.0%) | 0 (0.0%) |
| Construction | 0 (0.0%) | 19 (100.0%) |
| Manufacturing | 175 (95.1%) | 9 (4.9%) |
| Wholesale Trade | 0 (0.0%) | 0 (0.0%) |
| Retail Trade | 0 (0.0%) | 25 (100.0%) |
| Transportation & Warehousing | 117 (100.0%) | 0 (0.0%) |
| Utilities | 0 (0.0%) | 114 (100.0%) |
| Information | 0 (0.0%) | 0 (0.0%) |
| Finance & Insurance | 0 (0.0%) | 19 (100.0%) |
| Real Estate, Rental & Leasing | 0 (0.0%) | 0 (0.0%) |
| Professional & Scientific | 0 (0.0%) | 0 (0.0%) |
| Enterprise Management | 0 (0.0%) | 0 (0.0%) |
| Administrative & Support | 0 (0.0%) | 13 (100.0%) |
| Educational Services | 20 (100.0%) | 0 (0.0%) |
| Health Care & Social Assistance | 0 (0.0%) | 162 (100.0%) |
| Arts, Entertainment & Recreation | 0 (0.0%) | 10 (100.0%) |
| Accommodation & Food Services | 42 (100.0%) | 0 (0.0%) |
| Public Administration | 32 (56.1%) | 25 (43.9%) |
| Total | 450 (52.6%) | 406 (47.4%) |
Education in Quinnesec
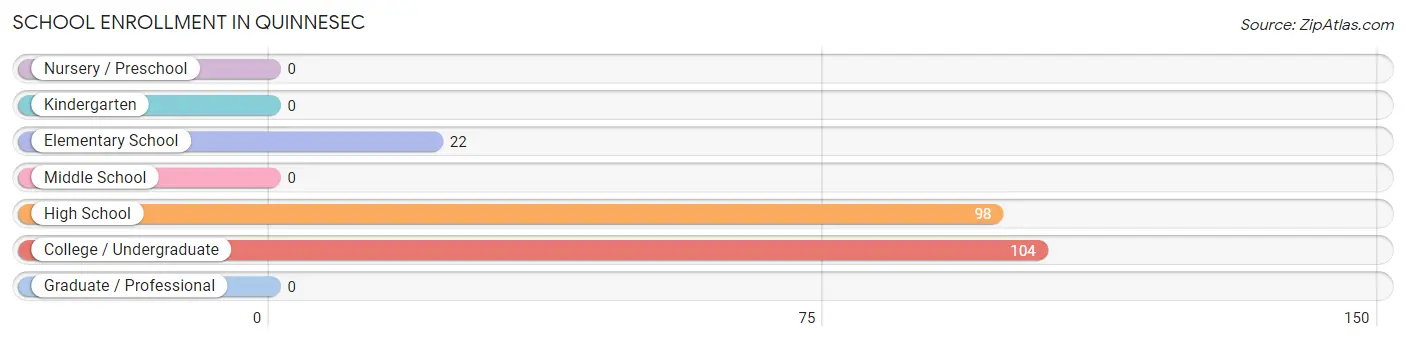
School Enrollment in Quinnesec
The most common levels of schooling among the 224 students in Quinnesec are college / undergraduate (104 | 46.4%), high school (98 | 43.8%), and elementary school (22 | 9.8%).
| School Level | # Students | % Students |
| Nursery / Preschool | 0 | 0.0% |
| Kindergarten | 0 | 0.0% |
| Elementary School | 22 | 9.8% |
| Middle School | 0 | 0.0% |
| High School | 98 | 43.8% |
| College / Undergraduate | 104 | 46.4% |
| Graduate / Professional | 0 | 0.0% |
| Total | 224 | 100.0% |
School Enrollment by Age by Funding Source in Quinnesec
Out of a total of 224 students who are enrolled in schools in Quinnesec, 17 (7.6%) attend a private institution, while the remaining 207 (92.4%) are enrolled in public schools. The age group of 5 to 9 year old has the highest likelihood of being enrolled in private schools, with 17 (77.3% in the age bracket) enrolled. Conversely, the age group of 15 to 17 year olds has the lowest likelihood of being enrolled in a private school, with 84 (100.0% in the age bracket) attending a public institution.
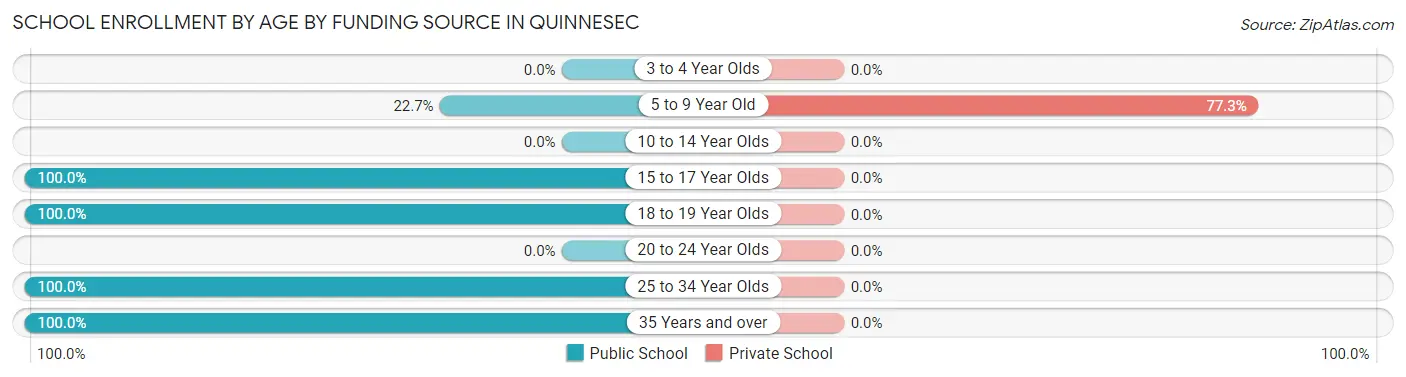
| Age Bracket | Public School | Private School |
| 3 to 4 Year Olds | 0 (0.0%) | 0 (0.0%) |
| 5 to 9 Year Old | 5 (22.7%) | 17 (77.3%) |
| 10 to 14 Year Olds | 0 (0.0%) | 0 (0.0%) |
| 15 to 17 Year Olds | 84 (100.0%) | 0 (0.0%) |
| 18 to 19 Year Olds | 79 (100.0%) | 0 (0.0%) |
| 20 to 24 Year Olds | 0 (0.0%) | 0 (0.0%) |
| 25 to 34 Year Olds | 11 (100.0%) | 0 (0.0%) |
| 35 Years and over | 28 (100.0%) | 0 (0.0%) |
| Total | 207 (92.4%) | 17 (7.6%) |
Educational Attainment by Field of Study in Quinnesec
Science & technology (107 | 89.2%), and education (13 | 10.8%) are the most common fields of study among 120 individuals in Quinnesec who have obtained a bachelor's degree or higher.
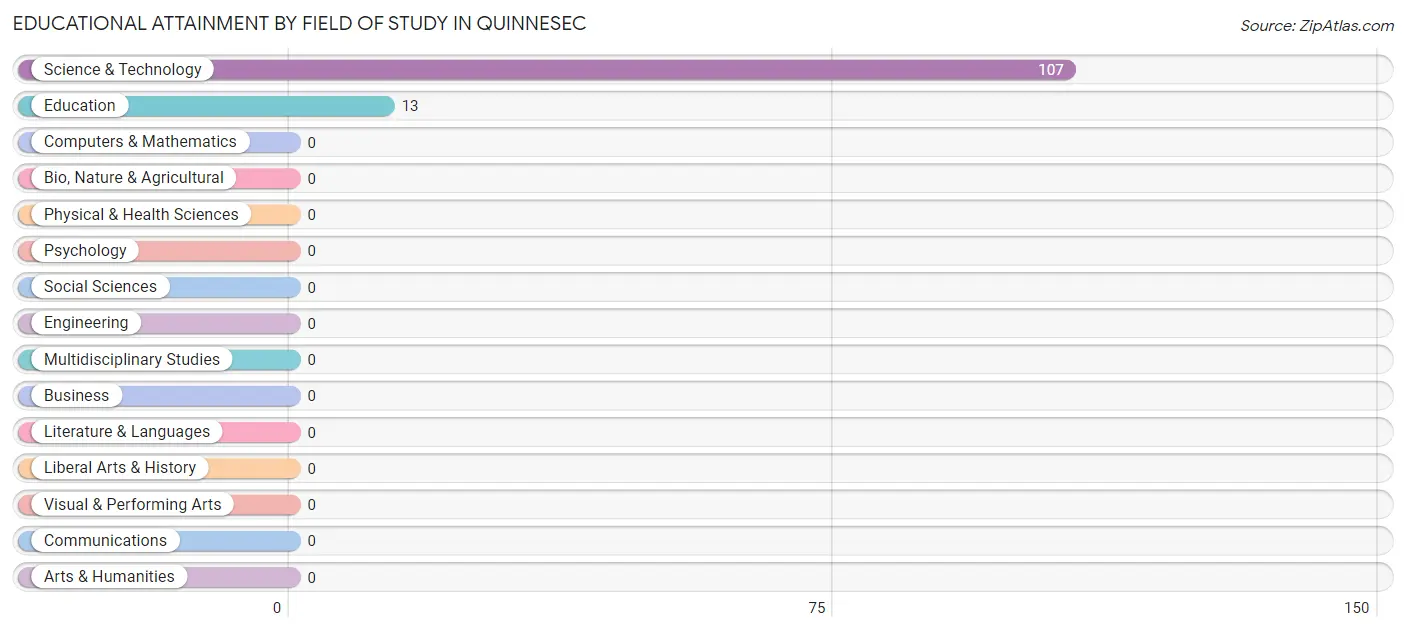
| Field of Study | # Graduates | % Graduates |
| Computers & Mathematics | 0 | 0.0% |
| Bio, Nature & Agricultural | 0 | 0.0% |
| Physical & Health Sciences | 0 | 0.0% |
| Psychology | 0 | 0.0% |
| Social Sciences | 0 | 0.0% |
| Engineering | 0 | 0.0% |
| Multidisciplinary Studies | 0 | 0.0% |
| Science & Technology | 107 | 89.2% |
| Business | 0 | 0.0% |
| Education | 13 | 10.8% |
| Literature & Languages | 0 | 0.0% |
| Liberal Arts & History | 0 | 0.0% |
| Visual & Performing Arts | 0 | 0.0% |
| Communications | 0 | 0.0% |
| Arts & Humanities | 0 | 0.0% |
| Total | 120 | 100.0% |
Transportation & Commute in Quinnesec
Vehicle Availability by Sex in Quinnesec
The most prevalent vehicle ownership categories in Quinnesec are males with 2 vehicles (220, accounting for 48.9%) and females with 2 vehicles (187, making up 56.0%).
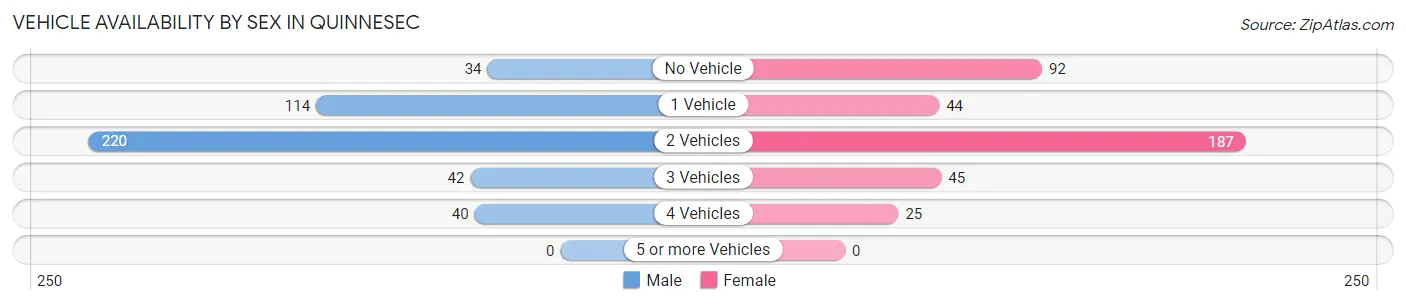
| Vehicles Available | Male | Female |
| No Vehicle | 34 (7.6%) | 92 (23.4%) |
| 1 Vehicle | 114 (25.3%) | 44 (11.2%) |
| 2 Vehicles | 220 (48.9%) | 187 (47.6%) |
| 3 Vehicles | 42 (9.3%) | 45 (11.5%) |
| 4 Vehicles | 40 (8.9%) | 25 (6.4%) |
| 5 or more Vehicles | 0 (0.0%) | 0 (0.0%) |
| Total | 450 (100.0%) | 393 (100.0%) |
Commute Time in Quinnesec
The most frequently occuring commute durations in Quinnesec are 10 to 14 minutes (525 commuters, 64.3%), 15 to 19 minutes (165 commuters, 20.2%), and 5 to 9 minutes (44 commuters, 5.4%).
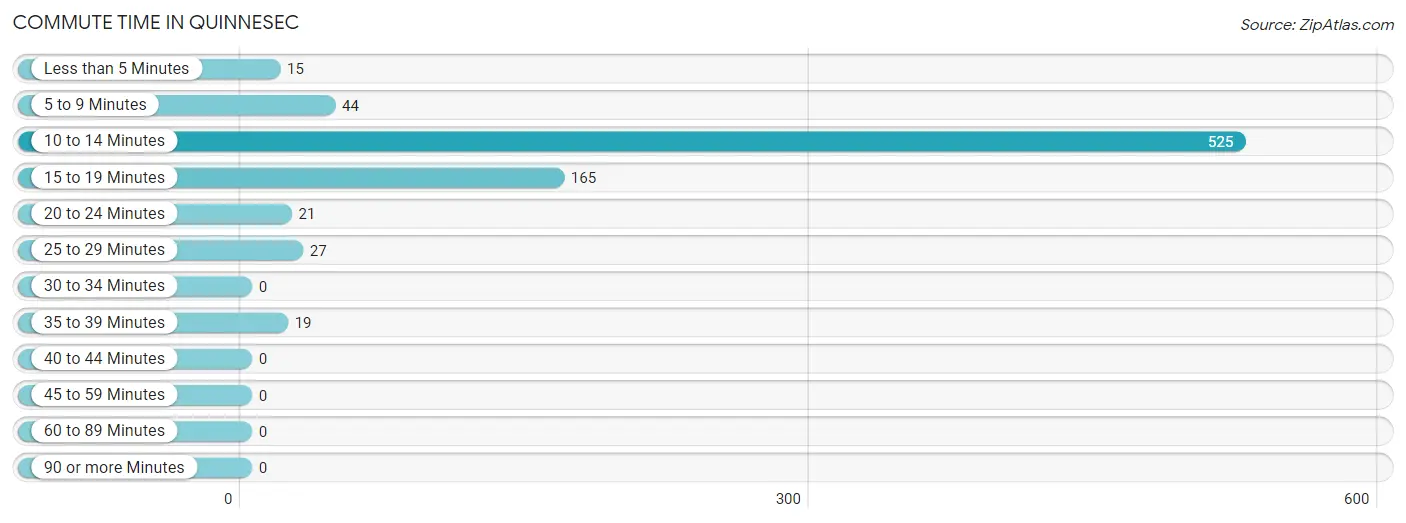
| Commute Time | # Commuters | % Commuters |
| Less than 5 Minutes | 15 | 1.8% |
| 5 to 9 Minutes | 44 | 5.4% |
| 10 to 14 Minutes | 525 | 64.3% |
| 15 to 19 Minutes | 165 | 20.2% |
| 20 to 24 Minutes | 21 | 2.6% |
| 25 to 29 Minutes | 27 | 3.3% |
| 30 to 34 Minutes | 0 | 0.0% |
| 35 to 39 Minutes | 19 | 2.3% |
| 40 to 44 Minutes | 0 | 0.0% |
| 45 to 59 Minutes | 0 | 0.0% |
| 60 to 89 Minutes | 0 | 0.0% |
| 90 or more Minutes | 0 | 0.0% |
Commute Time by Sex in Quinnesec
The most common commute times in Quinnesec are 10 to 14 minutes (278 commuters, 61.8%) for males and 10 to 14 minutes (247 commuters, 67.5%) for females.
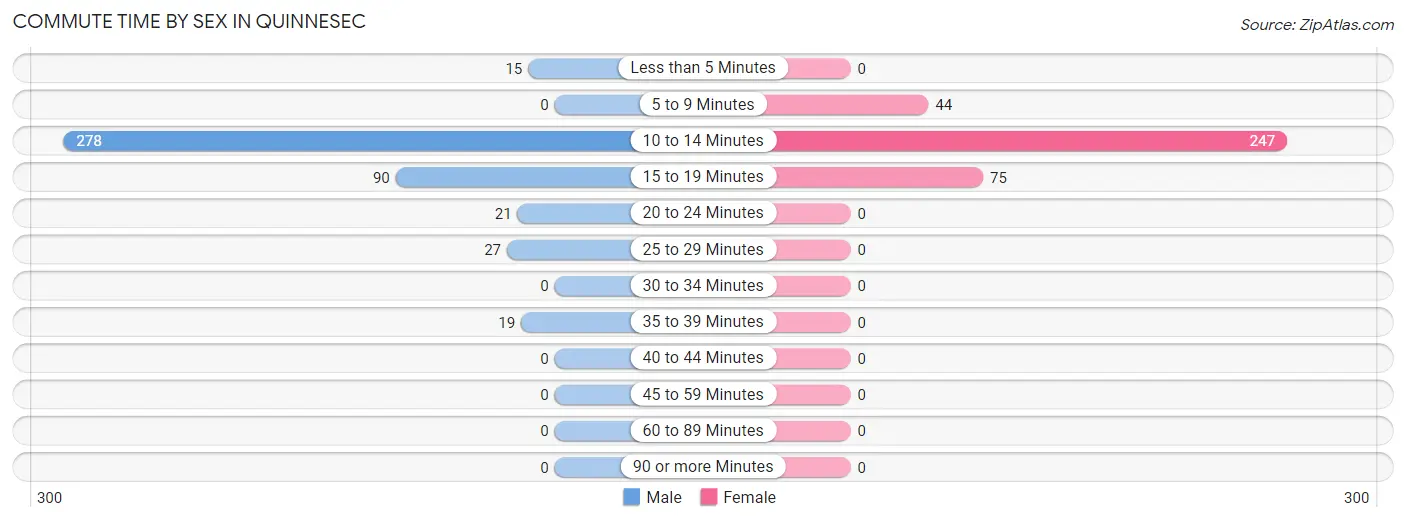
| Commute Time | Male | Female |
| Less than 5 Minutes | 15 (3.3%) | 0 (0.0%) |
| 5 to 9 Minutes | 0 (0.0%) | 44 (12.0%) |
| 10 to 14 Minutes | 278 (61.8%) | 247 (67.5%) |
| 15 to 19 Minutes | 90 (20.0%) | 75 (20.5%) |
| 20 to 24 Minutes | 21 (4.7%) | 0 (0.0%) |
| 25 to 29 Minutes | 27 (6.0%) | 0 (0.0%) |
| 30 to 34 Minutes | 0 (0.0%) | 0 (0.0%) |
| 35 to 39 Minutes | 19 (4.2%) | 0 (0.0%) |
| 40 to 44 Minutes | 0 (0.0%) | 0 (0.0%) |
| 45 to 59 Minutes | 0 (0.0%) | 0 (0.0%) |
| 60 to 89 Minutes | 0 (0.0%) | 0 (0.0%) |
| 90 or more Minutes | 0 (0.0%) | 0 (0.0%) |
Time of Departure to Work by Sex in Quinnesec
The most frequent times of departure to work in Quinnesec are 5:30 AM to 5:59 AM (101, 22.4%) for males and 4:00 PM to 11:59 PM (189, 51.6%) for females.
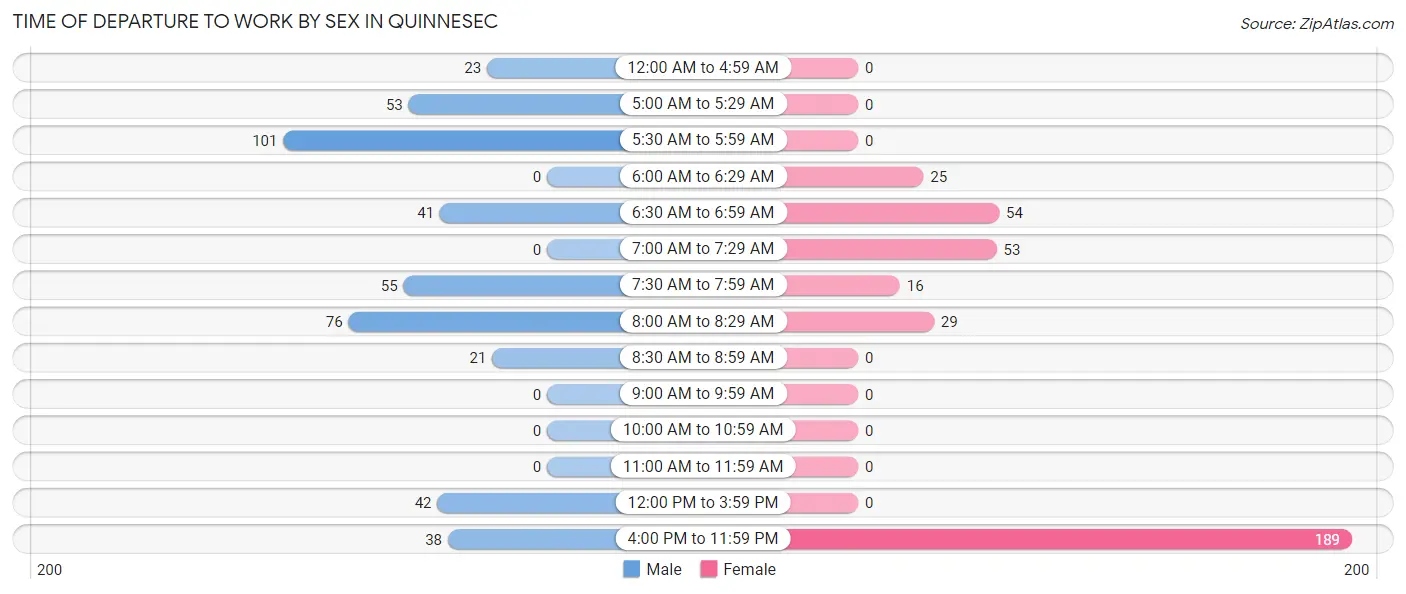
| Time of Departure | Male | Female |
| 12:00 AM to 4:59 AM | 23 (5.1%) | 0 (0.0%) |
| 5:00 AM to 5:29 AM | 53 (11.8%) | 0 (0.0%) |
| 5:30 AM to 5:59 AM | 101 (22.4%) | 0 (0.0%) |
| 6:00 AM to 6:29 AM | 0 (0.0%) | 25 (6.8%) |
| 6:30 AM to 6:59 AM | 41 (9.1%) | 54 (14.7%) |
| 7:00 AM to 7:29 AM | 0 (0.0%) | 53 (14.5%) |
| 7:30 AM to 7:59 AM | 55 (12.2%) | 16 (4.4%) |
| 8:00 AM to 8:29 AM | 76 (16.9%) | 29 (7.9%) |
| 8:30 AM to 8:59 AM | 21 (4.7%) | 0 (0.0%) |
| 9:00 AM to 9:59 AM | 0 (0.0%) | 0 (0.0%) |
| 10:00 AM to 10:59 AM | 0 (0.0%) | 0 (0.0%) |
| 11:00 AM to 11:59 AM | 0 (0.0%) | 0 (0.0%) |
| 12:00 PM to 3:59 PM | 42 (9.3%) | 0 (0.0%) |
| 4:00 PM to 11:59 PM | 38 (8.4%) | 189 (51.6%) |
| Total | 450 (100.0%) | 366 (100.0%) |
Housing Occupancy in Quinnesec
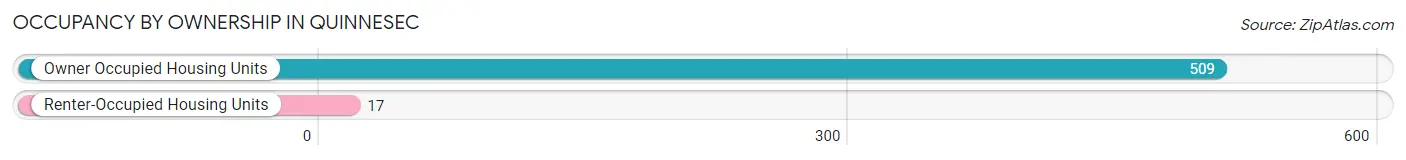
Occupancy by Ownership in Quinnesec
Of the total 526 dwellings in Quinnesec, owner-occupied units account for 509 (96.8%), while renter-occupied units make up 17 (3.2%).
| Occupancy | # Housing Units | % Housing Units |
| Owner Occupied Housing Units | 509 | 96.8% |
| Renter-Occupied Housing Units | 17 | 3.2% |
| Total Occupied Housing Units | 526 | 100.0% |
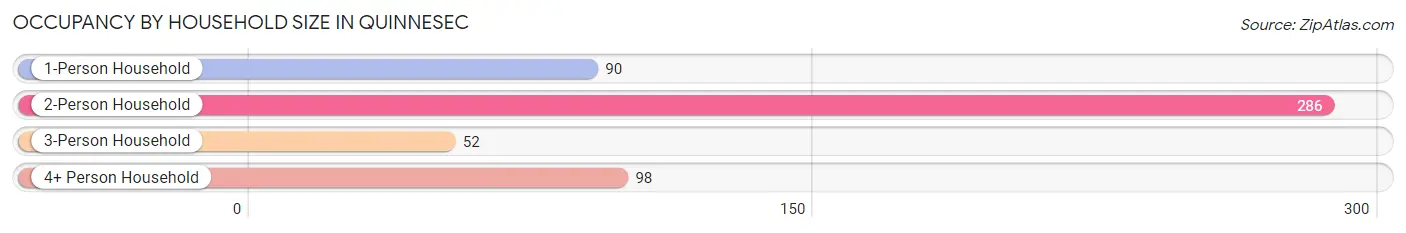
Occupancy by Household Size in Quinnesec
| Household Size | # Housing Units | % Housing Units |
| 1-Person Household | 90 | 17.1% |
| 2-Person Household | 286 | 54.4% |
| 3-Person Household | 52 | 9.9% |
| 4+ Person Household | 98 | 18.6% |
| Total Housing Units | 526 | 100.0% |
Occupancy by Ownership by Household Size in Quinnesec
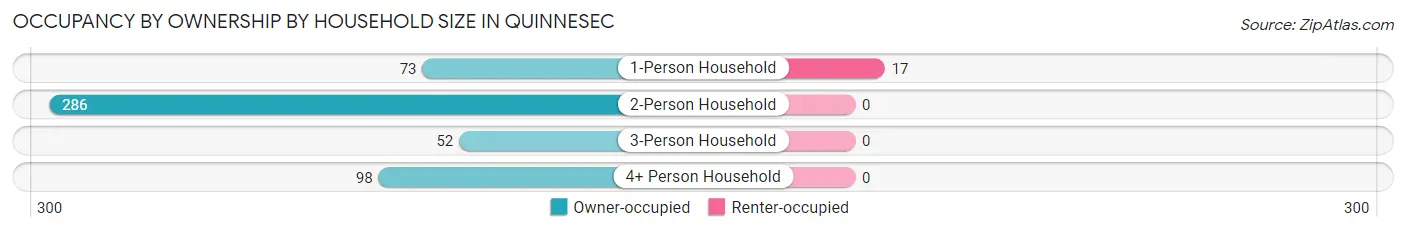
| Household Size | Owner-occupied | Renter-occupied |
| 1-Person Household | 73 (81.1%) | 17 (18.9%) |
| 2-Person Household | 286 (100.0%) | 0 (0.0%) |
| 3-Person Household | 52 (100.0%) | 0 (0.0%) |
| 4+ Person Household | 98 (100.0%) | 0 (0.0%) |
| Total Housing Units | 509 (96.8%) | 17 (3.2%) |
Occupancy by Educational Attainment in Quinnesec
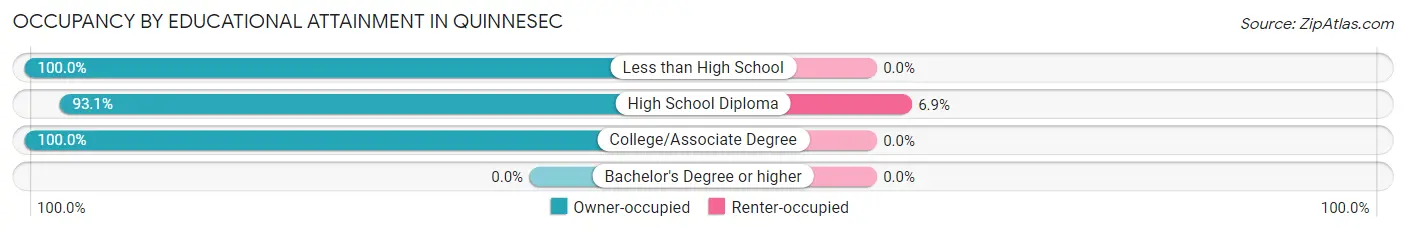
| Household Size | Owner-occupied | Renter-occupied |
| Less than High School | 20 (100.0%) | 0 (0.0%) |
| High School Diploma | 228 (93.1%) | 17 (6.9%) |
| College/Associate Degree | 261 (100.0%) | 0 (0.0%) |
| Bachelor's Degree or higher | 0 (0.0%) | 0 (0.0%) |
Occupancy by Age of Householder in Quinnesec
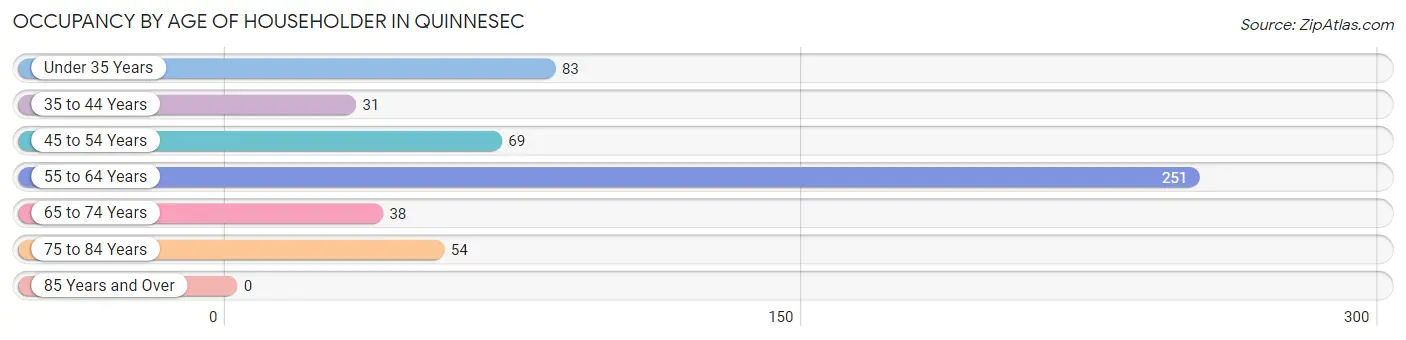
| Age Bracket | # Households | % Households |
| Under 35 Years | 83 | 15.8% |
| 35 to 44 Years | 31 | 5.9% |
| 45 to 54 Years | 69 | 13.1% |
| 55 to 64 Years | 251 | 47.7% |
| 65 to 74 Years | 38 | 7.2% |
| 75 to 84 Years | 54 | 10.3% |
| 85 Years and Over | 0 | 0.0% |
| Total | 526 | 100.0% |
Housing Finances in Quinnesec
Median Income by Occupancy in Quinnesec
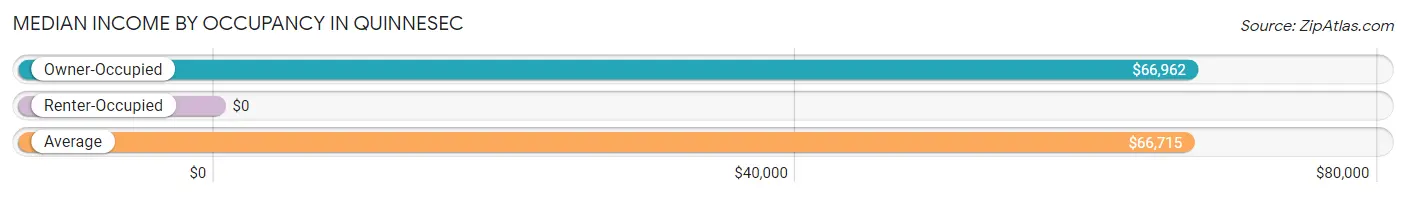
| Occupancy Type | # Households | Median Income |
| Owner-Occupied | 509 (96.8%) | $66,962 |
| Renter-Occupied | 17 (3.2%) | $0 |
| Average | 526 (100.0%) | $66,715 |
Occupancy by Householder Income Bracket in Quinnesec
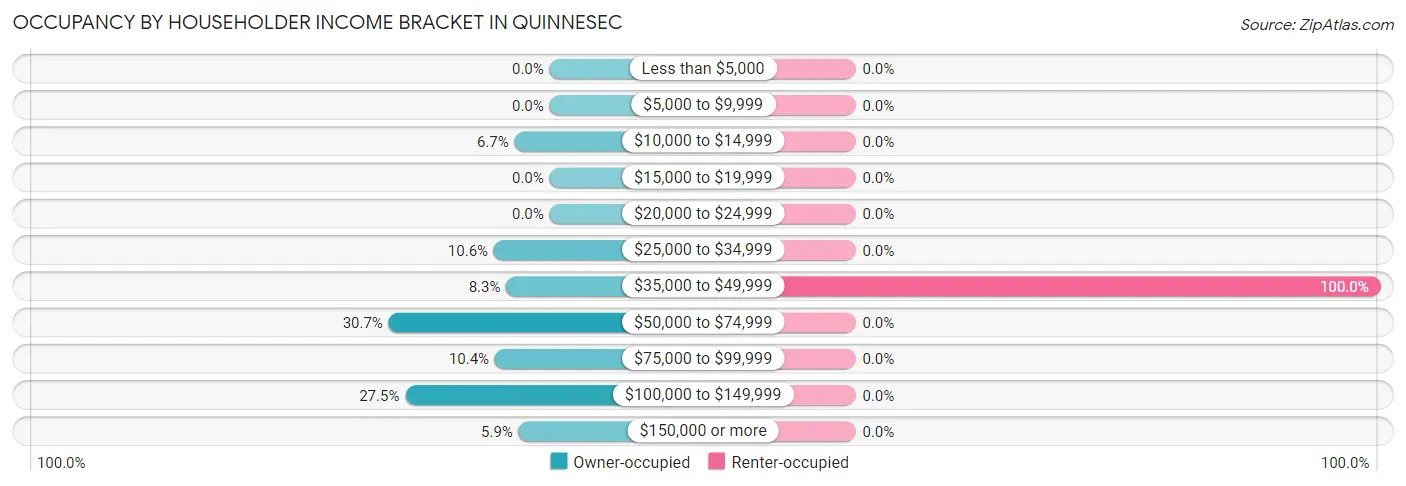
| Income Bracket | Owner-occupied | Renter-occupied |
| Less than $5,000 | 0 (0.0%) | 0 (0.0%) |
| $5,000 to $9,999 | 0 (0.0%) | 0 (0.0%) |
| $10,000 to $14,999 | 34 (6.7%) | 0 (0.0%) |
| $15,000 to $19,999 | 0 (0.0%) | 0 (0.0%) |
| $20,000 to $24,999 | 0 (0.0%) | 0 (0.0%) |
| $25,000 to $34,999 | 54 (10.6%) | 0 (0.0%) |
| $35,000 to $49,999 | 42 (8.3%) | 17 (100.0%) |
| $50,000 to $74,999 | 156 (30.6%) | 0 (0.0%) |
| $75,000 to $99,999 | 53 (10.4%) | 0 (0.0%) |
| $100,000 to $149,999 | 140 (27.5%) | 0 (0.0%) |
| $150,000 or more | 30 (5.9%) | 0 (0.0%) |
| Total | 509 (100.0%) | 17 (100.0%) |
Monthly Housing Cost Tiers in Quinnesec
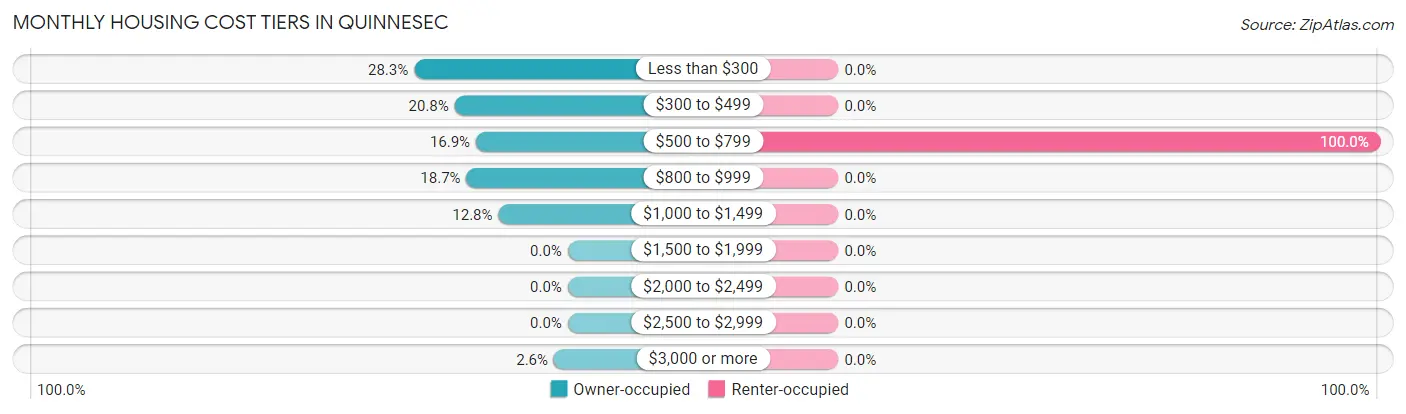
| Monthly Cost | Owner-occupied | Renter-occupied |
| Less than $300 | 144 (28.3%) | 0 (0.0%) |
| $300 to $499 | 106 (20.8%) | 0 (0.0%) |
| $500 to $799 | 86 (16.9%) | 17 (100.0%) |
| $800 to $999 | 95 (18.7%) | 0 (0.0%) |
| $1,000 to $1,499 | 65 (12.8%) | 0 (0.0%) |
| $1,500 to $1,999 | 0 (0.0%) | 0 (0.0%) |
| $2,000 to $2,499 | 0 (0.0%) | 0 (0.0%) |
| $2,500 to $2,999 | 0 (0.0%) | 0 (0.0%) |
| $3,000 or more | 13 (2.5%) | 0 (0.0%) |
| Total | 509 (100.0%) | 17 (100.0%) |
Physical Housing Characteristics in Quinnesec
Housing Structures in Quinnesec
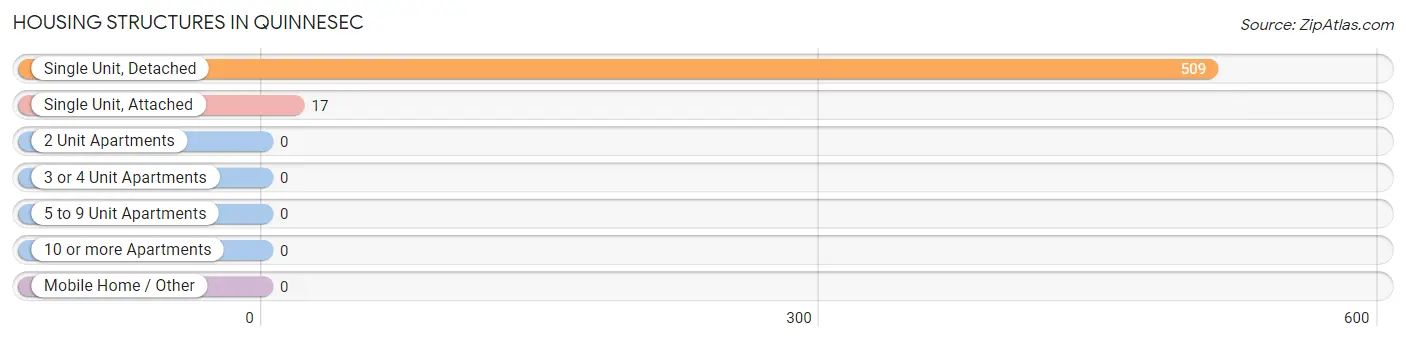
| Structure Type | # Housing Units | % Housing Units |
| Single Unit, Detached | 509 | 96.8% |
| Single Unit, Attached | 17 | 3.2% |
| 2 Unit Apartments | 0 | 0.0% |
| 3 or 4 Unit Apartments | 0 | 0.0% |
| 5 to 9 Unit Apartments | 0 | 0.0% |
| 10 or more Apartments | 0 | 0.0% |
| Mobile Home / Other | 0 | 0.0% |
| Total | 526 | 100.0% |
Housing Structures by Occupancy in Quinnesec
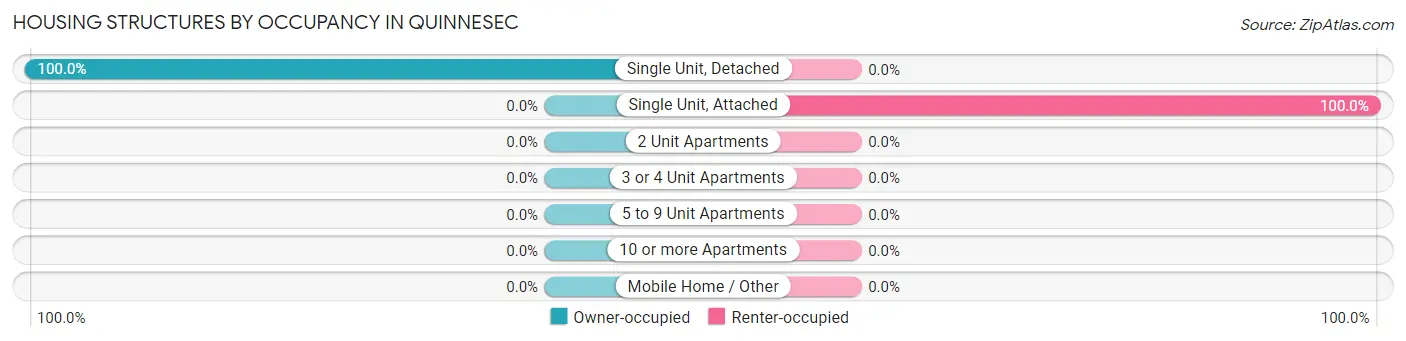
| Structure Type | Owner-occupied | Renter-occupied |
| Single Unit, Detached | 509 (100.0%) | 0 (0.0%) |
| Single Unit, Attached | 0 (0.0%) | 17 (100.0%) |
| 2 Unit Apartments | 0 (0.0%) | 0 (0.0%) |
| 3 or 4 Unit Apartments | 0 (0.0%) | 0 (0.0%) |
| 5 to 9 Unit Apartments | 0 (0.0%) | 0 (0.0%) |
| 10 or more Apartments | 0 (0.0%) | 0 (0.0%) |
| Mobile Home / Other | 0 (0.0%) | 0 (0.0%) |
| Total | 509 (96.8%) | 17 (3.2%) |
Housing Structures by Number of Rooms in Quinnesec
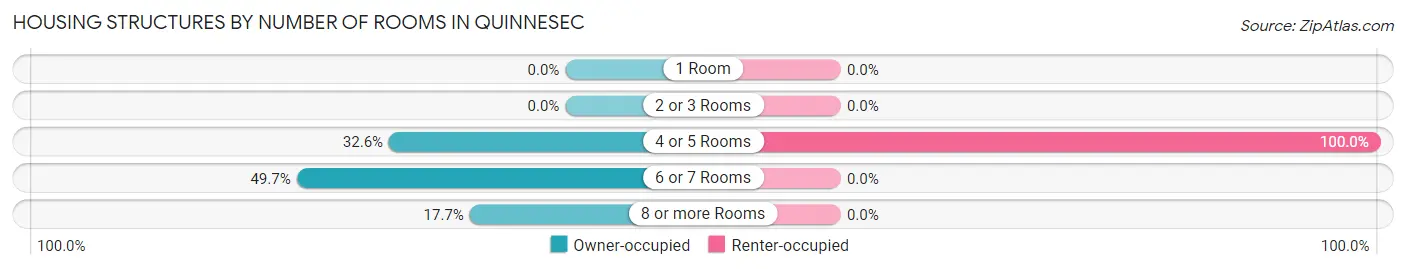
| Number of Rooms | Owner-occupied | Renter-occupied |
| 1 Room | 0 (0.0%) | 0 (0.0%) |
| 2 or 3 Rooms | 0 (0.0%) | 0 (0.0%) |
| 4 or 5 Rooms | 166 (32.6%) | 17 (100.0%) |
| 6 or 7 Rooms | 253 (49.7%) | 0 (0.0%) |
| 8 or more Rooms | 90 (17.7%) | 0 (0.0%) |
| Total | 509 (100.0%) | 17 (100.0%) |
Housing Structure by Heating Type in Quinnesec
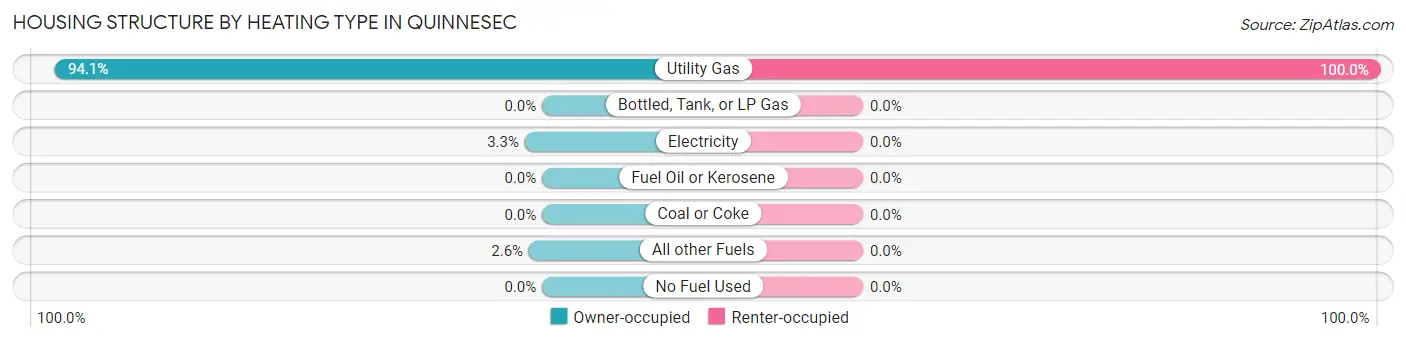
| Heating Type | Owner-occupied | Renter-occupied |
| Utility Gas | 479 (94.1%) | 17 (100.0%) |
| Bottled, Tank, or LP Gas | 0 (0.0%) | 0 (0.0%) |
| Electricity | 17 (3.3%) | 0 (0.0%) |
| Fuel Oil or Kerosene | 0 (0.0%) | 0 (0.0%) |
| Coal or Coke | 0 (0.0%) | 0 (0.0%) |
| All other Fuels | 13 (2.5%) | 0 (0.0%) |
| No Fuel Used | 0 (0.0%) | 0 (0.0%) |
| Total | 509 (100.0%) | 17 (100.0%) |
Household Vehicle Usage in Quinnesec
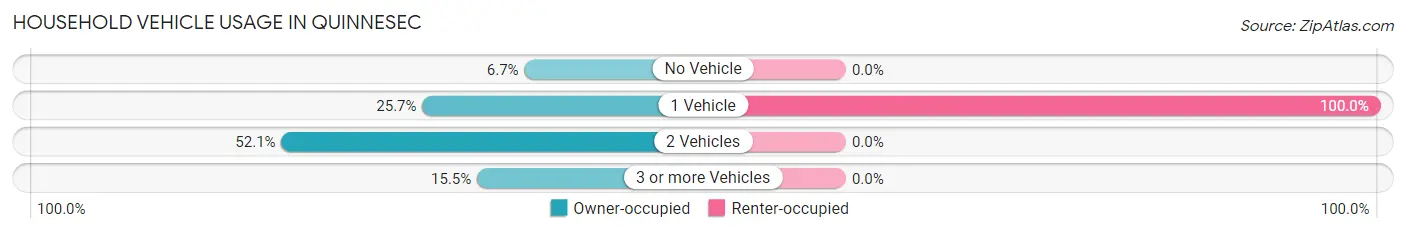
| Vehicles per Household | Owner-occupied | Renter-occupied |
| No Vehicle | 34 (6.7%) | 0 (0.0%) |
| 1 Vehicle | 131 (25.7%) | 17 (100.0%) |
| 2 Vehicles | 265 (52.1%) | 0 (0.0%) |
| 3 or more Vehicles | 79 (15.5%) | 0 (0.0%) |
| Total | 509 (100.0%) | 17 (100.0%) |
Real Estate & Mortgages in Quinnesec
Real Estate and Mortgage Overview in Quinnesec
| Characteristic | Without Mortgage | With Mortgage |
| Housing Units | 216 | 293 |
| Median Property Value | $118,800 | $100,700 |
| Median Household Income | $66,017 | $30 |
| Monthly Housing Costs | $285 | $13 |
| Real Estate Taxes | $1,395 | $0 |
Property Value by Mortgage Status in Quinnesec
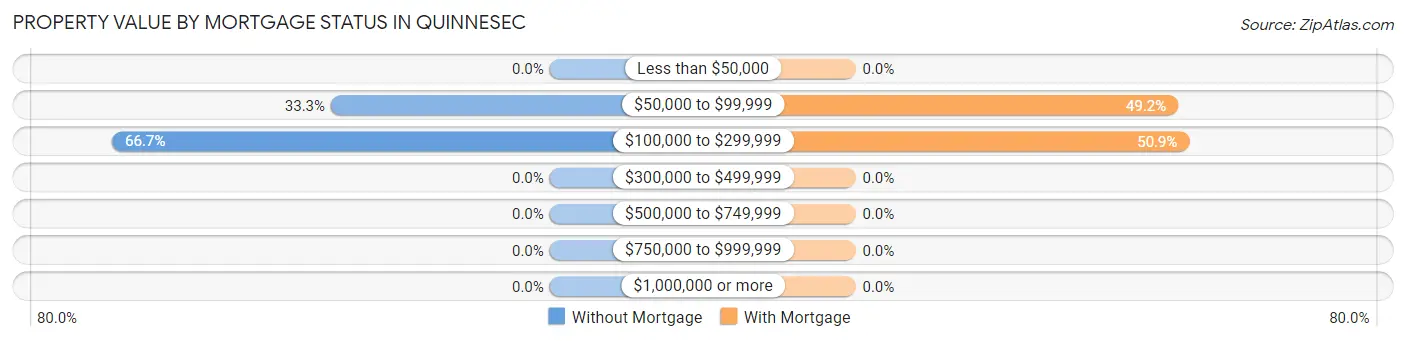
| Property Value | Without Mortgage | With Mortgage |
| Less than $50,000 | 0 (0.0%) | 0 (0.0%) |
| $50,000 to $99,999 | 72 (33.3%) | 144 (49.1%) |
| $100,000 to $299,999 | 144 (66.7%) | 149 (50.8%) |
| $300,000 to $499,999 | 0 (0.0%) | 0 (0.0%) |
| $500,000 to $749,999 | 0 (0.0%) | 0 (0.0%) |
| $750,000 to $999,999 | 0 (0.0%) | 0 (0.0%) |
| $1,000,000 or more | 0 (0.0%) | 0 (0.0%) |
| Total | 216 (100.0%) | 293 (100.0%) |
Household Income by Mortgage Status in Quinnesec
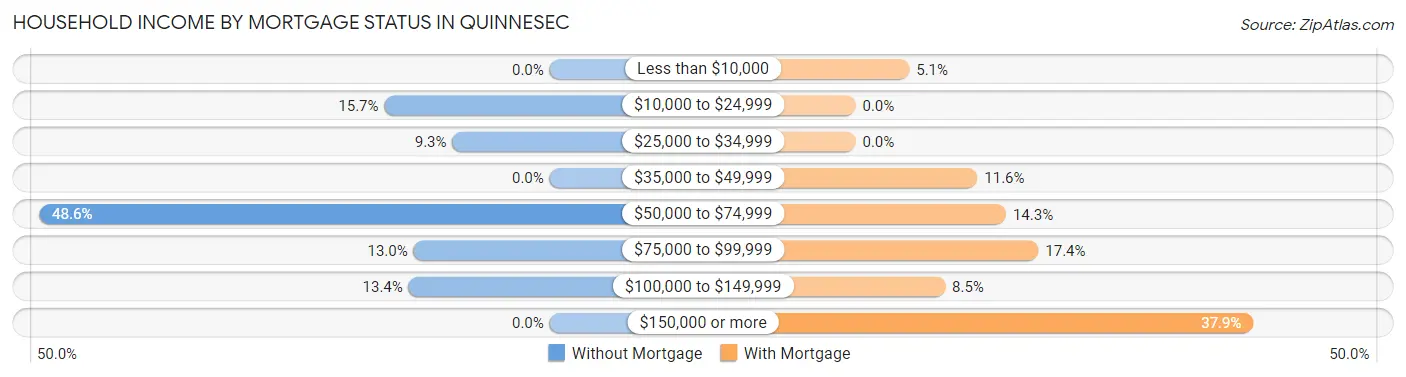
| Household Income | Without Mortgage | With Mortgage |
| Less than $10,000 | 0 (0.0%) | 15 (5.1%) |
| $10,000 to $24,999 | 34 (15.7%) | 0 (0.0%) |
| $25,000 to $34,999 | 20 (9.3%) | 0 (0.0%) |
| $35,000 to $49,999 | 0 (0.0%) | 34 (11.6%) |
| $50,000 to $74,999 | 105 (48.6%) | 42 (14.3%) |
| $75,000 to $99,999 | 28 (13.0%) | 51 (17.4%) |
| $100,000 to $149,999 | 29 (13.4%) | 25 (8.5%) |
| $150,000 or more | 0 (0.0%) | 111 (37.9%) |
| Total | 216 (100.0%) | 293 (100.0%) |
Property Value to Household Income Ratio in Quinnesec
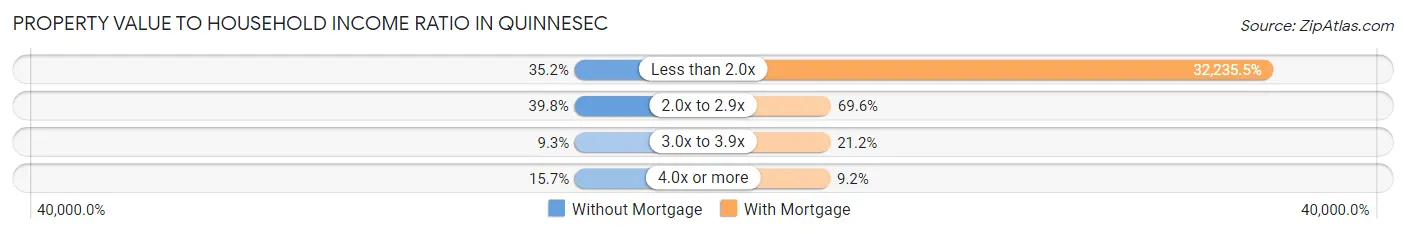
| Value-to-Income Ratio | Without Mortgage | With Mortgage |
| Less than 2.0x | 76 (35.2%) | 94,450 (32,235.5%) |
| 2.0x to 2.9x | 86 (39.8%) | 204 (69.6%) |
| 3.0x to 3.9x | 20 (9.3%) | 62 (21.2%) |
| 4.0x or more | 34 (15.7%) | 27 (9.2%) |
| Total | 216 (100.0%) | 293 (100.0%) |
Real Estate Taxes by Mortgage Status in Quinnesec
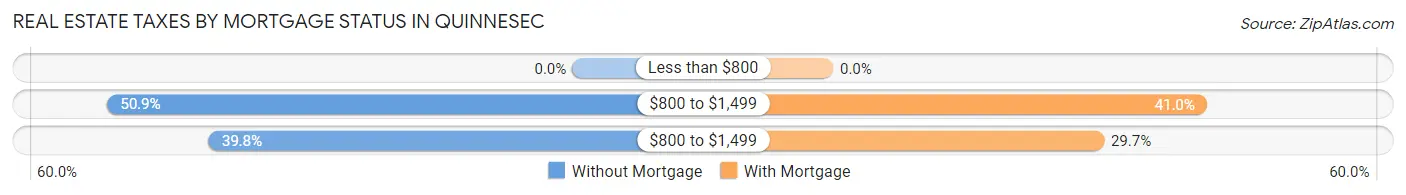
| Property Taxes | Without Mortgage | With Mortgage |
| Less than $800 | 0 (0.0%) | 0 (0.0%) |
| $800 to $1,499 | 110 (50.9%) | 120 (41.0%) |
| $800 to $1,499 | 86 (39.8%) | 87 (29.7%) |
| Total | 216 (100.0%) | 293 (100.0%) |
Health & Disability in Quinnesec
Health Insurance Coverage by Age in Quinnesec
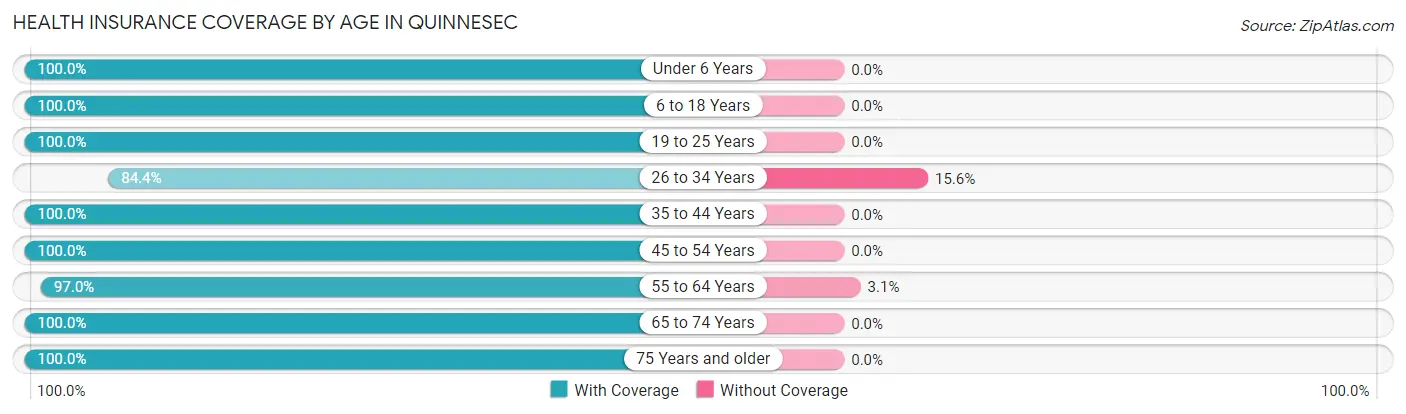
| Age Bracket | With Coverage | Without Coverage |
| Under 6 Years | 26 (100.0%) | 0 (0.0%) |
| 6 to 18 Years | 120 (100.0%) | 0 (0.0%) |
| 19 to 25 Years | 201 (100.0%) | 0 (0.0%) |
| 26 to 34 Years | 54 (84.4%) | 10 (15.6%) |
| 35 to 44 Years | 97 (100.0%) | 0 (0.0%) |
| 45 to 54 Years | 133 (100.0%) | 0 (0.0%) |
| 55 to 64 Years | 477 (97.0%) | 15 (3.0%) |
| 65 to 74 Years | 75 (100.0%) | 0 (0.0%) |
| 75 Years and older | 54 (100.0%) | 0 (0.0%) |
| Total | 1,237 (98.0%) | 25 (2.0%) |
Health Insurance Coverage by Citizenship Status in Quinnesec
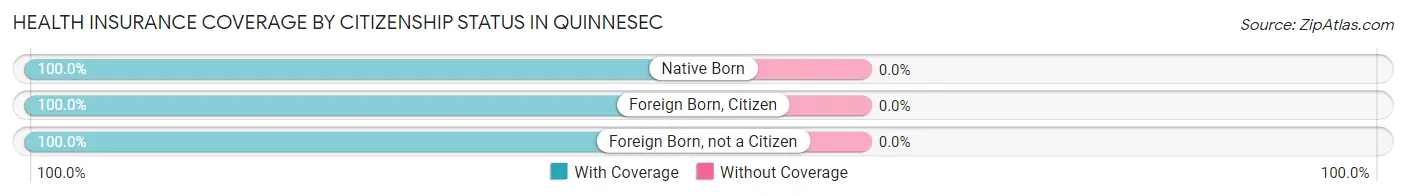
| Citizenship Status | With Coverage | Without Coverage |
| Native Born | 26 (100.0%) | 0 (0.0%) |
| Foreign Born, Citizen | 120 (100.0%) | 0 (0.0%) |
| Foreign Born, not a Citizen | 201 (100.0%) | 0 (0.0%) |
Health Insurance Coverage by Household Income in Quinnesec
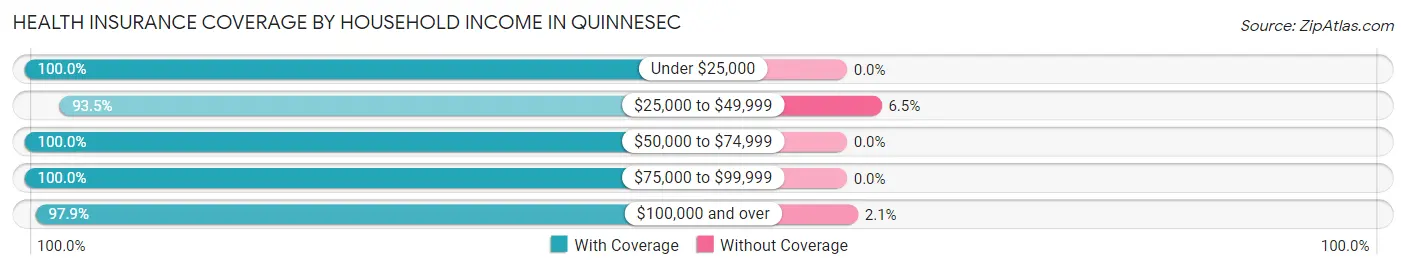
| Household Income | With Coverage | Without Coverage |
| Under $25,000 | 34 (100.0%) | 0 (0.0%) |
| $25,000 to $49,999 | 216 (93.5%) | 15 (6.5%) |
| $50,000 to $74,999 | 367 (100.0%) | 0 (0.0%) |
| $75,000 to $99,999 | 148 (100.0%) | 0 (0.0%) |
| $100,000 and over | 472 (97.9%) | 10 (2.1%) |
Public vs Private Health Insurance Coverage by Age in Quinnesec
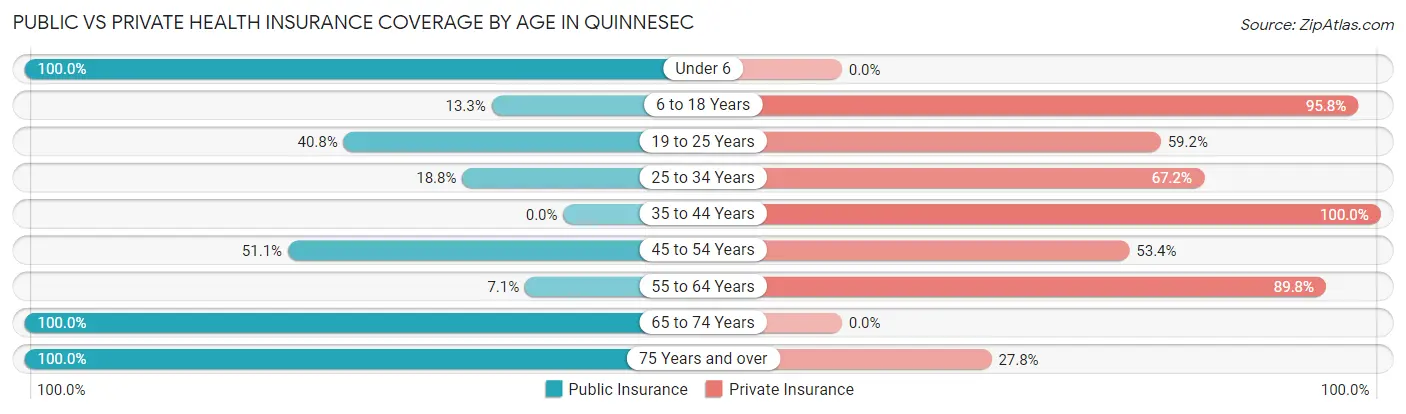
| Age Bracket | Public Insurance | Private Insurance |
| Under 6 | 26 (100.0%) | 0 (0.0%) |
| 6 to 18 Years | 16 (13.3%) | 115 (95.8%) |
| 19 to 25 Years | 82 (40.8%) | 119 (59.2%) |
| 25 to 34 Years | 12 (18.8%) | 43 (67.2%) |
| 35 to 44 Years | 0 (0.0%) | 97 (100.0%) |
| 45 to 54 Years | 68 (51.1%) | 71 (53.4%) |
| 55 to 64 Years | 35 (7.1%) | 442 (89.8%) |
| 65 to 74 Years | 75 (100.0%) | 0 (0.0%) |
| 75 Years and over | 54 (100.0%) | 15 (27.8%) |
| Total | 368 (29.2%) | 902 (71.5%) |
Disability Status by Sex by Age in Quinnesec
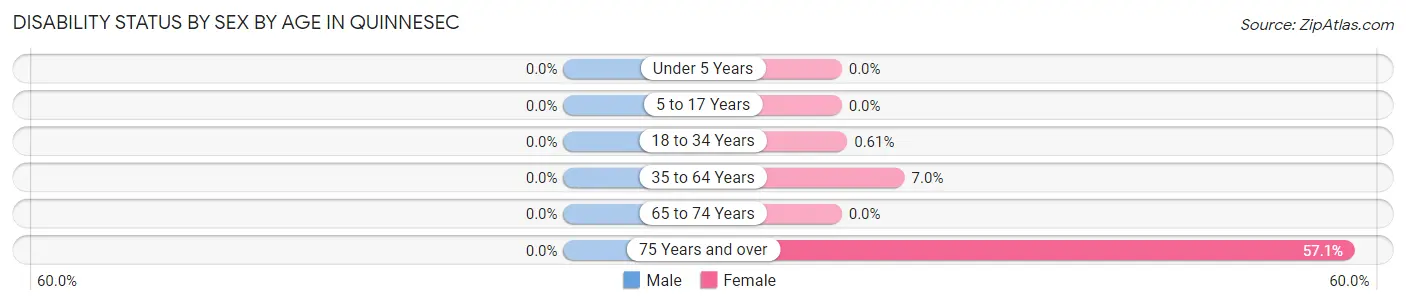
| Age Bracket | Male | Female |
| Under 5 Years | 0 (0.0%) | 0 (0.0%) |
| 5 to 17 Years | 0 (0.0%) | 0 (0.0%) |
| 18 to 34 Years | 0 (0.0%) | 1 (0.6%) |
| 35 to 64 Years | 0 (0.0%) | 25 (7.0%) |
| 65 to 74 Years | 0 (0.0%) | 0 (0.0%) |
| 75 Years and over | 0 (0.0%) | 20 (57.1%) |
Disability Class by Sex by Age in Quinnesec
Disability Class: Hearing Difficulty
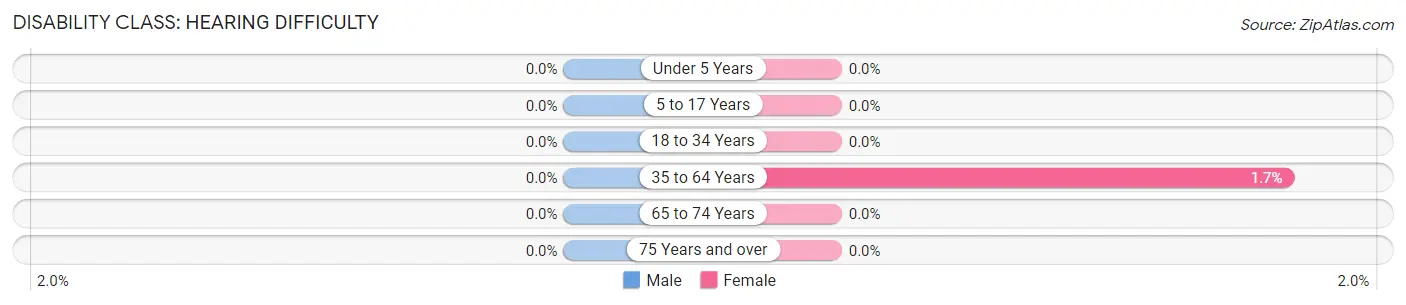
| Age Bracket | Male | Female |
| Under 5 Years | 0 (0.0%) | 0 (0.0%) |
| 5 to 17 Years | 0 (0.0%) | 0 (0.0%) |
| 18 to 34 Years | 0 (0.0%) | 0 (0.0%) |
| 35 to 64 Years | 0 (0.0%) | 6 (1.7%) |
| 65 to 74 Years | 0 (0.0%) | 0 (0.0%) |
| 75 Years and over | 0 (0.0%) | 0 (0.0%) |
Disability Class: Vision Difficulty
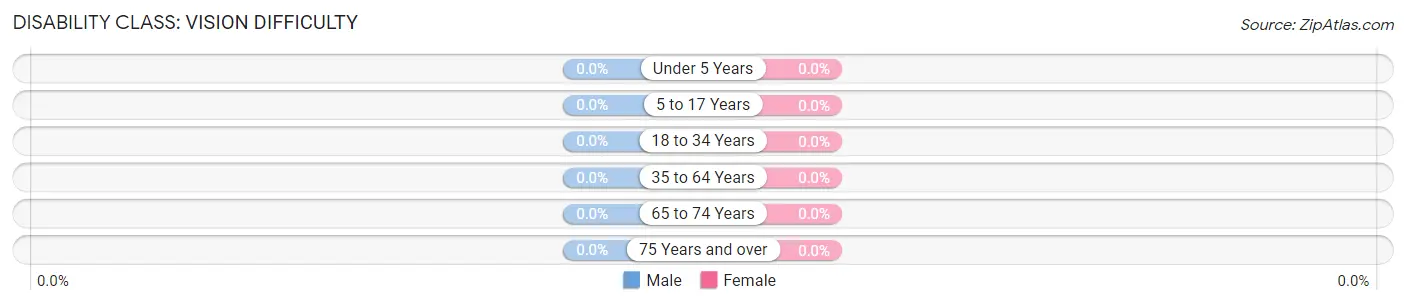
| Age Bracket | Male | Female |
| Under 5 Years | 0 (0.0%) | 0 (0.0%) |
| 5 to 17 Years | 0 (0.0%) | 0 (0.0%) |
| 18 to 34 Years | 0 (0.0%) | 0 (0.0%) |
| 35 to 64 Years | 0 (0.0%) | 0 (0.0%) |
| 65 to 74 Years | 0 (0.0%) | 0 (0.0%) |
| 75 Years and over | 0 (0.0%) | 0 (0.0%) |
Disability Class: Cognitive Difficulty
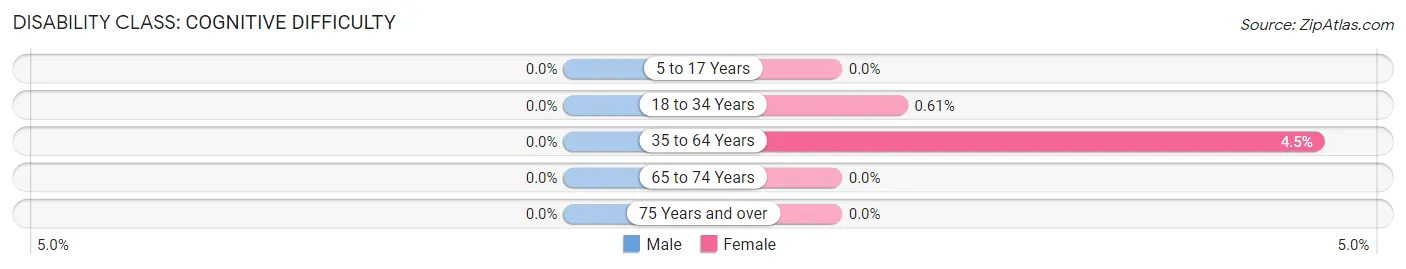
| Age Bracket | Male | Female |
| 5 to 17 Years | 0 (0.0%) | 0 (0.0%) |
| 18 to 34 Years | 0 (0.0%) | 1 (0.6%) |
| 35 to 64 Years | 0 (0.0%) | 16 (4.5%) |
| 65 to 74 Years | 0 (0.0%) | 0 (0.0%) |
| 75 Years and over | 0 (0.0%) | 0 (0.0%) |
Disability Class: Ambulatory Difficulty
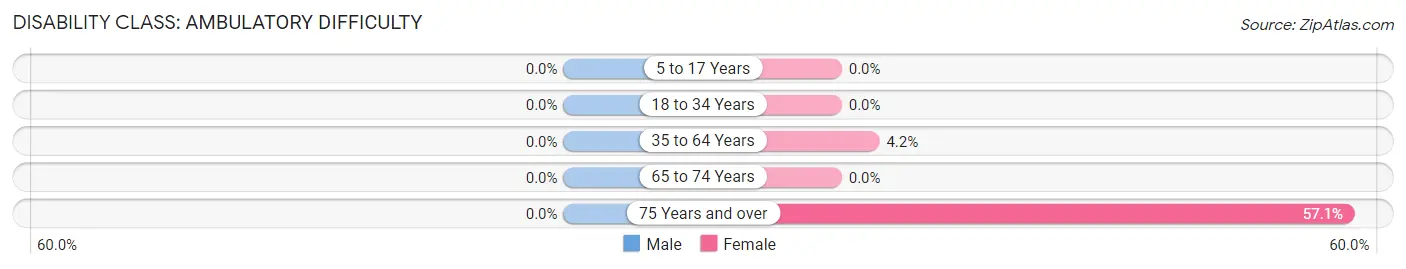
| Age Bracket | Male | Female |
| 5 to 17 Years | 0 (0.0%) | 0 (0.0%) |
| 18 to 34 Years | 0 (0.0%) | 0 (0.0%) |
| 35 to 64 Years | 0 (0.0%) | 15 (4.2%) |
| 65 to 74 Years | 0 (0.0%) | 0 (0.0%) |
| 75 Years and over | 0 (0.0%) | 20 (57.1%) |
Disability Class: Self-Care Difficulty
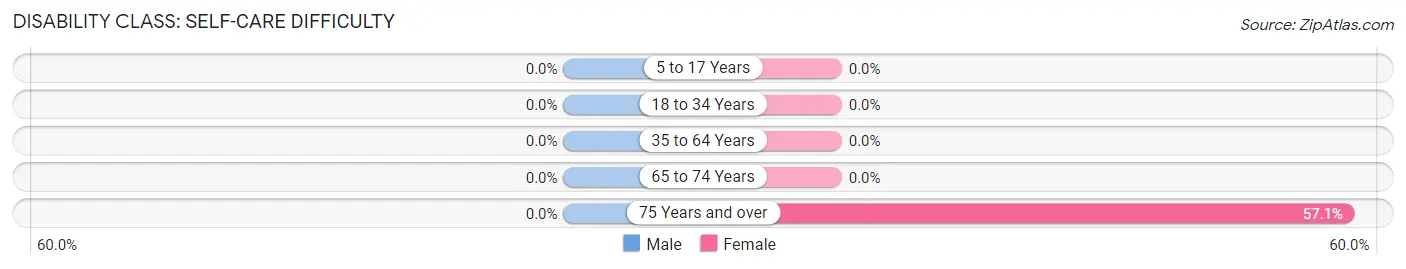
| Age Bracket | Male | Female |
| 5 to 17 Years | 0 (0.0%) | 0 (0.0%) |
| 18 to 34 Years | 0 (0.0%) | 0 (0.0%) |
| 35 to 64 Years | 0 (0.0%) | 0 (0.0%) |
| 65 to 74 Years | 0 (0.0%) | 0 (0.0%) |
| 75 Years and over | 0 (0.0%) | 20 (57.1%) |
Technology Access in Quinnesec
Computing Device Access in Quinnesec
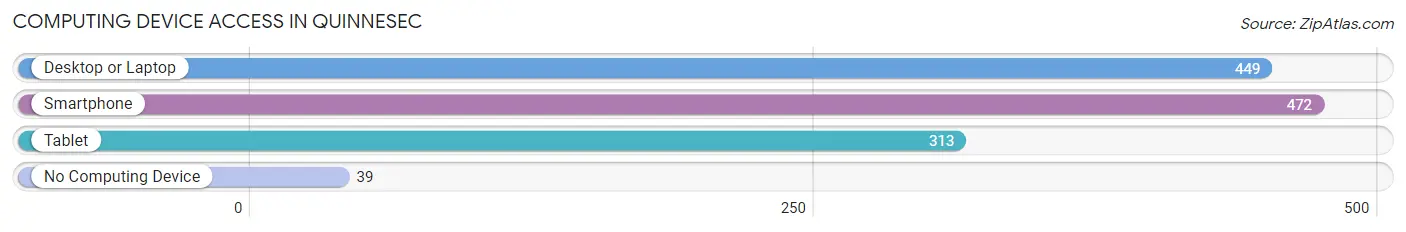
| Device Type | # Households | % Households |
| Desktop or Laptop | 449 | 85.4% |
| Smartphone | 472 | 89.7% |
| Tablet | 313 | 59.5% |
| No Computing Device | 39 | 7.4% |
| Total | 526 | 100.0% |
Internet Access in Quinnesec
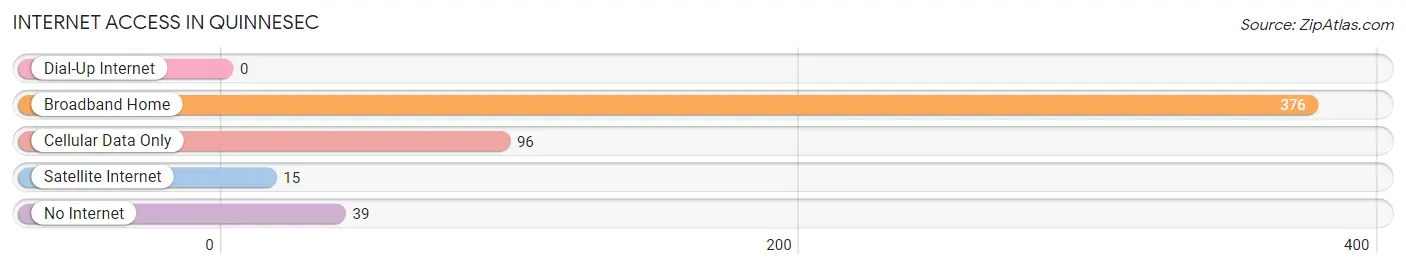
| Internet Type | # Households | % Households |
| Dial-Up Internet | 0 | 0.0% |
| Broadband Home | 376 | 71.5% |
| Cellular Data Only | 96 | 18.2% |
| Satellite Internet | 15 | 2.9% |
| No Internet | 39 | 7.4% |
| Total | 526 | 100.0% |
Quinnesec Summary
Quinnesec is a small unincorporated community located in Dickinson County, Michigan. It is situated on the Menominee River, which forms the border between Michigan and Wisconsin. The community is located approximately 10 miles east of Iron Mountain and about 20 miles west of Escanaba. The population of Quinnesec was estimated to be around 1,000 in 2020.
History
The area that is now Quinnesec was first settled in the late 1800s by a group of Swedish immigrants. The community was originally known as “Swedish Settlement” and was later renamed Quinnesec after the nearby Quinnesec Falls. The falls were named after Chief Quinnesec, a leader of the Menominee tribe who lived in the area.
The first post office in Quinnesec was established in 1891. The community was incorporated as a village in 1895. The village was later dissolved in 1967 and the area is now an unincorporated community.
Geography
Quinnesec is located in the Upper Peninsula of Michigan, in Dickinson County. It is situated on the Menominee River, which forms the border between Michigan and Wisconsin. The community is located approximately 10 miles east of Iron Mountain and about 20 miles west of Escanaba.
The terrain in the area is mostly flat, with some rolling hills. The climate is humid continental, with cold winters and warm summers. The average annual temperature is around 40°F (4°C).
Economy
The economy of Quinnesec is largely based on agriculture and forestry. The area is home to several farms, as well as a sawmill and a paper mill. The community also has a few small businesses, including a grocery store, a hardware store, and a restaurant.
Demographics
The population of Quinnesec was estimated to be around 1,000 in 2020. The racial makeup of the community is predominantly white (97.2%), with a small percentage of African Americans (1.2%) and Native Americans (1.6%). The median household income is around $37,000, and the median home value is around $90,000.
The majority of the population (90%) is of Swedish descent, with the remaining 10% being of other European descent. The majority of the population (90%) is Christian, with the remaining 10% being of other faiths.
Conclusion
Quinnesec is a small unincorporated community located in Dickinson County, Michigan. It is situated on the Menominee River, which forms the border between Michigan and Wisconsin. The community is largely based on agriculture and forestry, and the population is predominantly of Swedish descent. The median household income is around $37,000, and the median home value is around $90,000.
Common Questions
What is Per Capita Income in Quinnesec?
Per Capita income in Quinnesec is $34,268.
What is the Median Family Income in Quinnesec?
Median Family Income in Quinnesec is $68,462.
What is the Median Household income in Quinnesec?
Median Household Income in Quinnesec is $66,715.
What is Income or Wage Gap in Quinnesec?
Income or Wage Gap in Quinnesec is 41.9%.
Women in Quinnesec earn 58.1 cents for every dollar earned by a man.
What is Inequality or Gini Index in Quinnesec?
Inequality or Gini Index in Quinnesec is 0.35.
What is the Total Population of Quinnesec?
Total Population of Quinnesec is 1,262.
What is the Total Male Population of Quinnesec?
Total Male Population of Quinnesec is 619.
What is the Total Female Population of Quinnesec?
Total Female Population of Quinnesec is 643.
What is the Ratio of Males per 100 Females in Quinnesec?
There are 96.27 Males per 100 Females in Quinnesec.
What is the Ratio of Females per 100 Males in Quinnesec?
There are 103.88 Females per 100 Males in Quinnesec.
What is the Median Population Age in Quinnesec?
Median Population Age in Quinnesec is 52.0 Years.
What is the Average Family Size in Quinnesec
Average Family Size in Quinnesec is 2.4 People.
What is the Average Household Size in Quinnesec
Average Household Size in Quinnesec is 2.4 People.
How Large is the Labor Force in Quinnesec?
There are 881 People in the Labor Forcein in Quinnesec.
What is the Percentage of People in the Labor Force in Quinnesec?
73.7% of People are in the Labor Force in Quinnesec.
What is the Unemployment Rate in Quinnesec?
Unemployment Rate in Quinnesec is 2.8%.