Prescott, MI Map & Demographics
Prescott Map
Prescott Overview
$19,052
PER CAPITA INCOME
$54,550
AVG FAMILY INCOME
$53,550
AVG HOUSEHOLD INCOME
60.9%
WAGE / INCOME GAP [ % ]
39.1¢/ $1
WAGE / INCOME GAP [ $ ]
0.39
INEQUALITY / GINI INDEX
388
TOTAL POPULATION
186
MALE POPULATION
202
FEMALE POPULATION
92.08
MALES / 100 FEMALES
108.60
FEMALES / 100 MALES
43.3
MEDIAN AGE
3.6
AVG FAMILY SIZE
3.2
AVG HOUSEHOLD SIZE
135
LABOR FORCE [ PEOPLE ]
45.0%
PERCENT IN LABOR FORCE
14.1%
UNEMPLOYMENT RATE
Prescott Zip Codes
Prescott Area Codes
Income in Prescott
Income Overview in Prescott
Per Capita Income in Prescott is $19,052, while median incomes of families and households are $54,550 and $53,550 respectively.
| Characteristic | Number | Measure |
| Per Capita Income | 388 | $19,052 |
| Median Family Income | 89 | $54,550 |
| Mean Family Income | 89 | $61,281 |
| Median Household Income | 121 | $53,550 |
| Mean Household Income | 121 | $60,759 |
| Income Deficit | 89 | $0 |
| Wage / Income Gap (%) | 388 | 60.87% |
| Wage / Income Gap ($) | 388 | 39.13¢ per $1 |
| Gini / Inequality Index | 388 | 0.39 |
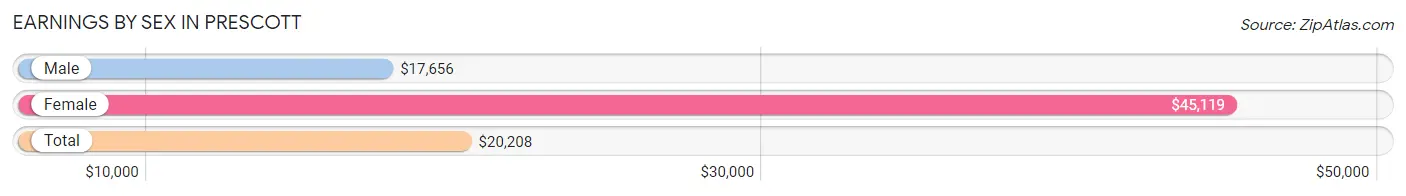
Earnings by Sex in Prescott
Average Earnings in Prescott are $20,208, $17,656 for men and $45,119 for women, a difference of 60.9%.
| Sex | Number | Average Earnings |
| Male | 77 (54.6%) | $17,656 |
| Female | 64 (45.4%) | $45,119 |
| Total | 141 (100.0%) | $20,208 |
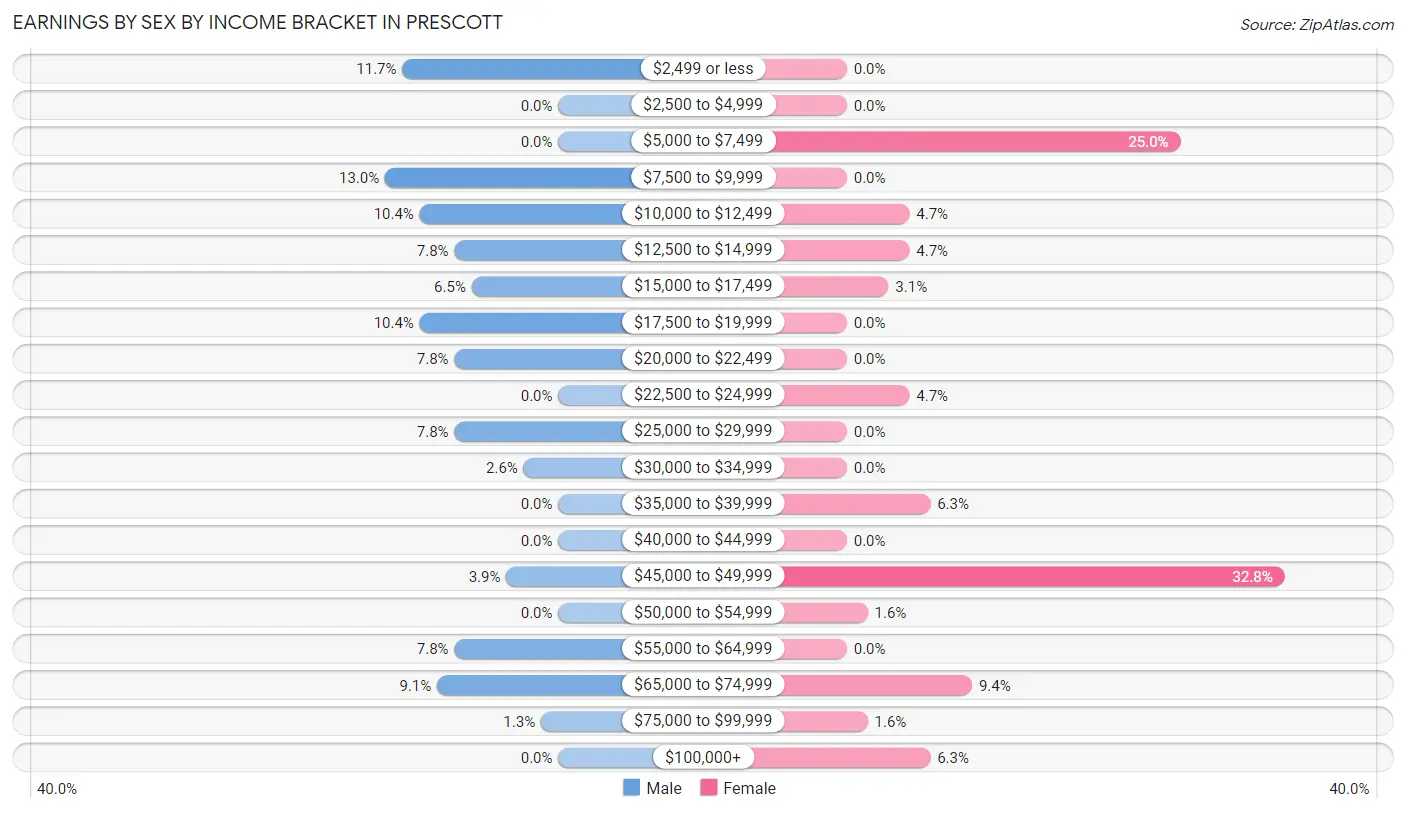
Earnings by Sex by Income Bracket in Prescott
The most common earnings brackets in Prescott are $7,500 to $9,999 for men (10 | 13.0%) and $45,000 to $49,999 for women (21 | 32.8%).
| Income | Male | Female |
| $2,499 or less | 9 (11.7%) | 0 (0.0%) |
| $2,500 to $4,999 | 0 (0.0%) | 0 (0.0%) |
| $5,000 to $7,499 | 0 (0.0%) | 16 (25.0%) |
| $7,500 to $9,999 | 10 (13.0%) | 0 (0.0%) |
| $10,000 to $12,499 | 8 (10.4%) | 3 (4.7%) |
| $12,500 to $14,999 | 6 (7.8%) | 3 (4.7%) |
| $15,000 to $17,499 | 5 (6.5%) | 2 (3.1%) |
| $17,500 to $19,999 | 8 (10.4%) | 0 (0.0%) |
| $20,000 to $22,499 | 6 (7.8%) | 0 (0.0%) |
| $22,500 to $24,999 | 0 (0.0%) | 3 (4.7%) |
| $25,000 to $29,999 | 6 (7.8%) | 0 (0.0%) |
| $30,000 to $34,999 | 2 (2.6%) | 0 (0.0%) |
| $35,000 to $39,999 | 0 (0.0%) | 4 (6.2%) |
| $40,000 to $44,999 | 0 (0.0%) | 0 (0.0%) |
| $45,000 to $49,999 | 3 (3.9%) | 21 (32.8%) |
| $50,000 to $54,999 | 0 (0.0%) | 1 (1.6%) |
| $55,000 to $64,999 | 6 (7.8%) | 0 (0.0%) |
| $65,000 to $74,999 | 7 (9.1%) | 6 (9.4%) |
| $75,000 to $99,999 | 1 (1.3%) | 1 (1.6%) |
| $100,000+ | 0 (0.0%) | 4 (6.2%) |
| Total | 77 (100.0%) | 64 (100.0%) |
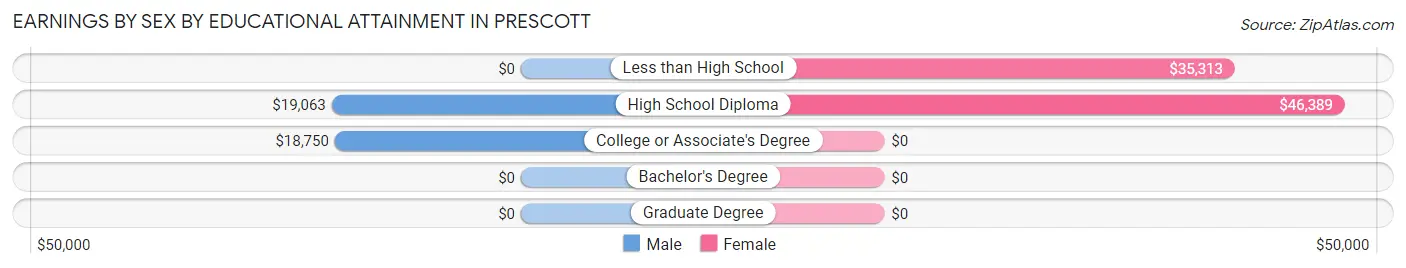
Earnings by Sex by Educational Attainment in Prescott
Average earnings in Prescott are $22,083 for men and $45,595 for women, a difference of 51.6%. Men with an educational attainment of high school diploma enjoy the highest average annual earnings of $19,063, while those with college or associate's degree education earn the least with $18,750. Women with an educational attainment of high school diploma earn the most with the average annual earnings of $46,389, while those with less than high school education have the smallest earnings of $35,313.
| Educational Attainment | Male Income | Female Income |
| Less than High School | - | - |
| High School Diploma | $19,063 | $46,389 |
| College or Associate's Degree | $18,750 | $0 |
| Bachelor's Degree | - | - |
| Graduate Degree | - | - |
| Total | $22,083 | $45,595 |
Family Income in Prescott
Family Income Brackets in Prescott
According to the Prescott family income data, there are 45 families falling into the $50,000 to $74,999 income range, which is the most common income bracket and makes up 50.6% of all families.
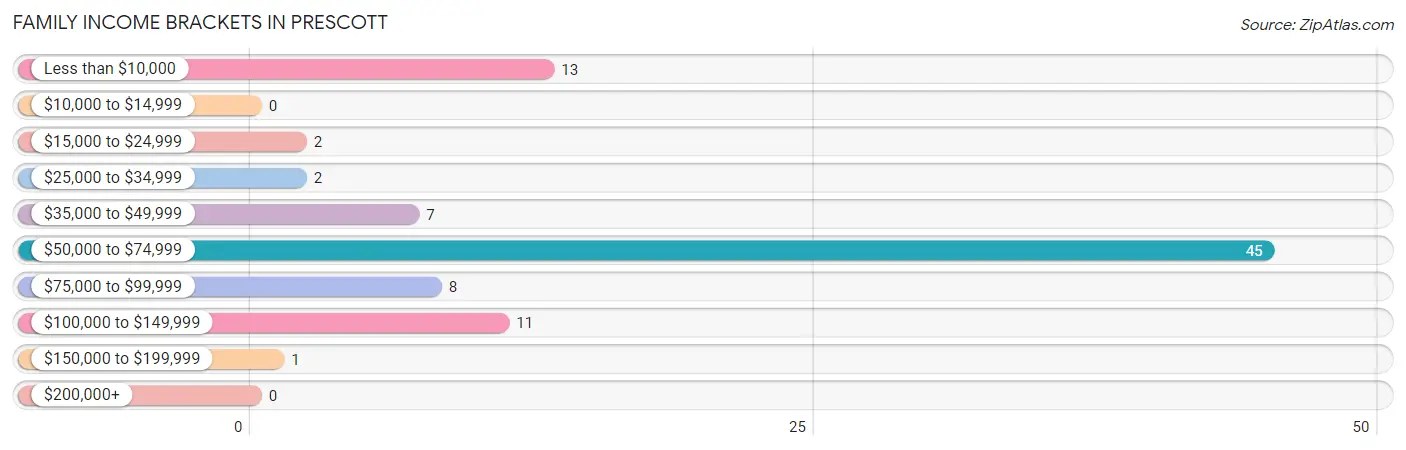
| Income Bracket | # Families | % Families |
| Less than $10,000 | 13 | 14.6% |
| $10,000 to $14,999 | 0 | 0.0% |
| $15,000 to $24,999 | 2 | 2.2% |
| $25,000 to $34,999 | 2 | 2.2% |
| $35,000 to $49,999 | 7 | 7.9% |
| $50,000 to $74,999 | 45 | 50.6% |
| $75,000 to $99,999 | 8 | 9.0% |
| $100,000 to $149,999 | 11 | 12.4% |
| $150,000 to $199,999 | 1 | 1.1% |
| $200,000+ | 0 | 0.0% |
Family Income by Famaliy Size in Prescott
3-person families (27 | 30.3%) account for the highest median family income in Prescott with $54,688 per family, while 2-person families (34 | 38.2%) have the highest median income of $26,538 per family member.
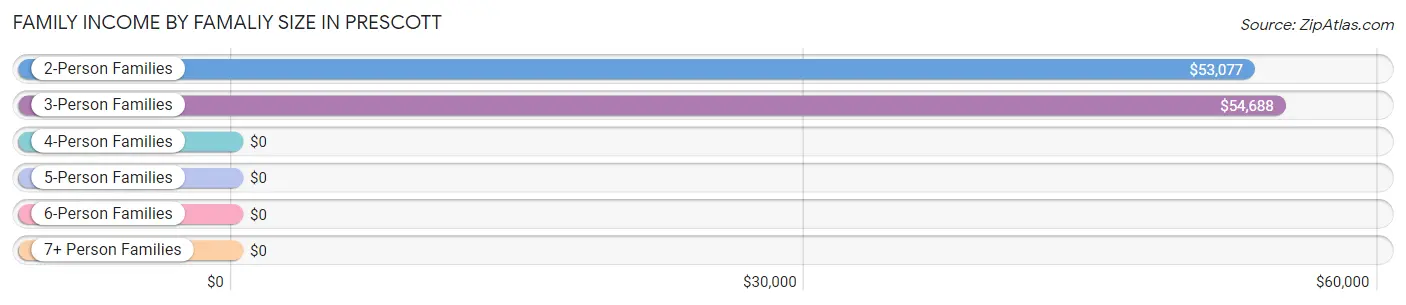
| Income Bracket | # Families | Median Income |
| 2-Person Families | 34 (38.2%) | $53,077 |
| 3-Person Families | 27 (30.3%) | $54,688 |
| 4-Person Families | 0 (0.0%) | $0 |
| 5-Person Families | 15 (16.9%) | $0 |
| 6-Person Families | 13 (14.6%) | $0 |
| 7+ Person Families | 0 (0.0%) | $0 |
| Total | 89 (100.0%) | $54,550 |
Family Income by Number of Earners in Prescott
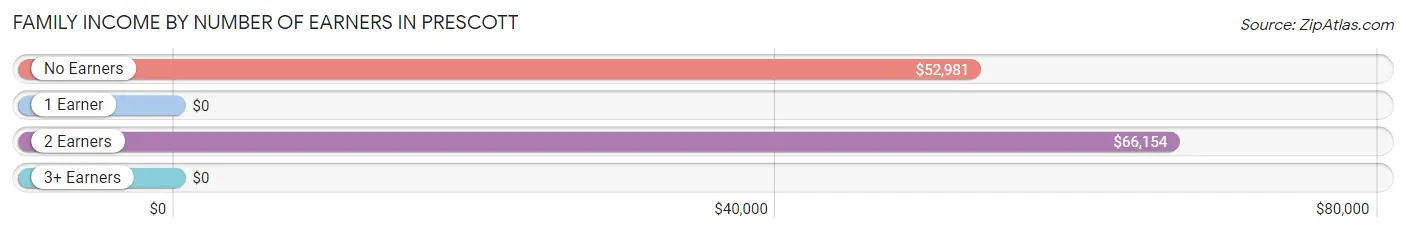
| Number of Earners | # Families | Median Income |
| No Earners | 29 (32.6%) | $52,981 |
| 1 Earner | 17 (19.1%) | $0 |
| 2 Earners | 42 (47.2%) | $66,154 |
| 3+ Earners | 1 (1.1%) | $0 |
| Total | 89 (100.0%) | $54,550 |
Household Income in Prescott
Household Income Brackets in Prescott
With 42 households falling in the category, the $50,000 to $74,999 income range is the most frequent in Prescott, accounting for 34.7% of all households.
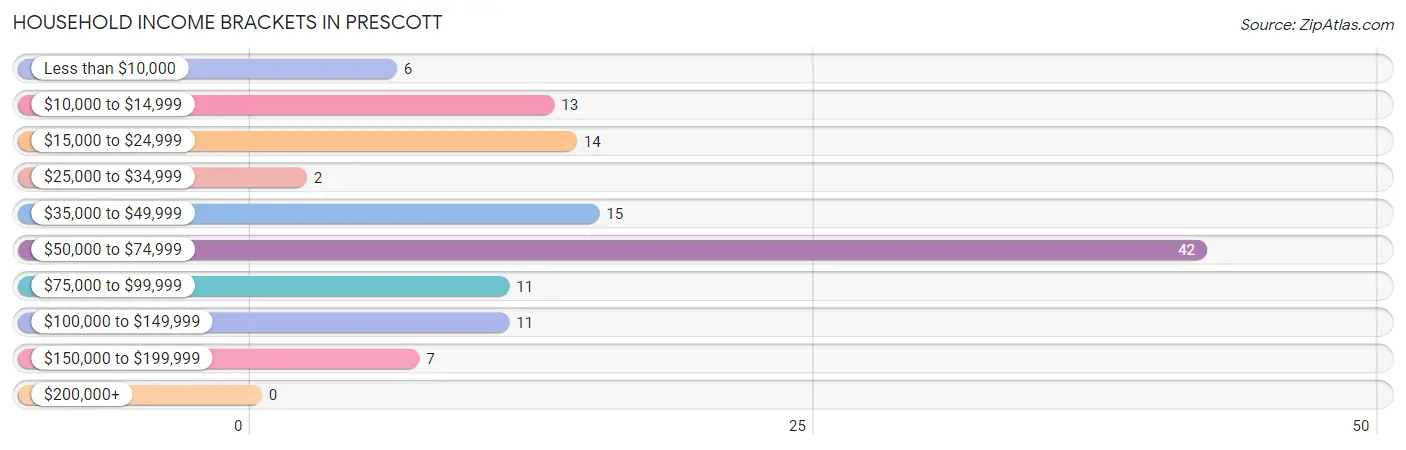
| Income Bracket | # Households | % Households |
| Less than $10,000 | 6 | 5.0% |
| $10,000 to $14,999 | 13 | 10.7% |
| $15,000 to $24,999 | 14 | 11.6% |
| $25,000 to $34,999 | 2 | 1.7% |
| $35,000 to $49,999 | 15 | 12.4% |
| $50,000 to $74,999 | 42 | 34.7% |
| $75,000 to $99,999 | 11 | 9.1% |
| $100,000 to $149,999 | 11 | 9.1% |
| $150,000 to $199,999 | 7 | 5.8% |
| $200,000+ | 0 | 0.0% |
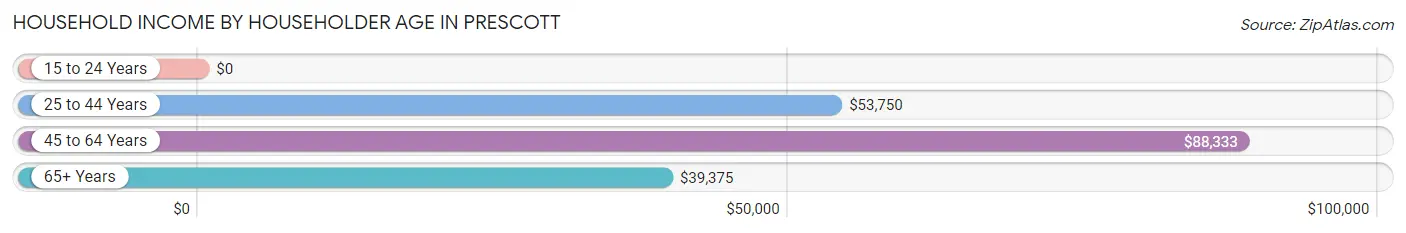
Household Income by Householder Age in Prescott
The median household income in Prescott is $53,550, with the highest median household income of $88,333 found in the 45 to 64 years age bracket for the primary householder. A total of 30 households (24.8%) fall into this category.
| Income Bracket | # Households | Median Income |
| 15 to 24 Years | 0 (0.0%) | $0 |
| 25 to 44 Years | 48 (39.7%) | $53,750 |
| 45 to 64 Years | 30 (24.8%) | $88,333 |
| 65+ Years | 43 (35.5%) | $39,375 |
| Total | 121 (100.0%) | $53,550 |
Poverty in Prescott
Income Below Poverty by Sex and Age in Prescott
With 17.3% poverty level for males and 29.2% for females among the residents of Prescott, 6 to 11 year old males and 5 year old females are the most vulnerable to poverty, with 9 males (75.0%) and 7 females (100.0%) in their respective age groups living below the poverty level.
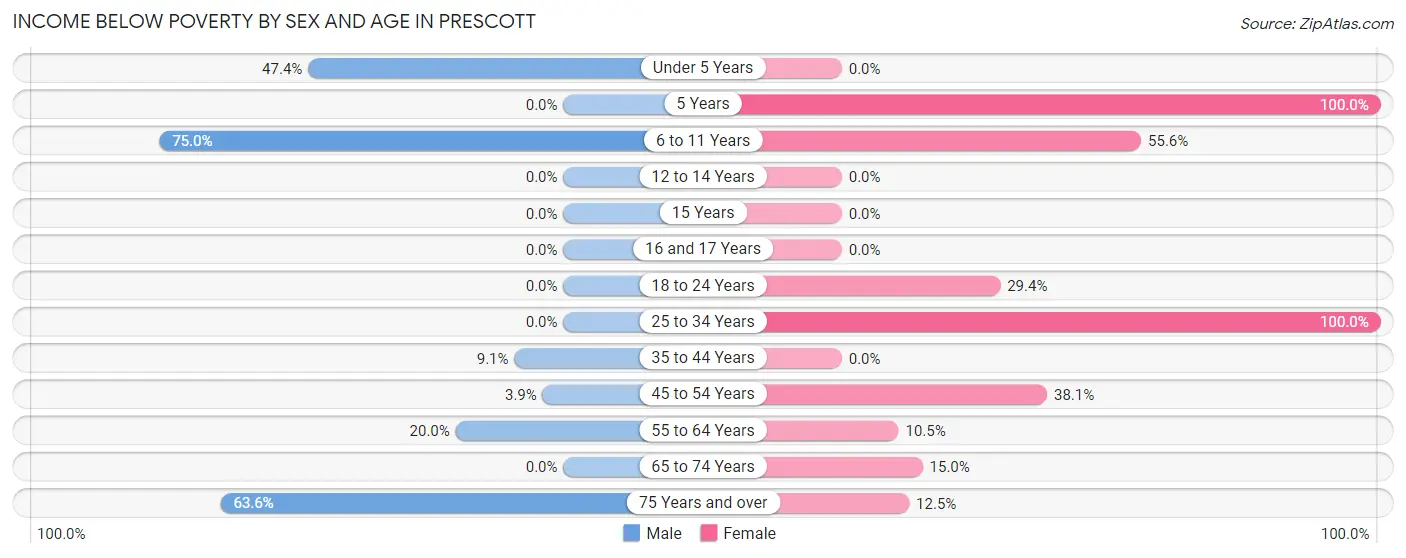
| Age Bracket | Male | Female |
| Under 5 Years | 9 (47.4%) | 0 (0.0%) |
| 5 Years | 0 (0.0%) | 7 (100.0%) |
| 6 to 11 Years | 9 (75.0%) | 15 (55.6%) |
| 12 to 14 Years | 0 (0.0%) | 0 (0.0%) |
| 15 Years | 0 (0.0%) | 0 (0.0%) |
| 16 and 17 Years | 0 (0.0%) | 0 (0.0%) |
| 18 to 24 Years | 0 (0.0%) | 5 (29.4%) |
| 25 to 34 Years | 0 (0.0%) | 15 (100.0%) |
| 35 to 44 Years | 2 (9.1%) | 0 (0.0%) |
| 45 to 54 Years | 1 (3.8%) | 8 (38.1%) |
| 55 to 64 Years | 3 (20.0%) | 2 (10.5%) |
| 65 to 74 Years | 0 (0.0%) | 6 (15.0%) |
| 75 Years and over | 7 (63.6%) | 1 (12.5%) |
| Total | 31 (17.3%) | 59 (29.2%) |
Income Above Poverty by Sex and Age in Prescott
According to the poverty statistics in Prescott, males aged 16 and 17 years and females aged under 5 years are the age groups that are most secure financially, with 100.0% of males and 100.0% of females in these age groups living above the poverty line.
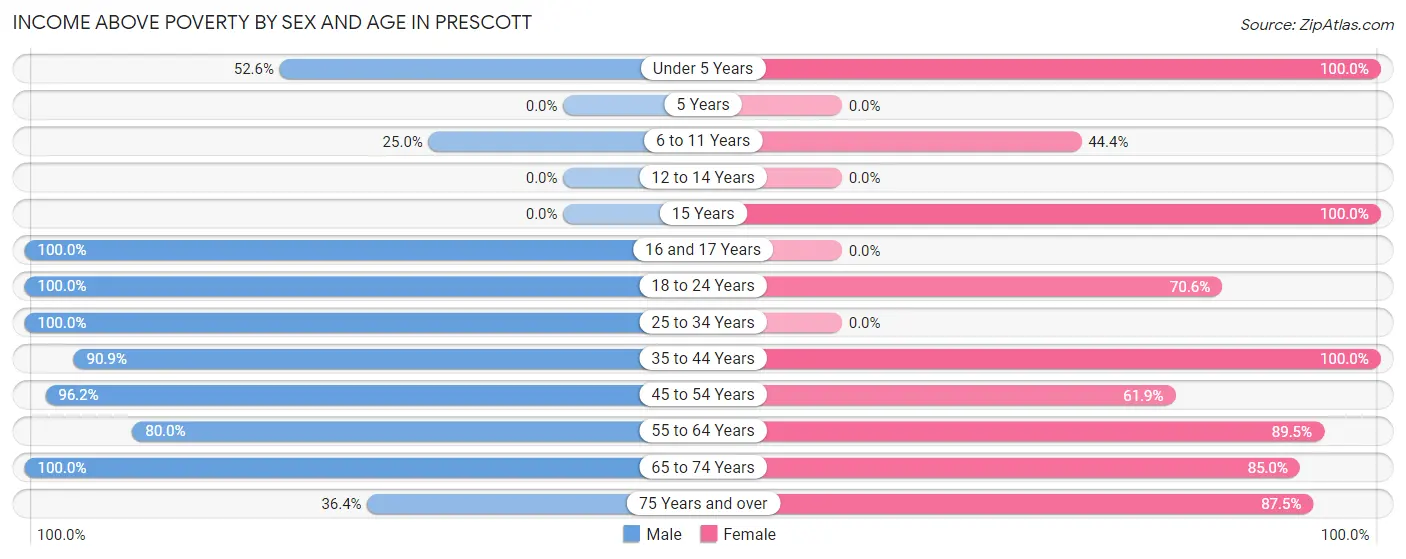
| Age Bracket | Male | Female |
| Under 5 Years | 10 (52.6%) | 4 (100.0%) |
| 5 Years | 0 (0.0%) | 0 (0.0%) |
| 6 to 11 Years | 3 (25.0%) | 12 (44.4%) |
| 12 to 14 Years | 0 (0.0%) | 0 (0.0%) |
| 15 Years | 0 (0.0%) | 12 (100.0%) |
| 16 and 17 Years | 12 (100.0%) | 0 (0.0%) |
| 18 to 24 Years | 34 (100.0%) | 12 (70.6%) |
| 25 to 34 Years | 6 (100.0%) | 0 (0.0%) |
| 35 to 44 Years | 20 (90.9%) | 32 (100.0%) |
| 45 to 54 Years | 25 (96.2%) | 13 (61.9%) |
| 55 to 64 Years | 12 (80.0%) | 17 (89.5%) |
| 65 to 74 Years | 22 (100.0%) | 34 (85.0%) |
| 75 Years and over | 4 (36.4%) | 7 (87.5%) |
| Total | 148 (82.7%) | 143 (70.8%) |
Income Below Poverty Among Married-Couple Families in Prescott
The poverty statistics for married-couple families in Prescott show that 12.1% or 8 of the total 66 families live below the poverty line. Families with no children have the highest poverty rate of 18.6%, comprising of 8 families. On the other hand, families with 1 or 2 children have the lowest poverty rate of 0.0%, which includes 0 families.
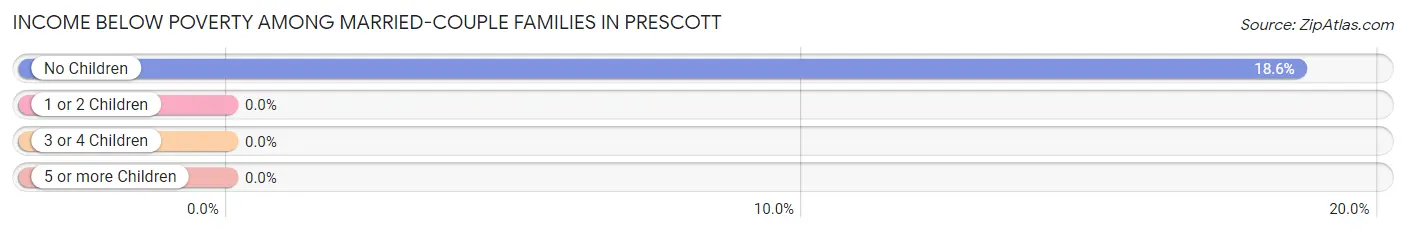
| Children | Above Poverty | Below Poverty |
| No Children | 35 (81.4%) | 8 (18.6%) |
| 1 or 2 Children | 23 (100.0%) | 0 (0.0%) |
| 3 or 4 Children | 0 (0.0%) | 0 (0.0%) |
| 5 or more Children | 0 (0.0%) | 0 (0.0%) |
| Total | 58 (87.9%) | 8 (12.1%) |
Income Below Poverty Among Single-Parent Households in Prescott
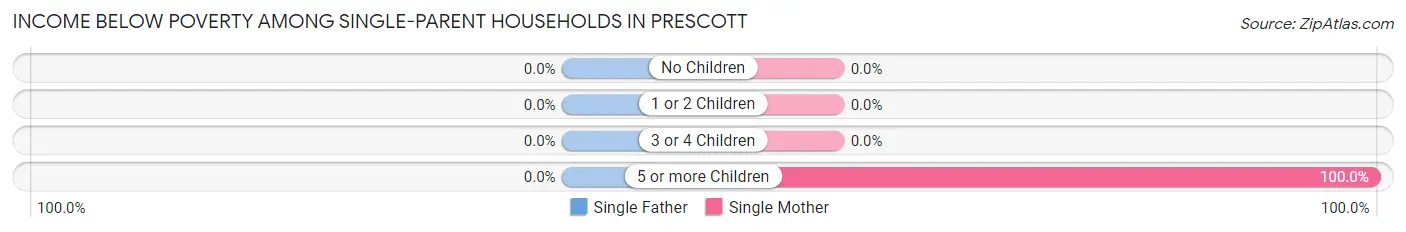
| Children | Single Father | Single Mother |
| No Children | 0 (0.0%) | 0 (0.0%) |
| 1 or 2 Children | 0 (0.0%) | 0 (0.0%) |
| 3 or 4 Children | 0 (0.0%) | 0 (0.0%) |
| 5 or more Children | 0 (0.0%) | 7 (100.0%) |
| Total | 0 (0.0%) | 7 (30.4%) |
Income Below Poverty Among Married-Couple vs Single-Parent Households in Prescott
The poverty data for Prescott shows that 8 of the married-couple family households (12.1%) and 7 of the single-parent households (30.4%) are living below the poverty level. Within the married-couple family households, those with no children have the highest poverty rate, with 8 households (18.6%) falling below the poverty line. Among the single-parent households, those with 5 or more children have the highest poverty rate, with 7 household (100.0%) living below poverty.
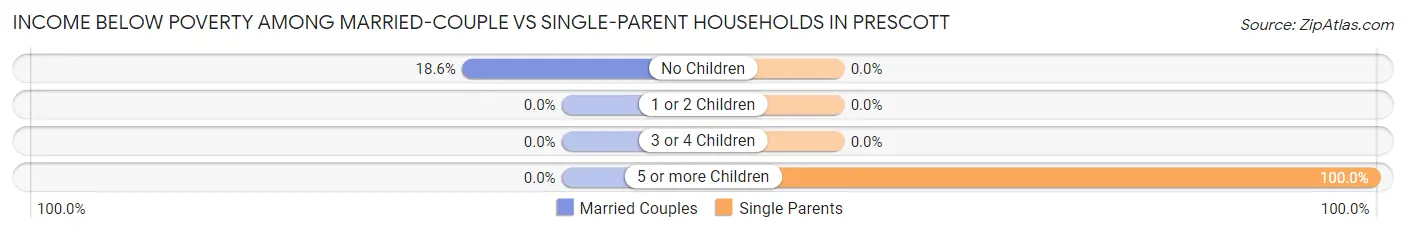
| Children | Married-Couple Families | Single-Parent Households |
| No Children | 8 (18.6%) | 0 (0.0%) |
| 1 or 2 Children | 0 (0.0%) | 0 (0.0%) |
| 3 or 4 Children | 0 (0.0%) | 0 (0.0%) |
| 5 or more Children | 0 (0.0%) | 7 (100.0%) |
| Total | 8 (12.1%) | 7 (30.4%) |
Race in Prescott
The most populous races in Prescott are White / Caucasian (375 | 96.7%), Hispanic or Latino (14 | 3.6%), and Two or more Races (10 | 2.6%).
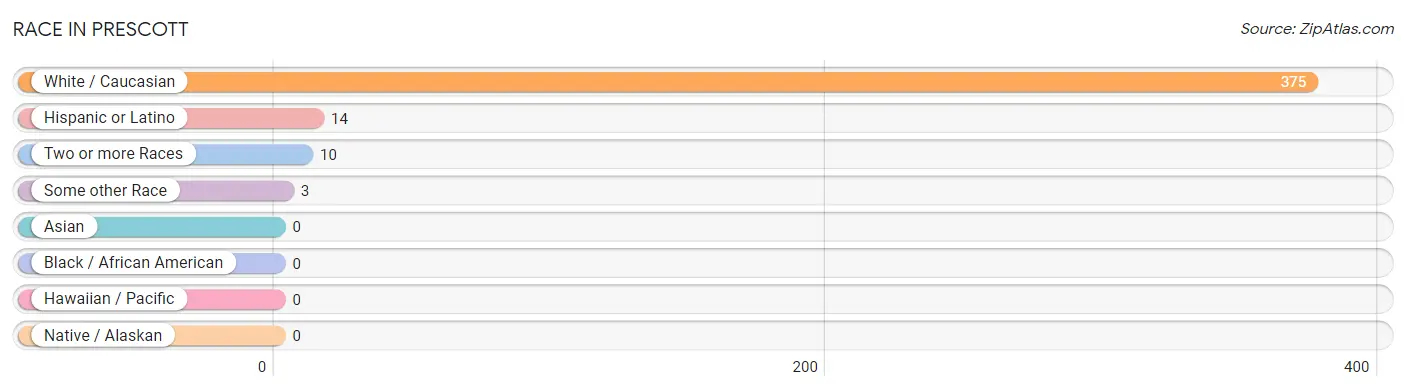
| Race | # Population | % Population |
| Asian | 0 | 0.0% |
| Black / African American | 0 | 0.0% |
| Hawaiian / Pacific | 0 | 0.0% |
| Hispanic or Latino | 14 | 3.6% |
| Native / Alaskan | 0 | 0.0% |
| White / Caucasian | 375 | 96.7% |
| Two or more Races | 10 | 2.6% |
| Some other Race | 3 | 0.8% |
| Total | 388 | 100.0% |
Ancestry in Prescott
The most populous ancestries reported in Prescott are English (58 | 14.9%), German (46 | 11.9%), Italian (39 | 10.1%), Polish (30 | 7.7%), and Irish (22 | 5.7%), together accounting for 50.3% of all Prescott residents.
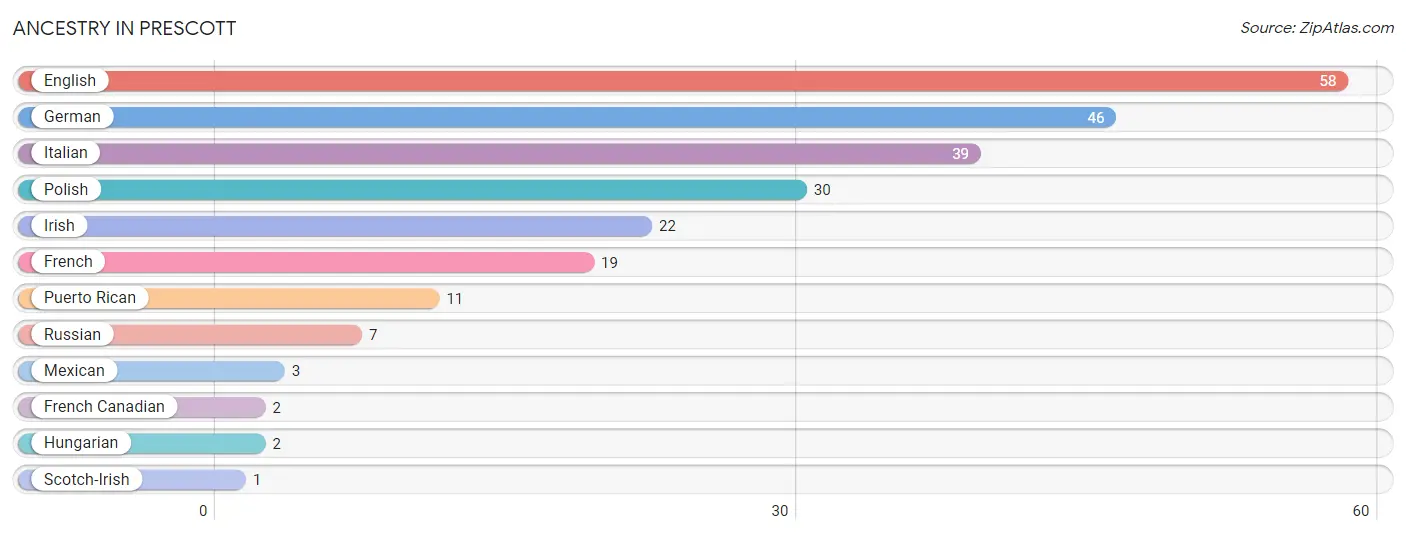
| Ancestry | # Population | % Population |
| English | 58 | 14.9% |
| French | 19 | 4.9% |
| French Canadian | 2 | 0.5% |
| German | 46 | 11.9% |
| Hungarian | 2 | 0.5% |
| Irish | 22 | 5.7% |
| Italian | 39 | 10.1% |
| Mexican | 3 | 0.8% |
| Polish | 30 | 7.7% |
| Puerto Rican | 11 | 2.8% |
| Russian | 7 | 1.8% |
| Scotch-Irish | 1 | 0.3% | View All 12 Rows |
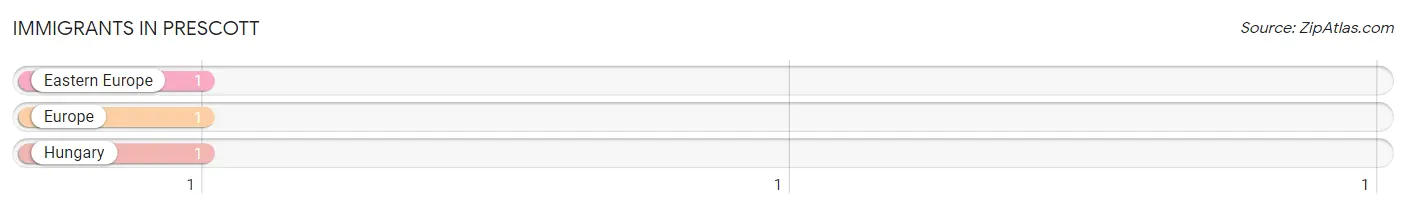
Immigrants in Prescott
The most numerous immigrant groups reported in Prescott came from Eastern Europe (1 | 0.3%), Europe (1 | 0.3%), and Hungary (1 | 0.3%), together accounting for 0.8% of all Prescott residents.
| Immigration Origin | # Population | % Population |
| Eastern Europe | 1 | 0.3% |
| Europe | 1 | 0.3% |
| Hungary | 1 | 0.3% | View All 3 Rows |
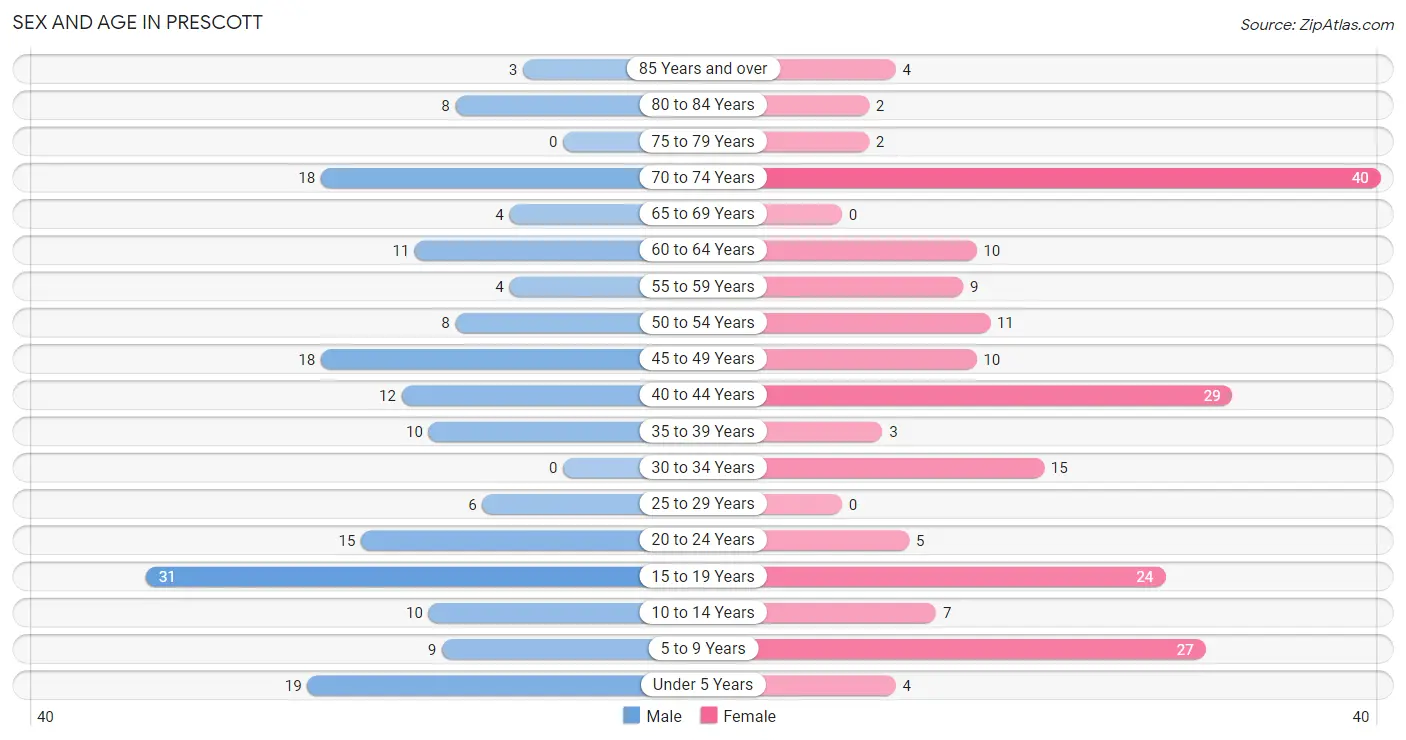
Sex and Age in Prescott
Sex and Age in Prescott
The most populous age groups in Prescott are 15 to 19 Years (31 | 16.7%) for men and 70 to 74 Years (40 | 19.8%) for women.
| Age Bracket | Male | Female |
| Under 5 Years | 19 (10.2%) | 4 (2.0%) |
| 5 to 9 Years | 9 (4.8%) | 27 (13.4%) |
| 10 to 14 Years | 10 (5.4%) | 7 (3.5%) |
| 15 to 19 Years | 31 (16.7%) | 24 (11.9%) |
| 20 to 24 Years | 15 (8.1%) | 5 (2.5%) |
| 25 to 29 Years | 6 (3.2%) | 0 (0.0%) |
| 30 to 34 Years | 0 (0.0%) | 15 (7.4%) |
| 35 to 39 Years | 10 (5.4%) | 3 (1.5%) |
| 40 to 44 Years | 12 (6.5%) | 29 (14.4%) |
| 45 to 49 Years | 18 (9.7%) | 10 (5.0%) |
| 50 to 54 Years | 8 (4.3%) | 11 (5.4%) |
| 55 to 59 Years | 4 (2.1%) | 9 (4.5%) |
| 60 to 64 Years | 11 (5.9%) | 10 (5.0%) |
| 65 to 69 Years | 4 (2.1%) | 0 (0.0%) |
| 70 to 74 Years | 18 (9.7%) | 40 (19.8%) |
| 75 to 79 Years | 0 (0.0%) | 2 (1.0%) |
| 80 to 84 Years | 8 (4.3%) | 2 (1.0%) |
| 85 Years and over | 3 (1.6%) | 4 (2.0%) |
| Total | 186 (100.0%) | 202 (100.0%) |
Families and Households in Prescott
Median Family Size in Prescott
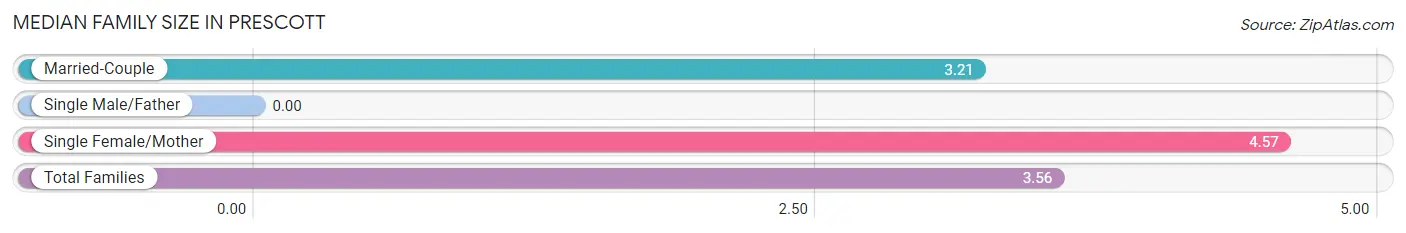
| Family Type | # Families | Family Size |
| Married-Couple | 66 (74.2%) | 3.21 |
| Single Male/Father | 0 (0.0%) | - |
| Single Female/Mother | 23 (25.8%) | 4.57 |
| Total Families | 89 (100.0%) | 3.56 |
Median Household Size in Prescott
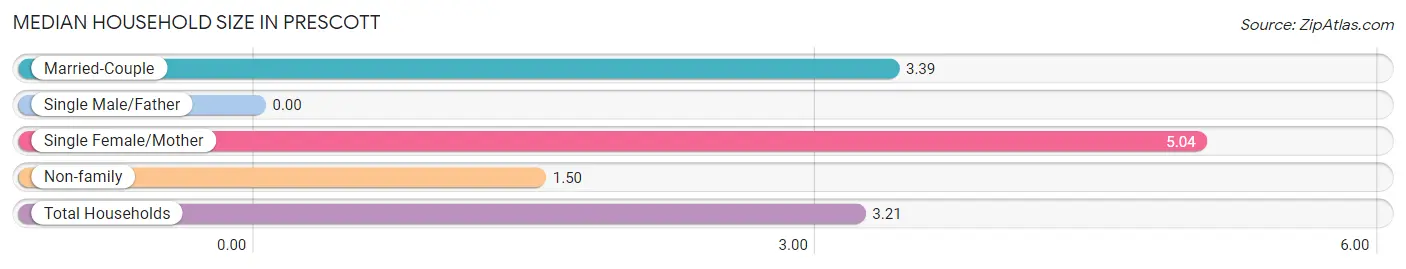
| Household Type | # Households | Household Size |
| Married-Couple | 66 (54.5%) | 3.39 |
| Single Male/Father | 0 (0.0%) | - |
| Single Female/Mother | 23 (19.0%) | 5.04 |
| Non-family | 32 (26.5%) | 1.50 |
| Total Households | 121 (100.0%) | 3.21 |
Household Size by Marriage Status in Prescott
Out of a total of 121 households in Prescott, 89 (73.6%) are family households, while 32 (26.5%) are nonfamily households. The most numerous type of family households are 3-person households, comprising 32, and the most common type of nonfamily households are 1-person households, comprising 23.
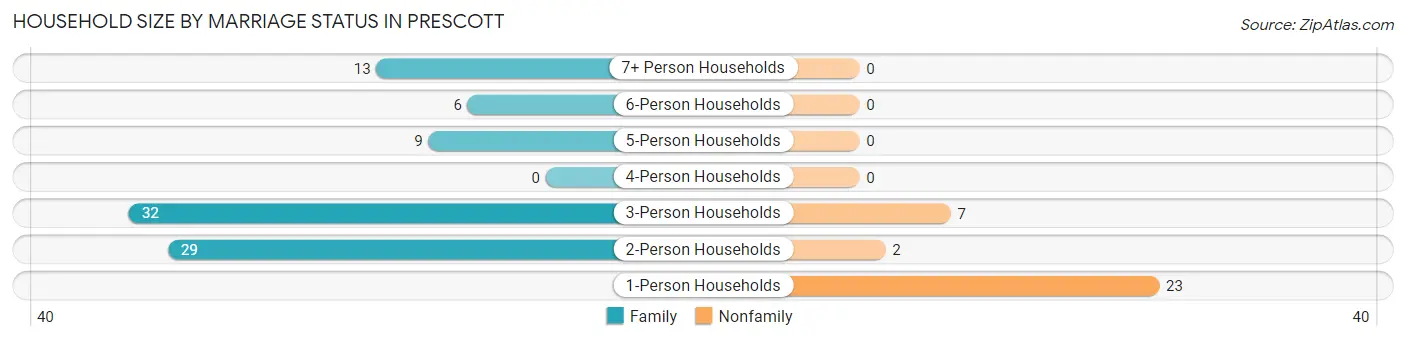
| Household Size | Family Households | Nonfamily Households |
| 1-Person Households | - | 23 (19.0%) |
| 2-Person Households | 29 (24.0%) | 2 (1.7%) |
| 3-Person Households | 32 (26.5%) | 7 (5.8%) |
| 4-Person Households | 0 (0.0%) | 0 (0.0%) |
| 5-Person Households | 9 (7.4%) | 0 (0.0%) |
| 6-Person Households | 6 (5.0%) | 0 (0.0%) |
| 7+ Person Households | 13 (10.7%) | 0 (0.0%) |
| Total | 89 (73.6%) | 32 (26.5%) |
Female Fertility in Prescott
Fertility by Age in Prescott
Average fertility rate in Prescott is 34.0 births per 1,000 women. Women in the age bracket of 35 to 50 years have the highest fertility rate with 70.0 births per 1,000 women. Women in the age bracket of 35 to 50 years acount for 100.0% of all women with births.
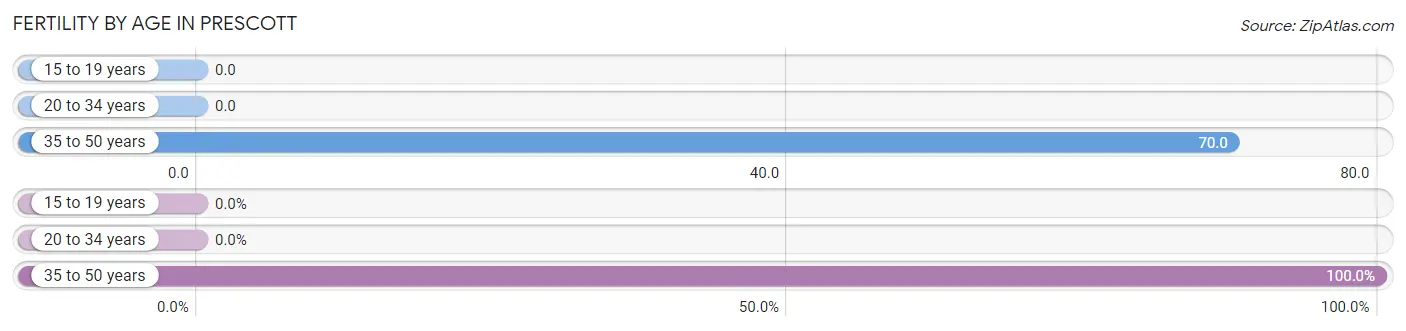
| Age Bracket | Women with Births | Births / 1,000 Women |
| 15 to 19 years | 0 (0.0%) | 0.0 |
| 20 to 34 years | 0 (0.0%) | 0.0 |
| 35 to 50 years | 3 (100.0%) | 70.0 |
| Total | 3 (100.0%) | 34.0 |
Fertility by Age by Marriage Status in Prescott
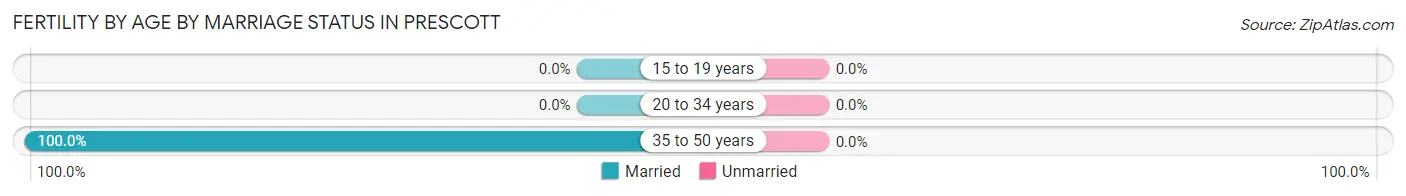
| Age Bracket | Married | Unmarried |
| 15 to 19 years | 0 (0.0%) | 0 (0.0%) |
| 20 to 34 years | 0 (0.0%) | 0 (0.0%) |
| 35 to 50 years | 3 (100.0%) | 0 (0.0%) |
| Total | 3 (100.0%) | 0 (0.0%) |
Fertility by Education in Prescott
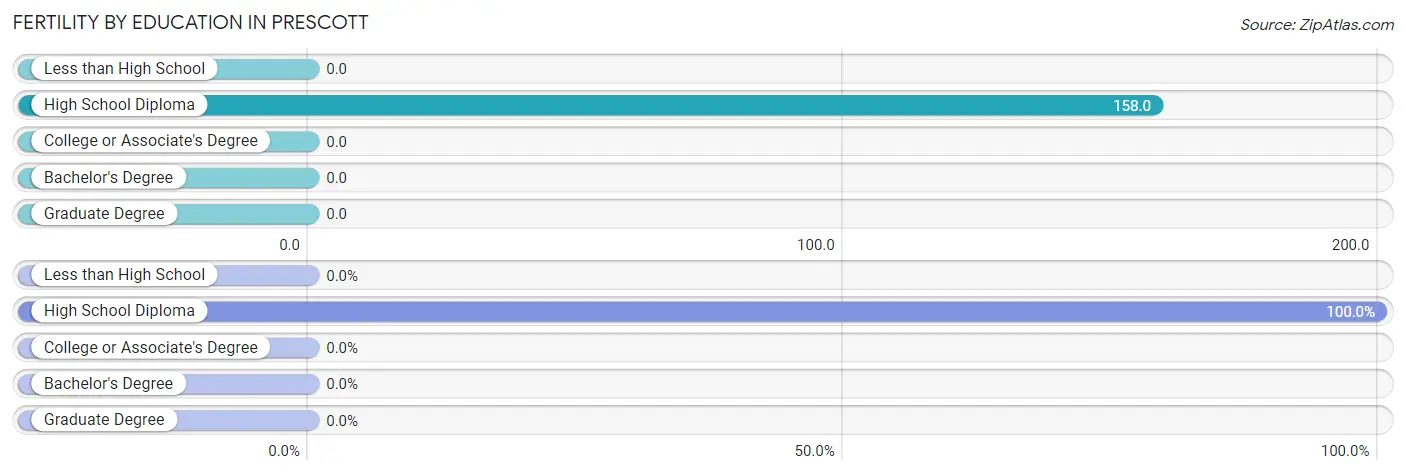
| Educational Attainment | Women with Births | Births / 1,000 Women |
| Less than High School | 0 (0.0%) | 0.0 |
| High School Diploma | 3 (100.0%) | 158.0 |
| College or Associate's Degree | 0 (0.0%) | 0.0 |
| Bachelor's Degree | 0 (0.0%) | 0.0 |
| Graduate Degree | 0 (0.0%) | 0.0 |
| Total | 3 (100.0%) | 34.0 |
Fertility by Education by Marriage Status in Prescott
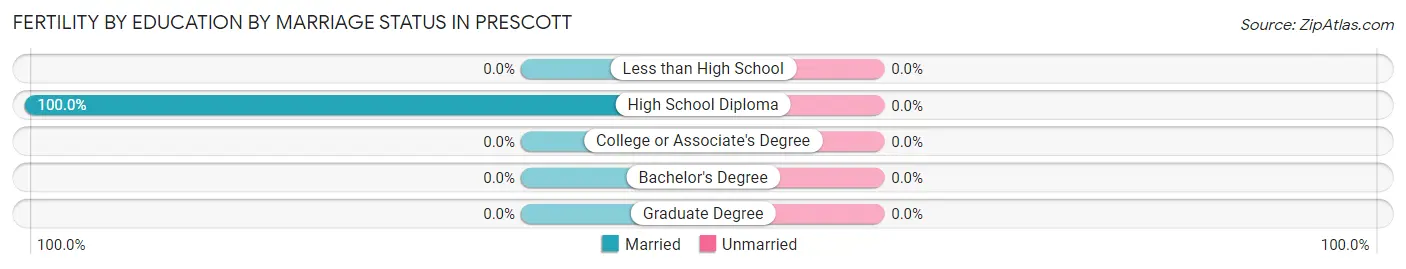
| Educational Attainment | Married | Unmarried |
| Less than High School | 0 (0.0%) | 0 (0.0%) |
| High School Diploma | 3 (100.0%) | 0 (0.0%) |
| College or Associate's Degree | 0 (0.0%) | 0 (0.0%) |
| Bachelor's Degree | 0 (0.0%) | 0 (0.0%) |
| Graduate Degree | 0 (0.0%) | 0 (0.0%) |
| Total | 3 (100.0%) | 0 (0.0%) |
Employment Characteristics in Prescott
Employment by Class of Employer in Prescott
Among the 116 employed individuals in Prescott, private company employees (90 | 77.6%), self-employed (not incorporated) (10 | 8.6%), and not-for-profit organizations (10 | 8.6%) make up the most common classes of employment.
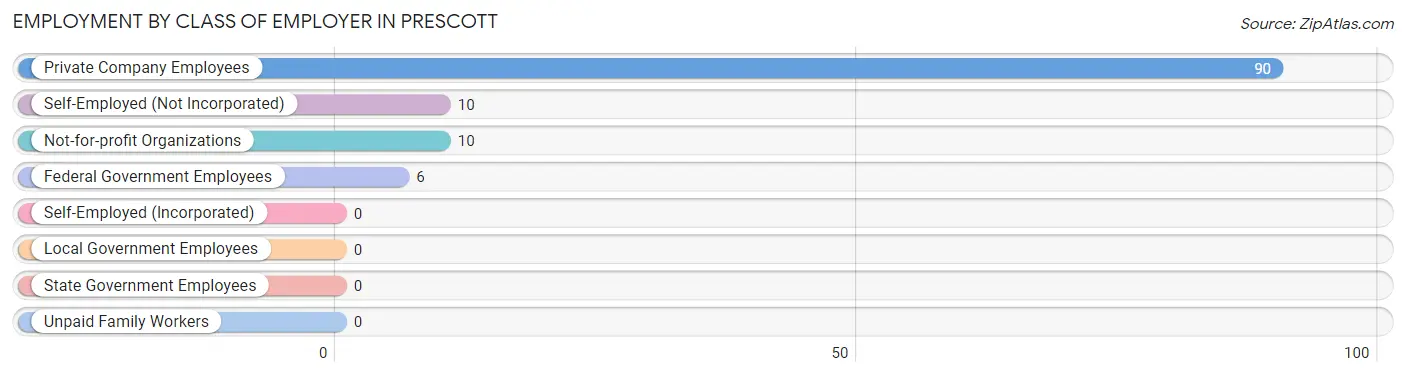
| Employer Class | # Employees | % Employees |
| Private Company Employees | 90 | 77.6% |
| Self-Employed (Incorporated) | 0 | 0.0% |
| Self-Employed (Not Incorporated) | 10 | 8.6% |
| Not-for-profit Organizations | 10 | 8.6% |
| Local Government Employees | 0 | 0.0% |
| State Government Employees | 0 | 0.0% |
| Federal Government Employees | 6 | 5.2% |
| Unpaid Family Workers | 0 | 0.0% |
| Total | 116 | 100.0% |
Employment Status by Age in Prescott
According to the labor force statistics for Prescott, out of the total population over 16 years of age (300), 45.0% or 135 individuals are in the labor force, with 14.1% or 19 of them unemployed. The age group with the highest labor force participation rate is 25 to 29 years, with 100.0% or 6 individuals in the labor force. Within the labor force, the 20 to 24 years age range has the highest percentage of unemployed individuals, with 100.0% or 10 of them being unemployed.
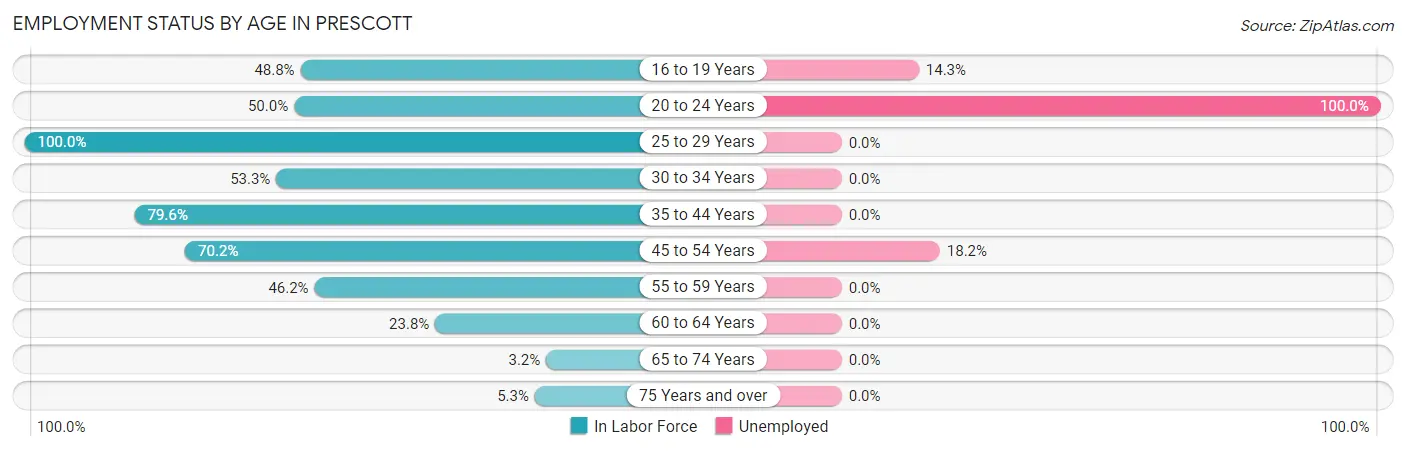
| Age Bracket | In Labor Force | Unemployed |
| 16 to 19 Years | 21 (48.8%) | 3 (14.3%) |
| 20 to 24 Years | 10 (50.0%) | 10 (100.0%) |
| 25 to 29 Years | 6 (100.0%) | 0 (0.0%) |
| 30 to 34 Years | 8 (53.3%) | 0 (0.0%) |
| 35 to 44 Years | 43 (79.6%) | 0 (0.0%) |
| 45 to 54 Years | 33 (70.2%) | 6 (18.2%) |
| 55 to 59 Years | 6 (46.2%) | 0 (0.0%) |
| 60 to 64 Years | 5 (23.8%) | 0 (0.0%) |
| 65 to 74 Years | 2 (3.2%) | 0 (0.0%) |
| 75 Years and over | 1 (5.3%) | 0 (0.0%) |
| Total | 135 (45.0%) | 19 (14.1%) |
Employment Status by Educational Attainment in Prescott
According to labor force statistics for Prescott, 64.7% of individuals (101) out of the total population between 25 and 64 years of age (156) are in the labor force, with 5.9% or 6 of them being unemployed. The group with the highest labor force participation rate are those with the educational attainment of bachelor's degree or higher, with 100.0% or 13 individuals in the labor force. Within the labor force, individuals with high school diploma education have the highest percentage of unemployment, with 13.0% or 6 of them being unemployed.
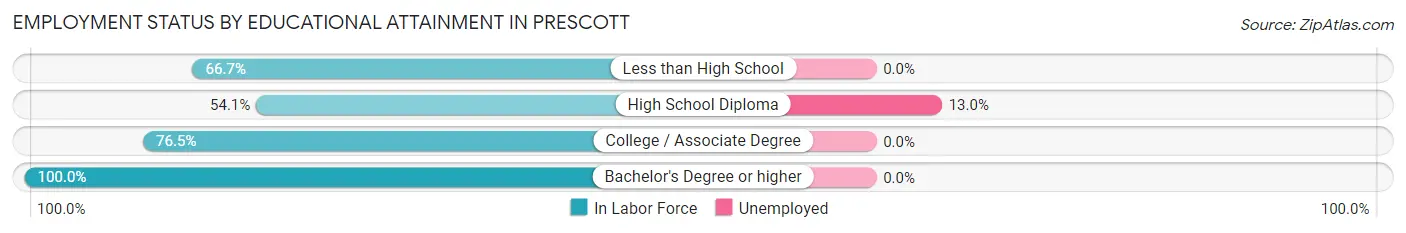
| Educational Attainment | In Labor Force | Unemployed |
| Less than High School | 16 (66.7%) | 0 (0.0%) |
| High School Diploma | 46 (54.1%) | 11 (13.0%) |
| College / Associate Degree | 26 (76.5%) | 0 (0.0%) |
| Bachelor's Degree or higher | 13 (100.0%) | 0 (0.0%) |
| Total | 101 (64.7%) | 9 (5.9%) |
Employment Occupations by Sex in Prescott
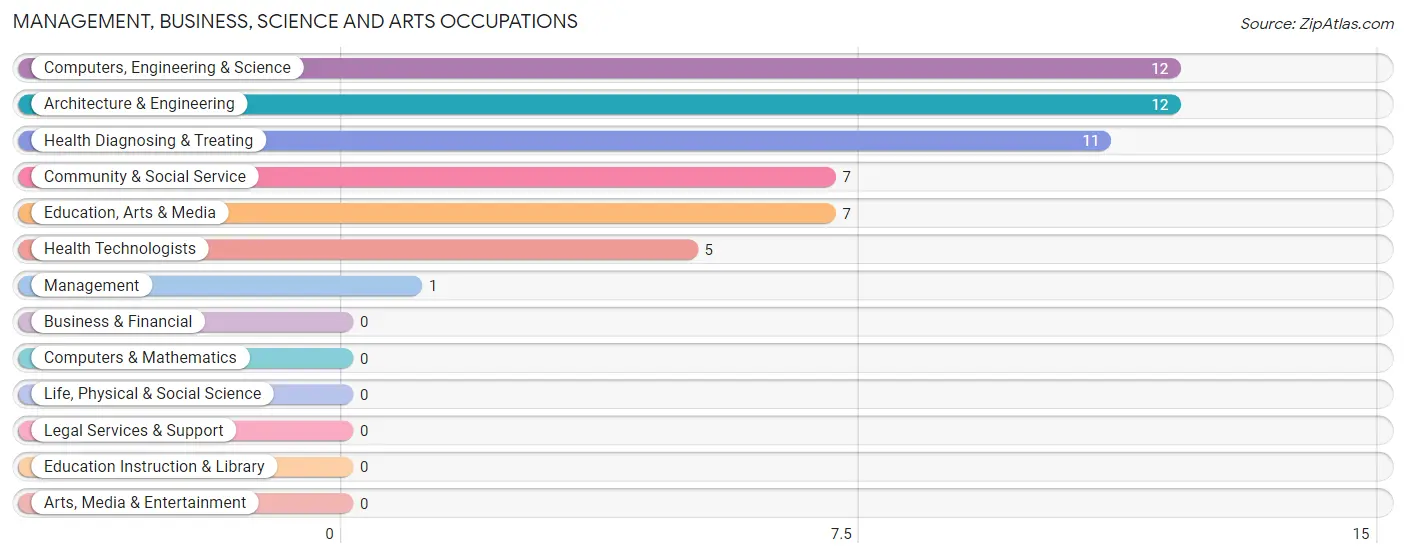
Management, Business, Science and Arts Occupations
The most common Management, Business, Science and Arts occupations in Prescott are Computers, Engineering & Science (12 | 10.3%), Architecture & Engineering (12 | 10.3%), Health Diagnosing & Treating (11 | 9.5%), Community & Social Service (7 | 6.0%), and Education, Arts & Media (7 | 6.0%).
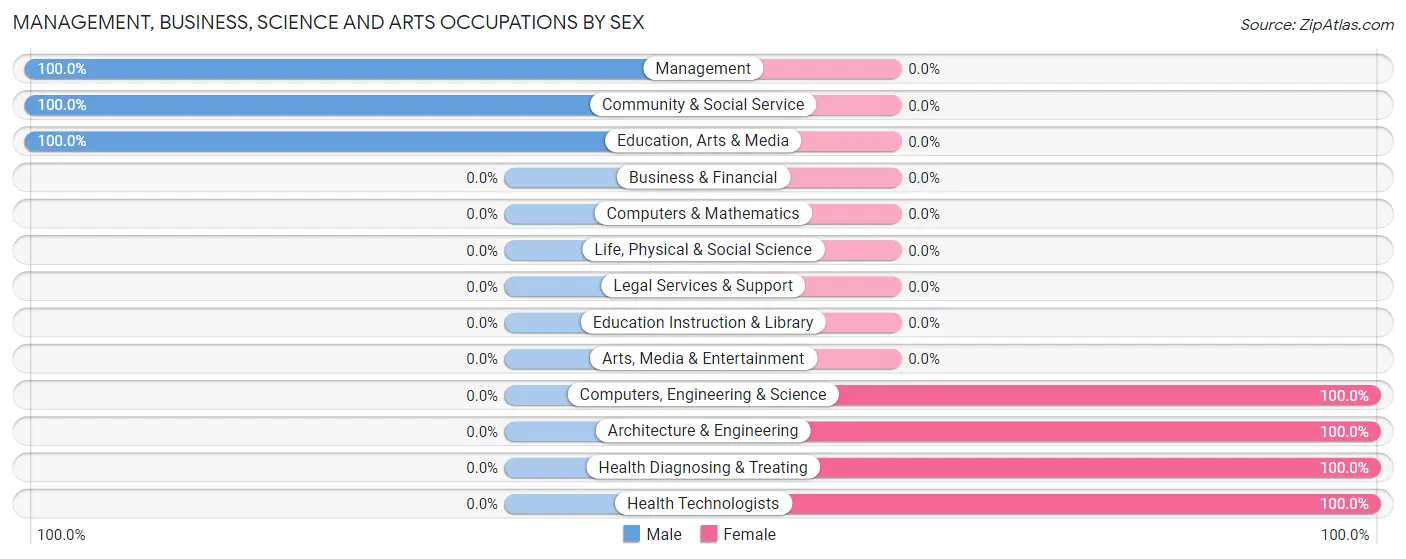
Management, Business, Science and Arts Occupations by Sex
Within the Management, Business, Science and Arts occupations in Prescott, the most male-oriented occupations are Management (100.0%), Community & Social Service (100.0%), and Education, Arts & Media (100.0%), while the most female-oriented occupations are Computers, Engineering & Science (100.0%), Architecture & Engineering (100.0%), and Health Diagnosing & Treating (100.0%).
| Occupation | Male | Female |
| Management | 1 (100.0%) | 0 (0.0%) |
| Business & Financial | 0 (0.0%) | 0 (0.0%) |
| Computers, Engineering & Science | 0 (0.0%) | 12 (100.0%) |
| Computers & Mathematics | 0 (0.0%) | 0 (0.0%) |
| Architecture & Engineering | 0 (0.0%) | 12 (100.0%) |
| Life, Physical & Social Science | 0 (0.0%) | 0 (0.0%) |
| Community & Social Service | 7 (100.0%) | 0 (0.0%) |
| Education, Arts & Media | 7 (100.0%) | 0 (0.0%) |
| Legal Services & Support | 0 (0.0%) | 0 (0.0%) |
| Education Instruction & Library | 0 (0.0%) | 0 (0.0%) |
| Arts, Media & Entertainment | 0 (0.0%) | 0 (0.0%) |
| Health Diagnosing & Treating | 0 (0.0%) | 11 (100.0%) |
| Health Technologists | 0 (0.0%) | 5 (100.0%) |
| Total (Category) | 8 (25.8%) | 23 (74.2%) |
| Total (Overall) | 52 (44.8%) | 64 (55.2%) |
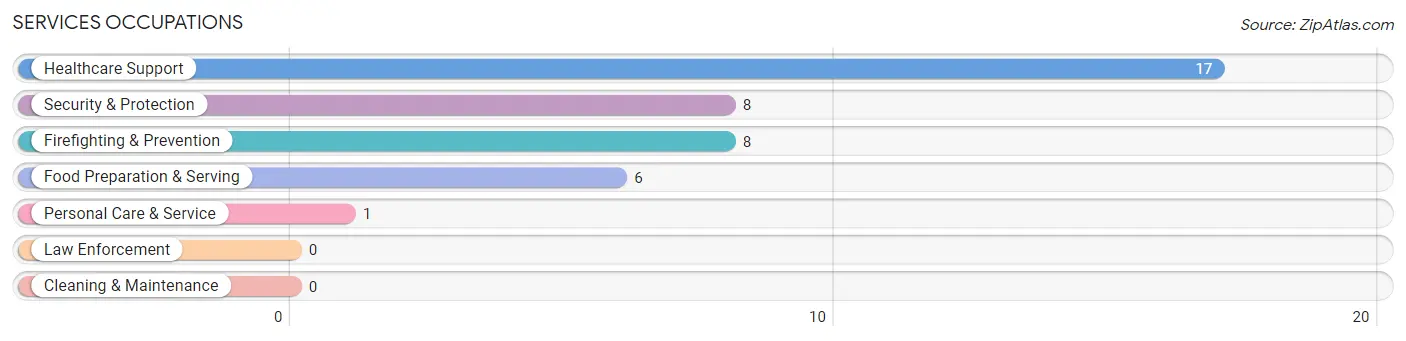
Services Occupations
The most common Services occupations in Prescott are Healthcare Support (17 | 14.7%), Security & Protection (8 | 6.9%), Firefighting & Prevention (8 | 6.9%), Food Preparation & Serving (6 | 5.2%), and Personal Care & Service (1 | 0.9%).
Services Occupations by Sex
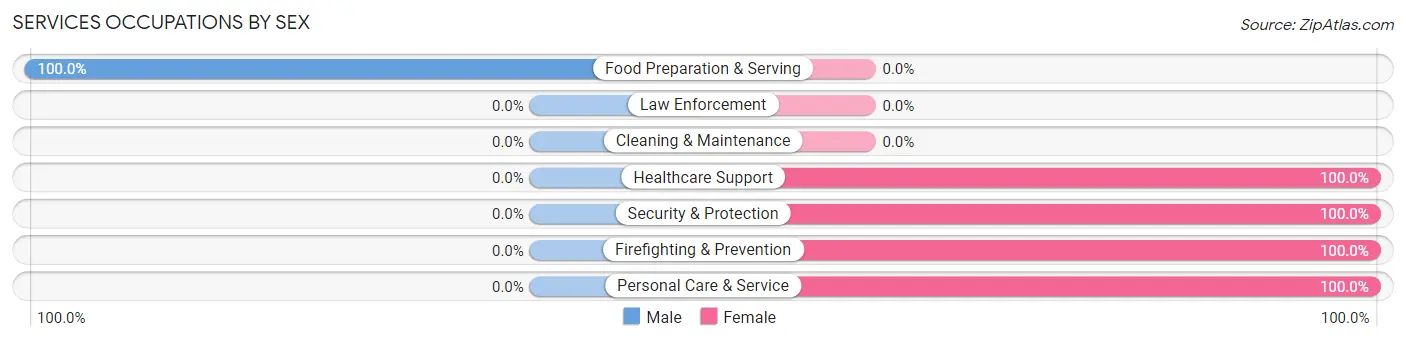
| Occupation | Male | Female |
| Healthcare Support | 0 (0.0%) | 17 (100.0%) |
| Security & Protection | 0 (0.0%) | 8 (100.0%) |
| Firefighting & Prevention | 0 (0.0%) | 8 (100.0%) |
| Law Enforcement | 0 (0.0%) | 0 (0.0%) |
| Food Preparation & Serving | 6 (100.0%) | 0 (0.0%) |
| Cleaning & Maintenance | 0 (0.0%) | 0 (0.0%) |
| Personal Care & Service | 0 (0.0%) | 1 (100.0%) |
| Total (Category) | 6 (18.8%) | 26 (81.2%) |
| Total (Overall) | 52 (44.8%) | 64 (55.2%) |
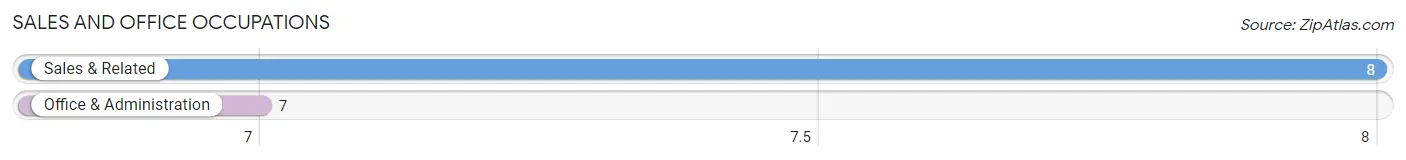
Sales and Office Occupations
The most common Sales and Office occupations in Prescott are Sales & Related (8 | 6.9%), and Office & Administration (7 | 6.0%).
Sales and Office Occupations by Sex
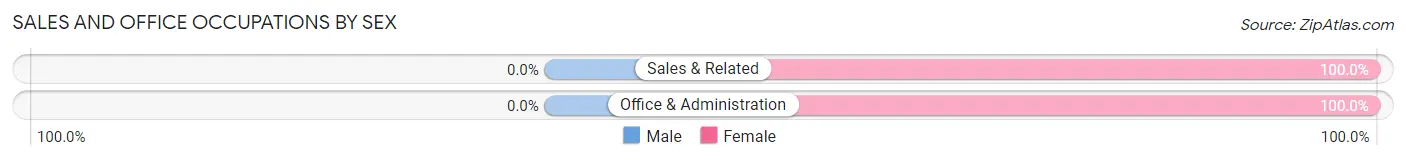
| Occupation | Male | Female |
| Sales & Related | 0 (0.0%) | 8 (100.0%) |
| Office & Administration | 0 (0.0%) | 7 (100.0%) |
| Total (Category) | 0 (0.0%) | 15 (100.0%) |
| Total (Overall) | 52 (44.8%) | 64 (55.2%) |
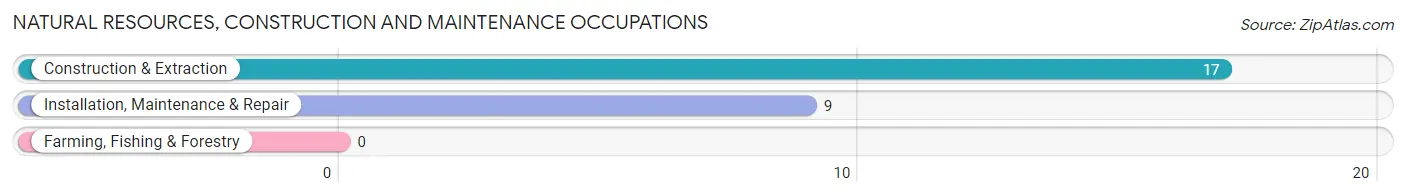
Natural Resources, Construction and Maintenance Occupations
The most common Natural Resources, Construction and Maintenance occupations in Prescott are Construction & Extraction (17 | 14.7%), and Installation, Maintenance & Repair (9 | 7.8%).
Natural Resources, Construction and Maintenance Occupations by Sex
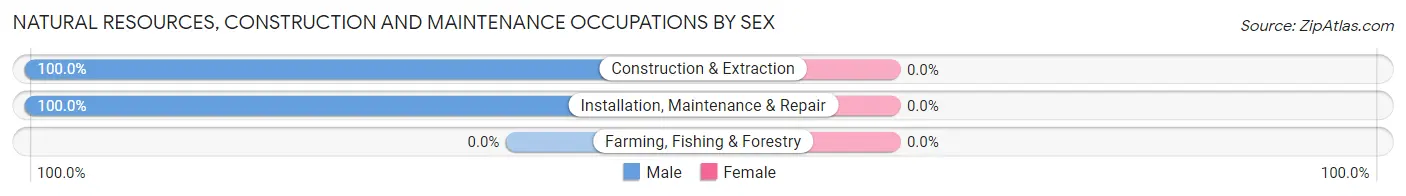
| Occupation | Male | Female |
| Farming, Fishing & Forestry | 0 (0.0%) | 0 (0.0%) |
| Construction & Extraction | 17 (100.0%) | 0 (0.0%) |
| Installation, Maintenance & Repair | 9 (100.0%) | 0 (0.0%) |
| Total (Category) | 26 (100.0%) | 0 (0.0%) |
| Total (Overall) | 52 (44.8%) | 64 (55.2%) |
Production, Transportation and Moving Occupations
The most common Production, Transportation and Moving occupations in Prescott are Production (7 | 6.0%), and Transportation (5 | 4.3%).
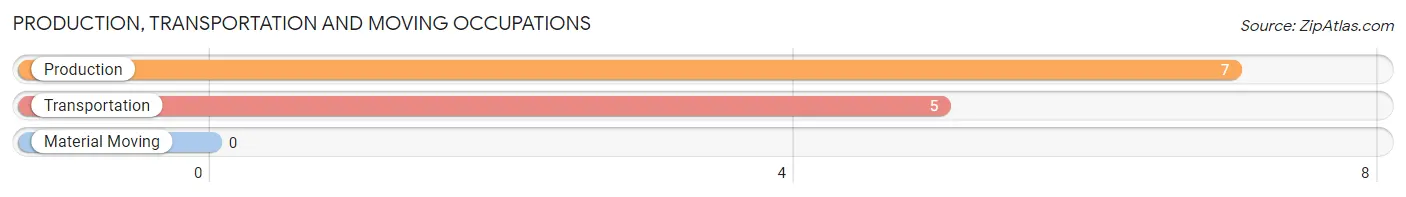
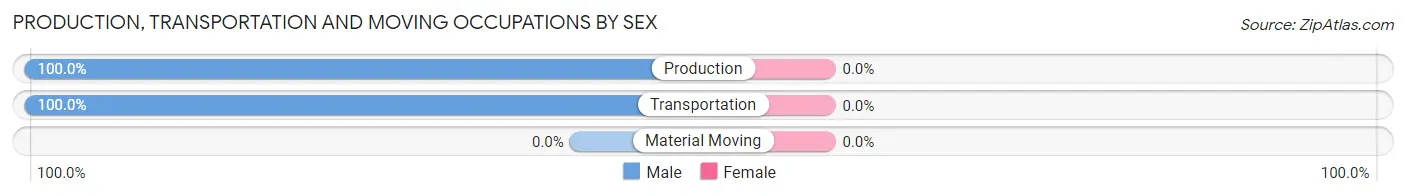
Production, Transportation and Moving Occupations by Sex
| Occupation | Male | Female |
| Production | 7 (100.0%) | 0 (0.0%) |
| Transportation | 5 (100.0%) | 0 (0.0%) |
| Material Moving | 0 (0.0%) | 0 (0.0%) |
| Total (Category) | 12 (100.0%) | 0 (0.0%) |
| Total (Overall) | 52 (44.8%) | 64 (55.2%) |
Employment Industries by Sex in Prescott
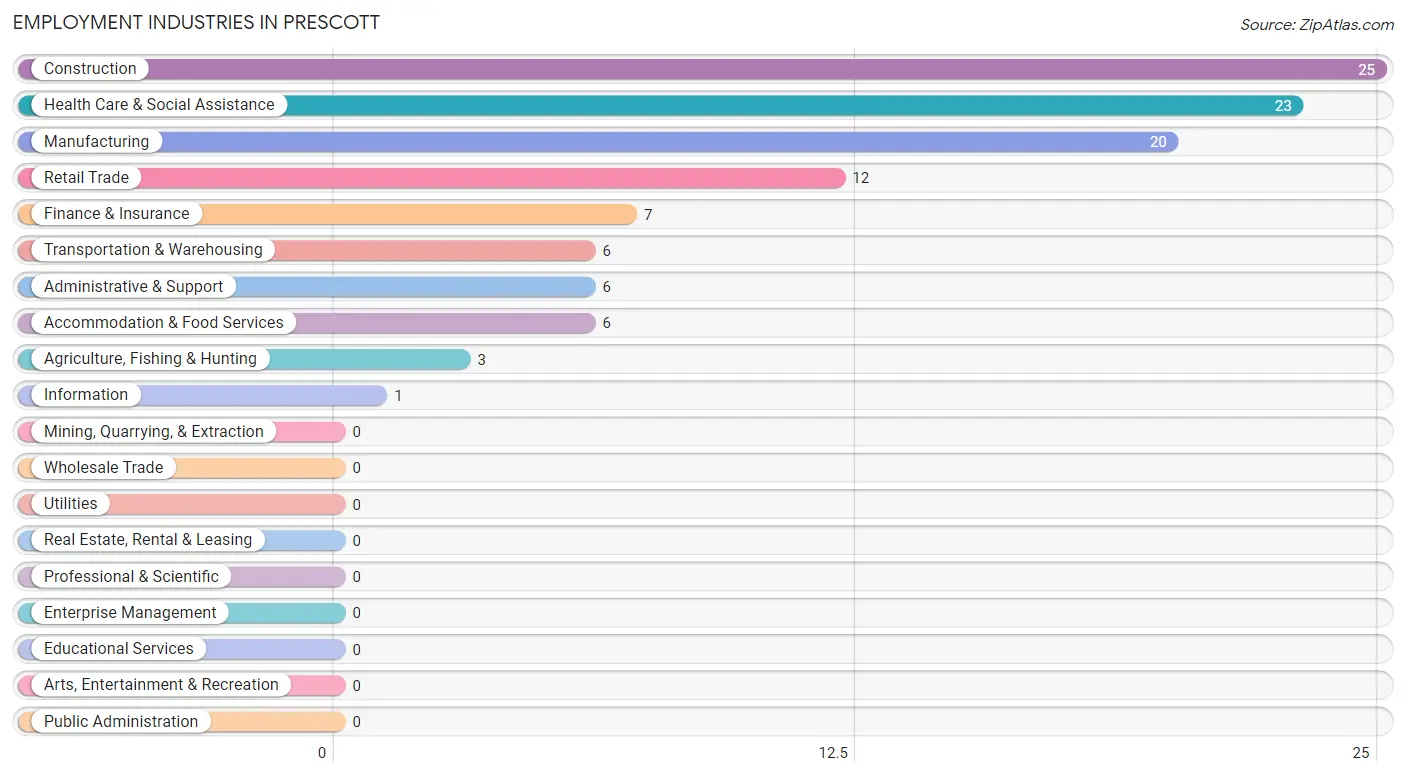
Employment Industries in Prescott
The major employment industries in Prescott include Construction (25 | 21.5%), Health Care & Social Assistance (23 | 19.8%), Manufacturing (20 | 17.2%), Retail Trade (12 | 10.3%), and Finance & Insurance (7 | 6.0%).
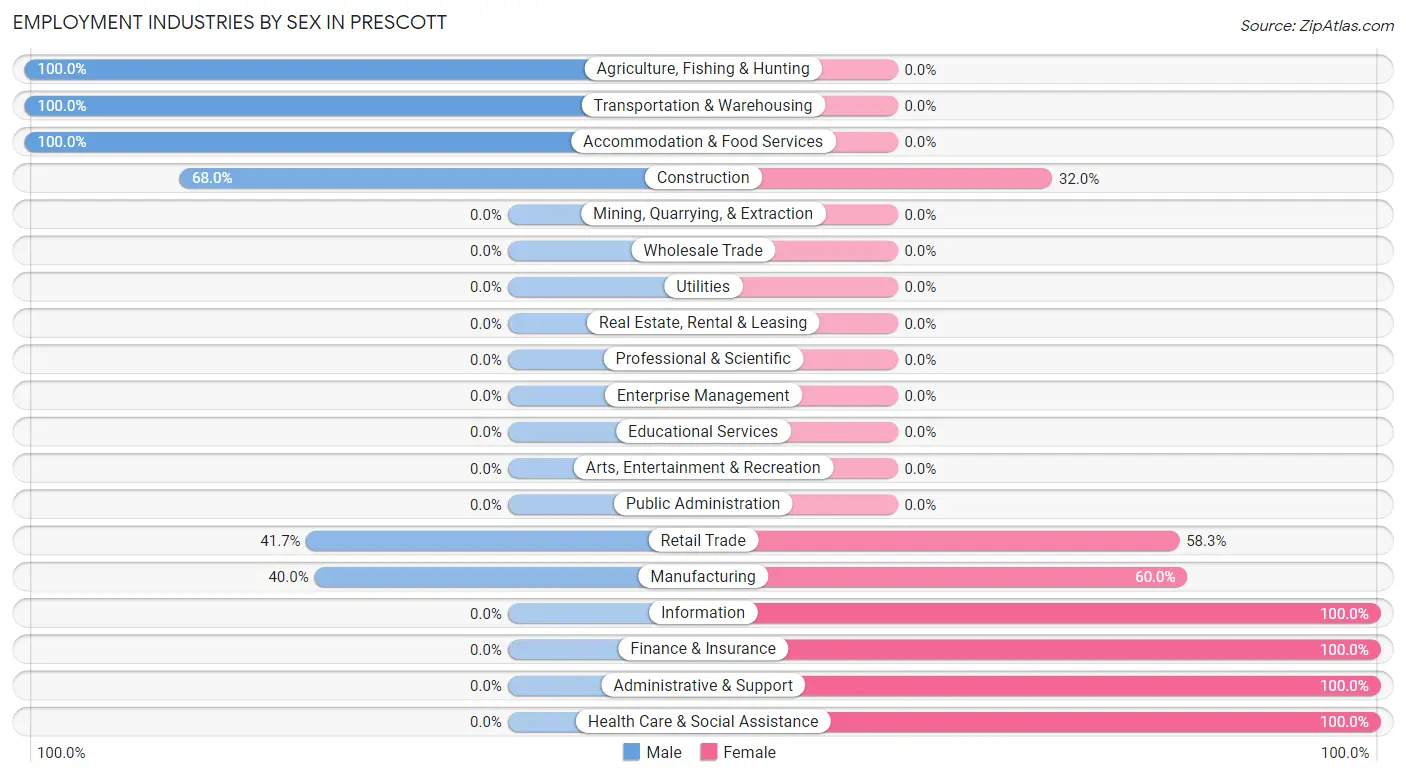
Employment Industries by Sex in Prescott
The Prescott industries that see more men than women are Agriculture, Fishing & Hunting (100.0%), Transportation & Warehousing (100.0%), and Accommodation & Food Services (100.0%), whereas the industries that tend to have a higher number of women are Information (100.0%), Finance & Insurance (100.0%), and Administrative & Support (100.0%).
| Industry | Male | Female |
| Agriculture, Fishing & Hunting | 3 (100.0%) | 0 (0.0%) |
| Mining, Quarrying, & Extraction | 0 (0.0%) | 0 (0.0%) |
| Construction | 17 (68.0%) | 8 (32.0%) |
| Manufacturing | 8 (40.0%) | 12 (60.0%) |
| Wholesale Trade | 0 (0.0%) | 0 (0.0%) |
| Retail Trade | 5 (41.7%) | 7 (58.3%) |
| Transportation & Warehousing | 6 (100.0%) | 0 (0.0%) |
| Utilities | 0 (0.0%) | 0 (0.0%) |
| Information | 0 (0.0%) | 1 (100.0%) |
| Finance & Insurance | 0 (0.0%) | 7 (100.0%) |
| Real Estate, Rental & Leasing | 0 (0.0%) | 0 (0.0%) |
| Professional & Scientific | 0 (0.0%) | 0 (0.0%) |
| Enterprise Management | 0 (0.0%) | 0 (0.0%) |
| Administrative & Support | 0 (0.0%) | 6 (100.0%) |
| Educational Services | 0 (0.0%) | 0 (0.0%) |
| Health Care & Social Assistance | 0 (0.0%) | 23 (100.0%) |
| Arts, Entertainment & Recreation | 0 (0.0%) | 0 (0.0%) |
| Accommodation & Food Services | 6 (100.0%) | 0 (0.0%) |
| Public Administration | 0 (0.0%) | 0 (0.0%) |
| Total | 52 (44.8%) | 64 (55.2%) |
Education in Prescott
School Enrollment in Prescott
The most common levels of schooling among the 105 students in Prescott are high school (28 | 26.7%), college / undergraduate (25 | 23.8%), and kindergarten (20 | 19.1%).
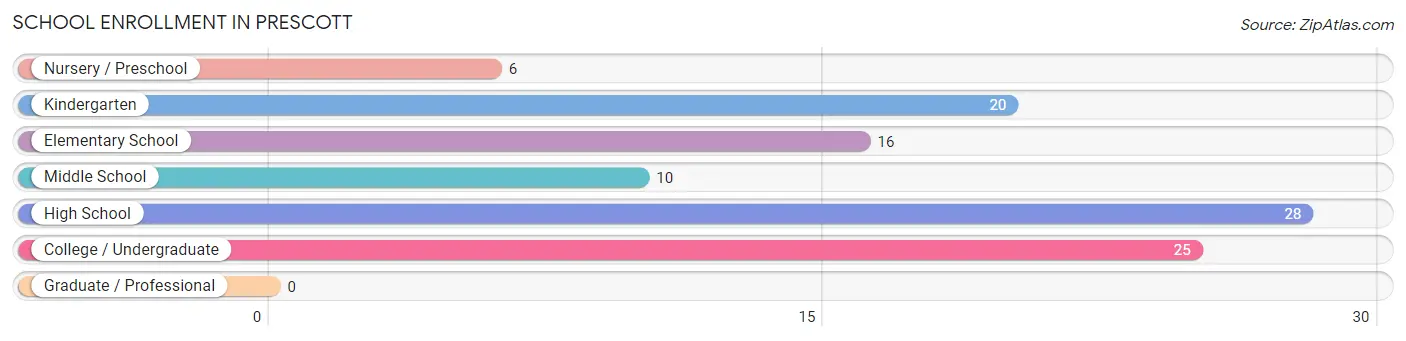
| School Level | # Students | % Students |
| Nursery / Preschool | 6 | 5.7% |
| Kindergarten | 20 | 19.1% |
| Elementary School | 16 | 15.2% |
| Middle School | 10 | 9.5% |
| High School | 28 | 26.7% |
| College / Undergraduate | 25 | 23.8% |
| Graduate / Professional | 0 | 0.0% |
| Total | 105 | 100.0% |
School Enrollment by Age by Funding Source in Prescott
Out of a total of 105 students who are enrolled in schools in Prescott, 7 (6.7%) attend a private institution, while the remaining 98 (93.3%) are enrolled in public schools. The age group of 10 to 14 year olds has the highest likelihood of being enrolled in private schools, with 7 (41.2% in the age bracket) enrolled. Conversely, the age group of 3 to 4 year olds has the lowest likelihood of being enrolled in a private school, with 6 (100.0% in the age bracket) attending a public institution.
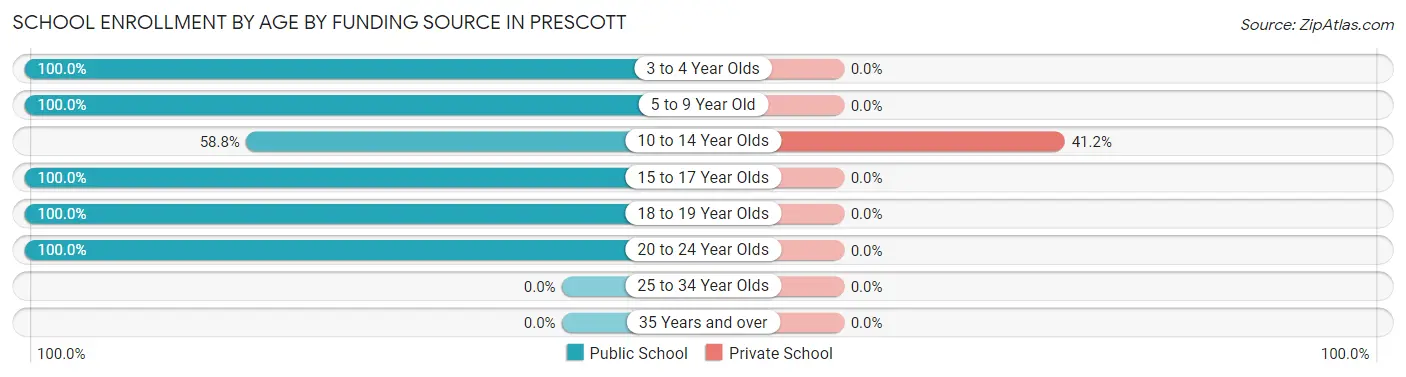
| Age Bracket | Public School | Private School |
| 3 to 4 Year Olds | 6 (100.0%) | 0 (0.0%) |
| 5 to 9 Year Old | 29 (100.0%) | 0 (0.0%) |
| 10 to 14 Year Olds | 10 (58.8%) | 7 (41.2%) |
| 15 to 17 Year Olds | 24 (100.0%) | 0 (0.0%) |
| 18 to 19 Year Olds | 19 (100.0%) | 0 (0.0%) |
| 20 to 24 Year Olds | 10 (100.0%) | 0 (0.0%) |
| 25 to 34 Year Olds | 0 (0.0%) | 0 (0.0%) |
| 35 Years and over | 0 (0.0%) | 0 (0.0%) |
| Total | 98 (93.3%) | 7 (6.7%) |
Educational Attainment by Field of Study in Prescott
Liberal arts & history (7 | 36.8%), education (6 | 31.6%), science & technology (5 | 26.3%), and engineering (1 | 5.3%) are the most common fields of study among 19 individuals in Prescott who have obtained a bachelor's degree or higher.
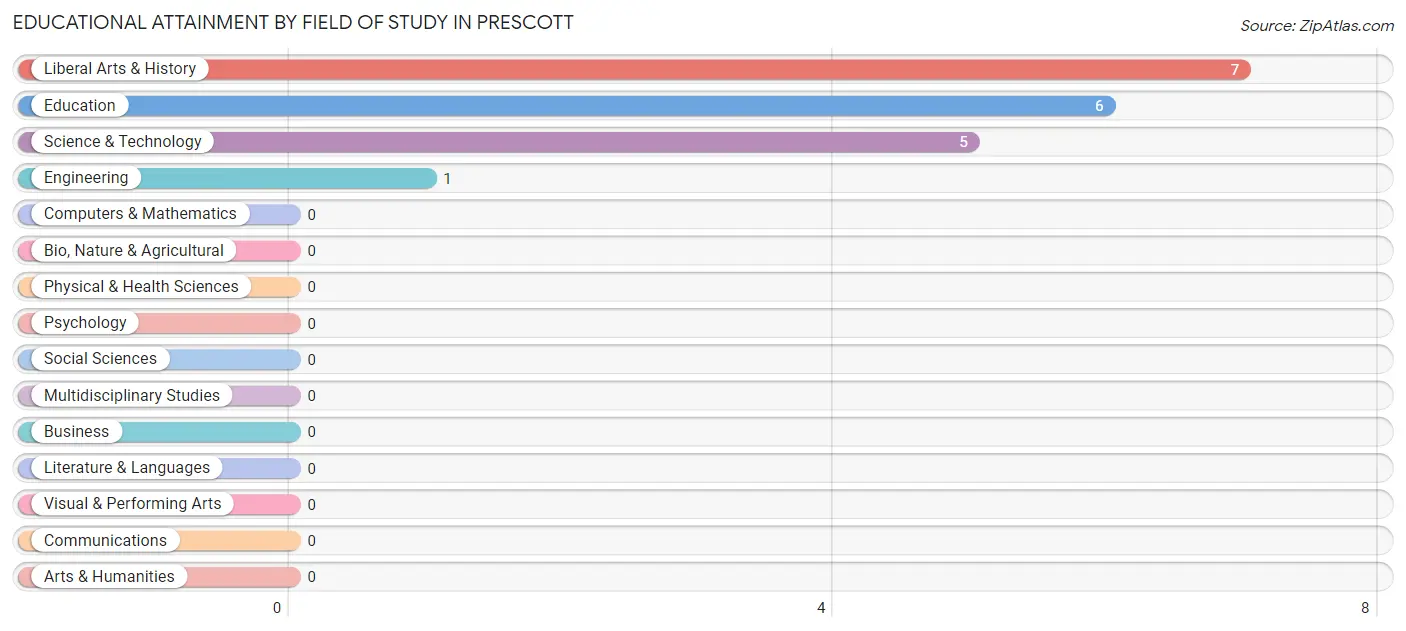
| Field of Study | # Graduates | % Graduates |
| Computers & Mathematics | 0 | 0.0% |
| Bio, Nature & Agricultural | 0 | 0.0% |
| Physical & Health Sciences | 0 | 0.0% |
| Psychology | 0 | 0.0% |
| Social Sciences | 0 | 0.0% |
| Engineering | 1 | 5.3% |
| Multidisciplinary Studies | 0 | 0.0% |
| Science & Technology | 5 | 26.3% |
| Business | 0 | 0.0% |
| Education | 6 | 31.6% |
| Literature & Languages | 0 | 0.0% |
| Liberal Arts & History | 7 | 36.8% |
| Visual & Performing Arts | 0 | 0.0% |
| Communications | 0 | 0.0% |
| Arts & Humanities | 0 | 0.0% |
| Total | 19 | 100.0% |
Transportation & Commute in Prescott
Vehicle Availability by Sex in Prescott
The most prevalent vehicle ownership categories in Prescott are males with 3 vehicles (28, accounting for 53.8%) and females with 3 vehicles (15, making up 43.8%).
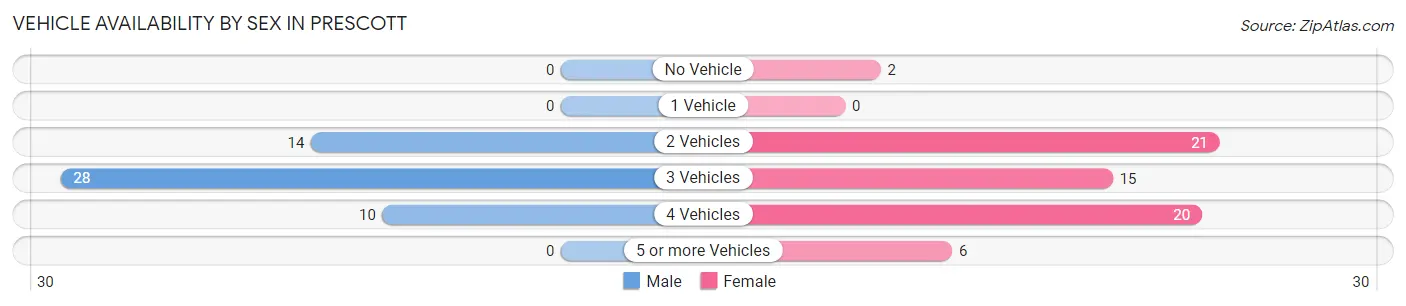
| Vehicles Available | Male | Female |
| No Vehicle | 0 (0.0%) | 2 (3.1%) |
| 1 Vehicle | 0 (0.0%) | 0 (0.0%) |
| 2 Vehicles | 14 (26.9%) | 21 (32.8%) |
| 3 Vehicles | 28 (53.8%) | 15 (23.4%) |
| 4 Vehicles | 10 (19.2%) | 20 (31.2%) |
| 5 or more Vehicles | 0 (0.0%) | 6 (9.4%) |
| Total | 52 (100.0%) | 64 (100.0%) |
Commute Time in Prescott
The most frequently occuring commute durations in Prescott are 30 to 34 minutes (43 commuters, 41.7%), 25 to 29 minutes (19 commuters, 18.4%), and 60 to 89 minutes (16 commuters, 15.5%).
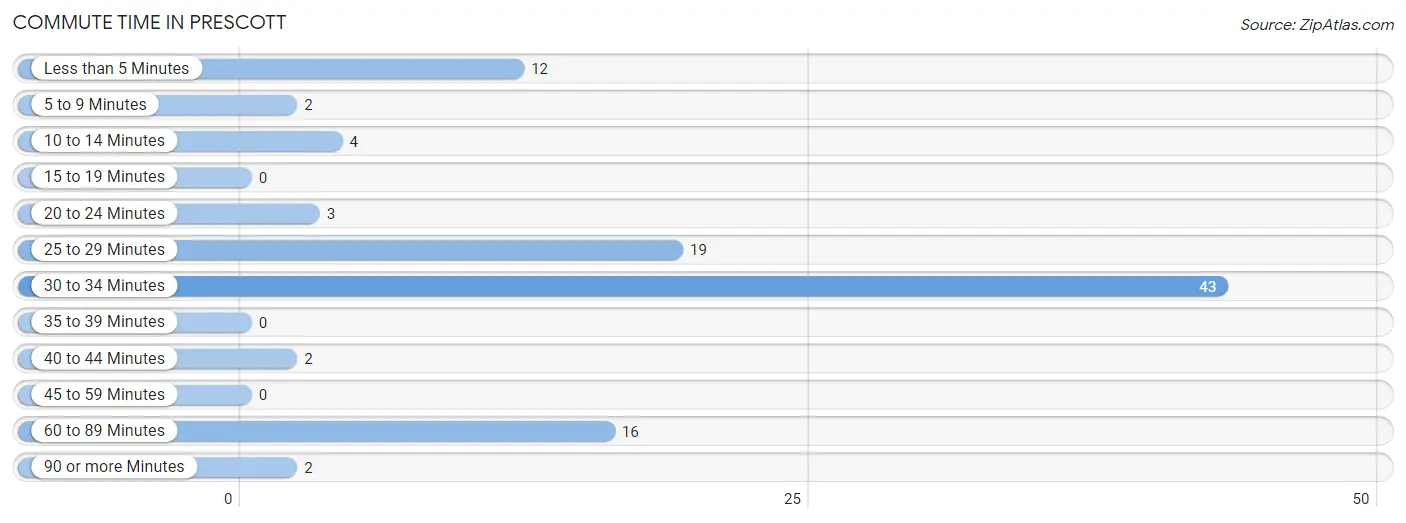
| Commute Time | # Commuters | % Commuters |
| Less than 5 Minutes | 12 | 11.7% |
| 5 to 9 Minutes | 2 | 1.9% |
| 10 to 14 Minutes | 4 | 3.9% |
| 15 to 19 Minutes | 0 | 0.0% |
| 20 to 24 Minutes | 3 | 2.9% |
| 25 to 29 Minutes | 19 | 18.4% |
| 30 to 34 Minutes | 43 | 41.7% |
| 35 to 39 Minutes | 0 | 0.0% |
| 40 to 44 Minutes | 2 | 1.9% |
| 45 to 59 Minutes | 0 | 0.0% |
| 60 to 89 Minutes | 16 | 15.5% |
| 90 or more Minutes | 2 | 1.9% |
Commute Time by Sex in Prescott
The most common commute times in Prescott are 30 to 34 minutes (24 commuters, 46.2%) for males and 30 to 34 minutes (19 commuters, 37.2%) for females.
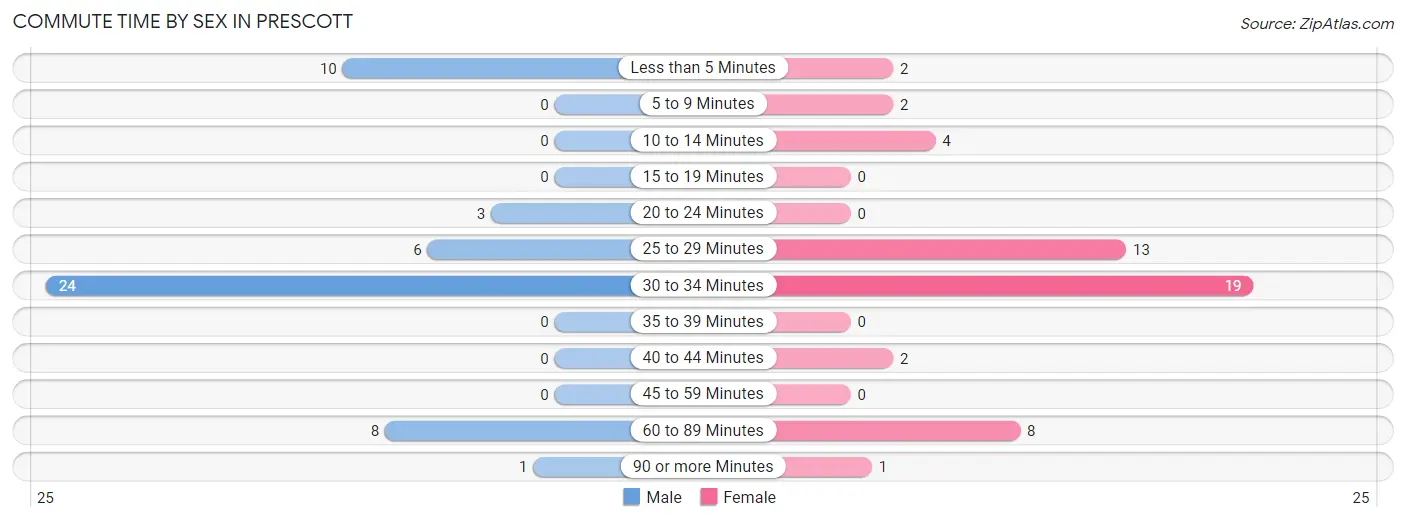
| Commute Time | Male | Female |
| Less than 5 Minutes | 10 (19.2%) | 2 (3.9%) |
| 5 to 9 Minutes | 0 (0.0%) | 2 (3.9%) |
| 10 to 14 Minutes | 0 (0.0%) | 4 (7.8%) |
| 15 to 19 Minutes | 0 (0.0%) | 0 (0.0%) |
| 20 to 24 Minutes | 3 (5.8%) | 0 (0.0%) |
| 25 to 29 Minutes | 6 (11.5%) | 13 (25.5%) |
| 30 to 34 Minutes | 24 (46.2%) | 19 (37.2%) |
| 35 to 39 Minutes | 0 (0.0%) | 0 (0.0%) |
| 40 to 44 Minutes | 0 (0.0%) | 2 (3.9%) |
| 45 to 59 Minutes | 0 (0.0%) | 0 (0.0%) |
| 60 to 89 Minutes | 8 (15.4%) | 8 (15.7%) |
| 90 or more Minutes | 1 (1.9%) | 1 (2.0%) |
Time of Departure to Work by Sex in Prescott
The most frequent times of departure to work in Prescott are 5:00 AM to 5:29 AM (19, 36.5%) for males and 12:00 AM to 4:59 AM (13, 25.5%) for females.
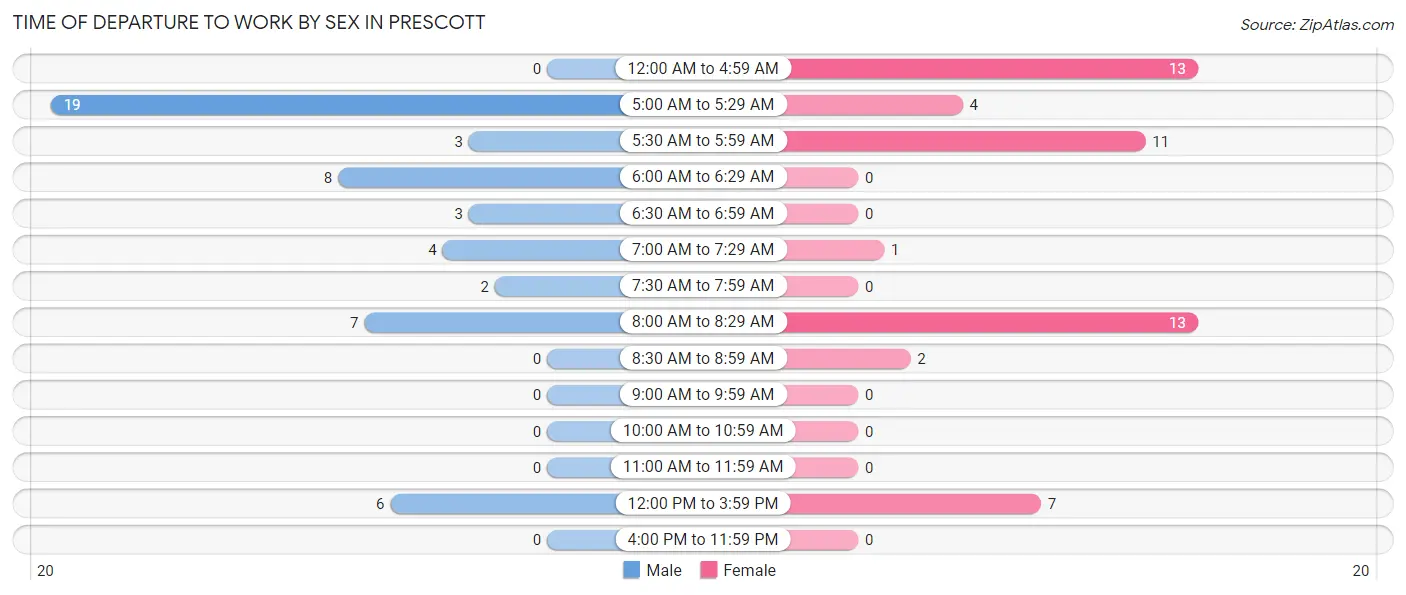
| Time of Departure | Male | Female |
| 12:00 AM to 4:59 AM | 0 (0.0%) | 13 (25.5%) |
| 5:00 AM to 5:29 AM | 19 (36.5%) | 4 (7.8%) |
| 5:30 AM to 5:59 AM | 3 (5.8%) | 11 (21.6%) |
| 6:00 AM to 6:29 AM | 8 (15.4%) | 0 (0.0%) |
| 6:30 AM to 6:59 AM | 3 (5.8%) | 0 (0.0%) |
| 7:00 AM to 7:29 AM | 4 (7.7%) | 1 (2.0%) |
| 7:30 AM to 7:59 AM | 2 (3.8%) | 0 (0.0%) |
| 8:00 AM to 8:29 AM | 7 (13.5%) | 13 (25.5%) |
| 8:30 AM to 8:59 AM | 0 (0.0%) | 2 (3.9%) |
| 9:00 AM to 9:59 AM | 0 (0.0%) | 0 (0.0%) |
| 10:00 AM to 10:59 AM | 0 (0.0%) | 0 (0.0%) |
| 11:00 AM to 11:59 AM | 0 (0.0%) | 0 (0.0%) |
| 12:00 PM to 3:59 PM | 6 (11.5%) | 7 (13.7%) |
| 4:00 PM to 11:59 PM | 0 (0.0%) | 0 (0.0%) |
| Total | 52 (100.0%) | 51 (100.0%) |
Housing Occupancy in Prescott
Occupancy by Ownership in Prescott
Of the total 121 dwellings in Prescott, owner-occupied units account for 108 (89.3%), while renter-occupied units make up 13 (10.7%).
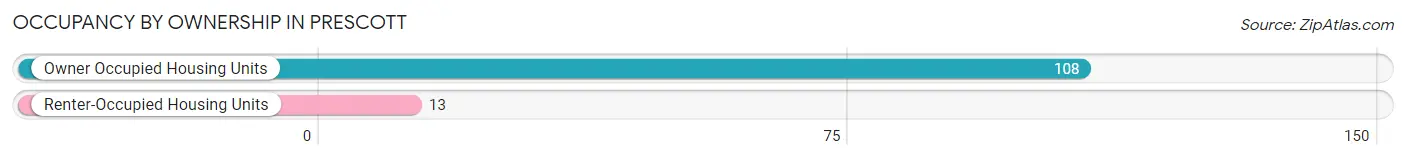
| Occupancy | # Housing Units | % Housing Units |
| Owner Occupied Housing Units | 108 | 89.3% |
| Renter-Occupied Housing Units | 13 | 10.7% |
| Total Occupied Housing Units | 121 | 100.0% |
Occupancy by Household Size in Prescott
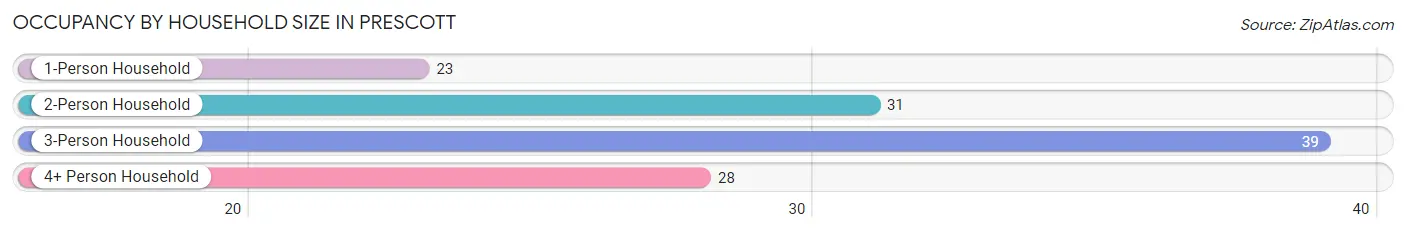
| Household Size | # Housing Units | % Housing Units |
| 1-Person Household | 23 | 19.0% |
| 2-Person Household | 31 | 25.6% |
| 3-Person Household | 39 | 32.2% |
| 4+ Person Household | 28 | 23.1% |
| Total Housing Units | 121 | 100.0% |
Occupancy by Ownership by Household Size in Prescott
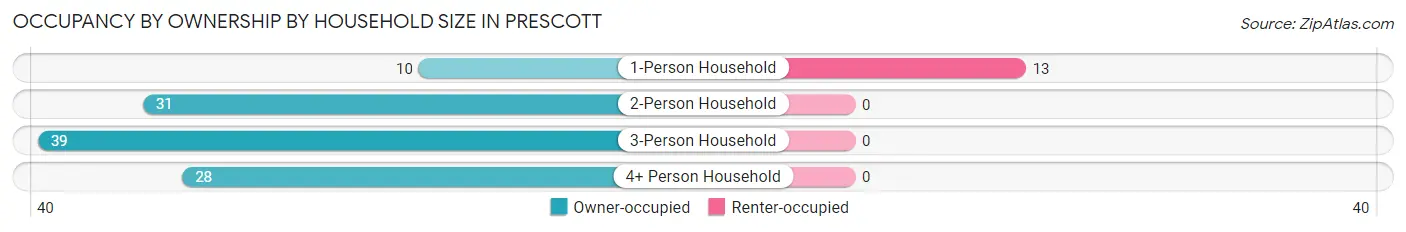
| Household Size | Owner-occupied | Renter-occupied |
| 1-Person Household | 10 (43.5%) | 13 (56.5%) |
| 2-Person Household | 31 (100.0%) | 0 (0.0%) |
| 3-Person Household | 39 (100.0%) | 0 (0.0%) |
| 4+ Person Household | 28 (100.0%) | 0 (0.0%) |
| Total Housing Units | 108 (89.3%) | 13 (10.7%) |
Occupancy by Educational Attainment in Prescott
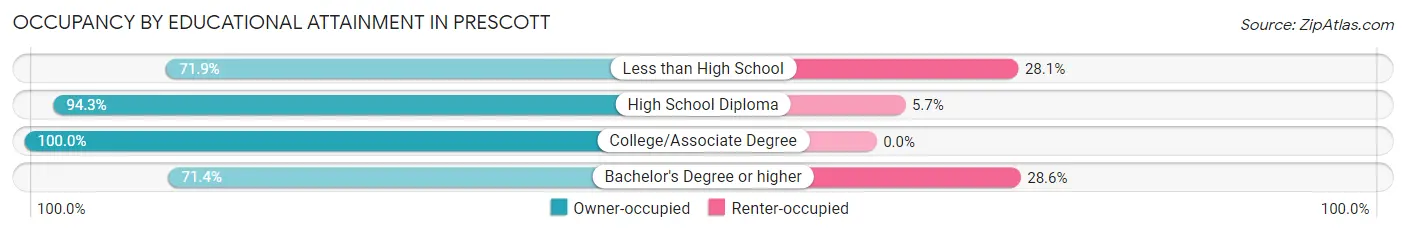
| Household Size | Owner-occupied | Renter-occupied |
| Less than High School | 23 (71.9%) | 9 (28.1%) |
| High School Diploma | 33 (94.3%) | 2 (5.7%) |
| College/Associate Degree | 47 (100.0%) | 0 (0.0%) |
| Bachelor's Degree or higher | 5 (71.4%) | 2 (28.6%) |
Occupancy by Age of Householder in Prescott
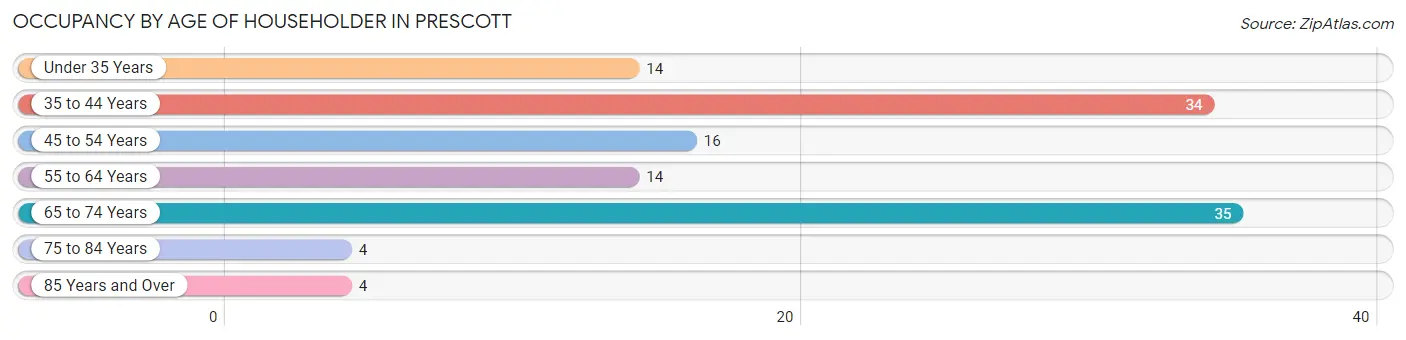
| Age Bracket | # Households | % Households |
| Under 35 Years | 14 | 11.6% |
| 35 to 44 Years | 34 | 28.1% |
| 45 to 54 Years | 16 | 13.2% |
| 55 to 64 Years | 14 | 11.6% |
| 65 to 74 Years | 35 | 28.9% |
| 75 to 84 Years | 4 | 3.3% |
| 85 Years and Over | 4 | 3.3% |
| Total | 121 | 100.0% |
Housing Finances in Prescott
Median Income by Occupancy in Prescott
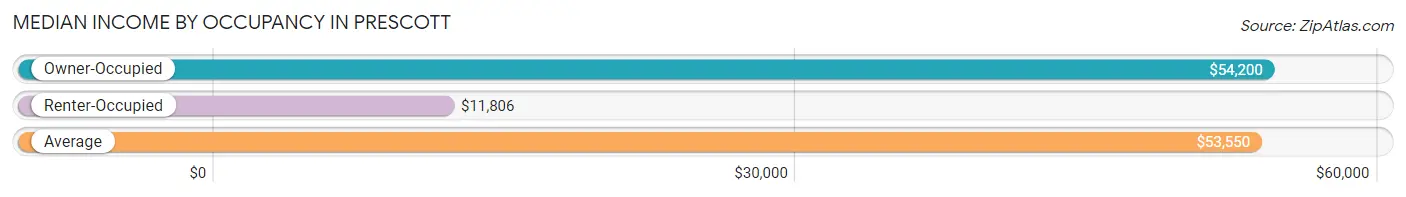
| Occupancy Type | # Households | Median Income |
| Owner-Occupied | 108 (89.3%) | $54,200 |
| Renter-Occupied | 13 (10.7%) | $11,806 |
| Average | 121 (100.0%) | $53,550 |
Occupancy by Householder Income Bracket in Prescott
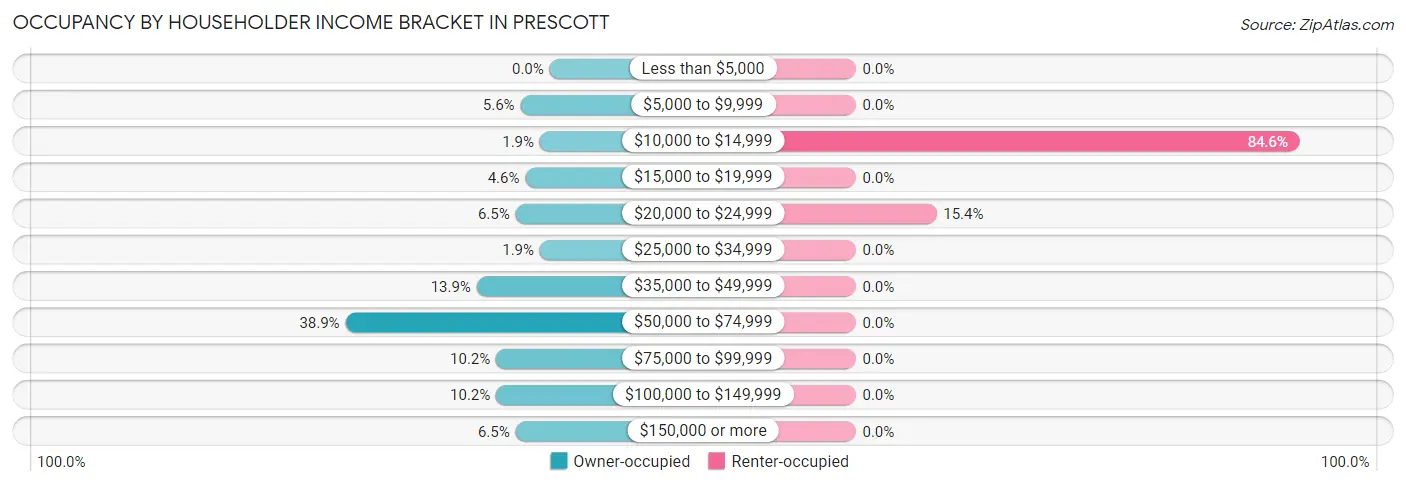
| Income Bracket | Owner-occupied | Renter-occupied |
| Less than $5,000 | 0 (0.0%) | 0 (0.0%) |
| $5,000 to $9,999 | 6 (5.6%) | 0 (0.0%) |
| $10,000 to $14,999 | 2 (1.8%) | 11 (84.6%) |
| $15,000 to $19,999 | 5 (4.6%) | 0 (0.0%) |
| $20,000 to $24,999 | 7 (6.5%) | 2 (15.4%) |
| $25,000 to $34,999 | 2 (1.8%) | 0 (0.0%) |
| $35,000 to $49,999 | 15 (13.9%) | 0 (0.0%) |
| $50,000 to $74,999 | 42 (38.9%) | 0 (0.0%) |
| $75,000 to $99,999 | 11 (10.2%) | 0 (0.0%) |
| $100,000 to $149,999 | 11 (10.2%) | 0 (0.0%) |
| $150,000 or more | 7 (6.5%) | 0 (0.0%) |
| Total | 108 (100.0%) | 13 (100.0%) |
Monthly Housing Cost Tiers in Prescott
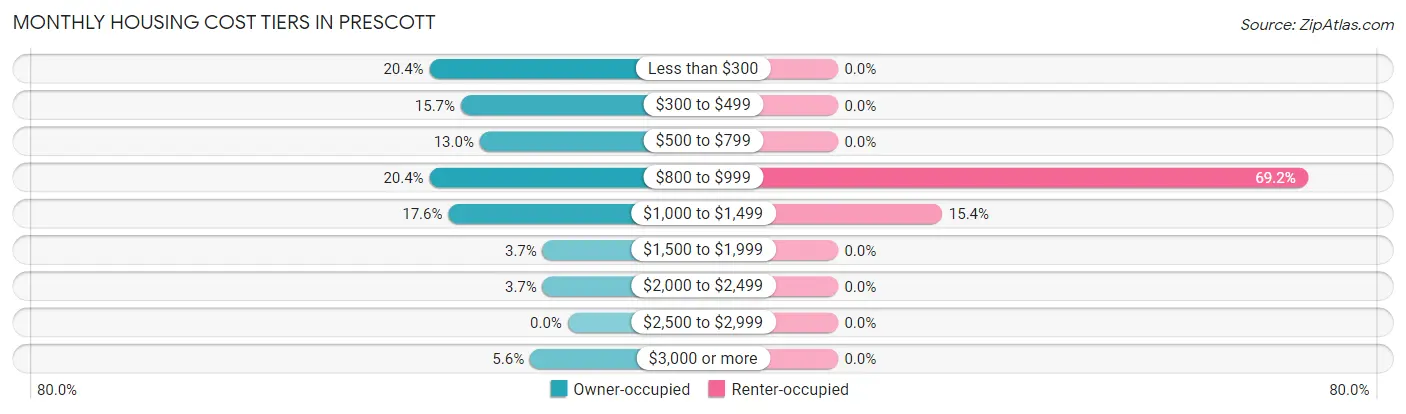
| Monthly Cost | Owner-occupied | Renter-occupied |
| Less than $300 | 22 (20.4%) | 0 (0.0%) |
| $300 to $499 | 17 (15.7%) | 0 (0.0%) |
| $500 to $799 | 14 (13.0%) | 0 (0.0%) |
| $800 to $999 | 22 (20.4%) | 9 (69.2%) |
| $1,000 to $1,499 | 19 (17.6%) | 2 (15.4%) |
| $1,500 to $1,999 | 4 (3.7%) | 0 (0.0%) |
| $2,000 to $2,499 | 4 (3.7%) | 0 (0.0%) |
| $2,500 to $2,999 | 0 (0.0%) | 0 (0.0%) |
| $3,000 or more | 6 (5.6%) | 0 (0.0%) |
| Total | 108 (100.0%) | 13 (100.0%) |
Physical Housing Characteristics in Prescott
Housing Structures in Prescott
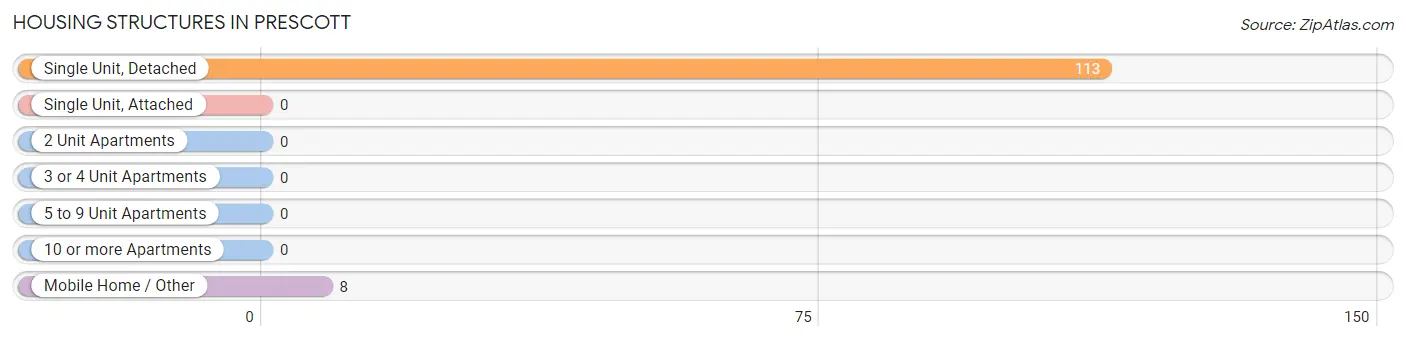
| Structure Type | # Housing Units | % Housing Units |
| Single Unit, Detached | 113 | 93.4% |
| Single Unit, Attached | 0 | 0.0% |
| 2 Unit Apartments | 0 | 0.0% |
| 3 or 4 Unit Apartments | 0 | 0.0% |
| 5 to 9 Unit Apartments | 0 | 0.0% |
| 10 or more Apartments | 0 | 0.0% |
| Mobile Home / Other | 8 | 6.6% |
| Total | 121 | 100.0% |
Housing Structures by Occupancy in Prescott
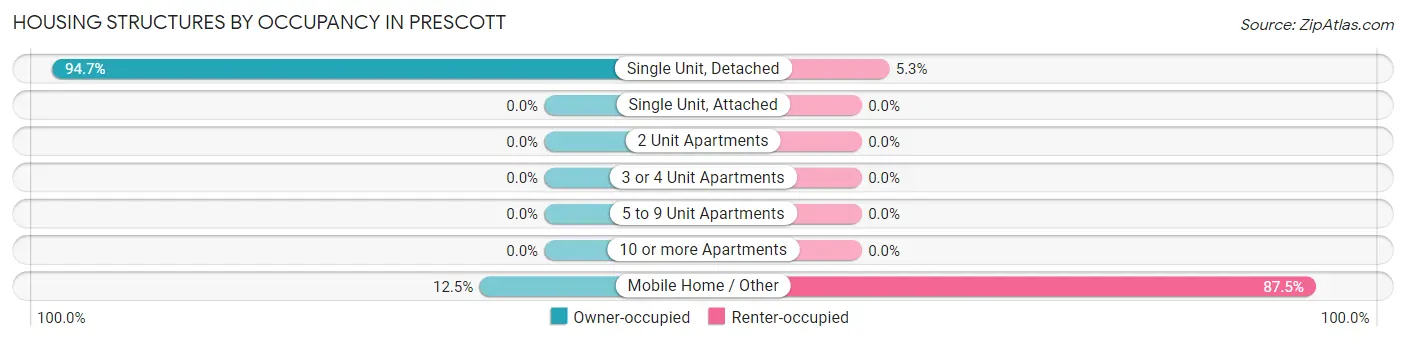
| Structure Type | Owner-occupied | Renter-occupied |
| Single Unit, Detached | 107 (94.7%) | 6 (5.3%) |
| Single Unit, Attached | 0 (0.0%) | 0 (0.0%) |
| 2 Unit Apartments | 0 (0.0%) | 0 (0.0%) |
| 3 or 4 Unit Apartments | 0 (0.0%) | 0 (0.0%) |
| 5 to 9 Unit Apartments | 0 (0.0%) | 0 (0.0%) |
| 10 or more Apartments | 0 (0.0%) | 0 (0.0%) |
| Mobile Home / Other | 1 (12.5%) | 7 (87.5%) |
| Total | 108 (89.3%) | 13 (10.7%) |
Housing Structures by Number of Rooms in Prescott
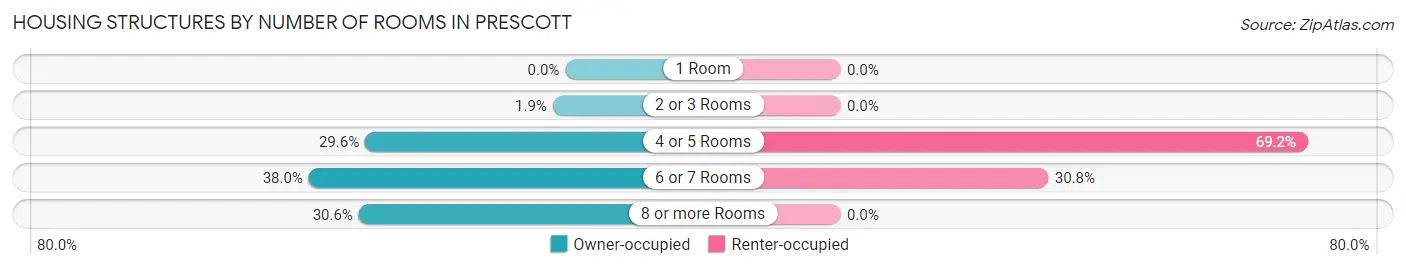
| Number of Rooms | Owner-occupied | Renter-occupied |
| 1 Room | 0 (0.0%) | 0 (0.0%) |
| 2 or 3 Rooms | 2 (1.8%) | 0 (0.0%) |
| 4 or 5 Rooms | 32 (29.6%) | 9 (69.2%) |
| 6 or 7 Rooms | 41 (38.0%) | 4 (30.8%) |
| 8 or more Rooms | 33 (30.6%) | 0 (0.0%) |
| Total | 108 (100.0%) | 13 (100.0%) |
Housing Structure by Heating Type in Prescott
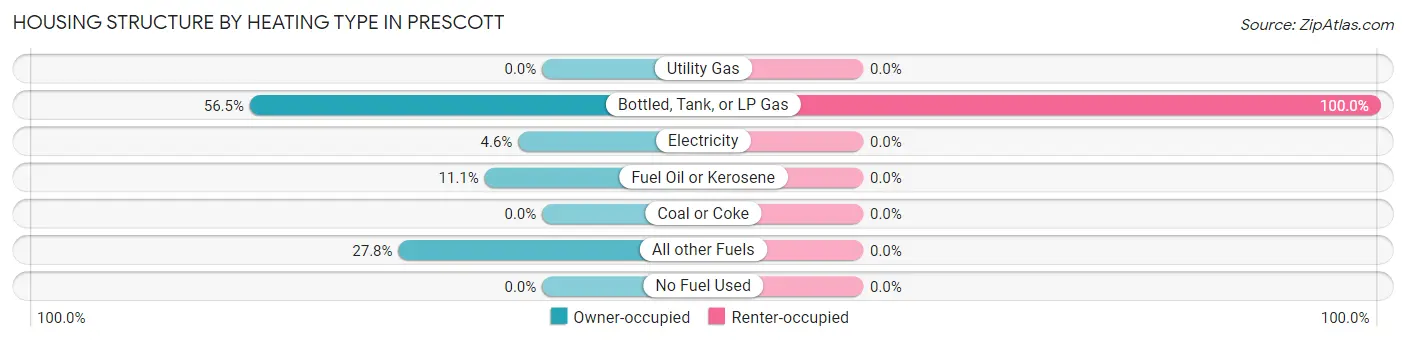
| Heating Type | Owner-occupied | Renter-occupied |
| Utility Gas | 0 (0.0%) | 0 (0.0%) |
| Bottled, Tank, or LP Gas | 61 (56.5%) | 13 (100.0%) |
| Electricity | 5 (4.6%) | 0 (0.0%) |
| Fuel Oil or Kerosene | 12 (11.1%) | 0 (0.0%) |
| Coal or Coke | 0 (0.0%) | 0 (0.0%) |
| All other Fuels | 30 (27.8%) | 0 (0.0%) |
| No Fuel Used | 0 (0.0%) | 0 (0.0%) |
| Total | 108 (100.0%) | 13 (100.0%) |
Household Vehicle Usage in Prescott
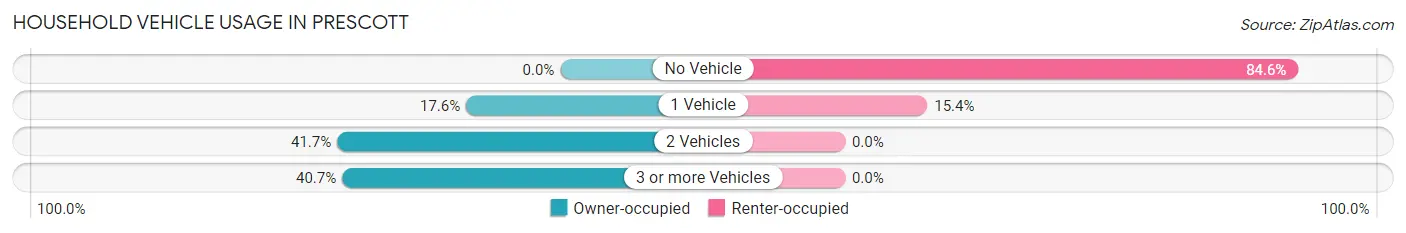
| Vehicles per Household | Owner-occupied | Renter-occupied |
| No Vehicle | 0 (0.0%) | 11 (84.6%) |
| 1 Vehicle | 19 (17.6%) | 2 (15.4%) |
| 2 Vehicles | 45 (41.7%) | 0 (0.0%) |
| 3 or more Vehicles | 44 (40.7%) | 0 (0.0%) |
| Total | 108 (100.0%) | 13 (100.0%) |
Real Estate & Mortgages in Prescott
Real Estate and Mortgage Overview in Prescott
| Characteristic | Without Mortgage | With Mortgage |
| Housing Units | 55 | 53 |
| Median Property Value | $68,100 | $63,900 |
| Median Household Income | $53,365 | $1 |
| Monthly Housing Costs | $355 | $6 |
| Real Estate Taxes | $981 | $6 |
Property Value by Mortgage Status in Prescott
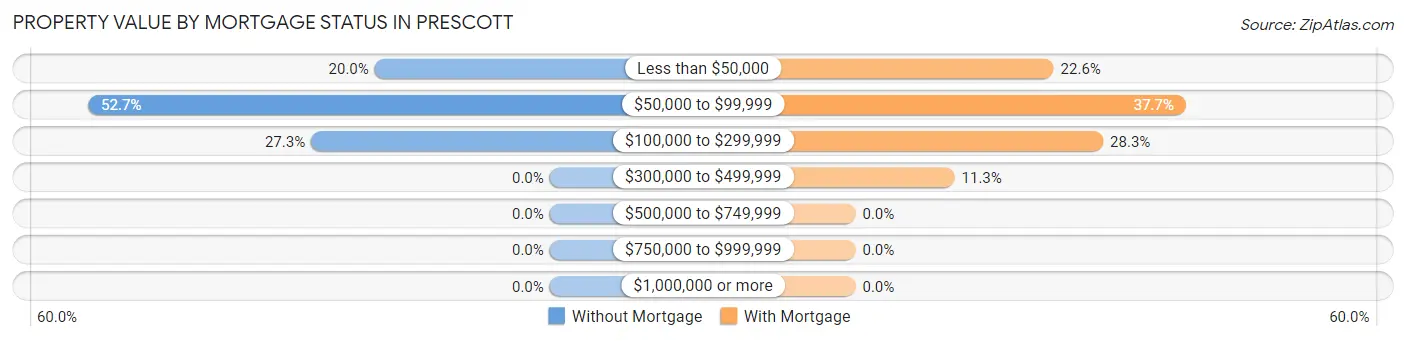
| Property Value | Without Mortgage | With Mortgage |
| Less than $50,000 | 11 (20.0%) | 12 (22.6%) |
| $50,000 to $99,999 | 29 (52.7%) | 20 (37.7%) |
| $100,000 to $299,999 | 15 (27.3%) | 15 (28.3%) |
| $300,000 to $499,999 | 0 (0.0%) | 6 (11.3%) |
| $500,000 to $749,999 | 0 (0.0%) | 0 (0.0%) |
| $750,000 to $999,999 | 0 (0.0%) | 0 (0.0%) |
| $1,000,000 or more | 0 (0.0%) | 0 (0.0%) |
| Total | 55 (100.0%) | 53 (100.0%) |
Household Income by Mortgage Status in Prescott
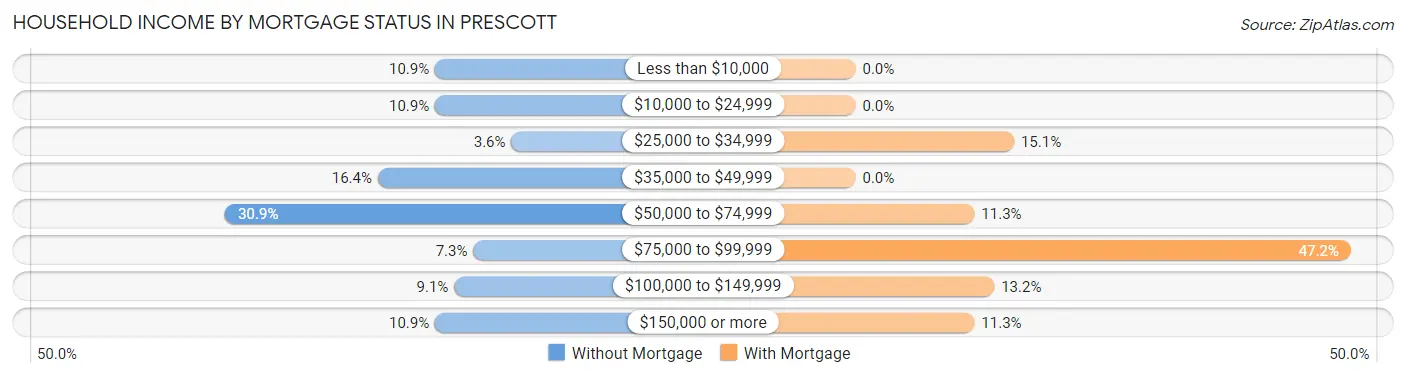
| Household Income | Without Mortgage | With Mortgage |
| Less than $10,000 | 6 (10.9%) | 0 (0.0%) |
| $10,000 to $24,999 | 6 (10.9%) | 0 (0.0%) |
| $25,000 to $34,999 | 2 (3.6%) | 8 (15.1%) |
| $35,000 to $49,999 | 9 (16.4%) | 0 (0.0%) |
| $50,000 to $74,999 | 17 (30.9%) | 6 (11.3%) |
| $75,000 to $99,999 | 4 (7.3%) | 25 (47.2%) |
| $100,000 to $149,999 | 5 (9.1%) | 7 (13.2%) |
| $150,000 or more | 6 (10.9%) | 6 (11.3%) |
| Total | 55 (100.0%) | 53 (100.0%) |
Property Value to Household Income Ratio in Prescott
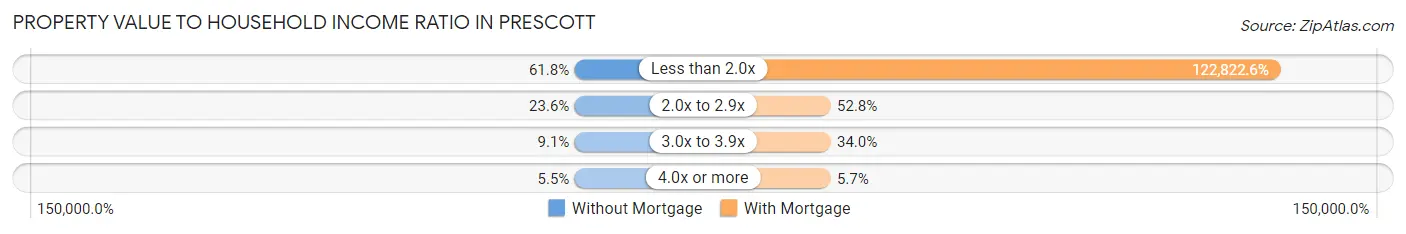
| Value-to-Income Ratio | Without Mortgage | With Mortgage |
| Less than 2.0x | 34 (61.8%) | 65,096 (122,822.6%) |
| 2.0x to 2.9x | 13 (23.6%) | 28 (52.8%) |
| 3.0x to 3.9x | 5 (9.1%) | 18 (34.0%) |
| 4.0x or more | 3 (5.4%) | 3 (5.7%) |
| Total | 55 (100.0%) | 53 (100.0%) |
Real Estate Taxes by Mortgage Status in Prescott
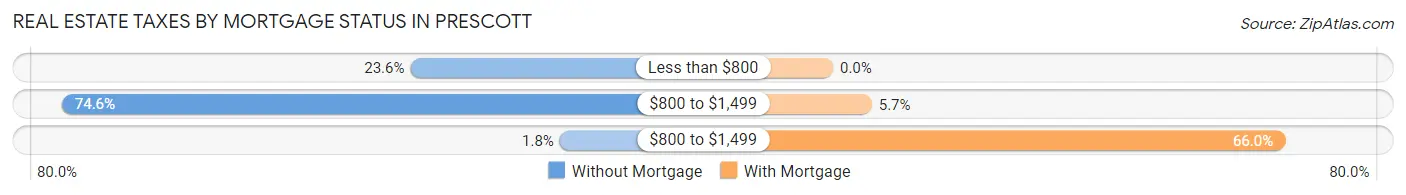
| Property Taxes | Without Mortgage | With Mortgage |
| Less than $800 | 13 (23.6%) | 0 (0.0%) |
| $800 to $1,499 | 41 (74.6%) | 3 (5.7%) |
| $800 to $1,499 | 1 (1.8%) | 35 (66.0%) |
| Total | 55 (100.0%) | 53 (100.0%) |
Health & Disability in Prescott
Health Insurance Coverage by Age in Prescott
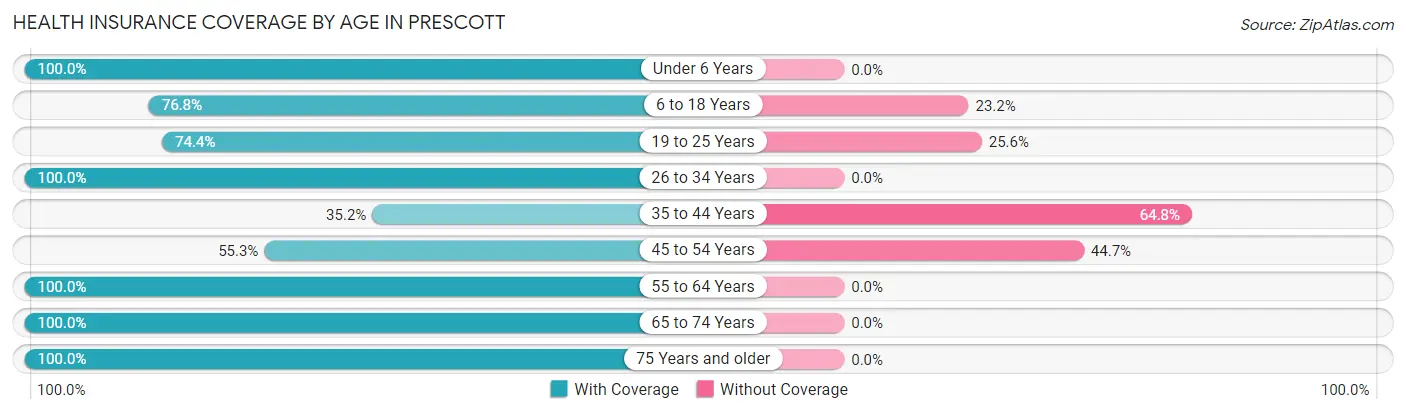
| Age Bracket | With Coverage | Without Coverage |
| Under 6 Years | 30 (100.0%) | 0 (0.0%) |
| 6 to 18 Years | 63 (76.8%) | 19 (23.2%) |
| 19 to 25 Years | 29 (74.4%) | 10 (25.6%) |
| 26 to 34 Years | 21 (100.0%) | 0 (0.0%) |
| 35 to 44 Years | 19 (35.2%) | 35 (64.8%) |
| 45 to 54 Years | 26 (55.3%) | 21 (44.7%) |
| 55 to 64 Years | 34 (100.0%) | 0 (0.0%) |
| 65 to 74 Years | 62 (100.0%) | 0 (0.0%) |
| 75 Years and older | 19 (100.0%) | 0 (0.0%) |
| Total | 303 (78.1%) | 85 (21.9%) |
Health Insurance Coverage by Citizenship Status in Prescott
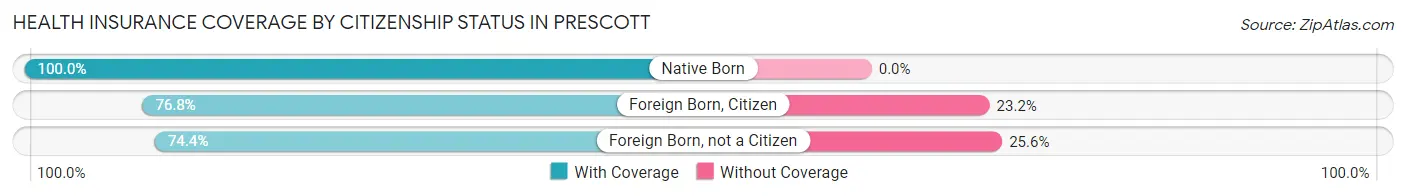
| Citizenship Status | With Coverage | Without Coverage |
| Native Born | 30 (100.0%) | 0 (0.0%) |
| Foreign Born, Citizen | 63 (76.8%) | 19 (23.2%) |
| Foreign Born, not a Citizen | 29 (74.4%) | 10 (25.6%) |
Health Insurance Coverage by Household Income in Prescott
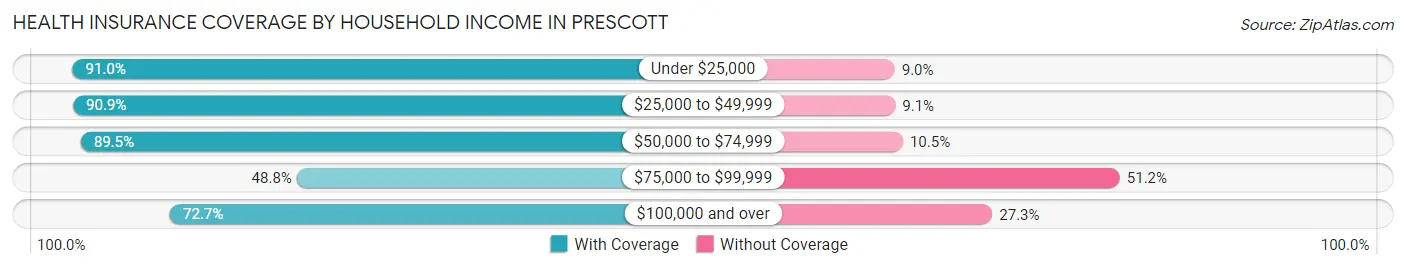
| Household Income | With Coverage | Without Coverage |
| Under $25,000 | 81 (91.0%) | 8 (9.0%) |
| $25,000 to $49,999 | 30 (90.9%) | 3 (9.1%) |
| $50,000 to $74,999 | 102 (89.5%) | 12 (10.5%) |
| $75,000 to $99,999 | 42 (48.8%) | 44 (51.2%) |
| $100,000 and over | 48 (72.7%) | 18 (27.3%) |
Public vs Private Health Insurance Coverage by Age in Prescott
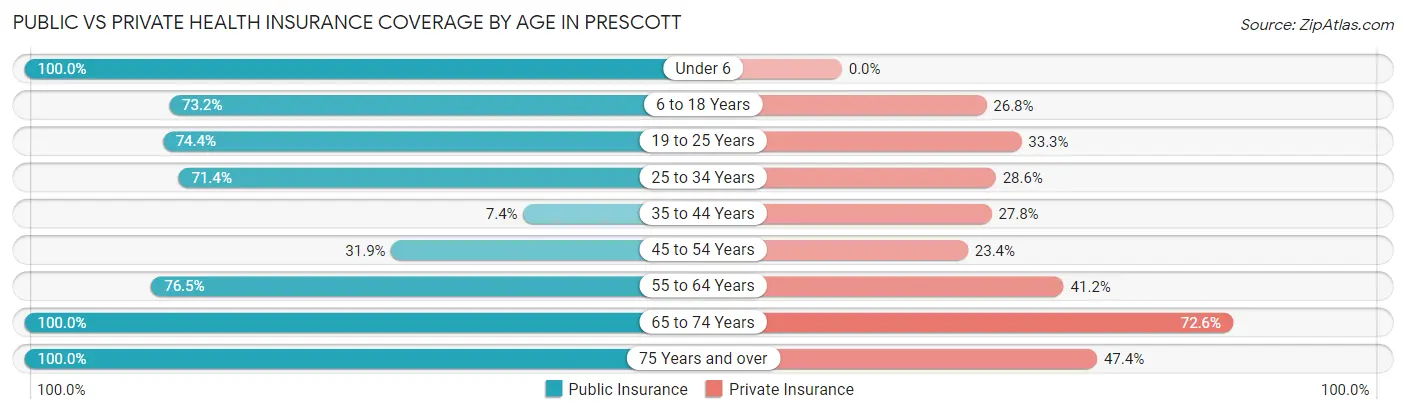
| Age Bracket | Public Insurance | Private Insurance |
| Under 6 | 30 (100.0%) | 0 (0.0%) |
| 6 to 18 Years | 60 (73.2%) | 22 (26.8%) |
| 19 to 25 Years | 29 (74.4%) | 13 (33.3%) |
| 25 to 34 Years | 15 (71.4%) | 6 (28.6%) |
| 35 to 44 Years | 4 (7.4%) | 15 (27.8%) |
| 45 to 54 Years | 15 (31.9%) | 11 (23.4%) |
| 55 to 64 Years | 26 (76.5%) | 14 (41.2%) |
| 65 to 74 Years | 62 (100.0%) | 45 (72.6%) |
| 75 Years and over | 19 (100.0%) | 9 (47.4%) |
| Total | 260 (67.0%) | 135 (34.8%) |
Disability Status by Sex by Age in Prescott
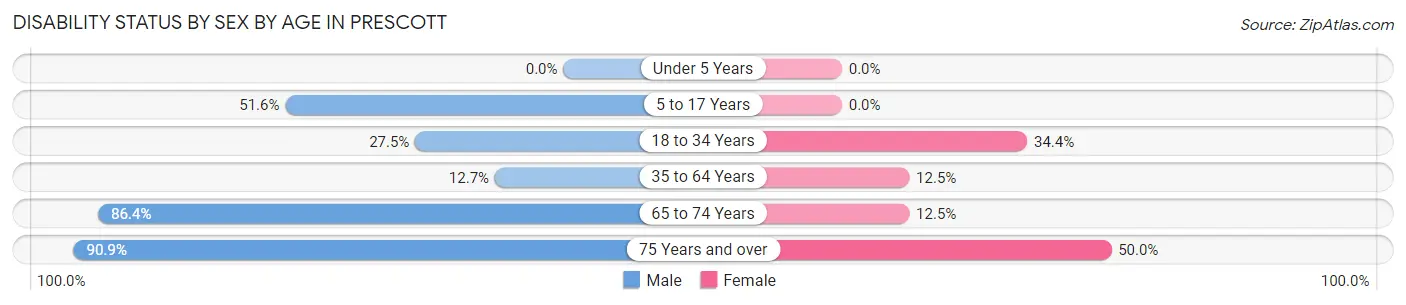
| Age Bracket | Male | Female |
| Under 5 Years | 0 (0.0%) | 0 (0.0%) |
| 5 to 17 Years | 16 (51.6%) | 0 (0.0%) |
| 18 to 34 Years | 11 (27.5%) | 11 (34.4%) |
| 35 to 64 Years | 8 (12.7%) | 9 (12.5%) |
| 65 to 74 Years | 19 (86.4%) | 5 (12.5%) |
| 75 Years and over | 10 (90.9%) | 4 (50.0%) |
Disability Class by Sex by Age in Prescott
Disability Class: Hearing Difficulty
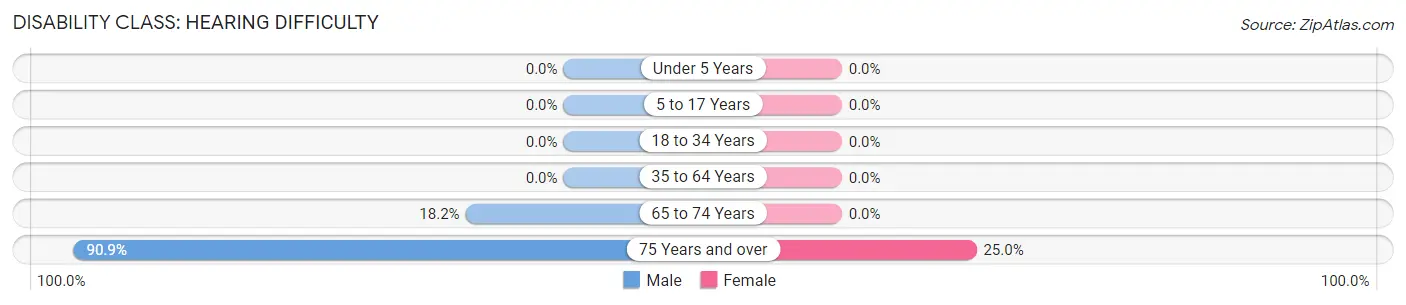
| Age Bracket | Male | Female |
| Under 5 Years | 0 (0.0%) | 0 (0.0%) |
| 5 to 17 Years | 0 (0.0%) | 0 (0.0%) |
| 18 to 34 Years | 0 (0.0%) | 0 (0.0%) |
| 35 to 64 Years | 0 (0.0%) | 0 (0.0%) |
| 65 to 74 Years | 4 (18.2%) | 0 (0.0%) |
| 75 Years and over | 10 (90.9%) | 2 (25.0%) |
Disability Class: Vision Difficulty
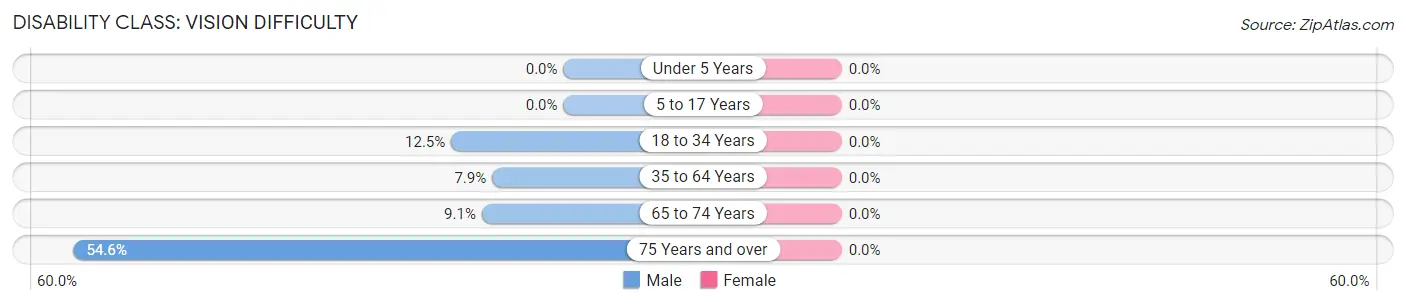
| Age Bracket | Male | Female |
| Under 5 Years | 0 (0.0%) | 0 (0.0%) |
| 5 to 17 Years | 0 (0.0%) | 0 (0.0%) |
| 18 to 34 Years | 5 (12.5%) | 0 (0.0%) |
| 35 to 64 Years | 5 (7.9%) | 0 (0.0%) |
| 65 to 74 Years | 2 (9.1%) | 0 (0.0%) |
| 75 Years and over | 6 (54.5%) | 0 (0.0%) |
Disability Class: Cognitive Difficulty
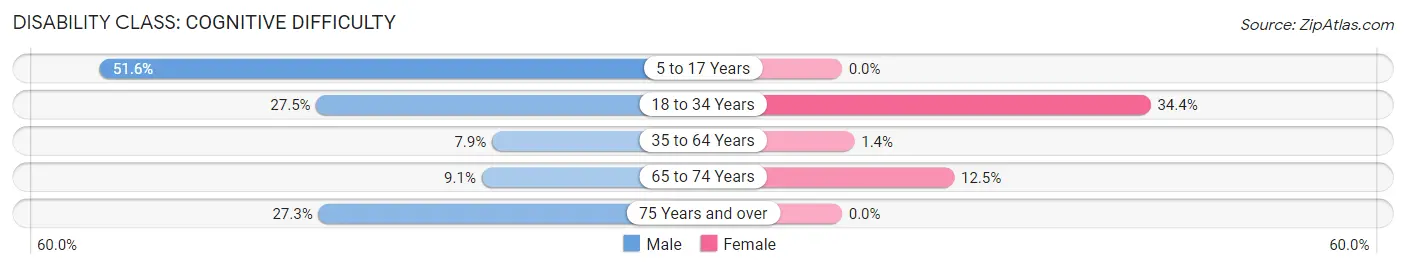
| Age Bracket | Male | Female |
| 5 to 17 Years | 16 (51.6%) | 0 (0.0%) |
| 18 to 34 Years | 11 (27.5%) | 11 (34.4%) |
| 35 to 64 Years | 5 (7.9%) | 1 (1.4%) |
| 65 to 74 Years | 2 (9.1%) | 5 (12.5%) |
| 75 Years and over | 3 (27.3%) | 0 (0.0%) |
Disability Class: Ambulatory Difficulty
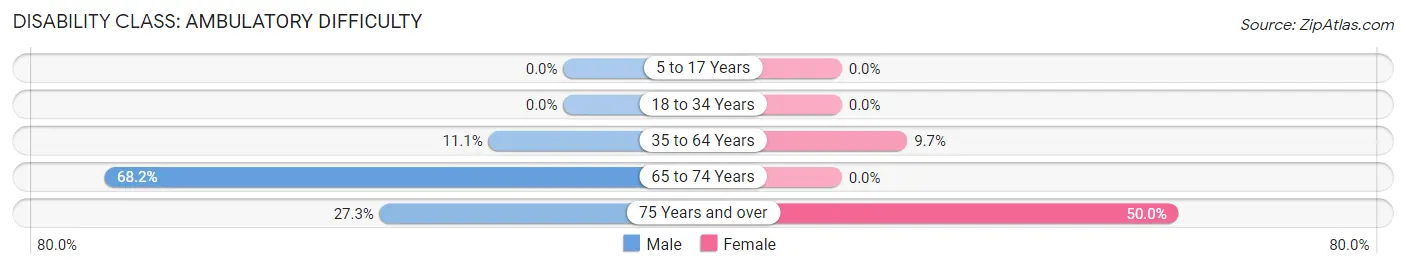
| Age Bracket | Male | Female |
| 5 to 17 Years | 0 (0.0%) | 0 (0.0%) |
| 18 to 34 Years | 0 (0.0%) | 0 (0.0%) |
| 35 to 64 Years | 7 (11.1%) | 7 (9.7%) |
| 65 to 74 Years | 15 (68.2%) | 0 (0.0%) |
| 75 Years and over | 3 (27.3%) | 4 (50.0%) |
Disability Class: Self-Care Difficulty
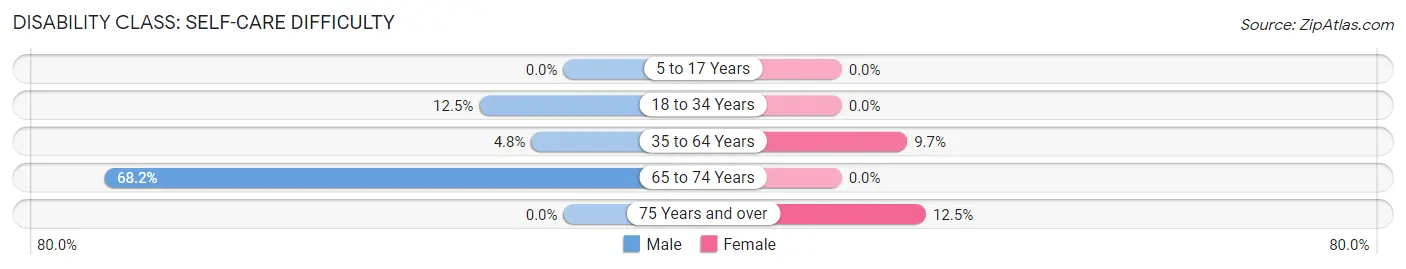
| Age Bracket | Male | Female |
| 5 to 17 Years | 0 (0.0%) | 0 (0.0%) |
| 18 to 34 Years | 5 (12.5%) | 0 (0.0%) |
| 35 to 64 Years | 3 (4.8%) | 7 (9.7%) |
| 65 to 74 Years | 15 (68.2%) | 0 (0.0%) |
| 75 Years and over | 0 (0.0%) | 1 (12.5%) |
Technology Access in Prescott
Computing Device Access in Prescott
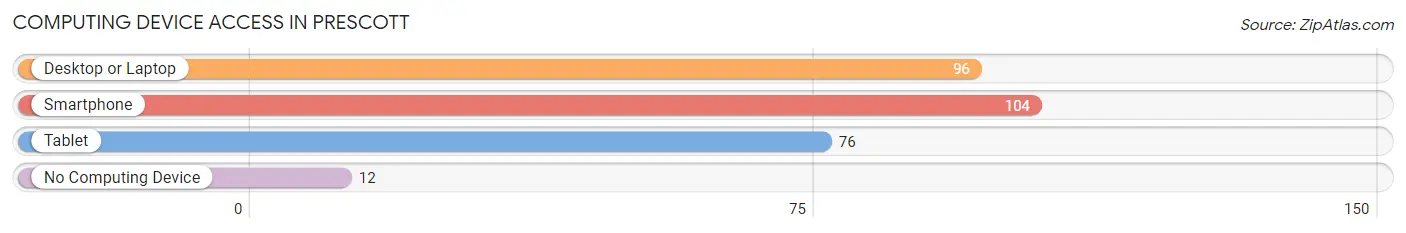
| Device Type | # Households | % Households |
| Desktop or Laptop | 96 | 79.3% |
| Smartphone | 104 | 86.0% |
| Tablet | 76 | 62.8% |
| No Computing Device | 12 | 9.9% |
| Total | 121 | 100.0% |
Internet Access in Prescott
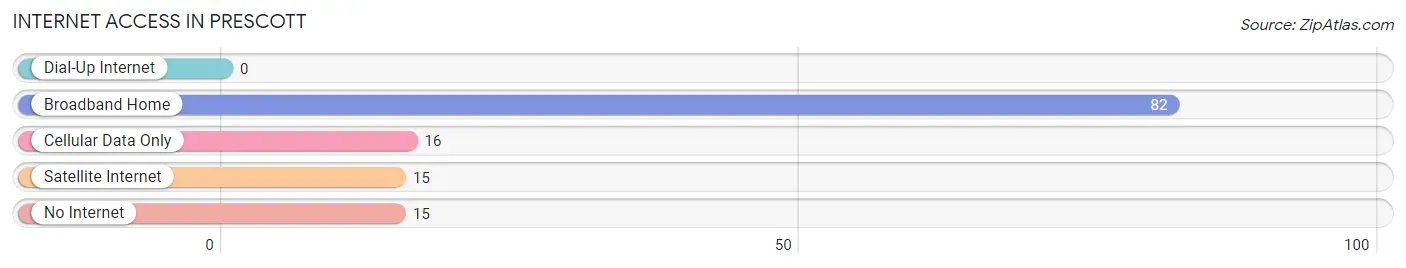
| Internet Type | # Households | % Households |
| Dial-Up Internet | 0 | 0.0% |
| Broadband Home | 82 | 67.8% |
| Cellular Data Only | 16 | 13.2% |
| Satellite Internet | 15 | 12.4% |
| No Internet | 15 | 12.4% |
| Total | 121 | 100.0% |
Prescott Summary
Prescott, Michigan is a small town located in the Upper Peninsula of Michigan. It is situated in the western part of the state, near the Wisconsin border. The town has a population of just over 1,000 people and is part of the Iron County. Prescott is known for its rural charm and its proximity to the nearby lakes and forests.
History
Prescott was first settled in 1871 by a group of settlers from Wisconsin. The town was named after the nearby Prescott Creek, which was named after a local settler, William Prescott. The town was officially incorporated in 1887.
In the early 1900s, Prescott was a thriving logging town. The town was home to several sawmills and lumber companies. The town also had a thriving agricultural industry, with many farmers growing potatoes, wheat, and other crops.
In the 1950s, the town began to decline as the logging industry moved away. The town was also affected by the decline of the railroad industry. In the 1970s, the town began to experience a resurgence as tourism began to increase in the area.
Geography
Prescott is located in the western part of the Upper Peninsula of Michigan. The town is situated in Iron County, near the Wisconsin border. The town is located on the shores of Lake Superior and is surrounded by forests and lakes. The nearby towns of Iron River and Ironwood are located to the east and west of Prescott, respectively.
The town has a total area of 1.2 square miles, all of which is land. The town is located at an elevation of 1,072 feet above sea level.
Economy
Prescott’s economy is largely based on tourism. The town is home to several resorts and campgrounds, as well as a number of restaurants and shops. The town is also home to a number of small businesses, including a grocery store, a hardware store, and a gas station.
The town is also home to a number of manufacturing companies, including a paper mill and a furniture factory. The town is also home to a number of logging companies, which are responsible for the harvesting of timber in the area.
Demographics
As of the 2010 census, Prescott had a population of 1,072 people. The town has a population density of 890 people per square mile. The median age of the population is 44.7 years.
The racial makeup of the town is 97.2% White, 0.7% African American, 0.3% Native American, 0.2% Asian, 0.1% Pacific Islander, 0.2% from other races, and 1.3% from two or more races. The median household income in Prescott is $37,917. The per capita income in Prescott is $20,845.
Common Questions
What is Per Capita Income in Prescott?
Per Capita income in Prescott is $19,052.
What is the Median Family Income in Prescott?
Median Family Income in Prescott is $54,550.
What is the Median Household income in Prescott?
Median Household Income in Prescott is $53,550.
What is Income or Wage Gap in Prescott?
Income or Wage Gap in Prescott is 60.9%.
Women in Prescott earn 39.1 cents for every dollar earned by a man.
What is Inequality or Gini Index in Prescott?
Inequality or Gini Index in Prescott is 0.39.
What is the Total Population of Prescott?
Total Population of Prescott is 388.
What is the Total Male Population of Prescott?
Total Male Population of Prescott is 186.
What is the Total Female Population of Prescott?
Total Female Population of Prescott is 202.
What is the Ratio of Males per 100 Females in Prescott?
There are 92.08 Males per 100 Females in Prescott.
What is the Ratio of Females per 100 Males in Prescott?
There are 108.60 Females per 100 Males in Prescott.
What is the Median Population Age in Prescott?
Median Population Age in Prescott is 43.3 Years.
What is the Average Family Size in Prescott
Average Family Size in Prescott is 3.6 People.
What is the Average Household Size in Prescott
Average Household Size in Prescott is 3.2 People.
How Large is the Labor Force in Prescott?
There are 135 People in the Labor Forcein in Prescott.
What is the Percentage of People in the Labor Force in Prescott?
45.0% of People are in the Labor Force in Prescott.
What is the Unemployment Rate in Prescott?
Unemployment Rate in Prescott is 14.1%.