Port Sanilac, MI Map & Demographics
Port Sanilac Map
Port Sanilac Overview
$31,805
PER CAPITA INCOME
$62,375
AVG FAMILY INCOME
$50,078
AVG HOUSEHOLD INCOME
14.7%
WAGE / INCOME GAP [ % ]
85.3¢/ $1
WAGE / INCOME GAP [ $ ]
0.49
INEQUALITY / GINI INDEX
792
TOTAL POPULATION
392
MALE POPULATION
400
FEMALE POPULATION
98.00
MALES / 100 FEMALES
102.04
FEMALES / 100 MALES
42.3
MEDIAN AGE
2.8
AVG FAMILY SIZE
2.2
AVG HOUSEHOLD SIZE
304
LABOR FORCE [ PEOPLE ]
48.8%
PERCENT IN LABOR FORCE
3.3%
UNEMPLOYMENT RATE
Port Sanilac Zip Codes
Port Sanilac Area Codes
Income in Port Sanilac
Income Overview in Port Sanilac
Per Capita Income in Port Sanilac is $31,805, while median incomes of families and households are $62,375 and $50,078 respectively.
| Characteristic | Number | Measure |
| Per Capita Income | 792 | $31,805 |
| Median Family Income | 205 | $62,375 |
| Mean Family Income | 205 | $73,736 |
| Median Household Income | 347 | $50,078 |
| Mean Household Income | 347 | $73,625 |
| Income Deficit | 205 | $0 |
| Wage / Income Gap (%) | 792 | 14.70% |
| Wage / Income Gap ($) | 792 | 85.30¢ per $1 |
| Gini / Inequality Index | 792 | 0.49 |
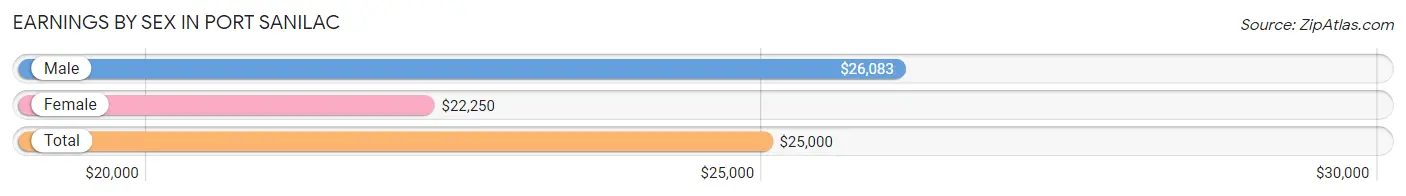
Earnings by Sex in Port Sanilac
Average Earnings in Port Sanilac are $25,000, $26,083 for men and $22,250 for women, a difference of 14.7%.
| Sex | Number | Average Earnings |
| Male | 205 (57.6%) | $26,083 |
| Female | 151 (42.4%) | $22,250 |
| Total | 356 (100.0%) | $25,000 |
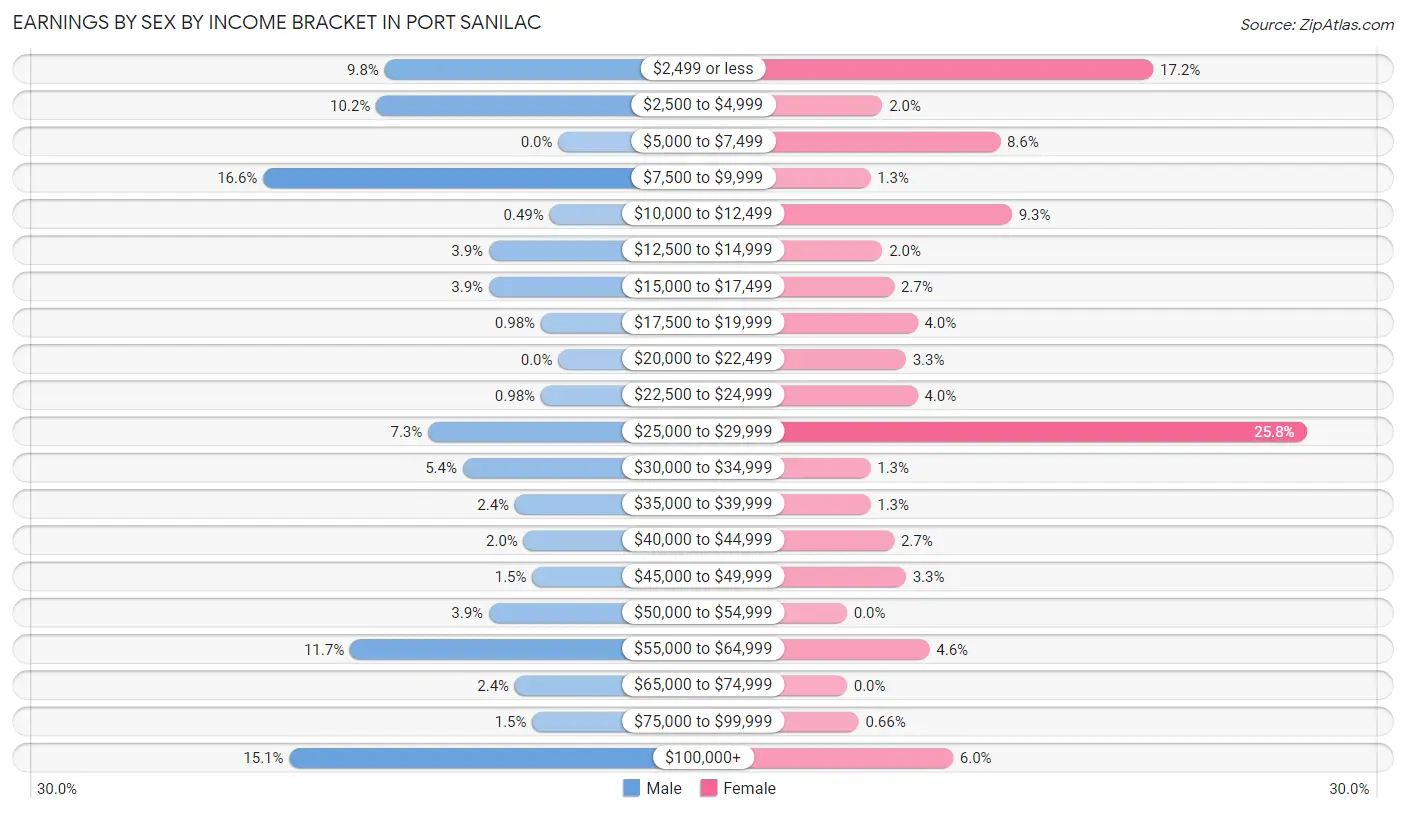
Earnings by Sex by Income Bracket in Port Sanilac
The most common earnings brackets in Port Sanilac are $7,500 to $9,999 for men (34 | 16.6%) and $25,000 to $29,999 for women (39 | 25.8%).
| Income | Male | Female |
| $2,499 or less | 20 (9.8%) | 26 (17.2%) |
| $2,500 to $4,999 | 21 (10.2%) | 3 (2.0%) |
| $5,000 to $7,499 | 0 (0.0%) | 13 (8.6%) |
| $7,500 to $9,999 | 34 (16.6%) | 2 (1.3%) |
| $10,000 to $12,499 | 1 (0.5%) | 14 (9.3%) |
| $12,500 to $14,999 | 8 (3.9%) | 3 (2.0%) |
| $15,000 to $17,499 | 8 (3.9%) | 4 (2.6%) |
| $17,500 to $19,999 | 2 (1.0%) | 6 (4.0%) |
| $20,000 to $22,499 | 0 (0.0%) | 5 (3.3%) |
| $22,500 to $24,999 | 2 (1.0%) | 6 (4.0%) |
| $25,000 to $29,999 | 15 (7.3%) | 39 (25.8%) |
| $30,000 to $34,999 | 11 (5.4%) | 2 (1.3%) |
| $35,000 to $39,999 | 5 (2.4%) | 2 (1.3%) |
| $40,000 to $44,999 | 4 (1.9%) | 4 (2.6%) |
| $45,000 to $49,999 | 3 (1.5%) | 5 (3.3%) |
| $50,000 to $54,999 | 8 (3.9%) | 0 (0.0%) |
| $55,000 to $64,999 | 24 (11.7%) | 7 (4.6%) |
| $65,000 to $74,999 | 5 (2.4%) | 0 (0.0%) |
| $75,000 to $99,999 | 3 (1.5%) | 1 (0.7%) |
| $100,000+ | 31 (15.1%) | 9 (6.0%) |
| Total | 205 (100.0%) | 151 (100.0%) |
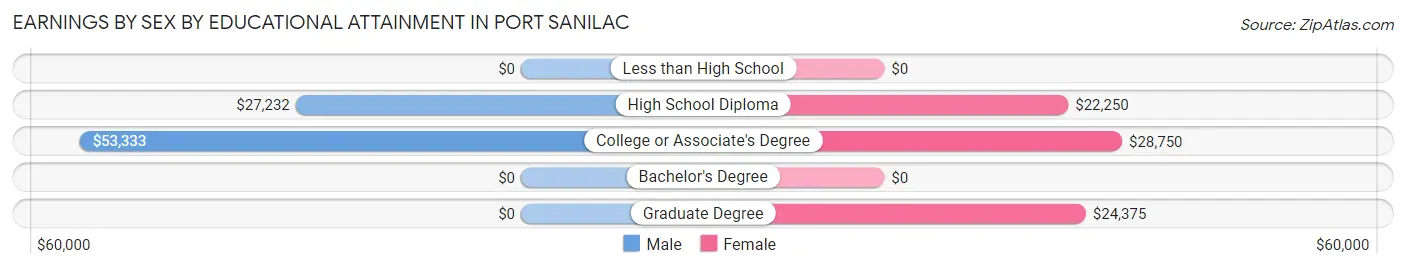
Earnings by Sex by Educational Attainment in Port Sanilac
Average earnings in Port Sanilac are $27,000 for men and $26,319 for women, a difference of 2.5%. Men with an educational attainment of college or associate's degree enjoy the highest average annual earnings of $53,333, while those with high school diploma education earn the least with $27,232. Women with an educational attainment of college or associate's degree earn the most with the average annual earnings of $28,750, while those with high school diploma education have the smallest earnings of $22,250.
| Educational Attainment | Male Income | Female Income |
| Less than High School | - | - |
| High School Diploma | $27,232 | $22,250 |
| College or Associate's Degree | $53,333 | $28,750 |
| Bachelor's Degree | - | - |
| Graduate Degree | - | - |
| Total | $27,000 | $26,319 |
Family Income in Port Sanilac
Family Income Brackets in Port Sanilac
According to the Port Sanilac family income data, there are 49 families falling into the $100,000 to $149,999 income range, which is the most common income bracket and makes up 23.9% of all families. Conversely, the $150,000 to $199,999 income bracket is the least frequent group with only 7 families (3.4%) belonging to this category.
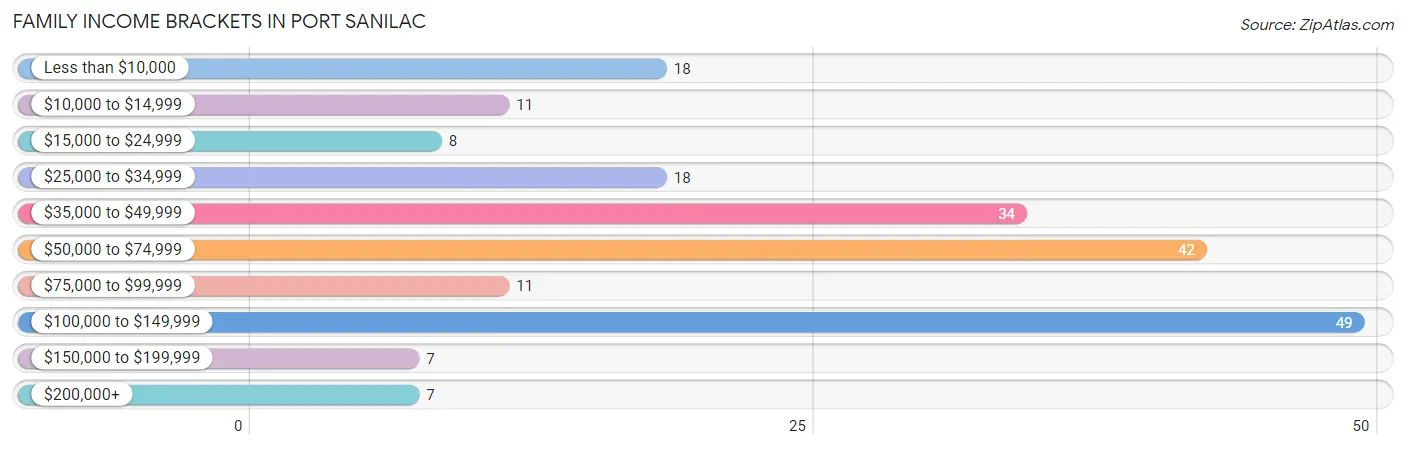
| Income Bracket | # Families | % Families |
| Less than $10,000 | 18 | 8.8% |
| $10,000 to $14,999 | 11 | 5.4% |
| $15,000 to $24,999 | 8 | 3.9% |
| $25,000 to $34,999 | 18 | 8.8% |
| $35,000 to $49,999 | 34 | 16.6% |
| $50,000 to $74,999 | 42 | 20.5% |
| $75,000 to $99,999 | 11 | 5.4% |
| $100,000 to $149,999 | 49 | 23.9% |
| $150,000 to $199,999 | 7 | 3.4% |
| $200,000+ | 7 | 3.4% |
Family Income by Famaliy Size in Port Sanilac
5-person families (30 | 14.6%) account for the highest median family income in Port Sanilac with $124,118 per family, while 3-person families (36 | 17.6%) have the highest median income of $25,278 per family member.
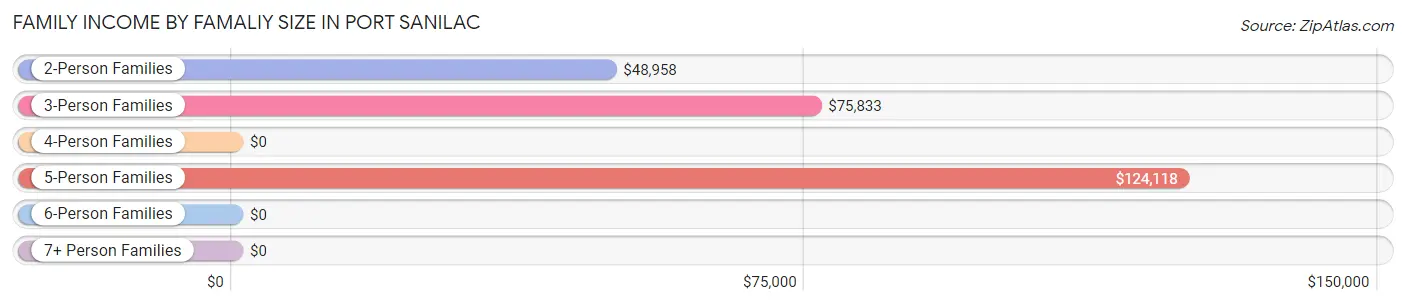
| Income Bracket | # Families | Median Income |
| 2-Person Families | 103 (50.2%) | $48,958 |
| 3-Person Families | 36 (17.6%) | $75,833 |
| 4-Person Families | 36 (17.6%) | $0 |
| 5-Person Families | 30 (14.6%) | $124,118 |
| 6-Person Families | 0 (0.0%) | $0 |
| 7+ Person Families | 0 (0.0%) | $0 |
| Total | 205 (100.0%) | $62,375 |
Family Income by Number of Earners in Port Sanilac
The median family income in Port Sanilac is $62,375, with families comprising 3+ earners (20) having the highest median family income of $149,091, while families with 1 earner (83) have the lowest median family income of $38,295, accounting for 9.8% and 40.5% of families, respectively.
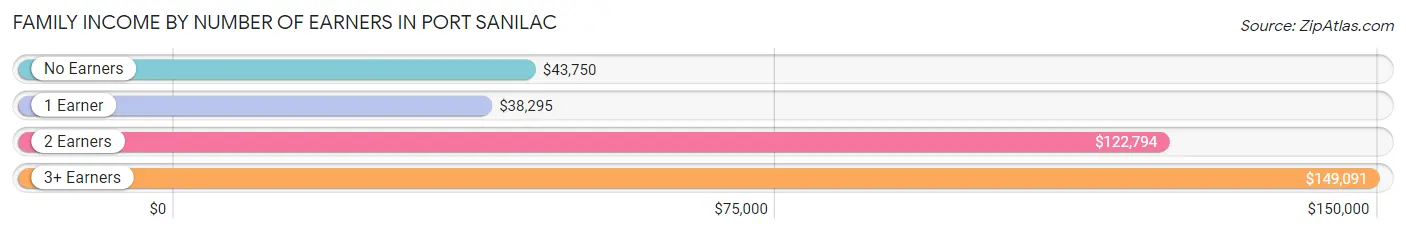
| Number of Earners | # Families | Median Income |
| No Earners | 48 (23.4%) | $43,750 |
| 1 Earner | 83 (40.5%) | $38,295 |
| 2 Earners | 54 (26.3%) | $122,794 |
| 3+ Earners | 20 (9.8%) | $149,091 |
| Total | 205 (100.0%) | $62,375 |
Household Income in Port Sanilac
Household Income Brackets in Port Sanilac
With 73 households falling in the category, the $50,000 to $74,999 income range is the most frequent in Port Sanilac, accounting for 21.0% of all households. In contrast, only 7 households (2.0%) fall into the $150,000 to $199,999 income bracket, making it the least populous group.
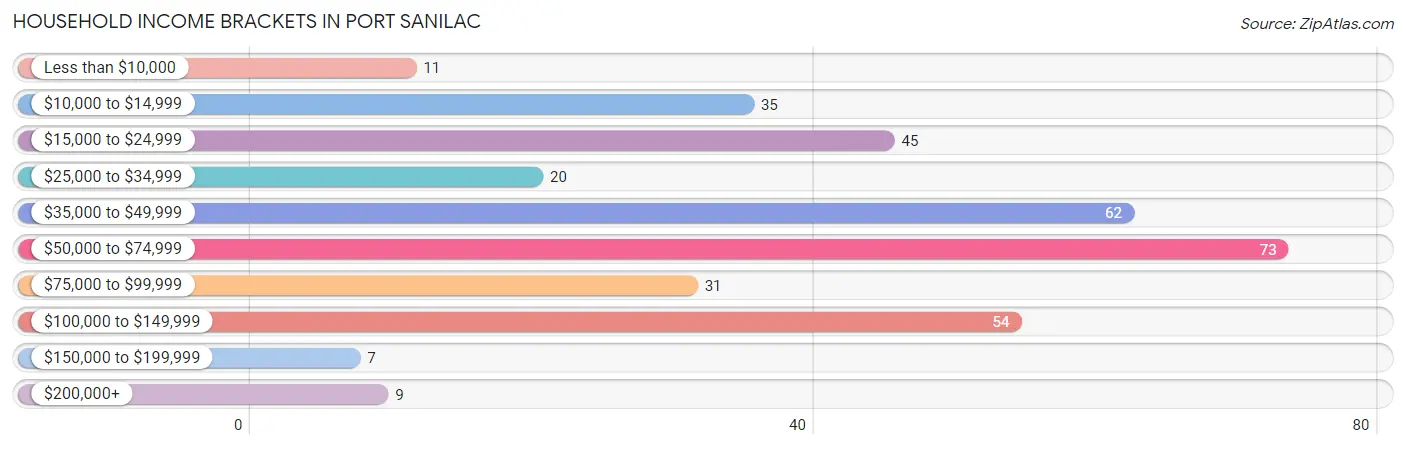
| Income Bracket | # Households | % Households |
| Less than $10,000 | 11 | 3.2% |
| $10,000 to $14,999 | 35 | 10.1% |
| $15,000 to $24,999 | 45 | 13.0% |
| $25,000 to $34,999 | 20 | 5.8% |
| $35,000 to $49,999 | 62 | 17.9% |
| $50,000 to $74,999 | 73 | 21.0% |
| $75,000 to $99,999 | 31 | 8.9% |
| $100,000 to $149,999 | 54 | 15.6% |
| $150,000 to $199,999 | 7 | 2.0% |
| $200,000+ | 9 | 2.6% |
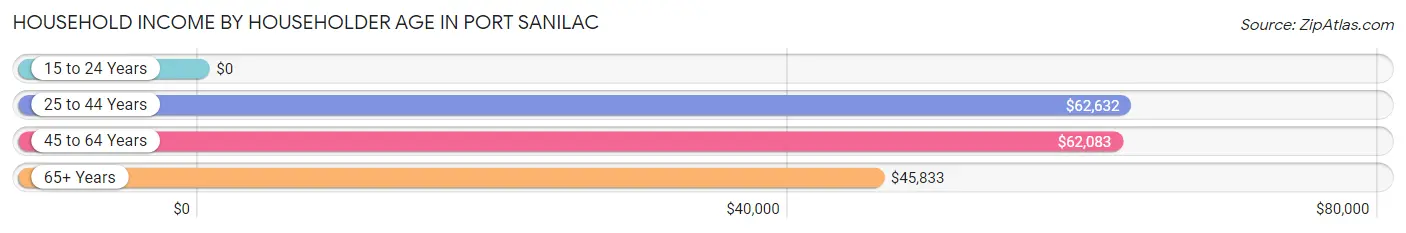
Household Income by Householder Age in Port Sanilac
The median household income in Port Sanilac is $50,078, with the highest median household income of $62,632 found in the 25 to 44 years age bracket for the primary householder. A total of 86 households (24.8%) fall into this category. Meanwhile, the 15 to 24 years age bracket for the primary householder has the lowest median household income of $0, with 8 households (2.3%) in this group.
| Income Bracket | # Households | Median Income |
| 15 to 24 Years | 8 (2.3%) | $0 |
| 25 to 44 Years | 86 (24.8%) | $62,632 |
| 45 to 64 Years | 87 (25.1%) | $62,083 |
| 65+ Years | 166 (47.8%) | $45,833 |
| Total | 347 (100.0%) | $50,078 |
Poverty in Port Sanilac
Income Below Poverty by Sex and Age in Port Sanilac
With 13.3% poverty level for males and 26.5% for females among the residents of Port Sanilac, 12 to 14 year old males and 5 year old females are the most vulnerable to poverty, with 9 males (81.8%) and 5 females (100.0%) in their respective age groups living below the poverty level.
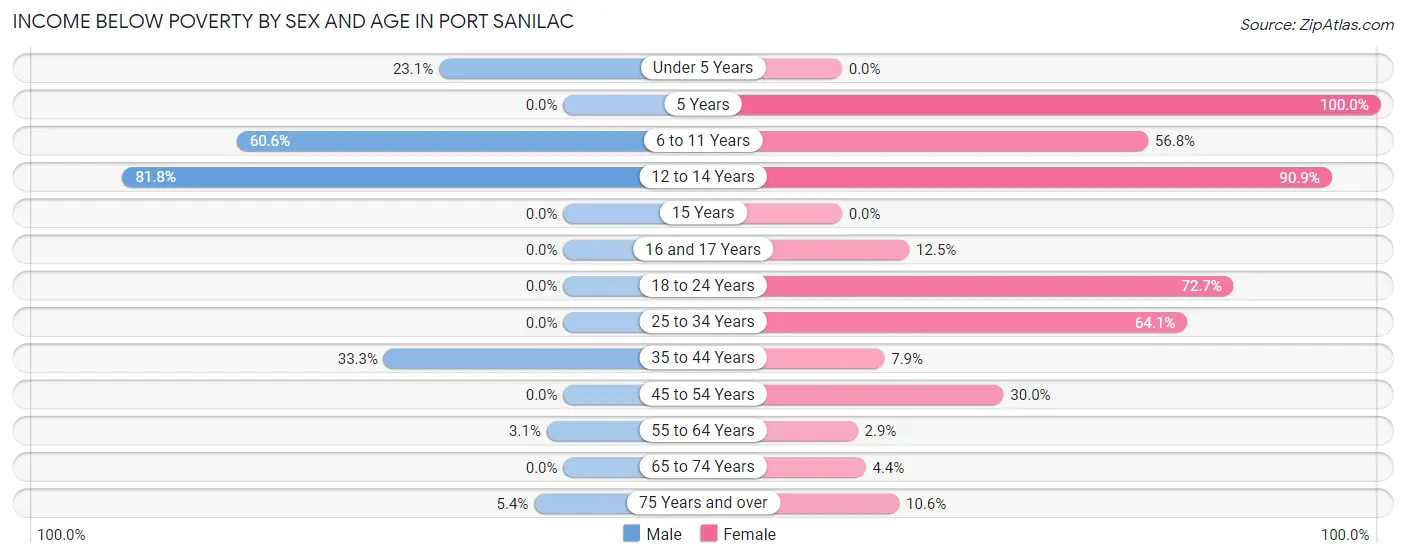
| Age Bracket | Male | Female |
| Under 5 Years | 3 (23.1%) | 0 (0.0%) |
| 5 Years | 0 (0.0%) | 5 (100.0%) |
| 6 to 11 Years | 20 (60.6%) | 25 (56.8%) |
| 12 to 14 Years | 9 (81.8%) | 20 (90.9%) |
| 15 Years | 0 (0.0%) | 0 (0.0%) |
| 16 and 17 Years | 0 (0.0%) | 4 (12.5%) |
| 18 to 24 Years | 0 (0.0%) | 8 (72.7%) |
| 25 to 34 Years | 0 (0.0%) | 25 (64.1%) |
| 35 to 44 Years | 16 (33.3%) | 3 (7.9%) |
| 45 to 54 Years | 0 (0.0%) | 3 (30.0%) |
| 55 to 64 Years | 2 (3.1%) | 2 (2.9%) |
| 65 to 74 Years | 0 (0.0%) | 3 (4.4%) |
| 75 Years and over | 2 (5.4%) | 5 (10.6%) |
| Total | 52 (13.3%) | 103 (26.5%) |
Income Above Poverty by Sex and Age in Port Sanilac
According to the poverty statistics in Port Sanilac, males aged 15 years and females aged under 5 years are the age groups that are most secure financially, with 100.0% of males and 100.0% of females in these age groups living above the poverty line.
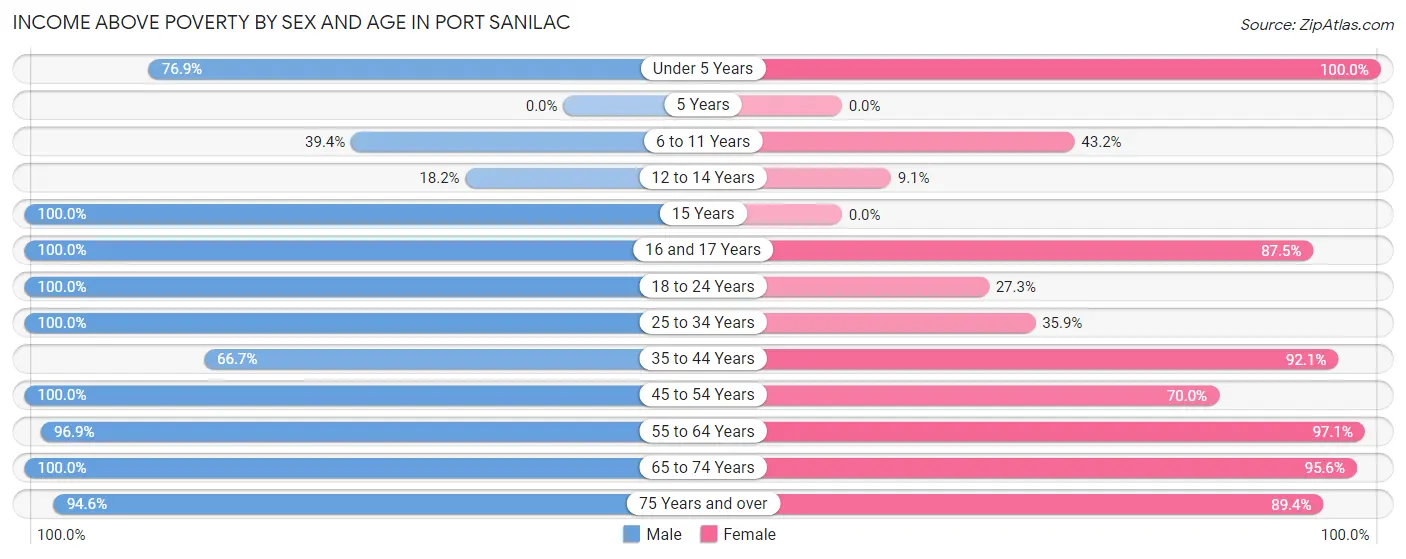
| Age Bracket | Male | Female |
| Under 5 Years | 10 (76.9%) | 5 (100.0%) |
| 5 Years | 0 (0.0%) | 0 (0.0%) |
| 6 to 11 Years | 13 (39.4%) | 19 (43.2%) |
| 12 to 14 Years | 2 (18.2%) | 2 (9.1%) |
| 15 Years | 25 (100.0%) | 0 (0.0%) |
| 16 and 17 Years | 14 (100.0%) | 28 (87.5%) |
| 18 to 24 Years | 2 (100.0%) | 3 (27.3%) |
| 25 to 34 Years | 52 (100.0%) | 14 (35.9%) |
| 35 to 44 Years | 32 (66.7%) | 35 (92.1%) |
| 45 to 54 Years | 5 (100.0%) | 7 (70.0%) |
| 55 to 64 Years | 63 (96.9%) | 66 (97.1%) |
| 65 to 74 Years | 87 (100.0%) | 65 (95.6%) |
| 75 Years and over | 35 (94.6%) | 42 (89.4%) |
| Total | 340 (86.7%) | 286 (73.5%) |
Income Below Poverty Among Married-Couple Families in Port Sanilac
The poverty statistics for married-couple families in Port Sanilac show that 1.4% or 2 of the total 139 families live below the poverty line. Families with no children have the highest poverty rate of 2.2%, comprising of 2 families. On the other hand, families with 1 or 2 children have the lowest poverty rate of 0.0%, which includes 0 families.
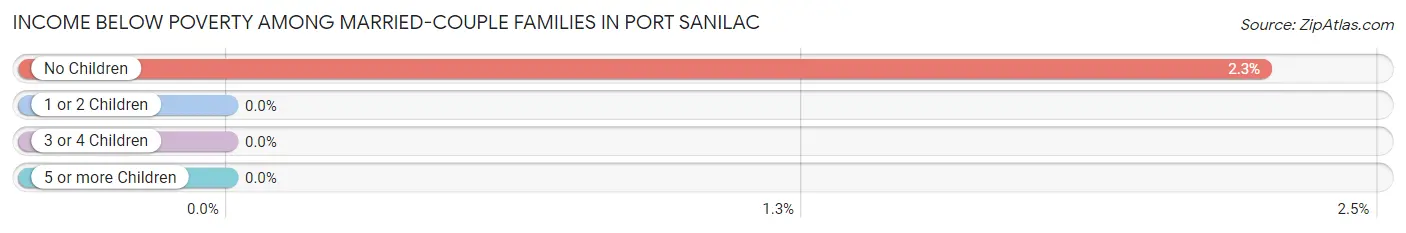
| Children | Above Poverty | Below Poverty |
| No Children | 87 (97.8%) | 2 (2.2%) |
| 1 or 2 Children | 29 (100.0%) | 0 (0.0%) |
| 3 or 4 Children | 21 (100.0%) | 0 (0.0%) |
| 5 or more Children | 0 (0.0%) | 0 (0.0%) |
| Total | 137 (98.6%) | 2 (1.4%) |
Income Below Poverty Among Single-Parent Households in Port Sanilac
According to the poverty data in Port Sanilac, 68.4% or 13 single-father households and 59.6% or 28 single-mother households are living below the poverty line. Among single-father households, those with 3 or 4 children have the highest poverty rate, with 13 households (100.0%) experiencing poverty. Likewise, among single-mother households, those with 3 or 4 children have the highest poverty rate, with 14 households (93.3%) falling below the poverty line.
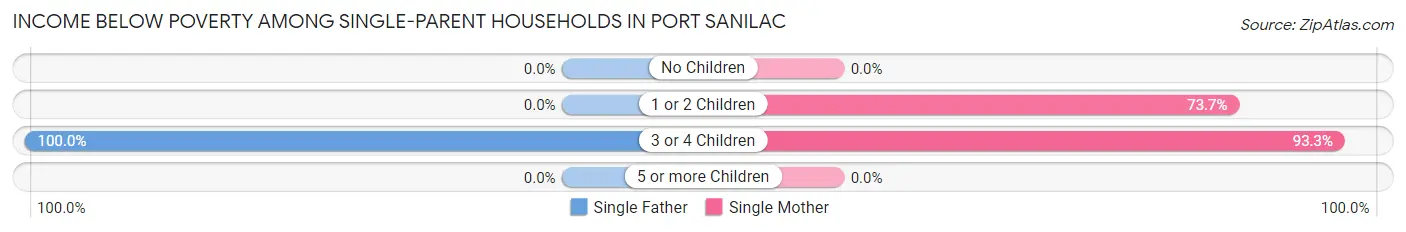
| Children | Single Father | Single Mother |
| No Children | 0 (0.0%) | 0 (0.0%) |
| 1 or 2 Children | 0 (0.0%) | 14 (73.7%) |
| 3 or 4 Children | 13 (100.0%) | 14 (93.3%) |
| 5 or more Children | 0 (0.0%) | 0 (0.0%) |
| Total | 13 (68.4%) | 28 (59.6%) |
Income Below Poverty Among Married-Couple vs Single-Parent Households in Port Sanilac
The poverty data for Port Sanilac shows that 2 of the married-couple family households (1.4%) and 41 of the single-parent households (62.1%) are living below the poverty level. Within the married-couple family households, those with no children have the highest poverty rate, with 2 households (2.2%) falling below the poverty line. Among the single-parent households, those with 3 or 4 children have the highest poverty rate, with 27 household (96.4%) living below poverty.
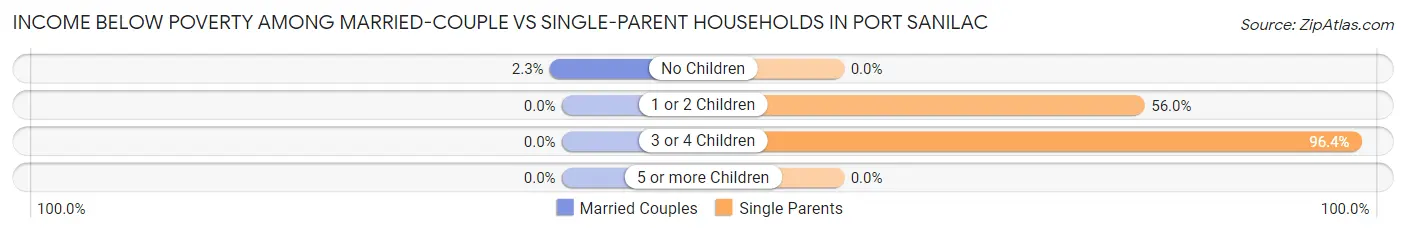
| Children | Married-Couple Families | Single-Parent Households |
| No Children | 2 (2.2%) | 0 (0.0%) |
| 1 or 2 Children | 0 (0.0%) | 14 (56.0%) |
| 3 or 4 Children | 0 (0.0%) | 27 (96.4%) |
| 5 or more Children | 0 (0.0%) | 0 (0.0%) |
| Total | 2 (1.4%) | 41 (62.1%) |
Race in Port Sanilac
The most populous races in Port Sanilac are White / Caucasian (780 | 98.5%), Hispanic or Latino (15 | 1.9%), and Two or more Races (12 | 1.5%).
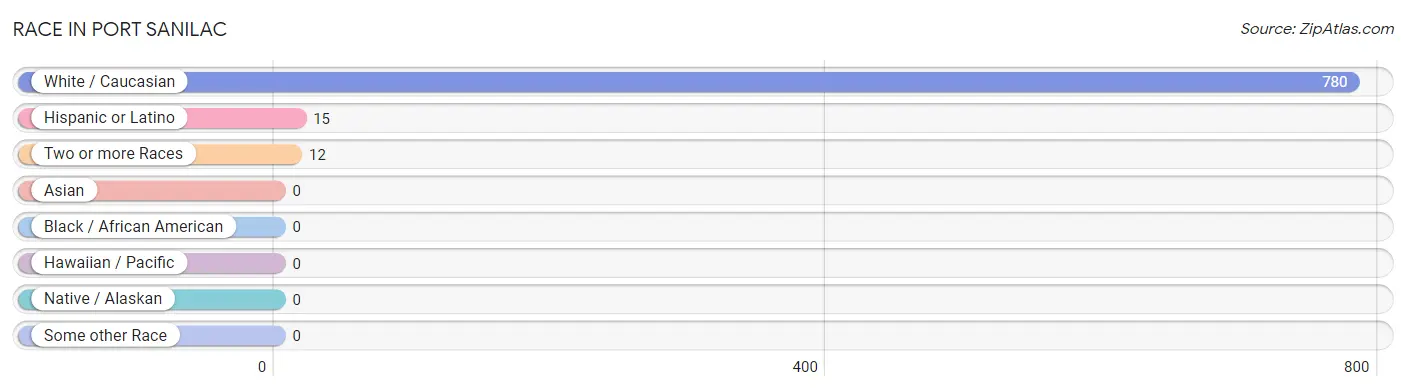
| Race | # Population | % Population |
| Asian | 0 | 0.0% |
| Black / African American | 0 | 0.0% |
| Hawaiian / Pacific | 0 | 0.0% |
| Hispanic or Latino | 15 | 1.9% |
| Native / Alaskan | 0 | 0.0% |
| White / Caucasian | 780 | 98.5% |
| Two or more Races | 12 | 1.5% |
| Some other Race | 0 | 0.0% |
| Total | 792 | 100.0% |
Ancestry in Port Sanilac
The most populous ancestries reported in Port Sanilac are German (267 | 33.7%), English (175 | 22.1%), Irish (72 | 9.1%), Italian (59 | 7.4%), and Polish (47 | 5.9%), together accounting for 78.3% of all Port Sanilac residents.
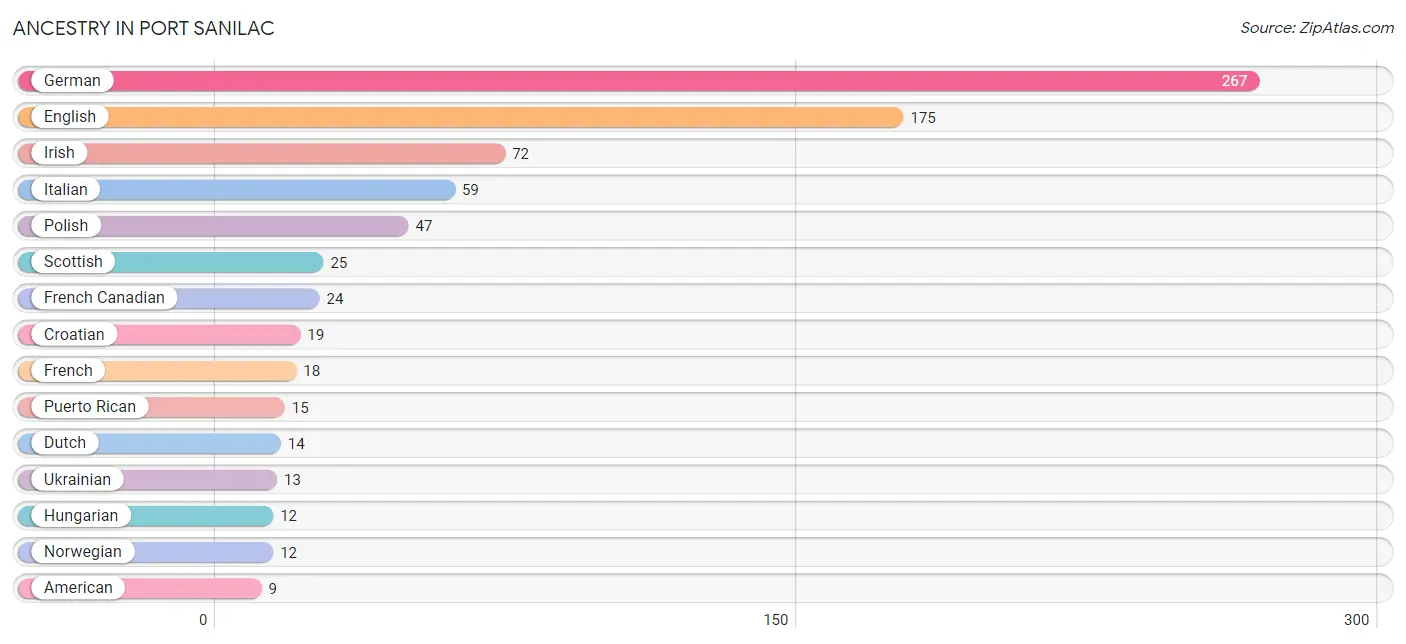
| Ancestry | # Population | % Population |
| American | 9 | 1.1% |
| Arab | 7 | 0.9% |
| Armenian | 6 | 0.8% |
| Austrian | 5 | 0.6% |
| Belgian | 4 | 0.5% |
| British | 7 | 0.9% |
| Croatian | 19 | 2.4% |
| Dutch | 14 | 1.8% |
| Eastern European | 9 | 1.1% |
| English | 175 | 22.1% |
| Finnish | 2 | 0.3% |
| French | 18 | 2.3% |
| French Canadian | 24 | 3.0% |
| German | 267 | 33.7% |
| Greek | 3 | 0.4% |
| Hungarian | 12 | 1.5% |
| Irish | 72 | 9.1% |
| Italian | 59 | 7.4% |
| Lebanese | 7 | 0.9% |
| Maltese | 1 | 0.1% |
| Northern European | 4 | 0.5% |
| Norwegian | 12 | 1.5% |
| Polish | 47 | 5.9% |
| Puerto Rican | 15 | 1.9% |
| Romanian | 2 | 0.3% |
| Scandinavian | 2 | 0.3% |
| Scottish | 25 | 3.2% |
| Slovak | 2 | 0.3% |
| Swedish | 5 | 0.6% |
| Ukrainian | 13 | 1.6% |
| Welsh | 6 | 0.8% | View All 31 Rows |
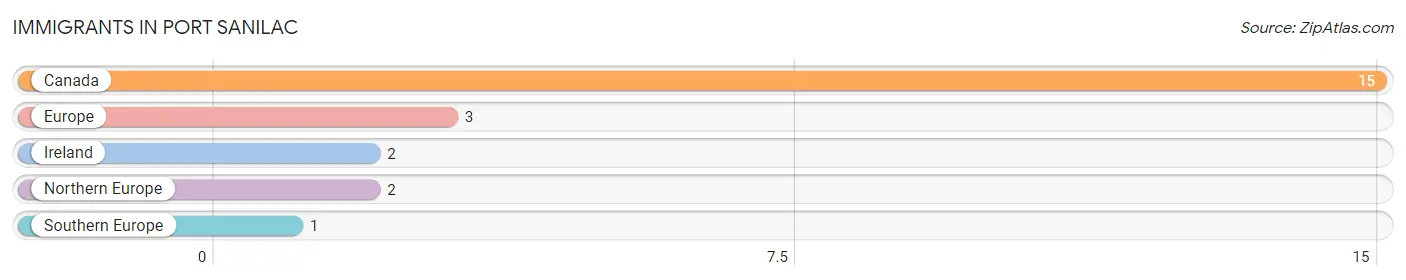
Immigrants in Port Sanilac
The most numerous immigrant groups reported in Port Sanilac came from Canada (15 | 1.9%), Europe (3 | 0.4%), Ireland (2 | 0.3%), Northern Europe (2 | 0.3%), and Southern Europe (1 | 0.1%), together accounting for 2.9% of all Port Sanilac residents.
| Immigration Origin | # Population | % Population |
| Canada | 15 | 1.9% |
| Europe | 3 | 0.4% |
| Ireland | 2 | 0.3% |
| Northern Europe | 2 | 0.3% |
| Southern Europe | 1 | 0.1% | View All 5 Rows |
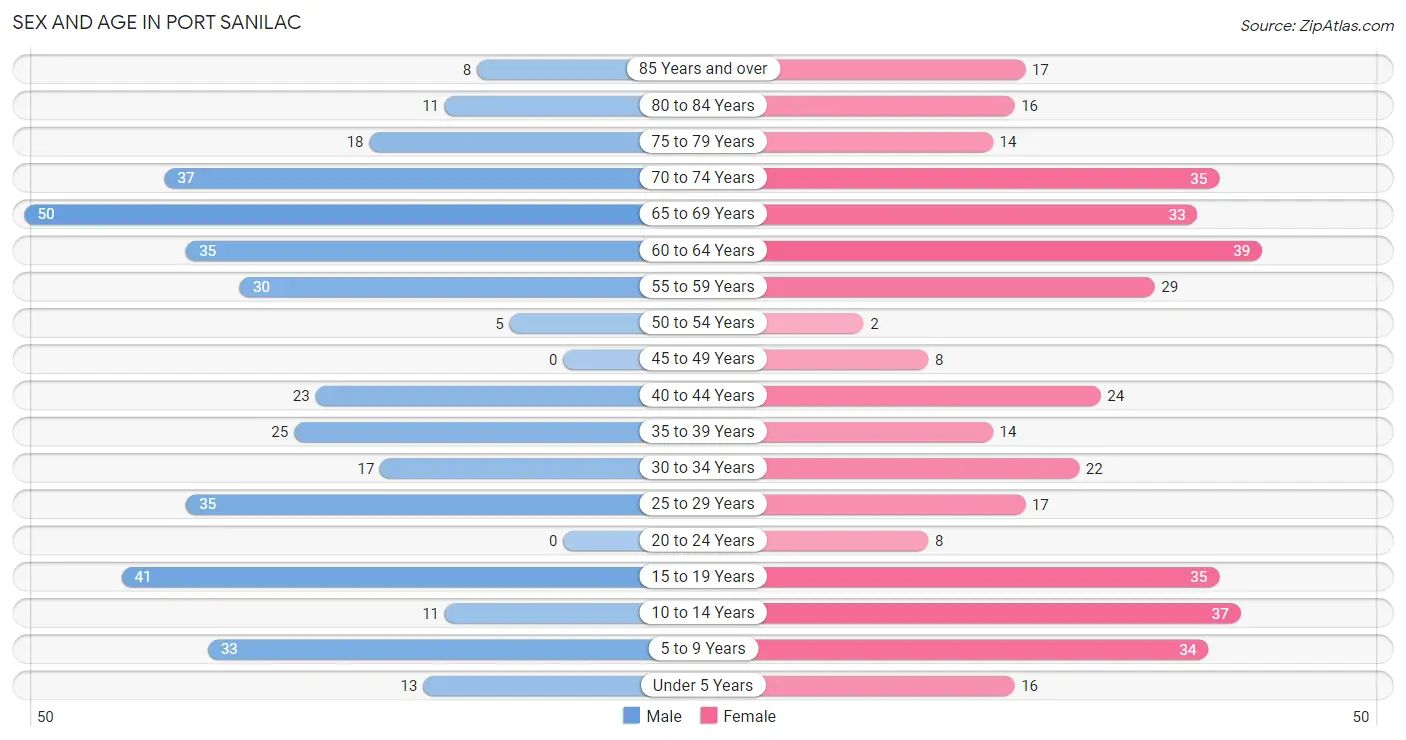
Sex and Age in Port Sanilac
Sex and Age in Port Sanilac
The most populous age groups in Port Sanilac are 65 to 69 Years (50 | 12.8%) for men and 60 to 64 Years (39 | 9.8%) for women.
| Age Bracket | Male | Female |
| Under 5 Years | 13 (3.3%) | 16 (4.0%) |
| 5 to 9 Years | 33 (8.4%) | 34 (8.5%) |
| 10 to 14 Years | 11 (2.8%) | 37 (9.2%) |
| 15 to 19 Years | 41 (10.5%) | 35 (8.7%) |
| 20 to 24 Years | 0 (0.0%) | 8 (2.0%) |
| 25 to 29 Years | 35 (8.9%) | 17 (4.3%) |
| 30 to 34 Years | 17 (4.3%) | 22 (5.5%) |
| 35 to 39 Years | 25 (6.4%) | 14 (3.5%) |
| 40 to 44 Years | 23 (5.9%) | 24 (6.0%) |
| 45 to 49 Years | 0 (0.0%) | 8 (2.0%) |
| 50 to 54 Years | 5 (1.3%) | 2 (0.5%) |
| 55 to 59 Years | 30 (7.6%) | 29 (7.2%) |
| 60 to 64 Years | 35 (8.9%) | 39 (9.8%) |
| 65 to 69 Years | 50 (12.8%) | 33 (8.3%) |
| 70 to 74 Years | 37 (9.4%) | 35 (8.7%) |
| 75 to 79 Years | 18 (4.6%) | 14 (3.5%) |
| 80 to 84 Years | 11 (2.8%) | 16 (4.0%) |
| 85 Years and over | 8 (2.0%) | 17 (4.3%) |
| Total | 392 (100.0%) | 400 (100.0%) |
Families and Households in Port Sanilac
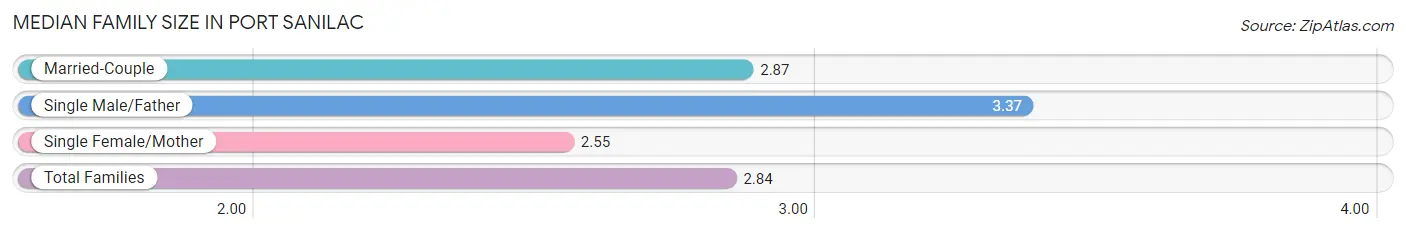
Median Family Size in Port Sanilac
The median family size in Port Sanilac is 2.84 persons per family, with single male/father families (19 | 9.3%) accounting for the largest median family size of 3.37 persons per family. On the other hand, single female/mother families (47 | 22.9%) represent the smallest median family size with 2.55 persons per family.
| Family Type | # Families | Family Size |
| Married-Couple | 139 (67.8%) | 2.87 |
| Single Male/Father | 19 (9.3%) | 3.37 |
| Single Female/Mother | 47 (22.9%) | 2.55 |
| Total Families | 205 (100.0%) | 2.84 |
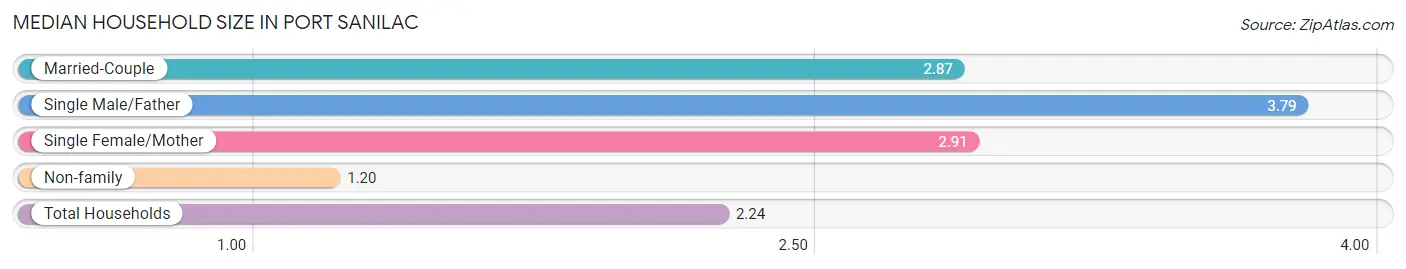
Median Household Size in Port Sanilac
The median household size in Port Sanilac is 2.24 persons per household, with single male/father households (19 | 5.5%) accounting for the largest median household size of 3.79 persons per household. non-family households (142 | 40.9%) represent the smallest median household size with 1.20 persons per household.
| Household Type | # Households | Household Size |
| Married-Couple | 139 (40.1%) | 2.87 |
| Single Male/Father | 19 (5.5%) | 3.79 |
| Single Female/Mother | 47 (13.5%) | 2.91 |
| Non-family | 142 (40.9%) | 1.20 |
| Total Households | 347 (100.0%) | 2.24 |
Household Size by Marriage Status in Port Sanilac
Out of a total of 347 households in Port Sanilac, 205 (59.1%) are family households, while 142 (40.9%) are nonfamily households. The most numerous type of family households are 2-person households, comprising 100, and the most common type of nonfamily households are 1-person households, comprising 125.
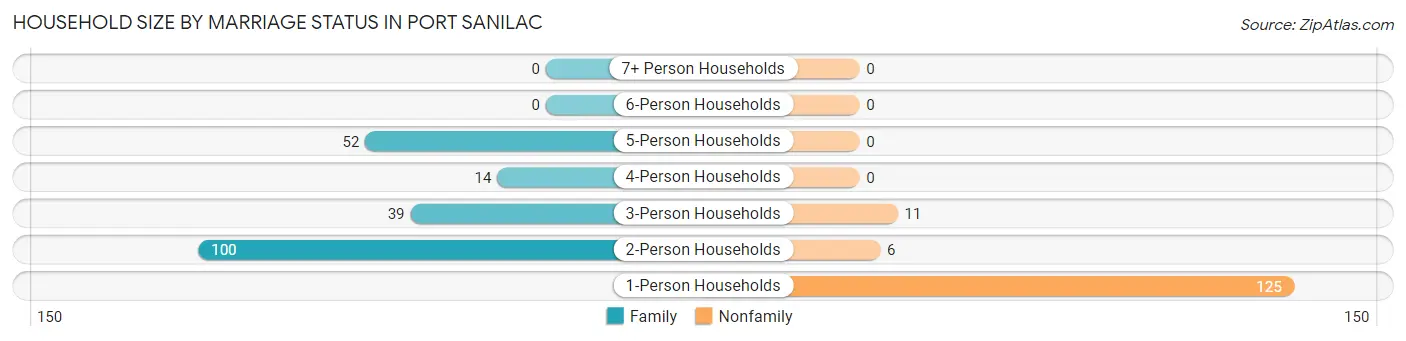
| Household Size | Family Households | Nonfamily Households |
| 1-Person Households | - | 125 (36.0%) |
| 2-Person Households | 100 (28.8%) | 6 (1.7%) |
| 3-Person Households | 39 (11.2%) | 11 (3.2%) |
| 4-Person Households | 14 (4.0%) | 0 (0.0%) |
| 5-Person Households | 52 (15.0%) | 0 (0.0%) |
| 6-Person Households | 0 (0.0%) | 0 (0.0%) |
| 7+ Person Households | 0 (0.0%) | 0 (0.0%) |
| Total | 205 (59.1%) | 142 (40.9%) |
Female Fertility in Port Sanilac
Fertility by Age in Port Sanilac
Average fertility rate in Port Sanilac is 62.0 births per 1,000 women. Women in the age bracket of 20 to 34 years have the highest fertility rate with 170.0 births per 1,000 women. Women in the age bracket of 20 to 34 years acount for 100.0% of all women with births.
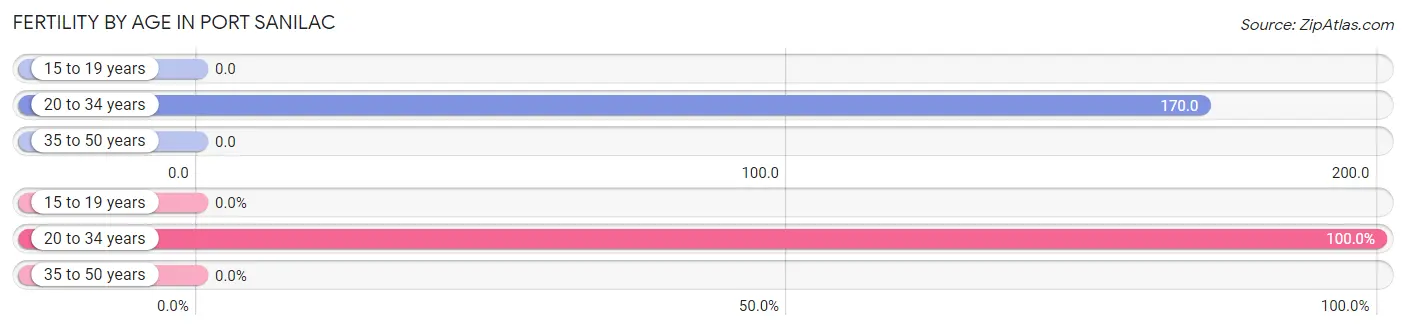
| Age Bracket | Women with Births | Births / 1,000 Women |
| 15 to 19 years | 0 (0.0%) | 0.0 |
| 20 to 34 years | 8 (100.0%) | 170.0 |
| 35 to 50 years | 0 (0.0%) | 0.0 |
| Total | 8 (100.0%) | 62.0 |
Fertility by Age by Marriage Status in Port Sanilac
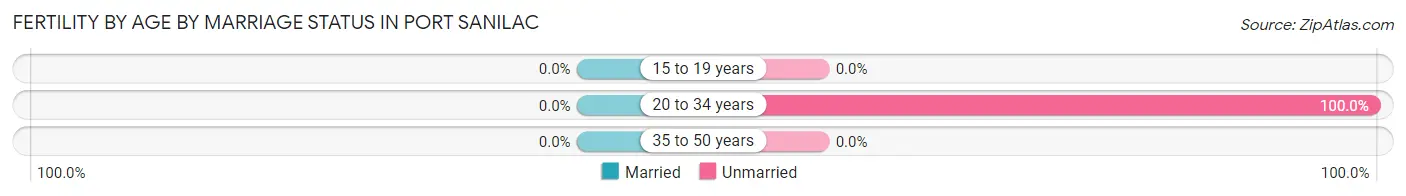
| Age Bracket | Married | Unmarried |
| 15 to 19 years | 0 (0.0%) | 0 (0.0%) |
| 20 to 34 years | 0 (0.0%) | 8 (100.0%) |
| 35 to 50 years | 0 (0.0%) | 0 (0.0%) |
| Total | 0 (0.0%) | 8 (100.0%) |
Fertility by Education in Port Sanilac
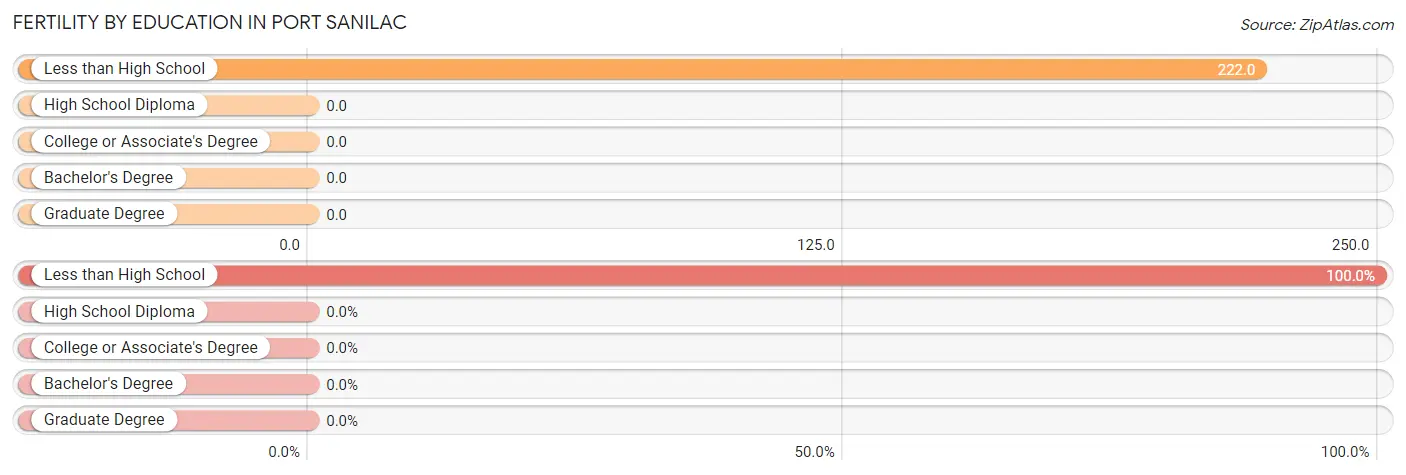
| Educational Attainment | Women with Births | Births / 1,000 Women |
| Less than High School | 8 (100.0%) | 222.0 |
| High School Diploma | 0 (0.0%) | 0.0 |
| College or Associate's Degree | 0 (0.0%) | 0.0 |
| Bachelor's Degree | 0 (0.0%) | 0.0 |
| Graduate Degree | 0 (0.0%) | 0.0 |
| Total | 8 (100.0%) | 62.0 |
Fertility by Education by Marriage Status in Port Sanilac
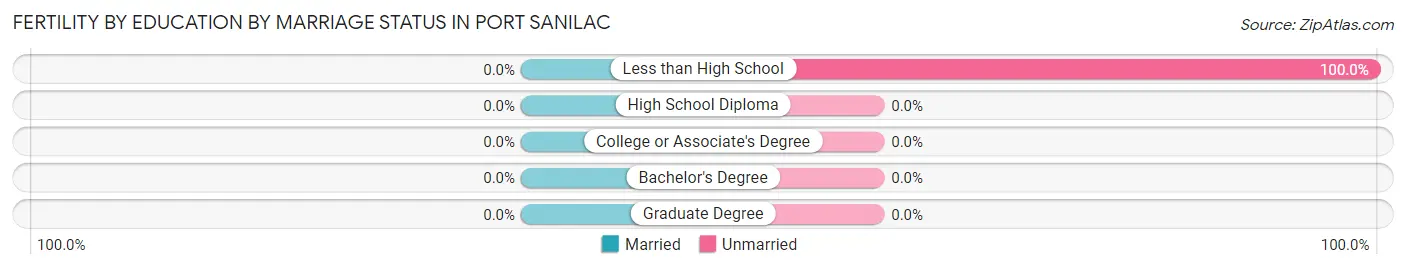
| Educational Attainment | Married | Unmarried |
| Less than High School | 0 (0.0%) | 8 (100.0%) |
| High School Diploma | 0 (0.0%) | 0 (0.0%) |
| College or Associate's Degree | 0 (0.0%) | 0 (0.0%) |
| Bachelor's Degree | 0 (0.0%) | 0 (0.0%) |
| Graduate Degree | 0 (0.0%) | 0 (0.0%) |
| Total | 0 (0.0%) | 8 (100.0%) |
Employment Characteristics in Port Sanilac
Employment by Class of Employer in Port Sanilac
Among the 289 employed individuals in Port Sanilac, private company employees (215 | 74.4%), not-for-profit organizations (21 | 7.3%), and self-employed (not incorporated) (19 | 6.6%) make up the most common classes of employment.
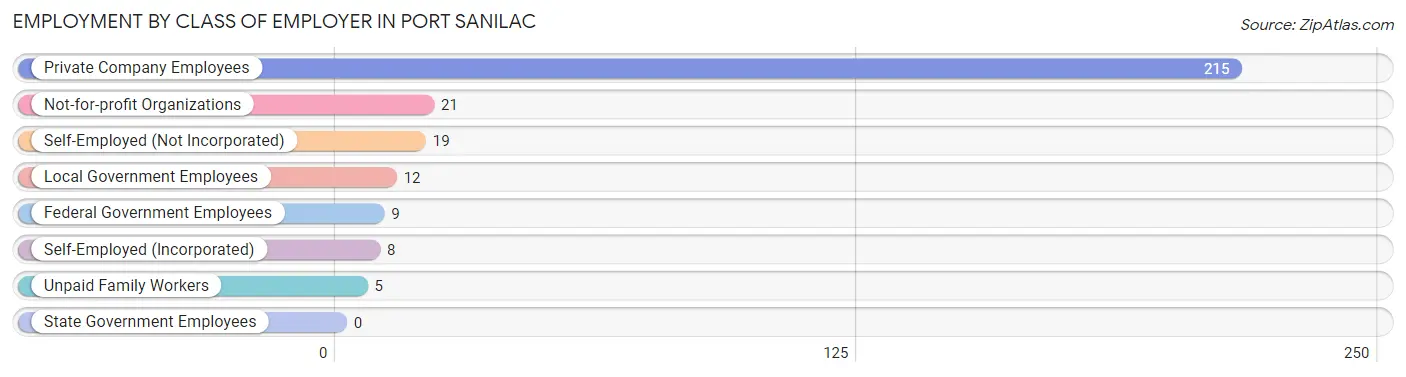
| Employer Class | # Employees | % Employees |
| Private Company Employees | 215 | 74.4% |
| Self-Employed (Incorporated) | 8 | 2.8% |
| Self-Employed (Not Incorporated) | 19 | 6.6% |
| Not-for-profit Organizations | 21 | 7.3% |
| Local Government Employees | 12 | 4.2% |
| State Government Employees | 0 | 0.0% |
| Federal Government Employees | 9 | 3.1% |
| Unpaid Family Workers | 5 | 1.7% |
| Total | 289 | 100.0% |
Employment Status by Age in Port Sanilac
According to the labor force statistics for Port Sanilac, out of the total population over 16 years of age (623), 48.8% or 304 individuals are in the labor force, with 3.3% or 10 of them unemployed. The age group with the highest labor force participation rate is 20 to 24 years, with 100.0% or 8 individuals in the labor force. Within the labor force, the 45 to 54 years age range has the highest percentage of unemployed individuals, with 23.1% or 3 of them being unemployed.
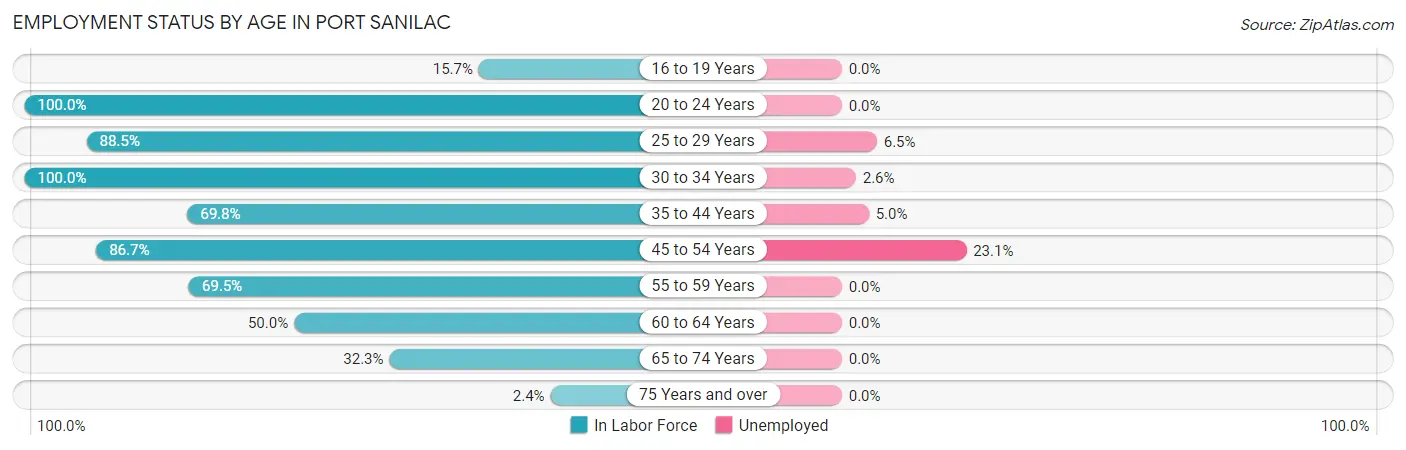
| Age Bracket | In Labor Force | Unemployed |
| 16 to 19 Years | 8 (15.7%) | 0 (0.0%) |
| 20 to 24 Years | 8 (100.0%) | 0 (0.0%) |
| 25 to 29 Years | 46 (88.5%) | 3 (6.5%) |
| 30 to 34 Years | 39 (100.0%) | 1 (2.6%) |
| 35 to 44 Years | 60 (69.8%) | 3 (5.0%) |
| 45 to 54 Years | 13 (86.7%) | 3 (23.1%) |
| 55 to 59 Years | 41 (69.5%) | 0 (0.0%) |
| 60 to 64 Years | 37 (50.0%) | 0 (0.0%) |
| 65 to 74 Years | 50 (32.3%) | 0 (0.0%) |
| 75 Years and over | 2 (2.4%) | 0 (0.0%) |
| Total | 304 (48.8%) | 10 (3.3%) |
Employment Status by Educational Attainment in Port Sanilac
According to labor force statistics for Port Sanilac, 72.6% of individuals (236) out of the total population between 25 and 64 years of age (325) are in the labor force, with 4.2% or 10 of them being unemployed. The group with the highest labor force participation rate are those with the educational attainment of high school diploma, with 80.7% or 88 individuals in the labor force. Within the labor force, individuals with bachelor's degree or higher education have the highest percentage of unemployment, with 10.3% or 3 of them being unemployed.
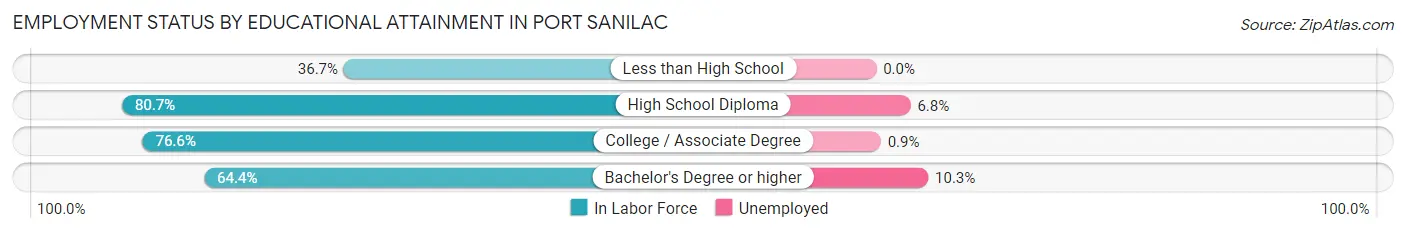
| Educational Attainment | In Labor Force | Unemployed |
| Less than High School | 11 (36.7%) | 0 (0.0%) |
| High School Diploma | 88 (80.7%) | 7 (6.8%) |
| College / Associate Degree | 108 (76.6%) | 1 (0.9%) |
| Bachelor's Degree or higher | 29 (64.4%) | 5 (10.3%) |
| Total | 236 (72.6%) | 14 (4.2%) |
Employment Occupations by Sex in Port Sanilac
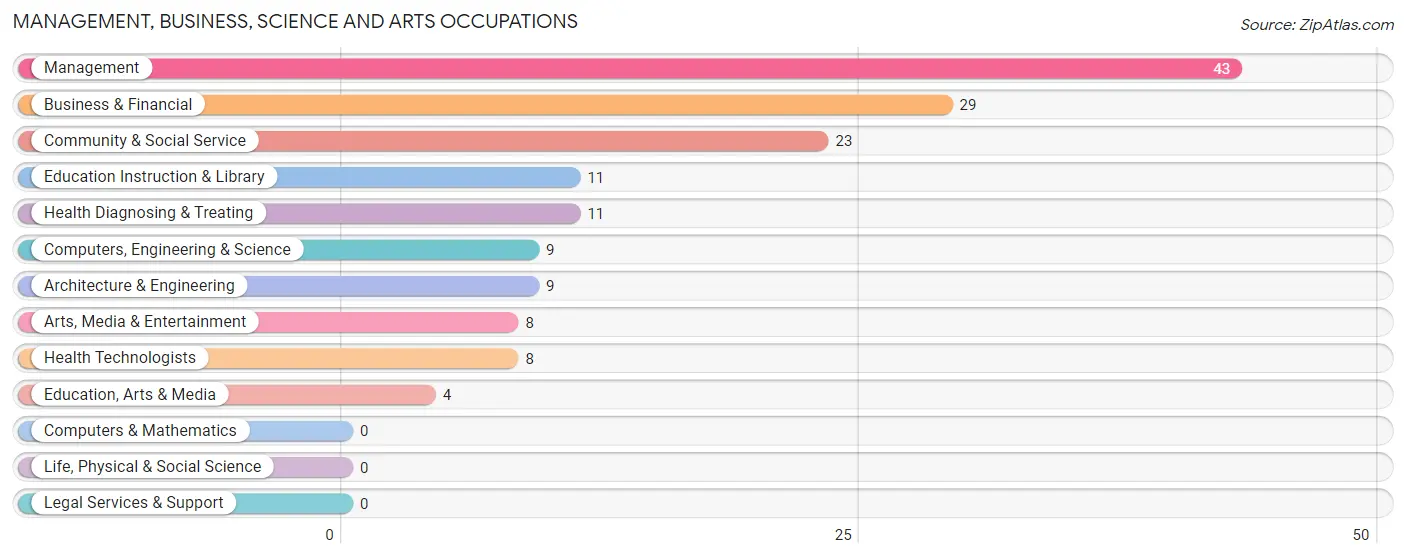
Management, Business, Science and Arts Occupations
The most common Management, Business, Science and Arts occupations in Port Sanilac are Management (43 | 14.6%), Business & Financial (29 | 9.9%), Community & Social Service (23 | 7.8%), Education Instruction & Library (11 | 3.7%), and Health Diagnosing & Treating (11 | 3.7%).
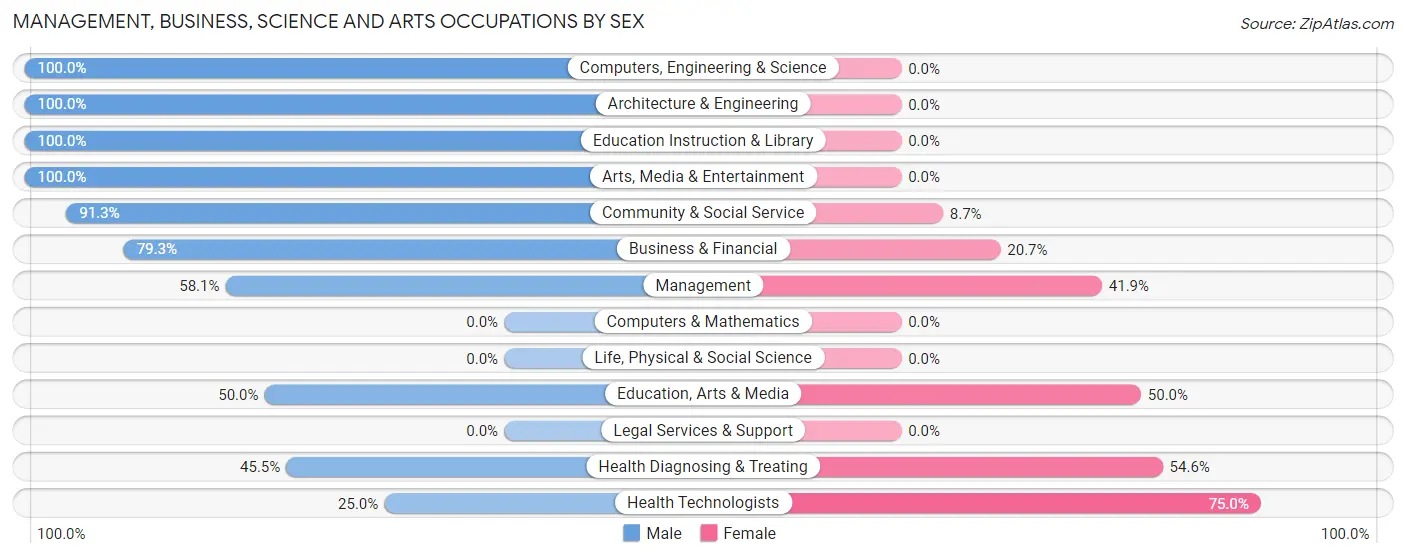
Management, Business, Science and Arts Occupations by Sex
Within the Management, Business, Science and Arts occupations in Port Sanilac, the most male-oriented occupations are Computers, Engineering & Science (100.0%), Architecture & Engineering (100.0%), and Education Instruction & Library (100.0%), while the most female-oriented occupations are Health Technologists (75.0%), Health Diagnosing & Treating (54.5%), and Education, Arts & Media (50.0%).
| Occupation | Male | Female |
| Management | 25 (58.1%) | 18 (41.9%) |
| Business & Financial | 23 (79.3%) | 6 (20.7%) |
| Computers, Engineering & Science | 9 (100.0%) | 0 (0.0%) |
| Computers & Mathematics | 0 (0.0%) | 0 (0.0%) |
| Architecture & Engineering | 9 (100.0%) | 0 (0.0%) |
| Life, Physical & Social Science | 0 (0.0%) | 0 (0.0%) |
| Community & Social Service | 21 (91.3%) | 2 (8.7%) |
| Education, Arts & Media | 2 (50.0%) | 2 (50.0%) |
| Legal Services & Support | 0 (0.0%) | 0 (0.0%) |
| Education Instruction & Library | 11 (100.0%) | 0 (0.0%) |
| Arts, Media & Entertainment | 8 (100.0%) | 0 (0.0%) |
| Health Diagnosing & Treating | 5 (45.5%) | 6 (54.5%) |
| Health Technologists | 2 (25.0%) | 6 (75.0%) |
| Total (Category) | 83 (72.2%) | 32 (27.8%) |
| Total (Overall) | 171 (58.2%) | 123 (41.8%) |
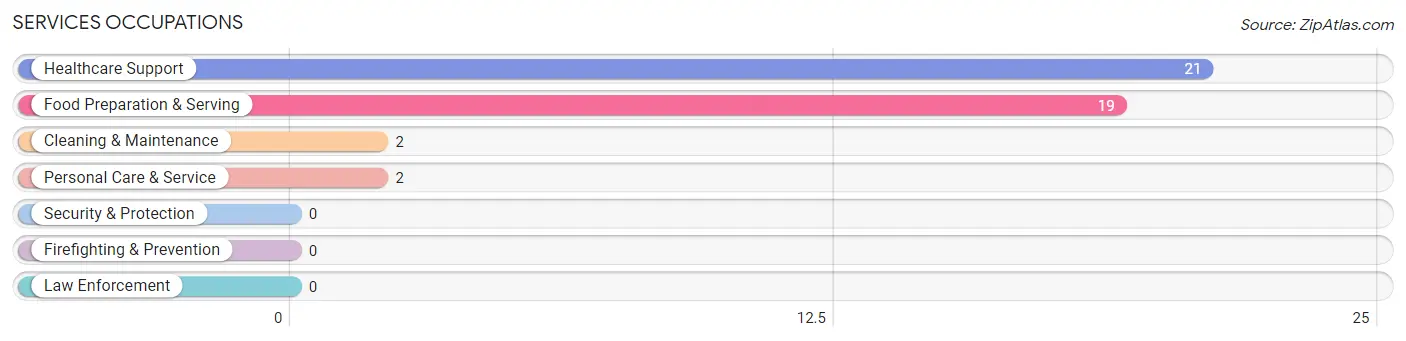
Services Occupations
The most common Services occupations in Port Sanilac are Healthcare Support (21 | 7.1%), Food Preparation & Serving (19 | 6.5%), Cleaning & Maintenance (2 | 0.7%), and Personal Care & Service (2 | 0.7%).
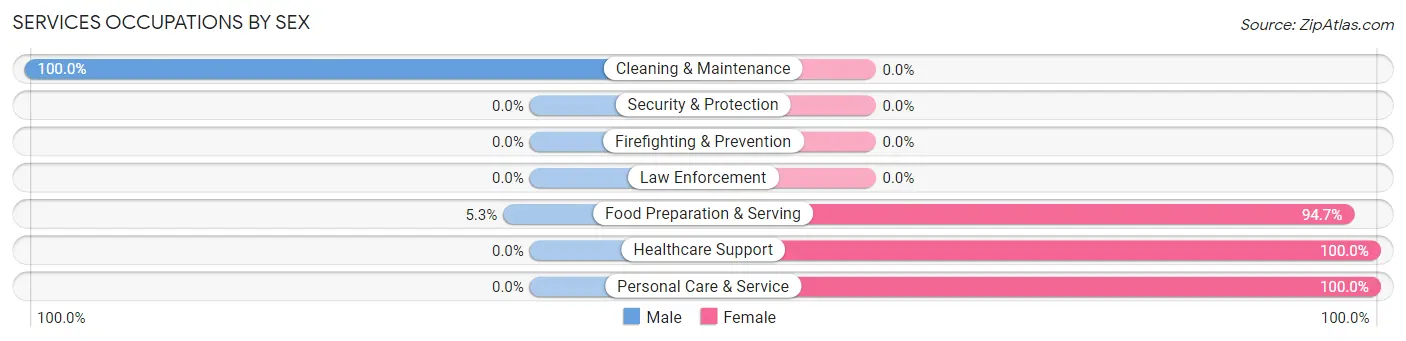
Services Occupations by Sex
Within the Services occupations in Port Sanilac, the most male-oriented occupations are Cleaning & Maintenance (100.0%), and Food Preparation & Serving (5.3%), while the most female-oriented occupations are Healthcare Support (100.0%), Personal Care & Service (100.0%), and Food Preparation & Serving (94.7%).
| Occupation | Male | Female |
| Healthcare Support | 0 (0.0%) | 21 (100.0%) |
| Security & Protection | 0 (0.0%) | 0 (0.0%) |
| Firefighting & Prevention | 0 (0.0%) | 0 (0.0%) |
| Law Enforcement | 0 (0.0%) | 0 (0.0%) |
| Food Preparation & Serving | 1 (5.3%) | 18 (94.7%) |
| Cleaning & Maintenance | 2 (100.0%) | 0 (0.0%) |
| Personal Care & Service | 0 (0.0%) | 2 (100.0%) |
| Total (Category) | 3 (6.8%) | 41 (93.2%) |
| Total (Overall) | 171 (58.2%) | 123 (41.8%) |
Sales and Office Occupations
The most common Sales and Office occupations in Port Sanilac are Sales & Related (32 | 10.9%), and Office & Administration (16 | 5.4%).
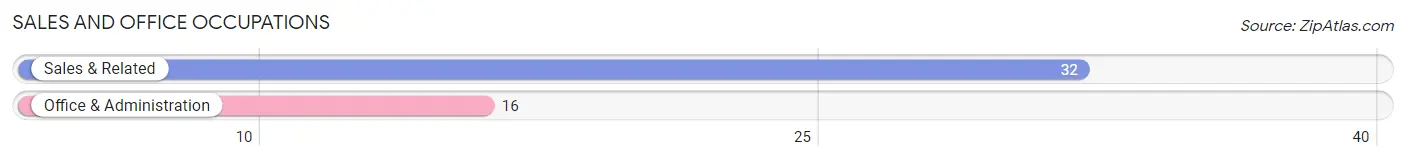
Sales and Office Occupations by Sex
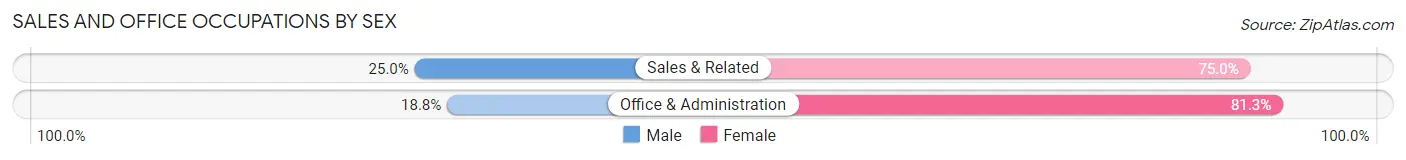
| Occupation | Male | Female |
| Sales & Related | 8 (25.0%) | 24 (75.0%) |
| Office & Administration | 3 (18.8%) | 13 (81.2%) |
| Total (Category) | 11 (22.9%) | 37 (77.1%) |
| Total (Overall) | 171 (58.2%) | 123 (41.8%) |
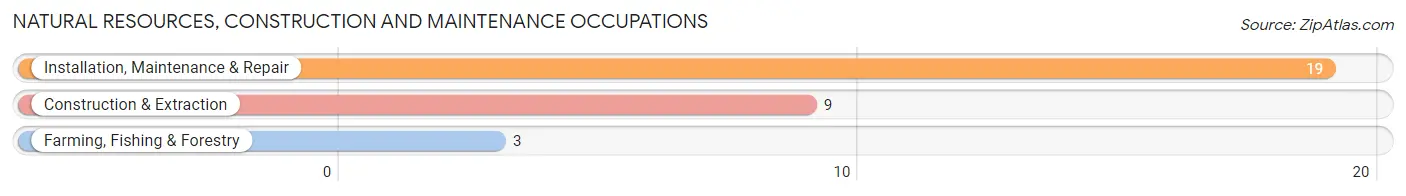
Natural Resources, Construction and Maintenance Occupations
The most common Natural Resources, Construction and Maintenance occupations in Port Sanilac are Installation, Maintenance & Repair (19 | 6.5%), Construction & Extraction (9 | 3.1%), and Farming, Fishing & Forestry (3 | 1.0%).
Natural Resources, Construction and Maintenance Occupations by Sex
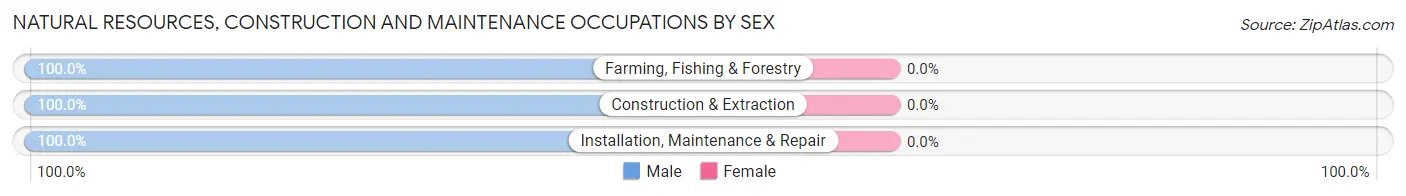
| Occupation | Male | Female |
| Farming, Fishing & Forestry | 3 (100.0%) | 0 (0.0%) |
| Construction & Extraction | 9 (100.0%) | 0 (0.0%) |
| Installation, Maintenance & Repair | 19 (100.0%) | 0 (0.0%) |
| Total (Category) | 31 (100.0%) | 0 (0.0%) |
| Total (Overall) | 171 (58.2%) | 123 (41.8%) |
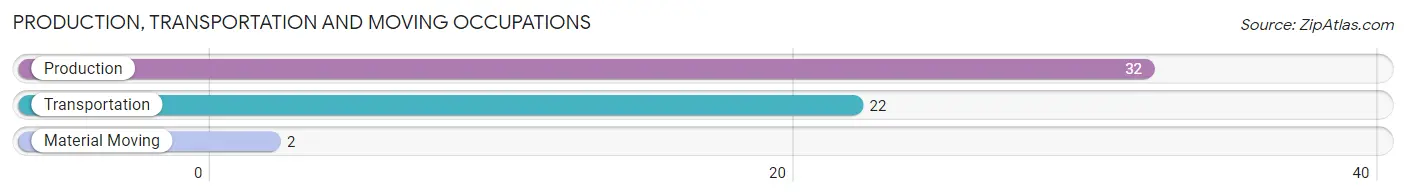
Production, Transportation and Moving Occupations
The most common Production, Transportation and Moving occupations in Port Sanilac are Production (32 | 10.9%), Transportation (22 | 7.5%), and Material Moving (2 | 0.7%).
Production, Transportation and Moving Occupations by Sex
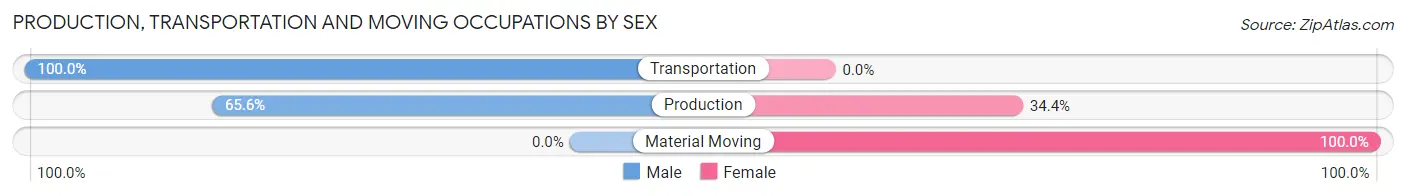
| Occupation | Male | Female |
| Production | 21 (65.6%) | 11 (34.4%) |
| Transportation | 22 (100.0%) | 0 (0.0%) |
| Material Moving | 0 (0.0%) | 2 (100.0%) |
| Total (Category) | 43 (76.8%) | 13 (23.2%) |
| Total (Overall) | 171 (58.2%) | 123 (41.8%) |
Employment Industries by Sex in Port Sanilac
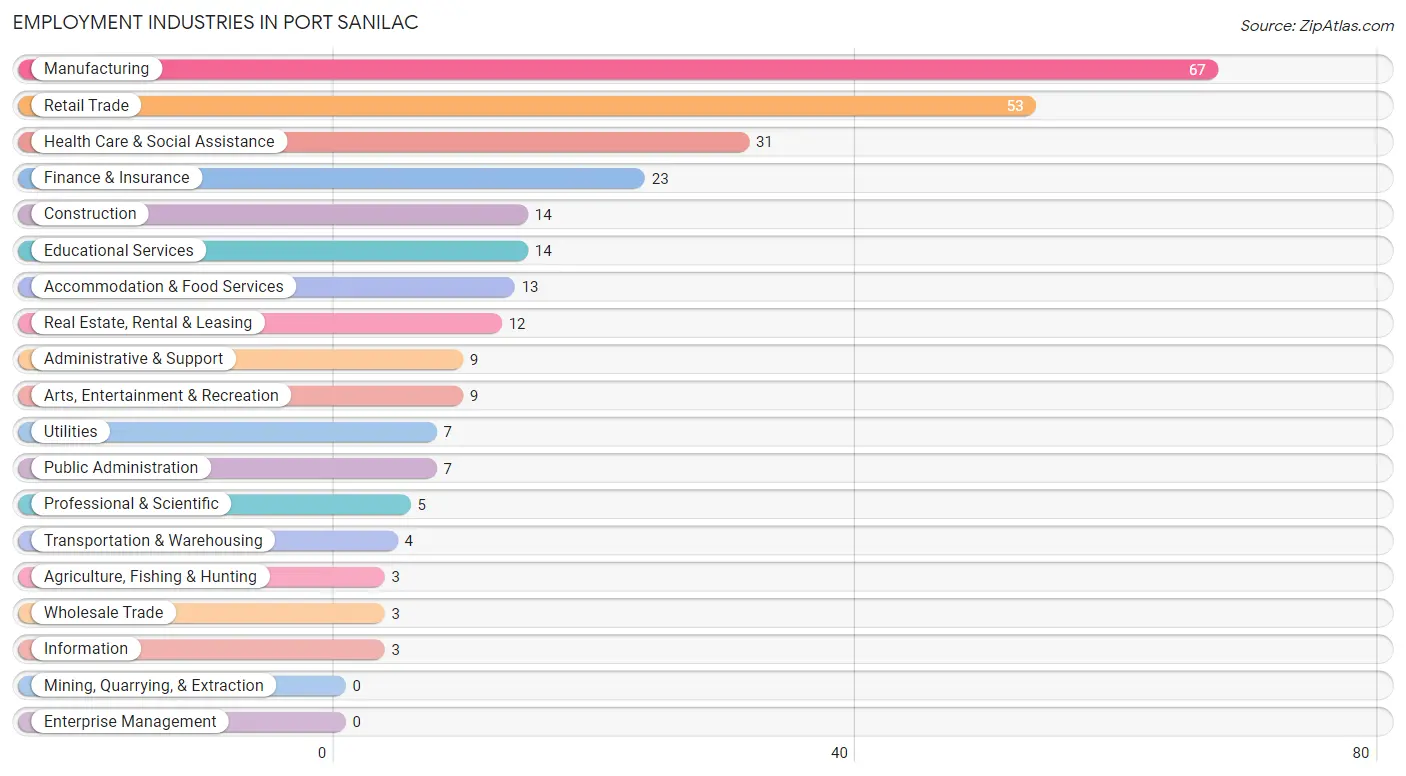
Employment Industries in Port Sanilac
The major employment industries in Port Sanilac include Manufacturing (67 | 22.8%), Retail Trade (53 | 18.0%), Health Care & Social Assistance (31 | 10.5%), Finance & Insurance (23 | 7.8%), and Construction (14 | 4.8%).
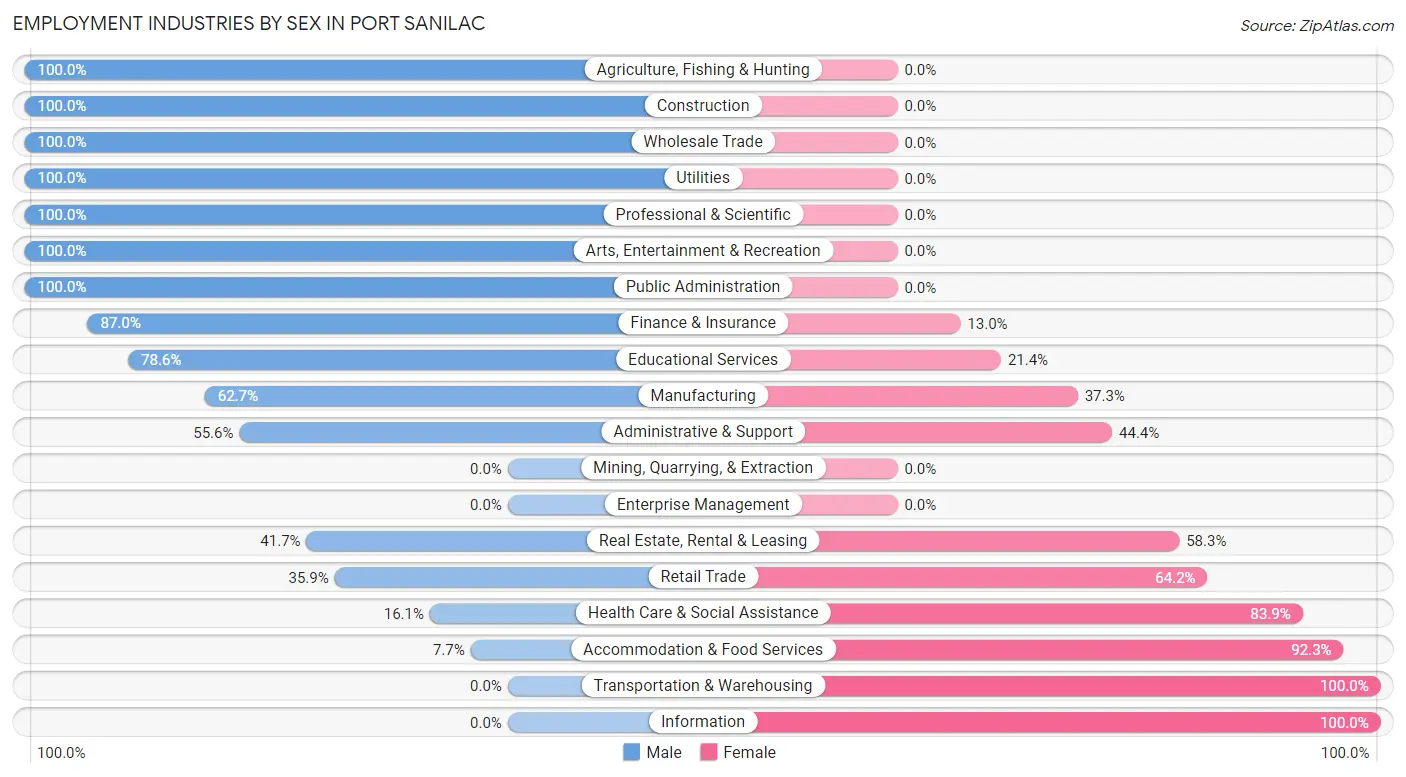
Employment Industries by Sex in Port Sanilac
The Port Sanilac industries that see more men than women are Agriculture, Fishing & Hunting (100.0%), Construction (100.0%), and Wholesale Trade (100.0%), whereas the industries that tend to have a higher number of women are Transportation & Warehousing (100.0%), Information (100.0%), and Accommodation & Food Services (92.3%).
| Industry | Male | Female |
| Agriculture, Fishing & Hunting | 3 (100.0%) | 0 (0.0%) |
| Mining, Quarrying, & Extraction | 0 (0.0%) | 0 (0.0%) |
| Construction | 14 (100.0%) | 0 (0.0%) |
| Manufacturing | 42 (62.7%) | 25 (37.3%) |
| Wholesale Trade | 3 (100.0%) | 0 (0.0%) |
| Retail Trade | 19 (35.8%) | 34 (64.1%) |
| Transportation & Warehousing | 0 (0.0%) | 4 (100.0%) |
| Utilities | 7 (100.0%) | 0 (0.0%) |
| Information | 0 (0.0%) | 3 (100.0%) |
| Finance & Insurance | 20 (87.0%) | 3 (13.0%) |
| Real Estate, Rental & Leasing | 5 (41.7%) | 7 (58.3%) |
| Professional & Scientific | 5 (100.0%) | 0 (0.0%) |
| Enterprise Management | 0 (0.0%) | 0 (0.0%) |
| Administrative & Support | 5 (55.6%) | 4 (44.4%) |
| Educational Services | 11 (78.6%) | 3 (21.4%) |
| Health Care & Social Assistance | 5 (16.1%) | 26 (83.9%) |
| Arts, Entertainment & Recreation | 9 (100.0%) | 0 (0.0%) |
| Accommodation & Food Services | 1 (7.7%) | 12 (92.3%) |
| Public Administration | 7 (100.0%) | 0 (0.0%) |
| Total | 171 (58.2%) | 123 (41.8%) |
Education in Port Sanilac
School Enrollment in Port Sanilac
The most common levels of schooling among the 194 students in Port Sanilac are high school (82 | 42.3%), elementary school (63 | 32.5%), and middle school (35 | 18.0%).
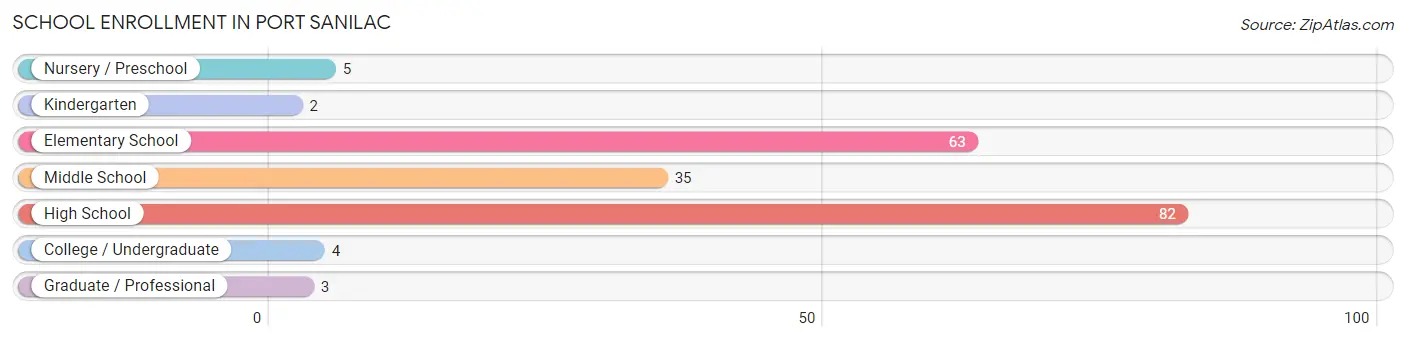
| School Level | # Students | % Students |
| Nursery / Preschool | 5 | 2.6% |
| Kindergarten | 2 | 1.0% |
| Elementary School | 63 | 32.5% |
| Middle School | 35 | 18.0% |
| High School | 82 | 42.3% |
| College / Undergraduate | 4 | 2.1% |
| Graduate / Professional | 3 | 1.5% |
| Total | 194 | 100.0% |
School Enrollment by Age by Funding Source in Port Sanilac
Out of a total of 194 students who are enrolled in schools in Port Sanilac, 3 (1.5%) attend a private institution, while the remaining 191 (98.5%) are enrolled in public schools. The age group of 35 years and over has the highest likelihood of being enrolled in private schools, with 3 (75.0% in the age bracket) enrolled. Conversely, the age group of 5 to 9 year old has the lowest likelihood of being enrolled in a private school, with 67 (100.0% in the age bracket) attending a public institution.
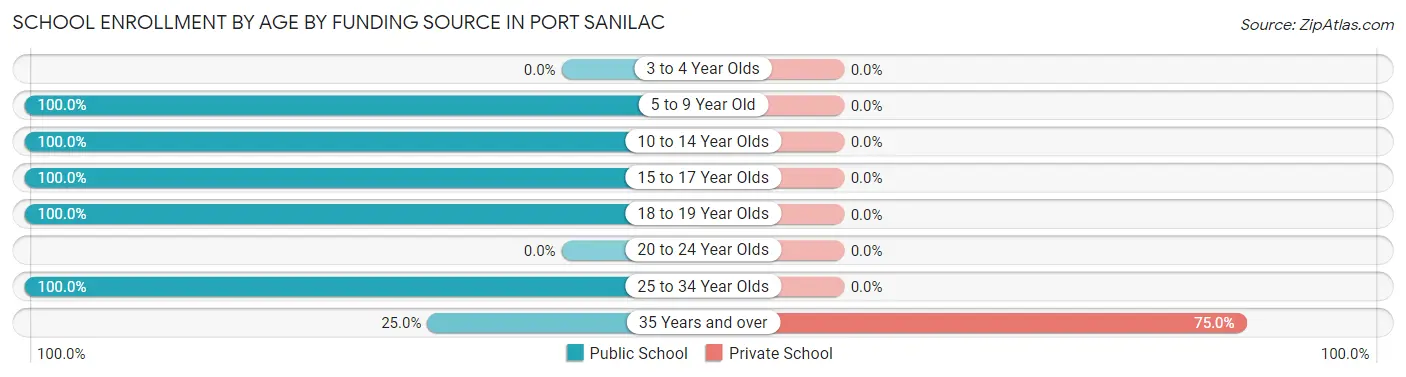
| Age Bracket | Public School | Private School |
| 3 to 4 Year Olds | 0 (0.0%) | 0 (0.0%) |
| 5 to 9 Year Old | 67 (100.0%) | 0 (0.0%) |
| 10 to 14 Year Olds | 48 (100.0%) | 0 (0.0%) |
| 15 to 17 Year Olds | 71 (100.0%) | 0 (0.0%) |
| 18 to 19 Year Olds | 3 (100.0%) | 0 (0.0%) |
| 20 to 24 Year Olds | 0 (0.0%) | 0 (0.0%) |
| 25 to 34 Year Olds | 1 (100.0%) | 0 (0.0%) |
| 35 Years and over | 1 (25.0%) | 3 (75.0%) |
| Total | 191 (98.5%) | 3 (1.5%) |
Educational Attainment by Field of Study in Port Sanilac
Business (45 | 34.9%), education (25 | 19.4%), communications (20 | 15.5%), social sciences (15 | 11.6%), and arts & humanities (8 | 6.2%) are the most common fields of study among 129 individuals in Port Sanilac who have obtained a bachelor's degree or higher.
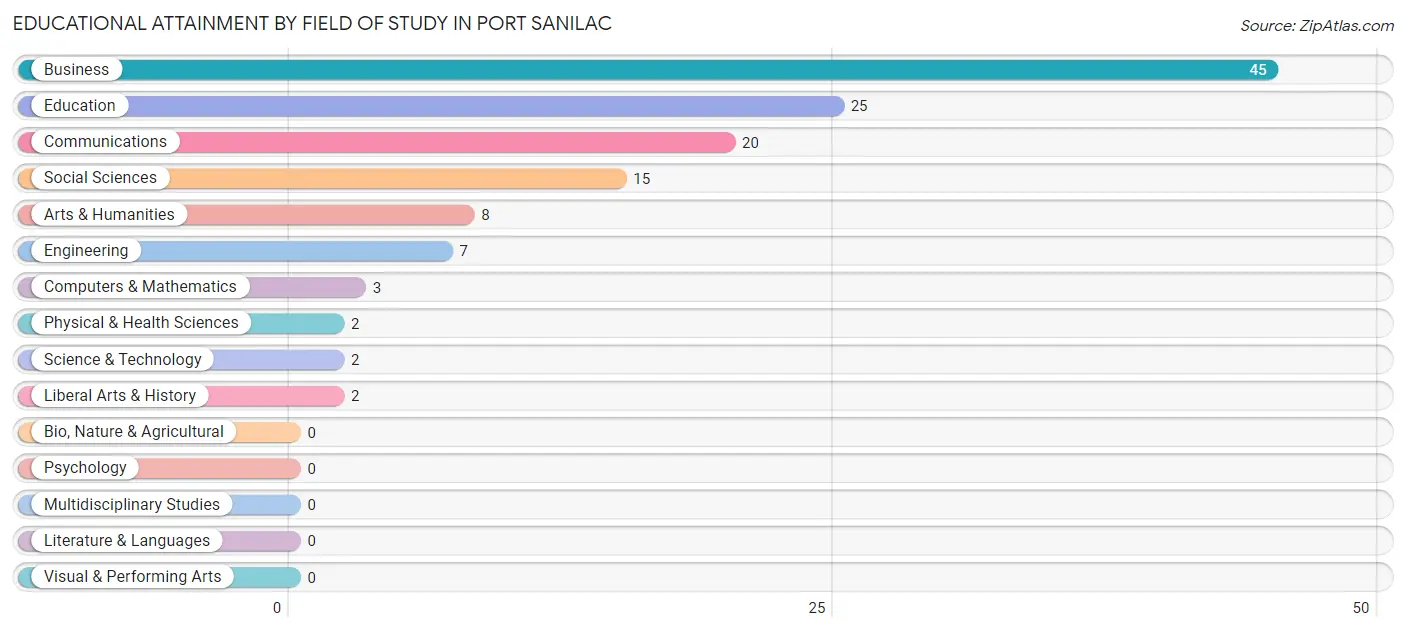
| Field of Study | # Graduates | % Graduates |
| Computers & Mathematics | 3 | 2.3% |
| Bio, Nature & Agricultural | 0 | 0.0% |
| Physical & Health Sciences | 2 | 1.5% |
| Psychology | 0 | 0.0% |
| Social Sciences | 15 | 11.6% |
| Engineering | 7 | 5.4% |
| Multidisciplinary Studies | 0 | 0.0% |
| Science & Technology | 2 | 1.5% |
| Business | 45 | 34.9% |
| Education | 25 | 19.4% |
| Literature & Languages | 0 | 0.0% |
| Liberal Arts & History | 2 | 1.5% |
| Visual & Performing Arts | 0 | 0.0% |
| Communications | 20 | 15.5% |
| Arts & Humanities | 8 | 6.2% |
| Total | 129 | 100.0% |
Transportation & Commute in Port Sanilac
Vehicle Availability by Sex in Port Sanilac
The most prevalent vehicle ownership categories in Port Sanilac are males with 1 vehicle (66, accounting for 39.1%) and females with 1 vehicle (22, making up 55.0%).
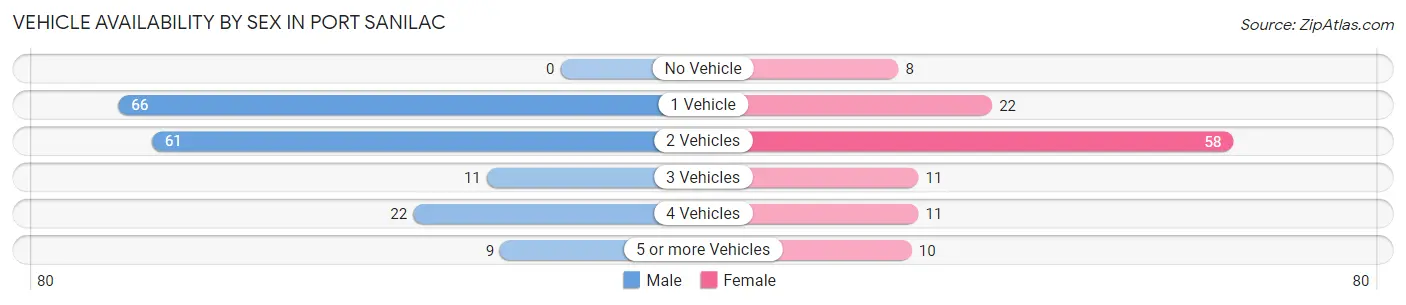
| Vehicles Available | Male | Female |
| No Vehicle | 0 (0.0%) | 8 (6.7%) |
| 1 Vehicle | 66 (39.1%) | 22 (18.3%) |
| 2 Vehicles | 61 (36.1%) | 58 (48.3%) |
| 3 Vehicles | 11 (6.5%) | 11 (9.2%) |
| 4 Vehicles | 22 (13.0%) | 11 (9.2%) |
| 5 or more Vehicles | 9 (5.3%) | 10 (8.3%) |
| Total | 169 (100.0%) | 120 (100.0%) |
Commute Time in Port Sanilac
The most frequently occuring commute durations in Port Sanilac are 45 to 59 minutes (53 commuters, 19.2%), 5 to 9 minutes (39 commuters, 14.1%), and 90 or more minutes (37 commuters, 13.4%).
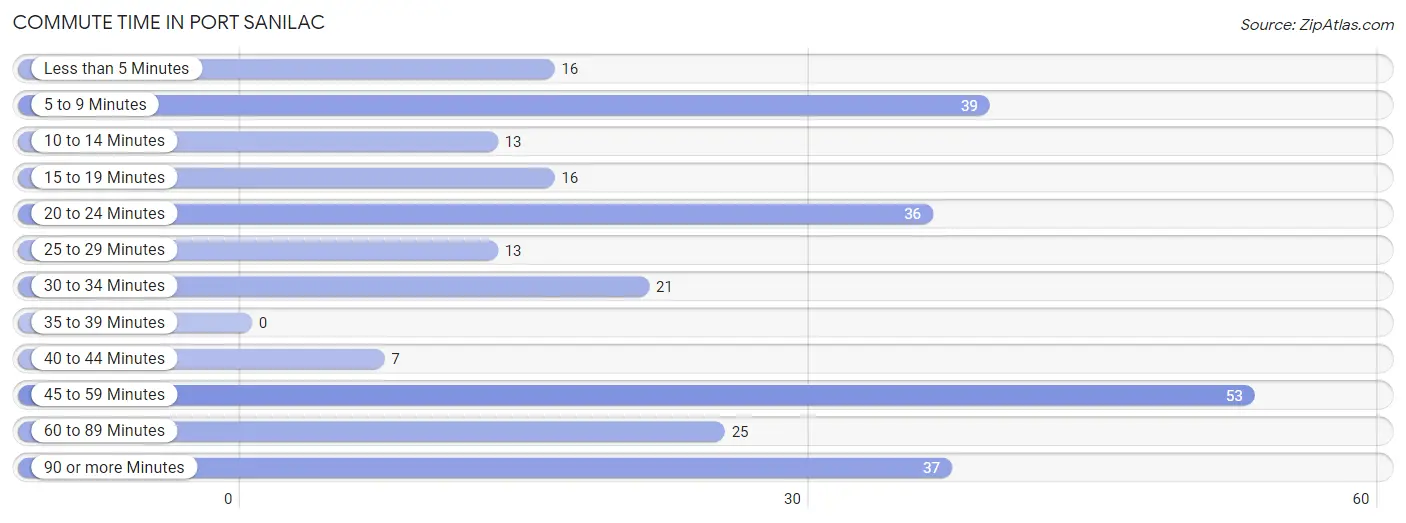
| Commute Time | # Commuters | % Commuters |
| Less than 5 Minutes | 16 | 5.8% |
| 5 to 9 Minutes | 39 | 14.1% |
| 10 to 14 Minutes | 13 | 4.7% |
| 15 to 19 Minutes | 16 | 5.8% |
| 20 to 24 Minutes | 36 | 13.0% |
| 25 to 29 Minutes | 13 | 4.7% |
| 30 to 34 Minutes | 21 | 7.6% |
| 35 to 39 Minutes | 0 | 0.0% |
| 40 to 44 Minutes | 7 | 2.5% |
| 45 to 59 Minutes | 53 | 19.2% |
| 60 to 89 Minutes | 25 | 9.1% |
| 90 or more Minutes | 37 | 13.4% |
Commute Time by Sex in Port Sanilac
The most common commute times in Port Sanilac are 90 or more minutes (37 commuters, 22.7%) for males and 45 to 59 minutes (23 commuters, 20.3%) for females.
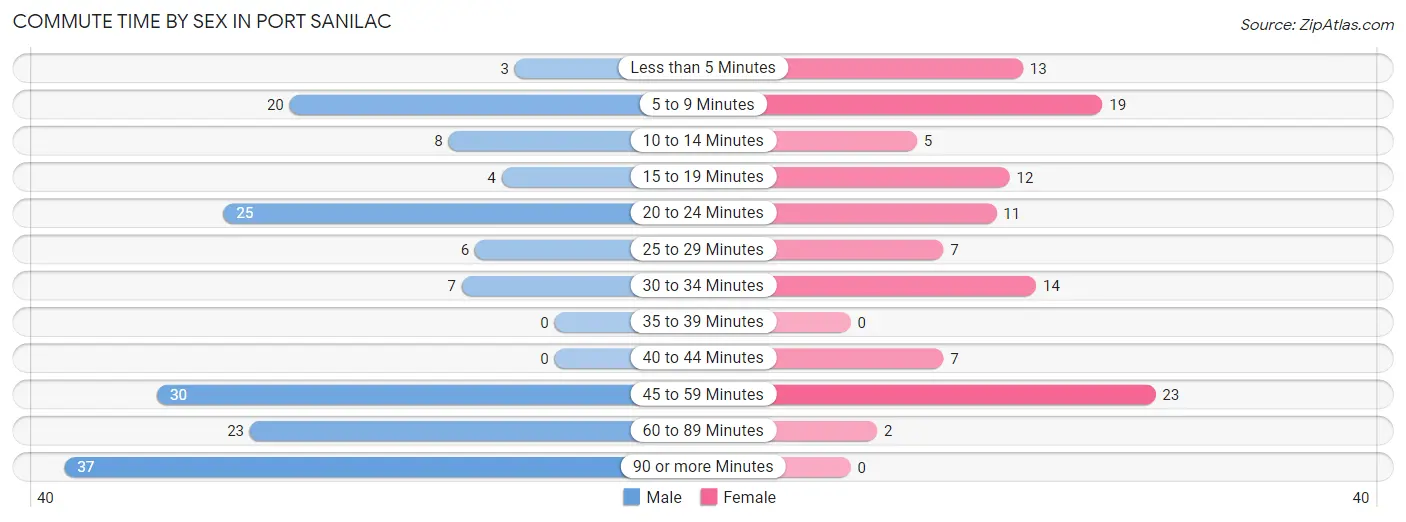
| Commute Time | Male | Female |
| Less than 5 Minutes | 3 (1.8%) | 13 (11.5%) |
| 5 to 9 Minutes | 20 (12.3%) | 19 (16.8%) |
| 10 to 14 Minutes | 8 (4.9%) | 5 (4.4%) |
| 15 to 19 Minutes | 4 (2.5%) | 12 (10.6%) |
| 20 to 24 Minutes | 25 (15.3%) | 11 (9.7%) |
| 25 to 29 Minutes | 6 (3.7%) | 7 (6.2%) |
| 30 to 34 Minutes | 7 (4.3%) | 14 (12.4%) |
| 35 to 39 Minutes | 0 (0.0%) | 0 (0.0%) |
| 40 to 44 Minutes | 0 (0.0%) | 7 (6.2%) |
| 45 to 59 Minutes | 30 (18.4%) | 23 (20.3%) |
| 60 to 89 Minutes | 23 (14.1%) | 2 (1.8%) |
| 90 or more Minutes | 37 (22.7%) | 0 (0.0%) |
Time of Departure to Work by Sex in Port Sanilac
The most frequent times of departure to work in Port Sanilac are 7:00 AM to 7:29 AM (37, 22.7%) for males and 7:00 AM to 7:29 AM (23, 20.3%) for females.
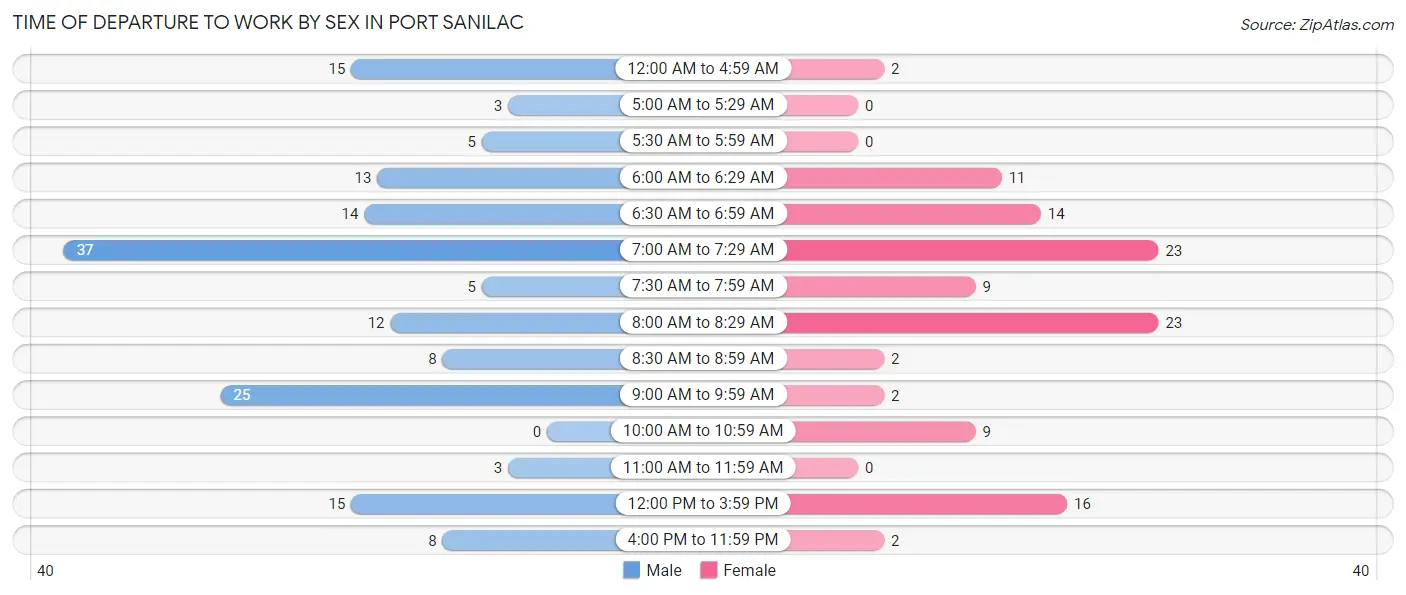
| Time of Departure | Male | Female |
| 12:00 AM to 4:59 AM | 15 (9.2%) | 2 (1.8%) |
| 5:00 AM to 5:29 AM | 3 (1.8%) | 0 (0.0%) |
| 5:30 AM to 5:59 AM | 5 (3.1%) | 0 (0.0%) |
| 6:00 AM to 6:29 AM | 13 (8.0%) | 11 (9.7%) |
| 6:30 AM to 6:59 AM | 14 (8.6%) | 14 (12.4%) |
| 7:00 AM to 7:29 AM | 37 (22.7%) | 23 (20.3%) |
| 7:30 AM to 7:59 AM | 5 (3.1%) | 9 (8.0%) |
| 8:00 AM to 8:29 AM | 12 (7.4%) | 23 (20.3%) |
| 8:30 AM to 8:59 AM | 8 (4.9%) | 2 (1.8%) |
| 9:00 AM to 9:59 AM | 25 (15.3%) | 2 (1.8%) |
| 10:00 AM to 10:59 AM | 0 (0.0%) | 9 (8.0%) |
| 11:00 AM to 11:59 AM | 3 (1.8%) | 0 (0.0%) |
| 12:00 PM to 3:59 PM | 15 (9.2%) | 16 (14.2%) |
| 4:00 PM to 11:59 PM | 8 (4.9%) | 2 (1.8%) |
| Total | 163 (100.0%) | 113 (100.0%) |
Housing Occupancy in Port Sanilac
Occupancy by Ownership in Port Sanilac
Of the total 347 dwellings in Port Sanilac, owner-occupied units account for 287 (82.7%), while renter-occupied units make up 60 (17.3%).
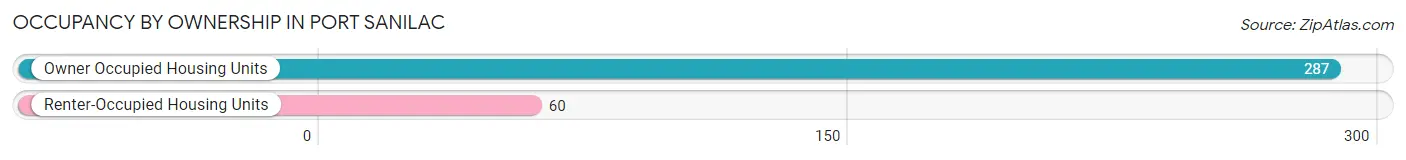
| Occupancy | # Housing Units | % Housing Units |
| Owner Occupied Housing Units | 287 | 82.7% |
| Renter-Occupied Housing Units | 60 | 17.3% |
| Total Occupied Housing Units | 347 | 100.0% |
Occupancy by Household Size in Port Sanilac
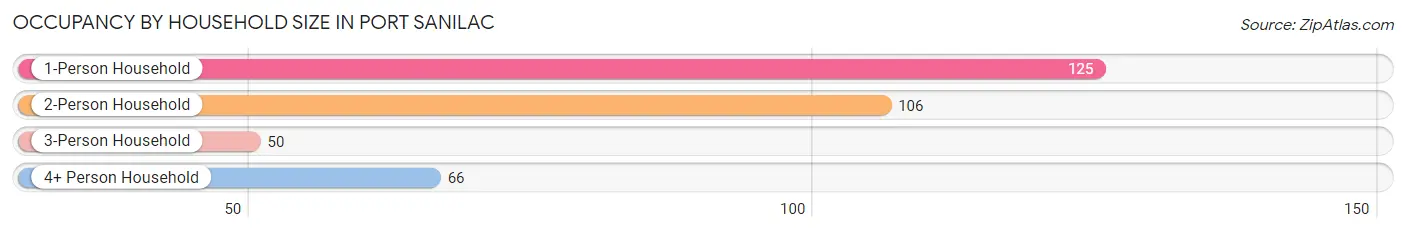
| Household Size | # Housing Units | % Housing Units |
| 1-Person Household | 125 | 36.0% |
| 2-Person Household | 106 | 30.5% |
| 3-Person Household | 50 | 14.4% |
| 4+ Person Household | 66 | 19.0% |
| Total Housing Units | 347 | 100.0% |
Occupancy by Ownership by Household Size in Port Sanilac
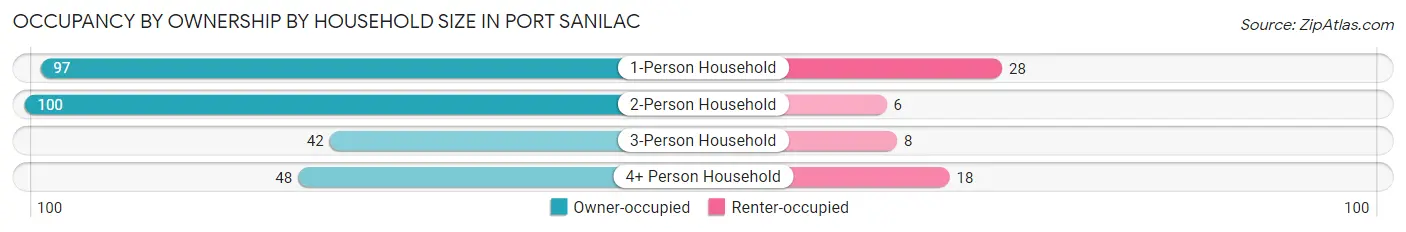
| Household Size | Owner-occupied | Renter-occupied |
| 1-Person Household | 97 (77.6%) | 28 (22.4%) |
| 2-Person Household | 100 (94.3%) | 6 (5.7%) |
| 3-Person Household | 42 (84.0%) | 8 (16.0%) |
| 4+ Person Household | 48 (72.7%) | 18 (27.3%) |
| Total Housing Units | 287 (82.7%) | 60 (17.3%) |
Occupancy by Educational Attainment in Port Sanilac
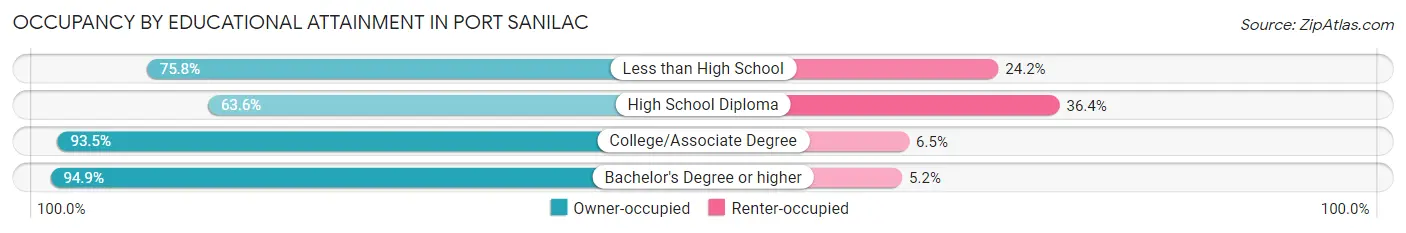
| Household Size | Owner-occupied | Renter-occupied |
| Less than High School | 25 (75.8%) | 8 (24.2%) |
| High School Diploma | 70 (63.6%) | 40 (36.4%) |
| College/Associate Degree | 100 (93.5%) | 7 (6.5%) |
| Bachelor's Degree or higher | 92 (94.9%) | 5 (5.1%) |
Occupancy by Age of Householder in Port Sanilac
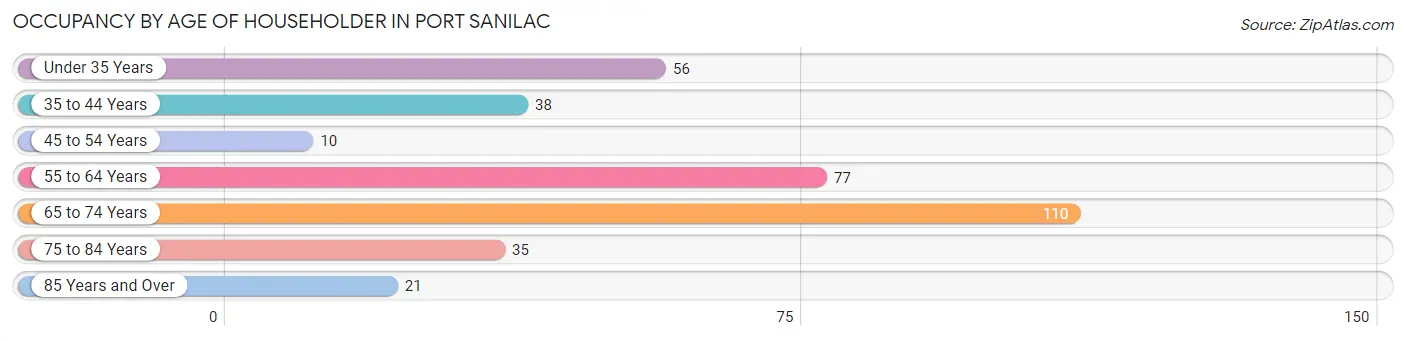
| Age Bracket | # Households | % Households |
| Under 35 Years | 56 | 16.1% |
| 35 to 44 Years | 38 | 11.0% |
| 45 to 54 Years | 10 | 2.9% |
| 55 to 64 Years | 77 | 22.2% |
| 65 to 74 Years | 110 | 31.7% |
| 75 to 84 Years | 35 | 10.1% |
| 85 Years and Over | 21 | 6.0% |
| Total | 347 | 100.0% |
Housing Finances in Port Sanilac
Median Income by Occupancy in Port Sanilac
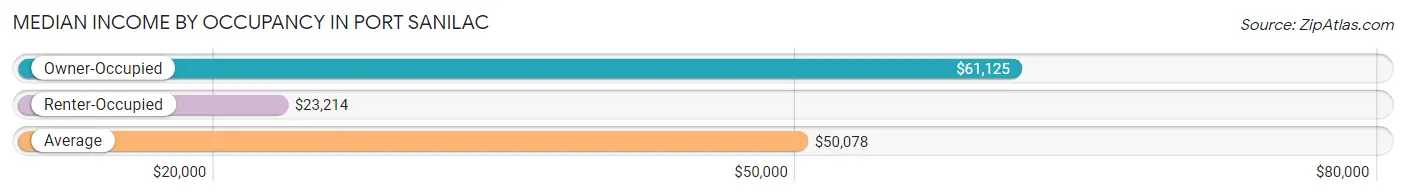
| Occupancy Type | # Households | Median Income |
| Owner-Occupied | 287 (82.7%) | $61,125 |
| Renter-Occupied | 60 (17.3%) | $23,214 |
| Average | 347 (100.0%) | $50,078 |
Occupancy by Householder Income Bracket in Port Sanilac
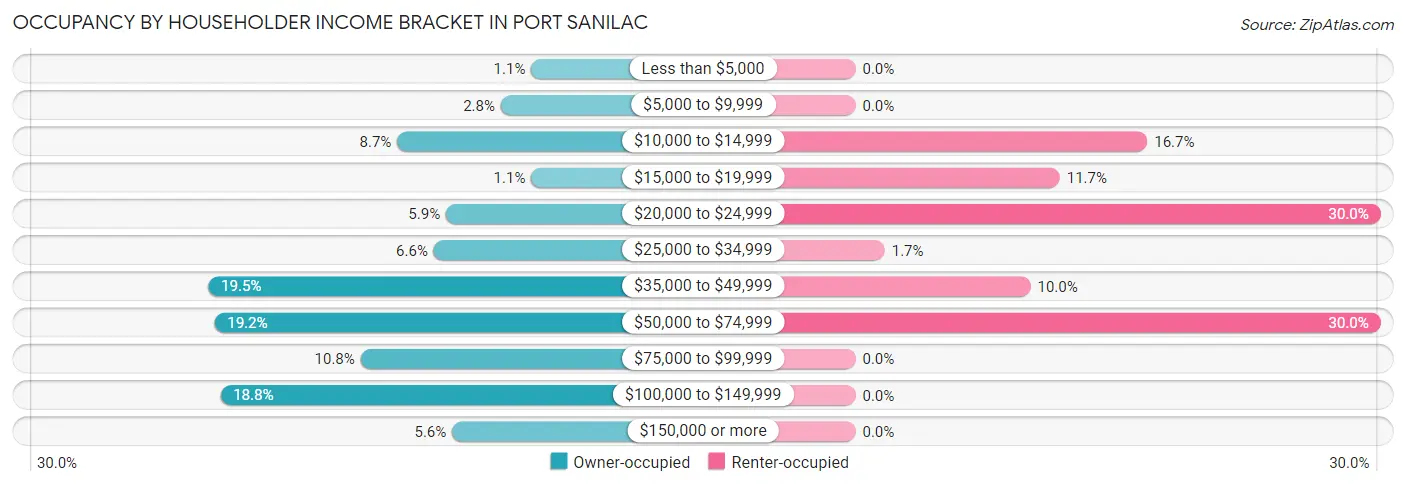
| Income Bracket | Owner-occupied | Renter-occupied |
| Less than $5,000 | 3 (1.1%) | 0 (0.0%) |
| $5,000 to $9,999 | 8 (2.8%) | 0 (0.0%) |
| $10,000 to $14,999 | 25 (8.7%) | 10 (16.7%) |
| $15,000 to $19,999 | 3 (1.1%) | 7 (11.7%) |
| $20,000 to $24,999 | 17 (5.9%) | 18 (30.0%) |
| $25,000 to $34,999 | 19 (6.6%) | 1 (1.7%) |
| $35,000 to $49,999 | 56 (19.5%) | 6 (10.0%) |
| $50,000 to $74,999 | 55 (19.2%) | 18 (30.0%) |
| $75,000 to $99,999 | 31 (10.8%) | 0 (0.0%) |
| $100,000 to $149,999 | 54 (18.8%) | 0 (0.0%) |
| $150,000 or more | 16 (5.6%) | 0 (0.0%) |
| Total | 287 (100.0%) | 60 (100.0%) |
Monthly Housing Cost Tiers in Port Sanilac
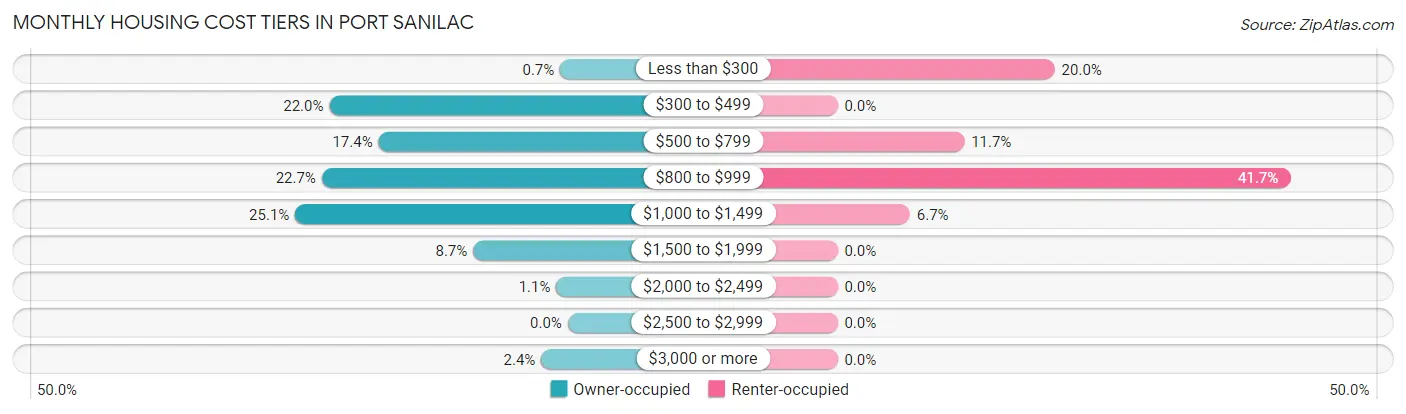
| Monthly Cost | Owner-occupied | Renter-occupied |
| Less than $300 | 2 (0.7%) | 12 (20.0%) |
| $300 to $499 | 63 (22.0%) | 0 (0.0%) |
| $500 to $799 | 50 (17.4%) | 7 (11.7%) |
| $800 to $999 | 65 (22.7%) | 25 (41.7%) |
| $1,000 to $1,499 | 72 (25.1%) | 4 (6.7%) |
| $1,500 to $1,999 | 25 (8.7%) | 0 (0.0%) |
| $2,000 to $2,499 | 3 (1.1%) | 0 (0.0%) |
| $2,500 to $2,999 | 0 (0.0%) | 0 (0.0%) |
| $3,000 or more | 7 (2.4%) | 0 (0.0%) |
| Total | 287 (100.0%) | 60 (100.0%) |
Physical Housing Characteristics in Port Sanilac
Housing Structures in Port Sanilac
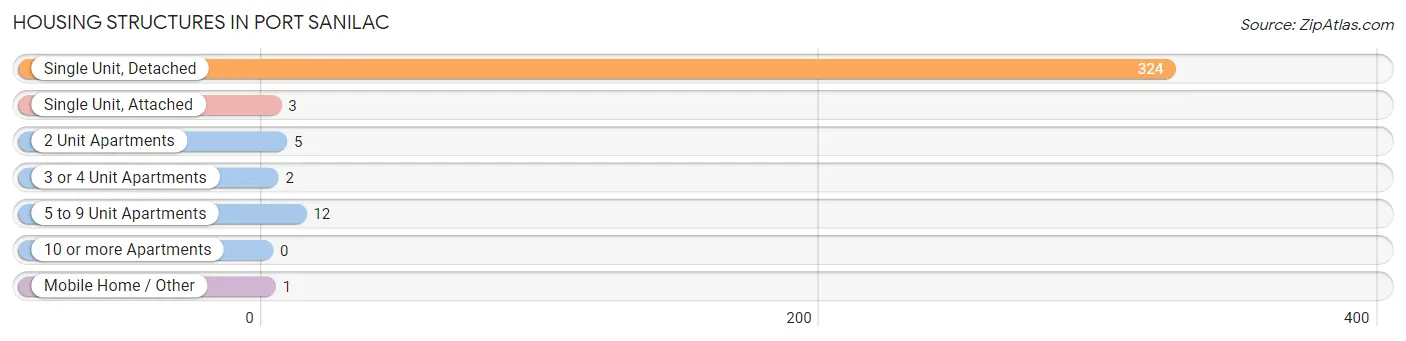
| Structure Type | # Housing Units | % Housing Units |
| Single Unit, Detached | 324 | 93.4% |
| Single Unit, Attached | 3 | 0.9% |
| 2 Unit Apartments | 5 | 1.4% |
| 3 or 4 Unit Apartments | 2 | 0.6% |
| 5 to 9 Unit Apartments | 12 | 3.5% |
| 10 or more Apartments | 0 | 0.0% |
| Mobile Home / Other | 1 | 0.3% |
| Total | 347 | 100.0% |
Housing Structures by Occupancy in Port Sanilac
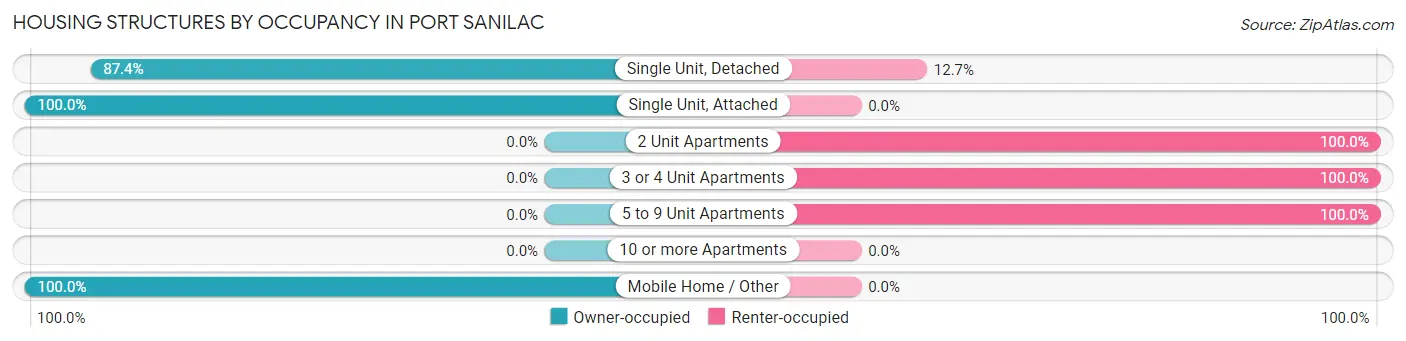
| Structure Type | Owner-occupied | Renter-occupied |
| Single Unit, Detached | 283 (87.4%) | 41 (12.7%) |
| Single Unit, Attached | 3 (100.0%) | 0 (0.0%) |
| 2 Unit Apartments | 0 (0.0%) | 5 (100.0%) |
| 3 or 4 Unit Apartments | 0 (0.0%) | 2 (100.0%) |
| 5 to 9 Unit Apartments | 0 (0.0%) | 12 (100.0%) |
| 10 or more Apartments | 0 (0.0%) | 0 (0.0%) |
| Mobile Home / Other | 1 (100.0%) | 0 (0.0%) |
| Total | 287 (82.7%) | 60 (17.3%) |
Housing Structures by Number of Rooms in Port Sanilac
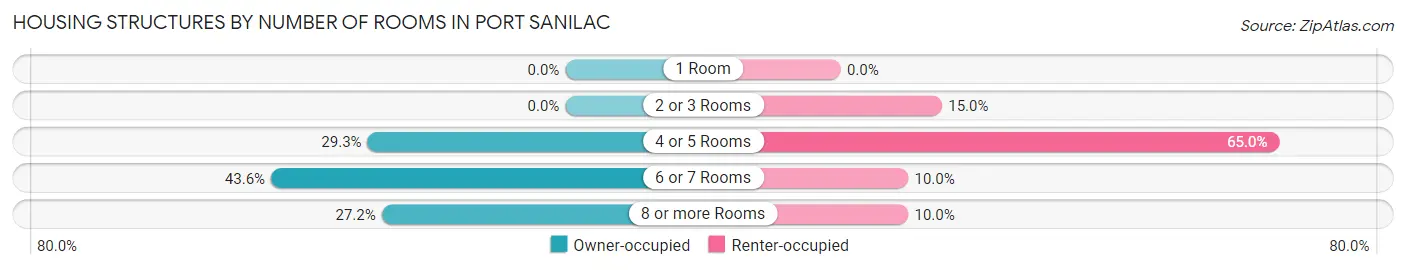
| Number of Rooms | Owner-occupied | Renter-occupied |
| 1 Room | 0 (0.0%) | 0 (0.0%) |
| 2 or 3 Rooms | 0 (0.0%) | 9 (15.0%) |
| 4 or 5 Rooms | 84 (29.3%) | 39 (65.0%) |
| 6 or 7 Rooms | 125 (43.5%) | 6 (10.0%) |
| 8 or more Rooms | 78 (27.2%) | 6 (10.0%) |
| Total | 287 (100.0%) | 60 (100.0%) |
Housing Structure by Heating Type in Port Sanilac
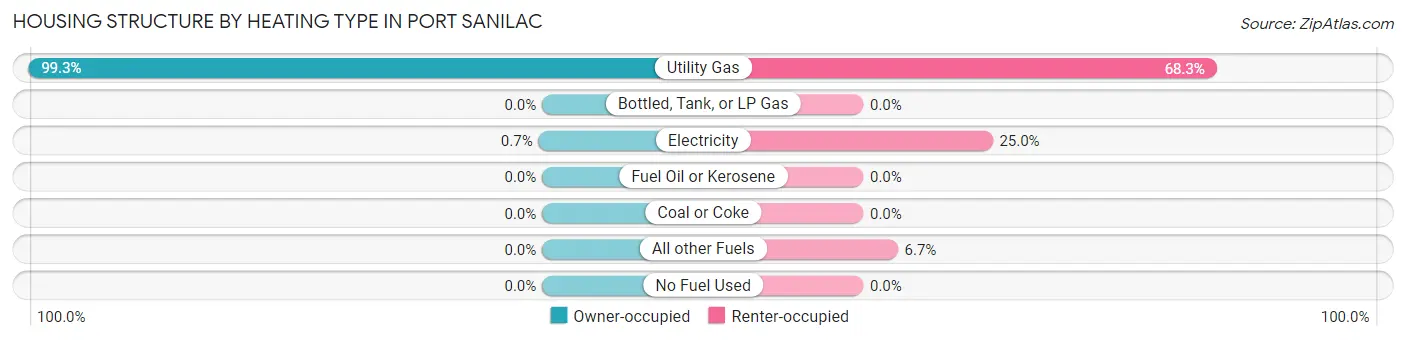
| Heating Type | Owner-occupied | Renter-occupied |
| Utility Gas | 285 (99.3%) | 41 (68.3%) |
| Bottled, Tank, or LP Gas | 0 (0.0%) | 0 (0.0%) |
| Electricity | 2 (0.7%) | 15 (25.0%) |
| Fuel Oil or Kerosene | 0 (0.0%) | 0 (0.0%) |
| Coal or Coke | 0 (0.0%) | 0 (0.0%) |
| All other Fuels | 0 (0.0%) | 4 (6.7%) |
| No Fuel Used | 0 (0.0%) | 0 (0.0%) |
| Total | 287 (100.0%) | 60 (100.0%) |
Household Vehicle Usage in Port Sanilac
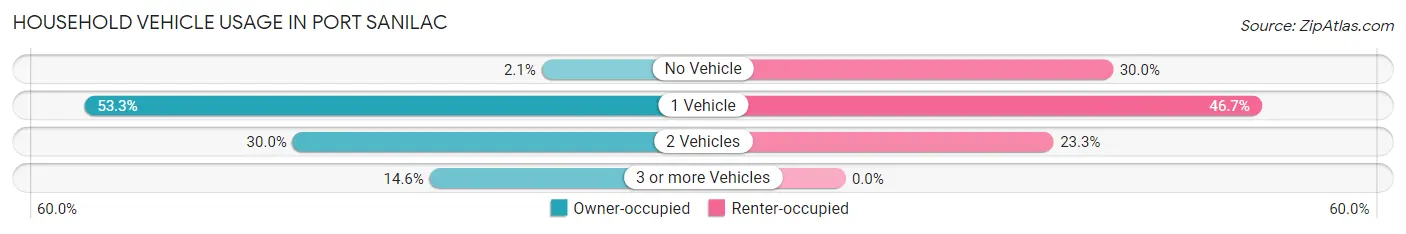
| Vehicles per Household | Owner-occupied | Renter-occupied |
| No Vehicle | 6 (2.1%) | 18 (30.0%) |
| 1 Vehicle | 153 (53.3%) | 28 (46.7%) |
| 2 Vehicles | 86 (30.0%) | 14 (23.3%) |
| 3 or more Vehicles | 42 (14.6%) | 0 (0.0%) |
| Total | 287 (100.0%) | 60 (100.0%) |
Real Estate & Mortgages in Port Sanilac
Real Estate and Mortgage Overview in Port Sanilac
| Characteristic | Without Mortgage | With Mortgage |
| Housing Units | 136 | 151 |
| Median Property Value | $167,200 | $134,000 |
| Median Household Income | $44,000 | $16 |
| Monthly Housing Costs | $513 | $7 |
| Real Estate Taxes | $1,783 | $4 |
Property Value by Mortgage Status in Port Sanilac
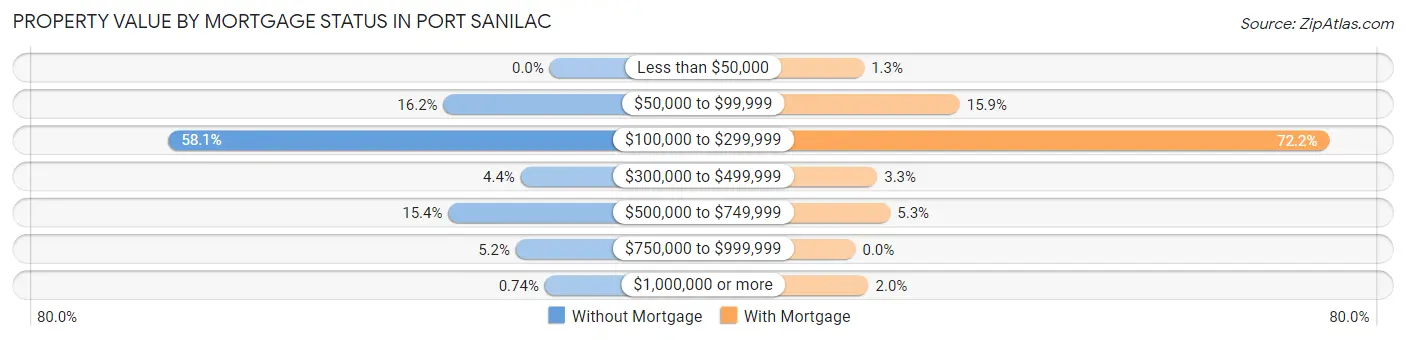
| Property Value | Without Mortgage | With Mortgage |
| Less than $50,000 | 0 (0.0%) | 2 (1.3%) |
| $50,000 to $99,999 | 22 (16.2%) | 24 (15.9%) |
| $100,000 to $299,999 | 79 (58.1%) | 109 (72.2%) |
| $300,000 to $499,999 | 6 (4.4%) | 5 (3.3%) |
| $500,000 to $749,999 | 21 (15.4%) | 8 (5.3%) |
| $750,000 to $999,999 | 7 (5.1%) | 0 (0.0%) |
| $1,000,000 or more | 1 (0.7%) | 3 (2.0%) |
| Total | 136 (100.0%) | 151 (100.0%) |
Household Income by Mortgage Status in Port Sanilac
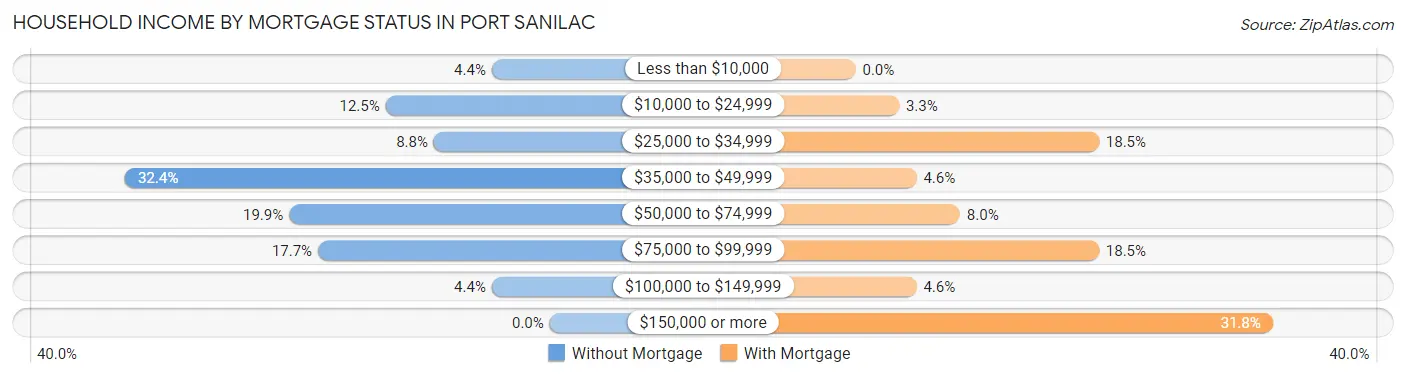
| Household Income | Without Mortgage | With Mortgage |
| Less than $10,000 | 6 (4.4%) | 0 (0.0%) |
| $10,000 to $24,999 | 17 (12.5%) | 5 (3.3%) |
| $25,000 to $34,999 | 12 (8.8%) | 28 (18.5%) |
| $35,000 to $49,999 | 44 (32.4%) | 7 (4.6%) |
| $50,000 to $74,999 | 27 (19.9%) | 12 (8.0%) |
| $75,000 to $99,999 | 24 (17.6%) | 28 (18.5%) |
| $100,000 to $149,999 | 6 (4.4%) | 7 (4.6%) |
| $150,000 or more | 0 (0.0%) | 48 (31.8%) |
| Total | 136 (100.0%) | 151 (100.0%) |
Property Value to Household Income Ratio in Port Sanilac
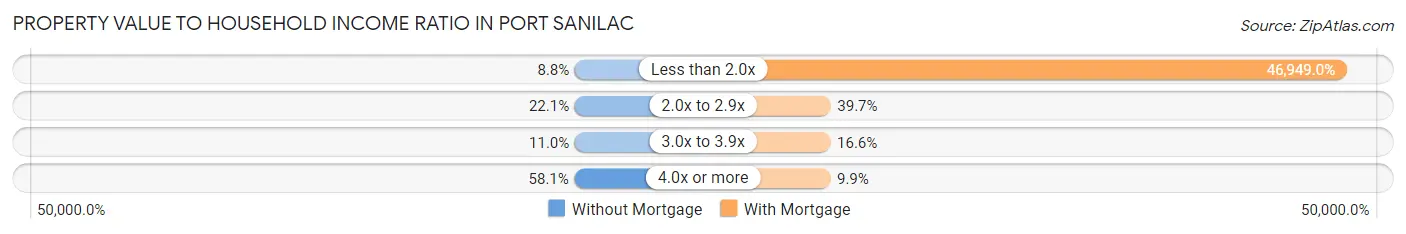
| Value-to-Income Ratio | Without Mortgage | With Mortgage |
| Less than 2.0x | 12 (8.8%) | 70,893 (46,949.0%) |
| 2.0x to 2.9x | 30 (22.1%) | 60 (39.7%) |
| 3.0x to 3.9x | 15 (11.0%) | 25 (16.6%) |
| 4.0x or more | 79 (58.1%) | 15 (9.9%) |
| Total | 136 (100.0%) | 151 (100.0%) |
Real Estate Taxes by Mortgage Status in Port Sanilac
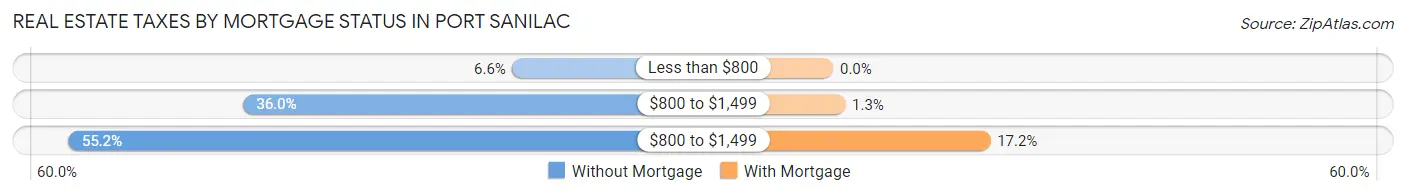
| Property Taxes | Without Mortgage | With Mortgage |
| Less than $800 | 9 (6.6%) | 0 (0.0%) |
| $800 to $1,499 | 49 (36.0%) | 2 (1.3%) |
| $800 to $1,499 | 75 (55.1%) | 26 (17.2%) |
| Total | 136 (100.0%) | 151 (100.0%) |
Health & Disability in Port Sanilac
Health Insurance Coverage by Age in Port Sanilac
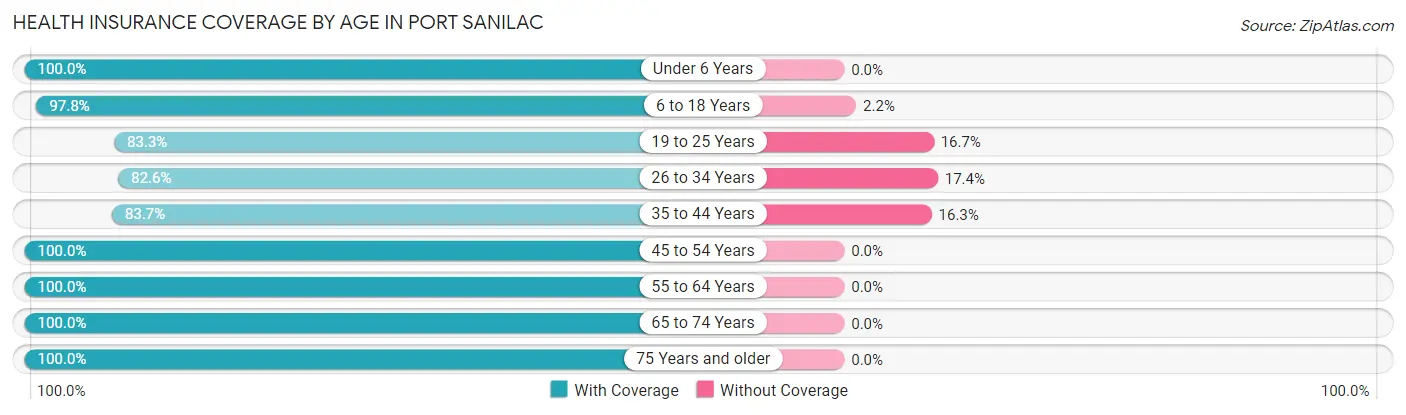
| Age Bracket | With Coverage | Without Coverage |
| Under 6 Years | 34 (100.0%) | 0 (0.0%) |
| 6 to 18 Years | 177 (97.8%) | 4 (2.2%) |
| 19 to 25 Years | 15 (83.3%) | 3 (16.7%) |
| 26 to 34 Years | 71 (82.6%) | 15 (17.4%) |
| 35 to 44 Years | 72 (83.7%) | 14 (16.3%) |
| 45 to 54 Years | 15 (100.0%) | 0 (0.0%) |
| 55 to 64 Years | 133 (100.0%) | 0 (0.0%) |
| 65 to 74 Years | 155 (100.0%) | 0 (0.0%) |
| 75 Years and older | 84 (100.0%) | 0 (0.0%) |
| Total | 756 (95.5%) | 36 (4.5%) |
Health Insurance Coverage by Citizenship Status in Port Sanilac
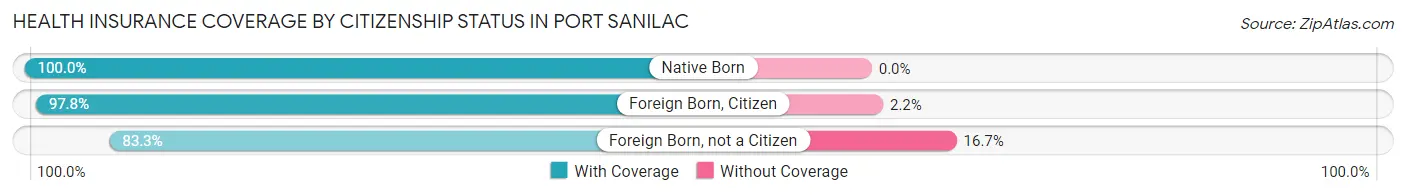
| Citizenship Status | With Coverage | Without Coverage |
| Native Born | 34 (100.0%) | 0 (0.0%) |
| Foreign Born, Citizen | 177 (97.8%) | 4 (2.2%) |
| Foreign Born, not a Citizen | 15 (83.3%) | 3 (16.7%) |
Health Insurance Coverage by Household Income in Port Sanilac
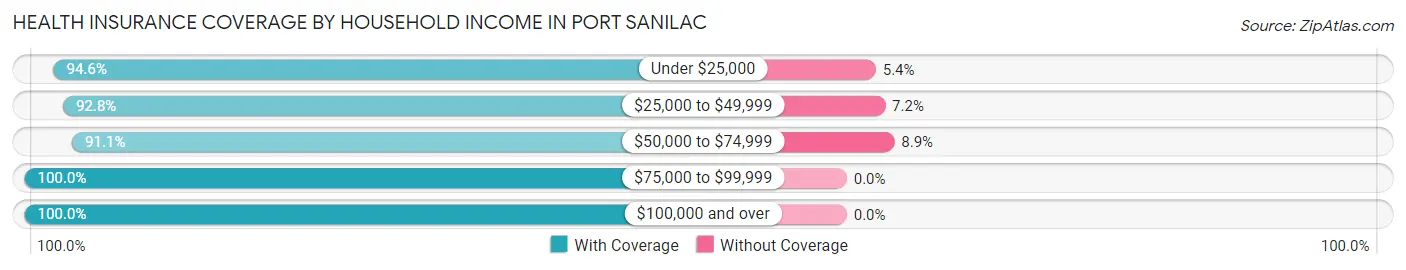
| Household Income | With Coverage | Without Coverage |
| Under $25,000 | 122 (94.6%) | 7 (5.4%) |
| $25,000 to $49,999 | 142 (92.8%) | 11 (7.2%) |
| $50,000 to $74,999 | 184 (91.1%) | 18 (8.9%) |
| $75,000 to $99,999 | 49 (100.0%) | 0 (0.0%) |
| $100,000 and over | 246 (100.0%) | 0 (0.0%) |
Public vs Private Health Insurance Coverage by Age in Port Sanilac
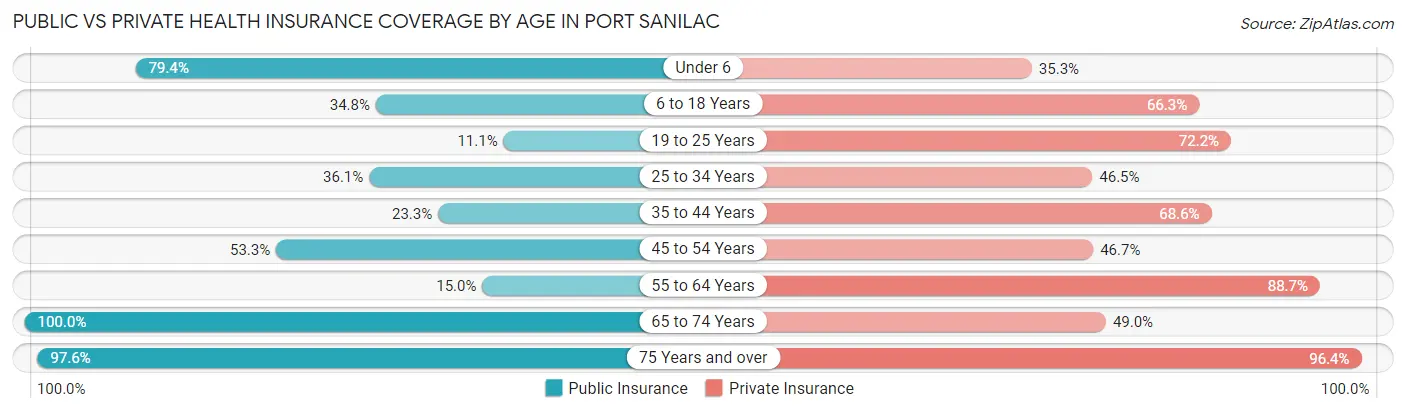
| Age Bracket | Public Insurance | Private Insurance |
| Under 6 | 27 (79.4%) | 12 (35.3%) |
| 6 to 18 Years | 63 (34.8%) | 120 (66.3%) |
| 19 to 25 Years | 2 (11.1%) | 13 (72.2%) |
| 25 to 34 Years | 31 (36.0%) | 40 (46.5%) |
| 35 to 44 Years | 20 (23.3%) | 59 (68.6%) |
| 45 to 54 Years | 8 (53.3%) | 7 (46.7%) |
| 55 to 64 Years | 20 (15.0%) | 118 (88.7%) |
| 65 to 74 Years | 155 (100.0%) | 76 (49.0%) |
| 75 Years and over | 82 (97.6%) | 81 (96.4%) |
| Total | 408 (51.5%) | 526 (66.4%) |
Disability Status by Sex by Age in Port Sanilac
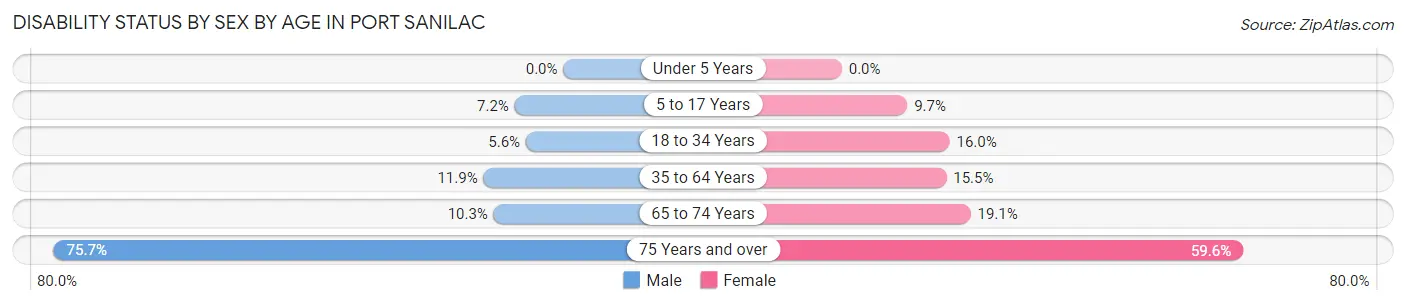
| Age Bracket | Male | Female |
| Under 5 Years | 0 (0.0%) | 0 (0.0%) |
| 5 to 17 Years | 6 (7.2%) | 10 (9.7%) |
| 18 to 34 Years | 3 (5.6%) | 8 (16.0%) |
| 35 to 64 Years | 14 (11.9%) | 18 (15.5%) |
| 65 to 74 Years | 9 (10.3%) | 13 (19.1%) |
| 75 Years and over | 28 (75.7%) | 28 (59.6%) |
Disability Class by Sex by Age in Port Sanilac
Disability Class: Hearing Difficulty
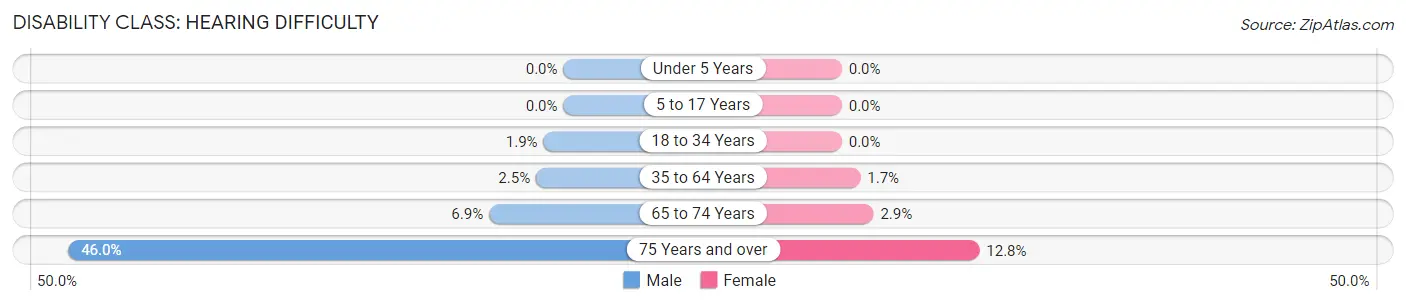
| Age Bracket | Male | Female |
| Under 5 Years | 0 (0.0%) | 0 (0.0%) |
| 5 to 17 Years | 0 (0.0%) | 0 (0.0%) |
| 18 to 34 Years | 1 (1.8%) | 0 (0.0%) |
| 35 to 64 Years | 3 (2.5%) | 2 (1.7%) |
| 65 to 74 Years | 6 (6.9%) | 2 (2.9%) |
| 75 Years and over | 17 (46.0%) | 6 (12.8%) |
Disability Class: Vision Difficulty
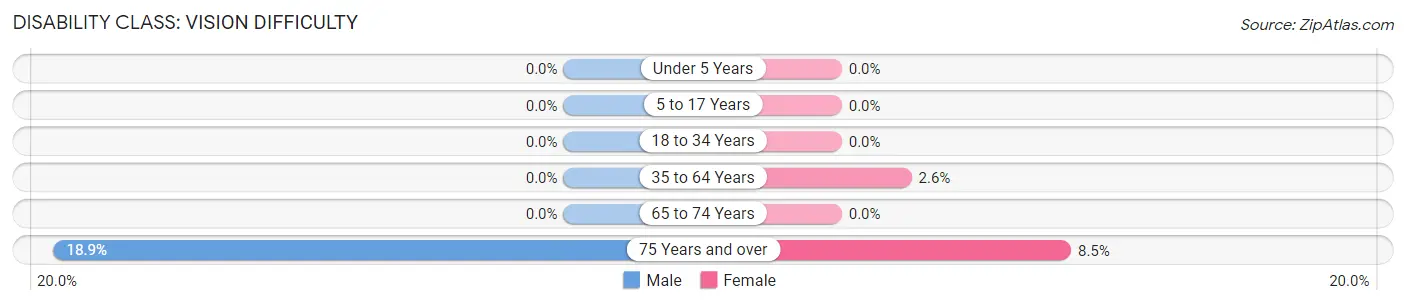
| Age Bracket | Male | Female |
| Under 5 Years | 0 (0.0%) | 0 (0.0%) |
| 5 to 17 Years | 0 (0.0%) | 0 (0.0%) |
| 18 to 34 Years | 0 (0.0%) | 0 (0.0%) |
| 35 to 64 Years | 0 (0.0%) | 3 (2.6%) |
| 65 to 74 Years | 0 (0.0%) | 0 (0.0%) |
| 75 Years and over | 7 (18.9%) | 4 (8.5%) |
Disability Class: Cognitive Difficulty
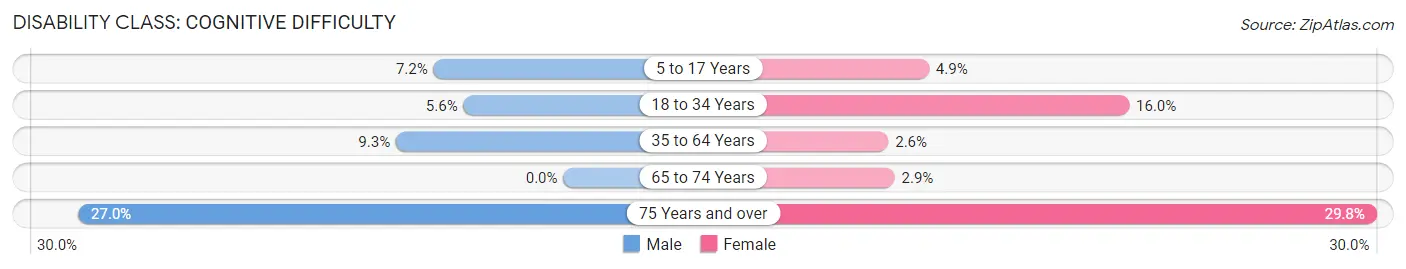
| Age Bracket | Male | Female |
| 5 to 17 Years | 6 (7.2%) | 5 (4.9%) |
| 18 to 34 Years | 3 (5.6%) | 8 (16.0%) |
| 35 to 64 Years | 11 (9.3%) | 3 (2.6%) |
| 65 to 74 Years | 0 (0.0%) | 2 (2.9%) |
| 75 Years and over | 10 (27.0%) | 14 (29.8%) |
Disability Class: Ambulatory Difficulty
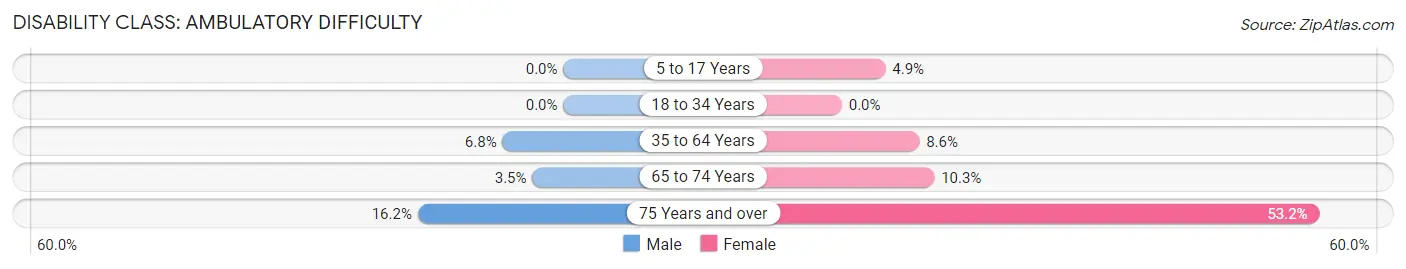
| Age Bracket | Male | Female |
| 5 to 17 Years | 0 (0.0%) | 5 (4.9%) |
| 18 to 34 Years | 0 (0.0%) | 0 (0.0%) |
| 35 to 64 Years | 8 (6.8%) | 10 (8.6%) |
| 65 to 74 Years | 3 (3.5%) | 7 (10.3%) |
| 75 Years and over | 6 (16.2%) | 25 (53.2%) |
Disability Class: Self-Care Difficulty
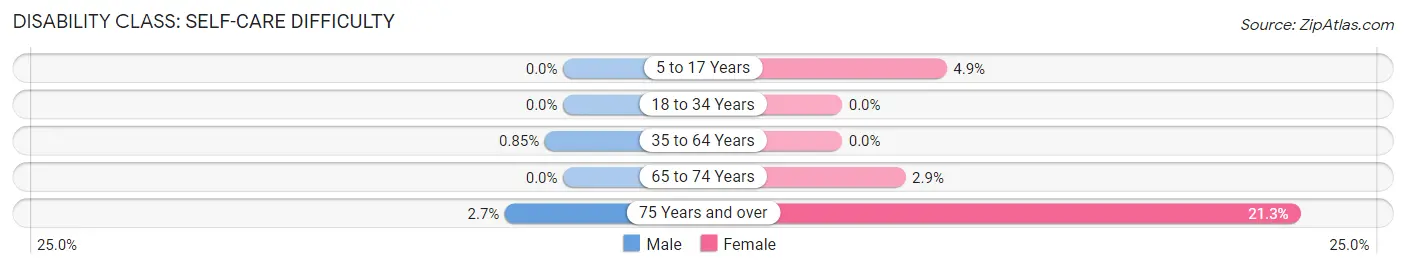
| Age Bracket | Male | Female |
| 5 to 17 Years | 0 (0.0%) | 5 (4.9%) |
| 18 to 34 Years | 0 (0.0%) | 0 (0.0%) |
| 35 to 64 Years | 1 (0.9%) | 0 (0.0%) |
| 65 to 74 Years | 0 (0.0%) | 2 (2.9%) |
| 75 Years and over | 1 (2.7%) | 10 (21.3%) |
Technology Access in Port Sanilac
Computing Device Access in Port Sanilac
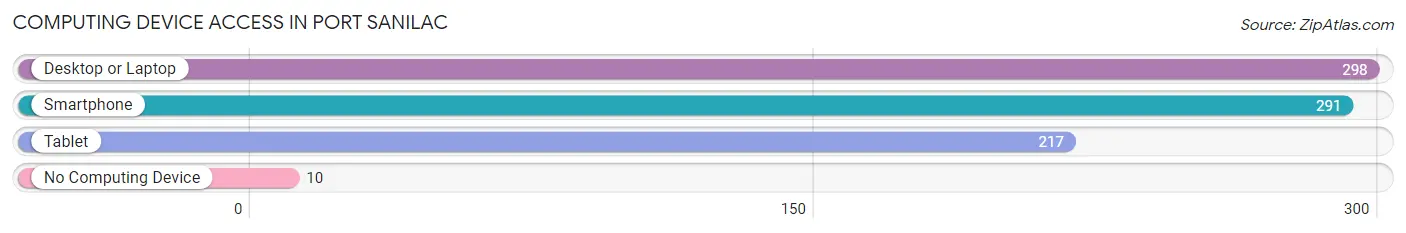
| Device Type | # Households | % Households |
| Desktop or Laptop | 298 | 85.9% |
| Smartphone | 291 | 83.9% |
| Tablet | 217 | 62.5% |
| No Computing Device | 10 | 2.9% |
| Total | 347 | 100.0% |
Internet Access in Port Sanilac
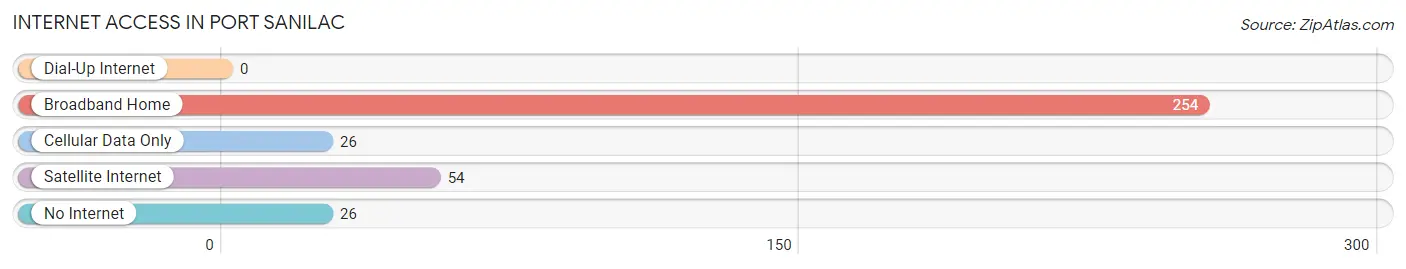
| Internet Type | # Households | % Households |
| Dial-Up Internet | 0 | 0.0% |
| Broadband Home | 254 | 73.2% |
| Cellular Data Only | 26 | 7.5% |
| Satellite Internet | 54 | 15.6% |
| No Internet | 26 | 7.5% |
| Total | 347 | 100.0% |
Port Sanilac Summary
Port Sanilac is a small village located in Sanilac County, Michigan. It is situated on the shores of Lake Huron, approximately 60 miles northeast of Detroit. The village has a population of approximately 1,000 people and is a popular tourist destination due to its picturesque harbor and sandy beaches.
History
Port Sanilac was first settled in 1837 by a group of French-Canadian fur traders. The village was originally known as “Port Sanilac”, which is derived from the French phrase “Port de Sanilac”, meaning “Port of Sanilac”. The village was officially incorporated in 1867.
In the late 19th century, Port Sanilac became a popular destination for tourists and vacationers. The village was home to several resorts, including the Sanilac Hotel, which was built in 1887. The hotel was a popular destination for wealthy Detroiters who wanted to escape the city for a few days.
In the early 20th century, Port Sanilac became a major port for the lumber industry. The village was home to several sawmills and lumberyards, which provided employment for many of the local residents.
Geography
Port Sanilac is located in Sanilac County, Michigan. The village is situated on the shores of Lake Huron, approximately 60 miles northeast of Detroit. The village is surrounded by several small towns and villages, including Lexington, Croswell, and Carsonville.
The village is located in a flat, low-lying area, with an elevation of approximately 600 feet. The area is mostly covered in farmland, with some wooded areas. The village is located near several small lakes, including Lake Huron, Lake St. Clair, and Lake Erie.
Economy
The economy of Port Sanilac is largely based on tourism and agriculture. The village is home to several resorts and hotels, which attract visitors from all over the state. The village is also home to several wineries, which produce a variety of wines.
Agriculture is also an important part of the local economy. The area is home to several farms, which produce a variety of crops, including corn, soybeans, and wheat. The village is also home to several dairy farms, which produce milk and other dairy products.
Demographics
As of the 2010 census, the population of Port Sanilac was 1,039. The village is predominantly white, with approximately 95% of the population identifying as Caucasian. The remaining 5% of the population is made up of African Americans, Native Americans, and other races.
The median household income in Port Sanilac is $41,250, which is slightly lower than the national average. The median age of the population is 44.7 years, which is slightly higher than the national average. The village has a high rate of homeownership, with approximately 75% of the population owning their own homes.
Port Sanilac is a small village with a rich history and a vibrant economy. The village is home to several resorts and wineries, which attract visitors from all over the state. The village is also home to several farms, which produce a variety of crops. The village has a diverse population, with a median age of 44.7 years and a median household income of $41,250.
Common Questions
What is Per Capita Income in Port Sanilac?
Per Capita income in Port Sanilac is $31,805.
What is the Median Family Income in Port Sanilac?
Median Family Income in Port Sanilac is $62,375.
What is the Median Household income in Port Sanilac?
Median Household Income in Port Sanilac is $50,078.
What is Income or Wage Gap in Port Sanilac?
Income or Wage Gap in Port Sanilac is 14.7%.
Women in Port Sanilac earn 85.3 cents for every dollar earned by a man.
What is Inequality or Gini Index in Port Sanilac?
Inequality or Gini Index in Port Sanilac is 0.49.
What is the Total Population of Port Sanilac?
Total Population of Port Sanilac is 792.
What is the Total Male Population of Port Sanilac?
Total Male Population of Port Sanilac is 392.
What is the Total Female Population of Port Sanilac?
Total Female Population of Port Sanilac is 400.
What is the Ratio of Males per 100 Females in Port Sanilac?
There are 98.00 Males per 100 Females in Port Sanilac.
What is the Ratio of Females per 100 Males in Port Sanilac?
There are 102.04 Females per 100 Males in Port Sanilac.
What is the Median Population Age in Port Sanilac?
Median Population Age in Port Sanilac is 42.3 Years.
What is the Average Family Size in Port Sanilac
Average Family Size in Port Sanilac is 2.8 People.
What is the Average Household Size in Port Sanilac
Average Household Size in Port Sanilac is 2.2 People.
How Large is the Labor Force in Port Sanilac?
There are 304 People in the Labor Forcein in Port Sanilac.
What is the Percentage of People in the Labor Force in Port Sanilac?
48.8% of People are in the Labor Force in Port Sanilac.
What is the Unemployment Rate in Port Sanilac?
Unemployment Rate in Port Sanilac is 3.3%.